Cereals, calories and change: exploring approaches to ... PAPER Cereals, calories and change:...
14
ORIGINAL PAPER Cereals, calories and change: exploring approaches to quantification in Indus archaeobotany J. Bates 1,2 & C.A. Petrie 1,3 & R.N. Singh 4 Received: 23 March 2016 /Accepted: 10 March 2017 # The Author(s) 2017. This article is published with open access at Springerlink.com Abstract Several major cereal groups have been identified as staples used by the pre-urban, urban and post-urban phase pop- ulations of the Indus Civilisation (3200–1500 BCE): wheat, bar- ley, a range of small hulled millets and also rice, though their proportional exploitation is variable across space and over time. Traditional quantification methods examine the frequency, inten- sity and proportionality of the use of these crops and help ascer- tain the ‘relative importance’ of these cereals for Indus popula- tions. However, this notion of ‘importance’ is abstracted from the daily lives of the people using these crops and may be biased by the differential production (as well as archaeological survival) of individual cereals. This paper outlines an alternative approach to quantifying Indus cereals by investigating proportions of calo- ries. Cereals are predominantly composed of carbohydrates and therefore provided much of the daily caloric intake among many late Holocene farming populations. The four major cereal groups cultivated by Indus farmers, however, vary greatly in terms of calories per grain, and this has an impact on their proportional input to past diets. This paper demonstrates that, when converted to proportions of calories, the perceived ‘importance’ of cereals from five Indus sites changes dramatically, reducing the role of the previously dominant small hulled millet species and elevat- ing the role of Triticoid grains. Although other factors will also have affected how a farmer perceived the role and importance of a crop, including its ecological tolerances, investments required to grow it, and the crop’ s role in the economy, this papers sug- gests that some consideration of what cereals meant in terms of daily lives is needed alongside the more abstracted quantification methods that have traditionally been applied. Keywords Indus Civilisation . Plant macroremains . South Asia . Bronze age . Calories . Quantification Introduction The role of agriculture in South Asia’ s Indus Civilisation (3200– 1300 BCE) (Table 1, Fig. 1) is a growing area of research. As in most complex societies, food production was integral to all aspects of the society and economy of the Indus Civilisation, potentially impacting upon its development and decline (Madella and Fuller 2006), and the interaction between cities and their hinterlands (Weber 2003; Wright 2010). It has thus been incorporated into models of its social organisation (e.g. Wheeler 1950; Fairservis 1967; Kenoyer 1997, 2000; Wright 2010 ). Since the 1990s, the number of sites with archaeobotanical datasets has increased to the point where an overall picture of Indus agriculture can be outlined (e.g. Fuller and Madella 2002). However, despite this growing corpus of data, many researchers seeking to characterise Indus agriculture still refer to a core-periphery model, which was developed using data from the site of Harappa (Weber 1992, 1997, 2003), com- bined with datasets several sites in from Gujarat (Weber 1989, 1991; Reddy 1994, 1997, 2003). A different pattern has been Electronic supplementary material The online version of this article (doi:10.1007/s12520-017-0489-2) contains supplementary material, which is available to authorized users. * J. Bates [email protected] 1 McDonald Institute for Archaeological Research, University of Cambridge, Downing Street, Cambridge CB2 3ER, UK 2 Selwyn College, University of Cambridge, Cambridge CB3 9DQ, UK 3 Division of Archaeology, University of Cambridge, Downing Street, Cambridge CB2 3DZ, UK 4 Department of AIHC and Archaeology, Banaras Hindu University, Varanasi, India Archaeol Anthropol Sci DOI 10.1007/s12520-017-0489-2
Transcript of Cereals, calories and change: exploring approaches to ... PAPER Cereals, calories and change:...

ORIGINAL PAPER
Cereals, calories and change: exploring approachesto quantification in Indus archaeobotany
J. Bates1,2 & C.A. Petrie1,3 & R.N. Singh4
Received: 23 March 2016 /Accepted: 10 March 2017# The Author(s) 2017. This article is published with open access at Springerlink.com
Abstract Several major cereal groups have been identified asstaples used by the pre-urban, urban and post-urban phase pop-ulations of the Indus Civilisation (3200–1500 BCE): wheat, bar-ley, a range of small hulled millets and also rice, though theirproportional exploitation is variable across space and over time.Traditional quantificationmethods examine the frequency, inten-sity and proportionality of the use of these crops and help ascer-tain the ‘relative importance’ of these cereals for Indus popula-tions. However, this notion of ‘importance’ is abstracted from thedaily lives of the people using these crops and may be biased bythe differential production (as well as archaeological survival) ofindividual cereals. This paper outlines an alternative approach toquantifying Indus cereals by investigating proportions of calo-ries. Cereals are predominantly composed of carbohydrates andtherefore provided much of the daily caloric intake among manylate Holocene farming populations. The fourmajor cereal groupscultivated by Indus farmers, however, vary greatly in terms ofcalories per grain, and this has an impact on their proportionalinput to past diets. This paper demonstrates that, when converted
to proportions of calories, the perceived ‘importance’ of cerealsfrom five Indus sites changes dramatically, reducing the role ofthe previously dominant small hulled millet species and elevat-ing the role of Triticoid grains. Although other factors will alsohave affected how a farmer perceived the role and importance ofa crop, including its ecological tolerances, investments requiredto grow it, and the crop’s role in the economy, this papers sug-gests that some consideration of what cereals meant in terms ofdaily lives is needed alongside themore abstracted quantificationmethods that have traditionally been applied.
Keywords Indus Civilisation . Plant macroremains . SouthAsia . Bronze age . Calories . Quantification
Introduction
The role of agriculture in SouthAsia’s Indus Civilisation (3200–1300 BCE) (Table 1, Fig. 1) is a growing area of research. As inmost complex societies, food production was integral to allaspects of the society and economy of the Indus Civilisation,potentially impacting upon its development and decline(Madella and Fuller 2006), and the interaction between citiesand their hinterlands (Weber 2003; Wright 2010). It has thusbeen incorporated into models of its social organisation (e.g.Wheeler 1950; Fairservis 1967; Kenoyer 1997, 2000; Wright2010). Since the 1990s, the number of sites witharchaeobotanical datasets has increased to the point where anoverall picture of Indus agriculture can be outlined (e.g. Fullerand Madella 2002). However, despite this growing corpus ofdata, many researchers seeking to characterise Indus agriculturestill refer to a core-periphery model, which was developed usingdata from the site of Harappa (Weber 1992, 1997, 2003), com-bined with datasets several sites in from Gujarat (Weber 1989,1991; Reddy 1994, 1997, 2003). A different pattern has been
Electronic supplementary material The online version of this article(doi:10.1007/s12520-017-0489-2) contains supplementary material,which is available to authorized users.
* J. [email protected]
1 McDonald Institute for Archaeological Research, University ofCambridge, Downing Street, Cambridge CB2 3ER, UK
2 Selwyn College, University of Cambridge, Cambridge CB3 9DQ,UK
3 Division of Archaeology, University of Cambridge, Downing Street,Cambridge CB2 3DZ, UK
4 Department of AIHC and Archaeology, Banaras Hindu University,Varanasi, India
Archaeol Anthropol SciDOI 10.1007/s12520-017-0489-2

observed in several new archaeobotanical datasets from thenorth-east zone of the Indus Civilisation, however (Bates2016; Bates et al. 2017a, 2017b; Petrie and Bates in press;Petrie et al. 2016, 2017). Analysis of floated samples from fiveof the six small village sites excavated by the Land, Water andSettlement project (Singh et al. 2008, 2010a, 2010b, 2011, 2012,2013a, 2013b; Petrie et al. 2009, 2016, 2017; Pawar 2012; Bates2016; Bates et al. 2017a, 2017b; Parikh and Petrie 2017) that arespread across the plains of north-west India has suggested thatdespite there being some similarities (such as the range of taxacultivated), there were differences in the proportions of individ-ual crops at each settlement and in each period (Bates 2016;Bates et al. 2017a, 2017b; Petrie et al. 2016, 2017). One elementthat was common at these settlements across time and space wasthe preponderance of small hulled native millets (Echinochloacf. colona, Setaria cf. pumila, and Panicum sp.), which ap-peared more regularly and often in a greater frequency andproportion than other cereals (Bates 2016; Petrie et al. 2016).These millets were likely to have been grown under mixedintercropping conditions when found together (Petrie andBates, in press). In the process of exploring these data, we beganto question the role these crops might have played in the lives,and especially the diets, of the people actually growing andeating them, particularly their ‘relative importance’ to one an-other in practical nutritional terms. This paper develops thesequestions further, outlining a new, experimental quantification
technique that can be employed to consider how different cropswere perceived or utilised by people in the past. It also considerswhat impact this new approach might have on the interpreta-tions that can be drawn from archaeobotanical datasets.
Quantifying archaeobotanical datasets
There has been much debate about the way thatarchaeobotanical datasets should be analysed and interpreted(e.g. Hastorf and Popper 1988), and no standard method isapplied in all studies. Instead, a range of methods is applied,with the selection being based on the questions being askedand the nature of the remains (Pearsall 1989; Popper 1988).These methods fall into two broad categories: qualitative andquantitative (Pearsall 1989). Qualitative analysis typically pre-sents presence/absence information and explores the datawithout reference to numbers and has been the most commonform of data presentation in Indus archaeobotany (Fuller andMadella 2002; Fuller 2002; Bates forthcoming). While suchanalysis can be used to address questions such as when a taxonwas first introduced at a site or which species co-occur incontexts, it cannot be used to infer the relative importance ofindividual species (Pearsall 1989). In contrast, quantitativeanalysis involves methods that explore standardised data(Weber 1999; Pearsall 1989) and can make use of multivariate
Table 1 Chronology of the IndusCivilisation (after Possehl 2002:29)
Stage Dates Regional phases
Early Harappan 3200–2600 BCE Amri-Nal
Kot Diji
Sothi-Siswal
Damb Sadaat
Early-Mature Harappan Transition 2600–2500 BCE
Mature Harappan 2500–1900 BCE Sindhi Harappan
Kulli Harappan
Sorath Harappan
Punjabi Harappan
Eastern Harappan
Quetta
Late Kot Diji
Late Harappan 1900–1300 BCE Jhukar (1900–1700 BCE)
Early Pirak (1800–1700 BCE)
Late Sorath Harappan (1900–1600 BCE)
Lustrous Red Ware (1600–1300 BCE)
Cemetary H (1900–1500 BCE)
Swat Valley Period IV (1650–1300 BCE)
Late Harappan in Haryana and Western
Uttar Pradesh (1900–1300 BCE)
Painted Grey Ware (PGW)
(north-east regional development)
1300–500 BCE Late Harappan—PGWoverlap (1300–1000 BCE)
PGW (1100–500 BCE)
Archaeol Anthropol Sci
and non-multivariate statistical approaches. This paper willfocus on non-multivariate methods, as they are the more com-monly used both in general and more specifically in Indusarchaeology.
Within Indus archaeobotany, the most frequently used setof non-multivariate statistical analyses are measures ofdensity, ubiquity and proportion (e.g. Weber 1989, 2003;Willcox 1991, 1992; Reddy 1994, 1997, 2003). All three ap-proaches aim to standardise archaeobotanical data sets tomake comparisons possible, as they often originate from dif-ferent context types and from samples of different sizes(Miller 1988). Density is expressed as a ratio of the numberof seeds per a specific quantity of sediment (Weber 1999,2003; Pearsall 1989; Miller 1988). Weber (2003) has arguedthat density is useful for looking at depositional variability.Ubiquity is the percentage of samples in which a taxon wasfound and acts as a measure of the frequency of accidentalcharring events that resulted in the assemblage (Minnis 1981;Weber 1992). Minnis (1981) has suggested that as the numberof accidental charring events can be viewed as a reflection ofthe frequency of utilisation, and ubiquity can therefore be usedto show relative changes in use of taxa over time. It is not,
however, a reflection of the relative importance of taxa, as ataxon of which only a single seed was found in all contextswould have the same score as a taxon that was found in allcontexts in much larger quantities (Popper 1988). Proportionis typically expressed in terms of percentages that look at therelative abundance of each taxa in an assemblage comparedwith the other taxa present (Weber 1999, 2003; Miller 1988)and can thus be used to gauge floral importance (Weber 1992,2003; Miller 1988). Miller (1988) has added a caveat thatpercentages are only meaningful when comparing functional-ly equivalent elements, so for example including both chaffand seeds in the same percentage analysis would not be ap-propriate. Fuller (2000; also Fuller and Harvey 2006) has sug-gested that comparison between groups of crops such as ce-reals and pulses is also problematic because of differentialdeposition processes and taphonomy. Despite these issues,proportion remains a common method for looking at the rel-ative importance of individual floral taxa. Combining all threeof these analytical methods makes it possible to look at com-monality of use (ubiquity), intensity of use (density) and rel-ative importance of taxa (proportion). The datasets explored inthis paper have previously been analysed using these three
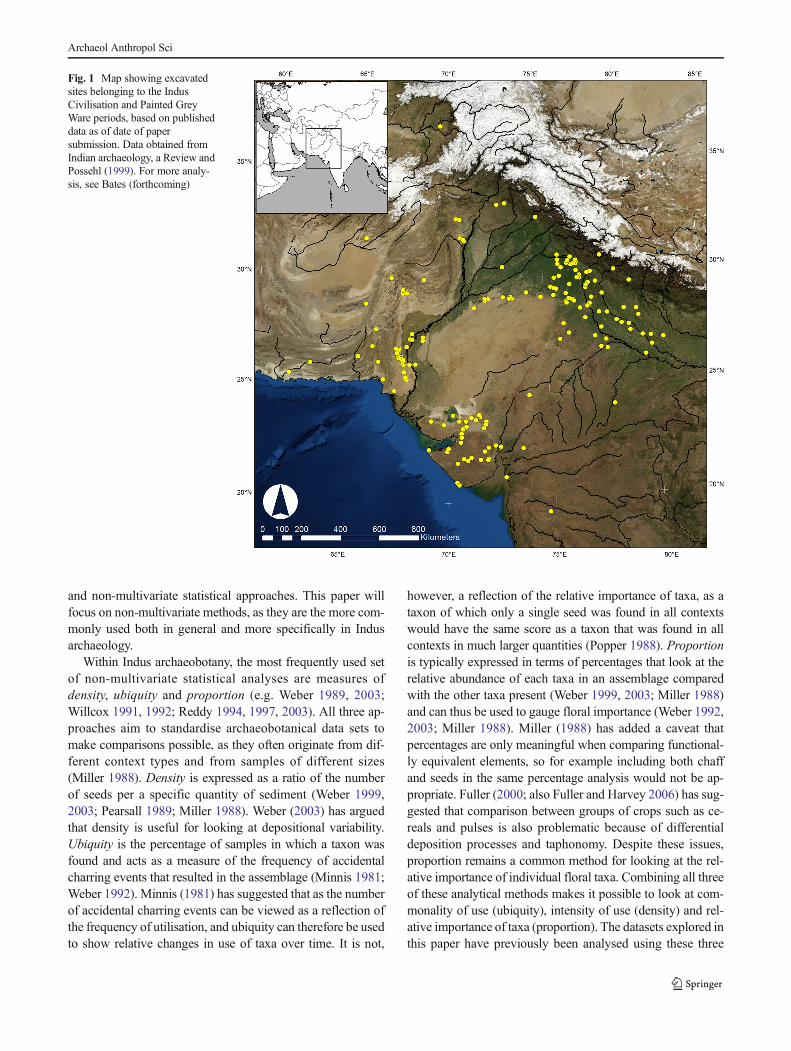
Fig. 1 Map showing excavatedsites belonging to the IndusCivilisation and Painted GreyWare periods, based on publisheddata as of date of papersubmission. Data obtained fromIndian archaeology, a Review andPossehl (1999). For more analy-sis, see Bates (forthcoming)
Archaeol Anthropol Sci

statistical approaches (Bates 2016) and will be referred tothroughout this paper.
Within the zone occupied by Indus Civilisation popula-tions, there was a wide range of different crops that wereknown and used, therefore, the issue of relative importanceof a crop within an individual assemblage becomes more crit-ical and informative. The Indus Civilisation has been de-scribed as a melting pot of botanical influences (Bates2016). Crop types range from the commonly cited rabi(winter) package of Near Eastern cereals and pulses, to kharif(summer) crops including the African millets, whose date ofarrival in the Indus has been debated (e.g. Weber 1998; Weberand Fuller 2008; Weber and Kashyap 2016), to native milletsand pulses from the south and east of the subcontinent thathave been dismissed or disregarded in some discussions (e.g.Fuller and Harvey 2006; Weber and Fuller 2008; Bates 2016;Weber and Kashyap 2016; Petrie et al. 2016) and the muchdebated issue of the adoption and use of rice (see Fuller 2006;Fuller et al. 2010; Madella 2014; Bates et al. 2017a; Petrieet al. 2016; see Petrie and Bates in press). Here, we will focuson cereals, as they are the most commonly reported botanicalremains from Indus sites (Fuller and Madella 2002; Bates2016, forthcoming). Cereals were also the most dense, themost ubiquitous and proportionately the largest plant groupfrom the quantified sites that have been explored (Bates 2016;Bates et al. 2017a, 2017b; Petrie and Bates in press; Petrieet al. 2016, 2017). Even when focusing just on the cereals,there are difficulties in making comparisons, as each specieshas different rates of production. For example, the smallergrained millet Echinochloa sp. can produce up to 6000 grainsper plant, while larger grained wheat (Triticum sp.), averages100–300 grains per plant. This variance means that comparingspecies directly in terms of raw numbers is potentially prob-lematic as to do so assumes direct similarity and thereforecomparability between species.
Given this limitation, and given that it is important to actu-ally understand how humans used these plants as food, wesuggest that an alternative approach for interpretation is re-quired. For example, it is typically argued that charred remainsare likely to reflect the daily routine actions of the final stagesof crop processing towards food preparation before consump-tion and therefore some degree of human meal choice anddaily activity on site, rather than acting as a direct reflectionof what was growing in the fields (Stevens 2003; Fuller et al.2014). One of the key elements of diet is calories, and as wewill show, in the case of the wide range of cereals available toIndus populations, the quantity of calories provided by eachtaxa varies greatly. This variability suggests that looking at theproportion of calories provided by different cereals has thepotential to indicate their relative importance to the daily livesof the people using them, thereby grounding the idea of ‘im-portance’ in the actions and choices of the people of the past.Calories have often been used as a standard metric in other
fields such as optimal foraging theory, where they are used toexplore how and why food items have been incorporated intodiets (see Hill 1988; Winterhalder and Goland 1997;Borgerhoff Mulder and Schacht 2012). Of course, the impor-tance of a crop goes beyond simply calorific content, and otherfactors influence whether a farmer chooses to use individualcrops, such as ecological tolerances (e.g. Petrie and Bates inpress; Petrie et al. 2017), investment of time and labour (e.g.Brookfield 1986; Morrison 1994; Bates et al. 2017a, 2017b;Petrie and Bates in press; Bates in prep) and their role in theeconomy (e.g. Brookfield 1986; Morrison 1994; Bates inprep). It should also be noted that calorific content is notthe only aspect of nutrition that might affect a decision toincorporate a crop into a diet, macronutrients such as carbo-hydrates, lipids, proteins and mineral content will also affectdecisions, and it will be important to undertake further workinto these aspects in the future. Similarly, cultural and socialchoices affect decisions about food (Appadurai 1981; Goody1982; Fischler 1988; Gumerman IV 1997; Lyons andD’Andrea 2003; Smith 2006; Twiss 2012; Fuller andRowlands 2011; Hastorf 2016). As Sherratt (1991: 50) haspointed out: Bwe do not eat species, we eat meals^, we eatfood. Food is made up of a series of categories of what isgood to eat and what is not good to eat (Levi Strauss 1968:xx), and by categorising food in such a way it intersects withaspects of social identity, allowing for it to become embed-ded in expressions of self, such as ethnicity, gender, age,status, ideology/religion (Appadurai 1981; Goody 1982;Fischler 1988; Gumerman IV 1997; Smith 2006; Twiss2012; Hastorf 2016). Culturally informed choices about tasteand texture will also affect cooking technologies and thusthe choices of crops used, for example a desire for breadmight affect decisions about grinding and thus also grainchoices based on starch, protein and gluten content, or thecultural liking for noodles and stewed/boiled foods mightlead to a focus on ‘sticky’ cereals with high waxy starchcontent (Lyons and D’Andrea 2003; Fuller and Rowlands2011). Nonetheless, we argue here that calories are a simplemetric that have the potential to begin to break down theway traditional quantification methods have been applied tolook more at how people thought about their crops from theview of the farmers and the people eating the foodproduced.
It is important to note, as with all statistical approacheswithin archaeobotany, that many factors need to be taken intoconsideration when quantifying the data, and as such, ap-proaching cereal use from the point of view of calorie propor-tion is a rough estimate of relative nutritional importance rath-er to provide an exact reflection of the calorie count within thediets of the past. As in all statistical methods, this approachassumes that differential preservation by charring is negligi-ble, a point that needs to be taken into consideration ininterpreting the data. Taphonomy varies depending on the
Archaeol Anthropol Sci

grain size, with larger grains often being more damaged due towater and starch alternations in cooking, while smaller grainslike millets are more likely to be lost during cooking. Milletsand rice are also commonly boiled not ground, and this couldincrease their survival over wheat and barley. Grain process-ing and storage differences also have the potential to alterubiquity and abundances of grain, and differences in the roleof grains in an economy (e.g. for food and foddering) have thepotential to affect their likelihood of preservation. We havepreviously explored differences in processing (Bates et al.2017b) and have outlined the different pathways throughcleaning at each site for the different grains. Foddering byfeeding grains to cattle (in the form of dung fuel containinggrain fragments) is also a possibility.
Calorific quantification is not being proposed here as anapproach to replace other methods of quantification in theanalysis of macrobotanical remains, nor to provide a directreflection of the exact calorific content of a single meal fromthe past, but rather to provide another way of thinking aboutrelative importance, in terms of significance to diet rather thanin abstracted numbers. The calculations used to estimate thecalories in 100 g of grain per species are shown in Table 2,with the data being taken from modern studies. The caloriesper 100 g of grain were then divided by the number of grainsper 100 g (Table 2) to create a figure for the number of caloriesper grain (Table 2). We recognise that grain size may be afactor in calculations of calories per grain, and suggest thatfuture studies should be carried out to look at calories per grainboth in terms of intra-species differences and also chronolog-ically, to ascertain whether the differences seen between taxaare greater than those within species (see Table 2). There issome likelihood that there were changes in grain size overtime and within species, particularly in response to changingpractice by farmers and the potential impact of climatic andecological variability. Further research looking into this pro-cess, specifically in relation to wheat and barley, and also toaddress the issue of sheer mass of carbohydrates, is ongoing
(see Bates et al. in prep.). In the absence of relevant ancientdatasets, modern studies have been used to provide a firstapproximation in demonstrating the value of calorific quanti-fication studies, which can be used alongside other quantifi-cation methods to look at the role of different grains withinarchaeological farming diets.
Panicum spp. is a broad group of millets that includesseveral species that are often difficult to identify given thecondition of the charred grains being analysed. The availablereferences suggest that Panicum sp. is similar in calorific val-ue range and grain production to Echinochloa colona andSetaria pumila. As Panicum sp. formed only a small propor-tion of any of the samples presented here, an assumption wasmade that it provided 0.004 kcal per grain like the other mil-lets. This was also assumed for the small hulled millets withlong embryos of the genera Setaria sp., Echinochloa sp. andBrachiaria sp. (the SEB group) and small indeterminate mil-lets, as these were likely to be Echinochloa sp. and Setaria sp.given that the majority of identifications were of these millets.
The average density of seeds per period was used to workout the calorie proportions: (density of grain × calories pergrain)/total calories of all cereals at site in time period ×100.
The sites and samples
The samples discussed here were recovered from settlementsites excavated by the Land, Water, Settlement project (Fig. 2;see Petrie et al. 2017). Charred macrobotanical remains wererecovered from five sites using bucket flotation and a 500-μmmesh. These sites will be discussed broadly from west to east.The raw data counts can be found in the SupplementaryInformation.
Dabli vas Chugta
Dabli vas Chugta is the western-most of the five sites, and theextant Mature Harappan levels were excavated and sampled(Singh et al. 2012). This 5–6-ha site lies 7 km north-east ofKalibangan, an important small urban centre. A total of 37flotation samples from the site were analysed (Bates 2016;Bates et al. 2017a, 2017b; Petrie and Bates in press; Petrieet al. 2016, 2017; see Supplementary Information).
As outlined in Table 3, Hordeum vulgare (barley) wasthe most ubiquitous, dense and highest proportioned of thecereals found at Dabli vas Chugta. However, there was alsoa high proportion of millets (all species) present with sim-ilarly high ubiquity. Due to preservation issues, the major-ity of the millet grains were either identifiable as small-grained hulled millets or could be attributed to the SEBgroup category. The next highest proportioned cereal wasHordeum/Triticum, which was made up of large grains thatcould not be identified beyond a generalised barley/wheat
Table 2 Calculations used to create calories per grain. These were thenused to create a proportion of the cereal calories. Sources: Calories per100 g: USDA (2014); grains per 100 g Hordeum vulgare: Penn. State(2014); Triticum aestivum: Ali et al. (2008); Oryza sp.: FAO (2014);Echinochloa colona: Sparacino et al. (2002); Setaria pumila: Steel et al.(1983)
Species Calories(kcal)per 100 g
Grainsper 100 g
Calories per grain(kcal/100 g dividedby grains/100 g)
Hordeum vulgare 354 2998 0.118
Triticum aestivum 361 3096 0.117
Oryza sp. 358 4000 0.09
Echinochloa colona 300 75,758 0.004
Setaria pumila 336 90,909 0.004
Archaeol Anthropol Sci
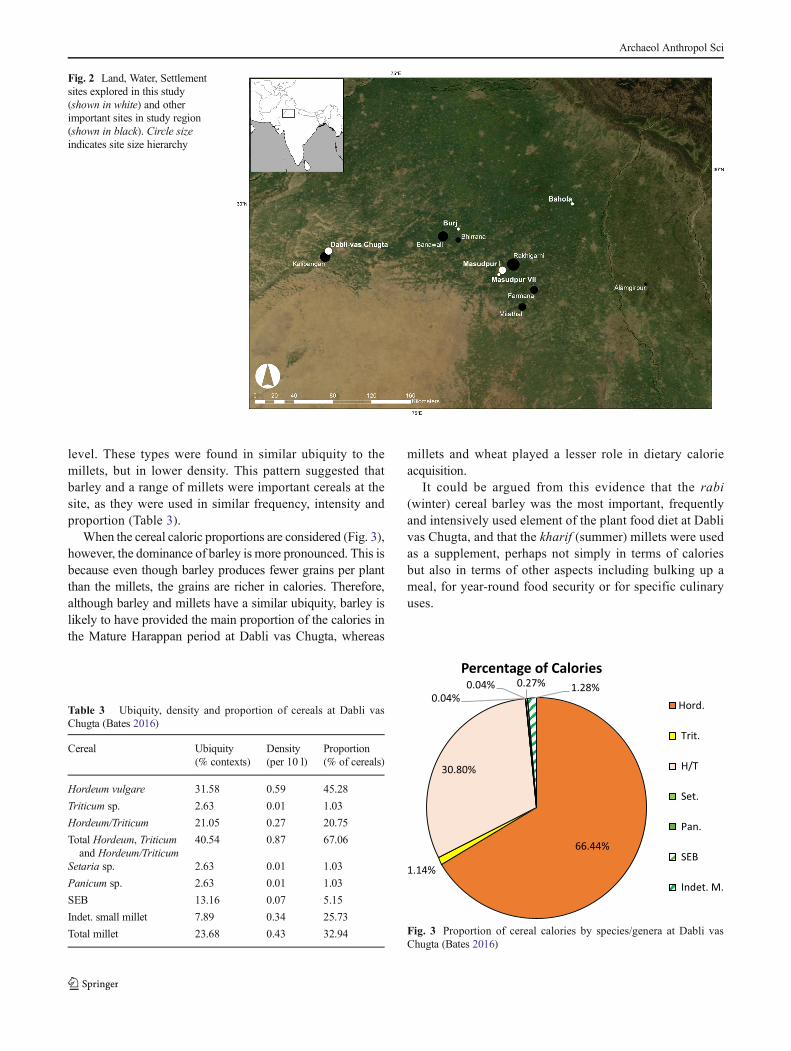
level. These types were found in similar ubiquity to themillets, but in lower density. This pattern suggested thatbarley and a range of millets were important cereals at thesite, as they were used in similar frequency, intensity andproportion (Table 3).
When the cereal caloric proportions are considered (Fig. 3),however, the dominance of barley is more pronounced. This isbecause even though barley produces fewer grains per plantthan the millets, the grains are richer in calories. Therefore,although barley and millets have a similar ubiquity, barley islikely to have provided the main proportion of the calories inthe Mature Harappan period at Dabli vas Chugta, whereas
millets and wheat played a lesser role in dietary calorieacquisition.
It could be argued from this evidence that the rabi(winter) cereal barley was the most important, frequentlyand intensively used element of the plant food diet at Dablivas Chugta, and that the kharif (summer) millets were usedas a supplement, perhaps not simply in terms of caloriesbut also in terms of other aspects including bulking up ameal, for year-round food security or for specific culinaryuses.
Fig. 2 Land, Water, Settlementsites explored in this study(shown in white) and otherimportant sites in study region(shown in black). Circle sizeindicates site size hierarchy
Table 3 Ubiquity, density and proportion of cereals at Dabli vasChugta (Bates 2016)
Cereal Ubiquity(% contexts)
Density(per 10 l)
Proportion(% of cereals)
Hordeum vulgare 31.58 0.59 45.28
Triticum sp. 2.63 0.01 1.03
Hordeum/Triticum 21.05 0.27 20.75
Total Hordeum, Triticumand Hordeum/Triticum
40.54 0.87 67.06
Setaria sp. 2.63 0.01 1.03
Panicum sp. 2.63 0.01 1.03
SEB 13.16 0.07 5.15
Indet. small millet 7.89 0.34 25.73
Total millet 23.68 0.43 32.94 Fig. 3 Proportion of cereal calories by species/genera at Dabli vasChugta (Bates 2016)
Archaeol Anthropol Sci

Burj
The site of Burj is located in Fatehabad District and was occu-pied during the Early Harappan and PGW periods (Singh et al.2010a). It is close to Kunal, which has an unusually rich as-semblage of Early, Early-Mature Transition and MatureHarappan material (Khatri and Acharya 1995), and a relativelyshort distance from both Banawali and Bhiranna. Previouswork (Bates 2016; Bates et al. 2017a, 2017b; Petrie andBates in press; Petrie et al. 2016, 2017) has shown that theEarly Harappan samples were poorly preserved and cannotbe quantified, but it is noticeable that the only material pre-served were large grained cereals, predominantly of wheat/barley type. The PGW period samples were, however, betterpreserved, and 14 samples were analysed (Bates 2016; Bateset al. 2017a, 2017b; Petrie and Bates in press; Petrie et al.,2016, 2017; see Supplementary Information).
In contrast to Dabli vas Chugta, the majority of cereals atBurj were small hulled millets (Table 4).
Millets were the cereal type that occurred in the highestdensity and the most ubiquity at Burj. Of those identifiableto genera or species, Echinochloa cf. colona formed thehighest proportion, occurring in the highest density and ubiq-uity. The second most prevalent millet was Setaria cf. pumila,with Panicum sp. being slightly less ubiquitous and occurringin a lower density. Combined, the small millets were the mostubiquitous, had the highest density and were proportionatelythe largest group of cereals. However, Hordeum vulgare(barley) was also found in over half of all samples, thoughin a much lower density and proportion than the millets. Incontrast, Triticum sp. (wheat) was not ubiquitous, nor was itfound in great proportions, forming less than 1% of the entirecereal assemblage. These data suggest that in the PGWperiod,millets were the dominant crop, with barley being used withsome frequency, but with less intensity, while wheat was nei-ther a major nor a regular component of the diet at Burj.
When these data are converted to proportions of calories,however, this pattern changes (Fig. 4). Instead of millets beingthe dominant group, the major role of barley and Hordeum/Triticum is emphasised, and millets are shown to have formedonly a quarter of the calorific input into the assemblage. Thus,although the millets were the dominant crop in terms of ubiq-uity, density and proportions, they provided a lower propor-tion of the calorific input than barley.
Kharif cereals were therefore the most regularly and in-tensely used cereal group, but not necessarily the most impor-tant in terms of calorific input and the less frequently and lessintensely used rabi cereals may have been the calorific staples.
Masudpur VII
Masudpur VII is one of the several small village sites locatedaround the modern village of the same name and lies about15 km from the Indus urban centre of Rakhigarhi (Petrie et al.2009, 2016; Singh et al. 2010b). This settlement had evidencefor occupation in the Early, Mature and Late Harappan pe-riods, and a total of 25macrobotanical samples were analysed:10 Early Harappan, 12Mature Harappan and 3 Late Harappan(Bates 2016; Bates et al. 2017a, 2017b; Petrie and Bates inpress; Petrie et al. 2016, 2017; see SupplementaryInformation).
In the Early Harappan deposits at Masudpur VII (Table 5),millets were the most ubiquitous of the cereals, specifically,Echinochloa sp. (mostly Echinochloa colona) as well as beingthe most densely occurring and proportionately the largestgroup of cereals. Setaria sp. (mostly Setaria pumila) was alsofound frequently in large proportions. Some Panicum sp. wasalso identified. Hordeum vulgare (barley) was found in highdensities and in similar proportions to Echinochloa sp., but
Table 4 Ubiquity, density and proportion of cereals at Burj in the PGWperiod (Bates 2016)
Cereal Ubiquity(% contexts)
Density(per 10 l)
Proportion(% of cereals)
Hordeum vulgare 57.14 0.82 6.01
Triticum sp. 7.14 0.04 0.26
Hordeum/Triticum 57.14 0.50 3.66
Total Hordeum, Triticumand Hordeum/Triticum
64.28 1.36 9.93
Echinochloa sp. 57.14 6.46 47.26
Setaria sp. 42.86 3.50 25.59
Panicum sp. 21.43 0.46 3.39
SEB 21.43 0.86 6.27
Indet. small millet 35.71 1.04 7.57
Total millets 78.57 12.32 90.07 Fig. 4 Proportion of cereal calories by species/genera at Burj in the PGW(Bates 2016)
Archaeol Anthropol Sci

barley was not as ubiquitous as the millets, being present inonly 40% of contexts. It can therefore be argued that milletwas used at the site in the same intensity and proportion asbarley, but more frequently. Two other cereals were identifiedin the Early Harappan period deposits: Triticum cf. aestivum/durum (bread wheat) and Oryza sp. (rice). These were bothfound in a lower ubiquity, density and proportion, and it canbe suggested that they did not play a large role in the diet at thesite in this period. The lower rice, wheat and barley metricscould be explained through taphonomy. Rice is often boiled,which could result in it being incorporated less frequently thanother cereals, while barley and wheat are often ground, and thehigh water and starch content in these grains can also lead todamage to the grains that results in poor preservationpotential.
This pattern changed in the Mature Harappan period(Table 6). While millets as a group were still more ubiquitousthan other cereals, they were not the largest group in eitherproportion or density, and instead Hordeum/Triticum, and
more specifically Triticum sp. (wheat) was the dominant cropin both of these measures. The millets in the Mature Harappanassemblage were also different from those used in the EarlyHarappan period: no Setaria sp. or Panicum sp. were identi-fied, and instead only Echinochloa sp. (mostly Echinochloacf. colona) was noted alongside the SEB group and smallmillet categories. This suggests that although wheat was notcommonly used, when it was, it was used more intensivelyand formed a larger proportion of the cereal assemblage.Millets were thus used less intensively and in smaller propor-tions, but more frequently.
In the Late Harappan period, there was again a change atMasudpur VII (Table 7), and it was in some ways a reversionto the pattern seen in the Early Harappan period, though thisinterpretation has to be tempered by an acknowledgment ofthe low number of samples. The data suggested that rice hadmade a return, but it was now found in the same ubiquity asHordeum/Triticum, and Panicum sp. also reappeared again.However, although rice and Hordeum/Triticum were the mostubiquitous species, again the small hulled millets group wasfound in a greater density and was proportionally larger. Ofthe millets, one species dominated: Echinochloa sp., whichwas found in the same density and proportion as rice. Itsdensity and proportions was slightly lower than Hordeum/Triticum, but very little genera specific data for this groupcould be gathered due to preservation: no wheat was notedand only 0.17 grains of barley was noted per 10 l sediment.From these data, it therefore seems that Oryza sp. andHordeum/Triticumwere the most commonly identified cerealsin the Late Harappan period and used in similar intensity andproportion to Echinochloa sp.
When these data from these three periods of occupation areconverted to calories, however, a different picture emerges.Figure 5a shows that in the Early Harappan period, the major-ity of calories were provided by barley (66%), while wheat,rice and millets make up similar calorific proportions of be-tween 4 and 6%. In the Mature Harappan period (Fig. 5b), the
Table 5 Ubiquity, density and proportion of cereals atMasudpur VII inthe Early Harappan period (Bates 2016)
Cereal Ubiquity(% contexts)
Density(per 10 l)
Proportion(% of cereals)
Hordeum vulgare 40 1.25 24.27
Triticum sp. 20 0.10 1.94
Hordeum/Triticum 20 0.35 6.80
Total Hordeum, Triticumand Hordeum/Triticum
50 1.7 33.01
Oryza sp. 20 0.10 1.94
Echinochloa sp. 70 1.45 28.16
Setaria sp. 40 0.55 10.68
Panicum sp. 30 0.35 6.80
SEB 40 0.40 7.77
Indet. small millet 50 0.60 11.65
Total millets 80 3.35 65.06
Table 6 Ubiquity, density and proportion of cereals atMasudpur VII inthe Mature Harappan period (Bates 2016)
Cereal Ubiquity(% contexts)
Density(per 10 l)
Proportion(% of cereals)
Hordeum vulgare 8.33 0.04 2.19
Triticum sp. 8.33 0.50 27.32
Hordeum/Triticum 25 0.75 40.98
Total Hordeum, Triticumand Hordeum/Triticum
25 1.29 70.49
Echinochloa sp. 33.33 0.33 18.03
SEB 16.67 0.08 4.37
Indet. small millet 8.33 0.13 7.10
Total millets 41.67 0.54 29.51
Table 7 Ubiquity, density and proportion of cereals atMasudpur VII inthe Late Harappan period (Bates 2016)
Cereal Ubiquity(% contexts)
Density(per 10 l)
Proportion(% of cereals)
Hordeum vulgare 33.33 0.17 2.70
Hordeum/Triticum 66.67 1.50 24.32
Total Hordeum, Triticum,and Hordeum/Triticum
100 1.67 27.02
Oryza sp. 66.67 1.17 18.92
Echinochloa sp. 33.33 1.17 18.92
Panicum sp. 33.33 0.17 2.70
Indet. small millet 33.33 2.00 32.43
Total millets 33.33 3.34 54.05
Archaeol Anthropol Sci

role of wheat increased, while millets made up only 1% of thecalories. The majority of calorific input was provided by thegeneralised category of Hordeum/Triticum, but looking at theidentifiable grains, wheat was proportionately larger in calorieprovision than barley. In the Late Harappan period (Fig. 5c),there is a more mixed picture, with Hordeum/Triticumforming around half of the calories, rice providing a further
33%, and barley and millet each providing a relatively smallproportion of calories.
The data from Masudpur VII thus varies considerably byperiod in both traditional quantification methods and calcula-tions of calories. While the small hulled millets were ubiqui-tous in all periods, their density and proportionate role variedby period, and calorifically, they did not form a significant partof the assemblage in any period. It is notable that species withlarger grains, although less ubiquitous, played a more signif-icant role in calorie provision. These species varied, however,between periods, mirroring perhaps the role of larger grains inthe traditional proportions: with barley being dominant in theEarly Harappan, wheat in the Mature Harappan, andHordeum/Triticum and rice in the Late Harappan.
Masudpur I
Masudpur I was another of the village sites in the hinterland ofRakhigarhi, slightly to the north-east of Masudpur VII (Petrieet al. 2009; Singh et al. 2010b). This site had only MatureHarappan period remains, and 29 samples were analysed(Bates 2016; Bates et al. 2017a, 2017b; Petrie and Bates inpress; Petrie et al. 2016, 2017; see Supplementary Information).
Hordeum vulgare (barley), small-grained hulled milletsEchinochloa cf. colona, Setaria cf. pumila, Panicum sp.,and the large grained Hordeum/Triticum, Triticum aestivum/durum (bread wheat) and Oryza sp. (rice) were all present(Table 8, Bates 2016). Of these, the small hulled millets werethe most ubiquitous group and occurred in the highest density,forming the largest proportion of the cereals (and indeed allcrops). Barley and rice, however, were only marginally lessubiquitous than millets but were found in similar densities andproportions to the millets. These proportions suggest that al-though slightly less common, barley and rice were as
a
b
c
Fig. 5 Proportion of cereal calories by species/genera atMasudpur VII inthe a Early, b Mature and c Late Harappan periods (Bates 2016)
Table 8 Ubiquity, density and proportion of cereals at Masudpur I(Bates 2016)
Cereal Ubiquity(% contexts)
Density(per 10 l)
Proportion(% of cereals)
Hordeum vulgare 62.07 8.64 19.90
Triticum sp. 37.93 0.80 1.85
Hordeum/Triticum 72.41 4.18 9.63
Total Hordeum, Triticumand Hordeum/Triticum
86.21 13.62 31.37
Oryza sp. 55.17 9.41 21.67
Echinochloa sp. 86.21 5.62 12.94
Setaria sp. 72.41 7.53 17.35
Panicum sp. 55.17 1.70 3.91
SEB 65.52 1.76 4.06
Indet. small millet 62.07 3.78 8.71
Total millets 89.66 20.39 46.96
Archaeol Anthropol Sci

intensively used and as important to diet in relative terms.Wheat was also present, but as at Burj and Dabli vasChugta, it was only present in a small number of contexts, inlow density and formed less than 2% of the cereal assemblage.
As at the other sites when these data from Masudpur I areconverted to proportion of calories (Fig. 6), the calorific roleof millets was low, in this instance to less than 3% of theassemblage. The major calorific input is evenly distributedbetween rice and barley, and wheat makes only a small pro-portionate contribution, similar to the millets. These data sug-gests that, although they were not used quite as regularly asmillets, barley and rice were perhaps the most important cropsat Masudpur I in terms of intensity and proportion of use, andalso in calorific terms.
Bahola
The final site discussed here, Bahola, provides yet anotherperspective on rural Indus agriculture in north-west India.Bahola is the most easterly of the sites discussed here andhad evidence for Late Harappan and PGWoccupation as wellas Early Historic levels (Singh et al. 2013a). In total, 20 LateHarappan and 10 PGW samples were analysed.
In the Late Harappan period, small hulled millets dominat-ed in terms of ubiquity, density and proportion statistics (Bates2016; Bates et al. 2017a, 2017b; Petrie and Bates in press;Petrie et al. 2016, 2017). Oryza sp. (rice) and Hordeum/Triticum were also present in high ubiquities (only slightlyless than the small hulled millets), while barley was low inubiquity and wheat was not attested (Table 9). This patterncontinued in the densities and proportions: with millets, espe-cially Echinochloa sp. (mostly Echinochloa cf. colona), beingthe largest and most dense group, closely followed by ricewhich had similar proportions to Setaria sp. (most Setaria
cf. pumila), Hordeum/Triticum which had slightly lower pro-portions, and Hordeum vulgare (barley), which comprisedonly a small proportion of the assemblage.
A similar pattern was seen in the PGW period samples atBahola (Table 10): millets were the most dominant group interms of ubiquity, density and proportion, closely followed byrice and Hordeum/Triticum, with barley being rarely found.Additionally, Triticum sp. (wheat) was found in the PGWlevels but in low ubiquity, density and proportion.
Again, this pattern is different when looking at the propor-tion of calories (Fig. 7). In the Late Harappan period, ricemakes up the largest calorific proportion, followed byHordeum/Triticum, whereas millets make up less than 10%of the calories, and barley is the smallest proportion. In thePGW period, the roles of rice and Hordeum/Triticum reverse,and the calorific proportion of barley increases so that it is
Fig. 6 Proportion of cereal calories by species/genera at Masudpur I(Bates 2016)
Table 10 Ubiquity, density and proportion of cereals at Bahola in thePGW period (Bates 2016)
Cereal Ubiquity(% contexts)
Density(per 10 l)
Proportion(% of cereals)
Hordeum vulgare 20 0.10 3.05
Triticum sp. 10 0.05 1.52
Hordeum/Triticum 50 0.42 12.80
Total Hordeum, Triticumand Hordeum/Triticum
60 0.57 17.38
Oryza sp. 60 0.36 10.98
Echinochloa sp. 70 0.64 19.51
Setaria sp. 60 0.37 11.28
Panicum sp. 30 0.18 5.49
SEB 20 0.17 5.18
Indet. small millet 70 0.99 30.18
Total millet 80 2.53 71.65
Table 9 Ubiquity, density and proportion of cereals at Bahola in theLate Harappan period (Bates 2016)
Cereal Ubiquity(% contexts)
Density(per 10 l)
Proportion(% of cereals)
Hordeum vulgare 20 0.10 0.80
Hordeum/Triticum 60 0.94 7.32
Total Hordeum, Triticumand Hordeum/Triticum
60 1.04 8.12
Oryza sp. 60 2.64 20.49
Echinochloa sp. 75 3.92 30.50
Setaria sp. 55 2.25 17.52
Panicum sp. 25 0.29 0.81
SEB 40 0.10 2.22
Indet. small millet 70 2.61 20.32
Total millet 75 9.18 71.37
Archaeol Anthropol Sci
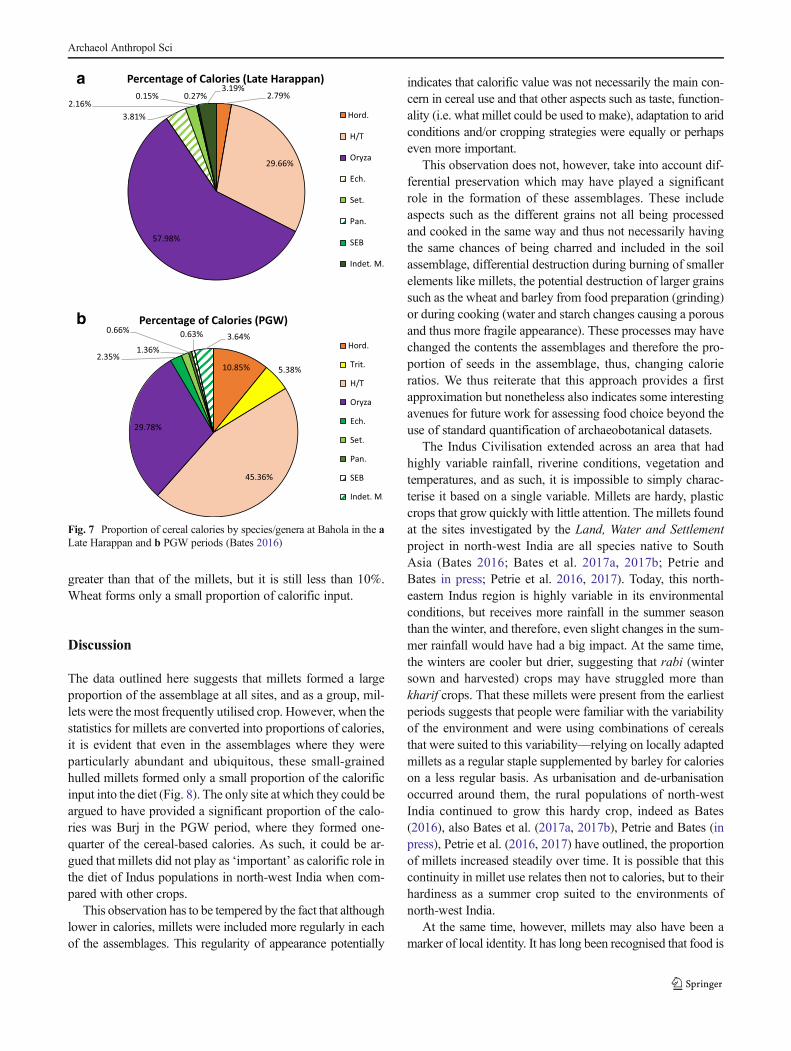
greater than that of the millets, but it is still less than 10%.Wheat forms only a small proportion of calorific input.
Discussion
The data outlined here suggests that millets formed a largeproportion of the assemblage at all sites, and as a group, mil-lets were the most frequently utilised crop. However, when thestatistics for millets are converted into proportions of calories,it is evident that even in the assemblages where they wereparticularly abundant and ubiquitous, these small-grainedhulled millets formed only a small proportion of the calorificinput into the diet (Fig. 8). The only site at which they could beargued to have provided a significant proportion of the calo-ries was Burj in the PGW period, where they formed one-quarter of the cereal-based calories. As such, it could be ar-gued that millets did not play as ‘important’ as calorific role inthe diet of Indus populations in north-west India when com-pared with other crops.
This observation has to be tempered by the fact that althoughlower in calories, millets were included more regularly in eachof the assemblages. This regularity of appearance potentially
indicates that calorific value was not necessarily the main con-cern in cereal use and that other aspects such as taste, function-ality (i.e. what millet could be used to make), adaptation to aridconditions and/or cropping strategies were equally or perhapseven more important.
This observation does not, however, take into account dif-ferential preservation which may have played a significantrole in the formation of these assemblages. These includeaspects such as the different grains not all being processedand cooked in the same way and thus not necessarily havingthe same chances of being charred and included in the soilassemblage, differential destruction during burning of smallerelements like millets, the potential destruction of larger grainssuch as the wheat and barley from food preparation (grinding)or during cooking (water and starch changes causing a porousand thus more fragile appearance). These processes may havechanged the contents the assemblages and therefore the pro-portion of seeds in the assemblage, thus, changing calorieratios. We thus reiterate that this approach provides a firstapproximation but nonetheless also indicates some interestingavenues for future work for assessing food choice beyond theuse of standard quantification of archaeobotanical datasets.
The Indus Civilisation extended across an area that hadhighly variable rainfall, riverine conditions, vegetation andtemperatures, and as such, it is impossible to simply charac-terise it based on a single variable. Millets are hardy, plasticcrops that grow quickly with little attention. The millets foundat the sites investigated by the Land, Water and Settlementproject in north-west India are all species native to SouthAsia (Bates 2016; Bates et al. 2017a, 2017b; Petrie andBates in press; Petrie et al. 2016, 2017). Today, this north-eastern Indus region is highly variable in its environmentalconditions, but receives more rainfall in the summer seasonthan the winter, and therefore, even slight changes in the sum-mer rainfall would have had a big impact. At the same time,the winters are cooler but drier, suggesting that rabi (wintersown and harvested) crops may have struggled more thankharif crops. That these millets were present from the earliestperiods suggests that people were familiar with the variabilityof the environment and were using combinations of cerealsthat were suited to this variability—relying on locally adaptedmillets as a regular staple supplemented by barley for calorieson a less regular basis. As urbanisation and de-urbanisationoccurred around them, the rural populations of north-westIndia continued to grow this hardy crop, indeed as Bates(2016), also Bates et al. (2017a, 2017b), Petrie and Bates (inpress), Petrie et al. (2016, 2017) have outlined, the proportionof millets increased steadily over time. It is possible that thiscontinuity in millet use relates then not to calories, but to theirhardiness as a summer crop suited to the environments ofnorth-west India.
At the same time, however, millets may also have been amarker of local identity. It has long been recognised that food is
a
b
Fig. 7 Proportion of cereal calories by species/genera at Bahola in the aLate Harappan and b PGW periods (Bates 2016)
Archaeol Anthropol Sci

an important element of social life (e.g. Appadurai 1981), as itmakes statements beyond simple sustenance about identity andaffects daily interactions. Cooking methods, for example, canbe indicative of a person’s origins or ancestry, and food can belinked to social class via differential access to resources, andacts such as feasting can be unifying or divisive. Retaining alocal cropping system with regular use of a lower yielding andlower calorific crop may therefore relate not only to environ-ment but may also reflect local identity and choices (e.g. Fulleret al. 2004; Fuller 2005; Smith 2006; Miller 2015).Ethnographic work looking at the functionality of all the cerealsused (e.g. documentation of what can be made/when/why/howthey are cooked) is a logical avenue for future research.
Conclusions
This paper used a corpus of Indus archaeobotanical samples toexplore a new way of quantifying archaeobotanical data, withthe aim of pushing quantification beyond abstracted notions ofrelative importance. By exploring cereals as calorie providersand using this factor to consider the relative importance of thesecrops in terms of the daily diet of the people using them, itindicates that different cereals may have been chosen partiallyfor their calorific value. It has also highlighted the likelihood
that other aspects such as reliability of cropping and ability toadapt to an unstable environment were also important. Formillets, these could have included their drought tolerance,low investment in terms of time and labour, their role in diver-sifying the economy and as part of risk management strategies(see Petrie and Bates in press, and Bates in prep.). We reiteratethat this approach is not meant to replace traditional examina-tions of density, ubiquity and frequency but should instead beused to enhance the interpretations that can be made fromarchaeobotanical data. Flotation is becoming more prevalentduring excavations at Indus settlements, and as a result, anabundance of data is likely to be collected in future years.Indus archaeobotany therefore needs to push its own bound-aries to gain the most out of this new data, by questioning themethods used andwhat they can tell us about the daily lives andchoices of Indus populations. New and even experimental waysof looking at the data are needed, taking into account issues ofuse, choice and value, in addition to basic quantification to lookat intensity, frequency of use and relative importance. Futureavenues of research investigating calories, approaches to multi-cropping to renew the soil nitrogen and mineral contents,cooking techniques, and notions of local values and tastes areall important ways forward. By looking into such areas, we canmove beyond simple numbers and ground our data in the be-haviour of people in the past.
Fig. 8 Proportion of cereal calories organised by period on the y-axis and location on the x-axis. Wheat, barley and Hordeum/Triticum have beencombined to produce a proportion of rabi (winter) cereals shown in orange, rice is shown in purple and millets have been combined and shown in green
Archaeol Anthropol Sci

Acknowledgments This research was carried out as a part of JB’s PhDresearch, which was funded by the Arts and Humanities Research Council.Analysis was carried out in the George Pitt Rivers laboratory in theMcDonald Institute for Archaeological Research, University of Cambridge.Sampleswere provided by theLand,Water, Settlement project, co-directed byCAP and RNS, which is a collaboration between the University ofCambridge and Banaras Hindu University that was carried out with thesupport of the Archaeological Survey of India. The Land, Water, Settlementproject was funded by the UK India Education Research Initiative, BritishAcademy Stein Arnold Fund, Isaac Newton Trust, McDonald Institute forArchaeological Research and the Research Councils UK. Additional field-work funding for JB was provided by the Arts and Humanities ResearchCouncil, Rouse-Ball Research Fund, Cambridge India Partnership Fund,Division of Archaeology Fieldwork Fund and Trinity College ProjectsFund. The authors would also like to thank Prof. Martin Jones, Prof.Dorian Fuller, Prof. Marco Madella, Dr. Michele Wollstonecroft and Dr.Rachel Ballentyne for their advice and help.
Open Access This article is distributed under the terms of the CreativeCommons At t r ibut ion 4 .0 In te rna t ional License (h t tp : / /creativecommons.org/licenses/by/4.0/), which permits unrestricted use,distribution, and reproduction in any medium, provided you giveappropriate credit to the original author(s) and the source, provide a linkto the Creative Commons license, and indicate if changes were made.
References
Ali Y, Atta BM, Akhter J, Monneveux P, Lateef Z (2008) Genetic variabil-ity, association and diversity studies in wheat (Triticum aestivum L.)germplasm. Pak J Bot 40:2087–2097
Appadurai A (1981) Gastro-politics in Hindu South Asia. Am Ethnol 8:494–511
Bates, J. (2016) Social organisation and change in Bronze Age SouthAsia: a multi-proxy approach to urbanisation, deurbanisation andvillage life through phytolith and macrobotanical analysis. PhDThesis, University of Cambridge.
Bates J, Petrie CA, Singh RN (2017a) Approaching rice domestication inSouth Asia: new evidence from Indus settlements in northern India.J Archaeol Sci 78:193–201. doi:10.1016/j.jas.2016.04.018
Bates J, Petrie CA, Singh RN (2017b) Exploring Indus crop processing:combining phytolith and macrobotanical analyses to consider the orga-nisation of agriculture in northwest India c. 3200–1500 BC. Veg HistArchaeobot 26(1):25–41. doi:10.1007/s00334-016-0576-9
Borgerhoff Mulder M., Schacht R. (2012) Human behavioural ecology.John Wiley & Sons, Ltd, Chichester, UK.
Brookfield HC (1986) Intensification intensified. Archaeol Ocean 21:177–180
Fairservis W.A. (1967) The origin, character and decline of an earlycivilisation. AM MUS NOVITATES no.2302.
Fischler C (1988) Food, self and identity. SOC SCI INFORM 27:275–292Food and Agriculture Organisation (2014) Grassland species. http://www.fao.
org/ag/agp/AGPC/doc/gbase/data/pf000274.htm. Accessed 5 June 2015.Fuller DQ (2000) The emergence of agricultural societies in South India:
botanical and archaeological perspectives. Dissertation, Universityof Cambridge
Fuller DQ (2002) Fifty years of archaeobotanical studies in India: laying asolid foundation. In: Settar S, Korisettar R (eds) Indian archaeologyin retrospect III: archaeology and interactive disciplines. Manohar,New Delhi, pp 247–364
Fuller DQ (2005) Ceramics, seeds and culinary change in prehistoricIndia. Antiquity 79:761–777
Fuller DQ (2006) Agricultural origins and frontiers in South Asia: a workingsynthesis. J World Prehist 20:1–86. doi:10.1007/s10963-006-9006-8
Fuller DQ, Korisettar R, Venkatasubbaiah PC, Jones M (2004) Earlyplant domestications in southern India: some preliminaryarchaeobotanical results. Veg Hist Archaeobot 13:115–129. doi:10.1007/s00334-004-0036-9
Fuller DQ, Harvey EL (2006) The archaeobotany of Indian pulses: iden-tification, processing and evidence for cultivation. Environ Archaeol11:219–246. doi:10.1179/174963106x123232
Fuller DQ, Madella M (2002) Issues in Harappan archaeobotany: retro-spect and prospect. In: Settar S, Korisettar R (eds) Indian archaeol-ogy in retrospect II: protohistory. Manohar, New Delhi, pp 317–390
Fuller DQ, Rowlands M (2011) Ingestion and food technologies: main-taining differences over the long-term in West, South and East Asia.In: Bennet J, Sherratt S, Wilkinson TC (eds) Interweaving worlds—systematic interactions in Eurasia, 7th to 1st millennia BC. Essaysfrom a conference in memory of Professor Andrew Sherratt. OxbowBooks, Oxford, pp 37–60
Fuller DQ, Sato Y-I, Castillo C, Qin L, Weisskopf A, Kingwell-BanhamE, Song J, Ahn S-M, van Etten J (2010) Consilience of genetics andarchaeobotany in the entangled history of rice. Archaeol AnthropolSci 2:115–131. doi:10.1007/s12520-010-0035-y
Fuller DQ, Stevens CJ, McClatchie M (2014) Routine activities, tertiaryrefuse and labour organisation: social inference from everydayarchaeobotany. In: Madella M, Lancelotti C, Savard M (eds)Ancient plants and people, contemporary trends in archaeology.University of Arizona Press, Tuscon, pp 174–217
Goody J. (1982) Cooking, cuisine and class: a study in comparativesociology. Cambridge University Press, Cambridge.
Gumerman G IV (1997) Food and complex societies. J ARCHAEOLMETHOD TH 4(2):105–139
Hastorf C.A. (2016) The social archaeology of food, thinking about eat-ing from prehistory to the present. Cambridge University Press,Cambridge.
Hastorf C.A. and Popper V.S. (1988) Current palaeoethnobotany: analyt-ical methods and cultural interpretations of archaeological plant re-mains. University of Chicago Press, Chicago.
Hill K (1988) Macronutrient modifications of optimal foraging theory: anapproach using indifference curves applied to some modern for-agers. Hum Ecol 16:157–197
Kenoyer JM (1997) Early city-states in South Asia: comparing theHarappan phase and the Early Historic period. In: Nichols DL,Charlton TH (eds) The archaeology of city-states, cross-cultural ap-proaches. Smithsonian Institute Press, Washington D.C., pp 51–70
Kenoyer JM (2000) Wealth and socio-economic hierarchies of the IndusValley Civilisation. In: Richards J, van Buren M (eds) Order, legit-imacy and wealth in early states. Cambridge University Press,Cambridge, pp 90–112
Khatri JS, Acharya M (1995) Kunal: a new Indus-Saraswati site.PURATATTVA 25:84–86
Levi Strauss, C., 1968. L’Origine des maniéres de table. In MythologiquesIV. Seuil, Paris.
Lyons DE, D’Andrea AC (2003) Griddle, ovens and agricultural origins:an ethnoarchaeological study of bread baking in highland Ethiopia.Am Anthropol 105(3):515–530
Madella M (2014) Of crops and food, a social perspective on rice in theIndus Civilisation. In: Madella M, Lancelotti C, Savard M (eds)Ancient plants and people, contemporary trends in archaeology.University of Arizona Press, Tuscon, pp 218–236
Madella M, Fuller DQ (2006) Palaeoecology and the HarappanCivilisation of South Asia: a reconsideration. QUATERNARYSCI REV 25:1283–1301. doi:10.1016/j.quascirev.2005.10.012
Miller HM-L (2015) Surplus in the Indus Civilisation: agricultural choices,social relations, political effects. In: Morehart CT, de Lucia K (eds)Surplus: the politics of production and the Strategies of Everyday life.University Press of Colorado, Colorado, pp 97–120
Miller NF (1988) Ratios in Palaeoethnobotanical analysis. In: HastorfCA, Popper VA (eds) Current palaeoethnobotany: analytical
Archaeol Anthropol Sci

methods and cultural interpretations of archaeological plant remains.Chicago University Press, Chicago, pp 72–85
Minnis PE (1981) Seeds in archaeological sites: sources and some inter-pretive problems. AM ANTIQUITY 46:143–151
Morrison KD (1994) Intensification of production: archaeological ap-proaches. J Archaeol Method Theory 1:111–159
Parikh D, Petrie CA (2017) Urban-rural dynamics and Indus ceramic pro-duction in Northwest India: a preliminary analysis of the pottery fromMasudpur I andMasudpur VII. In: Lefevre V,Mutin B, Didier A (eds)South Asian archaeology 2012. Indicopleustoi, Brepols, Turnhout
Pawar V (2012) Archaeological settlement pattern of HanumangarhDistrict (Rajasthan). Dissertation, MD University Rohtak.
Pearsall D.M. (1989) Palaeoethnobotany: a handbook of procedures.Academic Press, San Diego.
State P (2014) Agronomy Guide 2013–2014 http://extension.psu.edu/agronomy-guide/average-bushel-weights. Accessed 5 June 2015
Petrie C.A., Bates J. (in press) ‘Multi-cropping’, intercropping and adaptationto variable environments in Indus South Asia. J WORLD PREHIST
Petrie C.A., Bates J., Higham T., Singh, R.N. (2016) Feeding ancientcities in South Asia: dating the adoption of rice, millet and tropicalpulses in the Indus civilisation. ANTIQUITY 90(354): 1489-1504,DOI 10.15184/aqy.2016.210
Petrie C.A., Singh R.N., Bates J., Dixit Y., French C.A.I., Hodell D., JonesP.J., Lancelotti C., Lyman F., Neogi S., Pandey A.K., Parikh D.,Pawar V., Redhouse D.I., Singh D.P. (2017) Adaptation to variableenvironments, resilience to climate change: investigating Land, Waterand Settlement in Indus northwest India. CURR ANTHROPOL.DOI: 10.1086/690112
Petrie CA, Singh RN, Singh AK (2009) Investigating changing settle-ment dynamics on the plains: the 2009 survey and excavations atMasudpur (Hissar District, Haryana). PURATATTVA 39:38–49
Popper VS (1988) Selecting quantitative measures in palaeoethnobotany.In: Hastorf CA, Popper VS (eds) Current palaeoethnobotany: ana-lytical methods and cultural interpretations of archaeological plantremains. Chicago University Press, Chicago, pp 53–71
Possehl, G.L. (1999) Indus Age: the beginnings. University ofPennsylvania Press, Philadelphia, Pennsylvania.
Possehl G.L. (2002) The Indus civilization: a contemporary perspective.AltaMira Press, Walnut Creek.
Reddy S.N. (1994) Plant usage and subsistence modelling: anethnoarchaeological approach to the Late Harappan of northwestIndia. Dissertation, University of Wisconsin-Madison.
Reddy SN (1997) If the threshing floor could speak: integration of agri-culture and pastoralism during the Late Harappan in Gujarat, India. JAnthropol Archaeol 16:162–187
Reddy S.N. (2003) Discerning palates of the past: an ethnoarchaeologicalstudy of crop cultivation and plant usage in India, ethnoarchaeologicalseries. International Monographs in Prehistory, Ann Arbor.
Sherratt A (1991) Sacred and profane substances: the ritual use of nar-cotics in later Neolithic Europe. In: Garwood P, Jennings D, SkeatesR, Toms J (eds) Sacred and profane, monograph 32. OxfordUniversity Committee for Archaeology, Oxford, pp 50–64
Singh R.N., Petrie C.A., Bates J., Pandey A.K., Parikh D., Singh D.P.(2013a) Survey and excavations at Bahola, Karnal District,Haryana: March 27–April 17, 2012. MANAVIKI III-IV:5–11.
Singh RN, Petrie CA, FrenchCAI, Bates J, PandeyAK, ParikhD, LancelottiC, Redhouse DI (2012) Survey and excavations at Dabli vas Chugta,Hanumangarh District, Rajasthan. PURATATTVA 42:133–147
Singh R.N., Petrie C.A., French C.A.I., Goudie A.S., Gupta S., Tewari R.,Singh A.K., Sinha R., Srivastava R.K., Yadav S., Singh V.K. (2008)Settlements in context: reconnaissance in western Uttar Pradesh andHaryana, April and May 2008.) MAN AND ENVIRONMENTXXXIII:71–87.
Singh RN, Petrie CA, French CAI, Neogi S, Pandey AK, ParikhD, PawarV (2010a) Geoarchaeology survey and excavations at Burj,Fatehabad, Haryana. PURATATTVA 40:94–101
Singh RN, Petrie CA, Joglekar PP, Neogi S, Lancelotti C, Pandey AK,Pathak A (2013b) Recent excavations at Alamgirpur, Meerut District:a preliminary report. MAN AND ENVIRONMENT 38:32–54
Singh RN, Petrie CA, Pawar V, Pandey AK, Neogi S, Singh M, SinghAK, Parikh D, Lancelotti C (2010b) Changing patterns of settlementin the rise and fall of Harappan urbanism: preliminary report on theRakhigarhi Hinterland Survey 2009. MANANDENVIRONMENTXXXV:37–53
Singh RN, Petrie CA, Pawar V, Pandey AK, Parikh D (2011) New in-sights into settlement along the Ghaggar and its hinterland: a pre-liminary report on the Ghaggar Hinterland Survey 2010. MANAND ENVIRONMENT 36:89–106
Smith ML (2006) The archaeology of food preference. Am Anthropol108:480–493
Sparacino AC, Tano F, Vescovi FD, Sacchi D, Riva N (2002) Preliminarystudy of the biology ofEchinochloa crus-galli and E.colona. In: HillJE, Hardy B (eds) Proceedings of the second temperate rice confer-ence. IRRI, Los Baños, pp 583–589
Steel MG, Cavers PB, Lee SM (1983) The biology of Canadian weeds 59Setaria glauca (L.) Beauv. And S. verticilata (L.) Beauv. Can J PlantSci 63:711–725. doi:10.4141/cjps83-088
Stevens CJ (2003) An investigation of agricultural consumption and pro-duction models for prehistoric and Roman Britain. EnvironArchaeol 8:61–76. doi:10.1179/env.2003.8.1.61
Twiss K (2012) The archaeology of food and social diversity. JAARCHAEOL RES 20:357–395. doi:10.1007/s10814-012-9058-5
USDA Agricultural Research Service (2014) National nutrient databasefor standard reference release 27. http://ndb.nal.usda.gov/ndb/foods.Accessed 5 June 2015
Weber S.A. (1989) Plant and Harappan subsistence: an example of stabilityand change from Rojdi. Dissertation, University of Pennsylvania.
Weber S.A. (1991) Plants and Harappan subsistence: an example of sta-bility and change from Rojdi. Oxford and IBH Publishing Co. Pvt.Ltd., New Delhi.
Weber SA (1992) South Asian archaeobotanical variability. In: Jarrige C (ed)SouthAsian archaeology 1989. Prehistoric Press,Madison, pp 283–290
Weber SA (1997) Harappa archaeobotany: a model for subsistence. In:Allchin B, Allchin FR (eds) South Asian Archaeology 1995. Oxfordand IBH Publishing Co. Pvt. Ltd., New Delhi, pp 115–117
Weber SA (1998) Out of Africa: the initial impact of millets in SouthAsia. Curr Anthropol 39:267–274. doi:10.1086/204725
Weber SA (1999) Seeds of urbanism: palaeoethnobotany and the IndusCivilisation. Antiquity 73:813–826
Weber SA (2003) Archaeobotany at Harappa: indications for change. In:Weber SA, Belcher WR (eds) Indus ethnobiology: new perspectivesfrom the field. Lexington Books, Lanham, pp 175–198
Weber SA, Fuller DQ (2008) Millets and their role in early agriculture.PRAGDHARA 18:69–90
Weber SA, Kashyap A (2016) The vanishing millets of the Indus civiliza-tion. Archaeol Anthropol Sci 8:9–15. doi:10.1007/s12520-013-0143-6
Willcox G (1991) Carbonised plant remains from Shortughai,Afghanistan. In: Renfrew JM (ed) New light on early farming: re-cent developments in palaeoethnobotany. Edinburgh UniversityPress, Edinburgh, pp 139–153
Willcox G (1992) Some differences between crops of Near Eastern originand those from the tropics. In: Jarrige C (ed) South AsianArchaeology 1989. Monographs in World Archaeology,Wisconsin, pp 291–300
Winterhalder B, Goland C (1997) An evolutionary ecology perspectiveon diet choice, risk, and plant domestication. In: Gremillion KJ (ed)People, plants and landscapes: studies in paleoethnobotany.University of Alabama Press, Tuscaloosa, pp 123–160
Wheeler M. (1950) Five thousand years of Pakistan: an archaeologicaloutline. Royal India and Pakistan Society, London.
Wright R.P. (2010) The ancient Indus: urbanism, economy, and society, casestudies in early societies. Cambridge University Press, Cambridge.
Archaeol Anthropol Sci