Ceramics Industry Sector Report - · PDF fileCeramics Industry Sector Report ... Cera...
29
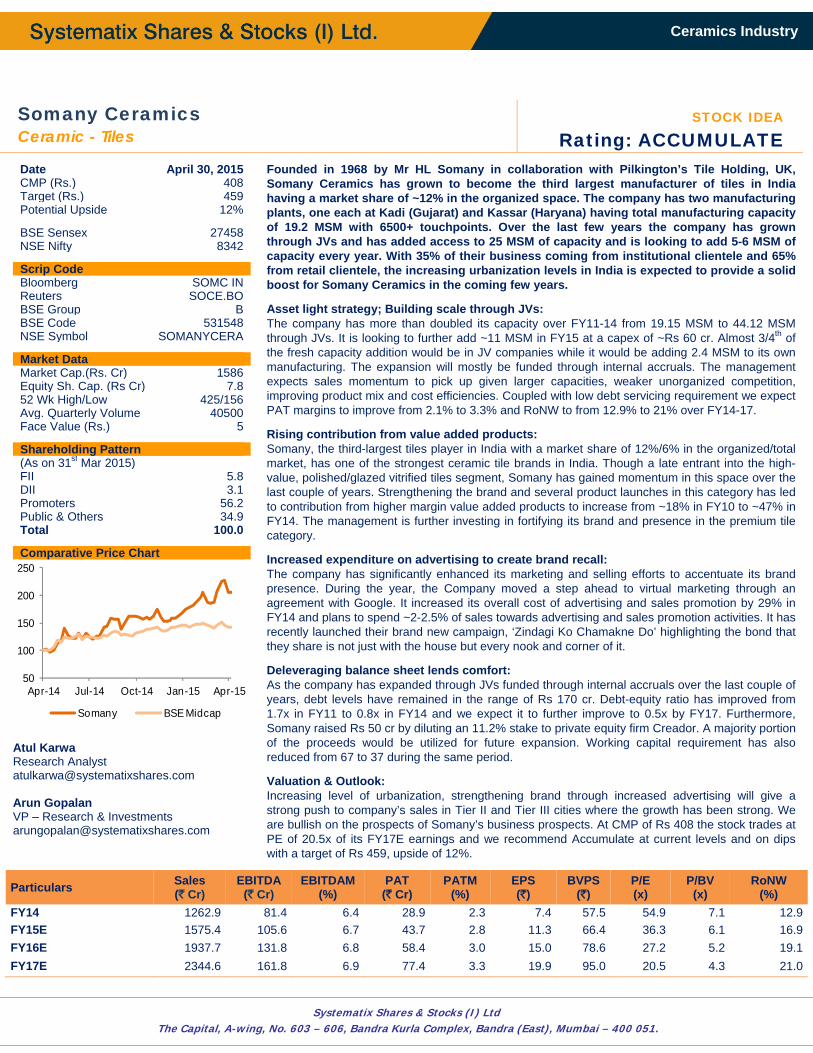
Systematix Shares & Stocks (I) Ltd The Capital, A-wing, No. 603 – 606, Bandra Kurla Complex, Bandra (East), Mumbai – 400 051. Ceramics Industry Sector Report Ceramics Outlook : BULLISH Cera Sanitaryware - Buy CMP: Rs 2135 Target price : Rs 2500 Upside: 17.0% HSIL Ltd - Buy CMP: Rs 399 Target price : Rs 476 Upside: 19.5% Kajaria Ceramics – Buy CMP: Rs 760 Target price : Rs 939 Upside: 23.5% Somany Ceramics - Accumulate CMP: Rs 408 Target price : Rs 459 Upside: 12.3% Atul Karwa Research Analyst [email protected] Arun Gopalan VP – Research & Investments [email protected] April 30, 2015 After nearly 100 years after the manufacture of ceramic tiles began in India, the industry output stands at 750 MSM at the end of CY13 valued at roughly Rs 22000 cr and growing annually by 15%, as compared to a global growth rate of 11%. The sanitaryware & bathroom fittings industry is valued at ~Rs 9000 cr and growing at 12-15% annually. Organized sector accounts for ~50% of the industry. The industry has been plagued by shortage of key raw materials like quartz and feldspar, high fuel prices, dumping from China and competition from unorganized players. With the recent fall in crude prices natural gas prices are expected to come down and the ban on use of coal based plants has reduced the competitive advantage of unorganized players. However, anti-dumping duty on Chinese imports expired in June 2013 and the exports of quartz and feldspar have gone up substantially. At 0.50 sq.m per person, India has a far lower per capita consumption than its BRICS peers which consume around 2 sq.m per person per year, while the USA consumes around 6 sq.m per person annually. This shows the sheer size of the opportunity. With the Modi Government’s focus on projects such as “Housing for All by 2022” and the “Swachh Bharat Abhiyaan), we expect the ceramics and sanitaryware sectors to offer an excellent opportunity for growth. Third largest and among the fastest growing tile market: India is the 3rd highest producer and consumer of ceramic tiles in the world after China and Brazil accounting for roughly 6.5% of the world production and consumption of tiles. The growth in India is ~1.4x of world average during the period CY09-CY13. The Indian ceramic tiles market size is estimated to have been Rs 172 bn in 2012 and is expected to reach Rs 301 bn by 2016 growing at a CAGR of 15%. India’s share in the world market has increased from 5.7% in CY09 to 6.3% in CY13 in production and from 5.8% to 6.5% in consumption. Sanitaryware & Bathroom Fittings market poised for strong growth: The sanitary ware and bathroom fittings industry in India together is estimated to be valued around US$ 427 mn USD in 2014. The sanitary ware segment is estimated to be valued ~US$ 124 mn while the bathroom fittings segment is estimated at approximately US$ 303 mn. The Indian sanitary-ware market accounts for 8% of the global production and ranks second in terms of volume in the Asia-Pacific region. The government initiatives and boom in the real estate sector will further contribute to the growing demand of sanitary ware and bathroom fittings products in the country with the grow at the CAGR of about 12.5% and 15% respectively between 2012-2016. The demand for sanitary ware is highest in residential sector followed by demand from commercial sector including malls, hotels, and hospitals. Share of organized players expected to increase: The organized ceramic tiles players account of ~50% of the market while sanitaryware players account for 60% of the total market size. With rising disposable income, increasing brand awareness and fading price differential market share of organized players is set to increase. Also the consumer preference is shifting towards better quality and higher end products offered mainly by the organized players which should drive the demand for their products. Govt pushing “Housing For All” by 2022 : India is expected to overtake China as the world’s most populated nation by 2025. The increasing population would lead to higher demand for housing both in the urban as well as rural areas. The Central Government aims to provide housing to all its citizens by 2022. As per KPMG’s estimate the vision entails developing 11 cr housing units including current shortage of 6 cr units. Higher budget allocation for housing, extended additional tax incentives on home loans, easing of FDI into real estate sector and the inclusion of slum development into the purview of Corporate Social Responsibility are some of the measures taken by the government so far to augment the growth of housing sector.
-
Upload
duongkhuong -
Category
Documents
-
view
223 -
download
6
Transcript of Ceramics Industry Sector Report - · PDF fileCeramics Industry Sector Report ... Cera...
Systematix Shares & Stocks (I) Ltd The Capital, A-wing, No. 603 – 606, Bandra Kurla Complex, Bandra (East), Mumbai – 400 051.
Ceramics Industry Sector Report Ceramics Outlook : BULLISH
Cera Sanitaryware - Buy CMP: Rs 2135 Target price : Rs 2500 Upside: 17.0% HSIL Ltd - Buy CMP: Rs 399 Target price : Rs 476 Upside: 19.5% Kajaria Ceramics – Buy CMP: Rs 760 Target price : Rs 939 Upside: 23.5% Somany Ceramics - Accumulate CMP: Rs 408 Target price : Rs 459 Upside: 12.3% Atul Karwa Research Analyst [email protected] Arun Gopalan VP – Research & Investments [email protected] April 30, 2015
After nearly 100 years after the manufacture of ceramic tiles began in India, the industry output stands at 750 MSM at the end of CY13 valued at roughly Rs 22000 cr and growing annually by 15%, as compared to a global growth rate of 11%. The sanitaryware & bathroom fittings industry is valued at ~Rs 9000 cr and growing at 12-15% annually. Organized sector accounts for ~50% of the industry. The industry has been plagued by shortage of key raw materials like quartz and feldspar, high fuel prices, dumping from China and competition from unorganized players. With the recent fall in crude prices natural gas prices are expected to come down and the ban on use of coal based plants has reduced the competitive advantage of unorganized players. However, anti-dumping duty on Chinese imports expired in June 2013 and the exports of quartz and feldspar have gone up substantially. At 0.50 sq.m per person, India has a far lower per capita consumption than its BRICS peers which consume around 2 sq.m per person per year, while the USA consumes around 6 sq.m per person annually. This shows the sheer size of the opportunity. With the Modi Government’s focus on projects such as “Housing for All by 2022” and the “Swachh Bharat Abhiyaan), we expect the ceramics and sanitaryware sectors to offer an excellent opportunity for growth. Third largest and among the fastest growing tile market: India is the 3rd highest producer and consumer of ceramic tiles in the world after China and Brazil accounting for roughly 6.5% of the world production and consumption of tiles. The growth in India is ~1.4x of world average during the period CY09-CY13. The Indian ceramic tiles market size is estimated to have been Rs 172 bn in 2012 and is expected to reach Rs 301 bn by 2016 growing at a CAGR of 15%. India’s share in the world market has increased from 5.7% in CY09 to 6.3% in CY13 in production and from 5.8% to 6.5% in consumption. Sanitaryware & Bathroom Fittings market poised for strong growth: The sanitary ware and bathroom fittings industry in India together is estimated to be valued around US$ 427 mn USD in 2014. The sanitary ware segment is estimated to be valued ~US$ 124 mn while the bathroom fittings segment is estimated at approximately US$ 303 mn. The Indian sanitary-ware market accounts for 8% of the global production and ranks second in terms of volume in the Asia-Pacific region. The government initiatives and boom in the real estate sector will further contribute to the growing demand of sanitary ware and bathroom fittings products in the country with the grow at the CAGR of about 12.5% and 15% respectively between 2012-2016. The demand for sanitary ware is highest in residential sector followed by demand from commercial sector including malls, hotels, and hospitals. Share of organized players expected to increase: The organized ceramic tiles players account of ~50% of the market while sanitaryware players account for 60% of the total market size. With rising disposable income, increasing brand awareness and fading price differential market share of organized players is set to increase. Also the consumer preference is shifting towards better quality and higher end products offered mainly by the organized players which should drive the demand for their products. Govt pushing “Housing For All” by 2022 : India is expected to overtake China as the world’s most populated nation by 2025. The increasing population would lead to higher demand for housing both in the urban as well as rural areas. The Central Government aims to provide housing to all its citizens by 2022. As per KPMG’s estimate the vision entails developing 11 cr housing units including current shortage of 6 cr units. Higher budget allocation for housing, extended additional tax incentives on home loans, easing of FDI into real estate sector and the inclusion of slum development into the purview of Corporate Social Responsibility are some of the measures taken by the government so far to augment the growth of housing sector.
2
Ceramics Industry
Systematix Shares & Stocks (I) Ltd The Capital, A-wing, No. 603 – 606, Bandra Kurla Complex, Bandra (East), Mumbai – 400 051.
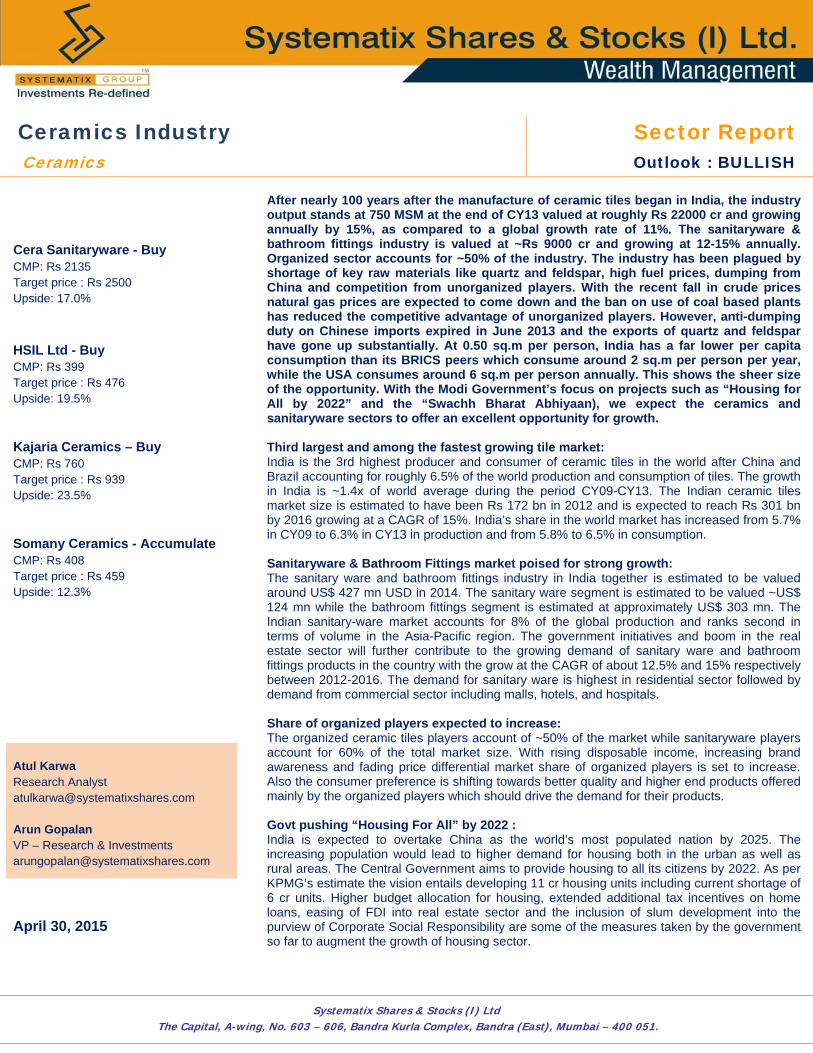
Third largest and among the fastest growing tile market… India is the 3rd highest producer and consumer of ceramic tiles in the world after China and Brazil. It accounted for 6.3% and 6.5% of the world production and consumption of ceramic tiles. India’s share in the world market has increased from 5.7% in CY09 to 6.3% in CY13 in production and from 5.8% to 6.5% in consumption. India is among the fastest growing tile markets with a CAGR growth of 11.2% and 10.9% over CY09-CY13 for production and consumption respectively as compared to the world average of 8.5% and 7.9%. The production of ceramic tiles in India stood at 750 MSM while consumption was 748 MSM indicating that there is very less idle capacity. According to a new market report published by Transparency Market Research on Ceramic Tiles Market the global market for ceramic tiles was valued at USD 55.79 billion in 2011 and is expected to reach USD 102.79 billion by 2018, growing at a CAGR of 9.2% from 2012 to 2018. In terms of volume, demand for ceramic tiles was 10,370.0 mn sq mtrs in 2011 and is expected to reach 18,154.1 mn sq mtrs by 2018, growing at a CAGR of 8.4% from 2012 to 2018.
Exhibit 1: Worldwide Production of Ceramic Tiles (MSM) Exhibit 2: Worldwide Consumption of Ceramic Tiles (MSM)
Country CY09 CY10 CY11 CY12 CY13 CAGR
(%) China 3600 4200 4800 5200 5700 12.2Brazil 715 754 844 866 871 5.1India 490 550 617 691 750 11.2Iran 350 400 475 500 500 9.3Spain 324 366 392 404 420 6.7Indonesia 278 287 320 360 390 8.8Italy 368 387 400 367 363 -0.3Turkey 205 245 260 280 340 13.5Vietnam 295 375 380 290 300 0.4Mexico 204 210 219 229 228 2.8Others 1752 1845 1892 2007 2051 4.0Total 8581 9619 10599 11194 11913 8.5
Country CY09 CY10 CY11 CY12 CY13 CAGR
(%) China 3030 3500 4000 4250 4556 10.7Brazil 644 700 775 803 837 6.8India 494 557 625 681 748 10.9Indonesia 297 277 312 340 360 4.9Iran 295 335 395 375 350 4.4Vietnam 240 330 360 254 251 1.1S. Arabia 166 182 203 230 235 9.1Russia 139 158 181 213 231 13.5USA 173 186 194 204 230 7.4Turkey 138 155 169 184 226 13.1Others 2919 3111 3222 3398 3550 5.0Total 8535 9491 10436 10932 11574 7.9
Source: Ceramic World Review, Systematix Research Exhibit 3: Production Share
Exhibit 4: Consumption Share
Source: Ceramic World Review, Systematix Research
42.0% 43.7% 45.3% 46.5% 47.8%
8.3% 7.8% 8.0% 7.7% 7.3%5.7% 5.7% 5.8% 6.2% 6.3%
36.1% 34.8% 32.7% 31.6% 30.8%
0.0%
10.0%
20.0%
30.0%
40.0%
50.0%
60.0%
70.0%
80.0%
90.0%
100.0%
CY09 CY10 CY11 CY12 CY13
China Brazil India Iran Spain Others
35.5% 36.9% 38.3% 38.9% 39.4%
7.5% 7.4% 7.4% 7.3% 7.2%5.8% 5.9% 6.0% 6.2% 6.5%
44.2% 43.4% 41.5% 41.0% 40.8%
0.0%
10.0%
20.0%
30.0%
40.0%
50.0%
60.0%
70.0%
80.0%
90.0%
100.0%
CY09 CY10 CY11 CY12 CY13
China Brazil India Indonesia Iran Others
3
Ceramics Industry
Systematix Shares & Stocks (I) Ltd The Capital, A-wing, No. 603 – 606, Bandra Kurla Complex, Bandra (East), Mumbai – 400 051.
Indian ceramic tiles expected to grow at 15% CAGR to Rs 301 bn by 2016 Per capita tile consumption in among the lowest in India
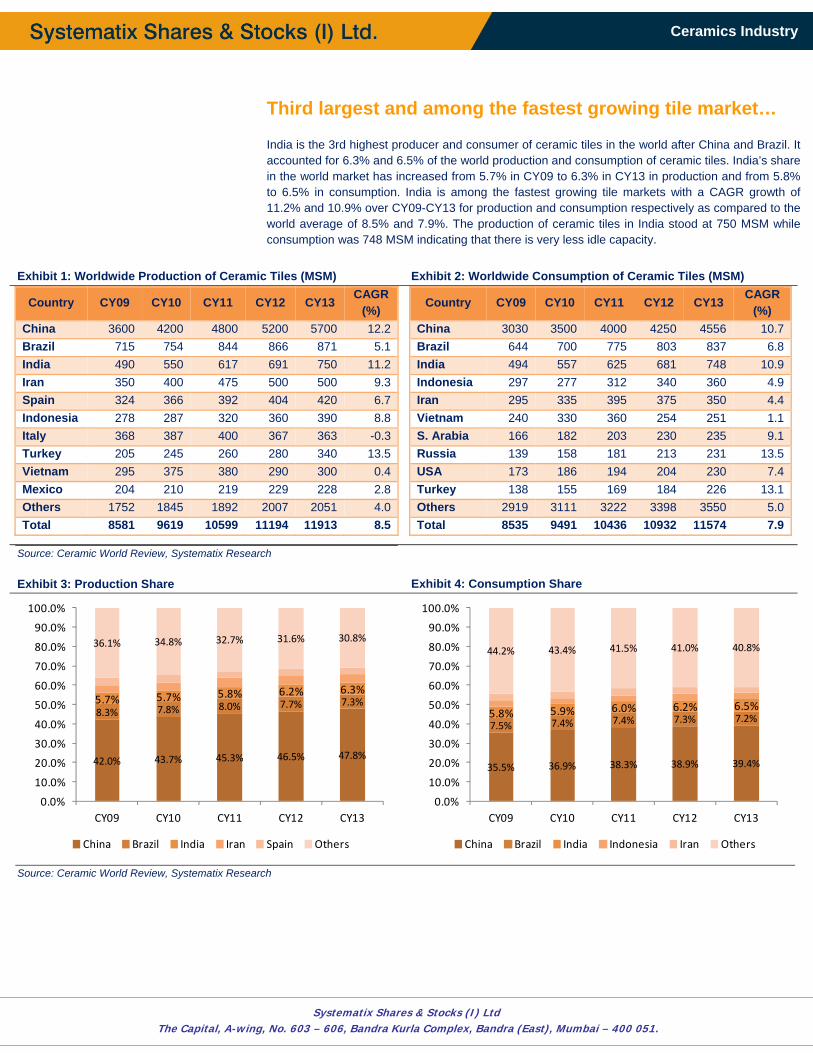
The Indian ceramic tiles market size is estimated to have been Rs 172 bn in 2012 and is expected to reach Rs 301 bn by 2016 growing at a CAGR of 15%.The Indian ceramic tiles market ranked third globally, accounted for over 6% of the total global production in 2012. The organized segment makes up approximately 50% of the sector, and the top three manufacturers constitute over 50% of the organized market. A large number of small or medium-scale manufacturers operate in the unorganized segment, mainly through plants in Gujarat. Nearly 50% of the market consists of vitrified tiles. Exhibit 5: Size of Indian Tile market (Rs Bn)
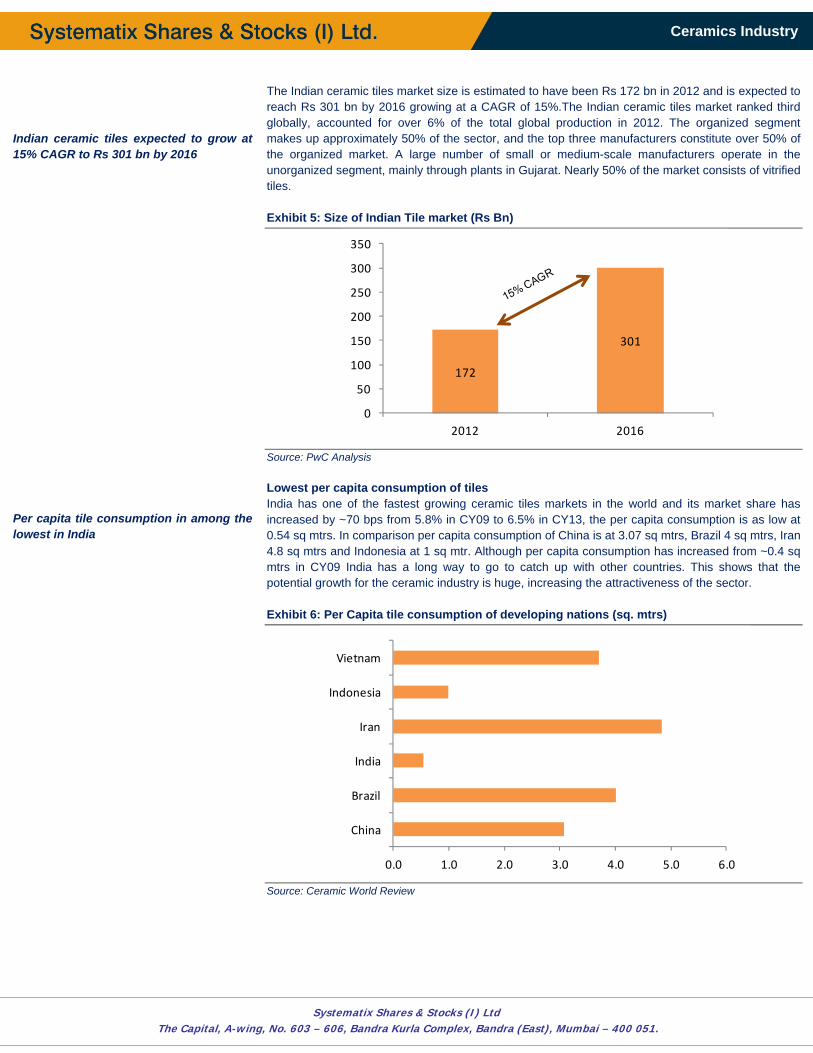
Source: PwC Analysis Lowest per capita consumption of tiles India has one of the fastest growing ceramic tiles markets in the world and its market share has increased by ~70 bps from 5.8% in CY09 to 6.5% in CY13, the per capita consumption is as low at 0.54 sq mtrs. In comparison per capita consumption of China is at 3.07 sq mtrs, Brazil 4 sq mtrs, Iran 4.8 sq mtrs and Indonesia at 1 sq mtr. Although per capita consumption has increased from ~0.4 sq mtrs in CY09 India has a long way to go to catch up with other countries. This shows that the potential growth for the ceramic industry is huge, increasing the attractiveness of the sector. Exhibit 6: Per Capita tile consumption of developing nations (sq. mtrs)
Source: Ceramic World Review
172
301
0
50
100
150
200
250
300
350
2012 2016
0.0 1.0 2.0 3.0 4.0 5.0 6.0
China
Brazil
India
Iran
Indonesia
Vietnam
4
Ceramics Industry
Systematix Shares & Stocks (I) Ltd The Capital, A-wing, No. 603 – 606, Bandra Kurla Complex, Bandra (East), Mumbai – 400 051.
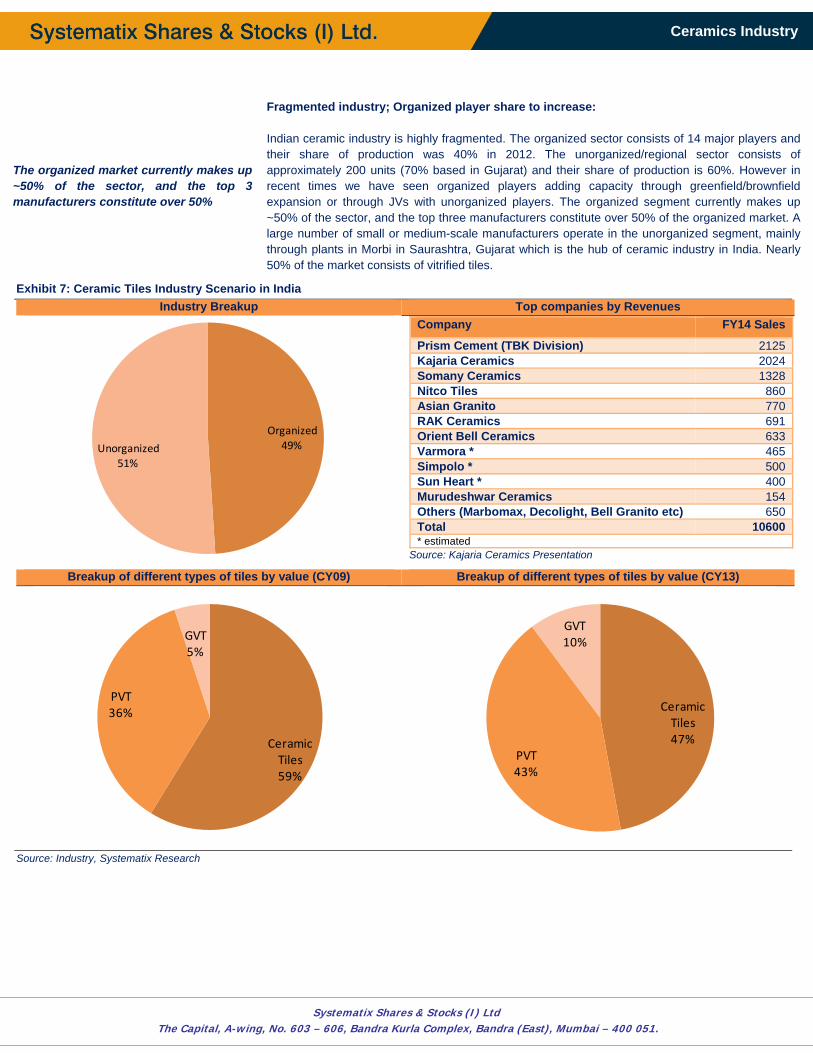
The organized market currently makes up ~50% of the sector, and the top 3 manufacturers constitute over 50%
Fragmented industry; Organized player share to increase: Indian ceramic industry is highly fragmented. The organized sector consists of 14 major players and their share of production was 40% in 2012. The unorganized/regional sector consists of approximately 200 units (70% based in Gujarat) and their share of production is 60%. However in recent times we have seen organized players adding capacity through greenfield/brownfield expansion or through JVs with unorganized players. The organized segment currently makes up ~50% of the sector, and the top three manufacturers constitute over 50% of the organized market. A large number of small or medium-scale manufacturers operate in the unorganized segment, mainly through plants in Morbi in Saurashtra, Gujarat which is the hub of ceramic industry in India. Nearly 50% of the market consists of vitrified tiles.
Exhibit 7: Ceramic Tiles Industry Scenario in India Industry Breakup Top companies by Revenues
Company FY14 Sales
Prism Cement (TBK Division) 2125Kajaria Ceramics 2024Somany Ceramics 1328Nitco Tiles 860Asian Granito 770RAK Ceramics 691Orient Bell Ceramics 633Varmora * 465Simpolo * 500Sun Heart * 400Murudeshwar Ceramics 154Others (Marbomax, Decolight, Bell Granito etc) 650Total 10600* estimated
Source: Kajaria Ceramics Presentation
Breakup of different types of tiles by value (CY09) Breakup of different types of tiles by value (CY13)
Source: Industry, Systematix Research
Organized49%Unorganized
51%
Ceramic Tiles59%
PVT36%
GVT5%
Ceramic Tiles47%
PVT43%
GVT10%
5
Ceramics Industry
Systematix Shares & Stocks (I) Ltd The Capital, A-wing, No. 603 – 606, Bandra Kurla Complex, Bandra (East), Mumbai – 400 051.
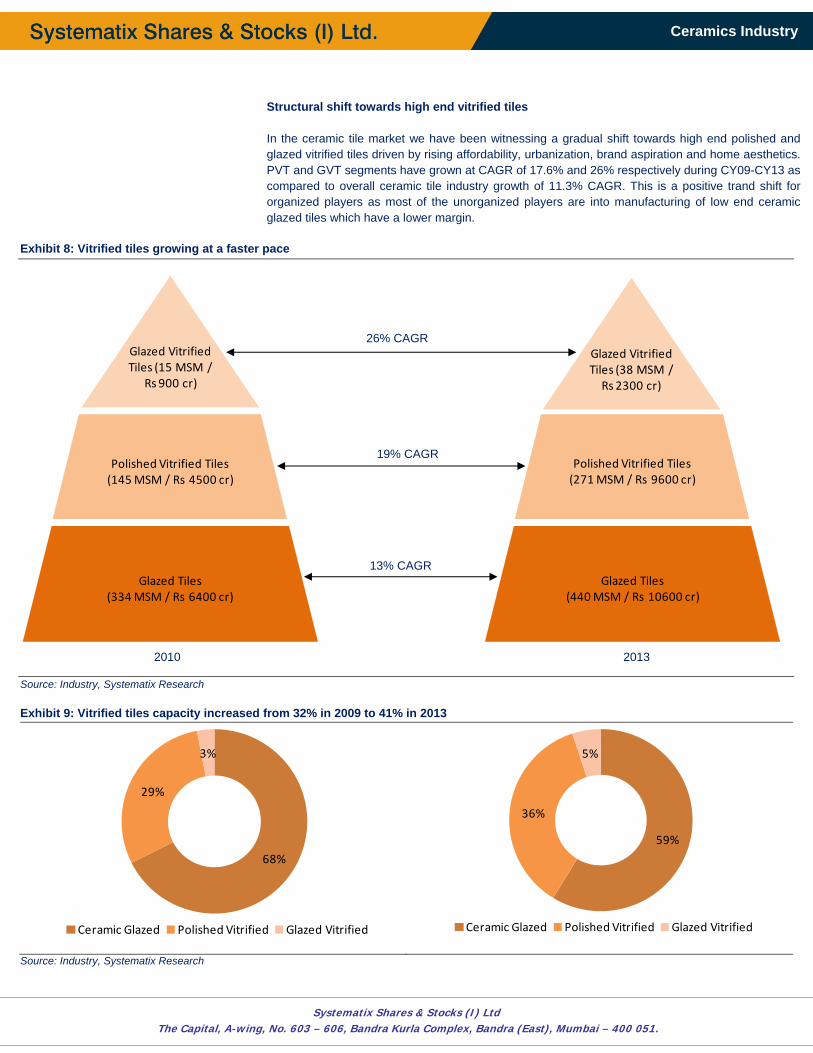
Structural shift towards high end vitrified tiles In the ceramic tile market we have been witnessing a gradual shift towards high end polished and glazed vitrified tiles driven by rising affordability, urbanization, brand aspiration and home aesthetics. PVT and GVT segments have grown at CAGR of 17.6% and 26% respectively during CY09-CY13 as compared to overall ceramic tile industry growth of 11.3% CAGR. This is a positive trand shift for organized players as most of the unorganized players are into manufacturing of low end ceramic glazed tiles which have a lower margin.
Exhibit 8: Vitrified tiles growing at a faster pace
Source: Industry, Systematix Research Exhibit 9: Vitrified tiles capacity increased from 32% in 2009 to 41% in 2013
Source: Industry, Systematix Research
Glazed Tiles(334 MSM / Rs 6400 cr)
Polished Vitrified Tiles(145 MSM / Rs 4500 cr)
Glazed Vitrified Tiles (15 MSM /
Rs 900 cr)
Glazed Tiles(440 MSM / Rs 10600 cr)
Polished Vitrified Tiles(271 MSM / Rs 9600 cr)
Glazed Vitrified Tiles (38 MSM / Rs 2300 cr)
68%
29%
3%
Ceramic Glazed Polished Vitrified Glazed Vitrified
59%
36%
5%
Ceramic Glazed Polished Vitrified Glazed Vitrified
13% CAGR
2010 2013
26% CAGR
19% CAGR
6
Ceramics Industry
Systematix Shares & Stocks (I) Ltd The Capital, A-wing, No. 603 – 606, Bandra Kurla Complex, Bandra (East), Mumbai – 400 051.
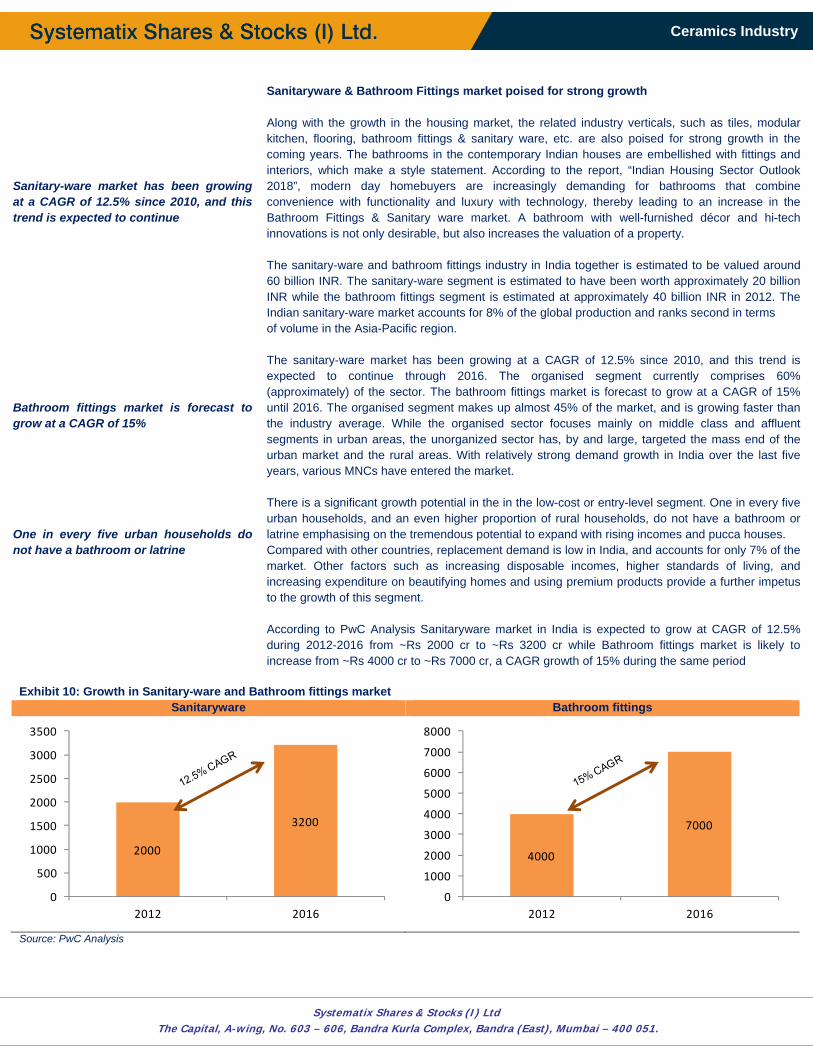
Sanitary-ware market has been growing at a CAGR of 12.5% since 2010, and this trend is expected to continue Bathroom fittings market is forecast to grow at a CAGR of 15% One in every five urban households do not have a bathroom or latrine
Sanitaryware & Bathroom Fittings market poised for strong growth Along with the growth in the housing market, the related industry verticals, such as tiles, modular kitchen, flooring, bathroom fittings & sanitary ware, etc. are also poised for strong growth in the coming years. The bathrooms in the contemporary Indian houses are embellished with fittings and interiors, which make a style statement. According to the report, “Indian Housing Sector Outlook 2018”, modern day homebuyers are increasingly demanding for bathrooms that combine convenience with functionality and luxury with technology, thereby leading to an increase in the Bathroom Fittings & Sanitary ware market. A bathroom with well-furnished décor and hi-tech innovations is not only desirable, but also increases the valuation of a property. The sanitary-ware and bathroom fittings industry in India together is estimated to be valued around 60 billion INR. The sanitary-ware segment is estimated to have been worth approximately 20 billion INR while the bathroom fittings segment is estimated at approximately 40 billion INR in 2012. The Indian sanitary-ware market accounts for 8% of the global production and ranks second in terms of volume in the Asia-Pacific region. The sanitary-ware market has been growing at a CAGR of 12.5% since 2010, and this trend is expected to continue through 2016. The organised segment currently comprises 60% (approximately) of the sector. The bathroom fittings market is forecast to grow at a CAGR of 15% until 2016. The organised segment makes up almost 45% of the market, and is growing faster than the industry average. While the organised sector focuses mainly on middle class and affluent segments in urban areas, the unorganized sector has, by and large, targeted the mass end of the urban market and the rural areas. With relatively strong demand growth in India over the last five years, various MNCs have entered the market. There is a significant growth potential in the in the low-cost or entry-level segment. One in every five urban households, and an even higher proportion of rural households, do not have a bathroom or latrine emphasising on the tremendous potential to expand with rising incomes and pucca houses. Compared with other countries, replacement demand is low in India, and accounts for only 7% of the market. Other factors such as increasing disposable incomes, higher standards of living, and increasing expenditure on beautifying homes and using premium products provide a further impetus to the growth of this segment. According to PwC Analysis Sanitaryware market in India is expected to grow at CAGR of 12.5% during 2012-2016 from ~Rs 2000 cr to ~Rs 3200 cr while Bathroom fittings market is likely to increase from ~Rs 4000 cr to ~Rs 7000 cr, a CAGR growth of 15% during the same period
Exhibit 10: Growth in Sanitary-ware and Bathroom fittings marketSanitaryware Bathroom fittings
Source: PwC Analysis
2000
3200
0
500
1000
1500
2000
2500
3000
3500
2012 2016
4000
7000
0
1000
2000
3000
4000
5000
6000
7000
8000
2012 2016
7
Ceramics Industry
Systematix Shares & Stocks (I) Ltd The Capital, A-wing, No. 603 – 606, Bandra Kurla Complex, Bandra (East), Mumbai – 400 051.
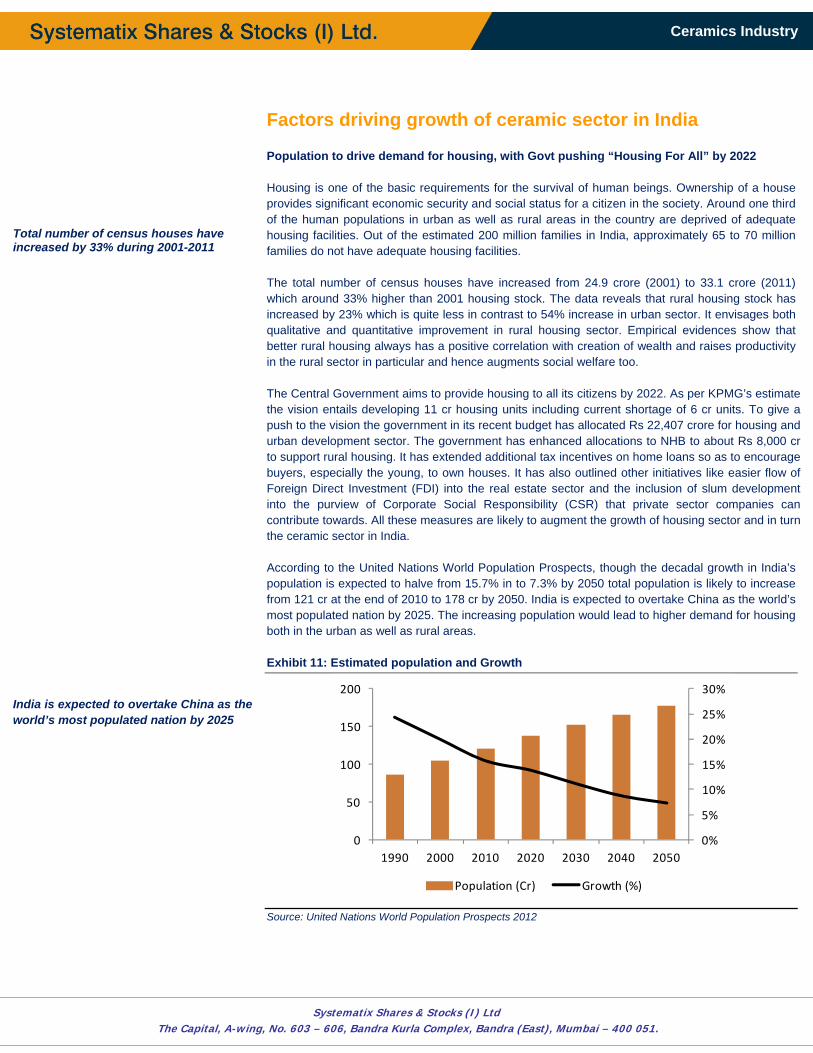
Total number of census houses have increased by 33% during 2001-2011 India is expected to overtake China as the world’s most populated nation by 2025
Factors driving growth of ceramic sector in India Population to drive demand for housing, with Govt pushing “Housing For All” by 2022 Housing is one of the basic requirements for the survival of human beings. Ownership of a house provides significant economic security and social status for a citizen in the society. Around one third of the human populations in urban as well as rural areas in the country are deprived of adequate housing facilities. Out of the estimated 200 million families in India, approximately 65 to 70 million families do not have adequate housing facilities. The total number of census houses have increased from 24.9 crore (2001) to 33.1 crore (2011) which around 33% higher than 2001 housing stock. The data reveals that rural housing stock has increased by 23% which is quite less in contrast to 54% increase in urban sector. It envisages both qualitative and quantitative improvement in rural housing sector. Empirical evidences show that better rural housing always has a positive correlation with creation of wealth and raises productivity in the rural sector in particular and hence augments social welfare too. The Central Government aims to provide housing to all its citizens by 2022. As per KPMG’s estimate the vision entails developing 11 cr housing units including current shortage of 6 cr units. To give a push to the vision the government in its recent budget has allocated Rs 22,407 crore for housing and urban development sector. The government has enhanced allocations to NHB to about Rs 8,000 cr to support rural housing. It has extended additional tax incentives on home loans so as to encourage buyers, especially the young, to own houses. It has also outlined other initiatives like easier flow of Foreign Direct Investment (FDI) into the real estate sector and the inclusion of slum development into the purview of Corporate Social Responsibility (CSR) that private sector companies can contribute towards. All these measures are likely to augment the growth of housing sector and in turn the ceramic sector in India. According to the United Nations World Population Prospects, though the decadal growth in India’s population is expected to halve from 15.7% in to 7.3% by 2050 total population is likely to increase from 121 cr at the end of 2010 to 178 cr by 2050. India is expected to overtake China as the world’s most populated nation by 2025. The increasing population would lead to higher demand for housing both in the urban as well as rural areas. Exhibit 11: Estimated population and Growth
Source: United Nations World Population Prospects 2012
0%
5%
10%
15%
20%
25%
30%
0
50
100
150
200
1990 2000 2010 2020 2030 2040 2050
Population (Cr) Growth (%)
8
Ceramics Industry
Systematix Shares & Stocks (I) Ltd The Capital, A-wing, No. 603 – 606, Bandra Kurla Complex, Bandra (East), Mumbai – 400 051.
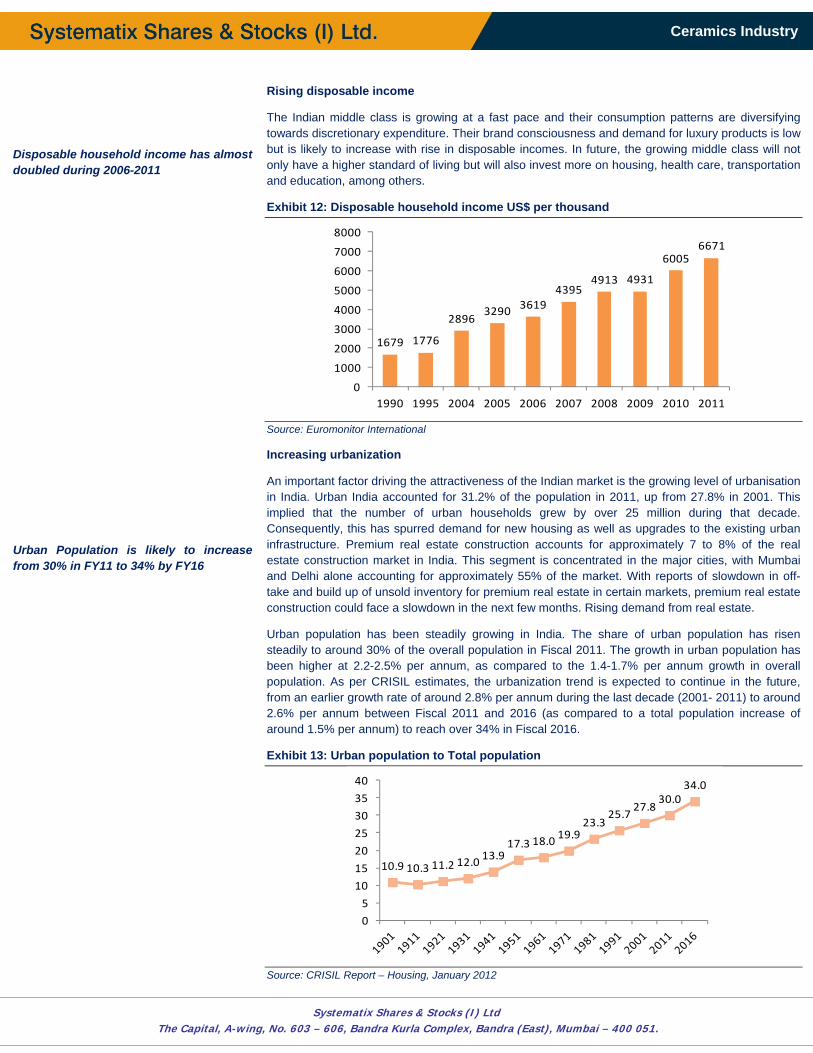
Disposable household income has almost doubled during 2006-2011 Urban Population is likely to increase from 30% in FY11 to 34% by FY16
Rising disposable income
The Indian middle class is growing at a fast pace and their consumption patterns are diversifying towards discretionary expenditure. Their brand consciousness and demand for luxury products is low but is likely to increase with rise in disposable incomes. In future, the growing middle class will not only have a higher standard of living but will also invest more on housing, health care, transportation and education, among others.
Exhibit 12: Disposable household income US$ per thousand
Source: Euromonitor International
Increasing urbanization
An important factor driving the attractiveness of the Indian market is the growing level of urbanisation in India. Urban India accounted for 31.2% of the population in 2011, up from 27.8% in 2001. This implied that the number of urban households grew by over 25 million during that decade. Consequently, this has spurred demand for new housing as well as upgrades to the existing urban infrastructure. Premium real estate construction accounts for approximately 7 to 8% of the real estate construction market in India. This segment is concentrated in the major cities, with Mumbai and Delhi alone accounting for approximately 55% of the market. With reports of slowdown in off-take and build up of unsold inventory for premium real estate in certain markets, premium real estate construction could face a slowdown in the next few months. Rising demand from real estate.
Urban population has been steadily growing in India. The share of urban population has risen steadily to around 30% of the overall population in Fiscal 2011. The growth in urban population has been higher at 2.2-2.5% per annum, as compared to the 1.4-1.7% per annum growth in overall population. As per CRISIL estimates, the urbanization trend is expected to continue in the future, from an earlier growth rate of around 2.8% per annum during the last decade (2001- 2011) to around 2.6% per annum between Fiscal 2011 and 2016 (as compared to a total population increase of around 1.5% per annum) to reach over 34% in Fiscal 2016.
Exhibit 13: Urban population to Total population
Source: CRISIL Report – Housing, January 2012
1679 1776
28963290 3619
43954913 4931
60056671
0
1000
2000
3000
4000
5000
6000
7000
8000
1990 1995 2004 2005 2006 2007 2008 2009 2010 2011
10.9 10.3 11.2 12.013.9
17.3 18.019.9
23.325.7
27.830.0
34.0
0
5
10
15
20
25
30
35
40
9
Ceramics Industry
Systematix Shares & Stocks (I) Ltd The Capital, A-wing, No. 603 – 606, Bandra Kurla Complex, Bandra (East), Mumbai – 400 051.
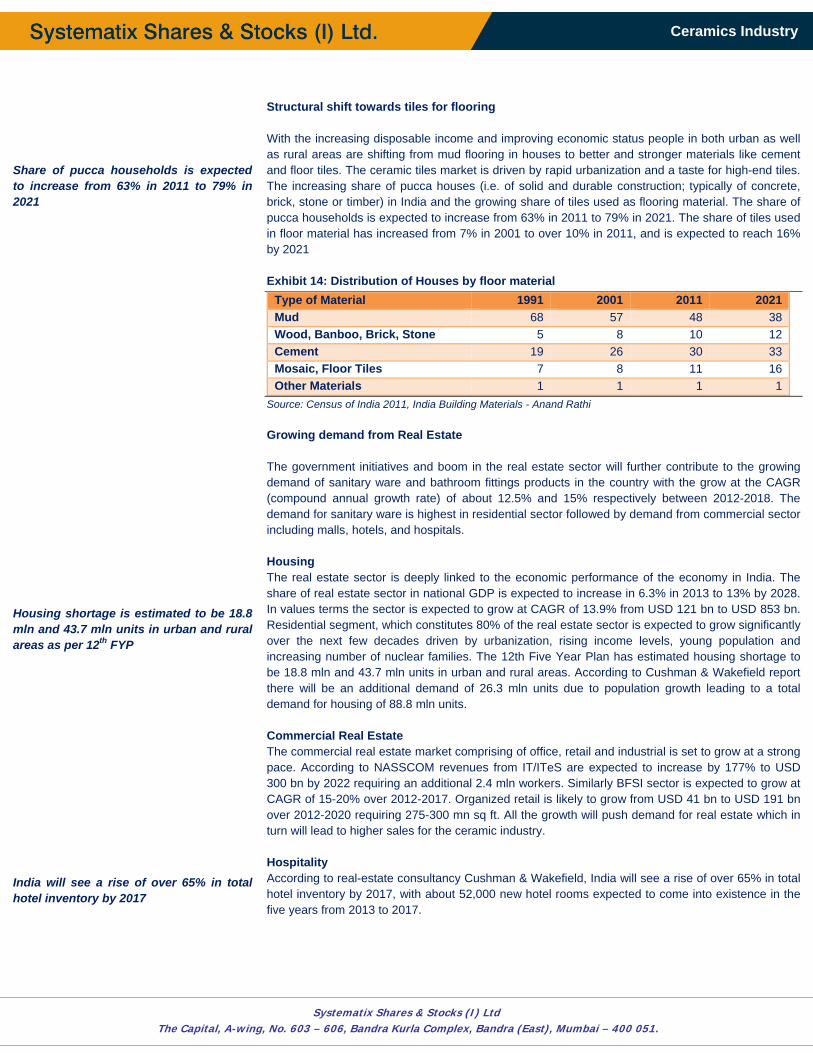
Share of pucca households is expected to increase from 63% in 2011 to 79% in 2021 Housing shortage is estimated to be 18.8 mln and 43.7 mln units in urban and rural areas as per 12th FYP India will see a rise of over 65% in total hotel inventory by 2017
Structural shift towards tiles for flooring With the increasing disposable income and improving economic status people in both urban as well as rural areas are shifting from mud flooring in houses to better and stronger materials like cement and floor tiles. The ceramic tiles market is driven by rapid urbanization and a taste for high-end tiles. The increasing share of pucca houses (i.e. of solid and durable construction; typically of concrete, brick, stone or timber) in India and the growing share of tiles used as flooring material. The share of pucca households is expected to increase from 63% in 2011 to 79% in 2021. The share of tiles used in floor material has increased from 7% in 2001 to over 10% in 2011, and is expected to reach 16% by 2021 Exhibit 14: Distribution of Houses by floor material
Type of Material 1991 2001 2011 2021Mud 68 57 48 38Wood, Banboo, Brick, Stone 5 8 10 12Cement 19 26 30 33Mosaic, Floor Tiles 7 8 11 16Other Materials 1 1 1 1
Source: Census of India 2011, India Building Materials - Anand Rathi Growing demand from Real Estate The government initiatives and boom in the real estate sector will further contribute to the growing demand of sanitary ware and bathroom fittings products in the country with the grow at the CAGR (compound annual growth rate) of about 12.5% and 15% respectively between 2012-2018. The demand for sanitary ware is highest in residential sector followed by demand from commercial sector including malls, hotels, and hospitals. Housing The real estate sector is deeply linked to the economic performance of the economy in India. The share of real estate sector in national GDP is expected to increase in 6.3% in 2013 to 13% by 2028. In values terms the sector is expected to grow at CAGR of 13.9% from USD 121 bn to USD 853 bn. Residential segment, which constitutes 80% of the real estate sector is expected to grow significantly over the next few decades driven by urbanization, rising income levels, young population and increasing number of nuclear families. The 12th Five Year Plan has estimated housing shortage to be 18.8 mln and 43.7 mln units in urban and rural areas. According to Cushman & Wakefield report there will be an additional demand of 26.3 mln units due to population growth leading to a total demand for housing of 88.8 mln units. Commercial Real Estate The commercial real estate market comprising of office, retail and industrial is set to grow at a strong pace. According to NASSCOM revenues from IT/ITeS are expected to increase by 177% to USD 300 bn by 2022 requiring an additional 2.4 mln workers. Similarly BFSI sector is expected to grow at CAGR of 15-20% over 2012-2017. Organized retail is likely to grow from USD 41 bn to USD 191 bn over 2012-2020 requiring 275-300 mn sq ft. All the growth will push demand for real estate which in turn will lead to higher sales for the ceramic industry. Hospitality According to real-estate consultancy Cushman & Wakefield, India will see a rise of over 65% in total hotel inventory by 2017, with about 52,000 new hotel rooms expected to come into existence in the five years from 2013 to 2017.
10
Ceramics Industry
Systematix Shares & Stocks (I) Ltd The Capital, A-wing, No. 603 – 606, Bandra Kurla Complex, Bandra (East), Mumbai – 400 051.
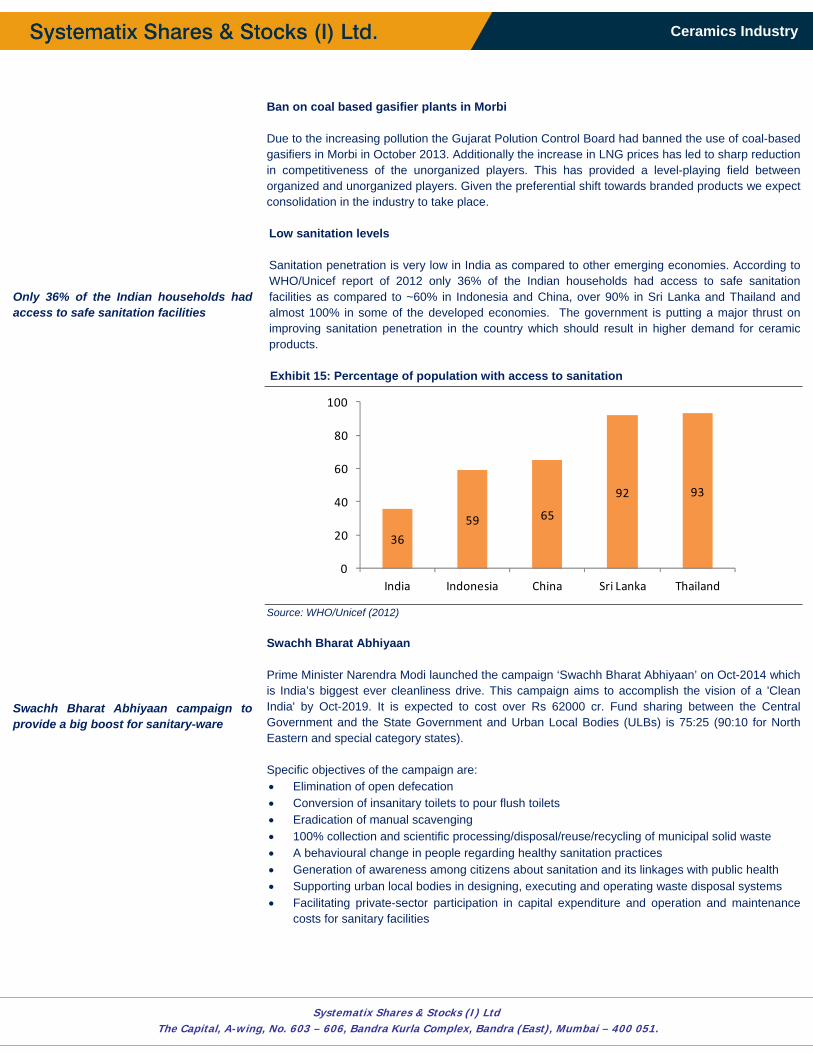
Only 36% of the Indian households had access to safe sanitation facilities Swachh Bharat Abhiyaan campaign to provide a big boost for sanitary-ware
Ban on coal based gasifier plants in Morbi Due to the increasing pollution the Gujarat Polution Control Board had banned the use of coal-based gasifiers in Morbi in October 2013. Additionally the increase in LNG prices has led to sharp reduction in competitiveness of the unorganized players. This has provided a level-playing field between organized and unorganized players. Given the preferential shift towards branded products we expect consolidation in the industry to take place. Low sanitation levels Sanitation penetration is very low in India as compared to other emerging economies. According to WHO/Unicef report of 2012 only 36% of the Indian households had access to safe sanitation facilities as compared to ~60% in Indonesia and China, over 90% in Sri Lanka and Thailand and almost 100% in some of the developed economies. The government is putting a major thrust on improving sanitation penetration in the country which should result in higher demand for ceramic products. Exhibit 15: Percentage of population with access to sanitation
Source: WHO/Unicef (2012) Swachh Bharat Abhiyaan Prime Minister Narendra Modi launched the campaign ‘Swachh Bharat Abhiyaan’ on Oct-2014 which is India’s biggest ever cleanliness drive. This campaign aims to accomplish the vision of a 'Clean India' by Oct-2019. It is expected to cost over Rs 62000 cr. Fund sharing between the Central Government and the State Government and Urban Local Bodies (ULBs) is 75:25 (90:10 for North Eastern and special category states). Specific objectives of the campaign are: • Elimination of open defecation • Conversion of insanitary toilets to pour flush toilets • Eradication of manual scavenging • 100% collection and scientific processing/disposal/reuse/recycling of municipal solid waste • A behavioural change in people regarding healthy sanitation practices • Generation of awareness among citizens about sanitation and its linkages with public health • Supporting urban local bodies in designing, executing and operating waste disposal systems • Facilitating private-sector participation in capital expenditure and operation and maintenance
costs for sanitary facilities
36
59 65
92 93
0
20
40
60
80
100
India Indonesia China Sri Lanka Thailand
11
Ceramics Industry
Systematix Shares & Stocks (I) Ltd The Capital, A-wing, No. 603 – 606, Bandra Kurla Complex, Bandra (East), Mumbai – 400 051.
Our recommendations… • Cera Sanitaryware
Cera has a strong position in the mass market segment (~60% of organized sanitaryware market) comprising of brand conscious but price sensitive customers. Net sales have grown at CAGR of ~40% over FY11-FY14 driven by capacity increases and higher utilization of faucet plant. However PAT grew by 25% CAGR during the same period on account of higher outsourcing of products. The company recently raised Rs 70 cr from PE fund. CSL is expanding its capacity through de-bottlenecking and plans to triple its faucet manufacturing in a phased manner. Strong positioning in mass market and continued focus on asset-light strategy has led to the company maintaining high RoCE in the range of 28-30%. Considering the increasing share of premium products and capacity expansion to meet the increasing demand we expect margins and returns to improve. The stock has witnessed some slowdown in sales in the month of Jan-Feb 2015 which has picked up in Mar-Apr 2015. At CMP of Rs 2135 the stock is available at PE of 23.5x of our FY17E earnings and we recommend BUY on CSL with a target of Rs 2500.
• HSIL HSIL is the largest sanitaryware player in the organized market with net sales of Rs 1828 cr in FY14. Building products and packaging products accounted for 47% each of the total sales. Over FY11-FY14 net sales of the company have grown at a CAGR of 19.4% driven by strong growth in its building products segment. Contribution of the building products segment has increased from 42% in FY12 to 47% in FY14. EBIT margins in the Building Products segment are in the range of ~20-22% as compared to ~9-10% for packaging products division. The past couple of years have witnessed a decline in PAT margins from 6.4% in FY12 to 1.8% in FY14 on account of slowdown in the packaging segment. The company recently raised Rs 250 cr through a QIP the proceedsof which Considering impressive revenue growth backed by favorable industry outlook, wide distribution network, strong brand equity and leadership position which we think will be strengthened further, we expect PAT margins and RoNW to improve to ~7% and 12% respectively by FY17. At CMP of Rs 399 the stock is available at PE of 14.2x of our FY17E earnings and we recommend BUY on HSIL with a price target of Rs 476, implying a 20% upside.
• Kajaria Ceramics Kajaria Ceramics is the largest manufacturer of ceramic/vitrified tiles in India. The company plans to augment its capacity by ~13 MSM through a mix of greenfield/brownfield expansion of owned and JV capacities which would take its capacity to 62/67 MSM by the end FY15E/16E. It is also strengthening its dealer network and increasing spend on advertising to improve its brand recall. Net sales of the company have grown at CAGR of 24.5% over FY11-FY14 driven by increase in capacities. PAT has grown by 27% during the same period on account of higher share of vitrified tiles. Given the strong growth in the ceramic industry, favorable structural shift towards vitrified tiles, better margin and return profile and increasing share of the organized players, we are bullish on the prospects of Kajaria’s business prospects. Healthy balance sheet provides a level of comfort for future growth of the company. At CMP of Rs 760 the stock is trading at PE of 19.4x of our FY17E earnings and we recommend BUY with a target of Rs 939, an upside of 23.5%.
• Somany Ceramics Somany has emerged as the third largest player in the growing tile industry largely by following asset-light strategy of forming JV with unorganized players. It is looking to add ~11 MSM in FY15 at a capex of ~Rs 60 cr. Almost 3/4th of the fresh capacity addition would be in JV. Further it is increasing its advertising spend to 2-2.5% of sales. Net sales have witnessed an increase of 21% CAGR over FY11-FY14 while PAT has gone up by 7% CAGR due to higher incidence of traded stock. Increasing level of urbanization, strengthening brand through increased advertising will give a strong push to company’s sales in Tier II and Tier III cities where the growth has been strong. We are bullish on the prospects of Somany’s business prospects. At CMP of Rs 408 the stock is trading at PE of 20.5x of our FY17E earnings and we recommend Accumulate with a target of Rs 459, an upside of 12.3%.
12
Ceramics Industry
Systematix Shares & Stocks (I) Ltd The Capital, A-wing, No. 603 – 606, Bandra Kurla Complex, Bandra (East), Mumbai – 400 051.
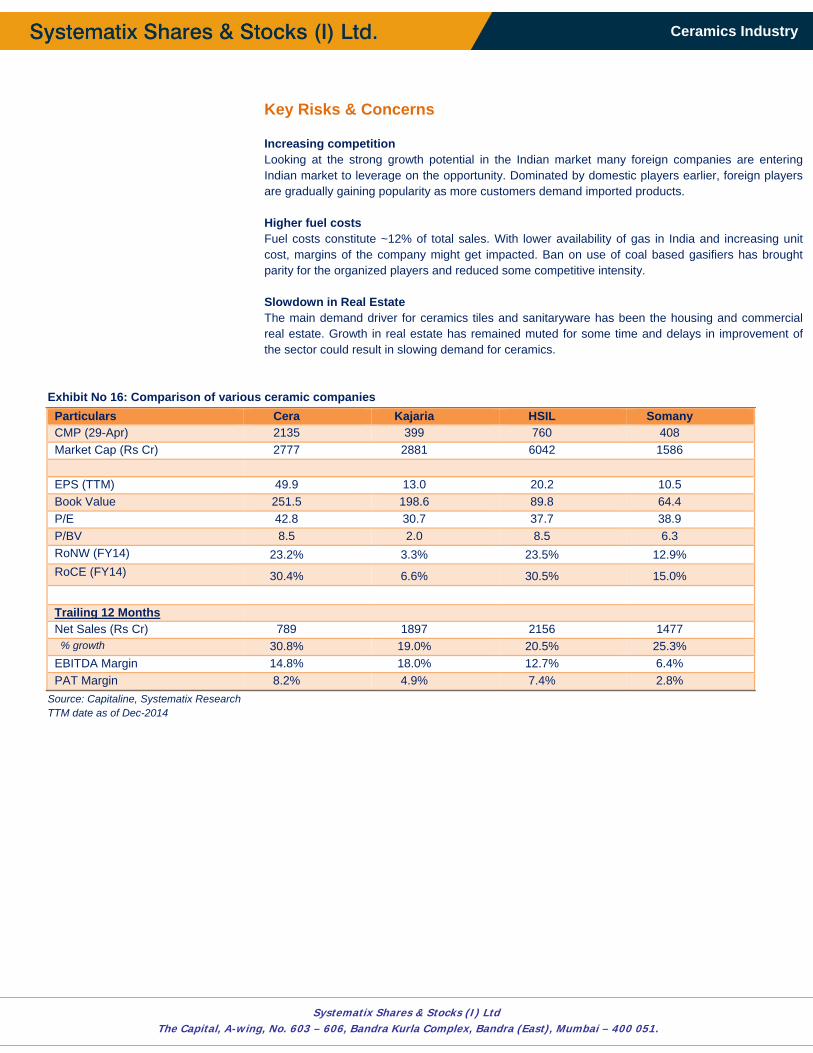
Key Risks & Concerns
Increasing competition Looking at the strong growth potential in the Indian market many foreign companies are entering Indian market to leverage on the opportunity. Dominated by domestic players earlier, foreign players are gradually gaining popularity as more customers demand imported products. Higher fuel costs Fuel costs constitute ~12% of total sales. With lower availability of gas in India and increasing unit cost, margins of the company might get impacted. Ban on use of coal based gasifiers has brought parity for the organized players and reduced some competitive intensity. Slowdown in Real Estate The main demand driver for ceramics tiles and sanitaryware has been the housing and commercial real estate. Growth in real estate has remained muted for some time and delays in improvement of the sector could result in slowing demand for ceramics.
Exhibit No 16: Comparison of various ceramic companies Particulars Cera Kajaria HSIL SomanyCMP (29-Apr) 2135 399 760 408 Market Cap (Rs Cr) 2777 2881 6042 1586 EPS (TTM) 49.9 13.0 20.2 10.5 Book Value 251.5 198.6 89.8 64.4 P/E 42.8 30.7 37.7 38.9 P/BV 8.5 2.0 8.5 6.3 RoNW (FY14) 23.2% 3.3% 23.5% 12.9% RoCE (FY14) 30.4% 6.6% 30.5% 15.0% Trailing 12 Months Net Sales (Rs Cr) 789 1897 2156 1477 % growth 30.8% 19.0% 20.5% 25.3% EBITDA Margin 14.8% 18.0% 12.7% 6.4% PAT Margin 8.2% 4.9% 7.4% 2.8%
Source: Capitaline, Systematix Research TTM date as of Dec-2014
13
Ceramics Industry
Systematix Shares & Stocks (I) Ltd The Capital, A-wing, No. 603 – 606, Bandra Kurla Complex, Bandra (East), Mumbai – 400 051.
Cera Sanitaryware STOCK IDEA Ceramics - Sanitaryware Rating: BUY
Date April 30, 2015 CMP (Rs.) 2135 Target (Rs.) 2500 Potential Upside 17%
BSE Sensex 27225 NSE Nifty 8240
Scrip Code Bloomberg CRS IN Reuters CERA.BO BSE Group B BSE Code 532443 NSE Symbol CERA
Market Data Market Cap.(Rs. Cr) 2777 Equity Sh. Cap. (Rs Cr) 6.5 52 Wk High/Low 2952/929 Avg. Quarterly Volume 19,000 Face Value (Rs.) 5
Shareholding Pattern (As on 31ST Dec 2014) FII 16.3 DII 2.1 Promoters 56.2 Public & Others 25.5 Total 100.0
Comparative Price Chart
Atul Karwa Research Analyst [email protected] Arun Gopalan VP – Research & Investments [email protected]
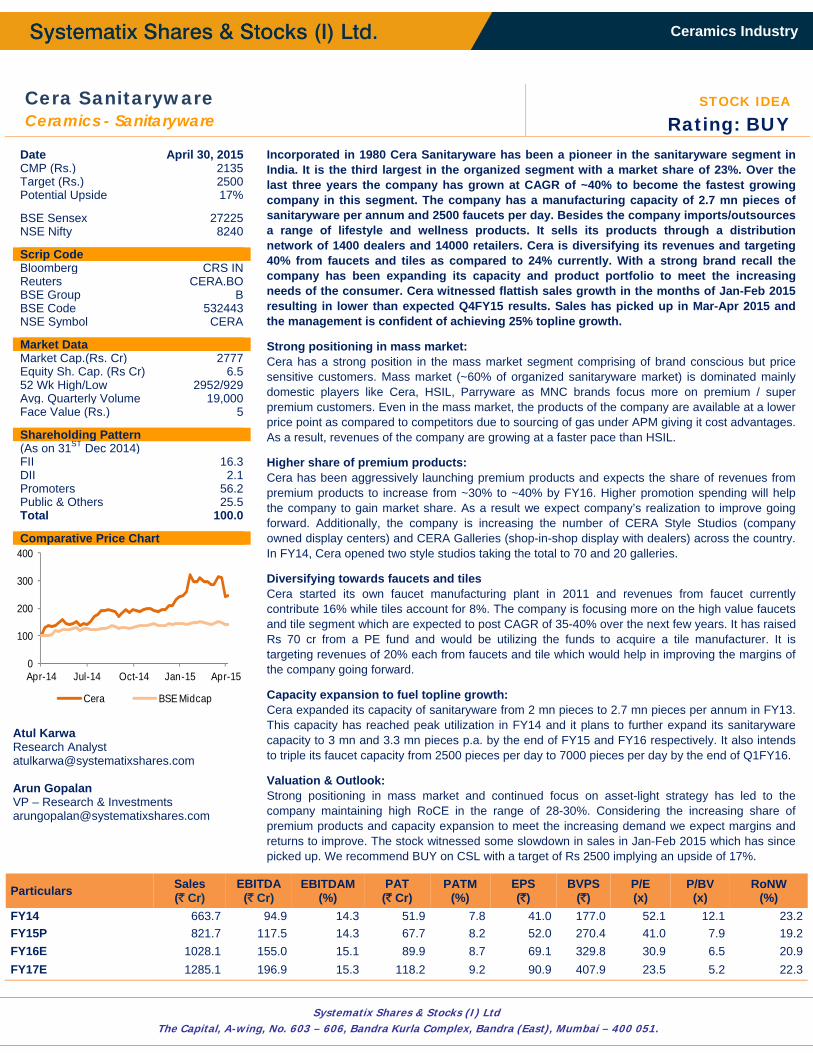
Incorporated in 1980 Cera Sanitaryware has been a pioneer in the sanitaryware segment in India. It is the third largest in the organized segment with a market share of 23%. Over the last three years the company has grown at CAGR of ~40% to become the fastest growing company in this segment. The company has a manufacturing capacity of 2.7 mn pieces of sanitaryware per annum and 2500 faucets per day. Besides the company imports/outsources a range of lifestyle and wellness products. It sells its products through a distribution network of 1400 dealers and 14000 retailers. Cera is diversifying its revenues and targeting 40% from faucets and tiles as compared to 24% currently. With a strong brand recall the company has been expanding its capacity and product portfolio to meet the increasing needs of the consumer. Cera witnessed flattish sales growth in the months of Jan-Feb 2015 resulting in lower than expected Q4FY15 results. Sales has picked up in Mar-Apr 2015 and the management is confident of achieving 25% topline growth. Strong positioning in mass market: Cera has a strong position in the mass market segment comprising of brand conscious but price sensitive customers. Mass market (~60% of organized sanitaryware market) is dominated mainly domestic players like Cera, HSIL, Parryware as MNC brands focus more on premium / super premium customers. Even in the mass market, the products of the company are available at a lower price point as compared to competitors due to sourcing of gas under APM giving it cost advantages. As a result, revenues of the company are growing at a faster pace than HSIL.
Higher share of premium products: Cera has been aggressively launching premium products and expects the share of revenues from premium products to increase from ~30% to ~40% by FY16. Higher promotion spending will help the company to gain market share. As a result we expect company’s realization to improve going forward. Additionally, the company is increasing the number of CERA Style Studios (company owned display centers) and CERA Galleries (shop-in-shop display with dealers) across the country. In FY14, Cera opened two style studios taking the total to 70 and 20 galleries. Diversifying towards faucets and tiles Cera started its own faucet manufacturing plant in 2011 and revenues from faucet currently contribute 16% while tiles account for 8%. The company is focusing more on the high value faucets and tile segment which are expected to post CAGR of 35-40% over the next few years. It has raised Rs 70 cr from a PE fund and would be utilizing the funds to acquire a tile manufacturer. It is targeting revenues of 20% each from faucets and tile which would help in improving the margins of the company going forward.
Capacity expansion to fuel topline growth: Cera expanded its capacity of sanitaryware from 2 mn pieces to 2.7 mn pieces per annum in FY13. This capacity has reached peak utilization in FY14 and it plans to further expand its sanitaryware capacity to 3 mn and 3.3 mn pieces p.a. by the end of FY15 and FY16 respectively. It also intends to triple its faucet capacity from 2500 pieces per day to 7000 pieces per day by the end of Q1FY16.
Valuation & Outlook: Strong positioning in mass market and continued focus on asset-light strategy has led to the company maintaining high RoCE in the range of 28-30%. Considering the increasing share of premium products and capacity expansion to meet the increasing demand we expect margins and returns to improve. The stock witnessed some slowdown in sales in Jan-Feb 2015 which has since picked up. We recommend BUY on CSL with a target of Rs 2500 implying an upside of 17%.
Particulars Sales (` Cr)
EBITDA (` Cr)
EBITDAM(%)
PAT (` Cr)
PATM (%)
EPS (`)
BVPS (`)
P/E (x)
P/BV (x)
RoNW (%)
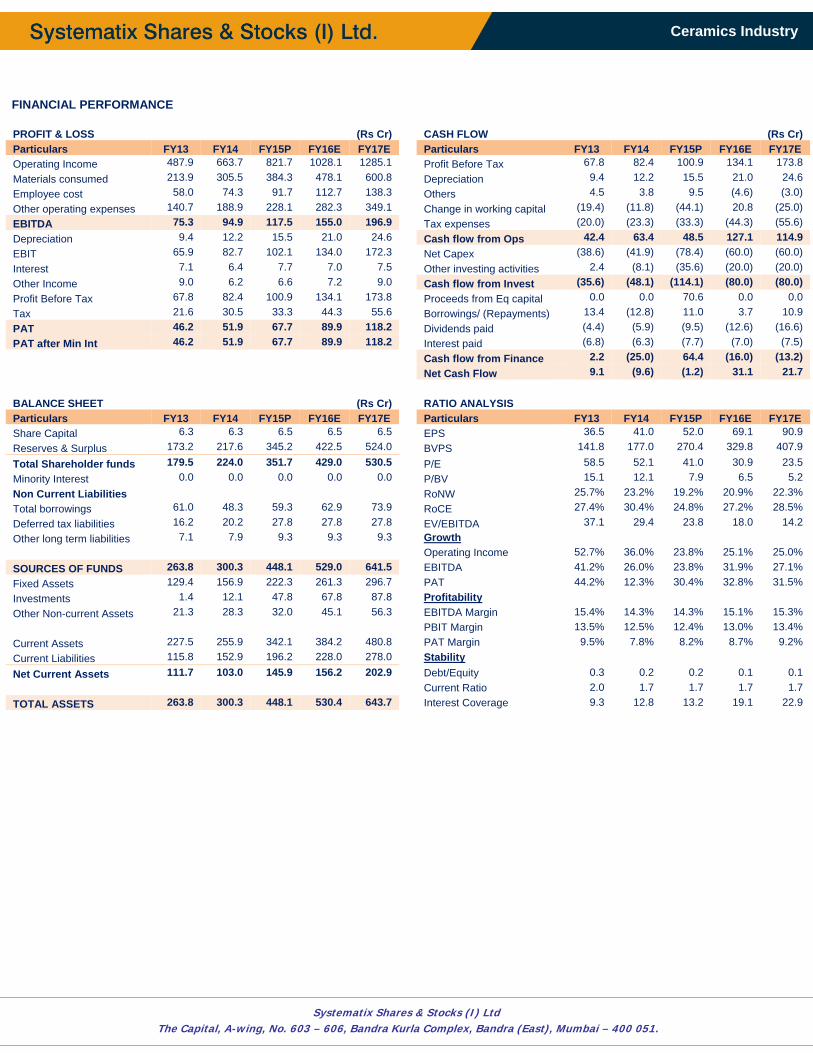
FY14 663.7 94.9 14.3 51.9 7.8 41.0 177.0 52.1 12.1 23.2FY15P 821.7 117.5 14.3 67.7 8.2 52.0 270.4 41.0 7.9 19.2FY16E 1028.1 155.0 15.1 89.9 8.7 69.1 329.8 30.9 6.5 20.9FY17E 1285.1 196.9 15.3 118.2 9.2 90.9 407.9 23.5 5.2 22.3
0
100
200
300
400
Apr-14 Jul-14 Oct-14 Jan-15 Apr-15
Cera BSE Midcap
14
Ceramics Industry
Systematix Shares & Stocks (I) Ltd The Capital, A-wing, No. 603 – 606, Bandra Kurla Complex, Bandra (East), Mumbai – 400 051.
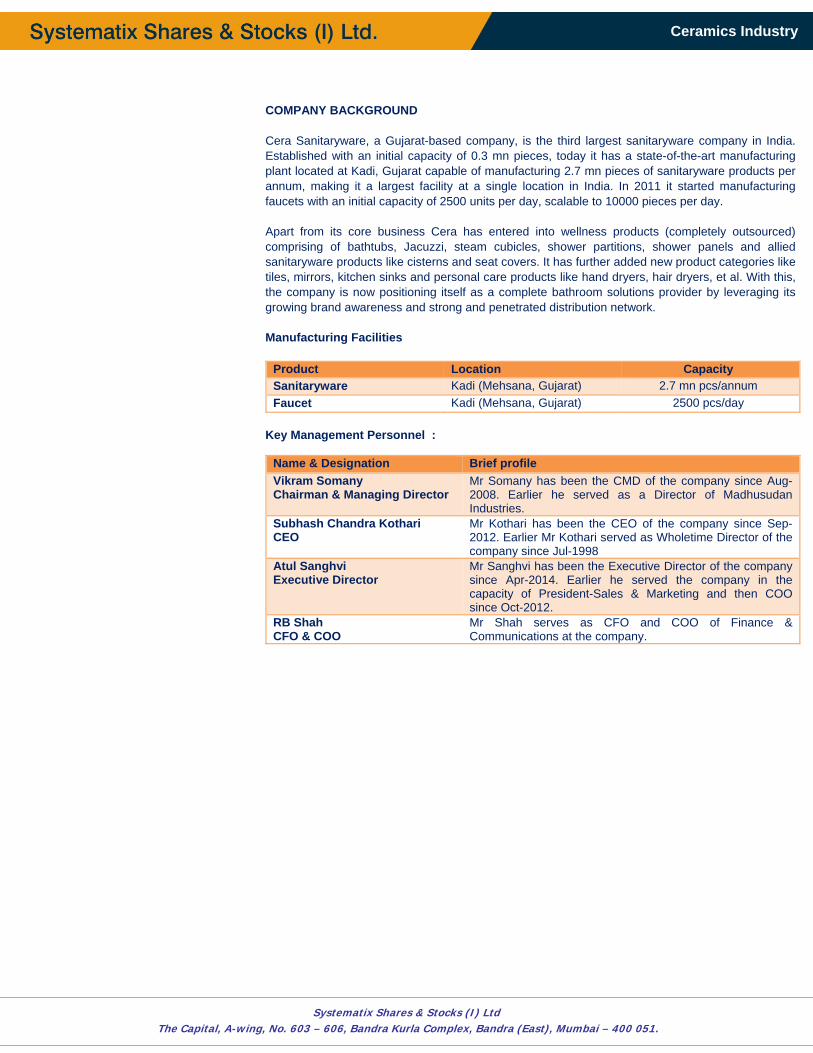
COMPANY BACKGROUND Cera Sanitaryware, a Gujarat-based company, is the third largest sanitaryware company in India. Established with an initial capacity of 0.3 mn pieces, today it has a state-of-the-art manufacturing plant located at Kadi, Gujarat capable of manufacturing 2.7 mn pieces of sanitaryware products per annum, making it a largest facility at a single location in India. In 2011 it started manufacturing faucets with an initial capacity of 2500 units per day, scalable to 10000 pieces per day. Apart from its core business Cera has entered into wellness products (completely outsourced) comprising of bathtubs, Jacuzzi, steam cubicles, shower partitions, shower panels and allied sanitaryware products like cisterns and seat covers. It has further added new product categories like tiles, mirrors, kitchen sinks and personal care products like hand dryers, hair dryers, et al. With this, the company is now positioning itself as a complete bathroom solutions provider by leveraging its growing brand awareness and strong and penetrated distribution network. Manufacturing Facilities
Product Location CapacitySanitaryware Kadi (Mehsana, Gujarat) 2.7 mn pcs/annum Faucet Kadi (Mehsana, Gujarat) 2500 pcs/day
Key Management Personnel :
Name & Designation Brief profileVikram SomanyChairman & Managing Director
Mr Somany has been the CMD of the company since Aug-2008. Earlier he served as a Director of Madhusudan Industries.
Subhash Chandra KothariCEO
Mr Kothari has been the CEO of the company since Sep-2012. Earlier Mr Kothari served as Wholetime Director of the company since Jul-1998
Atul SanghviExecutive Director
Mr Sanghvi has been the Executive Director of the company since Apr-2014. Earlier he served the company in the capacity of President-Sales & Marketing and then COO since Oct-2012.
RB Shah CFO & COO
Mr Shah serves as CFO and COO of Finance & Communications at the company.
15
Ceramics Industry
Systematix Shares & Stocks (I) Ltd The Capital, A-wing, No. 603 – 606, Bandra Kurla Complex, Bandra (East), Mumbai – 400 051.
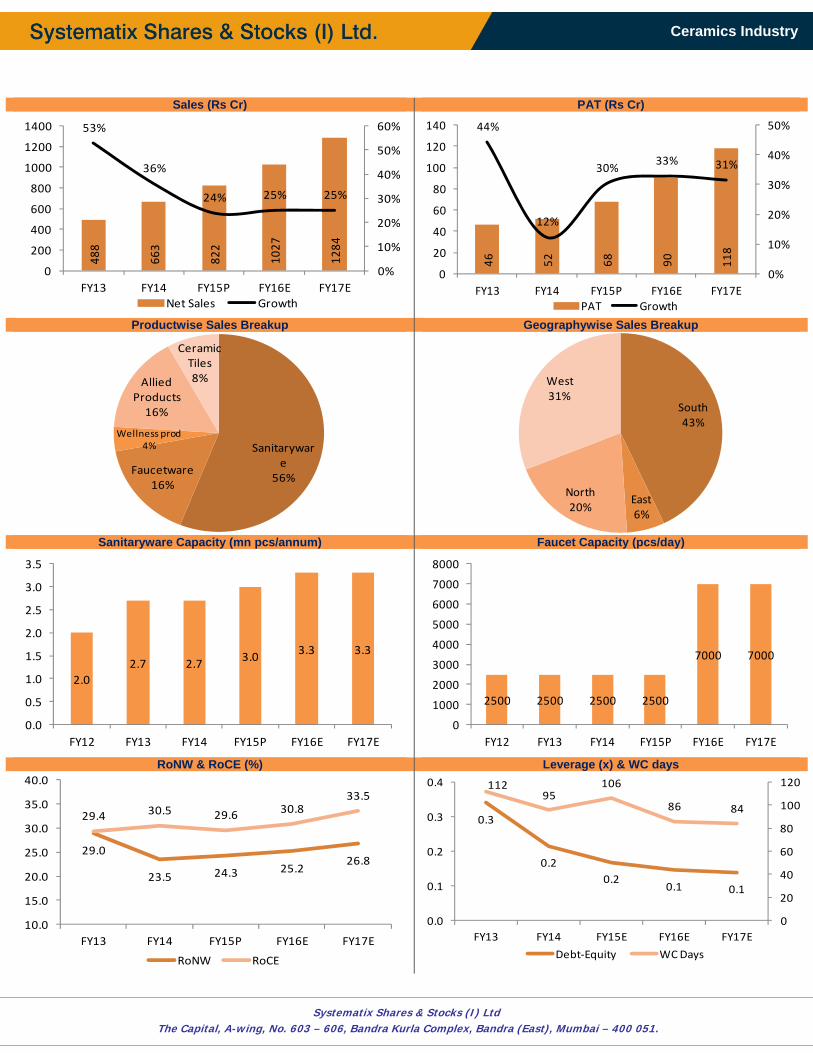
Sales (Rs Cr) PAT (Rs Cr)
Productwise Sales Breakup Geographywise Sales Breakup
Sanitaryware Capacity (mn pcs/annum) Faucet Capacity (pcs/day)
RoNW & RoCE (%) Leverage (x) & WC days
488
663
822
1027
1284
53%
36%
24% 25% 25%
0%
10%
20%
30%
40%
50%
60%
0
200
400
600
800
1000
1200
1400
FY13 FY14 FY15P FY16E FY17ENet Sales Growth
46 52 68 90 118
44%
12%
30%33% 31%
0%
10%
20%
30%
40%
50%
0
20
40
60
80
100
120
140
FY13 FY14 FY15P FY16E FY17EPAT Growth
Sanitaryware
56%Faucetware
16%
Wellness prod4%
Allied Products16%
Ceramic Tiles8%
South43%
East6%
North20%
West31%
2.02.7 2.7 3.0 3.3 3.3
0.0
0.5
1.0
1.5
2.0
2.5
3.0
3.5
FY12 FY13 FY14 FY15P FY16E FY17E
2500 2500 2500 2500
7000 7000
0
1000
2000
3000
4000
5000
6000
7000
8000
FY12 FY13 FY14 FY15P FY16E FY17E
29.0
23.5 24.3 25.226.8
29.4 30.5 29.6 30.833.5
10.0
15.0
20.0
25.0
30.0
35.0
40.0
FY13 FY14 FY15P FY16E FY17E
RoNW RoCE
0.3
0.20.2
0.1 0.1
11295
106
86 84
0
20
40
60
80
100
120
0.0
0.1
0.2
0.3
0.4
FY13 FY14 FY15E FY16E FY17E
Debt‐Equity WC Days
16
Ceramics Industry
Systematix Shares & Stocks (I) Ltd The Capital, A-wing, No. 603 – 606, Bandra Kurla Complex, Bandra (East), Mumbai – 400 051.
FINANCIAL PERFORMANCE
PROFIT & LOSS (Rs Cr) CASH FLOW (Rs Cr) Particulars FY13 FY14 FY15P FY16E FY17E Particulars FY13 FY14 FY15P FY16E FY17E Operating Income 487.9 663.7 821.7 1028.1 1285.1 Profit Before Tax 67.8 82.4 100.9 134.1 173.8 Materials consumed 213.9 305.5 384.3 478.1 600.8 Depreciation 9.4 12.2 15.5 21.0 24.6 Employee cost 58.0 74.3 91.7 112.7 138.3 Others 4.5 3.8 9.5 (4.6) (3.0) Other operating expenses 140.7 188.9 228.1 282.3 349.1 Change in working capital (19.4) (11.8) (44.1) 20.8 (25.0) EBITDA 75.3 94.9 117.5 155.0 196.9 Tax expenses (20.0) (23.3) (33.3) (44.3) (55.6) Depreciation 9.4 12.2 15.5 21.0 24.6 Cash flow from Ops 42.4 63.4 48.5 127.1 114.9 EBIT 65.9 82.7 102.1 134.0 172.3 Net Capex (38.6) (41.9) (78.4) (60.0) (60.0) Interest 7.1 6.4 7.7 7.0 7.5 Other investing activities 2.4 (8.1) (35.6) (20.0) (20.0) Other Income 9.0 6.2 6.6 7.2 9.0 Cash flow from Invest (35.6) (48.1) (114.1) (80.0) (80.0) Profit Before Tax 67.8 82.4 100.9 134.1 173.8 Proceeds from Eq capital 0.0 0.0 70.6 0.0 0.0 Tax 21.6 30.5 33.3 44.3 55.6 Borrowings/ (Repayments) 13.4 (12.8) 11.0 3.7 10.9 PAT 46.2 51.9 67.7 89.9 118.2 Dividends paid (4.4) (5.9) (9.5) (12.6) (16.6) PAT after Min Int 46.2 51.9 67.7 89.9 118.2 Interest paid (6.8) (6.3) (7.7) (7.0) (7.5) Cash flow from Finance 2.2 (25.0) 64.4 (16.0) (13.2) Net Cash Flow 9.1 (9.6) (1.2) 31.1 21.7 BALANCE SHEET (Rs Cr) RATIO ANALYSIS Particulars FY13 FY14 FY15P FY16E FY17E Particulars FY13 FY14 FY15P FY16E FY17E Share Capital 6.3 6.3 6.5 6.5 6.5 EPS 36.5 41.0 52.0 69.1 90.9 Reserves & Surplus 173.2 217.6 345.2 422.5 524.0 BVPS 141.8 177.0 270.4 329.8 407.9 Total Shareholder funds 179.5 224.0 351.7 429.0 530.5 P/E 58.5 52.1 41.0 30.9 23.5 Minority Interest 0.0 0.0 0.0 0.0 0.0 P/BV 15.1 12.1 7.9 6.5 5.2 Non Current Liabilities RoNW 25.7% 23.2% 19.2% 20.9% 22.3% Total borrowings 61.0 48.3 59.3 62.9 73.9 RoCE 27.4% 30.4% 24.8% 27.2% 28.5% Deferred tax liabilities 16.2 20.2 27.8 27.8 27.8 EV/EBITDA 37.1 29.4 23.8 18.0 14.2 Other long term liabilities 7.1 7.9 9.3 9.3 9.3 Growth Operating Income 52.7% 36.0% 23.8% 25.1% 25.0% SOURCES OF FUNDS 263.8 300.3 448.1 529.0 641.5 EBITDA 41.2% 26.0% 23.8% 31.9% 27.1% Fixed Assets 129.4 156.9 222.3 261.3 296.7 PAT 44.2% 12.3% 30.4% 32.8% 31.5% Investments 1.4 12.1 47.8 67.8 87.8 Profitability Other Non-current Assets 21.3 28.3 32.0 45.1 56.3 EBITDA Margin 15.4% 14.3% 14.3% 15.1% 15.3% PBIT Margin 13.5% 12.5% 12.4% 13.0% 13.4% Current Assets 227.5 255.9 342.1 384.2 480.8 PAT Margin 9.5% 7.8% 8.2% 8.7% 9.2% Current Liabilities 115.8 152.9 196.2 228.0 278.0 Stability Net Current Assets 111.7 103.0 145.9 156.2 202.9 Debt/Equity 0.3 0.2 0.2 0.1 0.1 Current Ratio 2.0 1.7 1.7 1.7 1.7 TOTAL ASSETS 263.8 300.3 448.1 530.4 643.7 Interest Coverage 9.3 12.8 13.2 19.1 22.9
17
Ceramics Industry
Systematix Shares & Stocks (I) Ltd The Capital, A-wing, No. 603 – 606, Bandra Kurla Complex, Bandra (East), Mumbai – 400 051.
HSIL Ltd STOCK IDEA Ceramics - Sanitaryware Rating: BUY
Date April 30, 2015 CMP (Rs.) 399 Target (Rs.) 476 Potential Upside 20%
BSE Sensex 27225 NSE Nifty 8240
Scrip Code Bloomberg HSI IN Reuters HSNT.BO BSE Group B BSE Code 500187 NSE Symbol HSIL
Market Data Market Cap.(Rs. Cr) 2881 Equity Sh. Cap. (Rs Cr) 14.5 52 Wk High/Low 477/145.0 Avg. Quarterly Volume 140,000 Face Value (Rs.) 2
Shareholding Pattern (As on 31st Dec 2014) FII 10.7 DII 20.5 Promoters 51.6 Public & Others 17.2 Total 100.0
Comparative Price Chart
Atul Karwa Research Analyst [email protected] Arun Gopalan VP – Research & Investments [email protected]
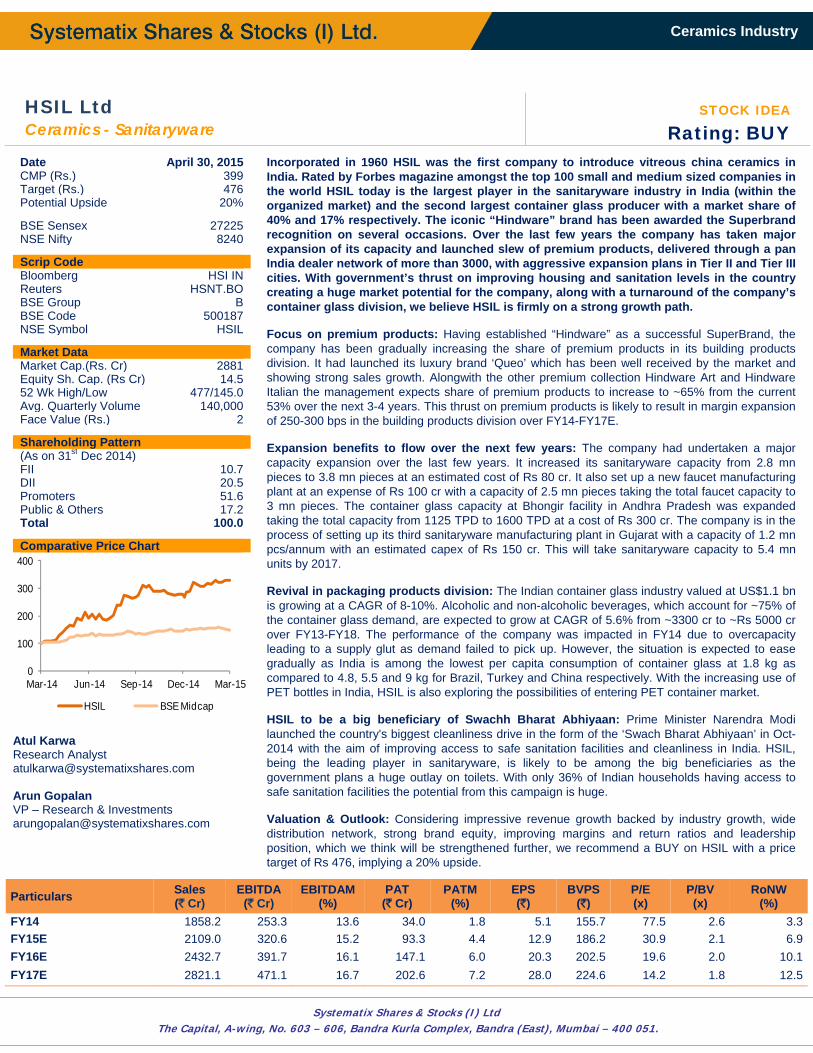
Incorporated in 1960 HSIL was the first company to introduce vitreous china ceramics in India. Rated by Forbes magazine amongst the top 100 small and medium sized companies in the world HSIL today is the largest player in the sanitaryware industry in India (within the organized market) and the second largest container glass producer with a market share of 40% and 17% respectively. The iconic “Hindware” brand has been awarded the Superbrand recognition on several occasions. Over the last few years the company has taken major expansion of its capacity and launched slew of premium products, delivered through a pan India dealer network of more than 3000, with aggressive expansion plans in Tier II and Tier III cities. With government’s thrust on improving housing and sanitation levels in the country creating a huge market potential for the company, along with a turnaround of the company’s container glass division, we believe HSIL is firmly on a strong growth path. Focus on premium products: Having established “Hindware” as a successful SuperBrand, the company has been gradually increasing the share of premium products in its building products division. It had launched its luxury brand ‘Queo’ which has been well received by the market and showing strong sales growth. Alongwith the other premium collection Hindware Art and Hindware Italian the management expects share of premium products to increase to ~65% from the current 53% over the next 3-4 years. This thrust on premium products is likely to result in margin expansion of 250-300 bps in the building products division over FY14-FY17E. Expansion benefits to flow over the next few years: The company had undertaken a major capacity expansion over the last few years. It increased its sanitaryware capacity from 2.8 mn pieces to 3.8 mn pieces at an estimated cost of Rs 80 cr. It also set up a new faucet manufacturing plant at an expense of Rs 100 cr with a capacity of 2.5 mn pieces taking the total faucet capacity to 3 mn pieces. The container glass capacity at Bhongir facility in Andhra Pradesh was expanded taking the total capacity from 1125 TPD to 1600 TPD at a cost of Rs 300 cr. The company is in the process of setting up its third sanitaryware manufacturing plant in Gujarat with a capacity of 1.2 mn pcs/annum with an estimated capex of Rs 150 cr. This will take sanitaryware capacity to 5.4 mn units by 2017. Revival in packaging products division: The Indian container glass industry valued at US$1.1 bn is growing at a CAGR of 8-10%. Alcoholic and non-alcoholic beverages, which account for ~75% of the container glass demand, are expected to grow at CAGR of 5.6% from ~3300 cr to ~Rs 5000 cr over FY13-FY18. The performance of the company was impacted in FY14 due to overcapacity leading to a supply glut as demand failed to pick up. However, the situation is expected to ease gradually as India is among the lowest per capita consumption of container glass at 1.8 kg as compared to 4.8, 5.5 and 9 kg for Brazil, Turkey and China respectively. With the increasing use of PET bottles in India, HSIL is also exploring the possibilities of entering PET container market. HSIL to be a big beneficiary of Swachh Bharat Abhiyaan: Prime Minister Narendra Modi launched the country's biggest cleanliness drive in the form of the ‘Swach Bharat Abhiyaan’ in Oct-2014 with the aim of improving access to safe sanitation facilities and cleanliness in India. HSIL, being the leading player in sanitaryware, is likely to be among the big beneficiaries as the government plans a huge outlay on toilets. With only 36% of Indian households having access to safe sanitation facilities the potential from this campaign is huge. Valuation & Outlook: Considering impressive revenue growth backed by industry growth, wide distribution network, strong brand equity, improving margins and return ratios and leadership position, which we think will be strengthened further, we recommend a BUY on HSIL with a price target of Rs 476, implying a 20% upside.
Particulars Sales (` Cr)
EBITDA (` Cr)
EBITDAM(%)
PAT (` Cr)
PATM (%)
EPS (`)
BVPS (`)
P/E (x)
P/BV (x)
RoNW (%)
FY14 1858.2 253.3 13.6 34.0 1.8 5.1 155.7 77.5 2.6 3.3FY15E 2109.0 320.6 15.2 93.3 4.4 12.9 186.2 30.9 2.1 6.9FY16E 2432.7 391.7 16.1 147.1 6.0 20.3 202.5 19.6 2.0 10.1FY17E 2821.1 471.1 16.7 202.6 7.2 28.0 224.6 14.2 1.8 12.5
0
100
200
300
400
Mar-14 Jun-14 Sep-14 Dec-14 Mar-15
HSIL BSE Midcap
18
Ceramics Industry
Systematix Shares & Stocks (I) Ltd The Capital, A-wing, No. 603 – 606, Bandra Kurla Complex, Bandra (East), Mumbai – 400 051.
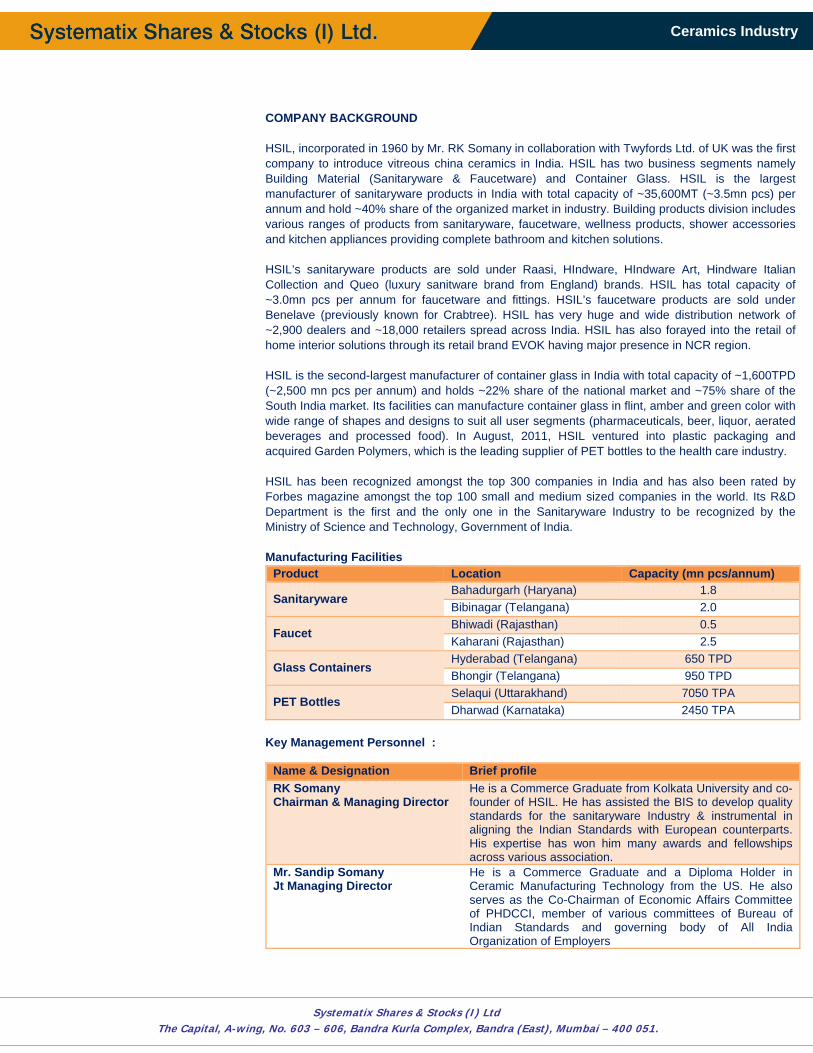
COMPANY BACKGROUND HSIL, incorporated in 1960 by Mr. RK Somany in collaboration with Twyfords Ltd. of UK was the first company to introduce vitreous china ceramics in India. HSIL has two business segments namely Building Material (Sanitaryware & Faucetware) and Container Glass. HSIL is the largest manufacturer of sanitaryware products in India with total capacity of ~35,600MT (~3.5mn pcs) per annum and hold ~40% share of the organized market in industry. Building products division includes various ranges of products from sanitaryware, faucetware, wellness products, shower accessories and kitchen appliances providing complete bathroom and kitchen solutions. HSIL’s sanitaryware products are sold under Raasi, HIndware, HIndware Art, Hindware Italian Collection and Queo (luxury sanitware brand from England) brands. HSIL has total capacity of ~3.0mn pcs per annum for faucetware and fittings. HSIL’s faucetware products are sold under Benelave (previously known for Crabtree). HSIL has very huge and wide distribution network of ~2,900 dealers and ~18,000 retailers spread across India. HSIL has also forayed into the retail of home interior solutions through its retail brand EVOK having major presence in NCR region. HSIL is the second-largest manufacturer of container glass in India with total capacity of ~1,600TPD (~2,500 mn pcs per annum) and holds ~22% share of the national market and ~75% share of the South India market. Its facilities can manufacture container glass in flint, amber and green color with wide range of shapes and designs to suit all user segments (pharmaceuticals, beer, liquor, aerated beverages and processed food). In August, 2011, HSIL ventured into plastic packaging and acquired Garden Polymers, which is the leading supplier of PET bottles to the health care industry. HSIL has been recognized amongst the top 300 companies in India and has also been rated by Forbes magazine amongst the top 100 small and medium sized companies in the world. Its R&D Department is the first and the only one in the Sanitaryware Industry to be recognized by the Ministry of Science and Technology, Government of India. Manufacturing Facilities
Product Location Capacity (mn pcs/annum)
Sanitaryware Bahadurgarh (Haryana) 1.8 Bibinagar (Telangana) 2.0
Faucet Bhiwadi (Rajasthan) 0.5 Kaharani (Rajasthan) 2.5
Glass Containers Hyderabad (Telangana) 650 TPD Bhongir (Telangana) 950 TPD
PET Bottles Selaqui (Uttarakhand) 7050 TPA Dharwad (Karnataka) 2450 TPA
Key Management Personnel :
Name & Designation Brief profileRK SomanyChairman & Managing Director
He is a Commerce Graduate from Kolkata University and co-founder of HSIL. He has assisted the BIS to develop quality standards for the sanitaryware Industry & instrumental in aligning the Indian Standards with European counterparts. His expertise has won him many awards and fellowships across various association.
Mr. Sandip SomanyJt Managing Director
He is a Commerce Graduate and a Diploma Holder in Ceramic Manufacturing Technology from the US. He also serves as the Co-Chairman of Economic Affairs Committee of PHDCCI, member of various committees of Bureau of Indian Standards and governing body of All India Organization of Employers
19
Ceramics Industry
Systematix Shares & Stocks (I) Ltd The Capital, A-wing, No. 603 – 606, Bandra Kurla Complex, Bandra (East), Mumbai – 400 051.
Sales (Rs Cr) PAT (Rs Cr)
Segmentwise Sales Breakup Geographywise Sales Breakup
Building Products capacity Packaging Products capacity
RoNW & RoCE (%) Leverage (x) & WC days
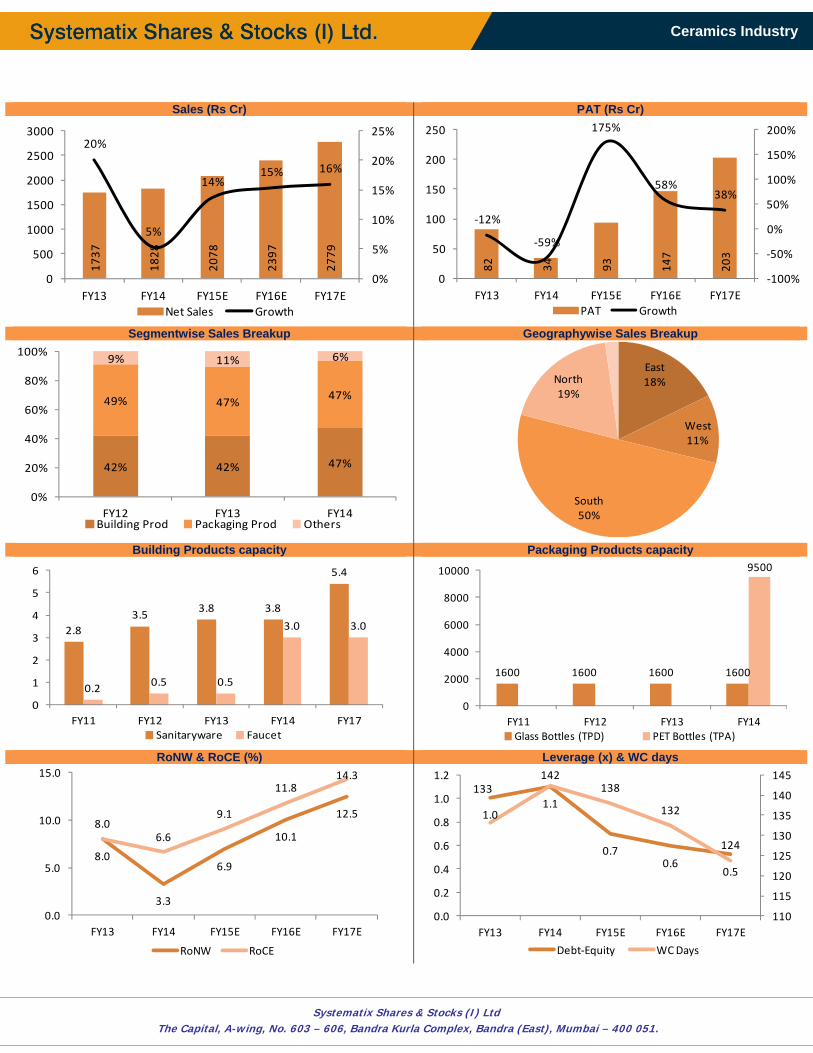
1737
1828
2078
2397
2779
20%
5%
14%15% 16%
0%
5%
10%
15%
20%
25%
0
500
1000
1500
2000
2500
3000
FY13 FY14 FY15E FY16E FY17ENet Sales Growth
82 34 93 147
203
‐12%
‐59%
175%
58%38%
‐100%
‐50%
0%
50%
100%
150%
200%
0
50
100
150
200
250
FY13 FY14 FY15E FY16E FY17EPAT Growth
42% 42% 47%
49% 47%47%
9% 11% 6%
0%
20%
40%
60%
80%
100%
FY12 FY13 FY14Building Prod Packaging Prod Others
East18%
West11%
South50%
North19%
2.83.5
3.8 3.8
5.4
0.2 0.5 0.5
3.0 3.0
0
1
2
3
4
5
6
FY11 FY12 FY13 FY14 FY17Sanitaryware Faucet
1600 1600 1600 1600
9500
0
2000
4000
6000
8000
10000
FY11 FY12 FY13 FY14Glass Bottles (TPD) PET Bottles (TPA)
8.0
3.3
6.9
10.1
12.58.0
6.6
9.1
11.814.3
0.0
5.0
10.0
15.0
FY13 FY14 FY15E FY16E FY17E
RoNW RoCE
1.01.1
0.70.6
0.5
133142
138
132
124
110
115
120
125
130
135
140
145
0.0
0.2
0.4
0.6
0.8
1.0
1.2
FY13 FY14 FY15E FY16E FY17E
Debt‐Equity WC Days

20
Ceramics Industry
Systematix Shares & Stocks (I) Ltd The Capital, A-wing, No. 603 – 606, Bandra Kurla Complex, Bandra (East), Mumbai – 400 051.
FINANCIAL PERFORMANCE
PROFIT & LOSS (Rs Cr) CASH FLOW (Rs Cr) Particulars FY13 FY14 FY15E FY16E FY17E Particulars FY13 FY14 FY15E FY16E FY17E Operating Income 1761.3 1858.2 2109.0 2432.7 2821.1 Profit Before Tax 123.6 75.2 139.3 219.6 302.4 Materials consumed 542.8 647.5 706.5 802.8 916.9 Depreciation 93.2 110.1 112.9 115.8 118.5 Employee cost 182.2 188.4 217.2 245.7 282.1 Others 90.2 70.0 72.7 61.2 55.8 Other operating expenses 777.6 768.9 864.7 992.6 1151.0 Change in working capital (234.8) (51.7) (48.8) (51.5) (34.2) EBITDA 258.7 253.3 320.6 391.7 471.1 Tax expenses (41.5) (41.2) (46.0) (72.5) (99.8) Depreciation 93.2 110.1 112.9 115.8 118.5 Cash flow from Ops 30.6 162.4 230.0 272.6 342.8 EBIT 165.5 143.2 207.7 275.9 352.6 Net Capex (117.4) (190.6) (100.0) (100.0) (100.0) Interest 69.4 71.8 72.7 61.2 55.8 Other investing activities 42.0 2.0 0.0 0.0 0.0 Other Income 3.8 3.8 4.2 4.9 5.6 Cash flow from Invest (75.5) (188.6) (100.0) (100.0) (100.0) Profit Before Tax 123.6 75.2 139.3 219.6 302.4 Proceeds from Eq capital 0.0 0.0 250.0 0.0 0.0 Tax 41.5 41.2 46.0 72.5 99.8 Borrowings/ (Repayments) 141.0 99.7 (190.0) (73.2) (21.1) PAT 82.0 34.0 93.3 147.1 202.6 Dividends paid (22.9) (23.1) (25.4) (29.6) (42.3) PAT after Min Int 82.0 34.0 93.3 147.1 202.6 Interest paid (67.3) (72.1) (72.7) (61.2) (55.8) Cash flow from Finance 50.8 4.5 (38.0) (164.0) (119.3) Net Cash Flow 6.0 (21.7) 92.0 8.6 123.5 BALANCE SHEET (Rs Cr) RATIO ANALYSIS Particulars FY13 FY14 FY15E FY16E FY17E Particulars FY13 FY14 FY15E FY16E FY17E Share Capital 13.2 13.2 14.5 14.5 14.5 EPS 12.4 5.1 12.9 20.3 28.0 Reserves & Surplus 1013.1 1015.1 1331.8 1449.3 1609.6 BVPS 155.4 155.7 186.2 202.5 224.6 Total Shareholder funds 1026.3 1028.3 1346.2 1463.7 1624.0 P/E 32.1 77.5 30.9 19.6 14.2 Minority Interest 0.0 0.0 0.0 0.0 0.0 P/BV 2.6 2.6 2.1 2.0 1.8 Non Current Liabilities RoNW 8.0% 3.3% 6.9% 10.1% 12.5% Total borrowings 1034.1 1133.0 943.0 869.8 848.6 RoCE 8.0% 6.6% 9.1% 11.8% 14.3% Deferred tax liabilities 114.1 115.4 115.4 115.4 115.4 EV/EBITDA 15.3 15.6 12.3 10.1 8.4 Other long term liabilities 14.1 15.4 15.4 15.4 15.4 Growth Operating Income 20.4% 5.5% 13.5% 15.3% 16.0% SOURCES OF FUNDS 2188.6 2292.1 2420.1 2464.4 2603.5 EBITDA 3.6% -2.1% 26.6% 22.2% 20.3% Fixed Assets 1566.8 1638.8 1626.0 1610.2 1591.7 PAT -12.3% -58.6% 174.6% 57.7% 37.7% Investments 10.8 10.9 10.9 10.9 10.9 Profitability Other Non-current Assets 55.2 56.7 56.7 56.7 56.7 EBITDA Margin 14.7% 13.6% 15.2% 16.1% 16.7% PBIT Margin 9.4% 7.7% 9.8% 11.3% 12.5% Current Assets 937.1 967.8 1165.7 1299.9 1547.2 PAT Margin 4.7% 1.8% 4.4% 6.0% 7.2% Current Liabilities 381.4 382.0 439.1 513.2 602.9 Stability Net Current Assets 555.7 585.7 726.6 786.6 944.3 Debt/Equity 1.0 1.1 0.7 0.6 0.5 Current Ratio 2.5 2.5 2.7 2.5 2.6 TOTAL ASSETS 2188.6 2292.1 2420.1 2464.4 2603.5 Interest Coverage 2.4 2.0 2.9 4.5 6.3
21
Ceramics Industry
Systematix Shares & Stocks (I) Ltd The Capital, A-wing, No. 603 – 606, Bandra Kurla Complex, Bandra (East), Mumbai – 400 051.
Kajaria Ceramics STOCK IDEA Ceramics - Tiles Rating: BUY
Date April 30, 2015 CMP (Rs.) 760 Target (Rs.) 939 Potential Upside 23%
BSE Sensex 27225 NSE Nifty 8240
Scrip Code Bloomberg KJC IN Reuters KAJR.BO BSE Group A BSE Code 500233 NSE Symbol KAJARIACER
Market Data Market Cap.(Rs. Cr) 6042 Equity Sh. Cap. (Rs Cr) 15.9 52 Wk High/Low 840/440 Avg. Quarterly Volume 183000 Face Value (Rs.) 2
Shareholding Pattern (As on 31st Dec 2014) FII 23.4 DII 4.2 Promoters 49.5 Public & Others 22.9 Total 100.0
Comparative Price Chart
Atul Karwa Research Analyst [email protected] Arun Gopalan VP – Research & Investments [email protected]
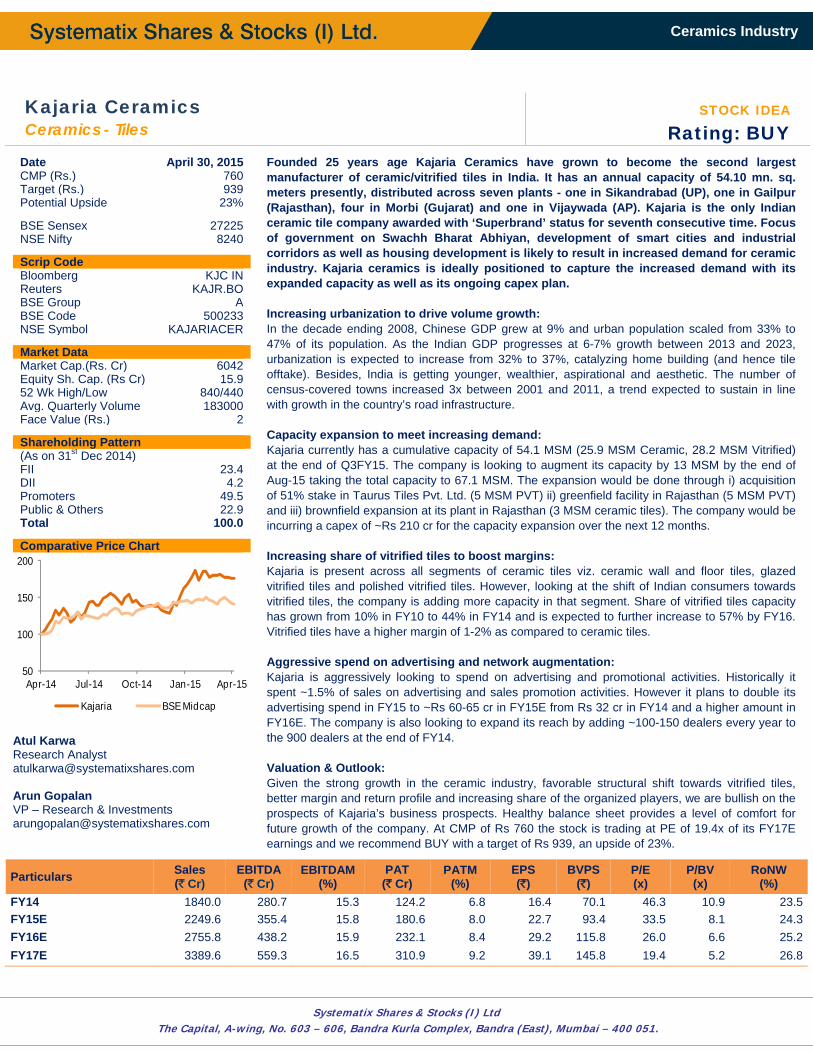
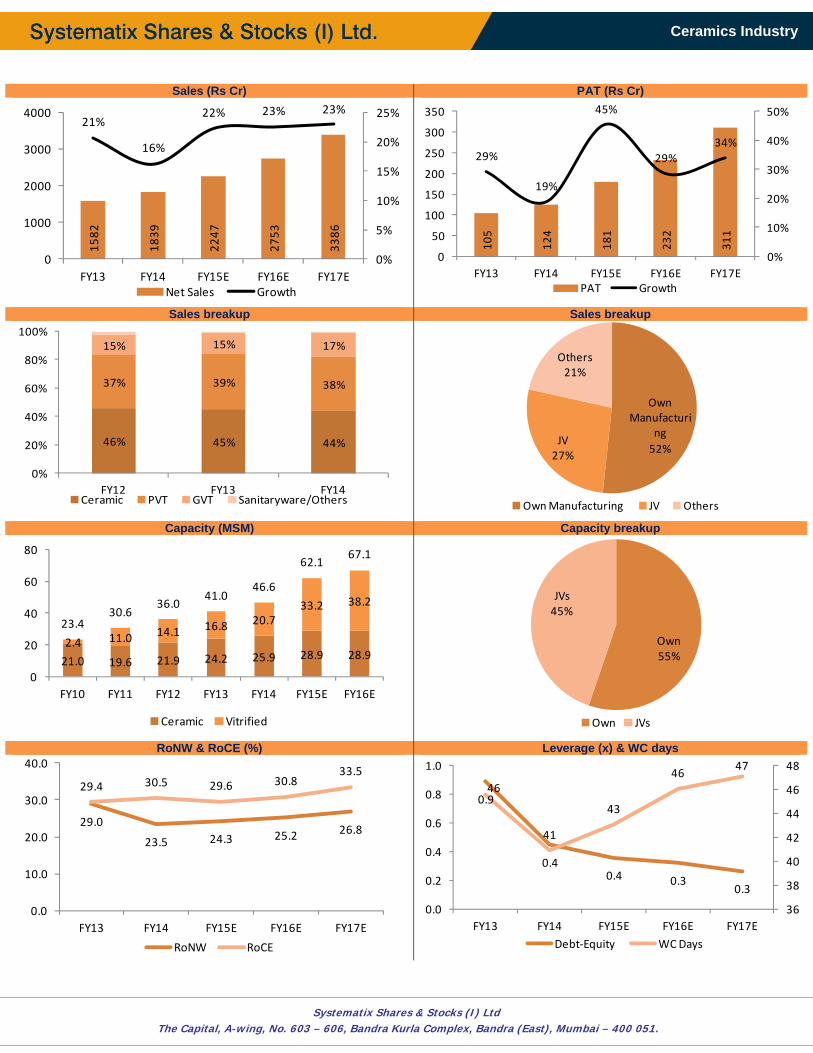
Founded 25 years age Kajaria Ceramics have grown to become the second largest manufacturer of ceramic/vitrified tiles in India. It has an annual capacity of 54.10 mn. sq. meters presently, distributed across seven plants - one in Sikandrabad (UP), one in Gailpur (Rajasthan), four in Morbi (Gujarat) and one in Vijaywada (AP). Kajaria is the only Indian ceramic tile company awarded with ‘Superbrand’ status for seventh consecutive time. Focus of government on Swachh Bharat Abhiyan, development of smart cities and industrial corridors as well as housing development is likely to result in increased demand for ceramic industry. Kajaria ceramics is ideally positioned to capture the increased demand with its expanded capacity as well as its ongoing capex plan. Increasing urbanization to drive volume growth: In the decade ending 2008, Chinese GDP grew at 9% and urban population scaled from 33% to 47% of its population. As the Indian GDP progresses at 6-7% growth between 2013 and 2023, urbanization is expected to increase from 32% to 37%, catalyzing home building (and hence tile offtake). Besides, India is getting younger, wealthier, aspirational and aesthetic. The number of census-covered towns increased 3x between 2001 and 2011, a trend expected to sustain in line with growth in the country’s road infrastructure. Capacity expansion to meet increasing demand: Kajaria currently has a cumulative capacity of 54.1 MSM (25.9 MSM Ceramic, 28.2 MSM Vitrified) at the end of Q3FY15. The company is looking to augment its capacity by 13 MSM by the end of Aug-15 taking the total capacity to 67.1 MSM. The expansion would be done through i) acquisition of 51% stake in Taurus Tiles Pvt. Ltd. (5 MSM PVT) ii) greenfield facility in Rajasthan (5 MSM PVT) and iii) brownfield expansion at its plant in Rajasthan (3 MSM ceramic tiles). The company would be incurring a capex of ~Rs 210 cr for the capacity expansion over the next 12 months. Increasing share of vitrified tiles to boost margins: Kajaria is present across all segments of ceramic tiles viz. ceramic wall and floor tiles, glazed vitrified tiles and polished vitrified tiles. However, looking at the shift of Indian consumers towards vitrified tiles, the company is adding more capacity in that segment. Share of vitrified tiles capacity has grown from 10% in FY10 to 44% in FY14 and is expected to further increase to 57% by FY16. Vitrified tiles have a higher margin of 1-2% as compared to ceramic tiles. Aggressive spend on advertising and network augmentation: Kajaria is aggressively looking to spend on advertising and promotional activities. Historically it spent ~1.5% of sales on advertising and sales promotion activities. However it plans to double its advertising spend in FY15 to ~Rs 60-65 cr in FY15E from Rs 32 cr in FY14 and a higher amount in FY16E. The company is also looking to expand its reach by adding ~100-150 dealers every year to the 900 dealers at the end of FY14. Valuation & Outlook: Given the strong growth in the ceramic industry, favorable structural shift towards vitrified tiles, better margin and return profile and increasing share of the organized players, we are bullish on the prospects of Kajaria’s business prospects. Healthy balance sheet provides a level of comfort for future growth of the company. At CMP of Rs 760 the stock is trading at PE of 19.4x of its FY17E earnings and we recommend BUY with a target of Rs 939, an upside of 23%.
Particulars Sales (` Cr)
EBITDA (` Cr)
EBITDAM(%)
PAT (` Cr)
PATM (%)
EPS (`)
BVPS (`)
P/E (x)
P/BV (x)
RoNW (%)
FY14 1840.0 280.7 15.3 124.2 6.8 16.4 70.1 46.3 10.9 23.5FY15E 2249.6 355.4 15.8 180.6 8.0 22.7 93.4 33.5 8.1 24.3FY16E 2755.8 438.2 15.9 232.1 8.4 29.2 115.8 26.0 6.6 25.2FY17E 3389.6 559.3 16.5 310.9 9.2 39.1 145.8 19.4 5.2 26.8
50
100
150
200
Apr-14 Jul-14 Oct-14 Jan-15 Apr-15
Kajaria BSE Midcap
22
Ceramics Industry
Systematix Shares & Stocks (I) Ltd The Capital, A-wing, No. 603 – 606, Bandra Kurla Complex, Bandra (East), Mumbai – 400 051.
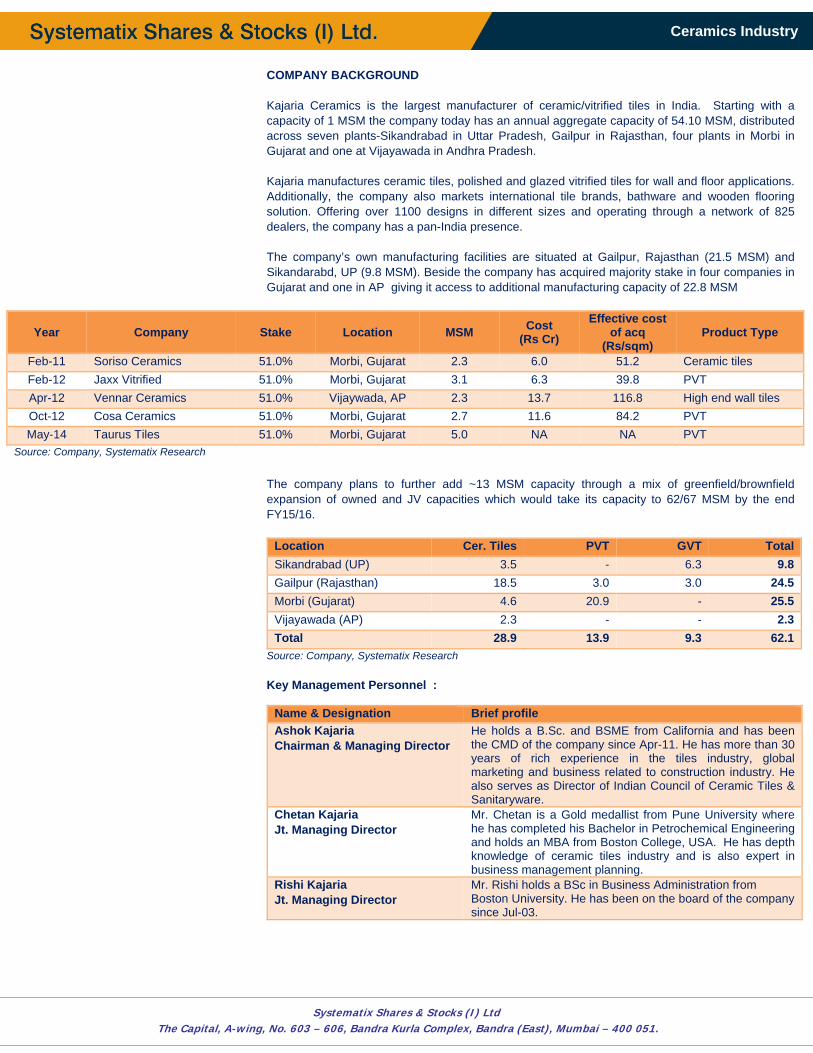
COMPANY BACKGROUND Kajaria Ceramics is the largest manufacturer of ceramic/vitrified tiles in India. Starting with a capacity of 1 MSM the company today has an annual aggregate capacity of 54.10 MSM, distributed across seven plants-Sikandrabad in Uttar Pradesh, Gailpur in Rajasthan, four plants in Morbi in Gujarat and one at Vijayawada in Andhra Pradesh. Kajaria manufactures ceramic tiles, polished and glazed vitrified tiles for wall and floor applications. Additionally, the company also markets international tile brands, bathware and wooden flooring solution. Offering over 1100 designs in different sizes and operating through a network of 825 dealers, the company has a pan-India presence. The company’s own manufacturing facilities are situated at Gailpur, Rajasthan (21.5 MSM) and Sikandarabd, UP (9.8 MSM). Beside the company has acquired majority stake in four companies in Gujarat and one in AP giving it access to additional manufacturing capacity of 22.8 MSM The company plans to further add ~13 MSM capacity through a mix of greenfield/brownfield expansion of owned and JV capacities which would take its capacity to 62/67 MSM by the end FY15/16.
Location Cer. Tiles PVT GVT TotalSikandrabad (UP) 3.5 - 6.3 9.8Gailpur (Rajasthan) 18.5 3.0 3.0 24.5Morbi (Gujarat) 4.6 20.9 - 25.5Vijayawada (AP) 2.3 - - 2.3Total 28.9 13.9 9.3 62.1
Source: Company, Systematix Research Key Management Personnel :
Name & Designation Brief profileAshok KajariaChairman & Managing Director
He holds a B.Sc. and BSME from California and has been the CMD of the company since Apr-11. He has more than 30 years of rich experience in the tiles industry, global marketing and business related to construction industry. He also serves as Director of Indian Council of Ceramic Tiles & Sanitaryware.
Chetan KajariaJt. Managing Director
Mr. Chetan is a Gold medallist from Pune University where he has completed his Bachelor in Petrochemical Engineering and holds an MBA from Boston College, USA. He has depth knowledge of ceramic tiles industry and is also expert in business management planning.
Rishi KajariaJt. Managing Director
Mr. Rishi holds a BSc in Business Administration from Boston University. He has been on the board of the company since Jul-03.
Year Company Stake Location MSM Cost (Rs Cr)
Effective cost of acq
(Rs/sqm) Product Type
Feb-11 Soriso Ceramics 51.0% Morbi, Gujarat 2.3 6.0 51.2 Ceramic tiles Feb-12 Jaxx Vitrified 51.0% Morbi, Gujarat 3.1 6.3 39.8 PVT Apr-12 Vennar Ceramics 51.0% Vijaywada, AP 2.3 13.7 116.8 High end wall tiles Oct-12 Cosa Ceramics 51.0% Morbi, Gujarat 2.7 11.6 84.2 PVT May-14 Taurus Tiles 51.0% Morbi, Gujarat 5.0 NA NA PVT
Source: Company, Systematix Research
23
Ceramics Industry
Systematix Shares & Stocks (I) Ltd The Capital, A-wing, No. 603 – 606, Bandra Kurla Complex, Bandra (East), Mumbai – 400 051.
Sales (Rs Cr) PAT (Rs Cr)
Sales breakup Sales breakup
Capacity (MSM) Capacity breakup
RoNW & RoCE (%) Leverage (x) & WC days
1582
1839
2247
2753
3386
21%
16%
22% 23% 23%
0%
5%
10%
15%
20%
25%
0
1000
2000
3000
4000
FY13 FY14 FY15E FY16E FY17ENet Sales Growth
105
124
181
232
311
29%
19%
45%
29%34%
0%
10%
20%
30%
40%
50%
0
50
100
150
200
250
300
350
FY13 FY14 FY15E FY16E FY17EPAT Growth
46% 45% 44%
37% 39% 38%
15% 15% 17%
0%
20%
40%
60%
80%
100%
FY12 FY13 FY14Ceramic PVT GVT Sanitaryware/Others
Own Manufacturi
ng52%
JV27%
Others21%
Own Manufacturing JV Others
21.0 19.6 21.9 24.2 25.9 28.9 28.92.4 11.0 14.1 16.8 20.7
33.2 38.2
23.430.6
36.041.0
46.6
62.167.1
0
20
40
60
80
FY10 FY11 FY12 FY13 FY14 FY15E FY16E
Ceramic Vitrified
Own55%
JVs45%
Own JVs
29.0
23.5 24.3 25.2 26.8
29.4 30.5 29.6 30.833.5
0.0
10.0
20.0
30.0
40.0
FY13 FY14 FY15E FY16E FY17E
RoNW RoCE
0.9
0.40.4 0.3
0.3
46
41
43
4647
36
38
40
42
44
46
48
0.0
0.2
0.4
0.6
0.8
1.0
FY13 FY14 FY15E FY16E FY17E
Debt‐Equity WC Days
24
Ceramics Industry
Systematix Shares & Stocks (I) Ltd The Capital, A-wing, No. 603 – 606, Bandra Kurla Complex, Bandra (East), Mumbai – 400 051.
FINANCIAL PERFORMANCE
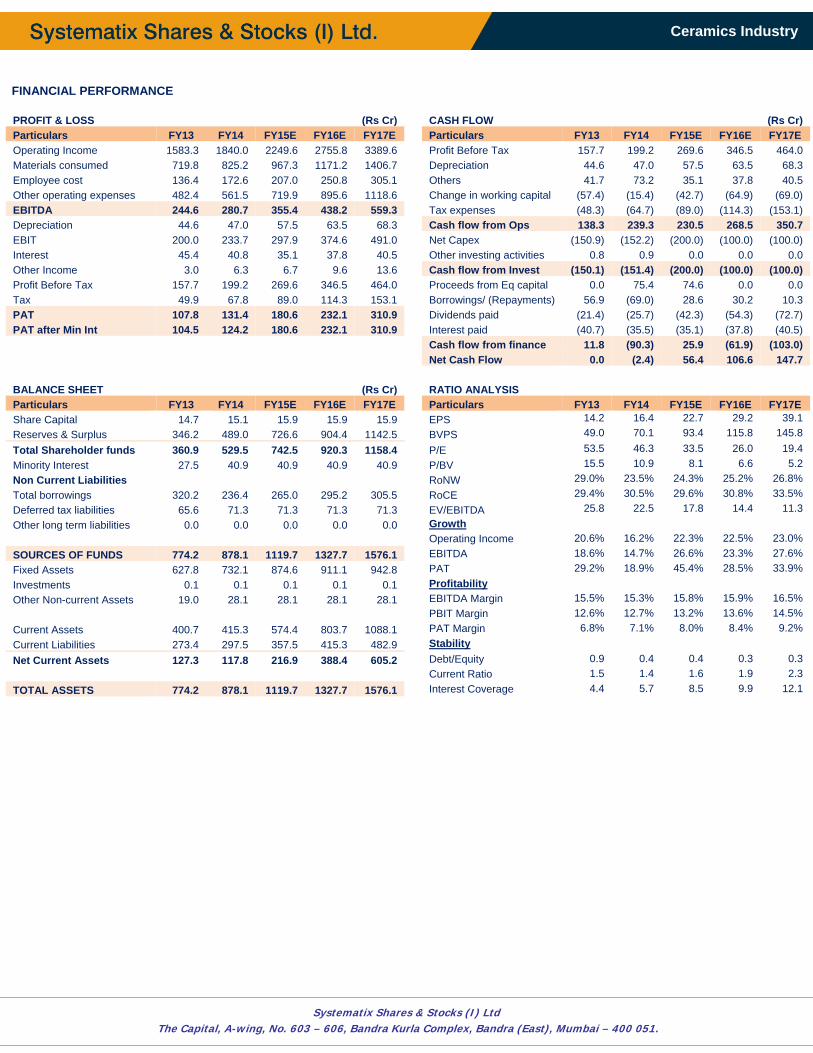
PROFIT & LOSS (Rs Cr) CASH FLOW (Rs Cr) Particulars FY13 FY14 FY15E FY16E FY17E Particulars FY13 FY14 FY15E FY16E FY17E Operating Income 1583.3 1840.0 2249.6 2755.8 3389.6 Profit Before Tax 157.7 199.2 269.6 346.5 464.0 Materials consumed 719.8 825.2 967.3 1171.2 1406.7 Depreciation 44.6 47.0 57.5 63.5 68.3 Employee cost 136.4 172.6 207.0 250.8 305.1 Others 41.7 73.2 35.1 37.8 40.5 Other operating expenses 482.4 561.5 719.9 895.6 1118.6 Change in working capital (57.4) (15.4) (42.7) (64.9) (69.0) EBITDA 244.6 280.7 355.4 438.2 559.3 Tax expenses (48.3) (64.7) (89.0) (114.3) (153.1) Depreciation 44.6 47.0 57.5 63.5 68.3 Cash flow from Ops 138.3 239.3 230.5 268.5 350.7 EBIT 200.0 233.7 297.9 374.6 491.0 Net Capex (150.9) (152.2) (200.0) (100.0) (100.0) Interest 45.4 40.8 35.1 37.8 40.5 Other investing activities 0.8 0.9 0.0 0.0 0.0 Other Income 3.0 6.3 6.7 9.6 13.6 Cash flow from Invest (150.1) (151.4) (200.0) (100.0) (100.0) Profit Before Tax 157.7 199.2 269.6 346.5 464.0 Proceeds from Eq capital 0.0 75.4 74.6 0.0 0.0 Tax 49.9 67.8 89.0 114.3 153.1 Borrowings/ (Repayments) 56.9 (69.0) 28.6 30.2 10.3 PAT 107.8 131.4 180.6 232.1 310.9 Dividends paid (21.4) (25.7) (42.3) (54.3) (72.7) PAT after Min Int 104.5 124.2 180.6 232.1 310.9 Interest paid (40.7) (35.5) (35.1) (37.8) (40.5) Cash flow from finance 11.8 (90.3) 25.9 (61.9) (103.0) Net Cash Flow 0.0 (2.4) 56.4 106.6 147.7 BALANCE SHEET (Rs Cr) RATIO ANALYSIS Particulars FY13 FY14 FY15E FY16E FY17E Particulars FY13 FY14 FY15E FY16E FY17E Share Capital 14.7 15.1 15.9 15.9 15.9 EPS 14.2 16.4 22.7 29.2 39.1 Reserves & Surplus 346.2 489.0 726.6 904.4 1142.5 BVPS 49.0 70.1 93.4 115.8 145.8 Total Shareholder funds 360.9 529.5 742.5 920.3 1158.4 P/E 53.5 46.3 33.5 26.0 19.4 Minority Interest 27.5 40.9 40.9 40.9 40.9 P/BV 15.5 10.9 8.1 6.6 5.2 Non Current Liabilities RoNW 29.0% 23.5% 24.3% 25.2% 26.8% Total borrowings 320.2 236.4 265.0 295.2 305.5 RoCE 29.4% 30.5% 29.6% 30.8% 33.5% Deferred tax liabilities 65.6 71.3 71.3 71.3 71.3 EV/EBITDA 25.8 22.5 17.8 14.4 11.3 Other long term liabilities 0.0 0.0 0.0 0.0 0.0 Growth Operating Income 20.6% 16.2% 22.3% 22.5% 23.0% SOURCES OF FUNDS 774.2 878.1 1119.7 1327.7 1576.1 EBITDA 18.6% 14.7% 26.6% 23.3% 27.6% Fixed Assets 627.8 732.1 874.6 911.1 942.8 PAT 29.2% 18.9% 45.4% 28.5% 33.9% Investments 0.1 0.1 0.1 0.1 0.1 Profitability Other Non-current Assets 19.0 28.1 28.1 28.1 28.1 EBITDA Margin 15.5% 15.3% 15.8% 15.9% 16.5% PBIT Margin 12.6% 12.7% 13.2% 13.6% 14.5% Current Assets 400.7 415.3 574.4 803.7 1088.1 PAT Margin 6.8% 7.1% 8.0% 8.4% 9.2% Current Liabilities 273.4 297.5 357.5 415.3 482.9 Stability Net Current Assets 127.3 117.8 216.9 388.4 605.2 Debt/Equity 0.9 0.4 0.4 0.3 0.3 Current Ratio 1.5 1.4 1.6 1.9 2.3 TOTAL ASSETS 774.2 878.1 1119.7 1327.7 1576.1 Interest Coverage 4.4 5.7 8.5 9.9 12.1
25
Ceramics Industry
Systematix Shares & Stocks (I) Ltd The Capital, A-wing, No. 603 – 606, Bandra Kurla Complex, Bandra (East), Mumbai – 400 051.
Somany Ceramics STOCK IDEA Ceramic - Tiles Rating: ACCUMULATE
Date April 30, 2015 CMP (Rs.) 408 Target (Rs.) 459 Potential Upside 12%
BSE Sensex 27458 NSE Nifty 8342
Scrip Code Bloomberg SOMC IN Reuters SOCE.BO BSE Group B BSE Code 531548 NSE Symbol SOMANYCERA
Market Data Market Cap.(Rs. Cr) 1586 Equity Sh. Cap. (Rs Cr) 7.8 52 Wk High/Low 425/156 Avg. Quarterly Volume 40500 Face Value (Rs.) 5
Shareholding Pattern (As on 31st Mar 2015) FII 5.8 DII 3.1 Promoters 56.2 Public & Others 34.9 Total 100.0
Comparative Price Chart
Atul Karwa Research Analyst [email protected] Arun Gopalan VP – Research & Investments [email protected]
Founded in 1968 by Mr HL Somany in collaboration with Pilkington’s Tile Holding, UK,Somany Ceramics has grown to become the third largest manufacturer of tiles in India having a market share of ~12% in the organized space. The company has two manufacturing plants, one each at Kadi (Gujarat) and Kassar (Haryana) having total manufacturing capacity of 19.2 MSM with 6500+ touchpoints. Over the last few years the company has grown through JVs and has added access to 25 MSM of capacity and is looking to add 5-6 MSM of capacity every year. With 35% of their business coming from institutional clientele and 65% from retail clientele, the increasing urbanization levels in India is expected to provide a solid boost for Somany Ceramics in the coming few years. Asset light strategy; Building scale through JVs: The company has more than doubled its capacity over FY11-14 from 19.15 MSM to 44.12 MSM through JVs. It is looking to further add ~11 MSM in FY15 at a capex of ~Rs 60 cr. Almost 3/4th of the fresh capacity addition would be in JV companies while it would be adding 2.4 MSM to its own manufacturing. The expansion will mostly be funded through internal accruals. The management expects sales momentum to pick up given larger capacities, weaker unorganized competition, improving product mix and cost efficiencies. Coupled with low debt servicing requirement we expect PAT margins to improve from 2.1% to 3.3% and RoNW to from 12.9% to 21% over FY14-17.
Rising contribution from value added products: Somany, the third-largest tiles player in India with a market share of 12%/6% in the organized/total market, has one of the strongest ceramic tile brands in India. Though a late entrant into the high-value, polished/glazed vitrified tiles segment, Somany has gained momentum in this space over the last couple of years. Strengthening the brand and several product launches in this category has led to contribution from higher margin value added products to increase from ~18% in FY10 to ~47% in FY14. The management is further investing in fortifying its brand and presence in the premium tile category. Increased expenditure on advertising to create brand recall: The company has significantly enhanced its marketing and selling efforts to accentuate its brand presence. During the year, the Company moved a step ahead to virtual marketing through an agreement with Google. It increased its overall cost of advertising and sales promotion by 29% in FY14 and plans to spend ~2-2.5% of sales towards advertising and sales promotion activities. It has recently launched their brand new campaign, ‘Zindagi Ko Chamakne Do’ highlighting the bond that they share is not just with the house but every nook and corner of it.
Deleveraging balance sheet lends comfort: As the company has expanded through JVs funded through internal accruals over the last couple of years, debt levels have remained in the range of Rs 170 cr. Debt-equity ratio has improved from 1.7x in FY11 to 0.8x in FY14 and we expect it to further improve to 0.5x by FY17. Furthermore, Somany raised Rs 50 cr by diluting an 11.2% stake to private equity firm Creador. A majority portion of the proceeds would be utilized for future expansion. Working capital requirement has also reduced from 67 to 37 during the same period. Valuation & Outlook: Increasing level of urbanization, strengthening brand through increased advertising will give a strong push to company’s sales in Tier II and Tier III cities where the growth has been strong. We are bullish on the prospects of Somany’s business prospects. At CMP of Rs 408 the stock trades at PE of 20.5x of its FY17E earnings and we recommend Accumulate at current levels and on dips with a target of Rs 459, upside of 12%.
Particulars Sales (` Cr)
EBITDA (` Cr)
EBITDAM(%)
PAT (` Cr)
PATM (%)
EPS (`)
BVPS (`)
P/E (x)
P/BV (x)
RoNW (%)
FY14 1262.9 81.4 6.4 28.9 2.3 7.4 57.5 54.9 7.1 12.9FY15E 1575.4 105.6 6.7 43.7 2.8 11.3 66.4 36.3 6.1 16.9FY16E 1937.7 131.8 6.8 58.4 3.0 15.0 78.6 27.2 5.2 19.1FY17E 2344.6 161.8 6.9 77.4 3.3 19.9 95.0 20.5 4.3 21.0
50
100
150
200
250
Apr-14 Jul-14 Oct-14 Jan-15 Apr-15
Somany BSE Midcap
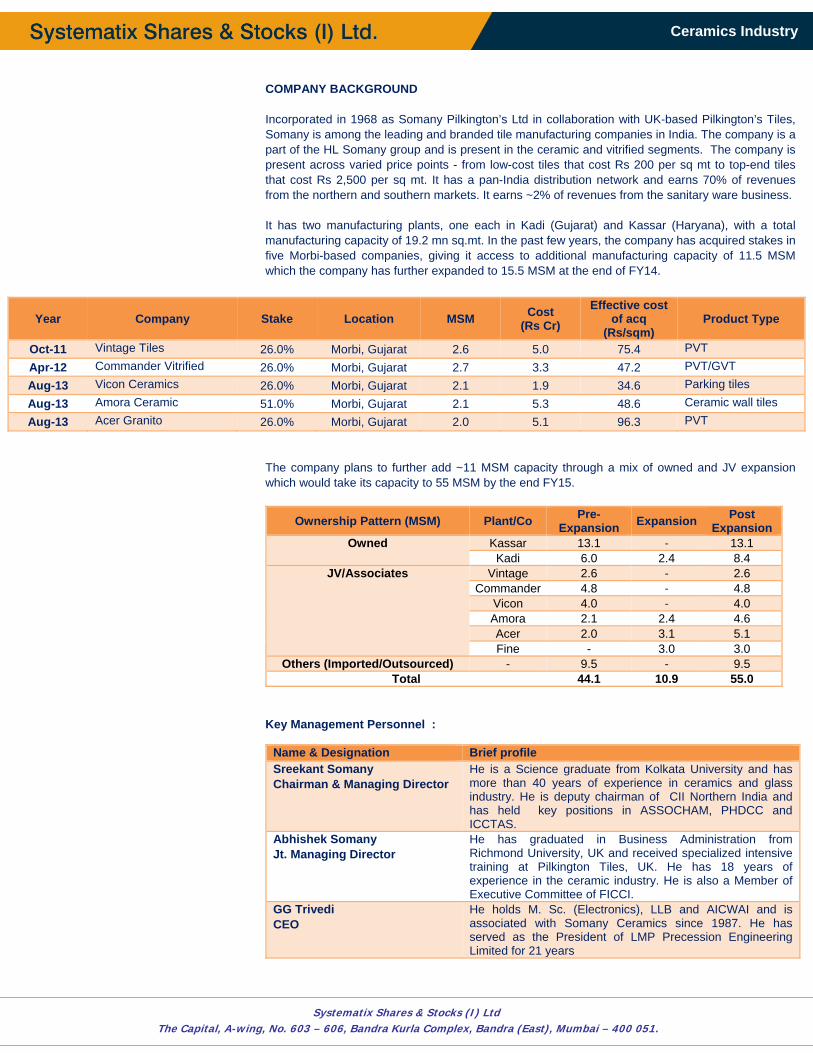
26
Ceramics Industry
Systematix Shares & Stocks (I) Ltd The Capital, A-wing, No. 603 – 606, Bandra Kurla Complex, Bandra (East), Mumbai – 400 051.
COMPANY BACKGROUND Incorporated in 1968 as Somany Pilkington’s Ltd in collaboration with UK-based Pilkington’s Tiles, Somany is among the leading and branded tile manufacturing companies in India. The company is a part of the HL Somany group and is present in the ceramic and vitrified segments. The company is present across varied price points - from low-cost tiles that cost Rs 200 per sq mt to top-end tiles that cost Rs 2,500 per sq mt. It has a pan-India distribution network and earns 70% of revenues from the northern and southern markets. It earns ~2% of revenues from the sanitary ware business. It has two manufacturing plants, one each in Kadi (Gujarat) and Kassar (Haryana), with a total manufacturing capacity of 19.2 mn sq.mt. In the past few years, the company has acquired stakes in five Morbi-based companies, giving it access to additional manufacturing capacity of 11.5 MSM which the company has further expanded to 15.5 MSM at the end of FY14. The company plans to further add ~11 MSM capacity through a mix of owned and JV expansion which would take its capacity to 55 MSM by the end FY15.
Ownership Pattern (MSM) Plant/Co Pre-Expansion Expansion Post
Expansion Owned Kassar 13.1 - 13.1
Kadi 6.0 2.4 8.4 JV/Associates Vintage 2.6 - 2.6
Commander 4.8 - 4.8 Vicon 4.0 - 4.0 Amora 2.1 2.4 4.6 Acer 2.0 3.1 5.1 Fine - 3.0 3.0
Others (Imported/Outsourced) - 9.5 - 9.5 Total 44.1 10.9 55.0
Key Management Personnel :
Name & Designation Brief profileSreekant SomanyChairman & Managing Director
He is a Science graduate from Kolkata University and has more than 40 years of experience in ceramics and glass industry. He is deputy chairman of CII Northern India and has held key positions in ASSOCHAM, PHDCC and ICCTAS.
Abhishek SomanyJt. Managing Director
He has graduated in Business Administration from Richmond University, UK and received specialized intensive training at Pilkington Tiles, UK. He has 18 years of experience in the ceramic industry. He is also a Member of Executive Committee of FICCI.
GG TrivediCEO
He holds M. Sc. (Electronics), LLB and AICWAI and is associated with Somany Ceramics since 1987. He has served as the President of LMP Precession Engineering Limited for 21 years
Year Company Stake Location MSM Cost (Rs Cr)
Effective cost of acq
(Rs/sqm) Product Type
Oct-11 Vintage Tiles 26.0% Morbi, Gujarat 2.6 5.0 75.4 PVT Apr-12 Commander Vitrified 26.0% Morbi, Gujarat 2.7 3.3 47.2 PVT/GVT Aug-13 Vicon Ceramics 26.0% Morbi, Gujarat 2.1 1.9 34.6 Parking tiles Aug-13 Amora Ceramic 51.0% Morbi, Gujarat 2.1 5.3 48.6 Ceramic wall tiles Aug-13 Acer Granito 26.0% Morbi, Gujarat 2.0 5.1 96.3 PVT
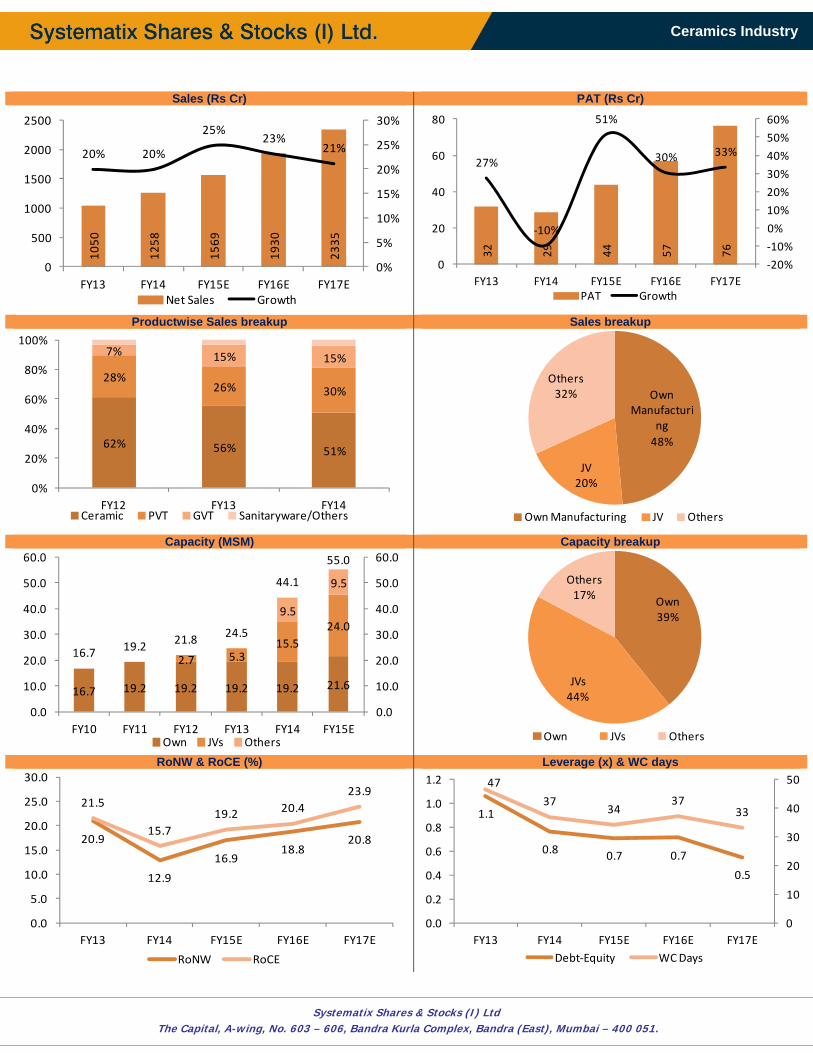
27
Ceramics Industry
Systematix Shares & Stocks (I) Ltd The Capital, A-wing, No. 603 – 606, Bandra Kurla Complex, Bandra (East), Mumbai – 400 051.
Sales (Rs Cr) PAT (Rs Cr)
Productwise Sales breakup Sales breakup
Capacity (MSM) Capacity breakup
RoNW & RoCE (%) Leverage (x) & WC days
1050
1258
1569
1930
2335
20% 20%
25%23%
21%
0%
5%
10%
15%
20%
25%
30%
0
500
1000
1500
2000
2500
FY13 FY14 FY15E FY16E FY17ENet Sales Growth
32 29 44 57 76
27%
‐10%
51%
30% 33%
‐20%
‐10%
0%
10%
20%
30%
40%
50%
60%
0
20
40
60
80
FY13 FY14 FY15E FY16E FY17EPAT Growth
62% 56% 51%
28%26% 30%
7% 15% 15%
0%
20%
40%
60%
80%
100%
FY12 FY13 FY14Ceramic PVT GVT Sanitaryware/Others
Own Manufacturi
ng48%
JV20%
Others32%
Own Manufacturing JV Others
16.7 19.2 19.2 19.2 19.2 21.6
2.7 5.315.5
24.09.5
9.5
16.7 19.2 21.8 24.5
44.1
55.0
0.0
10.0
20.0
30.0
40.0
50.0
60.0
0.0
10.0
20.0
30.0
40.0
50.0
60.0
FY10 FY11 FY12 FY13 FY14 FY15EOwn JVs Others
Own39%
JVs44%
Others17%
Own JVs Others
20.9
12.9
16.918.8
20.8
21.5
15.719.2 20.4
23.9
0.0
5.0
10.0
15.0
20.0
25.0
30.0
FY13 FY14 FY15E FY16E FY17E
RoNW RoCE
1.1
0.8 0.7 0.7
0.5
47
3734
3733
0
10
20
30
40
50
0.0
0.2
0.4
0.6
0.8
1.0
1.2
FY13 FY14 FY15E FY16E FY17EDebt‐Equity WC Days
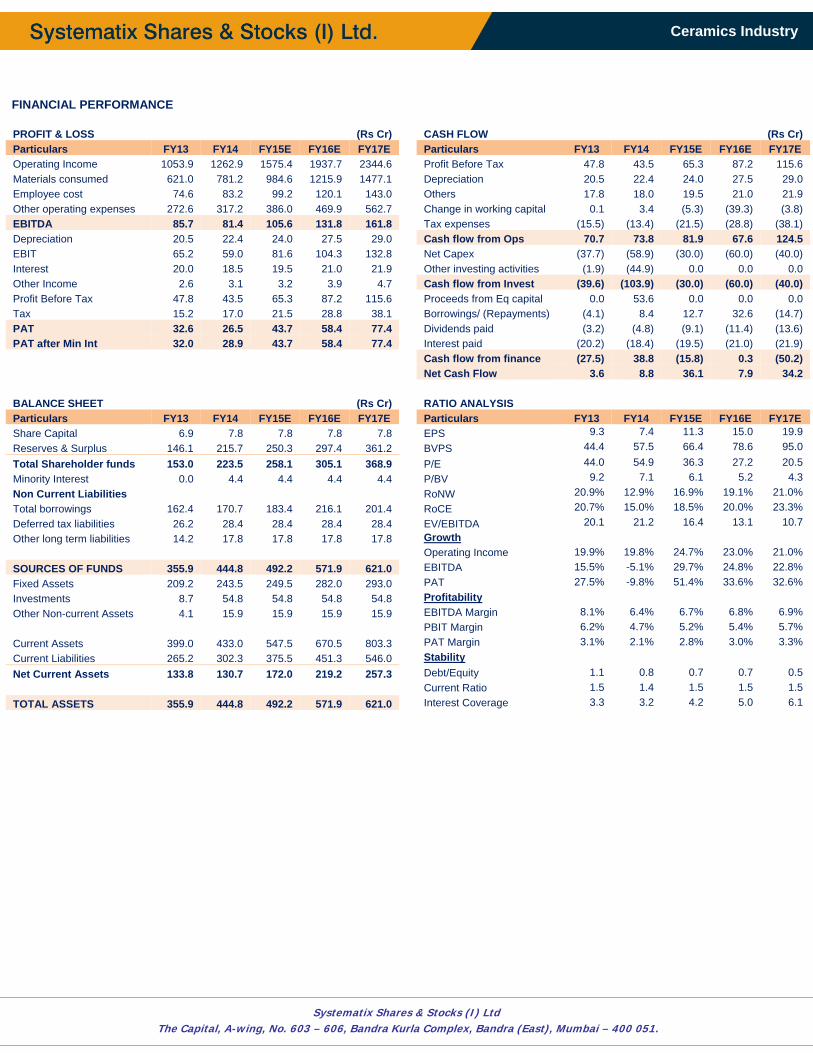
28
Ceramics Industry
Systematix Shares & Stocks (I) Ltd The Capital, A-wing, No. 603 – 606, Bandra Kurla Complex, Bandra (East), Mumbai – 400 051.
FINANCIAL PERFORMANCE
PROFIT & LOSS (Rs Cr) CASH FLOW (Rs Cr) Particulars FY13 FY14 FY15E FY16E FY17E Particulars FY13 FY14 FY15E FY16E FY17E Operating Income 1053.9 1262.9 1575.4 1937.7 2344.6 Profit Before Tax 47.8 43.5 65.3 87.2 115.6 Materials consumed 621.0 781.2 984.6 1215.9 1477.1 Depreciation 20.5 22.4 24.0 27.5 29.0 Employee cost 74.6 83.2 99.2 120.1 143.0 Others 17.8 18.0 19.5 21.0 21.9 Other operating expenses 272.6 317.2 386.0 469.9 562.7 Change in working capital 0.1 3.4 (5.3) (39.3) (3.8) EBITDA 85.7 81.4 105.6 131.8 161.8 Tax expenses (15.5) (13.4) (21.5) (28.8) (38.1) Depreciation 20.5 22.4 24.0 27.5 29.0 Cash flow from Ops 70.7 73.8 81.9 67.6 124.5 EBIT 65.2 59.0 81.6 104.3 132.8 Net Capex (37.7) (58.9) (30.0) (60.0) (40.0) Interest 20.0 18.5 19.5 21.0 21.9 Other investing activities (1.9) (44.9) 0.0 0.0 0.0 Other Income 2.6 3.1 3.2 3.9 4.7 Cash flow from Invest (39.6) (103.9) (30.0) (60.0) (40.0) Profit Before Tax 47.8 43.5 65.3 87.2 115.6 Proceeds from Eq capital 0.0 53.6 0.0 0.0 0.0 Tax 15.2 17.0 21.5 28.8 38.1 Borrowings/ (Repayments) (4.1) 8.4 12.7 32.6 (14.7) PAT 32.6 26.5 43.7 58.4 77.4 Dividends paid (3.2) (4.8) (9.1) (11.4) (13.6) PAT after Min Int 32.0 28.9 43.7 58.4 77.4 Interest paid (20.2) (18.4) (19.5) (21.0) (21.9) Cash flow from finance (27.5) 38.8 (15.8) 0.3 (50.2) Net Cash Flow 3.6 8.8 36.1 7.9 34.2 BALANCE SHEET (Rs Cr) RATIO ANALYSIS Particulars FY13 FY14 FY15E FY16E FY17E Particulars FY13 FY14 FY15E FY16E FY17E Share Capital 6.9 7.8 7.8 7.8 7.8 EPS 9.3 7.4 11.3 15.0 19.9 Reserves & Surplus 146.1 215.7 250.3 297.4 361.2 BVPS 44.4 57.5 66.4 78.6 95.0 Total Shareholder funds 153.0 223.5 258.1 305.1 368.9 P/E 44.0 54.9 36.3 27.2 20.5 Minority Interest 0.0 4.4 4.4 4.4 4.4 P/BV 9.2 7.1 6.1 5.2 4.3 Non Current Liabilities RoNW 20.9% 12.9% 16.9% 19.1% 21.0% Total borrowings 162.4 170.7 183.4 216.1 201.4 RoCE 20.7% 15.0% 18.5% 20.0% 23.3% Deferred tax liabilities 26.2 28.4 28.4 28.4 28.4 EV/EBITDA 20.1 21.2 16.4 13.1 10.7 Other long term liabilities 14.2 17.8 17.8 17.8 17.8 Growth Operating Income 19.9% 19.8% 24.7% 23.0% 21.0% SOURCES OF FUNDS 355.9 444.8 492.2 571.9 621.0 EBITDA 15.5% -5.1% 29.7% 24.8% 22.8% Fixed Assets 209.2 243.5 249.5 282.0 293.0 PAT 27.5% -9.8% 51.4% 33.6% 32.6% Investments 8.7 54.8 54.8 54.8 54.8 Profitability Other Non-current Assets 4.1 15.9 15.9 15.9 15.9 EBITDA Margin 8.1% 6.4% 6.7% 6.8% 6.9% PBIT Margin 6.2% 4.7% 5.2% 5.4% 5.7% Current Assets 399.0 433.0 547.5 670.5 803.3 PAT Margin 3.1% 2.1% 2.8% 3.0% 3.3% Current Liabilities 265.2 302.3 375.5 451.3 546.0 Stability Net Current Assets 133.8 130.7 172.0 219.2 257.3 Debt/Equity 1.1 0.8 0.7 0.7 0.5 Current Ratio 1.5 1.4 1.5 1.5 1.5 TOTAL ASSETS 355.9 444.8 492.2 571.9 621.0 Interest Coverage 3.3 3.2 4.2 5.0 6.1
DISCLOSURES/ APPENDIX
I. ANALYST CERTIFICATION I, Atul Karwa, hereby certify (1) that the views expressed in this research report accurately reflect my personal views about any or all of the subject securities or issuers referred to in this research report, (2) No part of my compensation was, is, or will be directly or indirectly related to the specific recommendations or views expressed in this research report by Systematix Shares & Stocks (I) Limited or its Group/associates companies. (3) has taken reasonable care to achieve and maintain independence and objectivity in making any recommendations.
Disclosure of Interest Statement Response Analyst holding in the stock No Served as an officer, director or employee No
II. ISSUER SPECIFIC REGULATORY DISCLOSURES, UNLESS SPECIFICALLY MENTIONED IN POINT NO. 9 BELOW:
1. The Research Analyst(s), Systematix Shares & Stocks(I) Limited (SSSIL), Associate of Analyst or his relative does not have any financial interest in the company(ies) covered in this report. 2. The Research Analyst, SSSIL or its associates or relatives of the Research Analyst affiliates collectively do not hold more than 1% of the securities of the company (ies) covered in this report as of the end of
the month immediately preceding the distribution of the research report. 3. The Research Analyst, his associate, his relative and SSSIL do not have any other material conflict of interest at the time of publication of this research report. 4. The Research Analyst, SSSIL and its associates have not received compensation for investment banking or merchant banking or brokerage services or for any other products or services from the
company(ies) covered in this report, in the past twelve months. 5. The Research Analyst, SSSIL or its associates have not managed or co-managed in the previous twelve months, a private or public offering of securities for the company (ies) covered in this report. 6. SSSIL or its associates have not received compensation or other benefits from the company(ies) covered in this report or from any third party, in connection with the research report. 7. The Research Analyst has not served as an Officer, Director or employee of the company (ies) covered in the Research report. 8. The Research Analyst and SSSIL has not been engaged in market making activity for the company(ies) covered in the Research report. 9. Details SSSIL, Research Analyst and its associates pertaining to the companies covered in the Research report:
Sr. No.
Particulars Yes / No.
1 Whether compensation has been received from the company(ies) covered in the Research report in the past 12 months for investment banking transaction by SSSIL No 2 Whether Research Analyst, SSSIL or its associates or relatives of the Research Analyst affiliates collectively hold more than 1% of the company(ies) covered in the Research report No 3 Whether compensation has been received by SSSIL or its associates from the company(ies) covered in the Research report No 4 SSSIL or its affiliates have managed or co-managed in the previous twelve months a private or public offering of securities for the company(ies) covered in the Research report No 5 Research Analyst, his associate, SSSIL or its associates have received compensation for investment banking or merchant banking or brokerage services or for any other products or services
from the company(ies) covered in the Research report, in the last twelve month No
10. There are no material disciplinary action that been taken by any regulatory authority impacting equity research analysis activities. 11. Systematix Shares & Stocks (I) Limited is in a process of seeking registration under SEBI (Research Analyst) Regulations, 2014.
EXPLANATION TO RATINGS: BUY: TP>15%; ACCUMULATE: 5%<TP<15%; HOLD: -5%<TP<5%; REDUCE: -15%<TP<-5%; SELL: TP<-15%
III. DISCLAIMER The information and opinions contained herein have been compiled or arrived at, based upon information obtained in good faith from sources believed to be reliable. Such information has not been independently verified and no guaranty, representation of warranty, express or implied, is made as to its accuracy completeness or correctness.
This document is for information purposes only. This report is based on information that we consider reliable, but we do not represent that it is accurate or complete, and one should exercise due caution while acting on it. Descriptions of any company or companies or their securities mentioned herein are not complete and this document is not, and should not be construed as an offer or solicitation of an offer to buy or sell any securities or other financial instruments. Past performance is not a guide for future performance, future returns are not guaranteed and a loss of original capital may occur. All opinions, projections and estimates constitute the judgment of the author as on the date of the report and these, plus any other information contained in the report, are subject to change without notice. Prices and availability of financial instruments also are subject to change without notice.
This report is not directed to or intended for display, downloading, printing, reproducing or for distribution to or use by, any person or entity that is a citizen or resident or located in any locality, state, country or other jurisdiction where such distribution, publication, reproduction, availability or use would be contrary to law or regulation or what would subject to SSSIL or its affiliates to any registration or licensing requirement within such jurisdiction. If this report is inadvertently send or has reached any individual in such country, especially, USA, the same may be ignored and brought to the attention of the sender. Neither this document nor any copy of it may be taken or transmitted into the United State (to U.S.Persons), Canada, or Japan or distributed, directly or indirectly, in the United States or Canada or distributed or redistributed in Japan or to any resident thereof. Any unauthorized use, duplication, redistribution or disclosure of this report including, but not limited to, redistribution by electronic mail, posting of the report on a website or page, and/or providing to a third party a link , is prohibited by law and will result in prosecution. The information contained in the Report is intended solely for the recipient and may not be further distributed by the recipient to any third party.
SSSIL generally prohibits its analysts, persons reporting to analysts, and members of their households from maintaining a financial interest in the securities or derivatives of any companies that the analysts cover. Additionally, SSSIL generally prohibits its analysts and persons reporting to analysts from serving as an officer, director, or advisory board member of any companies that the analysts cover. Our salespeople, traders, and other professionals or affiliates may provide oral or written market commentary or trading strategies to our clients that reflect opinions that are contrary to the opinions expressed herein. Our proprietary trading and investing businesses may make investment decisions that are inconsistent with the recommendations expressed herein. The views expressed in this research report reflect the personal views of the analyst(s) about the subject securities or issues, and no part of the compensation of the research analyst(s) was, is, or will be directly or indirectly related to the specific recommendations and views expressed by research analyst(s) in this report. The compensation of the analyst who prepared this document is determined exclusively by SSSIL however, compensation may relate to the revenues of the Systematix Group as a whole, of which investment banking, sales and trading are a part. Research analysts and sales persons of SSSIL may provide important inputs to its affiliated company(ies).
Foreign currencies denominated securities, wherever mentioned, are subject to exchange rate fluctuations, which could have an adverse effect on their value or price, or the income derived from them. In addition, investors in securities such as ADRs, the values of which are influenced by foreign currencies effectively assume currency risk.
MUTUAL FUND INVESTMENTS ARE SUBJECT TO MARKET RISKS, READ ALL SCHEME RELATED DOCUMENTS CAREFULLY. SSSIL, its directors, analysts or employees do not take any responsibility, financial or otherwise, of the losses or the damages sustained due to the investments made or any action taken on basis of this report including but not restricted to fluctuation in the prices of shares and bonds, changes in the currency rates, diminution in the NAVs, reduction in the dividend or income, etc.
SSSIL and its affiliates, officers, directors, and employees subject to the information given in the disclosures may: (a) from time to time, have long or short positions in, and buy or sell the securities thereof, of company (ies) mentioned herein or (b) be engaged in any other transaction involving such securities and earn brokerage or other compensation (financial interest) or act as a market maker in the financial instruments of the company (ies) discussed herein or act as advisor or lender / borrower to such company (ies) or have other potential material conflict of interest with respect to any recommendation and related information and opinions. The views expressed are those of the analyst and the Company may or may not subscribe to the views expressed therein.
SSSIL, its affiliates and any third party involved in, or related to, computing or compiling the information hereby expressly disclaim all warranties of originality, accuracy, completeness, merchantability or fitness for a particular purpose with respect to any of this information. Without limiting any of the foregoing, in no event shall SSSIL, any of its affiliates or any third party involved in, or related to, computing or compiling the information have any liability for any damages of any kind. The Company accepts no liability whatsoever for the actions of third parties. The Report may provide the addresses of, or contain hyperlinks to, websites. Except to the extent to which the Report refers to website material of the Company, the Company has not reviewed the linked site. Accessing such website or following such link through the report or the website of the Company shall be at your own risk and the Company shall have no liability arising out of, or in connection with, any such referenced website
SSSIL shall not be liable for any delay or any other interruption which may occur in presenting the data due to any technical glitch to present the data. In no event shall the SSSIL be liable for any damages, including without limitation, direct or indirect, special, incidental, or consequential damages, losses or expenses arising in connection with the data presented by SSSIL through this presentation.
Neither SSSIL, nor any of its other group companies or associates, shall be responsible for any decisions taken on the basis of this report. Investors are advised to consult their Investment and Tax consultants before taking any investment decisions based on this report. Systematix Shares & Stocks (I) Ltd. CIN: U65993TN1995PLC031285 : SEBI Regn. No.: BSE: INB/F011132736 Member Code: 182 | NSE: INB/F/E231132730 Member Code : 11327 | MCX-SX: INB/F261132733 Member Code: 17560 | PMS SEBI Reg No. : INP000002692 | Depository Participant: IN-DP-CDSL-246-2004 | AMFI: ARN No. 64917 Corporate Office Address: A 603-606 , The Capital, BKC, Bandra (E), Mumbai, India - 400051