CEQA AND HOUSING PRODUCTION - sjud.senate.ca.gov
48
22000 Timber Cove Road | Jenner, CA 95450 | 707.847.3098 | www.housingworkshop.com THEHOUSINGWORKSHOP CEQA AND HOUSING PRODUCTION 2018 Survey of California Cities & Counties
Transcript of CEQA AND HOUSING PRODUCTION - sjud.senate.ca.gov

22000 Timber Cove Road | Jenner, CA 95450 | 707.847.3098 | www.housingworkshop.com
THEHOUSINGWORKSHOP
CEQA AND HOUSING PRODUCTION 2018 Survey of California Cities & Counties

Table of Contents Executive Summary .................................................................................... i
Study Methodology ................................................................................................................................. i Summary of Findings ............................................................................................................................. ii Next Steps .............................................................................................................................................. vi
I. Introduction ............................................................................................. 1
Study Purpose ........................................................................................................................................ 1 CEQA’s Historical Relationship to Housing Production .................................................................... 1 Summary of Recent Studies ................................................................................................................. 3 Study Methodology ................................................................................................................................ 4 Report Organization ............................................................................................................................... 5
2. Overview of Survey Respondents ......................................................... 6
Summary of Respondents ..................................................................................................................... 6 Housing Production Index ..................................................................................................................... 8
3. Survey Results ...................................................................................... 10
CEQA Review of Housing Projects and Units ................................................................................... 10 Detail for Streamlining/Other Exemptions ......................................................................................... 12 CEQA Review for Market-Rate vs. Affordable Housing Units ........................................................ 14 CEQA Review by Production Index ................................................................................................... 15 Projects Withdrawn from CEQA Review ........................................................................................... 16 Timing of CEQA Review Methods ...................................................................................................... 17
4. Opinions: CEQA & Housing ................................................................. 18
Factors Constraining Housing Production ........................................................................................ 18 Comments Regarding CEQA as a Constraint on Housing Production ......................................... 19 Key Changes to Improve CEQA for Housing Production ............................................................... 20 Other Non-CEQA Changes to Improve Housing Production ......................................................... 22
Appendix A: Data Tables ......................................................................... 23
Appendix B: Survey Instrument .............................................................. 28
Appendix C: About the Authors .............................................................. 39

i
Executive Summary California is facing a severe housing shortage. According to a study by the State Legislative
Analyst’s Office (LAO), California’s High Housing Costs, far less housing has been built in
California than people demand, which has led to soaring rents and home prices. The LAO
estimates in addition to the 100,000 to 140,00 housing units California is expected to build each
year, another 100,000 additional units would need to be added to make an impact on housing
costs. As a result, policymakers have been calling for decisive changes to a broad range of
policies to support production.
In recent years, there has been much debate around the California Environmental Quality Act
(CEQA). Some developers, policymakers, and legislators have called for reform, believing that
CEQA has negative cost and timing impacts on market-rate and affordable housing production.
However, CEQA supporters maintain that it is critical to analyze and mitigate environmental
impacts associated with housing development. In this debate, there has been little empirical
evidence about how CEQA affects production and the degree to which environmental review
serves as an unnecessary constraint to expanding housing supply. The lack of data leaves
CEQA open to calls for “reform,” which in turn may not produce meaningful results, and/or
cause unintended consequences such as a decline in environmental quality. To date, no
comprehensive data about CEQA review methods including use of exemptions and streamlining
options has been published.
The Association of Environmental Professionals (AEP), a statewide resource representing
environmental professionals, commissioned this study to answer the following questions:
• How does CEQA review affect overall housing production for both market-rate and
affordable units in California?
• Are available streamlining/exemption methods being used?
• How does CEQA review affect the timing of housing project approvals?
• How could CEQA be further refined to increase both market-rate and affordable housing
production?
Study Methodology
Data on how cities and counties process CEQA housing applications is not readily available
because most jurisdictions do not track this comprehensively, nor are they required to report
this information. The only way to collect this data is to directly survey local jurisdictions.

ii
For this study, a survey was distributed to every city and county in California, totaling 483 cities
and 58 counties.1 Forty-six jurisdictions responded, equivalent to a 9% response rate. The
respondent jurisdictions included 7 of the 10 largest cities in the state, but also covered a wide
swath, including coastal and inland cities, rural and urban, large and small, with varying levels of
development activity and economic conditions. In total, cities and counties responding to this
survey represented about one-third of the state’s population, or 12.4 million residents.
Significantly, these jurisdictions accounted for 40 percent of all residential building permits
issued in California since 2010, and more impressively, 54 percent of all residential building
permits issued for housing projects with five or more units since 2010. This sample represents
the largest inventory of housing project applications and associated CEQA review published to
date and is potentially significant because it reveals how CEQA is being applied to housing
projects in places advancing housing production.
Respondents were asked to count the number of housing projects of five or more units subject
to environmental review between 2015 and 2017 and classify them by the type of review that
was utilized. Respondents were also asked to provide unit counts by review type and
differentiate between market-rate and affordable units. The survey also inquired about average
times to complete different environmental reviews, how many jurisdictions had plans in place to
allow for tiering under Community or Specific Plans, and data on project withdrawals.2 Finally,
the survey closed with opinion questions about how CEQA could be modified and other policy
suggestions to boost housing production.
Summary of Findings
This survey sample provided comprehensive data on all projects of 5+ units in their jurisdiction
under CEQA review between 2015 and 2017. This included a total of 1,417 housing projects
with 5+ units, which in turn contained a total of 144,111 housing units. Of the total, 15,115
housing units (10% of the survey inventory) were categorized as affordable units. The data
collected for this study represents the largest inventory of housing projects and units subject to
CEQA review ever published.
Major survey findings include:
• Streamlining/Exemptions was the predominant type of environmental review used
for housing projects in respondent jurisdictions (42% of projects), followed by
Mitigated Negative Declarations (36% of projects). Only 6% of projects were reviewed
by EIRs.
1 Cities and counties that did not complete the survey cited a lack of resources in collecting data as the main obstacle to responding. 2 Data for this study was self-reported by each jurisdiction’s staff. Data was not independently verified. However, the report authors reviewed all survey responses for mathematical accuracy and discussed discrepancies with respondents to clarify reporting.
iii
o The most frequently used streamlining exemptions were Infill Exemptions, which
accounted for 26% of housing projects.
o Tiering from Specific or Community Plans captured 14% of housing projects.
o The Affordable Housing and Transit exemptions were only modestly utilized.
• EIRs were generally reserved for large projects with potentially the greatest
environmental impacts on a community. The average size of projects that completed EIRs
was 426 units, compared to an average project size of 91 units for MNDs, 119 units for
projects tiering off a Specific or Community Plan, and 37 units for the Infill exemption.
• While most jurisdictions reported having at least one adopted Specific Plan to facilitate
tiered environmental review, more can be done to support tiered CEQA review for
housing production. Of the 46 jurisdictions responding to this question, 27 jurisdictions
reported having adopted one or more Specific or Community Plans that permitted tiering,
but there was a substantial range in terms of the quantity of units in these plans compared to
General Plan residential build-out estimates. Half of respondents reported their Specific
Plans usable for tiering encompassed over half of their General Plan residential buildout,
while the other half reported significantly less overlap. This finding underscores the need for
more state and regional funding to expand specific planning to support this process.
• Affordable units benefited from Streamlining/Other Exemptions to a greater extent
than market-rate units, and most were reviewed by tiering from Specific Plans or using
the Infill Exemption. Just a very small number, 387 of the 15,115 affordable units in the
sample, were reviewed using the Affordable Housing Exemption. Some cities attributed this
to excessive requirements limiting the number of projects that qualify for the Affordable
Housing Exemption, while others cited political pressure to conduct full EIRs even if other
methods could have applied. A comparison of CEQA review by market-rate versus
affordable units indicates that a slightly higher proportion of affordable units (28%) were
subject to EIR review compared to market-rate units (23%).
• Interestingly, CEQA review utilizing full EIRs was proportionately more common in
above-average housing production communities, despite the perception that EIRs
discourage housing production compared to other CEQA review methods. Above-
average production locations also appear to rely more heavily on Mitigated Negative
Declarations than below-average locations, while the below-average production locations
relied more heavily on streamlining. For definitions of above- and below-average production
cities, see Production Index in Chapter 2.
• The time frames for CEQA review (as reported) are relatively limited; the average time
to complete a Negative Declaration was 6 months, followed by 8 months for MNDs, 15
months for EIRs, and 6 months for projects using Streamlining/Exemptions. It should
be noted that these are estimated (and reported) averages. A follow-up study of statistically-

iv
weighted sample projects across California is needed to quantify and verify this much-
debated issue.
• The perceived causal relationship between CEQA review and frequent project
withdrawals may be significantly overstated. Some policy observers have cited
withdrawal of projects during CEQA review as a signal that CEQA discourages project
applicants to the point of ceasing the process of housing development. Respondents were
asked about the number of projects and units withdrawn between 2015 and 2017 and
reasons for withdrawal. In total, there were 51 project withdrawals covering 3,706 units,
equivalent to withdrawal rate of just 2.8 % of total units in the survey sample. These data
suggest that the anecdotes about CEQA causing project withdrawal, while potentially
accurate for a singular high-profile project, do not represent an overall discernable pattern.
Respondents were also asked to assign percentages to a list of withdrawal reasons generally
related to their jurisdiction’s experience. A small fraction of withdrawals was due to
unavoidable environmental impacts (2%). The largest category of withdrawal were
applicant-related such as bankruptcy or change in a project’s characteristics (50% attributed
to developer-related changes).
• The top 3 factors affecting market-rate housing production cited by respondents for
their jurisdiction were high development costs, non-CEQA related neighborhood
opposition, and lack of available sites. CEQA review was selected just 4 times out of the
112 responses received.3
• For factors affecting affordable housing production, the most frequently selected
factors were lack of financing, high development costs, and loss of redevelopment
agencies. For affordable housing, CEQA review was attributed just 2 times out of 124
selections.
• Comments from most respondents (17 out of 30 responses to this item) suggested that
CEQA did not constrain housing in their jurisdiction. Four other respondents had mixed
opinions, citing CEQA mixed with other development challenges and general political and
resident concern. Nine respondents felt that CEQA constrained housing development in
their community, with comments generally stating that CEQA added time and/or cost to the
approval process. These opinions about CEQA and housing production did not seem to
vary by the jurisdiction’s Production Index rating (see Production Index in Chapter 2). In
fact, 11 of the 17 respondents that felt that CEQA did not impact housing production in their
city or county were working in “below average production” jurisdictions, suggesting that
other factors were impacting production in substantial ways.
3 While CEQA review can surface opposition to a project, many other layers of approval heard in public can also engender opposition. The survey question offered a multiple-choice list of answers, including a specific choice about CEQA related opposition, and another choice specifically about non-CEQA related opposition. See Appendix B Question 11 for the question.

v
Suggestions to Improve CEQA for Increased Housing Production
The survey also queried about key changes that could be made to CEQA to further support
housing production. Detailed responses to this question are shown in the body of this report,
and are summarized below:
• Modify CEQA, including expanding infill and affordable housing exemptions, adding more
categorical exemptions for certain housing projects, creating more streamlining exemptions,
simplifying analysis for smaller projects, and limiting timelines for appeals.
• Improve Implementation, including a statewide CEQA Roadshow for training and technical
assistance, promoting greater use of exemptions, provide more funding for Specific Plans to
facilitate streamlining, and eliminating Level of Service (LOS) from CEQA guidelines.
• Simplify Litigation Processes, including creating a dedicated system of judges who work
exclusively on CEQA, expediting litigation, and lowering the legal standard of review for a
defensible document from fair argument to substantial evidence. This category of
suggestions also included requiring project opponents to disclose sources of funding and
shifting burden of court fees so loser pays.
Other Methods to Increase Housing Production (outside of CEQA)
Finally, survey respondents provided suggestions for other ways to boost housing production.
Detailed responses are included in the body of this report, and are summarized below (with
enumerated frequency of same suggestion):
• Frequent responses - bring back Redevelopment (12), streamline entitlement
process/create administrative approvals with codified standards (9), and improve
subsidies for affordable housing (6).
• Less frequent responses - reduce non-CEQA regulations (3), lower impact fees (3),
actively involve community participation/combat misperceptions (3), fund specific plans
(2), and find ways to lower construction costs (2). In addition, the following received 1
mention each: up-zone for housing, expand rent stabilization/just cause eviction
protections statewide, establish state oversight (HCD) of local inclusionary ordinances to
prevent abuses, zone appropriately for housing, make housing projects - regardless of
size - by right in residential zones, eliminate Proposition 13, invest in infrastructure,
develop adaptive reuse ordinances, give jurisdictions the ability to assemble parcels, and
expand state tax credits.
vi
Next Steps
This study presents empirical results about how California cities and counties review housing
applications through CEQA, and provide a large set of data about how various methods of
review are being used. It is time consuming and challenging to collect this data independently
and after-the-fact; it is strongly recommended that the State of California require a single online
reporting mechanism to track how every housing application for new development is reviewed,
as well as the timing of each major step in the review process. Such a mandatory reporting
mechanism would enable statewide analysis of the efficacy of expanding exemptions and
streamlining processes, allowing for further process modifications.
In addition, it is important to note that this study does not fully answer the question of how can
CEQA implementation be improved while still maintaining a consistent system of analysis,
identification, and mitigation of environmental impacts to maintain our statewide environmental
goals. More analysis needs to be done to understand CEQA’s impact at the project level and
specifically, what other factors may be contributing to California’s insufficient levels of new
housing production. For example, an in-depth case study of a sampling of housing project
applications, statistically weighted to reflect size, density, and location, could yield a deeper
understanding of CEQA and non-CEQA related development challenges across the state. This
type of case study, based on a set of unbiased sampling techniques, should also include
documenting the applicant’s story, so that cost and timing factors attributable to CEQA vs. other
pre-development conditions can be better and more thoroughly understood in a way that moves
beyond the worst-case headlines.
~ 1 ~
I. Introduction
Study Purpose
In the past few years, there has been much debate around possible substantial CEQA reform to
support increased housing production in California. Some developers, policymakers and
legislators in California believe that CEQA has negative cost and timing impacts on both market-
rate and affordable housing production, at a time when increased housing supply is so critically
needed. Other CEQA supporters believe that it is critical to assess and mitigate environmental
impacts of housing projects. There is very little empirical data regarding if and how CEQA might
affect housing production, and the degree to which environmental review serves as an
unnecessary constraint to expanding housing supply. The lack of data leaves CEQA open to
calls for “reform,” which in turn may not produce measurable results, and/or cause unintended
consequences such as a decline in environmental quality. The Association of Environmental
Professionals (AEP), as a statewide resource representing the environmental professional
community, commissioned this study to build out better information on this topic.
CEQA’s Historical Relationship to Housing Production
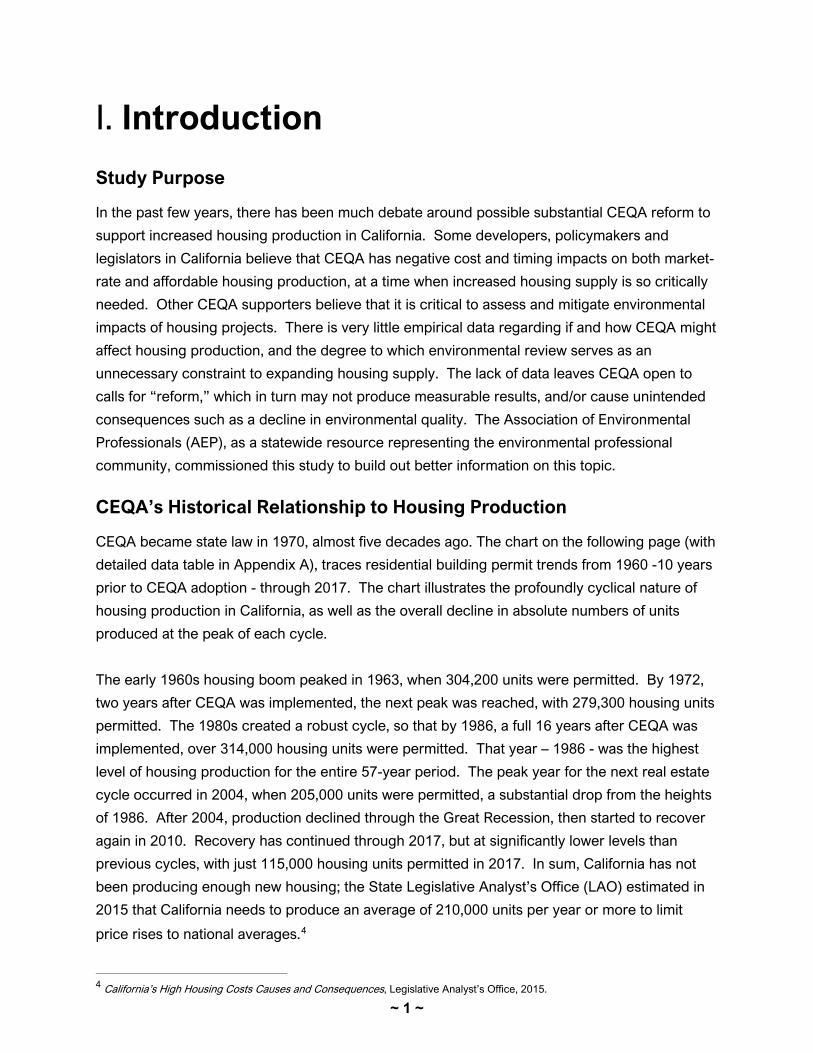
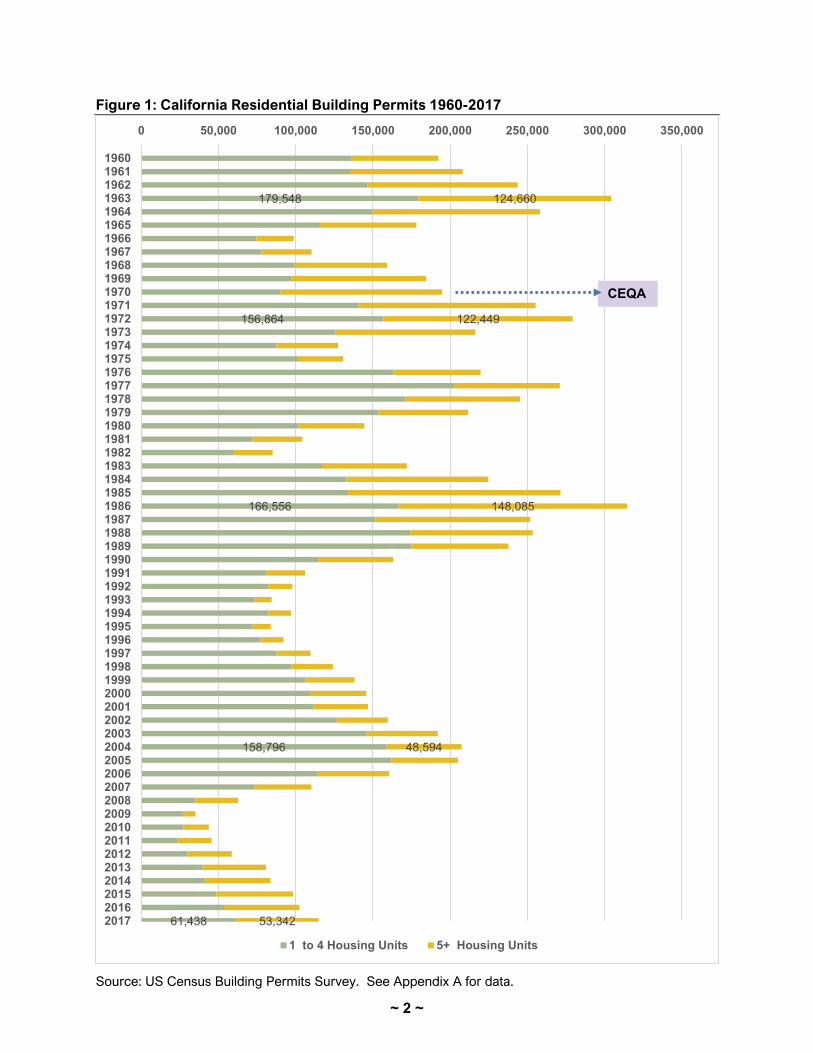
CEQA became state law in 1970, almost five decades ago. The chart on the following page (with
detailed data table in Appendix A), traces residential building permit trends from 1960 -10 years
prior to CEQA adoption - through 2017. The chart illustrates the profoundly cyclical nature of
housing production in California, as well as the overall decline in absolute numbers of units
produced at the peak of each cycle.
The early 1960s housing boom peaked in 1963, when 304,200 units were permitted. By 1972,
two years after CEQA was implemented, the next peak was reached, with 279,300 housing units
permitted. The 1980s created a robust cycle, so that by 1986, a full 16 years after CEQA was
implemented, over 314,000 housing units were permitted. That year – 1986 - was the highest
level of housing production for the entire 57-year period. The peak year for the next real estate
cycle occurred in 2004, when 205,000 units were permitted, a substantial drop from the heights
of 1986. After 2004, production declined through the Great Recession, then started to recover
again in 2010. Recovery has continued through 2017, but at significantly lower levels than
previous cycles, with just 115,000 housing units permitted in 2017. In sum, California has not
been producing enough new housing; the State Legislative Analyst’s Office (LAO) estimated in
2015 that California needs to produce an average of 210,000 units per year or more to limit
price rises to national averages.4
4 California’s High Housing Costs Causes and Consequences, Legislative Analyst’s Office, 2015.
~ 2 ~
Figure 1: California Residential Building Permits 1960-2017
Source: US Census Building Permits Survey. See Appendix A for data.
179,548
156,864
166,556
158,796
61,438
124,660
122,449
148,085
48,594
53,342
0 50,000 100,000 150,000 200,000 250,000 300,000 350,000
1960196119621963196419651966196719681969197019711972197319741975197619771978197919801981198219831984198519861987198819891990199119921993199419951996199719981999200020012002200320042005200620072008200920102011201220132014201520162017
1 to 4 Housing Units 5+ Housing Units
CEQA

~ 3 ~
Summary of Recent Studies
Two recent studies completed within the past 12 months indicate that CEQA does not directly
impact housing production in the ways that some experts have asserted. These two studies are
summarized below:
California Environmental Quality Act (CEQA) Survey (Senate Environmental Quality
Committee, October 2017). This study focuses exclusively on litigation rates for all projects
undergoing CEQA review (e.g., commercial, residential, infrastructure, and other types of
projects subject to CEQA). The study covers the years of FY 2011/12 to FY 2015/16, surveying
94 state agencies (for public projects), and all cities and counties in California. Of the state
agencies, 47 served as lead agency at least once during the period. Very low litigation rates on
CEQA review led by state agencies were observed. For the cities and counties surveyed, only
33 out of 480 governments responded.5 The respondents included 19 local governments with
less than 50,000 population, 6 with 50,000 to 100,000 population, 4 between 100,000 and
300,000, 3 between 300,000 and 500,000, and one city with more than 500,000 but less than
1,000,000 in population (thus excluding San Jose and Los Angeles). None of the responding
cities or counties were identified in the study. Again, the litigation rates on CEQA actions were
observed as very low.
It is important to note that this study does not describe data related directly to housing projects;
its point of view is focused primarily on litigation rates for all projects subject to CEQA.
Getting it Right: Examining the Local Land Use Entitlement Process in California to Inform
Policy and Process (Center for Law, Energy & Environment, UC Berkeley Law, February 2018).
This study closely aligns with AEP’s study focus; it seeks to examine CEQA’s impact on housing
production. For the report, researchers at the Center for Law, Energy & Environment (CLEE),
along with other research Institutes housed at UC Berkeley and Columbia University, analyzed
housing project applications for five northern California cities (e.g., San Francisco, Oakland, San
Jose, Redwood City, and Palo Alto). Projects analyzed by the research were limited to those
with five units or more and under city review during the 2014 – 2016 period. The number of
housing units proposed by the analyzed applications exceeded 27,600 units, with the majority
located in San Francisco or San Jose. The study included 29 interviews with city staff,
consultants, community organizations, and applicants active in the five cities.
The key finding of this study is that while streamlined CEQA review is often used for housing
projects, each city also uses other discretionary land use review of various types, and that these
review processes were the main driver of approval time frames. In other words, CEQA review
5Authors worked with League of California Cities to conduct the local government survey.
~ 4 ~
was not the primary obstacle to entitlement; more than 18,000 of the 27,600 housing units
analyzed had either project-based or tiering-based CEQA exemptions. Instead, the researchers
found that different land use entitlement processes across the cities, and sometimes uneven
interpretations of the same regulation within a city applied to different projects, were the main
drivers of project delay.
Study Methodology
Despite assertions in statewide policy documents that contemporary CEQA review is a major
constraint on new housing production, no comprehensive data about CEQA review methods
including use of exemptions and streamlining options has been published.
This study was formulated to address the following research questions:
• How does CEQA review affect overall housing production for both market-rate and
affordable units in California?
• Are available streamlining/exemption methods being used?
• How does CEQA review affect the timing of housing project approvals?
• How could CEQA be further refined to increase both market-rate and affordable housing
production?
Obtaining sufficient data to empirically analyze and answer the above questions is challenging;
some cities and counties in California have robust databases of housing project applications,
type and status of CEQA review (and other project review processes), and outcomes for each
project application. Other jurisdictions do not keep robust databases this way, while still others
may have data maintained in multiple databases across several departments or divisions. 6
To analyze how CEQA impacts housing production in California, therefore, requires extensive
data collection. For this report, this meant conducting a survey of every city and county in
California. The following survey methodology was used:
• The survey was formulated by The Housing Workshop and reviewed by AEP’s
Legislative Subcommittee (see list of members in Appendix C). The survey was also
pre-tested by several staff members at the City of San Francisco and revised based on
their input. The survey instrument is provided in Appendix B of this report.
• The survey was posted online, with an email invitation containing the survey link sent to
one staff member of each of the 541 cities and counties in California. Target recipients
6 This study relies on data that was self-reported by each responding jurisdiction. Data provided was not independently verified. However, the report authors reviewed all survey responses for mathematical accuracy and discussed discrepancies with respondents to clarify reporting.

~ 5 ~
were a combination of AEP members working as staff in the public sector (which
represents roughly 115 of the 541 jurisdictions), supplemented by compilation of a
contact list through internet website research to identify the likely staff person
responsible for environmental review.
• Email invitations were sent in March 2018 followed by a reminder email invitation in April
2018, and a second reminder email in early May 2018 to the full list of 541 jurisdictions.
• To boost participation further, The Housing Workshop then directly contacted (by phone
or email or both), the top 50 largest cities plus about 20 other rapidly developing
jurisdictions, multiple times over the following two months. The Housing Workshop also
conducted follow up with respondents, some of whom were not able to initially provide
all information requested but were interested in participating. The Housing Workshop
also directly sorted and cleaned raw databases for two jurisdictions who did have the
data but lacked the staff capacity in-house to query databases. This data support
provided by the report authors was then reviewed and verified by each of the two cities.
Report Organization
The following report presents an overview of jurisdictions responding to the survey in Chapter 2,
the survey data and related findings in Chapter 3, a summary of “opinion” questions in Chapter
4, and suggestions for further research in Chapter 5. Appendix A provides additional detailed
data tables, Appendix B presents the survey instrument, and Appendix C describes the
consultant team.
~ 6 ~
2. Overview of Survey Respondents
Summary of Respondents
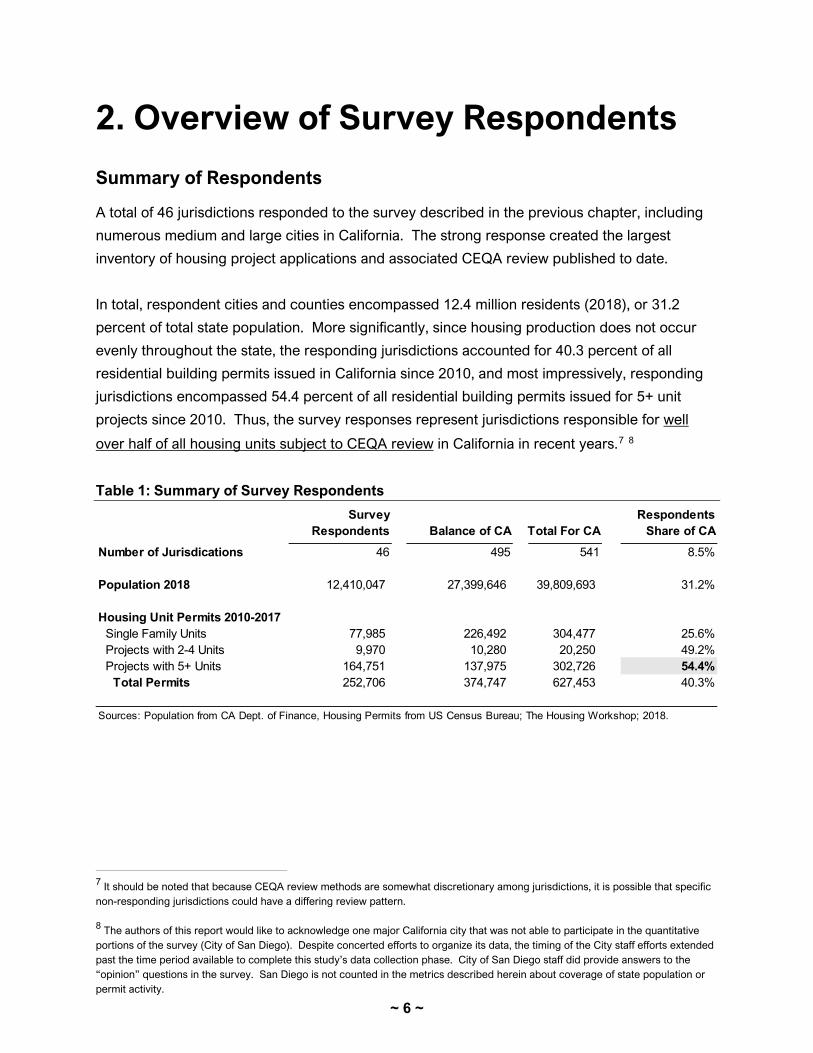
A total of 46 jurisdictions responded to the survey described in the previous chapter, including
numerous medium and large cities in California. The strong response created the largest
inventory of housing project applications and associated CEQA review published to date.
In total, respondent cities and counties encompassed 12.4 million residents (2018), or 31.2
percent of total state population. More significantly, since housing production does not occur
evenly throughout the state, the responding jurisdictions accounted for 40.3 percent of all
residential building permits issued in California since 2010, and most impressively, responding
jurisdictions encompassed 54.4 percent of all residential building permits issued for 5+ unit
projects since 2010. Thus, the survey responses represent jurisdictions responsible for well
over half of all housing units subject to CEQA review in California in recent years.7 8
Table 1: Summary of Survey Respondents
7 It should be noted that because CEQA review methods are somewhat discretionary among jurisdictions, it is possible that specific non-responding jurisdictions could have a differing review pattern. 8 The authors of this report would like to acknowledge one major California city that was not able to participate in the quantitative portions of the survey (City of San Diego). Despite concerted efforts to organize its data, the timing of the City staff efforts extended past the time period available to complete this study’s data collection phase. City of San Diego staff did provide answers to the “opinion” questions in the survey. San Diego is not counted in the metrics described herein about coverage of state population or permit activity.
Survey Respondents Balance of CA Total For CA
Respondents Share of CA
Number of Jurisdications 46 495 541 8.5%
Population 2018 12,410,047 27,399,646 39,809,693 31.2%
Housing Unit Permits 2010-2017Single Family Units 77,985 226,492 304,477 25.6%Projects with 2-4 Units 9,970 10,280 20,250 49.2%Projects with 5+ Units 164,751 137,975 302,726 54.4%
Total Permits 252,706 374,747 627,453 40.3%
Sources: Population from CA Dept. of Finance, Housing Permits from US Census Bureau; The Housing Workshop; 2018.
~ 7 ~
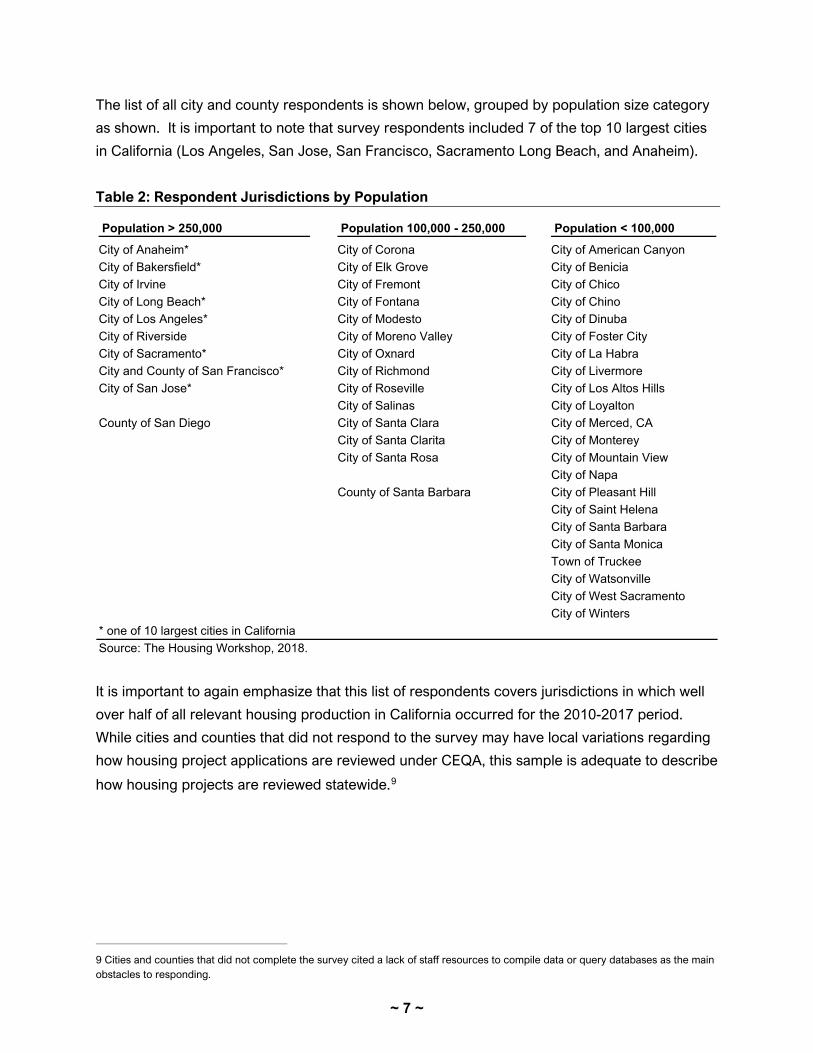
The list of all city and county respondents is shown below, grouped by population size category
as shown. It is important to note that survey respondents included 7 of the top 10 largest cities
in California (Los Angeles, San Jose, San Francisco, Sacramento Long Beach, and Anaheim).
Table 2: Respondent Jurisdictions by Population
It is important to again emphasize that this list of respondents covers jurisdictions in which well
over half of all relevant housing production in California occurred for the 2010-2017 period.
While cities and counties that did not respond to the survey may have local variations regarding
how housing project applications are reviewed under CEQA, this sample is adequate to describe
how housing projects are reviewed statewide.9
9 Cities and counties that did not complete the survey cited a lack of staff resources to compile data or query databases as the main obstacles to responding.
Population > 250,000 Population 100,000 - 250,000 Population < 100,000 City of Anaheim* City of Corona City of American CanyonCity of Bakersfield* City of Elk Grove City of BeniciaCity of Irvine City of Fremont City of ChicoCity of Long Beach* City of Fontana City of ChinoCity of Los Angeles* City of Modesto City of DinubaCity of Riverside City of Moreno Valley City of Foster CityCity of Sacramento* City of Oxnard City of La HabraCity and County of San Francisco* City of Richmond City of LivermoreCity of San Jose* City of Roseville City of Los Altos Hills
City of Salinas City of LoyaltonCounty of San Diego City of Santa Clara City of Merced, CA
City of Santa Clarita City of MontereyCity of Santa Rosa City of Mountain View
City of NapaCounty of Santa Barbara City of Pleasant Hill
City of Saint HelenaCity of Santa BarbaraCity of Santa MonicaTown of TruckeeCity of WatsonvilleCity of West SacramentoCity of Winters
* one of 10 largest cities in CaliforniaSource: The Housing Workshop, 2018.
~ 8 ~
Housing Production Index
In California, not every jurisdiction experiences housing development at the same pace: some
cities and counties add housing units in greater magnitude than others at any given point in
time, due to a range of factors such as the strength of the underlying economy, available land
supply, strong local demand, local policies favoring growth, etc. To measure this aspect of each
respondent’s housing unit growth, each respondent was analyzed and ranked regarding its
relative housing unit growth relative to the state average overall. The metric used, called the
“housing production index,” compares the number of new housing units permitted between
2010 and 2017 to the 2010 baseline number of existing households (which is equivalent to
occupied housing units). This approach factors out vacant standing inventory of housing units.
Expressed as a percentage (residential building permits issued between 2010 and 2017 as a
percent of baseline 2010 households), each jurisdiction was then compared to the State of
California’s overall housing production level of 5.0 percent (number of residential permits issued
statewide between 2010 and 2017 as a percent of baseline state households in 2010). Those
jurisdictions with a lower production index than the State, were deemed “below-average
production” jurisdictions, and those above the State level were deemed “above-average
production.”
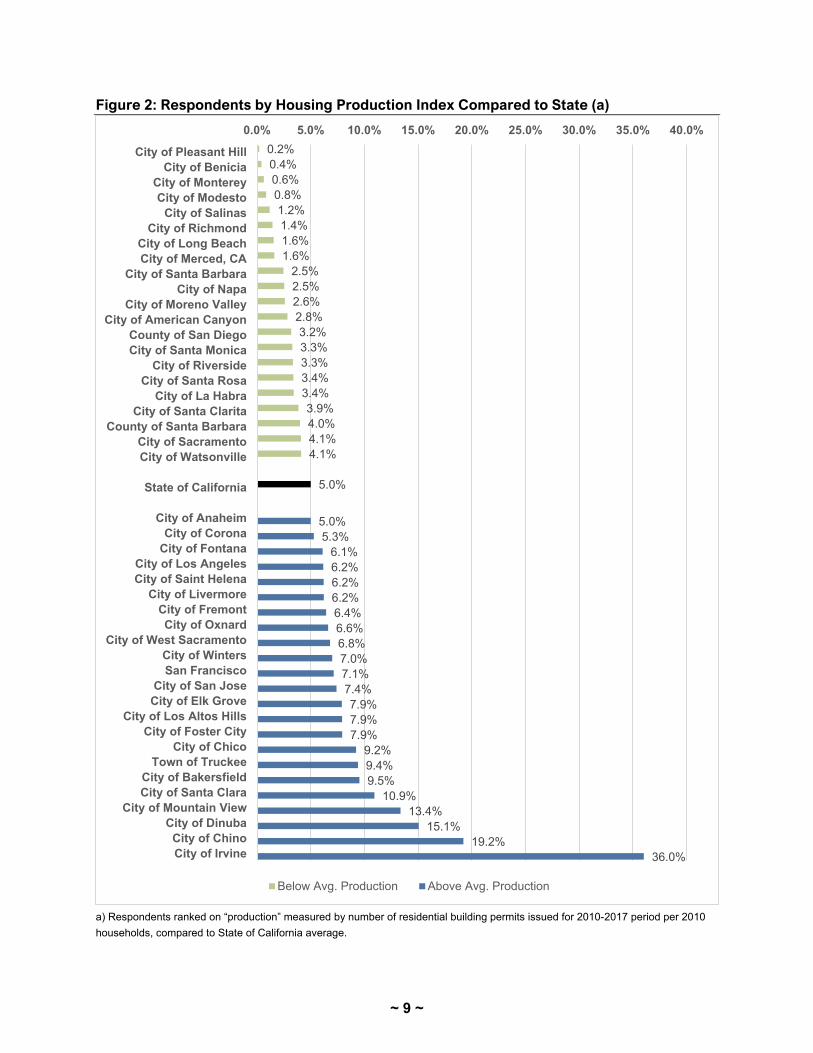
The figure on the next page shows the survey respondents’ housing production index and
corresponding categorizations related to housing unit production. Production indices ranged
from a low of 0.2 percent (City of Pleasant Hill), to 36.0 percent (City of Irvine). Respondent
communities are generally well-distributed between below-average (22 jurisdictions) and above-
average production (24 jurisdictions).
This categorization by housing production relative to the State of California is utilized later in this
report, as one way to explore CEQA review for housing projects.
~ 9 ~
Figure 2: Respondents by Housing Production Index Compared to State (a)
a) Respondents ranked on “production” measured by number of residential building permits issued for 2010-2017 period per 2010 households, compared to State of California average.
0.2%0.4%0.6%0.8%1.2%1.4%1.6%1.6%
2.5%2.5%2.6%2.8%3.2%3.3%3.3%3.4%3.4%3.9%4.0%4.1%4.1%
5.0%
5.0%5.3%
6.1%6.2%6.2%6.2%6.4%6.6%6.8%7.0%7.1%7.4%7.9%7.9%7.9%
9.2%9.4%9.5%
10.9%13.4%
15.1%19.2%
36.0%
0.0% 5.0% 10.0% 15.0% 20.0% 25.0% 30.0% 35.0% 40.0%
City of Pleasant HillCity of Benicia
City of MontereyCity of Modesto
City of SalinasCity of Richmond
City of Long BeachCity of Merced, CA
City of Santa BarbaraCity of Napa
City of Moreno ValleyCity of American Canyon
County of San DiegoCity of Santa Monica
City of RiversideCity of Santa Rosa
City of La HabraCity of Santa Clarita
County of Santa BarbaraCity of SacramentoCity of Watsonville
State of California
City of AnaheimCity of Corona
City of FontanaCity of Los AngelesCity of Saint Helena
City of LivermoreCity of FremontCity of Oxnard
City of West SacramentoCity of WintersSan Francisco
City of San JoseCity of Elk Grove
City of Los Altos HillsCity of Foster City
City of ChicoTown of Truckee
City of BakersfieldCity of Santa Clara
City of Mountain ViewCity of Dinuba
City of ChinoCity of Irvine
Below Avg. Production Above Avg. Production

~ 10 ~
3. Survey Results
CEQA Review of Housing Projects and Units
The table below summarizes the survey results regarding respondent jurisdictions’ methods of
CEQA review for all 5+ unit housing project applications received between 2015 and 2017. As
shown, the survey covers 1,417 projects containing 144,111 housing units.
Table 3: Survey Data for All 5+ Housing Project Applications 2015-2017
AverageNumber Percent Number Percent Project Size.
EIR 79 5.6% 33,651 23.4% 426 Mitigated Negative Declaration 508 35.9% 46,162 32.0% 91 Negative Declaration 12 0.8% 1,512 1.0% 126 Categorical Exemption (a) 126 8.9% 6,024 4.2% 48 Statutory Exemption (b) 5 0.4% 180 0.1% 36 Streamlining and Other Exemptions 600 42.3% 39,603 27.5% 66
Tiering from Specific or Community Plans (c) 195 13.8% 23,227 16.1% 119 Affordable Housing Exemption (d) 6 0.4% 459 0.3% 77 Infill Exemption (e) 361 25.5% 13,444 9.3% 37 Transit Priority Project Exemption (f) 38 2.7% 2,473 1.7% 65
Other (g) 87 6.1% 16,979 11.8% 195
Total 1,417 100.0% 144,111 100.0% 102
a) CEQA Guidelines §15301-15333b) CEQA Guidelines §15260-15285c) CEQA Guidelines §15183 and §15152; Govt Code §65457d) CA Govt Code §15194)e) CEQA Guidelines §15332 and §15183.3; PRC §21094.5)f) PRC §21155.1g) "Otjher" includes addendas to previous EIRs.Data collected by online survey + follow up, March - August 2018.
Source: The Housing Workshop, 2018.
All Projects All Units

~ 11 ~
Review by Number of Units
The figure below illustrates the general category of environmental review applied to the total
units contained in the survey data. The largest category of environmental review in terms of
units was Mitigated Negative Declaration (MND), used to review over 46,000 of the 144,000
units in the sample. The next most-utilized review method was one of the various forms of
streamlining allowed through a collection of Government Code sections and CEQA Guidelines.
The third largest category, EIR review, covered 33,700 of the units in the sample (just under a
quarter of total units). Categorical exemptions and “other” methods (such as EIR addendums),
were used less frequently, and Negative Declarations and Statutory Exemptions constituted
small components.
Figure 3: Number of Housing Units by Type of CEQA Review 2015-2017
“Streamlining/Other Exemptions” refers to: CP/SP Exemption CEQA Guidelines 15183 and 15152 / Govt Code 65457; Affordable Housing Streamlining Exemption govt Code 15194; Infill Exemption CEQA Guidelines 15332 and 15183.3 / PRC 21094.5; and Transit Priority Project PRC 21155.1. “Other” includes addendums to previous EIRs. Source: The Housing Workshop, 2018.
33,651
46,162
1,512 6,024
180
39,603
16,979
- 5,000
10,000 15,000 20,000 25,000 30,000 35,000 40,000 45,000 50,000
EIR MitigatedNegative
Declaration
NegativeDeclaration
CategoricalExemption
StatutoryExemption
Streamliningand Other
Exemptions
Other
Total Units = 144,111
~ 12 ~
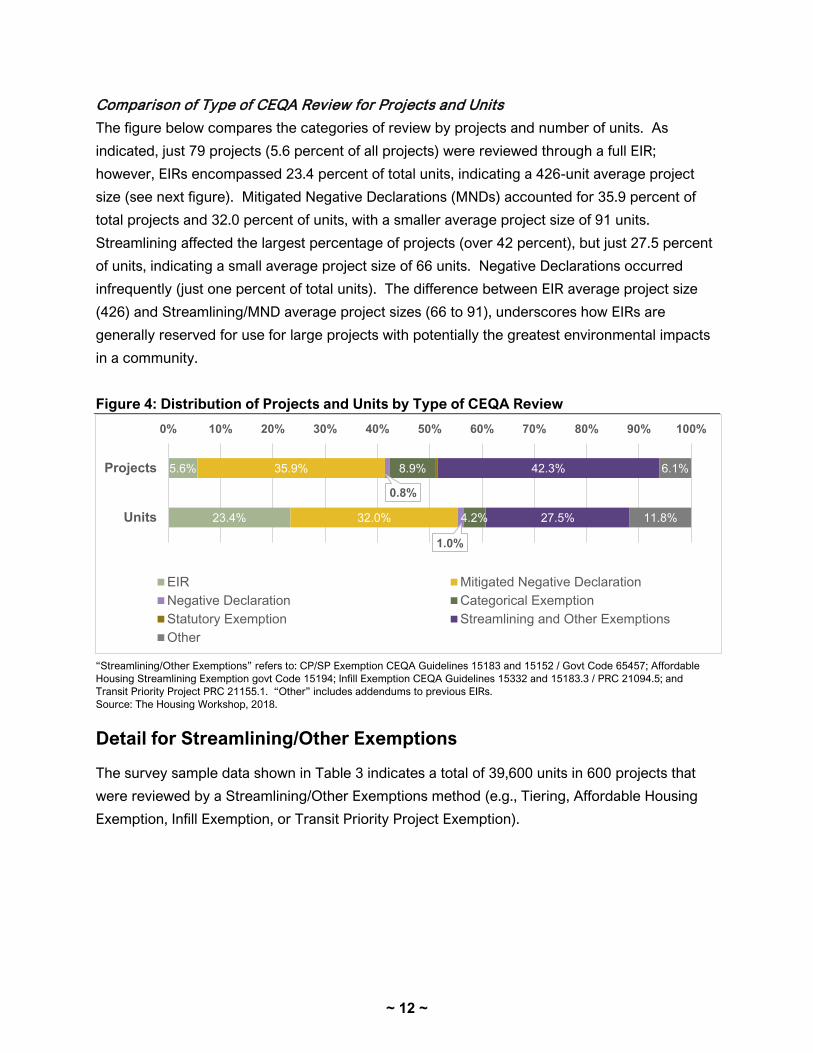
Comparison of Type of CEQA Review for Projects and Units
The figure below compares the categories of review by projects and number of units. As
indicated, just 79 projects (5.6 percent of all projects) were reviewed through a full EIR;
however, EIRs encompassed 23.4 percent of total units, indicating a 426-unit average project
size (see next figure). Mitigated Negative Declarations (MNDs) accounted for 35.9 percent of
total projects and 32.0 percent of units, with a smaller average project size of 91 units.
Streamlining affected the largest percentage of projects (over 42 percent), but just 27.5 percent
of units, indicating a small average project size of 66 units. Negative Declarations occurred
infrequently (just one percent of total units). The difference between EIR average project size
(426) and Streamlining/MND average project sizes (66 to 91), underscores how EIRs are
generally reserved for use for large projects with potentially the greatest environmental impacts
in a community.
Figure 4: Distribution of Projects and Units by Type of CEQA Review
“Streamlining/Other Exemptions” refers to: CP/SP Exemption CEQA Guidelines 15183 and 15152 / Govt Code 65457; Affordable Housing Streamlining Exemption govt Code 15194; Infill Exemption CEQA Guidelines 15332 and 15183.3 / PRC 21094.5; and Transit Priority Project PRC 21155.1. “Other” includes addendums to previous EIRs. Source: The Housing Workshop, 2018.
Detail for Streamlining/Other Exemptions
The survey sample data shown in Table 3 indicates a total of 39,600 units in 600 projects that
were reviewed by a Streamlining/Other Exemptions method (e.g., Tiering, Affordable Housing
Exemption, Infill Exemption, or Transit Priority Project Exemption).
5.6%
23.4%
35.9%
32.0%
0.8%
1.0%
8.9%
4.2%
42.3%
27.5%
6.1%
11.8%
0% 10% 20% 30% 40% 50% 60% 70% 80% 90% 100%
Projects
Units
EIR Mitigated Negative DeclarationNegative Declaration Categorical ExemptionStatutory Exemption Streamlining and Other ExemptionsOther
~ 13 ~
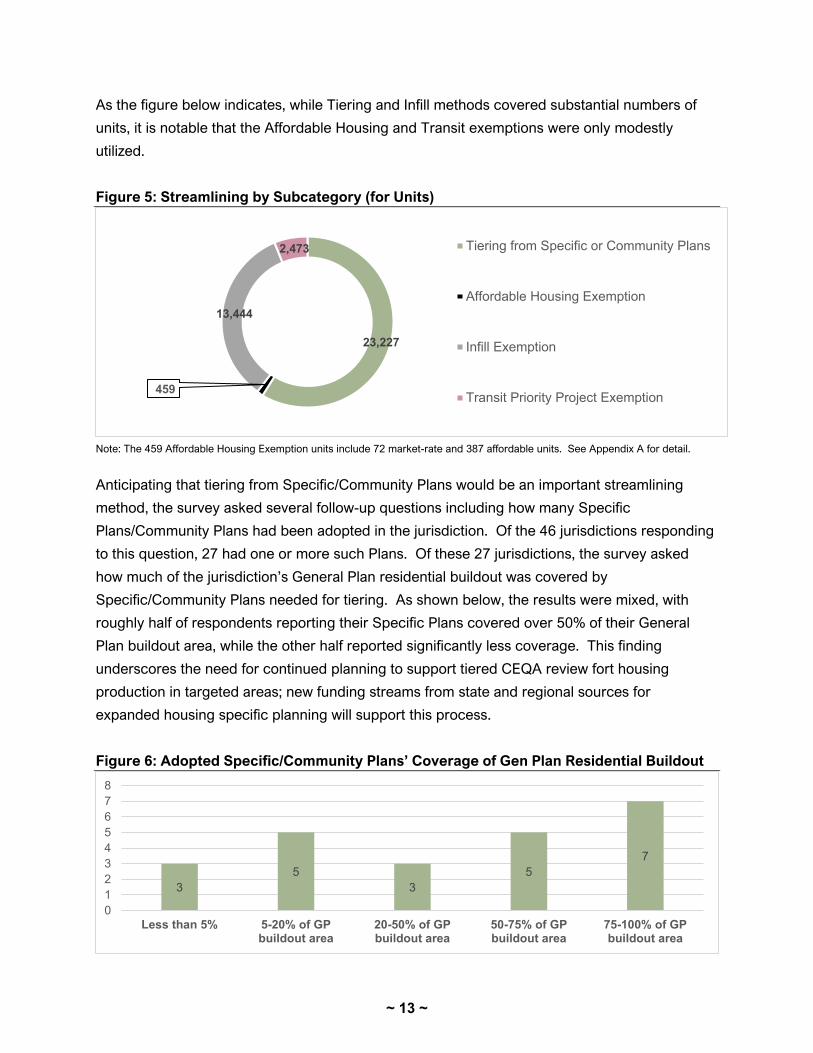
As the figure below indicates, while Tiering and Infill methods covered substantial numbers of
units, it is notable that the Affordable Housing and Transit exemptions were only modestly
utilized.
Figure 5: Streamlining by Subcategory (for Units)
Note: The 459 Affordable Housing Exemption units include 72 market-rate and 387 affordable units. See Appendix A for detail.
Anticipating that tiering from Specific/Community Plans would be an important streamlining
method, the survey asked several follow-up questions including how many Specific
Plans/Community Plans had been adopted in the jurisdiction. Of the 46 jurisdictions responding
to this question, 27 had one or more such Plans. Of these 27 jurisdictions, the survey asked
how much of the jurisdiction’s General Plan residential buildout was covered by
Specific/Community Plans needed for tiering. As shown below, the results were mixed, with
roughly half of respondents reporting their Specific Plans covered over 50% of their General
Plan buildout area, while the other half reported significantly less coverage. This finding
underscores the need for continued planning to support tiered CEQA review fort housing
production in targeted areas; new funding streams from state and regional sources for
expanded housing specific planning will support this process.
Figure 6: Adopted Specific/Community Plans’ Coverage of Gen Plan Residential Buildout
23,227
459
13,444
2,473 Tiering from Specific or Community Plans
Affordable Housing Exemption
Infill Exemption
Transit Priority Project Exemption
35
35
7
012345678
Less than 5% 5-20% of GPbuildout area
20-50% of GPbuildout area
50-75% of GPbuildout area
75-100% of GPbuildout area

~ 14 ~
CEQA Review for Market-Rate vs. Affordable Housing Units
One of the factors that can impact how a housing project is reviewed under CEQA is its status
as a market-rate or affordable project. In particular, aside from the Affordable Housing
Streamlining Exemption (CA Government Code 15194), which limits eligible projects based on
size and location criteria, the analysis for this report explores if affordable housing projects are
treated differently than market-rate projects.
As shown below (see detail in Appendix A), a comparison of CEQA review by market-rate
versus affordable projects on a unit count basis indicates that the market-rate unit inventory of
almost 129,000 units had a smaller proportion subject to EIR review than the proportion of
affordable units. This same pattern held in the utilization of Mitigated Negative Declaration
(MND, typically a quicker and less costly process than EIRs); a greater proportion of market-rate
units than affordable units had the benefit of MND review. However, affordable units benefited
from Streamlining/Other Exemptions to a greater extent than market-rate units, but most of
these approaches were through tiering from Specific Plans or using the Infill Exemption. Just a
very small number, 387 of the 15,115 affordable units in the sample, were reviewed using the
Affordable Housing Exemption; this finding is explored in more depth later in this report.10
Figure 7: CEQA Review of Market-Rate and Affordable Units
10 Note that 439 units were reviewed using the Affordable Housing Exemption, including 387 actual affordable units and 42 market-rate units (presumably in eligible projects).
22.8%
28.0%
32.8%
25.7%
26.7%
34.3%
12.3%
7.4%
1.1%
0.5%
4.2%
4.0%
0% 10% 20% 30% 40% 50% 60% 70% 80% 90% 100%
Market-Rate Units
Affordable Units
EIR Mitigated Negative Declaration
Statutory Exemption Streamlining and Other Exemptions
Other Negative Declaration
Categorical Exemption
~ 15 ~
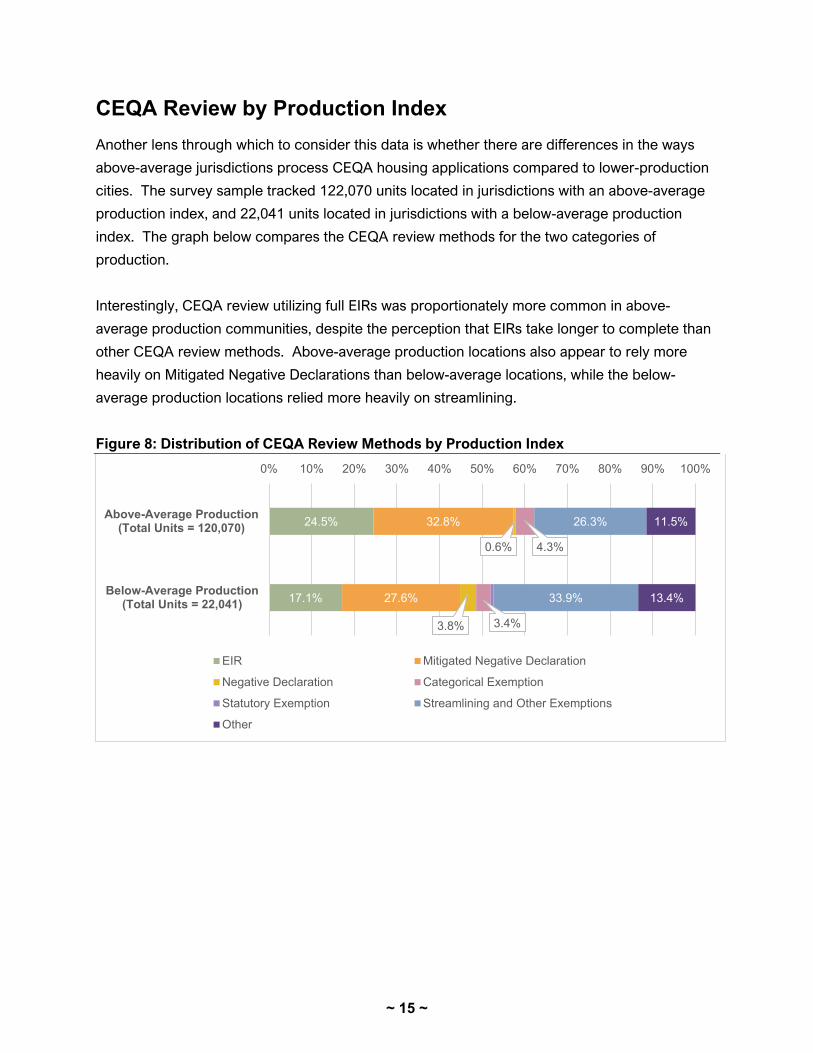
CEQA Review by Production Index Another lens through which to consider this data is whether there are differences in the ways
above-average jurisdictions process CEQA housing applications compared to lower-production
cities. The survey sample tracked 122,070 units located in jurisdictions with an above-average
production index, and 22,041 units located in jurisdictions with a below-average production
index. The graph below compares the CEQA review methods for the two categories of
production.
Interestingly, CEQA review utilizing full EIRs was proportionately more common in above-
average production communities, despite the perception that EIRs take longer to complete than
other CEQA review methods. Above-average production locations also appear to rely more
heavily on Mitigated Negative Declarations than below-average locations, while the below-
average production locations relied more heavily on streamlining.
Figure 8: Distribution of CEQA Review Methods by Production Index
24.5%
17.1%
32.8%
27.6%
0.6%
3.8%
4.3%
3.4%
26.3%
33.9%
11.5%
13.4%
0% 10% 20% 30% 40% 50% 60% 70% 80% 90% 100%
Above-Average Production(Total Units = 120,070)
Below-Average Production(Total Units = 22,041)
EIR Mitigated Negative Declaration
Negative Declaration Categorical Exemption
Statutory Exemption Streamlining and Other Exemptions
Other

~ 16 ~
Projects Withdrawn from CEQA Review Some policy observers have cited withdrawal of projects during CEQA review as a signal that
CEQA discourages project applicants to the point of ceasing the process of housing
development. Survey respondents were asked several questions about the rate of project
withdrawal (including units in these withdrawn projects), and reasons for the withdrawal.
The tables below summarize the survey results. As indicated, Los Angeles had a notably high
number of reported project withdrawals during the three-year study period and is therefore
shown separately for comparison. In total, for all jurisdictions reporting, there were 51 project
withdrawals with 3,706 units, or a withdrawal rate of 2.8 percent of total units in the survey
sample. These data suggest that the anecdotes about CEQA causing project withdrawal, while
possibly accurate for a singular high-profile project, do not represent an overall discernable
pattern.
Table 4: Project Application Withdrawals
Respondents were also asked to assign percentages to a list of withdrawal reasons generally
related to their jurisdiction’s experience. As shown below, just a small fraction of withdrawals
are due to unavoidable environmental impacts. The largest category of withdrawal reasons was
developer-related (e.g., bankruptcy, change in business model, etc.).
Table 5: Reasons for Project Withdrawal from CEQA Review
Projects Units Projects Units Projects UnitsWithdrawn, 2015-2017 30 1,932 21 1,774 51 3,706Completed CEQA Review 2015-2017 658 45,736 697 88,525 1,355 134,261Withdrawal Rate 4.6% 4.2% 3.0% 2.0% 3.8% 2.8%
a) Los Angeles is shown separately due to an unusually high rate of project withdrawal.b) Three cities did not provide withdrawal data for this survey: County of San Diego, City of San Jose, and the City of Chino. Five cities did not provide environmental review data: Bakersfield, Benicia, Elk Grove, Loyalton, San Diego County. Adjustments were made to the data so the numerator and denominator were comparable.
Source: The Housing Workshop, 2018.
TotalLos Angeles (a) All Other Jurisdictions (b)
PercentUnavoidable Adverse Environmental Impacts 2%Public or other opposition arising through CEQA 16%Non-CEQA related opposition 10%Developer-related reasons (e.g., bankruptcy, change in business model, etc. 50%Other reasons 22%
Total 100%
Notes:Excludes Los Angeles (did not answer the question).Source: The Housing Workshop, 2018.

~ 17 ~
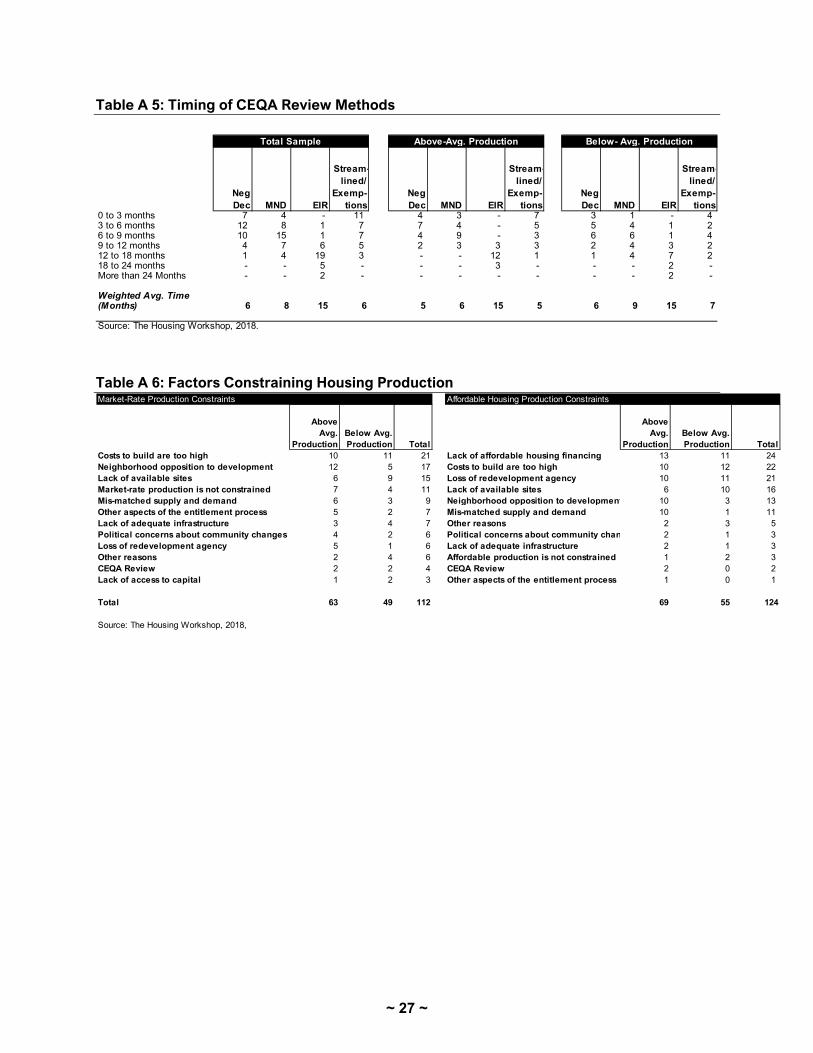
Timing of CEQA Review Methods
The survey included a question regarding the average time the jurisdiction spent on each type
of CEQA review. As shown below (data table in Appendix A), the average time for Negative
Declarations was 6 months, but when segregated by Production Index, the above-average
jurisdictions reported an average Negative Declaration time of 5 months. Similar patterns were
reported for each type of review; Mitigated Negative Declarations (MNDs) and streamlined
review occurred more quickly, on average, in the above-average production jurisdictions.
It should be noted that the California Legislative Analyst’s Office (LAO) found “…review of
CEQA documents submitted to the state by California’s ten largest cites between 2004-2013
indicates that local agencies took, on average, around two and a half years to approve housing
projects that required an EIR.” 11 That finding differs from this survey, which finds an average of
15 months. The LAO report appears to be describing the total approval process for these
projects (not just the EIR portion) and does not provide supporting data.
Figure 9: Average Time to Complete Each Environmental Review Type
11 See page 18, California’s High Housing Costs Causes and Consequences, Legislative Analyst’s Office, 2015
6
8
15
65
6
15
56
9
15
7
0
2
4
6
8
10
12
14
16
Neg
Dec
MN
D EIR
Stre
am-
lined
/Ex
emp-
tions
Neg
Dec
MN
D EIR
Stre
am-
lined
/Ex
emp-
tions
Neg
Dec
MN
D EIR
Stre
am-
lined
/Ex
emp-
tions
Total Sample Above-Avg. Production Below- Avg. Production
Mon
ths

~ 18 ~
13
10
10
6
10
10
2
2
2
1
2
1
11
12
11
10
3
1
3
1
1
2
0 5 10 15 20 25
Lack of affordablehousing financing
Costs to build are toohigh
Loss of redevelopmentagency
Lack of available sites
Neighborhoodopposition to…
Mis-matched supply anddemand
Other reasons
Political concerns aboutcommunity changes
Lack of adequateinfrastructure
Affordable production isnot constrained
CEQA Review
Other aspects of theentitlement process
Affordable Housing Production
Above Avg.Production Below Avg. Production
4. Opinions: CEQA & Housing
Factors Constraining Housing Production
The survey included a series of opinion questions posed to respondents (who were either senior
staff responsible for environmental review and/or long-range planning). First, a pair of multiple-
choice questions asked respondents to select up to the top 3 factors affecting market-rate
housing production in the respondent’s jurisdiction, and separately, asking for the top 3 factors
affecting affordable housing production in their jurisdiction. As shown below, the most
frequently-selected factors constraining market-rate housing production were high development
cost, neighborhood opposition, and lack of available sites. CEQA review was selected just 4
times out of the 112 responses selected. For affordable housing production, most frequently
selected factors included lack of financing, high development costs, and loss of redevelopment
agencies; for this type of housing, CEQA review was attributed just 2 times out of 124 selections.
Table 6: Factors Constraining Market-Rate and Affordable Housing Production
10
12
6
7
6
5
3
4
5
2
2
1
11
5
9
4
3
2
4
2
1
4
2
2
0 5 10 15 20 25
Costs to build are toohigh
Neighborhoodopposition to…
Lack of available sites
Market-rate production isnot constrained
Mis-matched supply anddemand
Other aspects of theentitlement process
Lack of adequateinfrastructure
Political concerns aboutcommunity changes
Loss of redevelopmentagency
Other reasons
CEQA Review
Lack of access to capital
Market-Rate Housing Production
Above Avg.Production Below Avg. Production
~ 19 ~
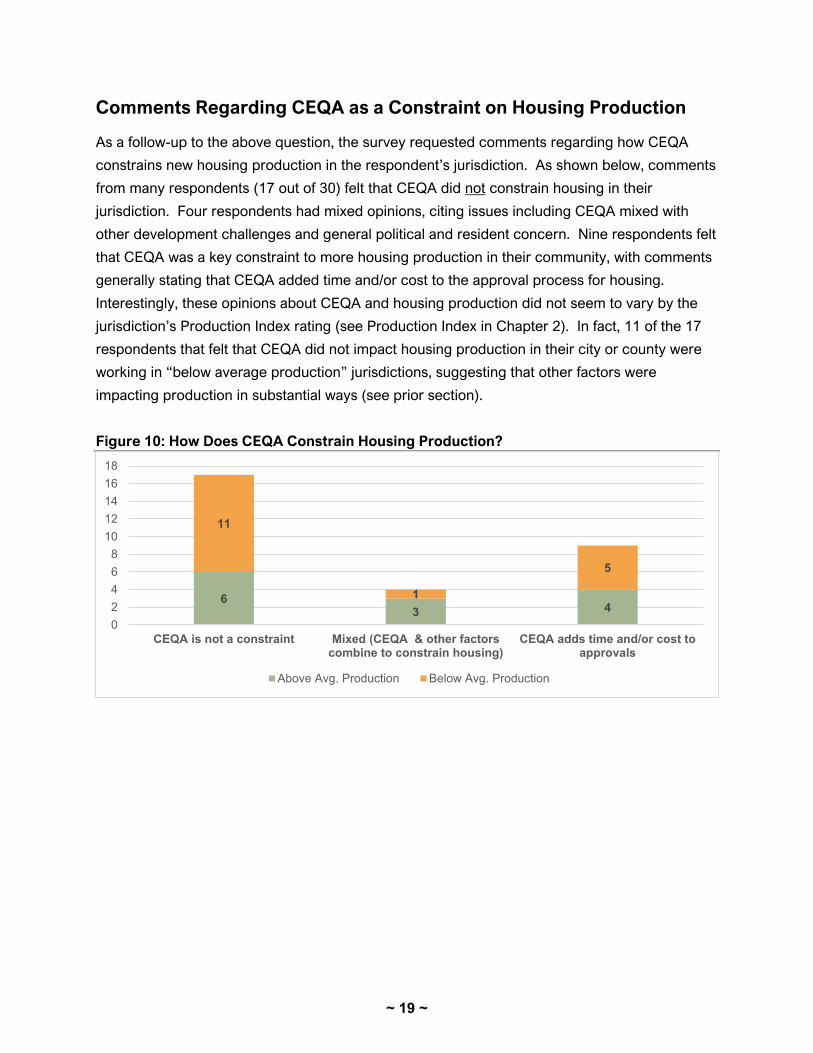
Comments Regarding CEQA as a Constraint on Housing Production
As a follow-up to the above question, the survey requested comments regarding how CEQA
constrains new housing production in the respondent’s jurisdiction. As shown below, comments
from many respondents (17 out of 30) felt that CEQA did not constrain housing in their
jurisdiction. Four respondents had mixed opinions, citing issues including CEQA mixed with
other development challenges and general political and resident concern. Nine respondents felt
that CEQA was a key constraint to more housing production in their community, with comments
generally stating that CEQA added time and/or cost to the approval process for housing.
Interestingly, these opinions about CEQA and housing production did not seem to vary by the
jurisdiction’s Production Index rating (see Production Index in Chapter 2). In fact, 11 of the 17
respondents that felt that CEQA did not impact housing production in their city or county were
working in “below average production” jurisdictions, suggesting that other factors were
impacting production in substantial ways (see prior section).
Figure 10: How Does CEQA Constrain Housing Production?
63 4
11
1
5
02468
1012141618
CEQA is not a constraint Mixed (CEQA & other factorscombine to constrain housing)
CEQA adds time and/or cost toapprovals
Above Avg. Production Below Avg. Production
~ 20 ~
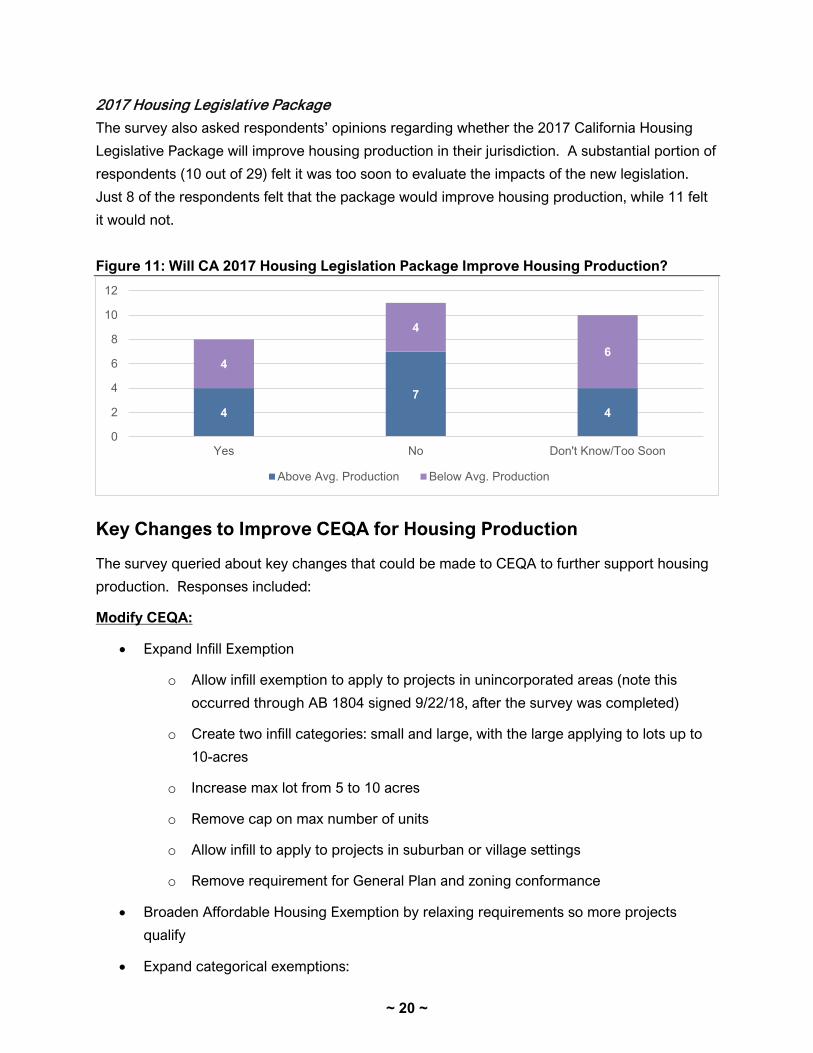
2017 Housing Legislative Package
The survey also asked respondents’ opinions regarding whether the 2017 California Housing
Legislative Package will improve housing production in their jurisdiction. A substantial portion of
respondents (10 out of 29) felt it was too soon to evaluate the impacts of the new legislation.
Just 8 of the respondents felt that the package would improve housing production, while 11 felt
it would not.
Figure 11: Will CA 2017 Housing Legislation Package Improve Housing Production?
Key Changes to Improve CEQA for Housing Production
The survey queried about key changes that could be made to CEQA to further support housing
production. Responses included:
Modify CEQA:
• Expand Infill Exemption
o Allow infill exemption to apply to projects in unincorporated areas (note this
occurred through AB 1804 signed 9/22/18, after the survey was completed)
o Create two infill categories: small and large, with the large applying to lots up to
10-acres
o Increase max lot from 5 to 10 acres
o Remove cap on max number of units
o Allow infill to apply to projects in suburban or village settings
o Remove requirement for General Plan and zoning conformance
• Broaden Affordable Housing Exemption by relaxing requirements so more projects
qualify
• Expand categorical exemptions:
47
4
4
4
6
0
2
4
6
8
10
12
Yes No Don't Know/Too Soon
Above Avg. Production Below Avg. Production

~ 21 ~
o Create a categorical exemption for stand-alone multi-family housing projects on
adopted housing element land use inventory sites zoned for multi-family
residential use by right consistent with CA Government Code Section 65580
o Create a categorical exemption for affordable housing projects
• Create more Streamlining Exemptions: exempt high-density housing in dense areas;
exempt housing projects in zones designated for residential; exempt sites in the Housing
Element not needing a General Plan/zoning change
• Simplify Small Projects Analysis by eliminating Caltrans traffic study for weaving and
merging on smaller projects.
• Mandate timelines for review / reduce time limits for appeals
• Lower legal standard of review for a defensible document from fair argument to
substantial evidence
• Change cumulative impact analysis for individual projects
Improve Implementation:
• OPR staff should create a CEQA Roadshow for training and provide technical assistance
to cities and counties on streamlining tools, when they apply, standard for review, and
how to use them.
• Promote greater use of exemptions, including infill exemptions to shorten the process
(responds to cities who said during interviews that they don’t always use streamlining
even if available due to concern the environmental review will not be thorough enough)
• Provide more funding for the creation of specific plans
• Eliminate Level of Services (LOS) from CEQA Guidelines
Simplify Litigation Processes:
• Create a dedicated system of judges who work exclusively on CEQA cases with a
streamlined process
• Expedite litigation: provide legislation to expedite cases similar to streamlining judicial
review pursuant to AB 900 by making the requirements to certify and maintain
certifications less burdensome
• Require opposition to disclose who is funding litigation
• Shift court fees so loser pays
• Reduce opportunities for lawsuits

~ 22 ~
Other Non-CEQA Changes to Improve Housing Production
Finally, the survey asked respondents to provide suggestions to increase housing production
outside of the CEQA process. Responses included:
• Bring back redevelopment (12 mentions)
• Streamline entitlement process (6 mentions)
• Create funding and improve subsidies for affordable housing (6 mentions)
• Enhance by-right approvals by shifting to codified objective and quantitative standards that can be administered ministerially (5 mentions)
• Further ways to allow administrative approval of housing projects (4 mentions)
• Lower development/impact fees (3 mentions)
• Invest in the creation of specific plans (2 mentions)
• Lower constraints to higher-density housing (e.g. min parking ratios) (2 mentions)
• Actively involve community participation (2 mentions)
• Find ways to lower construction costs (2 mentions)
• Up-zone for housing in area plans or other efforts that include a robust community benefits package (1 mention)
• Expand rent stabilization and just cause eviction protections in local jurisdictions and statewide (1 mention)
• Expand or establish state oversight (HCD) of local inclusionary ordinances to prevent jurisdictions from using them as a veiled means of slowing or preventing housing development (1 mention)
• Zone appropriately for housing (1 mention)
• Make housing projects, regardless of size, by right in residential zones (1 mention)
• Eliminate Proposition 13 (1 mention)
• Invest in infrastructure (1 mention)
• Combat public misconceptions about affordable housing (1 mention)
• Develop adaptive reuse ordinances (1 mention)
• Reduce regulations (1 mention)
• Give jurisdictions the ability to assemble parcels (1 mention)
• Create a state tax credit (similar to the 9% LIHTC) to finance affordable housing (1 mention)

~ 23 ~
Appendix A: Data Tables
~ 24 ~
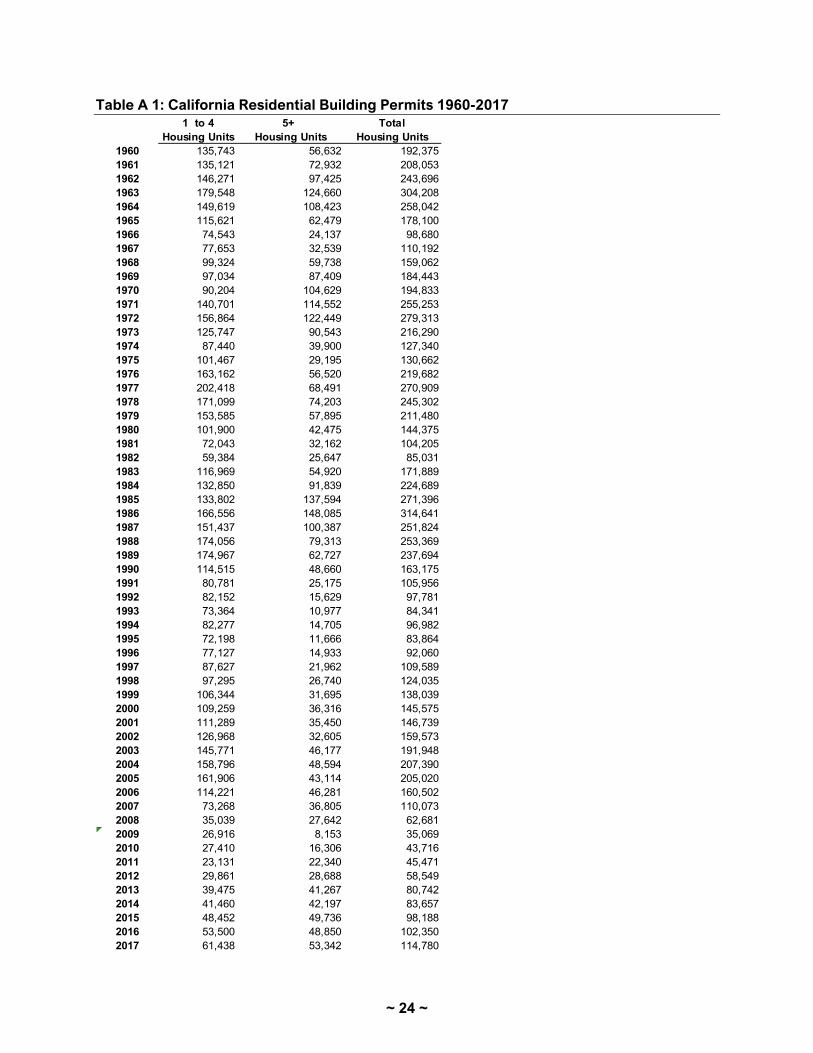
Table A 1: California Residential Building Permits 1960-2017
1 to 4 5+ TotalHousing Units Housing Units Housing Units
1960 135,743 56,632 192,3751961 135,121 72,932 208,0531962 146,271 97,425 243,6961963 179,548 124,660 304,2081964 149,619 108,423 258,0421965 115,621 62,479 178,1001966 74,543 24,137 98,6801967 77,653 32,539 110,1921968 99,324 59,738 159,0621969 97,034 87,409 184,4431970 90,204 104,629 194,8331971 140,701 114,552 255,2531972 156,864 122,449 279,3131973 125,747 90,543 216,2901974 87,440 39,900 127,3401975 101,467 29,195 130,6621976 163,162 56,520 219,6821977 202,418 68,491 270,9091978 171,099 74,203 245,3021979 153,585 57,895 211,4801980 101,900 42,475 144,3751981 72,043 32,162 104,2051982 59,384 25,647 85,0311983 116,969 54,920 171,8891984 132,850 91,839 224,6891985 133,802 137,594 271,3961986 166,556 148,085 314,6411987 151,437 100,387 251,8241988 174,056 79,313 253,3691989 174,967 62,727 237,6941990 114,515 48,660 163,1751991 80,781 25,175 105,9561992 82,152 15,629 97,7811993 73,364 10,977 84,3411994 82,277 14,705 96,9821995 72,198 11,666 83,8641996 77,127 14,933 92,0601997 87,627 21,962 109,5891998 97,295 26,740 124,0351999 106,344 31,695 138,0392000 109,259 36,316 145,5752001 111,289 35,450 146,7392002 126,968 32,605 159,5732003 145,771 46,177 191,9482004 158,796 48,594 207,3902005 161,906 43,114 205,0202006 114,221 46,281 160,5022007 73,268 36,805 110,0732008 35,039 27,642 62,6812009 26,916 8,153 35,0692010 27,410 16,306 43,7162011 23,131 22,340 45,4712012 29,861 28,688 58,5492013 39,475 41,267 80,7422014 41,460 42,197 83,6572015 48,452 49,736 98,1882016 53,500 48,850 102,3502017 61,438 53,342 114,780

~ 25 ~
Table A 2: Respondents by Production Index Ranking (a)
a) Production Index based on residential building permits issued 2010 – 2017 as percentage of “baseline” 2010
number of households in each jurisdiction.
Note: City of Loyalton does not have production index due to extremely small size (population of 700 residents)
and non-reporting of building permits.
Sources: US Census 2010, and US Census Residential Building Permits 2010 – 2017; The Housing Workshop, 2018.
Below Avg. Production Production Index Above Avg. Production Production IndexCity of Pleasant Hill 0.2% City of Anaheim 5.0%City of Benicia 0.4% City of Corona 5.3%City of Monterey 0.6% City of Fontana 6.1%City of Modesto 0.8% City of Los Angeles 6.2%City of Salinas 1.2% City of Saint Helena 6.2%City of Richmond 1.4% City of Livermore 6.2%City of Long Beach 1.6% City of Fremont 6.4%City of Merced, CA 1.6% City of Oxnard 6.6%City of Santa Barbara 2.5% City of West Sacramento 6.8%City of Napa 2.5% City of Winters 7.0%City of Moreno Valley 2.6% San Francisco 7.1%City of American Canyon 2.8% City of San Jose 7.4%County of San Diego 3.2% City of Elk Grove 7.9%City of Santa Monica 3.3% City of Los Altos Hills 7.9%City of Riverside 3.3% City of Foster City 7.9%City of Santa Rosa 3.4% City of Chico 9.2%City of La Habra 3.4% Town of Truckee 9.4%City of Santa Clarita 3.9% City of Bakersfield 9.5%County of Santa Barbara 4.0% City of Santa Clara 10.9%City of Sacramento 4.1% City of Mountain View 13.4%City of Watsonville 4.1% City of Dinuba 15.1%City of Loyalton N/A City of Chino 19.2%
City of Irvine 36.0%State of California 5.0%
) R d k d “ d i ” d b b f id i l b ildi i
~ 26 ~
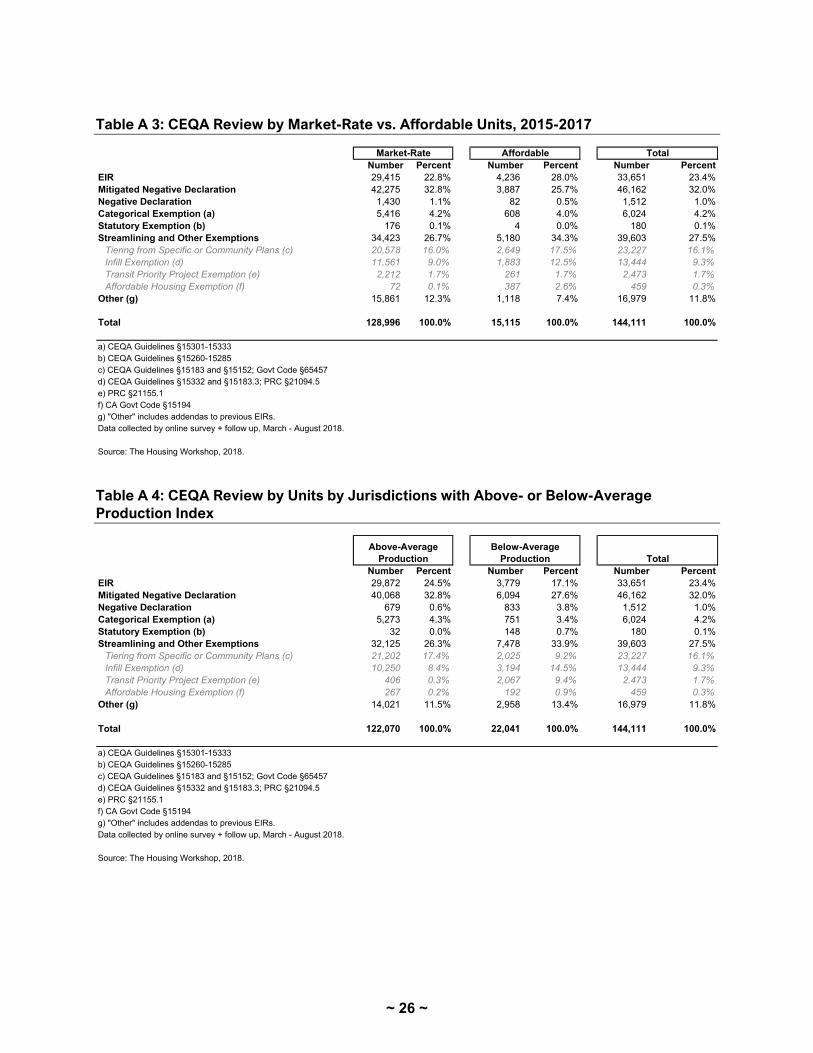
Table A 3: CEQA Review by Market-Rate vs. Affordable Units, 2015-2017
Table A 4: CEQA Review by Units by Jurisdictions with Above- or Below-Average Production Index
Number Percent Number Percent Number PercentEIR 29,415 22.8% 4,236 28.0% 33,651 23.4%Mitigated Negative Declaration 42,275 32.8% 3,887 25.7% 46,162 32.0%Negative Declaration 1,430 1.1% 82 0.5% 1,512 1.0%Categorical Exemption (a) 5,416 4.2% 608 4.0% 6,024 4.2%Statutory Exemption (b) 176 0.1% 4 0.0% 180 0.1%Streamlining and Other Exemptions 34,423 26.7% 5,180 34.3% 39,603 27.5%
Tiering from Specific or Community Plans (c) 20,578 16.0% 2,649 17.5% 23,227 16.1%Infill Exemption (d) 11,561 9.0% 1,883 12.5% 13,444 9.3%Transit Priority Project Exemption (e) 2,212 1.7% 261 1.7% 2,473 1.7%Affordable Housing Exemption (f) 72 0.1% 387 2.6% 459 0.3%
Other (g) 15,861 12.3% 1,118 7.4% 16,979 11.8%
Total 128,996 100.0% 15,115 100.0% 144,111 100.0%
a) CEQA Guidelines §15301-15333b) CEQA Guidelines §15260-15285c) CEQA Guidelines §15183 and §15152; Govt Code §65457d) CEQA Guidelines §15332 and §15183.3; PRC §21094.5e) PRC §21155.1f) CA Govt Code §15194g) "Other" includes addendas to previous EIRs.Data collected by online survey + follow up, March - August 2018.
Source: The Housing Workshop, 2018.
Market-Rate Affordable Total
Number Percent Number Percent Number PercentEIR 29,872 24.5% 3,779 17.1% 33,651 23.4%Mitigated Negative Declaration 40,068 32.8% 6,094 27.6% 46,162 32.0%Negative Declaration 679 0.6% 833 3.8% 1,512 1.0%Categorical Exemption (a) 5,273 4.3% 751 3.4% 6,024 4.2%Statutory Exemption (b) 32 0.0% 148 0.7% 180 0.1%Streamlining and Other Exemptions 32,125 26.3% 7,478 33.9% 39,603 27.5%
Tiering from Specific or Community Plans (c) 21,202 17.4% 2,025 9.2% 23,227 16.1%Infill Exemption (d) 10,250 8.4% 3,194 14.5% 13,444 9.3%Transit Priority Project Exemption (e) 406 0.3% 2,067 9.4% 2,473 1.7%Affordable Housing Exemption (f) 267 0.2% 192 0.9% 459 0.3%
Other (g) 14,021 11.5% 2,958 13.4% 16,979 11.8%
Total 122,070 100.0% 22,041 100.0% 144,111 100.0%
a) CEQA Guidelines §15301-15333b) CEQA Guidelines §15260-15285c) CEQA Guidelines §15183 and §15152; Govt Code §65457d) CEQA Guidelines §15332 and §15183.3; PRC §21094.5e) PRC §21155.1f) CA Govt Code §15194g) "Other" includes addendas to previous EIRs.Data collected by online survey + follow up, March - August 2018.
Source: The Housing Workshop, 2018.
Above-Average Production
Below-Average Production Total
~ 27 ~
Table A 5: Timing of CEQA Review Methods
Table A 6: Factors Constraining Housing Production
Neg Dec MND EIR
Stream-lined/
Exemp-tions
Neg Dec MND EIR
Stream-lined/
Exemp-tions
Neg Dec MND EIR
Stream-lined/
Exemp-tions
0 to 3 months 7 4 - 11 4 3 - 7 3 1 - 4 3 to 6 months 12 8 1 7 7 4 - 5 5 4 1 2 6 to 9 months 10 15 1 7 4 9 - 3 6 6 1 4 9 to 12 months 4 7 6 5 2 3 3 3 2 4 3 2 12 to 18 months 1 4 19 3 - - 12 1 1 4 7 2 18 to 24 months - - 5 - - - 3 - - - 2 - More than 24 Months - - 2 - - - - - - - 2 -
Weighted Avg. Time(Months) 6 8 15 6 5 6 15 5 6 9 15 7
Source: The Housing Workshop, 2018.
Total Sample Above-Avg. Production Below- Avg. Production
Above Avg.
ProductionBelow Avg. Production Total
Above Avg.
ProductionBelow Avg. Production Total
Costs to build are too high 10 11 21 Lack of affordable housing financing 13 11 24 Neighborhood opposition to development 12 5 17 Costs to build are too high 10 12 22 Lack of available sites 6 9 15 Loss of redevelopment agency 10 11 21 Market-rate production is not constrained 7 4 11 Lack of available sites 6 10 16 Mis-matched supply and demand 6 3 9 Neighborhood opposition to development 10 3 13 Other aspects of the entitlement process 5 2 7 Mis-matched supply and demand 10 1 11 Lack of adequate infrastructure 3 4 7 Other reasons 2 3 5 Political concerns about community changes 4 2 6 Political concerns about community chan 2 1 3 Loss of redevelopment agency 5 1 6 Lack of adequate infrastructure 2 1 3 Other reasons 2 4 6 Affordable production is not constrained 1 2 3 CEQA Review 2 2 4 CEQA Review 2 0 2 Lack of access to capital 1 2 3 Other aspects of the entitlement process 1 0 1
Total 63 49 112 69 55 124
Source: The Housing Workshop, 2018,
Market-Rate Production Constraints Affordable Housing Production Constraints

~ 28 ~
Appendix B: Survey Instrument Introduction This survey is part of a study commissioned by the Association of Environmental Professionals (AEP). This survey is designed to collect quantitative data from your jurisdiction to analyze how CEQA affects housing project approvals and production. This important topic, while garnering a lot of media attention, has not been empirically analyzed across the state of California until now. Please help AEP collect data by providing information on your community. We will keep your information anonymous in publication, by grouping responses by population size of jurisdiction to the extent possible. AEP is interested in collecting information about housing projects with 5 or more units (both market rate and affordable housing). We strongly encourage you to print out the PDF version of the same survey, which was attached to the email to use as a guide. Please review the
PDF so you can see the kind of data we are requesting. You may find it easier to answer some questions on paper first. When you are ready, enter
the information in the following online survey pages. Once you begin the online survey, there is a tool at the upper right-hand corner to "Save and
Continue" this survey later. If you need to pause while responding, please follow the online steps to obtain a link to be able to return later to the
same survey. Please also note: if you have data you can share, but do not have the resources to query your databases, please contact AEP’s research team, and we can conduct that analysis directly as needed. Thanks so much! Lynne C Bynder, CMP Executive Director Association of Environmental Professionals Research Team If you have technical questions about the survey, please contact: Janet Smith-Heimer and Jessica Hitchcock The Housing Workshop [email protected]
~ 29 ~
Respondent Information
1) Name of Respondent: ______________________________________________
Title of Respondent: ______________________________________________ City or County: ______________________________________________ Department: ______________________________________________ Housing Production
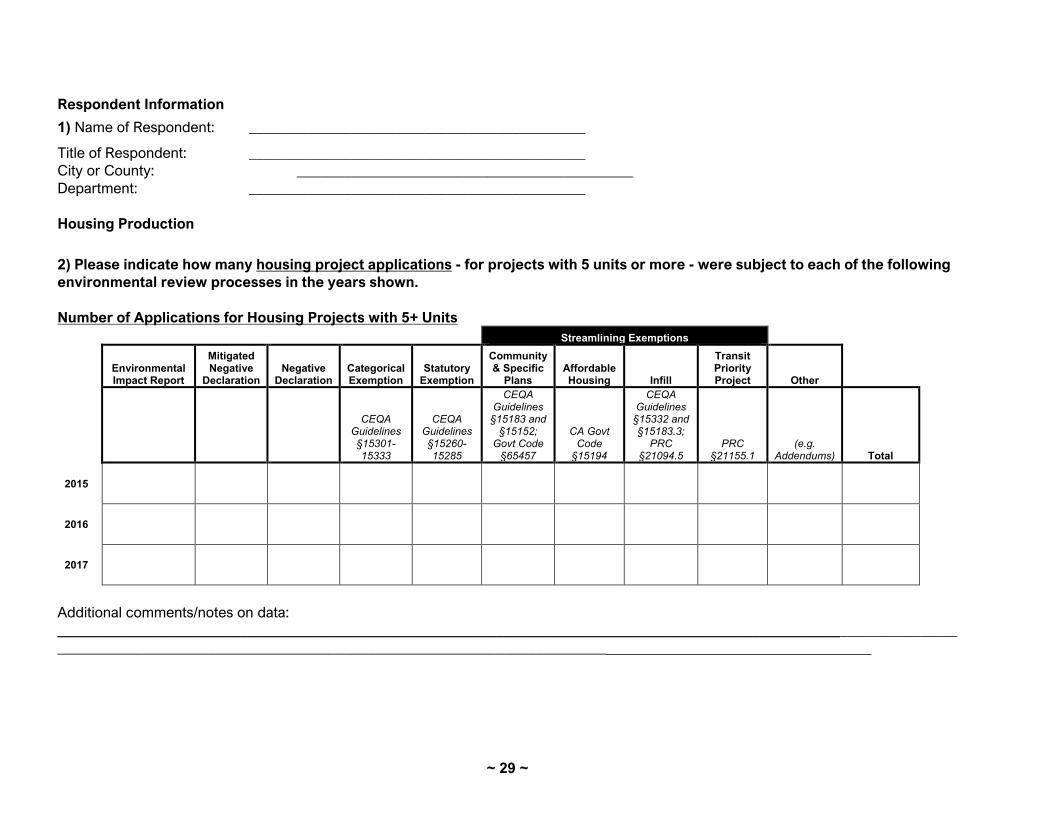
2) Please indicate how many housing project applications - for projects with 5 units or more - were subject to each of the following environmental review processes in the years shown. Number of Applications for Housing Projects with 5+ Units
Streamlining Exemptions
Environmental Impact Report
Mitigated Negative
Declaration Negative
Declaration Categorical Exemption
Statutory Exemption
Community & Specific
Plans Affordable Housing Infill
Transit Priority Project Other
CEQA Guidelines §15301-15333
CEQA Guidelines §15260-15285
CEQA Guidelines §15183 and
§15152; Govt Code
§65457
CA Govt Code
§15194
CEQA Guidelines §15332 and §15183.3;
PRC §21094.5
PRC §21155.1
(e.g. Addendums) Total
2015
2016
2017
Additional comments/notes on data: ______________________________________________________________________________________________________________________________________________________________________________________________________

~ 30 ~
3) For the projects identified in Question 2, please indicate the number of market-rate and affordable housing units contained within those projects. Affordable housing refers to income-restricted housing serving very-low through moderate-income households. (Fill in all relevant cells; for mixed-income projects, please separate market-rate and affordable units)
a. Number of Market-Rate Housing Units
Streamlining Exemptions
Environmental Impact Report
Mitigated Negative
Declaration Negative
Declaration Categorical Exemption
Statutory Exemption
Community & Specific
Plan Affordable Housing Infill
Transit Priority Project Other
CEQA Guidelines §15301-15333
CEQA Guidelines §15260-15285
CEQA Guidelines §15183 and
§15152; Govt Code
§65457
CA Govt Code
§15194
CEQA Guidelines §15332 and §15183.3;
PRC §21094.5
PRC §21155.1
(e.g. Addendums) Total
2015
2016
2017
b. Number of Affordable Housing Units
Streamlining Exemptions
Environmental Impact Report
Mitigated Negative
Declaration Negative
Declaration Categorical Exemption
Statutory Exemption
Community & Specific
Plan Affordable Housing Infill
Transit Priority Project Other
CEQA Guidelines §15301-15333
CEQA Guidelines §15260-15285
CEQA Guidelines §15183 and
§15152; Govt Code
§65457
CA Govt Code
§15194
CEQA Guidelines §15332 and §15183.3;
PRC §21094.5
PRC §21155.1
(e.g. Addendums) Total
2015
2016
2017

~ 31 ~
Additional comments/notes on data:

~ 32 ~
4-7) Please estimate the typical or average time to complete each type of environmental review (i.e. from initial application to final action) in your jurisdiction for housing projects of five units or more. (Select one answer for each environmental review type).
Negative Declaration Mitigated Negative Declaration Environmental Impact Report Streamlined Exemptions __ 0 to 3 months __ 0 to 3 months __ 0 to 3 months __ 0 to 3 months __ 3 to 6 months __ 3 to 6 months __ 3 to 6 months __ 3 to 6 months __ 6 to 9 months __ 6 to 9 months __ 6 to 9 months __ 6 to 9 months __ 9 to 12 months __ 9 to 12 months __ 9 to 12 months __ 9 to 12 months __ 12 to 18 months __ 12 to 18 months __ 12 to 18 months __ 12 to 18 months __ 18 months to 2 years __ 18 months to 2 years __ 18 months to 2 years __ 18 months to 2 years __ More than 2 years __ More than 2 years __ More than 2 years __ More than 2 years __ Not Available __ Not Available __ Not Available __ Not Available
8) Some stakeholders argue that CEQA is used intentionally to kill housing projects. This study seeks to measure this premise. First, we will ask you how many projects and units were completely withdrawn, and then, we will ask for reasons for withdrawal, to track primary reasons for these events.
Between 2015 and 2017, please estimate the number of housing projects and units (both market-rate and affordable) where developers withdrew their projects completely due to CEQA? (Please provide figures below; if zero, please enter zero and proceed to the next question. Please do not count projects that were delayed or slowed down but not clearly dead. For mixed-income projects, please separate these in the Housing Units cells, if possible).
Market-Rate Affordable Total
Number of Housing Projects Withdrawn (2015-2017)
Number of Housing Units Withdrawn (2015-2017)
If housing projects were withdrawn, please estimate the percent of Total Units withdrawn by primary reason (fill in percentages)
Reason Withdrawn Percent of Total Units
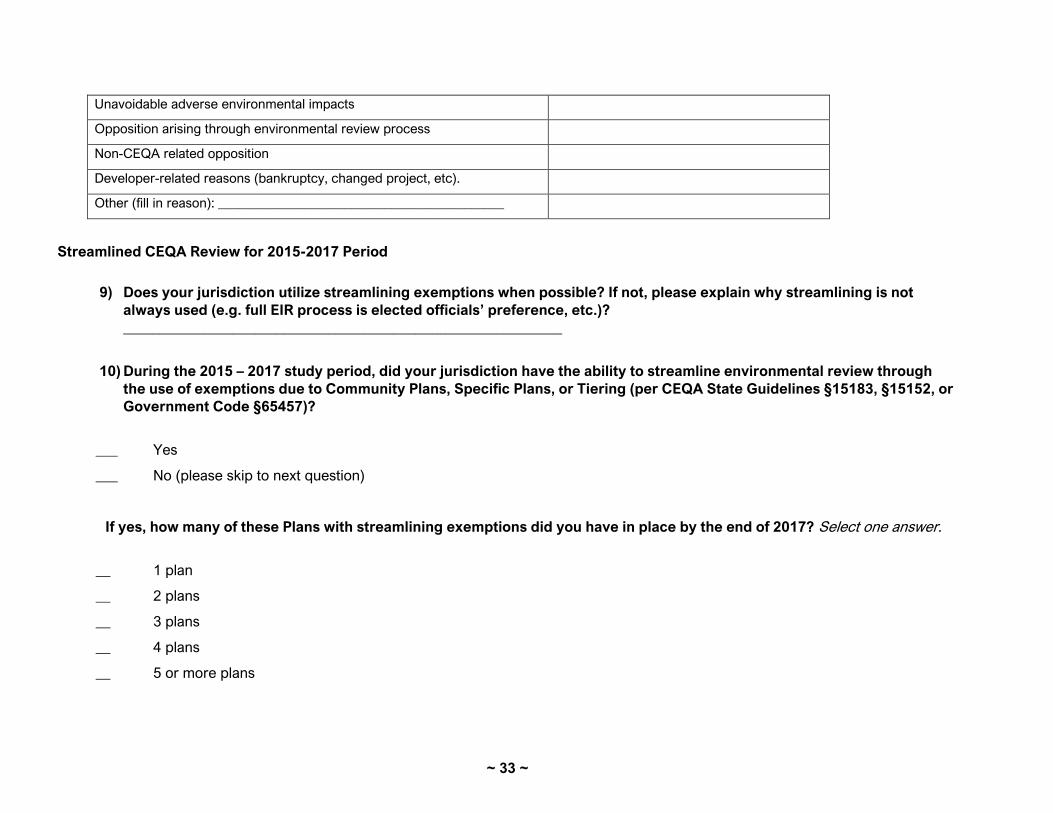
~ 33 ~
Unavoidable adverse environmental impacts
Opposition arising through environmental review process
Non-CEQA related opposition
Developer-related reasons (bankruptcy, changed project, etc).
Other (fill in reason): ___________________________________________
Streamlined CEQA Review for 2015-2017 Period
9) Does your jurisdiction utilize streamlining exemptions when possible? If not, please explain why streamlining is not
always used (e.g. full EIR process is elected officials’ preference, etc.)? ____________________________________________________________
10) During the 2015 – 2017 study period, did your jurisdiction have the ability to streamline environmental review through the use of exemptions due to Community Plans, Specific Plans, or Tiering (per CEQA State Guidelines §15183, §15152, or Government Code §65457)?
___ Yes
___ No (please skip to next question)
If yes, how many of these Plans with streamlining exemptions did you have in place by the end of 2017? Select one answer.
__ 1 plan
__ 2 plans
__ 3 plans
__ 4 plans
__ 5 or more plans

~ 34 ~
About how much (percentage) of your General Plan’s housing buildout potential (e.g., future housing production) is covered by Community Plans (CPs) or Specific Plans (SPs) allowing for streamlined CEQA review? Select one answer.
____ Less than 5% of our General Plan housing buildout is located in CP/SPs ____ 5% to 20% of our General Plan housing buildout is located in CP/SPs ____ 20% to 50% of our General Plan housing buildout is located in CP/SPs ____ 50% to 75% of our General Plan housing buildout is located in CP/SPs ____ 75% to 100% of our General Plan housing buildout is located in CP/SPs

~ 35 ~
Opinion Questions
11) For your jurisdiction, what are the top 3 reasons that market-rate housing production is constrained? Please select up to 3
reasons
__ Lack of available sites
__ Costs to build are too high (land, labor, materials, impact fees)
___ Mis-matched supply and demand (e.g., developers only proposing luxury housing, etc.)
__ The CEQA environmental review process
__ Other aspects of the entitlement process (non-CEQA related)
__ Neighborhood opposition to new development
__ Political concerns about changes to the community
__ Loss of Redevelopment Agency (which had powers to assemble land, provide financial subsidies, and invest in infrastructure)
___ Lack of adequate infrastructure to support new development (roads, transit, schools, etc.)
___ Lack of access to capital
___ Other (write in): _________________________________________________________________________________
___ Market-rate housing production is not constrained in my jurisdiction
12) For your jurisdiction, what are the top 3 reasons limiting affordable housing production? Please select up to 3 reasons
__ Lack of available sites
__ Costs to build are too high (land, labor, materials, impact fees)
___ Mis-matched supply and demand (e.g., developers only proposing luxury housing, etc.)
__ The CEQA environmental review process
__ Other aspects of the entitlement process (non-CEQA related)
__ Neighborhood opposition to new development

~ 36 ~
__ Political concerns about changes to the community
__ Loss of Redevelopment Agency (which had powers to assemble land, provide financial subsidies, and invest in infrastructure)
___ Lack of adequate infrastructure to support new development (roads, transit, schools, etc.)
___ Lack of affordable housing financing
___ Other (write in): _________________________________________________________________________________
___ Affordable housing production is not constrained in my jurisdiction
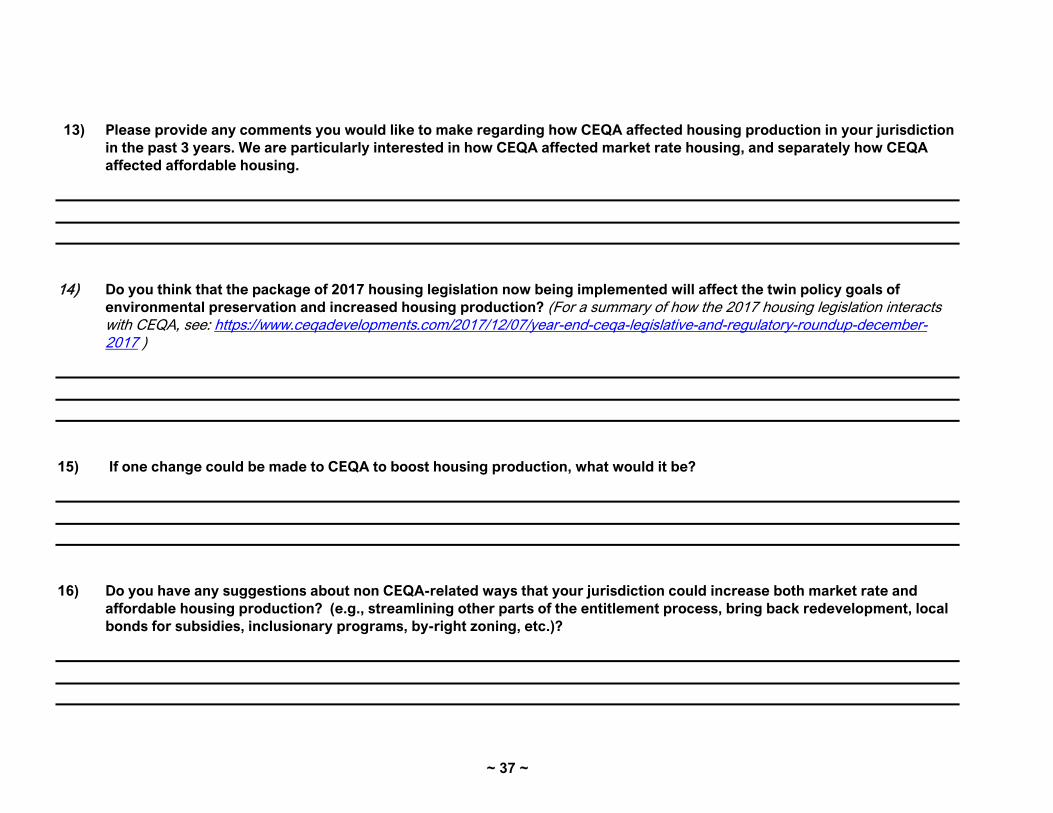
~ 37 ~
13) Please provide any comments you would like to make regarding how CEQA affected housing production in your jurisdiction in the past 3 years. We are particularly interested in how CEQA affected market rate housing, and separately how CEQA affected affordable housing.
14) Do you think that the package of 2017 housing legislation now being implemented will affect the twin policy goals of
environmental preservation and increased housing production? (For a summary of how the 2017 housing legislation interacts with CEQA, see: https://www.ceqadevelopments.com/2017/12/07/year-end-ceqa-legislative-and-regulatory-roundup-december-2017 )
15) If one change could be made to CEQA to boost housing production, what would it be?
16) Do you have any suggestions about non CEQA-related ways that your jurisdiction could increase both market rate and
affordable housing production? (e.g., streamlining other parts of the entitlement process, bring back redevelopment, local bonds for subsidies, inclusionary programs, by-right zoning, etc.)?

~ 38 ~

~ 39 ~
Appendix C: About the Authors Janet Smith-Heimer, MBA, Principal of The Housing Workshop
Janet founded The Housing Workshop in 2017 to provide focused housing
policy consulting services to research institutions, professional
organizations, foundations, and public agencies. This new firm builds on
Janet’s more than 35 years in consulting, primarily as founder and
President of BAE Urban Economics, a national award-winning urban
economics consulting firm. Janet managed BAE since founding the firm in
1986 through her departure in January 2017.
Janet’s affordable housing work spans three decades of policy and feasibility studies for the
nation’s largest cities, including the NYC Mandatory Inclusionary Housing Market & Financial
Feasibility Study (2015), and the City of Los Angeles Affordable Housing Linkage Fee Nexus
Study (2016). She is the author of CEQA in the 21st Century, prepared for the Rose Foundation
in 2016. During her career, Janet has also prepared Housing Elements, Consolidated Plans, and
market/financial feasibility studies on all types of affordable and market rate housing projects for
public agencies throughout the US. She has also managed feasibility studies for developers,
resulting in built projects including artist lofts, TOD, university faculty, and federal employee
housing.
In addition to housing, Janet has led engagements for some of the largest P3 projects in the
US. Her work includes transaction structuring, negotiations, and agency support for projects
ranging from the redevelopment of Pier 40 in NYC, to Hotel Vitale (a flagship boutique hotel on
public land) on the San Francisco waterfront, to P3 deals at the Presidio of San Francisco and
for the LA METRO. She also directed numerous downtown and business district revitalization
strategies. Her work has been used by cities as diverse as Los Angeles, Phoenix, Seattle,
Portland, Denver, Oakland, San Francisco, New York City, Washington DC, and throughout
Silicon Valley.
Janet received her MBA with a specialization in Real Estate Development from Golden Gate
University, and a Bachelor of Urban Planning from the University of Cincinnati. She served as a
lead instructor for the ULI Real Estate School for seven years and speaks regularly at
conferences and seminars. She is past Founding Board Chair of Sustainable Agricultural
Education (SAGE) and served for 9 years as an appointed Member of her hometown's
Sustainability Commission.

~ 40 ~
Jessica Hitchcock, MCP, Principal of Urban Math
Jessica is the founder of Urban Math, where she leads all projects,
incorporating advanced skills in data trends and financial analysis. She
has almost 20 years of experience in housing policy, small business
development, and workforce training. She has worked at community
non-profits, local government, and the private sector, and brings this
unique perspective to the practice.
Prior to launching Urban Math, Jessica was a Vice President at BAE
Urban Economics, where she led a variety of projects across the country
spanning economic development, housing policy, market analysis, strategic planning, and P3
transactions. Her experience at BAE gave her a deep understanding of how markets play out in
urban environments.
One of Jessica’s specialized skills is an advanced capability to convert large data sets into
digestible morsels. For example, she developed a tool that categorized all neighborhoods in
New York City and Los Angeles by market-strength, depicted on maps, and applied this
categorization to assess the efficacy of inclusionary housing/linkage fees within market and
financial feasibility constraints. In Los Angeles, the City used her framework to apply in-lieu fees
on a sliding scale.
Before joining BAE, Jessica was a project manager for RiseBoro, a non-profit housing developer
based in Brooklyn, NY, where she developed over 500 units of mixed-income housing that won
the Phoenix Award for Excellence in Brownfield Redevelopment. In addition to demonstrating
financial acumen and a skill for collaboration, she developed a respect for approaches to
community development. At RiseBoro, she learned the importance of deploying an array of tools
to empower communities, combat displacement, and address homelessness.
Jessica also worked for the City of Oakland Redevelopment Agency, where she administered
over $2 million of revitalization grants to small businesses in Uptown. She built relationships and
provided funding to new businesses around Oakland’s Fox Theater, many of which continue to
thrive. Jessica also has an entrepreneurial streak. She has run two small businesses, including
a restaurant to provide jobs for immigrant families in Hayward.
Jessica earned a BS in Business Administration from the Haas School of Business at UC
Berkeley, and a Master’s in City Planning (MCP) from UC Berkeley. She is active in her local
community, including current business planning work to create a model co-operative preschool.
She is also an active rental real estate investor and property manager.