
CEP Discussion Paper No 1420 April 2016 Global Firms ...cep.lse.ac.uk/pubs/download/dp1420.pdf ·...
59
ISSN 2042-2695 CEP Discussion Paper No 1420 April 2016 Global Firms Andrew B. Bernard J. Bradford Jensen Stephen J. Redding Peter K. Schott
Transcript of CEP Discussion Paper No 1420 April 2016 Global Firms ...cep.lse.ac.uk/pubs/download/dp1420.pdf ·...

ISSN 2042-2695
CEP Discussion Paper No 1420
April 2016
Global Firms
Andrew B. Bernard J. Bradford Jensen Stephen J. Redding
Peter K. Schott

Abstract Research in international trade has changed dramatically over the last twenty years, as attention has shifted from countries and industries towards the firms actually engaged in international trade. The now-standard heterogeneous firm model posits a continuum of firms that compete under monopolistic competition (and hence are measure zero) and decide whether to export to foreign markets. However, much of international trade is dominated by a few “global firms,” which participate in the international economy along multiple margins and are large relative to the markets in which they operate. We outline a framework that allows firms to be of positive measure and to decide simultaneously on the set of production locations, export markets, input sources, products to export, and inputs to import. We use this framework to interpret features of U.S. firm and trade transactions data and highlight interdependencies across these margins of firm international participation. Global firms participate more intensively along each margin, magnifying the impact of underlying differences in firm characteristics, and explaining their dominance of aggregate international trade.
Keywords: firm heterogeneity, international trade, multinationals, multi-product firms JEL codes: L11; L21; L25; L60
This paper was produced as part of the Centre’s Trade Programme. The Centre for Economic Performance is financed by the Economic and Social Research Council.
We are grateful to Janet Currie and Steven Durlauf for their encouragement. Bernard, Jensen, Redding and Schott thank Tuck, Georgetown, Princeton and Yale respectively for research support. We thank Jim Davis from Census for handling disclosure. The empirical research in this paper was conducted at the Boston, New York and Washington U.S. Census Regional Data Centers. Any opinions, findings, and conclusions or recommendations expressed in this material are those of the authors and do not necessarily reflect the views of the U.S. Census Bureau, the National Bureau of Economic Research, or the Centre for Economic Policy Research.
Andrew Bernard, Tuck School of Business and Centre for Economic Performance, London School of Economics. J. Bradford Jensen, McDonough School of Business, Georgetown University Washington DC. Stephen Redding, Princeton and Centre for Economic Performance, London School of Economics. Peter Schott, Yale School of Management and Centre for Economic Performance, London School of Economics.
Published by Centre for Economic Performance London School of Economics and Political Science Houghton Street London WC2A 2AE
All rights reserved. No part of this publication may be reproduced, stored in a retrieval system or transmitted in any form or by any means without the prior permission in writing of the publisher nor be issued to the public or circulated in any form other than that in which it is published.
Requests for permission to reproduce any article or part of the Working Paper should be sent to the editor at the above address.
A.B. Bernard, J. Bradford Jensen, S.J. Redding and P.K. Schott, submitted 2016.

Global Firms
1 Introduction
Research in international trade has changed dramatically over the last twenty years, as attention has
shifted from countries and industries towards firms. An initial wave of empirical research exploring
newly available administrative data established a series of stylized facts: only some firms export, exporters
are more productive than non-exporters, and trade liberalization is accompanied by an increase in ag-
gregate industry productivity. Subsequent theoretical research emphasized reallocation of resources
within and across firms as well as endogenous changes in firm productivity in a setting where measure
zero firms compete under monopolistic competition and self-select into export markets (e.g., Melitz
(2003)).
In this paper, we review this research and argue that this standard paradigm does not go far enough
in recognizing the role of individual firms. In particular, we use U.S firm and trade transactions data
to show that aggregate trade is dominated by a few “global firms,” which we define as firms that both
participate in the international economy along multiple margins and are large relative to the markets
in which they operate. We outline a theoretical framework that incorporates these features of the data.
The framework explicitly recognizes that such large global firms can internalize the eects of their
pricing and product introduction decisions on market aggregates. We include a much richer range of
margins along which firms can participate in international markets than the standard paradigm. Each
firm can choose the set of production locations in which to operate plants; the set of export markets for
each plant; the set of products to export from each plant to each market; the exports of each product
from each plant to each market; the set of countries from which to source intermediate inputs for each
plant; and imports of each intermediate input from each source country by each plant. Despite this
rich range of firm margins, our framework permits a relatively tractable characterization of the firm’s
problem, which we use to structure our interpretation of the data.
Focusing on global firms yields a number of new insights useful for understanding trade flows
and the impact of trade liberalization on welfare. The first insight is interdependence in firm decisions
for each margin of participation in the international economy. For example, importing decisions are
interdependent across source countries, because the decision to incur the fixed costs of sourcing inputs
from one country gives the firm access to lower-cost suppliers, which reduces firm production costs and
prices. These lower prices in turn imply a larger scale of operation, which makes it more likely that the
firmwill find it profitable to incur the fixed costs of sourcing inputs from other countries. Exporting and
importing decisions are also interdependent, because incurring the fixed exporting cost for an additional
market increases firm output, which makes it more likely that the firm will find it profitable to incur
the fixed cost of sourcing inputs from any given country. Extensive and intensive margin decisions
are related to one another, because choices of the set of markets to serve, the set of products to export,
and the set of countries from which to source inputs (the extensive margins) aect production costs and
1

Global Firms
prices, and hence influence exports of each product to each market and imports of each input from each
source country (the intensive margins). This interdependence implies that understanding the eects of
reductions in trade costs on any one margin (e.g. firm exports) requires taking into account its eects
through all other margins (e.g. firm imports).
The second insight is the magnification of the eects of dierences in exogenous primitives (e.g. ex-
ogenous components of firm productivity) on endogenous outcomes (e.g. firm sales and employment).
More productive firms participate more intensively in international markets along each margin. There-
fore small dierences in firm productivity can have magnified consequences for firm sales and employ-
ment, as more productive firms lower their production costs by sourcing inputs from more countries
and expand their scale of operation by exporting more products to each market and exporting to more
markets. Similarly, there is the potential for small changes in exogenous trade costs to have magnified
eects on endogenous trade flows, as they induce firms to serve more markets, export more products to
each market, export more of each product, source intermediate inputs frommore countries, and import
more of each intermediate input from each source country.
The third insight relates to strategic market power. When firms are large, they internalize the eects of
their decisions on market aggregates. This internalization implies that firms charge variable mark-ups
of price over marginal cost even in the presence of constant elasticity of substitution (CES) demand,
because larger firms have greater impact on aggregate price indices and hence face lower perceived
elasticities of demand. The presence of such variable markups provides a natural rationalization for
“pricing to market,” where firms charge dierent prices in dierent markets, because their markups in
each market depend on their sales shares in that market. Such variable markups also rationalize “incom-
plete pass-through,” where cost shocks are not passed through fully into consumer prices, because they
aect sales shares and hence lead to endogenous changes in markups. Finally, when large firms supply
multiple products, they internalize the cannibalization eects of the introduction of new products on
the sales of existing products, and hence make systematically dierent product introduction decisions
from single-product firms.
The fourth insight is granularity. When a small number of firms dominate the exports and imports
of trading nations, individual firm characteristics aect aggregate outcomes. In such a world, the law
of large numbers does not hold, and shocks to individual firms can aect country comparative advan-
tage, aggregate welfare, business cycle fluctuations and the international transmission of shocks. In
such a world, understanding the micro features of individual firms can be central to understanding the
aggregate causes and consequences of trade.
Our paper is related to the influential line of research that has modeled firm heterogeneity in dif-
ferentiated product markets following Melitz (2003).1 In this model, a competitive fringe of potential
1See also Bernard, Redding, and Schott (2007) andMelitz and Ottaviano (2008). For surveys of the theoretical literature onheterogeneous firms and trade, see Melitz and Redding (2014a) and Redding (2011). For broader surveys of firm organizationand trade, see Antràs (2015), Antràs and Rossi-Hansberg (2009) and Helpman (2006).
2

Global Firms
firms decide whether to enter an industry by paying a fixed entry cost which is thereafter sunk. Po-
tential entrants face ex ante uncertainty concerning their productivity. Once the sunk entry cost is
paid, a firm draws its productivity from a fixed distribution and productivity remains fixed thereafter.
Firms produce horizontally dierentiated varieties within the industry under conditions of monopo-
listic competition.2 The existence of fixed production costs implies that a firm drawing a productivity
level below the “zero-profit productivity cuto” would make negative profits and hence exits the in-
dustry. Fixed and variable costs of exporting ensure that only those active firms that draw a productivity
above a higher “export productivity cuto” find it profitable to export.3 Following multilateral trade
liberalization, high-productivity exporting firms experience increased revenue through greater export
market sales; the most productive non-exporters now find it profitable to enter export markets, increas-
ing the fraction of exporting firms; the least productive firms exit; and there is a contraction in the
revenue of surviving firms that only serve the domestic market. Each of these responses reallocates re-
sources towards high-productivity firms and raises aggregate productivity through a change in industry
composition.4
Our contribution relative to this theoretical research is to develop a framework that allows firms to be
“granular” or large relative to the markets in which they operate and participate in multiple ways in the
global economy. We model these granular firms as choosing prices or quantities taking into account
their eects on market price indices, as in Atkeson and Burstein (2008), Eaton, Kortum, and Sotelo
(2012), Edmond, Midrigan, and Xu (2012), Gaubert and Itskhoki (2015), and Hottman, Redding, and
Weinstein (2015).5 We consider the followingmargins of international participation. Each firm chooses
the set of export market to serve (as in Eaton, Kortum, and Kramarz (2011))6 and the set of products to
supply to each export market (as in Bernard, Redding, and Schott (2010), Bernard, Redding, and Schott
(2011) and Hottman, Redding, andWeinstein (2015)).7 Each firm also chooses the set of countries from
which to source intermediate inputs and which inputs to import from each source country (as in Antràs,
Fort, and Tintelnot (2014) and Bernard, Moxnes, and Saito (2014)).8 We provide the first framework
2For alternative approaches to firm heterogeneity, see Bernard, Eaton, Jensen, and Kortum (2003) and Yeaple (2005).3While the original model focuses on exporting, this framework is extended to incorporate foreign direct investment (FDI)
as an alternative mode for servicing foreign markets in Helpman, Melitz, and Yeaple (2004).4While firm productivity is fixed in the Melitz (2003) model, subsequent research has incorporated endogenous changes
in firm productivity through a variety of mechanisms, including technology adoption (Constantini and Melitz (2008), Bustos(2011) and Lileeva and Trefler (2010)), innovation (Atkeson and Burstein (2010), Perla, Tonetti, and Waugh (2015) andSampson (2015)), and endogenous changes in product mix (Bernard, Redding, and Schott (2010, 2011)).
5Related research on the role of granular firms in aggregate business cycle fluctuations includes Gabaix (2011) and di Gio-vanni, Levchenko, and Mejean (2014). For broader arguments for incorporating oligopolistic competition into internationaltrade, see Neary (2015) and Thisse and Shimomura (2012).
6Mrázová and Neary (2015) examine firm choices between alternative modes of serving export markets (e.g. exports versusforeign direct investment (FDI)).
7.Other research on multi-product firms and trade includes Arkolakis, Muendler, and Ganapati (2014), Dhingra (2013),Eckel and Neary (2010), Feenstra and Ma (2008), Mayer, Melitz, and Ottaviano (2013) and Nocke and Yeaple (2014).
8Firm importing is also examined in Amiti and Konings (2007), Amiti and Davis (2011), Blaum, Lelarge, and Peters (2013,2014), Goldberg, Khandelwal, Pavcnik, and Topalova (2010), De Loecker, Goldberg, Khandelwal, and Pavcnik (2015) andHalpern, Koren, and Szeidl (2015).
3
Global Firms
that simultaneously encompasses all of these margins of international participation and we show how
this framework can be used to make sense of a number of features of U.S. firm and trade transactions
data.
Our research is also related to the large empirical literature that has examined the relationship
between firm performance and participation in international markets following Bernard and Jensen
(1995).9 Early empirical studies in this literature used firm and plant-level data to document a number
of stylized facts about exporters and non-exporters. In particular, exporters are larger, more produc-
tive, more capital-intensive, more skill-intensive and pay higher wages than non-exporters within the
same industry (see Bernard and Jensen (1995, 1999)). Subsequent empirical research has used inter-
national trade transactions data to establish additional regularities about firm trade participation fol-
lowing Bernard, Jensen, and Schott (2009). Much of the variation in aggregate bilateral trade flows
is accounted for by the extensive margins of the number of exporting firms (see Eaton, Kortum, and
Kramarz (2004)) and the number of firm-product observations with positive trade (see Bernard, Jensen,
Redding, and Schott (2009)). While the extensive margins of export firms and products are sharply
decreasing in proxies for bilateral trade costs such as distance, the intensive margin of average exports
per firm-product observation with positive trade exhibits little relationship with these proxies because of
changes in export composition (see Bernard, Redding, and Schott (2011)). We show how our theoreti-
cal framework accounts for these properties of firm export behavior and for a broader range of features
of firm participation in the global economy.
Within this empirical literature on export participation, our paper is related to several studies that
have focused on the largest firms in the international economy. Bernard, Jensen, and Schott (2009)
document the concentration of activity in the largest exporting and importing firms for the U.S. and
argue that the “most globally engaged” firms are more likely to trade with dicult markets and perform
foreign direct investment. Mayer and Ottaviano (2007) document a set of regularities for European
firms and find that the export distribution is highly skewed. Freund and Pierola (2015) examine “export
superstars” and find that very large firms shape country export patterns. Among 32 countries, the top
firm on average accounts for 14% of a country’s total (non-oil) exports, and the top five firms make up
30% and argue that revealed comparative advantage can be created by a single firm.
The remainder of the paper is structured as follows. Section 2 develops our theoretical framework.
Section 3 introduces the data. Section 4 reports evidence on the decisionmargins of global firms. Section
5 concludes.9For existing surveys of this empirical literature, see Bernard, Jensen, Redding, and Schott (2007), Bernard, Jensen, Red-
ding, and Schott (2012) and Melitz and Trefler (2015).
4

Global Firms
2 Theoretical Framework
We consider a world of many (potentially) asymmetric countries. Firms make three sets of decisions:
which markets to serve (typically indexed by n), which countries in produce in (usually denoted by
i), and which countries to source inputs from (generally indicated by j). For each destination market,
firms choose the range of products to supply to that market (ordinarily referenced by k). For each
source country, firms choose the range of intermediate inputs to obtain from that source (most often
represented by `). We assume that consumer preferences exhibit a constant elasticity of substitution
(CES). However, we allow firms to be large relative to the markets in which they sell their products,
which introduces variable markups (because each firm internalizes the eect of its pricing choices on
market aggregates).
2.1 Preferences
We consider a nested structure of demand as in Hottman, Redding, and Weinstein (2015). Preferences
in each market m are a Cobb-Douglas aggregate of the consumption indices (CGmg) of a continuum of
sectors indexed by g:
ln Um =
ˆg∈ΩG
λGmg ln CG
mgdg,ˆ
g∈ΩGλG
mgdg = 1, (1)
where λGmg determines the share of market m’s expenditure on sector g.10 The consumption index (CG
mg)
for each sector g in each market m is defined over consumption indices (CFmi f ) for each final good firm
f from each production country i:
CGmg =
∑i∈ΩN
∑f∈ΩF
mig
(λF
mi fCF
mi f
) σFg −1
σFg
σF
gσF
g −1
, σFg > 1, λF
mi f > 0, (2)
where σFg is the elasticity of substitution across firms for sector g; ΩN is the set of countries; λF
mi f is the
overall perceived quality of the consumption index supplied by firm f to market m from production
country i; and ΩFmig is the set of firms that supply market m from production country i within sector g.
The consumption index (CFmi f ) for each firm f from production location i in market m within sector g
is defined over the consumption (CKmik) of each final product k:
CFmi f =
∑k∈ΩK
mi f
(λK
mikCKmik
) σKg −1
σKg
σK
gσK
g −1
, σKg > 1, λK
mik > 0, (3)
10For expositional clarity, we use the superscripts G, F and K to denote sector, firm and product-level variables. We usethe subscripts n, i and j to index the values of variables for individual markets, production countries and source countriesrespectively. We use the subscripts g, f and k to index the values of variables for individual sectors, firms and productsrespectively.
5

Global Firms
where σKg is the elasticity of substitution across products within firms; λK
mik is the perceived quality of
product k supplied to market m from production country i; and ΩKmi f g is the set of products supplied by
firm f to market m from production country i within sector g.11
There are a few features of this specificationworth noting. First, we allow firms to be large relative to
sectors (and hence internalize their eects on consumption and the price index for the sector). However,
we assume a continuum of sectors so that each firm is of measure zero relative to the economy as a whole
(and hence takes aggregate expenditure Em as given). Second, the assumption that the upper-level of
utility is Cobb-Douglas implies that no firm has an incentive to try to manipulate prices in one sector
to influence behavior in another sector. The reason is that each firm is assumed to be small relative to
the aggregate economy (and hence cannot aect aggregate expenditure) and sector expenditure shares
are determined by the parameters λGmg alone. Therefore the firm problem becomes separable by sector,
which implies that we can treat the divisions of a firm that operates in multiple sectors as if they were
separate firms. Henceforth, we adopt this convention, and use the firm index f to refer to firm-divisions
within a given sector g for firms that operate in multiple sectors.
Third, the consumption index (CGmg) for sector g in market m allows for dierentiation across both
firms f and production locations i, which enables the model to rationalize a firm supplying the same
product to the same market from dierent production locations. Fourth, since preferences are homoge-
neous of degree one in quality, firm quality (λFmi f ) cannot be defined independently of product quality
(λKmik). We therefore need a normalization. It proves convenient to make the following normalizations:
we set the geometric mean of product quality (λKmik) across products within each firm and production
country equal to one and the geometric mean of firm quality (λFmi f ) across firms within each sector
equal to one:
∏k∈ΩK
mi f
λKmik
1NK
mi f
= 1,
∏i∈ΩN
∏f∈ΩF
mig
λFmi f
1NF
mg
= 1, (4)
where NKmi f =
∣∣∣ΩKmi f
∣∣∣ is the number of products supplied by firm f from production country i to market
m within sector g and NFmg =
∣∣∣ΩFmig : i ∈ ΩN
∣∣∣ is the total number of firms supplying market m from
all production countries i within sector g.
Under these normalizations, product quality (λKmik) determines the relative expenditure shares of
products within a given firm from a given production country, while firm quality (λFmi f ) determines
the relative expenditure shares of firms within a given sector; the Cobb-Douglas expenditure shares
(λGmg) determine the relative expenditure shares of sectors; and aggregate expenditure (Em) determines
the overall level of expenditures in a given market. The corresponding sectoral price index dual to (2)
is:11A large empirical literature provides evidence of the importance of product quality dierences, including Hallak and
Schott (2011), Hottman, Redding, and Weinstein (2015), Khandelwal (2010), Manova and Zhang (2012) and Schott (2004).
6

Global Firms
PGmg =
∑i∈ΩN
∑f∈ΩF
mig
(PF
mi f
λFmi f
)1−σFg
11−σF
g
, (5)
and the corresponding firm price index dual to (3) is:
PFmi f =
∑k∈ΩK
mi f
(PK
mik
λKmik
)1−σKg
11−σK
g
. (6)
An important property of these CES preferences, which we use below, is that elasticity of the price
index with respect to a price of a variety is that variety’s expenditure share. Therefore the expenditure
share of firm f from production country i in market m within sector g is:
SFmi f =
(PF
mi f /λFmi f
)1−σFg
∑i∈ΩN ∑o∈ΩFmig
(PF
mio/λFmio
)1−σFg=
∂PGmg
∂PFmi f
PFmi f
PGmg
, (7)
and the expenditure share of product k from production country i in market m within firm f is:
SKmik =
(PK
mik/λKmik
)1−σKg
∑n∈ΩKmi f
(PK
min/λKmin
)1−σKg=
∂PFmi f
∂PKmik
PKmik
PFmi f
. (8)
The corresponding level of expenditure on product k is:
EKmik =
(λF
mi f
)σFg−1 (
λKmik
)σKg −1 (
λGmgwmLm
) (PG
mg
)σFg−1 (
PFmi f
)σKg −σF
g(
PKmik
)1−σKg
, (9)
where we have used the Cobb-Douglas upper tier of utility, which implies that sectoral expenditure is
a constant share of aggregate expenditure (EGmg = λG
mgEm). We have also used the fact that aggregate
expenditure (Em) equals aggregate income (wmLm), where labor is the sole primary factor of production
with wage wm and inelastic supply Lm.
2.2 Final Goods Production Technology
A final good firm f is defined by its productivity (ϕi f ) in each potential country of production i, con-
sumers’ perceptions of the overall quality of the firm from that production country in market m (λFmi f ),
and consumers’ perceptions of the quality of each product k supplied by the firm from that production
country to that market (λKmik). Each product k is produced using a continuum of intermediate inputs
indexed by ` ∈ [0, 1], which are modeled following Eaton and Kortum (2002) and Antràs, Fort, and
Tintelnot (2014).12 A firm f with productivity ϕi f that locates a plant in production country i and uses
12See also Bernard, Moxnes, and Saito (2014), Rodríguez-Clare (2010) and Tintelnot (2014).
7

Global Firms
an amount YKik (`) of each intermediate input ` can produce the following output (QK
ik) of product k:
QKik = ϕi f
[ˆ 1
0YK
ik (`)ηg−1
ηg d`
] ηgηg−1
, ηg > 1, (10)
where ηg is the elasticity of substitution across intermediate inputs for sector g; more productive firms
(with higher ϕi f ) generate more output for given use of intermediate inputs YKik (`).
To open a plant in production country i, firm f must incur a fixed production cost of FPi > 0 units
of labor. We also assume that the firm must incur a fixed exporting cost of FXmi > 0 units of labor to
export to market m from production country i, after which it can supply that market subject to iceberg
variable trade costs of dXmi > 1, where dX
mi > 1 for m 6= i and dXmm = 1. Additionally, we assume that the
firmmust incur fixed sourcing costs of FIij > 0 units of labor to obtain intermediate inputs in production
country i from source country j, after which it can obtain these inputs subject to iceberg variable trade
costs of dIij > 1, where dI
ij > 1 for i 6= j and dIii = 1. These fixed costs of production, exporting and
sourcing (FPi , FX
mi and FIij) are incurred in terms of labor in country i and must be paid irrespective of the
number of products exported or the number of inputs used. To rationalize firms only exporting a subset
of their products to some markets, we also assume a fixed product exporting cost (FKmik) for each product
k exported from production country i to market m. We allow the variable trade costs to dier between
final and intermediate goods (dXmi 6= dI
mi). For simplicity, we assume that the final goods variable trade
costs (dXmi) are the same across products k, and the intermediate inputs variable trade costs (dI
ij) are the
same across inputs `, although it is possible to relax both these assumptions. Consistent with a large
empirical literature, we assume that fixed and variable trade costs are suciently high that only a subset
of firms from each production country i export to foreign markets m 6= i and that only a subset of these
firms from production country i import intermediate inputs from foreign source countries j 6= i.
2.3 Intermediate Input Production Technology
Intermediate inputs are produced with labor according to a linear technology under conditions of per-
fect competition. If a firm f in production country i has chosen to incur the fixed importing costs for
source country j, the cost of sourcing an intermediate input ` from country j for product k is:
aij f k (`) =wjdI
ij
z, (11)
where recall that wj is the wage in country j and z is a stochastic draw for intermediate input productiv-
ity. We assume that intermediate input productivity is drawn independently for each final good firm f ,
product k, intermediate input `, production country i and source country j from a Fréchet distribution:
Gij f k(z) = e−TKjk z−θK
k , (12)
8

Global Firms
where TKjk is the Fréchet scale parameter that determines the average productivity of intermediate in-
puts from source j for product k; θKk is the Fréchet shape parameter that determines the dispersion of
intermediate input productivity for product k.
Although intermediate input productivity (z) is specific to a final goods firm, we assume that all
intermediate input firms within source country j have access to this productivity, which ensures that
intermediate inputs are produced under conditions of perfect competition.13 Although intermediate
input productivity draws are assumed to be independent, we allow the scale parameter TKjk to vary
across both products and countries. Therefore, if source country j with a high value of TKjk for product
k also has a high value of TKjn for another product n 6= k, this variation in the Fréchet scale parameter
will induce a correlation between intermediate input productivity draws for products k and n.
2.4 Exporting and Importing Decisions
Firm decisions involve the organization of global production chains.14 Each firm chooses the set of
production countries in which to operate plants, taking into account the location of these facilities
relative to final goods markets and their location relative to sources of intermediate inputs. Each firm
also chooses the set of markets to supply from each plant, the range of products to export from each
plant to each market, the set of countries from which to source intermediate inputs for each product in
each plant, and imports of each input for each product in each plant.
We analyze the firm’s optimal exporting and importing decisions in two stages. First, for given sets
of countries for which the fixed production costs (FPi ), fixed exporting costs (FX
mi) and fixed sourcing
costs (FIij) have been incurred, and for a given set of products for which the fixed product exporting costs
(FKmik) have been incurred, we characterize the firm’s optimal decisions of which intermediate inputs to
source from each country, how much of each intermediate input to import from each source country,
and how much of each product to export to each market. Second, we characterize the firm’s optimal
choices of the set of countries for which to incur the fixed production costs (FPi ), fixed exporting costs
(FXmi) and fixed sourcing costs (F
Iij) and the set of products for which to incur the product fixed exporting
costs (FKmik).
2.4.1 Sourcing Decisions for a Given Set of Production, Market and Source Countries
We begin with the firm’s sourcing decisions for intermediate inputs. Suppose that firm f has chosen the
set of production countries i in which to locate plants (ΩNPf ⊆ ΩN), the set of markets m to which to
export from each plant (ΩNXi f ⊆ ΩN), the set of source countries j from which to obtain intermediate
13We thus abstract from issues of incomplete contracts and hold-up with relationship-specific investments, as consideredin Antràs (2003), Antràs and Helpman (2004) and Helpman (2006). Within our framework, final goods firms are indierentwhether to source intermediate inputs within or beyond the boundaries of the firm.
14The determinants and implications of global production chains are explored in Antràs and Chor (2013), Alfaro, Antrás,Chor, and Conconi (2015), Baldwin and Venables (2013), Costinot, Vogel, and Wang (2013), Dixit and Grossman (1982),Grossman and Rossi-Hansberg (2008), Johnson and Noguera (2012), Melitz and Redding (2014b) and Yi (2003).
9
Global Firms
inputs for each plant (ΩNIi f ⊆ ΩN), and the set of products k to export from each plant to each market
(ΩKmi f ). Given these sets of countries and products, we now characterize the firm’s optimal sourcing
decisions for each intermediate input for each product. Using the monotonic relationship between the
price of intermediate inputs (aij f k (`)) and intermediate input productivity (z) in (11) and the Fréchet
productivity distribution (12), the firm f in production country i faces the following distribution of
prices for intermediate inputs for each product k from each source country j ∈ ΩNIi f :
Gij f k(a, ΩNIi f ) = 1− e−TK
jk(wjdIij)−θK
k aθKk , j ∈ ΩNI
i f . (13)
The firm f in production country i sources each intermediate input for each product k from the lowest-
cost supplier of that input from among the set of source countries j ∈ ΩNIi f . Since the minimum of
Fréchet distributed random variables is itself Fréchet distributed, the corresponding distribution of min-
imum prices across all source countries j ∈ ΩNIi f is:
Gi f k(a, ΩNIi f ) = 1− e−Φi f kaθK
k , Φi f k = ∑j∈ΩNI
i f
TKjk(wjdI
ij)−θK
k . (14)
Given this distribution for minimum prices, the probability that the firm f in production country i
sources an intermediate input for product k from source country j ∈ ΩNIi f is:
µij f k(ΩNIi f ) =
TKjk(wjdI
ij)−θK
k
∑h∈ΩNIi f
TKhk(whdI
ih)−θK
k. (15)
The variable unit cost function dual to the final goods production technology (10) is:
δKi f k(ϕi f , ΩNI
i f ) =1
ϕi f
[ˆ 1
0ai f k (`)
1−ηg d`
] 11−ηg
. (16)
Using the distribution for intermediate input prices (14), variable unit costs can be expressed as:
δKi f k(ϕi f , ΩNI
i f ) =1
ϕi fγK
k
[Φi f k
(ΩNI
i f
)]− 1θKk , (17)
where γKk =
[Γ
(θK
k + 1− ηg
θKk
)] 11−ηg
, Φi f k
(ΩNI
i f
)= ∑
j∈ΩNIi f
TKjk(wjdI
ij)−θK
k ,
Γ (·) is the Gamma function and we require θKk > ηg − 1 .
We refer to Φi f k
(ΩNI
i f
)as firm supplier access, because it summarizes a firm’s access to intermediate
inputs around the globe as a function of its choice of the set of source countries (ΩNIi f ). Firm supplier
access is decreasing in the number of source countries: N Ii f =
∣∣∣ΩNIi f
∣∣∣. Firm supplier access also depends
onwages (wj) and intermediate input productivity (TKjk) in each source country j ∈ ΩNI
i f and the variable
10

Global Firms
trade costs of importing intermediate inputs from those source countries (dIij). The firm’s total cost
function (including fixed sourcing costs and taking into account the firm’s output choice) for product
k is:
Λ(
ϕi f , ΩNIi f , QK
ik
)=
γKk
[Φi f k
(ΩNI
i f
)]− 1θKk
ϕi fQK
ik + ∑j∈ΩNI
i f
FIij, (18)
where QKik is total firm output of product k in country i, which is the sum of output produced for each
market m (QKmik) across all markets: QK
ik = ∑m∈ΩNXi f
QKmik. Firms that incur the fixed sourcing costs (FI
ij)
for more source countries j have higher total fixed costs, but lower variable costs, because of improved
firm supplier access Φi f k
(ΩNI
i f
).
Finally, an implication of the Fréchet assumption for intermediate input productivity is that the av-
erage prices of intermediate inputs conditional on sourcing those inputs from a given source country
are the same across all source countries. Therefore the probability (µij f k(ΩNIi f )) that a firm f in produc-
tion country i obtains an input for product k from source country j (15) also corresponds to its share of
expenditure on inputs from source country j in its total expenditure on intermediate inputs for product
k.
2.4.2 Exporting Decisions for a Given Set of Production, Market and Source Countries
Given firm f ’s choice of sets of production countries i (ΩNPf ), markets m (ΩNX
i f ) and sources j (ΩNIi f )
and sets of products exported to each market (ΩKmi f ), we now characterize the firm’s optimal pricing
decisions for each exported product. Firm f from production country i chooses the price (PKmik) for each
product k for each market m within sector g to maximize its profits subject to the downward-sloping
demand curve (9) and taking into account the eects of its choices on market price indices:
maxPK
mik :m∈ΩNXi f ,k∈ΩK
mi f
ΠFig f =
∑
m∈ΩNXi f
∑k∈ΩK
mi f
PKmikQK
mik(
PKmik)−
dXmiγ
Kk
[Φi f k
(ΩNI
i f
)]− 1θKk
ϕi fQK
mik(
PKmik)
− ∑m∈ΩNX
i f
∑k∈ΩK
mi f
wiFKmik − ∑
m∈ΩNXi f
wiFXmi − ∑
j∈ΩNIi f
wiFIij − wiFP
i
(19)
where recall that dXmi > 1 for m 6= i are iceberg variable trade costs for final goods.
Under our assumption of nested CES demand, each firm f from production country i internalizes
that it is the monopoly supplier of the firm consumption index (CFmi f ) to market m, and hence chooses a
commonmarkup (µFmi f ) of price over marginal cost across all products within a given sector and market,
as in Hottman, Redding, and Weinstein (2015):
PKmik = µF
mi f
dXmiγ
Kk
[Φi f k
(ΩNI
i f
)]− 1θKk
ϕi f. (20)
The size of the mark-up (µFmi f ) depends on the perceived elasticity of demand (εF
mi f ) for the firm con-
11

Global Firms
sumption index in market m:
µFmi f =
εFmi f
εFmi f − 1
, (21)
where this perceived elasticity of demand depends on the firm’s market share within that sector and
market:
εFmi f = σF
g −(
σFg − 1
)SF
mi f = σFg
(1− SF
mi f
)+ SF
mi f , (22)
where SFmi f is the share of firm f from production country i in sectoral expenditure in market m.15
Although consumers have constant elasticity of substitution preferences (σFg ), each firm perceives a
variable elasticity of demand (εFmi f ) that is decreasing in its expenditure share (SF
mi f ), because it internal-
izes the eect of its pricing choices on market price indices, as in Atkeson and Burstein (2008), Eaton,
Kortum, and Sotelo (2012), Edmond, Midrigan, and Xu (2012) and Hottman, Redding, andWeinstein
(2015). As a result, the firm’s equilibrium pricing rule (20) involves a variable markup (µFmi f ) that is
increasing in its expenditure share (SFmi f ). Our framework is thus consistent with empirical evidence
of “pricing to market,” because firms charge higher markups over marginal costs in markets where they
account for a larger shares of sectoral expenditure.16
The property that the firm charges a common markup across all products within a given sector
and market is a generic implication of nested demand systems. In such specifications, the firm’s profit
maximization problem can be thought of in two stages. First, the firm chooses the price index (PFmi f )
to maximize the profits from supplying the firm consumption index (CFmi f ), which implies a markup
at the firm level within a given sector and market over the cost of supplying that real consumption
index. Second, the firm chooses the price for each product to minimize the cost of supplying that real
consumption index (CFmi f ), which requires setting the relative prices of products equal to their relative
marginal costs. Together these two results ensure the same markup across all products supplied by the
firm within a given sector and market. Nonetheless, firm markups vary across markets within a given
sector (with the firm market share in those markets), and they vary across sectors within a given market
(with the firm market share and elasticity of substitution across products within those sectors).17
Using the equilibrium pricing rule (20) in the firm problem (19), equilibrium profits for firm f
from production location i within sector g can be written in terms of sales from each product k in each
market, the common markup across products within each market, and the fixed costs:
15Although we assume that firms choose prices under Bertrand competition, it is straightforward to consider the alternativecase under which firms choose quantities under Cournot competition. In this alternative specification, firms again chargevariable markups that are common across products within a given sector and market, but the expression for the perceivedelasticity of demand diers, as shown in Atkeson and Burstein (2008) and Hottman, Redding, and Weinstein (2015).
16See Atkeson and Burstein (2008), Bergin and Feenstra (2001), Fitzgerald and Haller (2015), Goldberg and Hellerstein(2013), Krugman (1987) and the review in De Loecker and Goldberg (2014). De Loecker and Warzynski (2012) provideevidence of substantial dierences in markups between exporters and non-exporters.
17As long as the elasticity of substitution across products within firms (σKg ) is greater than the elasticity of substitution across
firms (σFg ), firms face cannibalization eects, whereby the introduction of new products cannibalizes the sales of existing
products, as examined in Hottman, Redding, and Weinstein (2015).
12

Global Firms
ΠFig f =
∑
m∈ΩNXi f
∑k∈ΩK
mi f
(µF
mi f−1
µFmi f
)EK
mik − ∑m∈ΩNX
i f
∑k∈ΩK
mi f
wiFKmik − ∑
m∈ΩNXi f
wiFXmi − ∑
j∈ΩNIi f
wiFIij − wiFP
i
.
(23)
Using the markup (21) and our assumption of constant marginal costs to recover variable costs from sales
(as EKmik/µF
mi f ), and using the share of each source country in variable costs (15), imports of intermediate
inputs for product k by firm f from production location i within sector g from source country j are:
MKi f kj =
TKjk(wjdI
ij)−θK
k
∑h∈ΩNIi f
TKhk(whdI
ih)−θK
k
∑m∈ΩNX
i f
EKmik
µFmi f
. (24)
Finally, using the equilibrium pricing rule (20) in the revenue function (9), sales of each product(EK
mik) depend on firm supplier access (ΩNIi f ) through variable production costs:
EKmik =
(λF
mi f
)σFg−1 (
λKmik
)σKg −1 (
λGmgwmLm
) (PG
mg
)σFg−1 (
PFmi f
)σKg −σF
g
µFmi f
dXmiγ
Kk
[Φi f k
(ΩNI
i f
)]− 1θKk
ϕi f
1−σK
g
. (25)
As in Antràs, Fort, and Tintelnot (2014), incurring the fixed sourcing cost for a new source country
(expanding ΩNIi f ) has two eects on imports from existing source countries for each product. On the one
hand, the addition of the new source country reduces imports from existing source countries through a
substitution eect (from the expenditure shares (15)). On the other hand, the addition of the new source
country improves supplier access (Φi f k), which reduces production costs and expands firms sales (from
the revenue function (25)), which raises imports from existing source countries through a production
scale eect. Which of these two eects dominates, and whether source countries are substitutes or
complements, depends on whether(
σKg − 1
)/θK
k is less than or greater than one respectively.
We now examine the properties of firm variables with respect to productivity using the firm expen-
diture share (7), price index (6) and pricing rule (20). These results should be interpreted carefully for
the following reasons. First, they are partial equilibrium relationships, because we hold constant wages
in all countries m (wm). Second, we hold constant the set of production countries in which plants are
located for each firm f (ΩNPf ), the set of markets for each plant in each production country i (ΩNX
i f ),
the set of products exported from each plant in each production country i to each market m in each
sector g (ΩKmi f ), and the set of input sources for each plant (ΩNI
i f ). Each of these choice sets are them-
selves endogenous. Therefore these results should be interpreted as partial derivatives of firm variables
with respect to productivity, holding constant these choice sets and wages. Finally, we also hold fixed
all other model parameters, including firm appeal (λFmi f ), product appeal (λ
Kmik) and intermediate input
productivities (TKjk).
Proposition 1. Given wages in all countries m (wm), the set of production countries in which plants are locatedfor each firm f (ΩNP
f ), the set of markets for each plant in each production country i (ΩNXi f ), the set of products
13

Global Firms
exported from each plant in each production country i to each market m in each sector g (ΩKmi f ), and the set of
source countries for intermediate inputs for each plant (ΩNIi f ), an increase in firm productivity (ϕi f ) implies:
(i) higher expenditure shares within each market (SFmi f ),
(ii) lower prices (PKmik) for each product k and higher markups (µK
mik) within each market,(iii) higher sales (EK
mik) and output (QKmik) of each product within each market.
Proof. See the appendix.
Higher firm productivity reduces firm prices in each market, which leads to higher sales and output
of each product in each market, and hence higher total sales and output of each product across all
markets. This higher total output for each product in turn implies higher imports of intermediate inputs
for each productive. Therefore a key empirical prediction of the model is that higher firm productivity
leads to an expansion of the intensive margins of exports of each product and imports of each input.
The expansion of firm sales in turn implies a reduction in the firm’s perceived elasticity and demand and
hence higher firm markups. Therefore our framework features “incomplete pass-through” of productioncosts to consumer prices, consistent with a large empirical literature.18
2.4.3 Optimal Set of Production, Market and Source Countries
We now turn to the firm’s optimal choice of the sets of production countries in which to locate plants
(ΩNPf ), markets for each plant (ΩNX
i f ), source countries for each plant (ΩNIi f ), and products exported
from each plant to each market served (ΩKmi f ). Firm f chooses these sets of countries and products to
maximize its equilibrium profits (23):
ΩNP
f , ΩNXi f , ΩNI
i f , ΩKmi f
= arg max
∑i∈ΩNP
f
∑
m∈ΩNXi f
∑k∈ΩK
mi f
(µF
mi f−1µF
mi f
)EK
mik − ∑m∈ΩNX
i f
∑k∈ΩK
mi f
wiFKmik
− ∑m∈ΩNX
i f
wiFXmi − ∑
j∈ΩNIi f
wiFIij − wiFP
i
, (26)
where sales (EKmik) and the markup (µF
mi f ) in each market are determined from the CES revenue function
for each product (9), the firm expenditure share (7) and the firm equilibrium pricing rule (20).
This expression for the firm’s problem has an intuitive interpretation. For each set of production,
market and source countries and each set of products exported, the firm first solves for its equilibrium
variable profits as determined in the previous subsection (in terms of the markup (µFmi f ) and sales (E
Kmik)).
Having computed this solution for each set of production, market and source countries and each set of
products exported, the firm then searches over all possible combinations of production, market and
source countries and products exported for the combination that maximizes total profits.
Although conceptually straightforward, this firm problem is highly computationally demanding.
First, the choice set is high dimensional (for each production location i, the firm chooses sets of export
18See for example Amiti, Itskhoki, and Konings (2015), Berman, Martin, and Mayer (2012), and the review in Goldbergand Knetter (1997).
14

Global Firms
markets and intermediate input sources from N countries and chooses sets of products for each market).
Second, exporting and importing decisions are interdependent with one another and across countries.
Importing decisions are interdependent across source countries, because incurring the fixed sourcing
cost (FIij) for an additional source country j increases firm supplier access (Φi f k
(ΩNI
i f
)) and hence reduces
variable unit costs (17) and prices (20). These lower prices in turn imply higher output from the revenue
function (9), which makes it more likely that the firm will find it profitable to incur the fixed sourcing
costs for another country h 6= j. Exporting and importing decisions are interdependent with one
another, because incurring the fixed exporting cost (FXmi) for an additional export market m increases
firm output. This increased output makes it more likely that the firm will find it profitable to incur the
fixed sourcing cost (FIij) for any given source country j. The resulting reduction in variable unit costs
and prices from adding an additional source country in turn makes it more likely that the firm will find
it profitable to incur the fixed exporting cost (FXhi ) for another export market h 6= m.
Providing a general characterization of the solution to (26) becomes all the more demanding once
this firm problem is embedded in general equilibrium, which requires solving for the endogenous set of
firms and wages. However, without explicitly solving this firm problem or the full general equilibrium,
we can again establish some properties of the firm’s decisions. We begin with the firm’s decisions of the
set of products to export to each market (ΩKmi f ). We again examine partial derivatives, holding constant
wages in all countries m (wm), the sets of production countries (ΩNPf ), markets (ΩNX
i f ) and sources of
supply (ΩNIi f ), and all other model parameters besides productivity (including other firm characteristics
such as firm appeal (λFmi f ) and product appeal (λK
mik)).
A firm f from production country i will expand the set of products k exported to a given market m
within a given sector g from ΩKmi f to ΩK
mi f (where ΩKmi f ⊂ ΩK
mi f ) if the resulting increase in variable
profits exceeds the additional product fixed costs:
∑k∈
ΩKmi f \ΩK
mi f
(
µFmi f − 1
µFmi f
)EK
mik − ∑k∈
ΩKmi f \ΩK
mi f
wiFKmik ≥ 0. (27)
From Proposition 1, an increase in firm productivity implies higher sales (EKmik) of each product and
higher markups (µFmi f ) within each market for given wm, ΩNP
f , ΩNXi f , ΩNI
i f , ΩKmi f. Therefore an
increase in firm productivity implies greater variable profits from expanding the set of products from
ΩKmi f to ΩK
mi f in (27).
Proposition 2. Given wages in all countries m (wm), the set of production countries in which plants are locatedfor each firm f (ΩNP
f ), the set of markets for each plant in each production country i (ΩNXi f ), and the set of
source countries for intermediate inputs for each plant (ΩNIi f ), an increase in firm productivity (ϕi f ) increases the
variable profits from an expansion in the set of products supplied to each market from ΩKmi f to ΩK
mi f (whereΩK
mi f ⊂ ΩKmi f ).
Proof. See the appendix.
15

Global Firms
We next consider the firm’s decision of the set of export markets (ΩNXi f ), holding constant wages
in all countries m (wm), the sets of production locations (ΩNPf ), source countries (ΩNI
i f ) and products
exported to each market (ΩKmi f ), and all model parameters besides firm productivity. A firm f from
production country i will expand the set of markets served from ΩNXi f to ΩNX
i f (where ΩNXi f ⊂ ΩNX
i f ) if
the resulting increase in variable profits exceeds the additional fixed exporting costs:
∑m∈
ΩNXi f \Ω
NXi f
∑k∈ΩK
mi f
(µF
mi f − 1
µFmi f
)EK
mik − ∑m∈
ΩNXi f \Ω
NXi f
∑k∈ΩK
mi f
wiFKmik − ∑
m∈
ΩNXi f \Ω
NXi f
wiFXmi ≥ 0. (28)
From Proposition 1, an increase in firm productivity implies higher sales (EKmik) of each product
and higher markups (µFmi f ) within each market for given wm, ΩNP
f , ΩNXi f , ΩNI
i f , ΩKmi f. Therefore an
increase in firm productivity implies greater variable profits from expanding the set of export markets
from ΩNXi f to ΩNX
i f in (28).
Proposition 3. Given wages in all countries m (wm), the set of production countries in which plants are locatedfor each firm f (ΩNP
f ), the set of source countries for intermediate inputs for each plant (ΩNIi f ), and the set of
products exported from each plant to each export market (ΩKmi f ), an increase in firm productivity (ϕi f ) increases
the variable profits from an expansion in the set of export markets from ΩNXi f to ΩNX
i f (where ΩNXi f ⊂ ΩNX
i f ).
Proof. See the appendix.
Finally, we consider the firm’s decision of the set of source countries from which to obtain interme-
diate inputs (ΩNIi f ). As shown in Antràs, Fort, and Tintelnot (2014), even if firm supplier access (Φi f k)
is increasing in firm productivity, the number of countries from which a firm sources need not be in-
creasing in firm productivity. In the case in which source countries are substitutes ((
σKg − 1
)/θK
k < 1),
a highly productive firm might pay a large fixed cost to source from one country with particularly low
variable costs of producing intermediate inputs, after which the marginal incentive to add further source
countries might be diminished. In contrast, in the case in which source countries are complements
((
σKg − 1
)/θK
k > 1), adding source one country increases the profitability of adding another source
country, so that both firm supplier access (Φi f k) and the number of source countries are increasing in
firm productivity.
Throughout the following, we focus on the complements case ((
σKg − 1
)/θK
k > 1) and examine
the variable profits from adding an additional source country, holding constant wages in all countries
m (wm), the sets of production locations (ΩNPf ), markets (ΩNX
i f ) and products supplied to each market
(ΩKmi f ), and all model parameters besides productivity. A firm f from production location i will expand
the set of source countries from ΩNIi f to ΩNI
i f (where ΩNIi f ⊂ ΩNI
i f ) if the resulting increase in variable
profits exceeds the additional fixed sourcing costs:
16
Global Firms
∑
m∈ΩNXi f
∑k∈ΩK
mi f
µFmi f
(ΩNI
i f
)− 1
µFmi f
(ΩNI
i f
) EK
mik
(ΩNI
i f
)− ∑
m∈ΩNXi f
∑k∈ΩK
mi f
µFmi f
(ΩNI
i f
)− 1
µFmi f
(ΩNI
i f
) EK
mik
(ΩNI
i f
) (29)
− ∑j∈
ΩNIi f \ΩNI
i f
wiFIij ≥ 0,
where we make explicit that both the markup (µFmi f ) and sales of each product (EK
mik) are functions of
the set of source countries (ΩNIi f ).
An expansion in the set of source countries from ΩNIi f to ΩNI
i f increases firm variable profits through
two channels. First, the expansion in the set of source countries increases firm supplier access (Φi f k
(ΩNI
i f
)),
which reduces variable unit costs (17) and prices (20), and in turn increases sales for each product (EKmik).
Second, the expansion in sales for each product increases firm market share and mark-ups (µFmi f ). To-
gether these two eects ensure that the first term in curly braces for the increase in variable profits is
positive.
From Proposition 1, an increase in firm productivity implies higher sales (EKnik) of each product
and higher markups (µFni f ) within each market for given wm, ΩNP
f , ΩNXi f , ΩNI
i f , ΩKmi f. Therefore an
increase in firm productivity implies greater variable profits from expanding the set of source countries
from ΩNIi f to ΩNI
i f in (29).
Proposition 4. Given wages in all countries m (wm), the set of production countries in which plants are locatedfor each firm f (ΩNP
f ), the set of export markets for each plant (ΩNIi f ), and the set of products exported from each
plant to each export market (ΩKmi f ), an increase in firm productivity (ϕi f ) increases the variable profits from an
expansion in the set of source countries for intermediate inputs from ΩNXi f to ΩNX
i f (where ΩNXi f ⊂ ΩNX
i f ).
Proof. See the appendix.
Taking Propositions 2-4 together, a second key empirical prediction of the model is that higher
firm productivity leads to an expansion of the extensive margins of the number of products exported to
each market, the number of export markets and the number of source countries for intermediate inputs.
Combining these results with those of the previous subsection, the model implies that more productive
firms participate more in the international economy along all margins simultaneously: higher exports
of each product, higher imports of each intermediate input, more products exported to each market,
more export markets and more import sources. Therefore we should expect to see that all these margins
of international participation co-move together across firms: more exports and imports on the intensive
margins should be systematically correlated with more export and import participation on the extensive
margins.
This correlation implies that a given exogenous dierence in productivity between firms has a mag-
nified impact on endogenous dierences in performance such as sales and employment, because it in-
duces firms to simultaneously expand along each of the margins of international specialization. Fur-
17

Global Firms
thermore, as more productive firms import intermediate inputs from a wider range of source countries,
this improves their supplier access and reduces their production costs, magnifying the endogenous dif-
ference in costs between firms relative to the exogenous dierence in productivity. This expansion
by more successful firms along multiple margins of international specialization, and the magnification
of primitive productivity dierences by endogenous sourcing decisions, helps to explain the extent to
which aggregate international trade is dominated by a relatively small number of firms.
3 Data
To provide empirical evidence on these margins of firm participation in the international economy, we
use the Linked-Longitudinal Firm Trade Transaction Database (LFTTD), which combines information
from three separate databases collected by the U.S. Census Bureau and the U.S. Customs Bureau. The
first dataset is the U.S. Census of Manufactures (CM), which reports data on the operation of establish-
ments in the U.S. manufacturing sector, including information on output (shipments and value-added),
inputs (capital, employment and wagebills for production and non-production workers, and materials)
and export participation (whether a firm exports and total export shipments).19
The second dataset is the Longitudinal Business Database (LBD), which records employment and
survival information for all U.S. establishments outside of agriculture, forestry and fishing, railroads,
the U.S. Postal Service, education, public administration and several other smaller sectors.20 The third
dataset includes all U.S. export and import transactions between 1992 and 2007. For each flow of goods
across a U.S. border, this dataset records the product classification(s) of the shipment, the value and
quantity shipped, the date of the shipment, the destination or source country, the transport mode used
to ship the goods, the identity of the U.S. firm engaging in the trade, and whether the trade is with a
related party or occurs at arms length.21
We aggregate the establishment-level data from the CM and LBD and the trade transactions data
up to the level of the firm. We thus obtain a dataset for each firm that contains information on firm
characteristics (e.g. industry, employment, productivity and total shipments) as well as on each of the
margins of firm international participation considered above (exports of each product, the number of
products exported to each market, the number of export markets, imports of each input, the number of
imported inputs from each source country, and the number of source countries).
19For further discussion of the CM see, for example, Bernard, Redding, and Schott (2010).20See Jarmin and Miranda (2002) for further details on the LBD.21See Bernard, Jensen, and Schott (2009) for a detailed description of the LFTTD and its construction. Related-party trade
refers to trade between U.S. companies and their foreign subsidiaries as well as trade between U.S. subsidiaries of foreigncompanies and their foreign aliates. For imports, firms are related if either owns, controls or holds voting power equivalentto 6 percent of the outstanding voting stock or shares of the other organization (see Section 402(e) of the Tari Act of 1930).For exports, firms are related if either party owns, directly or indirectly, 10 percent or more of the other party (see Section30.7(v) of The Foreign Trade Statistics Regulations).
18
Global Firms
4 Evidence on Global Firms
We now provide empirical evidence on the margins of firm international participation. Section 4.1
examines the frequency of firm exporting. Section 4.2 compares exporter and non-exporter character-
istics. Section 4.3 considers the prevalence of firm importing. Section 4.4 contrasts the characteristics of
importers, exporters, and other firms. Section 4.5 investigates the extensive margins of the number of
exported products, the number of export markets, the number of imported products, and the number
of import countries. Section 4.6 explores the relationship between each of the intensive and extensive
margins of firm participation in the international economy.
4.1 Firm Exporting
Percent of Firms
Fraction of Firms that
Export
Mean Exports as a Share of Total
Shipments311 Food Manufacturing 6.8 0.23 0.21312 Beverage and Tobacco Product 0.9 0.30 0.30313 Textile Mills 0.8 0.57 0.39314 Textile Product Mills 2.7 0.19 0.12315 Apparel Manufacturing 3.6 0.22 0.16316 Leather and Allied Product 0.3 0.56 0.19321 Wood Product Manufacturing 4.8 0.21 0.09322 Paper Manufacturing 1.5 0.48 0.06323 Printing and Related Support 11.1 0.15 0.10324 Petroleum and Coal Products 0.5 0.34 0.13325 Chemical Manufacturing 3.3 0.65 0.23326 Plastics and Rubber Products 3.9 0.59 0.11327 Nonmetallic Mineral Product 4.3 0.19 0.09331 Primary Metal Manufacturing 1.5 0.58 0.31332 Fabricated Metal Product 20.6 0.30 0.09333 Machinery Manufacturing 8.7 0.61 0.15334 Computer and Electronic Product 3.9 0.75 0.28335 Electrical Equipment, Appliance, 1.7 0.70 0.47336 Transportation Equipment 3.4 0.57 0.16337 Furniture and Related Product 6.5 0.16 0.14339 Miscellaneous Manufacturing 9.3 0.32 0.16Aggregate Manufacturing 100 0.35 0.17
NAICS Industry
Notes: Data are from the 2007 U.S. Census of Manufactures. Column 2 summarizes thedistribution of manufacturing firms across three-digit NAICS manufacturing industries.Column 3 reports the share of firms in each industry that export. Firm exports measuredusing customs information from LFTTD. The final column reports mean exports as a percentof total shipments across all firms that export in the noted industry.
Table 1: Firm Exporting
Exporting is a relatively rare firm activity. Of the 5.5 million firms operating in the United States in
2000, just 4 percent engaged in exporting. Even within the smaller set of U.S. firms active in industries
19

Global Firms
more predisposed to exporting – like those in the manufacturing, mining, or agricultural sectors that
produce tradable goods – only 15 percent were exporters.
Table 1 provides further evidence on firm export participation using data from the 2007 LFTTD
and building on the earlier results from Bernard and Jensen (1995, 1999). Column (1) reports the
share of each three-digit North American Industrial Classification (NAIC) industry in the number of
manufacturing firms, which ranges from 0.3 percent for Leather and Allied Products (316) to 20.6
percent for Fabricated Metal Products (332).
Column (2) summarizes the share of firms within each industry that export. Consistent with the
selection of only some firms into export markets in heterogeneous firm theories, around 35 percent of
firms in the U.S. manufacturing sector export. However, this share of exporters ranges rather widely,
from 75 percent of firms in Computer and Electronic Products (311) to 15 percent of firms in Printing
and Related Support (323). Comparing across the rows of the column, the variation in the share of
exporters accords with priors about industries in which the U.S. is likely to have comparative advantage.
High-skill and capital-intensive sectors such as Electrical Equipment, Appliance (335) have exporter
shares more than twice as large as those of labor-intensive sectors such as Apparel Manufacturing (315).
This variation in the share of exporters with industry factor intensity is in line with the predictions of
the model of heterogeneous firms and comparative advantage of Bernard, Redding, and Schott (2007).
Column (3) presents the average share of exports in firm shipments for each sector. Here again we
find evidence of the scarcity of trade. The average export share for manufacturing as a whole of 17
percent is substantially lower than would be predicted in a world of zero trade costs and identical and
homothetic preferences.22 Although trade costs directly reduce the share of exports in firm shipments
relative to such a frictionless world, other contributory factors are the selection of only a subset of firms
into export markets (as in Eaton, Kortum, and Kramarz (2011)) and the selection of only a subset of
products within firms into export markets (as in Bernard, Redding, and Schott (2011)).
We also find substantial variation in the average share of exports in firm shipments across industries,
ranging from a high of 47 percent in Electrical Equipment (335) to a low of 6 percent in PaperManufac-
turing (322). Furthermore, this variation again appears related to priors about comparative advantage,
with substantially higher export shares in Electrical Equipment, Appliance (335) than in Apparel Man-
ufacturing (315). This relationship is consistent with a model in which the selection of heterogeneous
firms into export markets and the selection of products within firms into export markets is influenced
by comparative advantage, as in Bernard, Redding, and Schott (2007, 2011).
Comparing the results for 2007 in Table 1 with those for 2002 in Bernard, Jensen, Redding, and
Schott (2007), we find a larger fraction of exporters and a higher share of firm exports in total shipments
in Table 1. The main reason for this dierence is that Table 1 measures firm exporting using the
22In such a frictionless world, the share of a firm’s exports in its total shipments would equal the share of the rest of the worldin world GDP, which is substantially larger than the reported export shares in Table 1 (see also Brooks (2006)).
20
Global Firms
customs records from LFTTD, whereas Bernard, Jensen, Redding, and Schott (2007) measures firm
exporting using the export question in the Census of Manufactures.23 Following the 2001 recession
and the granting of Permanent Normal Trading Relations (PNTR) to China, there was also a sharp
decline in overall employment and high rates of exit in U.S. manufacturing (as examined in Pierce and
Schott (2012)), both of which are likely to dier between exporters and non-exporters.
4.2 Exporter Characteristics
Exporters are not only rare but look systematically dierent from non-exporters. In Table 2, we high-
light these dierences by estimating export premia using the 2007 LFTTD and following the approach
of Bernard and Jensen (1995, 1999). Each cell in the table corresponds to a separate regression, in which
we regress the log of a firm characteristic on a dummy variable for whether a firm exports. Column (1)
estimates these regressions for the firm characteristics shown in the rows of the table. Since the depen-
dent variables are in logarithms, the estimated coecients can be interpreted as percentages (up to a log
approximation). We find that exporting firms have 128 percent more employment, 172 percent higher
shipments, 33 percent higher value-added per worker, and 3 percent higher total factor productivity
(TFP).24 All of these dierences are statistically significant at conventional critical values.25
Column (2) estimates the same regression including industry fixed eects to control for the fact
that export participation is correlated with industry characteristics, as discussed in the previous section.
We find smaller but still substantial within-industry dierences in performance between exporters and
non-exporters. Exporters are larger than nonexporters, by approximately 111 percent for employment
and 135 percent for shipments; they are more productive by roughly 19 percent for value-added per
worker and 4 percent for TFP; they also pay higher wages by around 9 percent. Finally, exporters
are relatively more capital- and skill-intensive than nonexporters by approximately 16 and 1 percent,
respectively. All of these dierences are again statistically significant at conventional critical values.
Column (3) shows that the estimated dierences are not driven solely by firm size. Including log firm
employment as an additional control, we continue to find statistically significant dierences between
exporters and non-exporters within the same industry for all the other firm characteristics.
23Using this alternative definition of firm exporting from the Census of Manufactures, we find a relatively similar patternof results for 2007 as for 2002 in Bernard, Jensen, Redding, and Schott (2007). Therefore the customs records from LFTTDimply that exporting is more prevalent than would be concluded based on the export question in the Census of Manufactures.
24Total Factor Productivity (TFP) is measured using the Törnqvist superlative index number of Caves, Christensen, andDiewert (1982). Since the dierences between exporters and nonexporters are often large, the log approximation can un-derstate considerably the size of these dierences. Taking exponents of the employment coecient in Column 1 of Table 2,exporting firms have 260 percent more employment (since 100*(exp(1.28)-1)=260).
25Similar performance dierences are observed between plants that ship short versus long distances within the U.S., asshown in Holmes and Stevens (2012).
21

Global Firms
(1) (2) (3)Log Employment 1.28 1.11 -Log Shipments 1.72 1.35 0.24Log Value Added per Worker 0.33 0.19 0.21Log TFP 0.03 0.04 0.04Log Wage 0.21 0.09 0.10Log Capital per Worker 0.28 0.16 0.20Log Skill per Worker 0.06 0.01 0.11
Additional Covariates None Industry Fixed Effects
Industry Fixed Effects, Log Employment
Exporter Premia
Notes: Notes: Data are for 2007 and are from the U.S. Census of Manufactures. All results are from bivariate OLS regressions of firm characteristic in first column on a dummy variable indicating firm's export status. Firm exports measured using customs information from LFTTD. Columns two and three include industry fixed effects and industry fixed effects plus log firm employment, respectively, as additional controls. Total factor productivity (TFP) is computed as in Caves et al (1982). Capital and skill per worker are capital stock and non-production workers per total employment, respectively. All results are significant at the 1 percent level except the Log Skill per Worker results in column 2 which are not significant at the 10 percent level.
Table 2: Exporter Premia
As emphasized in the theoretical framework developed above, the decision to export is endogenous.
Therefore these estimated “export premia” do not have a causal interpretation and instead capture dif-
ferences in conditional means between exporters and non-exporters. Two potential explanations for
the estimated productivity dierences are “selection into exporting” (causality runs from productivity
to exporting) and “learning by exporting” (causality runs from exporting to productivity). As pro-
ductivity dierences between future exporters and other non-exporters are typically found to predate
entry into exporting, most existing research interprets these productivity dierences as largely the re-
sult of selection in exporting (see Bernard and Jensen (1999) for U.S. evidence and Clerides and Tybout
(1998) for evidence from Mexico, Colombia, and Morocco). Therefore these findings provide empiri-
cal support for the mechanism of firm selection into export markets in the original heterogeneous firm
model and the theoretical framework developed above. More recently, a number of empirical studies
have provided evidence that firm entry into exporting can stimulate the adoption of new productivity-
enhancing technologies, including in particular Bustos (2011) and Lileeva and Trefler (2010).
While most existing research has focused on productivity dierences between exporters and non-
exporters, the results in Table 2 emphasize that exporters dier from non-exporters along a number
of other dimensions. The estimated dierences in size, wages, capital and skill-intensity are also much
larger than those in TFP, consistent with the idea that primitive dierences in technology aect a
22

Global Firms
number of firm decision margins, leading to endogenous dierences in firm outcomes that are larger
than these primitive dierences in technology. Burstein and Vogel (2015) and Harrigan and Reshef
(2015) explore complementarities between heterogeneous firm technology and the skill-intensity of
production. Helpman, Itskhoki, and Redding (2010) and Helpman, Itskhoki, Muendler, and Redding
(2015) examine endogenous dierences in workforce composition. In such a setting, the increase in the
dispersion of revenues across firms as a result of firm selection into exportmarkets increases the dispersion
of wages across firms, thereby providing a new mechanism for trade to aect wage inequality.26
A subsequent empirical literature has used linked employer-employee datasets to decompose the
exporter wage premium into the contributions of unobserved dierences in workforce composition
and wage premia for workers with identical characteristics. Following Abowd, Kramarz, and Margo-
lis (1999), Abowd, Creecy, and Kramarz (2002), this literature typically assumes that the production
function is log additively separable in worker ability and that the switching of workers between firms is
random conditional on firm fixed eects, worker fixed eects and time-varying worker observables. In
general, this literature finds a role for both unobserved dierences in workforce composition and wage
premia, with their relative contributions varying across studies, as in Baumgarten (2013), Davidson,
Heyman, Matusz, Sjöholm, and Zhu (2014), Frías, Kaplan, and Verhoogen (2015), Krishna, Poole, and
Senses (2014), Munch and Skaksen (2008) and Schank, Schnabel, and Wagner (2007).
4.3 Firm Importing
With the emergence of trade transactions datasets based on customs records that can be merged to
firms, researchers have gained access to information about firm importing as well as exporting. These
new trade transactions data have revealed that firm importing displays many of the same features as firm
exporting.
Table 3 compares firm exporting and importing using the 2007 LFTTD, updating results for an
earlier year in Bernard, Jensen, Redding, and Schott (2007). Column (1) reproduces the share of each
three-digit North American Industrial Classification (NAIC) industry in the number of manufactur-
ing firms from Table 1; Column (2) reproduces the share of firms within each industry that export
from Table 1; Column (3) reports the share of firms within each industry that import; and Column (4)
summarizes the share of firms within each industry that both export and import.
26For a review of the literature on heterogeneous workers and trade, see Grossman (2013).
23

Global Firms
Percent of All Firms
Fraction of Firms that
Export
Fraction of Firms that
Import
Fraction of Firms that Import & Export
311 Food Manufacturing 6.8 0.23 0.15 0.10312 Beverage and Tobacco Product 0.9 0.30 0.18 0.11313 Textile Mills 0.8 0.57 0.44 0.37314 Textile Product Mills 2.7 0.19 0.14 0.09315 Apparel Manufacturing 3.6 0.22 0.23 0.15316 Leather and Allied Product 0.3 0.56 0.53 0.40321 Wood Product Manufacturing 4.8 0.21 0.09 0.06322 Paper Manufacturing 1.5 0.48 0.25 0.21323 Printing and Related Support 11.1 0.15 0.05 0.03324 Petroleum and Coal Products 0.5 0.34 0.18 0.14325 Chemical Manufacturing 3.3 0.65 0.40 0.36326 Plastics and Rubber Products 3.9 0.59 0.34 0.29327 Nonmetallic Mineral Product 4.3 0.19 0.15 0.09331 Primary Metal Manufacturing 1.5 0.58 0.32 0.29332 Fabricated Metal Product 20.6 0.30 0.12 0.10333 Machinery Manufacturing 8.7 0.61 0.30 0.28334 Computer and Electronic Product 3.9 0.75 0.50 0.47335 Electrical Equipment, Appliance, 1.7 0.70 0.46 0.41336 Transportation Equipment 3.4 0.57 0.35 0.31337 Furniture and Related Product 6.5 0.16 0.12 0.07339 Miscellaneous Manufacturing 9.3 0.32 0.20 0.17Aggregate Manufacturing 100 0.35 0.20 0.16
NAICS Industry
Notes: Data are for 2007 and are for firms that appear in both the U.S. Census of Manufacturers and the LFTTD. Firmexports and imports measured using customs information from LFTTD. Column 2 summarizes the distribution ofmanufacturing firms across three-digit NAICS industries. Remaining columns report the percent of firms in eachindustry that export, import and do both.
Table 3: Firm Importing and Exporting
Comparing Columns (2) and (3), importers like exporters are relatively rare, accounting for around
20 percent of firms in the U.S. manufacturing sector as a whole. Again there is substantial variation
across industries, with the share of importers ranging from a low of 5 percent in Printing and Related
Support (323) to a high of 50 percent in Computer and Electronic Product (334). Although traditional
models of international trade assume a representative firm (and hence do not explain why only some
firms trade within industries), one could try to rationalize the variation across industries in the share of
firms that export and import in terms of comparative advantage. Such an explanation would predict a
negative relationship between the share of firms that export (highest in comparative advantage indus-
tries) and the share of firms that import (highest in comparative disadvantage industries). In contrast to
this prediction, we find a strong positive correlation across industries between the share of firms that
export and import. In the theoretical framework developed above, this positive correlation can be gen-
erated by variation across industries in the fixed costs of participating in international markets (with the
shares of both exporting and importing firms higher in industries with lower values of both the fixed
exporting and sourcing costs). The theoretical model also identifies another economic mechanism that
contributes towards this positive correlation across industries: the higher the share of firms that import,
24

Global Firms
the greater firm supplier access and the lower production costs, thereby increasing export profitability
and the share of firms that export.
Comparing Columns (2)-(3) to the fraction of firms that both export and import in Column (4),
it is clear that a substantial fraction of firms that engage one margin of international participation also
engage in the other. Again this pattern is consistent with the theoretical model developed above, in
which there is a complementarity between exporting and importing. On the one hand, incurring the
fixed cost to export increases firm sales and output, which makes it more likely that the firm will find
it profitable to incur the fixed cost to import. On the other hand, incurring the fixed cost to import
reduces firm production costs and prices, which in turn increases firm sales and output, which makes it
more likely that the firm will find it profitable to incur the fixed cost to export.
While Table 3 reports results for firms in the U.S. manufacturing sector, many firms in other sectors
export or import manufacturing products or other goods. A small body of research has sought to analyze
the trade behavior of such intermediaries, wholesalers and retailers, including Ahn, Khandelwal, and
Wei (2011), Akerman (2010), Antràs andCostinot (2011), Bernard, Grazzi, andTomasi (2014), Bernard,
Jensen, Redding, and Schott (2010b) and Blum, Claro, and Horstmann (2000).
4.4 Importer Characteristics
Importers exhibit many of the same characteristics as exporters. In Table 4, we highlight this by esti-
mating trading premia using the 2007 LFTTD, updating results for an earlier year in Bernard, Jensen,
Redding, and Schott (2007). Each cell in the table again corresponds to a separate regression, in which
we regress the log of a firm characteristic on a dummy variable for whether a firm exports (Column
(1)), imports (Column (2)) or both exports and imports (Column (3)). We estimate these regressions
for the log firm characteristic shown in the rows of the tables. All three columns include industry fixed
eects and hence capture within-industry dierences in performance between trading and domestic
firms. All three specifications also control for firm size (log employment) for all characteristics except
log employment.
25

Global Firms
Exporter Premia Importer PremiaExporter &
Importer PremiaLog Employment 1.11 1.20 1.39Log Shipments 0.24 0.32 0.36Log Value Added per Worker 0.21 0.25 0.28Log TFP 0.04 0.03 0.03Log Wage 0.10 0.09 0.11Log Capital per Worker 0.20 0.28 0.34Log Skill per Worker 0.11 0.16 0.18Notes: Data are for 2007 and are for firms that appear in both the U.S. Census of Manufacturersand the LFTTD. All results are from bivariate OLS regressions of firm characteristic in firstcolumn on dummy variable noted at the top of each column as well as industry fixed effectsand firm employment as additional controls. Firm exports and imports measured using customsinformation from LFTTD. Employment regressions omit firm employment as a covariate. Totalfactor productivity (TFP) is computed as in Caves et al (1982). Capital and skill per worker arecapital stock and non-production workers per total employment, respectively. All results aresignificant at the 1 percent level.
Table 4: Exporter and Importer Premia
Comparing Columns (1) and (2), we find that the performance dierences between importers and
other firms are of around the same magnitude as those between exporters and other firms. Controlling
for size, importers are larger than other firmswithin the same industry, by approximately 120 percent for
employment and 32 percent for shipments; they are more productive by roughly 25 percent for value-
added per worker and 3 percent for TFP; they also pay higher wages by around 9 percent. Finally,
importers are relatively more capital- and skill-intensive than other firms within the same industry by
approximately 28 and 16 percent, respectively, after controlling for size.27 Comparing Column (3)
to Columns (1)-(2), we find that these estimated performance dierences between exporters/importers
and other firms are partly driven by firms that both export and import. Indeed, we find that the most
globally engaged firms that engage in both of these forms of participation in the global economy exhibit
the largest performance dierences relative to other firms.28 Therefore, in line with the theoretical
framework above, more productive firms participate in the international economy in more ways than
less productive firms.
Motivated by the early empirical findings frommicro datasets on plants and firms that contained only
export information, the paradigmatic heterogeneous firm model following Melitz (2003) concentrates
on firm exporting. However, a growing body of theoretical and empirical research examines firm
decisions to participate in international markets through both exporting and importing, including Amiti
and Davis (2011), Amiti, Itskhoki, and Konings (2015) Antràs, Fort, and Tintelnot (2014), Blaum,
Lelarge, and Peters (2013, 2014), Eaton, Kortum, Kramarz, and Sampognaro (2014), Fort (2014) and27Since the dierences between importers and other firms are sometimes large, the log approximation again can understate
considerably the size of these dierences. Taking exponents of the employment coecient in Column (2) of Table 4, importingfirms have 232 percent more employment (since 100*(exp(1.20)-1)=232).
28While we focus on firm exporting and importing, similar performance dierences are observed between multinationalsand other firms. See for example Doms and Jensen (1998), Helpman, Melitz, and Yeaple (2004) and Yeaple (2009).
26

Global Firms
Oberfield (2015). An extreme internationalization of production occurs when a firm oshores all stages
of production abroad and becomes a “factory-less goods producing firm.” Such firms are like domestic
manufacturers, in the sense that they design the goods they sell and coordination production activities,
and yet their domestic employment is concentrated outside manufacturing. Bernard and Fort (2015),
show that these factory-less goods producing firms account for an increasing share of U.S. employment
over time.
In the theoretical framework developed above, sourcing inputs from foreign countries reduces firm
variable production costs by expanding the set of locations from which the lowest-cost supplier of each
intermediate input can be chosen. Consistent with this prediction, Blaum, Lelarge, and Peters (2014)
finds a modest increase in firm productivity from importing, of around 5 percent for the median firm
relative to autarky. As larger firms have higher import intensities, the aggregate gains from importing
are larger and range from 16 to 47 percent, depending on the strength of interlinkages between firms.
4.5 Extensive Margins of Firm Exporting and Importing
One of the central features of the theoretical framework developed above is that firms decide to partic-
ipate in the international economy along multiple extensive margins: the number of products to export
to each market, the number of export markets, the number of intermediate inputs to import from each
source country, and the number of countries from which to source intermediate inputs. We now use
U.S. export and import transactions data to provide evidence on these firm extensive margin decisions.29
In Table 5, we report the joint distributions for exporting firms across the number of products
exported (rows) and the number of markets served (columns). The top panel reports the percentage of
exporting firms; the middle panel reports the percentage of export value; and the bottom panel reports
the percentage of exporter employment. The cells in each panel sum to 100. Comparing results across
the three panels, we find that around 35 percent exporters ship one product to one market (top panel, top
left cell), but they account for only 11 percent of employment (bottom panel, top left cell) and a mere
1 percent of export value (middle panel, top left cell). In contrast, the 5 percent of exporters that ship
eleven or more products to eleven or more markets (top panel, bottom right cell) account for around
46 percent of employment (bottom panel, bottom right cell) and nearly 80 percent of export value
(middle panel, bottom right cell). Across all three panels, the diagonal terms in each panel tend to be
large relative to the o-diagonal terms, so that firms that export to many markets also on average export
many products. This pattern of results is consistent with the positive correlation between the dierent
margins of firm international participation in the theoretical framework above. More successful firms
export more of each product to each market, as well as exporting more products to each market and
exporting to more markets, thereby ensuring that relatively few firms account for most of aggregate
29As discussed in the data section, we aggregate the data on individual trade transactions by firm, product, destination andyear. Relatively little research has explored the properties of these data at a more disaggregated level, with some exceptionssuch as Hornok and Koren (2014) and Hornok and Koren (2015).
27
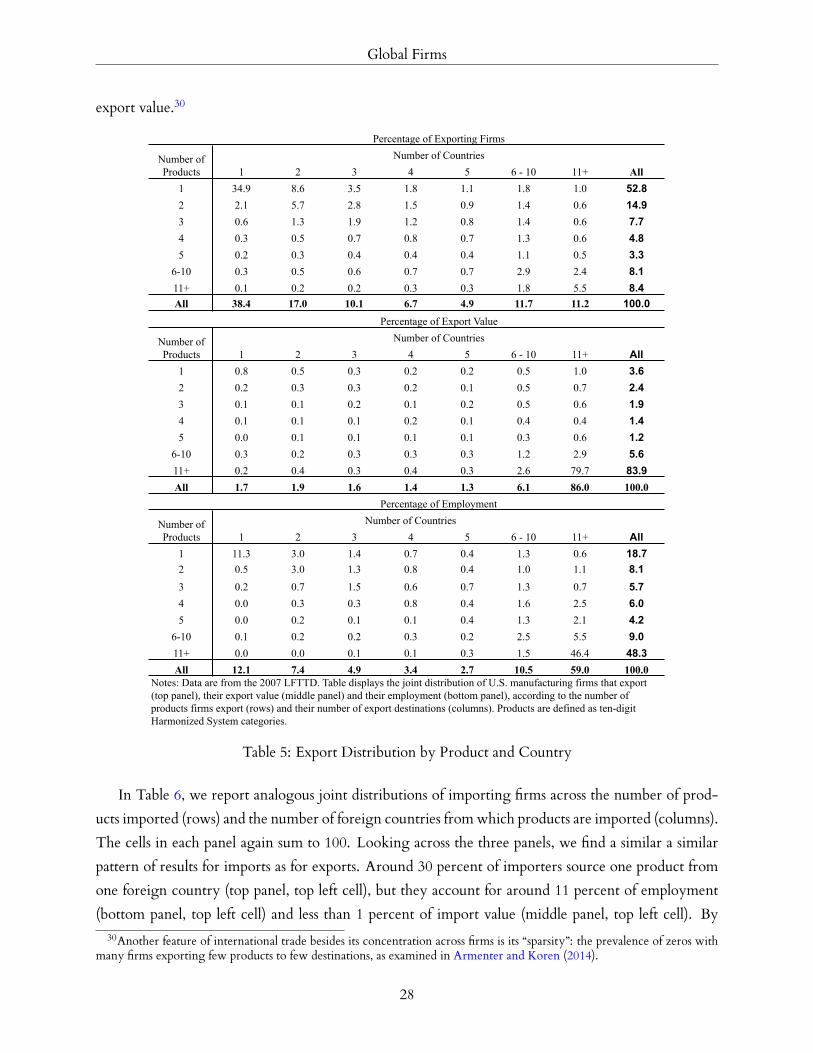
Global Firms
export value.30
1 2 3 4 5 6 - 10 11+ All1 34.9 8.6 3.5 1.8 1.1 1.8 1.0 52.82 2.1 5.7 2.8 1.5 0.9 1.4 0.6 14.93 0.6 1.3 1.9 1.2 0.8 1.4 0.6 7.74 0.3 0.5 0.7 0.8 0.7 1.3 0.6 4.85 0.2 0.3 0.4 0.4 0.4 1.1 0.5 3.3
6-10 0.3 0.5 0.6 0.7 0.7 2.9 2.4 8.111+ 0.1 0.2 0.2 0.3 0.3 1.8 5.5 8.4All 38.4 17.0 10.1 6.7 4.9 11.7 11.2 100.0
1 2 3 4 5 6 - 10 11+ All1 0.8 0.5 0.3 0.2 0.2 0.5 1.0 3.62 0.2 0.3 0.3 0.2 0.1 0.5 0.7 2.43 0.1 0.1 0.2 0.1 0.2 0.5 0.6 1.94 0.1 0.1 0.1 0.2 0.1 0.4 0.4 1.45 0.0 0.1 0.1 0.1 0.1 0.3 0.6 1.2
6-10 0.3 0.2 0.3 0.3 0.3 1.2 2.9 5.611+ 0.2 0.4 0.3 0.4 0.3 2.6 79.7 83.9All 1.7 1.9 1.6 1.4 1.3 6.1 86.0 100.0
1 2 3 4 5 6 - 10 11+ All1 11.3 3.0 1.4 0.7 0.4 1.3 0.6 18.72 0.5 3.0 1.3 0.8 0.4 1.0 1.1 8.13 0.2 0.7 1.5 0.6 0.7 1.3 0.7 5.74 0.0 0.3 0.3 0.8 0.4 1.6 2.5 6.05 0.0 0.2 0.1 0.1 0.4 1.3 2.1 4.2
6-10 0.1 0.2 0.2 0.3 0.2 2.5 5.5 9.011+ 0.0 0.0 0.1 0.1 0.3 1.5 46.4 48.3All 12.1 7.4 4.9 3.4 2.7 10.5 59.0 100.0
Number of CountriesPercentage of Exporting Firms
Number of CountriesNumber of Products
Number of Products
Number of CountriesPercentage of Export Value
Percentage of Employment
Number of Products
Notes: Data are from the 2007 LFTTD. Table displays the joint distribution of U.S. manufacturing firms that export (top panel), their export value (middle panel) and their employment (bottom panel), according to the number of products firms export (rows) and their number of export destinations (columns). Products are defined as ten-digit Harmonized System categories.
Table 5: Export Distribution by Product and Country
In Table 6, we report analogous joint distributions of importing firms across the number of prod-
ucts imported (rows) and the number of foreign countries fromwhich products are imported (columns).
The cells in each panel again sum to 100. Looking across the three panels, we find a similar a similar
pattern of results for imports as for exports. Around 30 percent of importers source one product from
one foreign country (top panel, top left cell), but they account for around 11 percent of employment
(bottom panel, top left cell) and less than 1 percent of import value (middle panel, top left cell). By30Another feature of international trade besides its concentration across firms is its “sparsity”: the prevalence of zeros with
many firms exporting few products to few destinations, as examined in Armenter and Koren (2014).
28

Global Firms
comparison, the 3 percent of importers that ship eleven or more products to eleven or more markets
(top panel, bottom right cell) account for around 46 percent of employment (bottom panel, bottom
right cell) and approximately 76 percent of export value (middle panel, bottom right cell). We again
find that the diagonal terms in each panel tend to be large relative to the o-diagonal terms, imply-
ing that firms that import from many countries also on average import many products. These results
again confirm the positive correlation between the dierent margins of international participation in
the model. More successful firms import more of each product from each country, as well as import-
ing more products from each country and importing from more countries, thereby again enabling a
relatively small number of firms to be responsible for most of aggregate import value.
More broadly, these findings provide additional support for a growing body of research that em-
phasizes the importance of the extensive margins of firm selection into export markets for aggregate
trade. Comparing the Krugman (1980) model to the Melitz (2003) model with an untruncated Pareto
productivity distribution, Chaney (2008) shows that the presence of the extensive margin in the hetero-
geneous firm model reverses the relationship between the elasticity of substitution and the sensitivity
of trade flows to trade costs. Using firm export data from France, Eaton, Kortum, and Kramarz (2004)
decompose the variation in aggregate exports across destination markets, and show that the extensive
margin of the number of exporting firms accounts for over 60 percent of the variation.31 Using the same
French data, Eaton, Kortum, and Kramarz (2011) structurally estimate an extension of the paradigmatic
model of heterogeneous firms and trade and show that the extensive margin of firm export participation
plays a central role in shaping the eects of a counterfactual 10 percent in bilateral trade barriers for all
French firms.32 Most of the overall increase in French exports of around $16 million is accounted for
by a rise in the sales of the top decile of firms of around $23 million.33 In contrast, every other decile
of firms experiences a decline in sales, with around half the firms in the bottom decile exiting. Using
a gravity equation specification, Helpman, Melitz, and Rubinstein (2008) show that incorporating the
extensive margin of firm selection into export markets is consequential for estimates of the impact of
standard trade frictions (such as distance and whether countries share a common border) on trade flows.31Following trade liberalization reforms, Kehoe and Ruhl (2013) find that much of the growth in overall trade occurs in
goods that were not previously exported or were only previously exported in small amounts.32Other quantitative analyses of models of heterogeneous firms and trade include the study of trade integration in Corcos,
Del Gatto, Mion, and Ottaviano (2012), the analysis of the impact of China’s productivity growth on world welfare in Hsiehand Ossa (2011), the investigation of patterns of trade in Bangladesh’s apparel sector in Cherkashin, Demidova, Kee, andKrishna (2010), and the exploration of foreign direct investment (FDI) activity in Irarrazabal, Opromolla, and Moxnes (2013).
33The importance of the extensive margins in understanding variation in aggregate trade flows does not necessarily implythat they are relevant for measuring the aggregate welfare gains from trade. For the circumstances under which the aggregategains from trade can be summarized by a constant trade elasticity and an aggregate domestic trade share in the paradigmaticmodel of heterogeneous firms, see Arkolakis, Costinot, and Rodriguez-Clare (2012) and Melitz and Redding (2015).
29

Global Firms
1 2 3 4 5 6 - 10 11+ All1 29.7 8.5 4.1 2.5 1.6 3.6 2.1 52.12 2.4 5.3 3.1 1.8 1.3 3.2 2.3 19.33 0.6 1.2 1.5 1.2 0.8 2.3 2.1 9.64 0.2 0.4 0.5 0.6 0.5 1.6 1.6 5.55 0.1 0.2 0.2 0.3 0.3 1.1 1.4 3.5
6-10 0.1 0.2 0.2 0.3 0.3 1.6 3.9 6.611+ 0.0 0.0 0.0 0.0 0.0 0.2 3.0 3.4All 33.0 15.7 9.7 6.6 4.9 13.5 16.5 100.0
1 2 3 4 5 6 - 10 11+ All1 0.6 0.5 0.3 0.2 0.2 0.6 0.5 3.02 0.2 0.3 0.2 0.3 0.2 0.8 1.0 3.03 0.1 0.2 0.2 0.2 0.2 0.8 1.2 2.84 0.1 0.1 0.1 0.2 0.1 0.4 1.2 2.35 0.0 0.0 0.1 0.1 0.1 0.4 1.3 2.0
6-10 0.0 0.0 0.1 0.2 0.2 1.3 7.1 8.911+ 0.0 0.2 0.0 0.1 0.1 1.1 76.4 78.0All 1.0 1.4 1.1 1.2 1.1 5.5 88.7 100.0
1 2 3 4 5 6 - 10 11+ All1 11.3 3.0 1.4 0.7 0.4 1.3 0.6 18.72 0.5 3.0 1.3 0.8 0.4 1.0 1.1 8.13 0.2 0.7 1.5 0.6 0.7 1.3 0.7 5.74 0.0 0.3 0.3 0.8 0.4 1.6 2.5 6.05 0.0 0.2 0.1 0.1 0.4 1.3 2.1 4.2
6-10 0.1 0.2 0.2 0.3 0.2 2.5 5.5 9.011+ 0.0 0.0 0.1 0.1 0.3 1.5 46.4 48.3All 12.1 7.4 4.9 3.4 2.7 10.5 59.0 100.0
Number of Products
Share of Importing FirmsNumber of Countries
Share of Import ValueNumber of Countries
Share of EmploymentNumber of Countries
Notes: Data are from the 2007 LFTTD. Table displays the joint distribution of U.S. manufacturing firms that import (top panel), their import value (middle panel) and their employment (bottom panel), according to the number of products firms import (rows) and their number of import sources (columns). Products are defined as ten-digit Harmonized System categories.
Number of Products
Number of Products
Table 6: Import Distribution by Product and Country
Other research has established the importance of the extensive margin of the number of products
exported to each market within firms. Bernard, Redding, and Schott (2011) develops a general equilib-
riummodel of multiple-product, multiple-destination firms, which features heterogeneity and selection
across products within firms as well as across firms.34 Firms choose whether to export to each market
and the range of products to export to each market. Under the assumption of untruncated Pareto
distributions for firm productivity and product attributes, the model implies log linear relationships for
aggregate trade, the intensive margin of average exports per firm-product conditional on positive trade,
34Other recent research on multi-product firms in international trade includes Arkolakis, Muendler, and Ganapati (2014),Eckel and Neary (2010), Feenstra and Ma (2008), Mayer, Melitz, and Ottaviano (2013) and Nocke and Yeaple (2014).
30

Global Firms
and the extensive margin of the number of firm-product observations with positive trade. Estimating
these gravity equation relationships using U.S. trade transactions data, the negative eect of distance on
aggregate bilateral trade is largely explained by the extensive margin of the number of firm-product
observations with positive trade. Although distance reduces the intensive margin of exports of a given
product by a given firm, average firm-product exports conditional on positive trade are largely uncor-
related with distance, because of endogenous changes in export composition.35
More recent research has begun to provide evidence on the extensive margins of firm importing.
As discussed above, Antràs, Fort, and Tintelnot (2014) develops a quantitative multi-country sourcing
model in which heterogeneous firms self-select into importing based on their productivity and country-
specific variables (wages, trade costs, and technology).36 For parameter values for which firm importing
decisions are complementary across source countries, firm import participation exhibits a strict hierar-
chy, according to which the number of countries from which a firm sources is (weakly) increasing in
its productivity. The presence of endogenous import sourcing decisions plays a central important role
in shaping the eects of a counterfactual shock of increased import competition from China. While this
common import competition shock decreases overall domestic sourcing and employment, some firms
can be induced to select into sourcing from China as a result of the shock. For parameter values for
which importing decisions are complementary across source countries, these firms on average increase
their input purchases not only from China, but also from the U.S. and other countries.
4.6 Co-movement in the Margins of International Participation
We now provide further evidence on one of the model’s key predictions of co-movement across the
margins of firm participation in international markets. In Table 7, we calculate the correlations of log
value (total trade, imports, exports and total related-party trade) and log counts (import and export
counts of country-products, products, and countries) for firms with positive values in the category. In
every case we find positive and significant correlations across the dierent dimensions of international
activity of the firm. Perhaps unsurprisingly, total firm trade is strongly positively correlated with firm
exports and imports as well as total related-party trade. In addition, however, we see that export value
and counts of export products and countries are positively related to similar measures on the import
side. As predicted by the model, firms that source from more countries, or import more products, also
export more products to more countries and the total value of their exports is higher.
35As shown in Bernard, Jensen, Redding, and Schott (2009), the extensive margins of the number of number of exportedproducts and export markets account for much of the cross-section variation in aggregate U.S. exports and imports. Over shorttime horizons, the intensive margin of average trade conditional on trade being positive is relatively more important, and theextensive and intensive margins behave dierently for arms-length versus related-party trade in response to macroeconomicshocks such as the 1997 Asian financial crisis.
36Using French firm import data, Blaum, Lelarge, and Peters (2013) provide evidence that larger firms spend relativelymore on their most important import variety, and examine three mechanisms that can account for this finding: a comple-mentarity between input quality and firm productivity, a search process by which larger firms search for foreign suppliersmore intensively, and the presence of intra-firm trade.
31
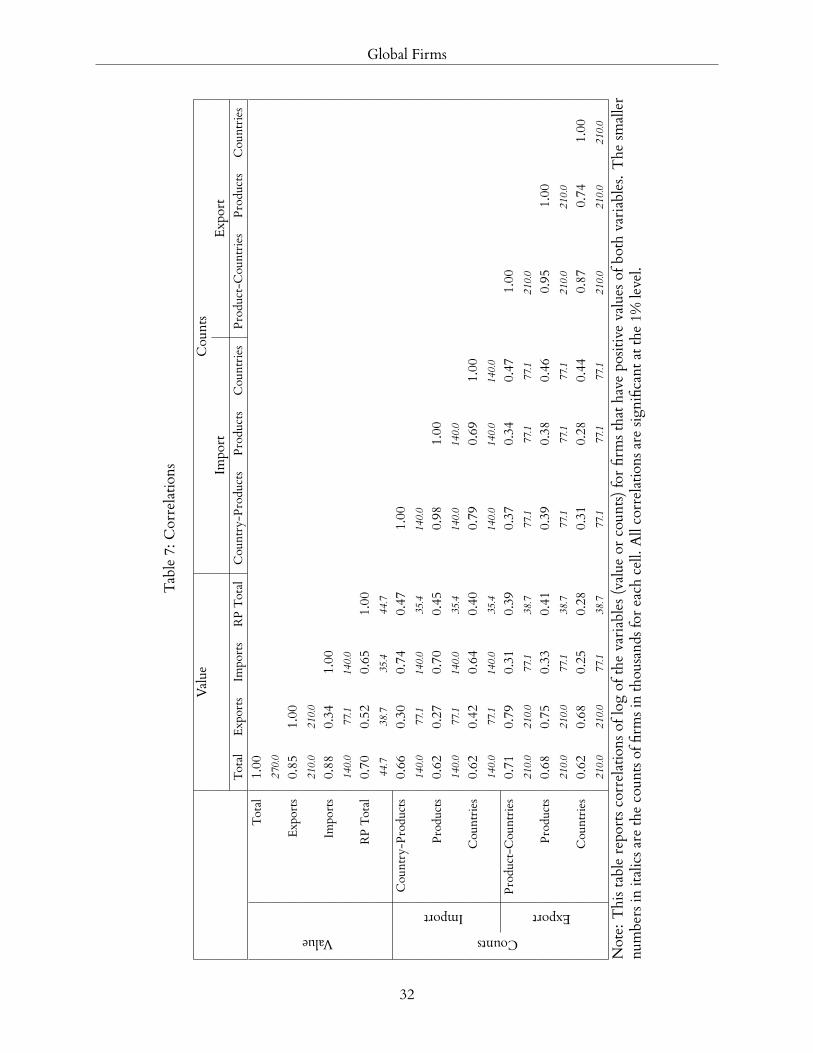
Global Firms
Table7:
Correlatio
ns
Value
Cou
nts
Impo
rtEx
port
Total
Expo
rts
Impo
rts
RPTotal
Cou
ntry-P
rodu
cts
Prod
ucts
Cou
ntries
Prod
uct-Cou
ntries
Prod
ucts
Cou
ntries
Value
Total
1.00
270.0
Expo
rts
0.85
1.00
210.0
210.0
Impo
rts
0.88
0.34
1.00
140.0
77.1
140.0
RPTotal
0.70
0.52
0.65
1.00
44.7
38.7
35.4
44.7
Counts
Import
Cou
ntry-P
rodu
cts
0.66
0.30
0.74
0.47
1.00
140.0
77.1
140.0
35.4
140.0
Prod
ucts
0.62
0.27
0.70
0.45
0.98
1.00
140.0
77.1
140.0
35.4
140.0
140.0
Cou
ntries
0.62
0.42
0.64
0.40
0.79
0.69
1.00
140.0
77.1
140.0
35.4
140.0
140.0
140.0
Export
Prod
uct-Cou
ntries
0.71
0.79
0.31
0.39
0.37
0.34
0.47
1.00
210.0
210.0
77.1
38.7
77.1
77.1
77.1
210.0
Prod
ucts
0.68
0.75
0.33
0.41
0.39
0.38
0.46
0.95
1.00
210.0
210.0
77.1
38.7
77.1
77.1
77.1
210.0
210.0
Cou
ntries
0.62
0.68
0.25
0.28
0.31
0.28
0.44
0.87
0.74
1.00
210.0
210.0
77.1
38.7
77.1
77.1
77.1
210.0
210.0
210.0
Note:
Thistablerepo
rtsc
orrelatio
nsof
logof
thevariables(valueor
coun
ts)forfirmsthath
avepositivevalues
ofbo
thvariables.The
smaller
numbersin
italicsare
thecoun
tsof
firmsinthou
sand
sfor
each
cell.
Allcorrelations
aresig
nificantatthe
1%level.
32
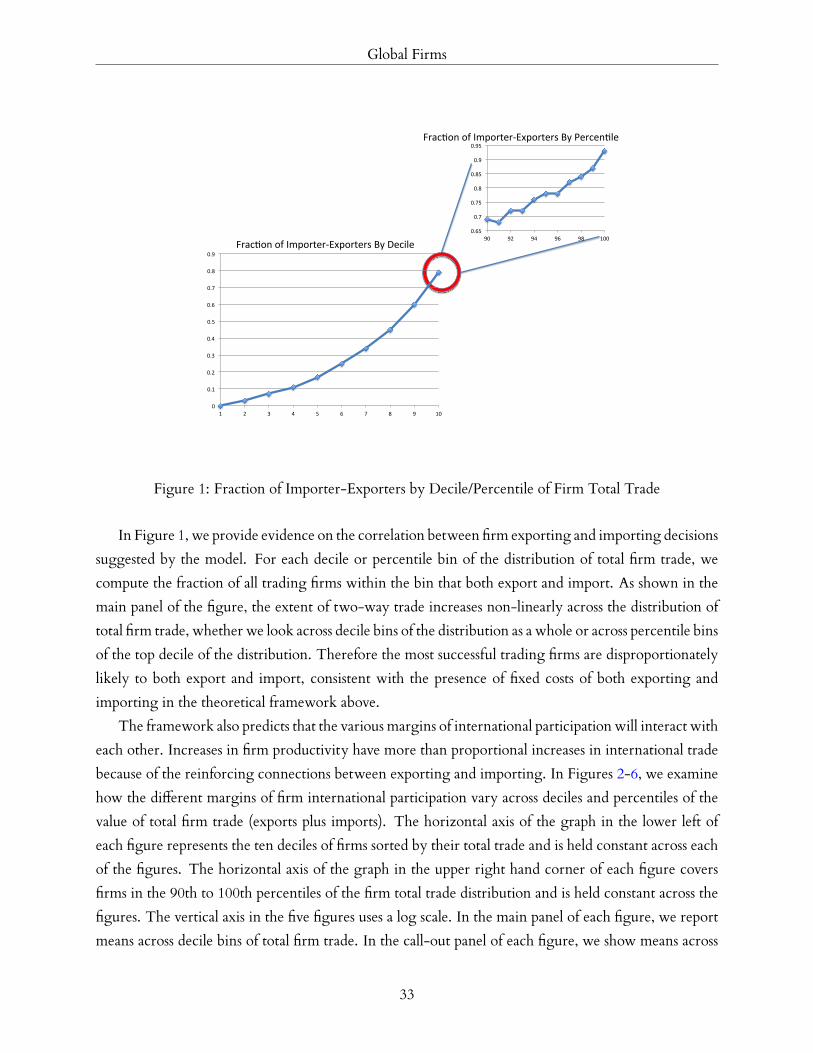
Global Firms
Frac%on of Importer-‐Exporters By Decile
Frac%on of Importer-‐Exporters By Percen%le
0
0.1
0.2
0.3
0.4
0.5
0.6
0.7
0.8
0.9
1 2 3 4 5 6 7 8 9 10
0.65
0.7
0.75
0.8
0.85
0.9
0.95
90 92 94 96 98 100
Figure 1: Fraction of Importer-Exporters by Decile/Percentile of Firm Total Trade
In Figure 1, we provide evidence on the correlation between firm exporting and importing decisions
suggested by the model. For each decile or percentile bin of the distribution of total firm trade, we
compute the fraction of all trading firms within the bin that both export and import. As shown in the
main panel of the figure, the extent of two-way trade increases non-linearly across the distribution of
total firm trade, whether we look across decile bins of the distribution as a whole or across percentile bins
of the top decile of the distribution. Therefore the most successful trading firms are disproportionately
likely to both export and import, consistent with the presence of fixed costs of both exporting and
importing in the theoretical framework above.
The framework also predicts that the various margins of international participationwill interact with
each other. Increases in firm productivity have more than proportional increases in international trade
because of the reinforcing connections between exporting and importing. In Figures 2-6, we examine
how the dierent margins of firm international participation vary across deciles and percentiles of the
value of total firm trade (exports plus imports). The horizontal axis of the graph in the lower left of
each figure represents the ten deciles of firms sorted by their total trade and is held constant across each
of the figures. The horizontal axis of the graph in the upper right hand corner of each figure covers
firms in the 90th to 100th percentiles of the firm total trade distribution and is held constant across the
figures. The vertical axis in the five figures uses a log scale. In the main panel of each figure, we report
means across decile bins of total firm trade. In the call-out panel of each figure, we show means across
33

Global Firms
percentile bins of the top decile of total firm trade.
100
1000
10000
100000
1000000
10000000
100000000
1 2 3 4 5 6 7 8 9 10
Total Trade Total Imports Total Exports
1000000
10000000
100000000
1E+09
90 92 94 96 98 100
Total Trade Total Imports Total Exports Average Trade By Decile
Average Trade By PercenEle
Figure 2: Value of Firm Exports, Imports and Total Trade by Decile/Percentile of Firm Total Trade
10
100
1000
10000
100000
1000000
10000000
100000000
1 2 3 4 5 6 7 8 9 10
RelatedPartyImports RelatedPartyExports TotalRelatedPartyTrade
AverageRelatedPartyTradeByDecile
AverageRelatedPartyTradeByPercenEle
100000
1000000
10000000
100000000
1E+09
90 92 94 96 98 100
Figure 3: Value Firm Related-Party Trade by Decile/Percentile of Firm Total Trade
34
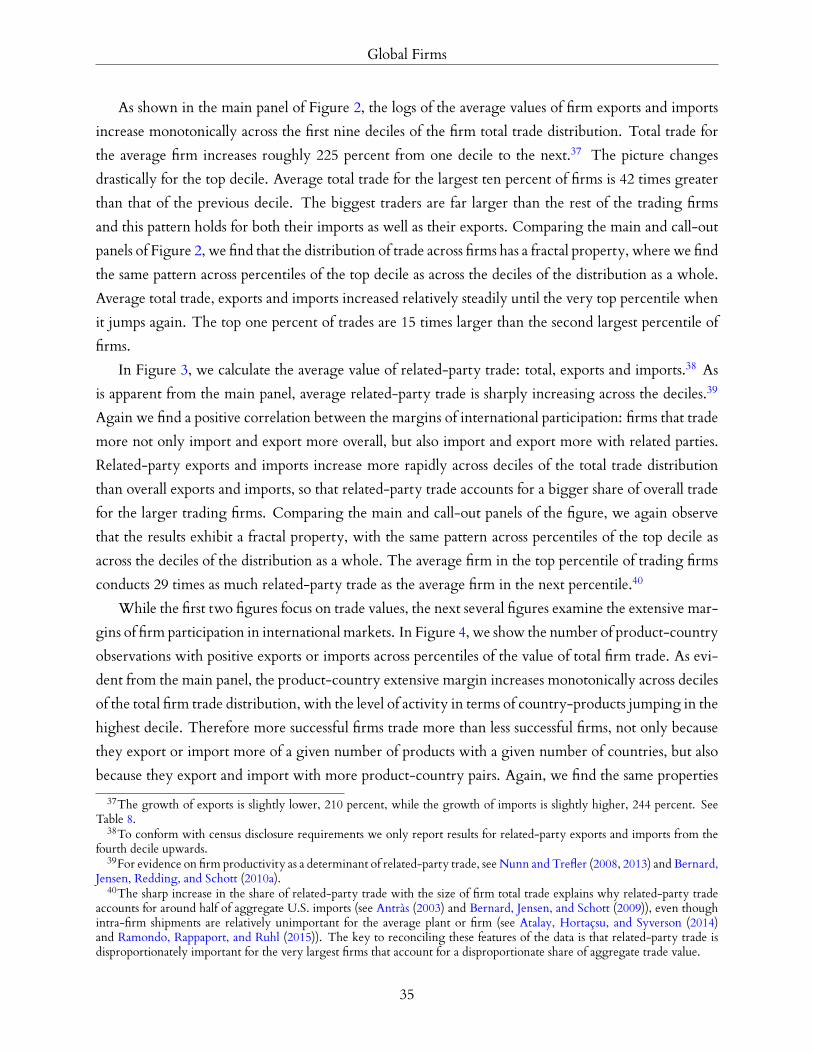
Global Firms
As shown in the main panel of Figure 2, the logs of the average values of firm exports and imports
increase monotonically across the first nine deciles of the firm total trade distribution. Total trade for
the average firm increases roughly 225 percent from one decile to the next.37 The picture changes
drastically for the top decile. Average total trade for the largest ten percent of firms is 42 times greater
than that of the previous decile. The biggest traders are far larger than the rest of the trading firms
and this pattern holds for both their imports as well as their exports. Comparing the main and call-out
panels of Figure 2, we find that the distribution of trade across firms has a fractal property, where we find
the same pattern across percentiles of the top decile as across the deciles of the distribution as a whole.
Average total trade, exports and imports increased relatively steadily until the very top percentile when
it jumps again. The top one percent of trades are 15 times larger than the second largest percentile of
firms.
In Figure 3, we calculate the average value of related-party trade: total, exports and imports.38 As
is apparent from the main panel, average related-party trade is sharply increasing across the deciles.39
Again we find a positive correlation between the margins of international participation: firms that trade
more not only import and export more overall, but also import and export more with related parties.
Related-party exports and imports increase more rapidly across deciles of the total trade distribution
than overall exports and imports, so that related-party trade accounts for a bigger share of overall trade
for the larger trading firms. Comparing the main and call-out panels of the figure, we again observe
that the results exhibit a fractal property, with the same pattern across percentiles of the top decile as
across the deciles of the distribution as a whole. The average firm in the top percentile of trading firms
conducts 29 times as much related-party trade as the average firm in the next percentile.40
While the first two figures focus on trade values, the next several figures examine the extensive mar-
gins of firm participation in international markets. In Figure 4, we show the number of product-country
observations with positive exports or imports across percentiles of the value of total firm trade. As evi-
dent from the main panel, the product-country extensive margin increases monotonically across deciles
of the total firm trade distribution, with the level of activity in terms of country-products jumping in the
highest decile. Therefore more successful firms trade more than less successful firms, not only because
they export or import more of a given number of products with a given number of countries, but also
because they export and import with more product-country pairs. Again, we find the same properties
37The growth of exports is slightly lower, 210 percent, while the growth of imports is slightly higher, 244 percent. SeeTable 8.
38To conform with census disclosure requirements we only report results for related-party exports and imports from thefourth decile upwards.
39For evidence on firm productivity as a determinant of related-party trade, see Nunn and Trefler (2008, 2013) and Bernard,Jensen, Redding, and Schott (2010a).
40The sharp increase in the share of related-party trade with the size of firm total trade explains why related-party tradeaccounts for around half of aggregate U.S. imports (see Antràs (2003) and Bernard, Jensen, and Schott (2009)), even thoughintra-firm shipments are relatively unimportant for the average plant or firm (see Atalay, Hortaçsu, and Syverson (2014)and Ramondo, Rappaport, and Ruhl (2015)). The key to reconciling these features of the data is that related-party trade isdisproportionately important for the very largest firms that account for a disproportionate share of aggregate trade value.
35

Global Firms
across the percentiles of the top decile (in the call-out panel) as across the deciles of the distribution as a
whole (in the main panel).
Product-‐Countries By Decile
Product-‐Countries By Percen3le
1
10
100
1 2 3 4 5 6 7 8 9 10
Product-‐Country Imports Product-‐Country-‐ Exports
10
100
1000
90 92 94 96 98 100
Product-‐Country Imports
Product-‐Country-‐ Exports
Figure 4: Product-Country Extensive Margin by Decile/Percentile of Firm Total Trade
1
10
100
90 92 94 96 98 100
1
10
100
1 2 3 4 5 6 7 8 9 10
ImportProducts ImportCountries ExportProducts ExportCountries
ProductsandCountriesByDecile
ProductandCountriesByPercenEle
Figure 5: Product and Country Extensive Margins by Decile/Percentile of Firm Total Trade
36

Global Firms
RelatedPartyProductsandCountriesByDecile
RelatedPartyProductandCountriesByPercenEle
1
10
100
1 2 3 4 5 6 7 8 9 10
Product-CountriesImport ProductsImport CountriesImport
Product-CountriesExport ProductsExport CountriesExport
1
10
100
90 92 94 96 98 100
Figure 6: Related Party Product and Country Extensive Margins by Decile/Percentile of Firm TotalTrade
In Figures 4 and 5, we break out the product-country extensive margin in the contributions of the
product and country extensive margins separately. As shown in the main panel, the increase in the
number of product-country observations with positive trade across the deciles of the total firm trade
distribution is achieved partly through an increase in the number of products with positive trade and
partly through an increase in the number of countries with positive trade. While the extensive margins
for export and import products rise at approximately the same rate across the deciles of total firm trade,
the extensive margin for export destinations rises more rapidly than that for import source countries,
suggesting that fixed sourcing costs are large relative to fixed exporting costs. For all these extensive
margins, the level of activity jumps the top decile, and the distributions are fractal, in the sense that we
observe a similar pattern across percentiles of the top decile as across the deciles of the distribution as a
whole.
Figure 6 shows the distribution of extensive margins activity for related-party trade. the pattern
is a familiar one with a roughly log-linear increase across the deciles until the largest decile where
there is a substantial jump in activity. Again, we see the pattern repeated within the top decile as the
largest trading firms have many more related-party connections for both imports and exports. This
extensive margin of related party activity suggests a useful extension of the framework to incorporate
the decision whether to organize overseas production within the boundaries of the firm (foreign direct
37

Global Firms
investment (FDI)) or through arms-length transactions (outsourcing). Work on firm-level FDI has
consistently found that more productive firms are more likely to be multinationals, i.e. have at least one
foreign aliate, and that the numbers of host countries and aliates are increasing in measures of firm
performance.41
Taken together, these results paint a picture in which all the margins of firm international par-
ticipation co-move together, with greater participation along one margin correlated with more active
engagement along another. This pattern of results is consistent with two core mechanisms in the model.
On the one hand, higher firm productivity propels greater international participation along all margins
simultaneously through the non-random selection of firms into these dierent activities. On other
hand, the decisions to participate in international markets along each margin are complementary with
one another. As more productive firms incur the fixed exporting costs of serving additional markets, this
increases their production scale, and raises the profitability of incurring the fixed sourcing costs for addi-
tional countries. Incurring these additional fixed sourcing costs in turn reduces production costs, which
raises the profitability of incurring the fixed exporting costs for additional markets. Through these both
these forces of selection and complementarity, exogenous dierences across firms are magnified, such
that a relatively small number of firms account for a disproportionately large share of aggregate trade.
5 Conclusions
Over the last two decades, a growing body of theoretical and empirical research has demonstrated the
role of heterogeneous firm decisions in mediating the economy’s response to international trade. The
now-standard model of heterogeneous firms and trade envisions a continuum of measure zero firms that
compete under conditions of monopolistic competition and self-select into export markets. In this paper,
we review this research and argue that this standard paradigm does not go far enough in recognizing
the role of individual firms. In particular, much of international trade is dominated by a few large firms
that are far from measure zero and participate in international markets in multiple ways.
We outline a theoretical framework that recognizes the role played by such global firms. We allow
large firms to internalize the eects of their choices on market aggregates, which results in variable
markups, pricing to market and incomplete pass-through. We include a much richer range of margins
along which firms can participate in international markets than the standard paradigm. Each firm can
choose the set of production locations in which to operate plants; the set of export markets for each
plant; the set of products to export from each plant to each market; the exports of each product from
each plant to each market; the set of countries from which to source intermediate inputs for each plant;
and imports of each intermediate input from each source country by each plant.41The large literature on foreign direct investment (FDI) includes Antràs (2003), Antràs and Helpman (2004), Arkolakis,
Ramondo, Rodriguez-Clare, and Yeaple (2015), Brainard (1997), Doms and Jensen (1998), Helpman (1984), Helpman, Melitz,and Yeaple (2004), Markusen and Venables (1998, 2000), Ramondo and Rodriguez-Clare (2013), and Yeaple (2009), as re-viewed in Antràs and Yeaple (2009).
38
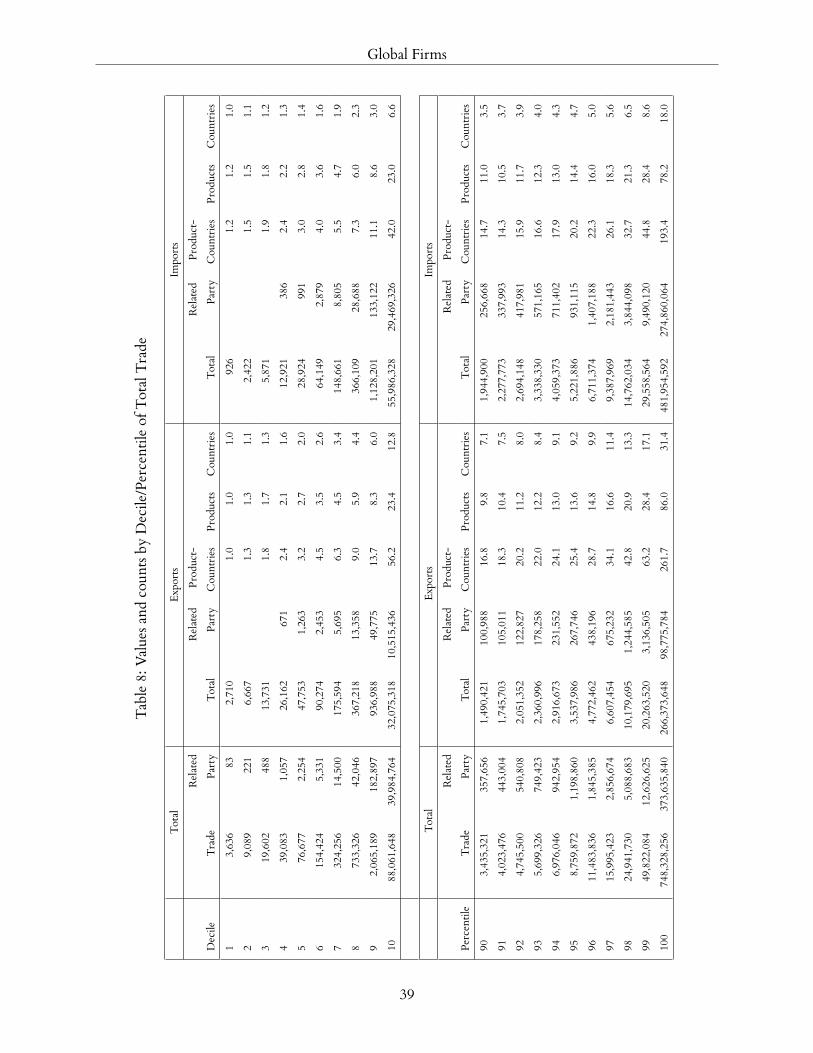
Global Firms
Table8:
Valuesand
coun
tsby
Decile/Percentile
ofTotalTrade
Total
Expo
rts
Impo
rts
Related
Related
Prod
uct-
Related
Prod
uct-
Decile
Trade
Party
Total
Party
Cou
ntries
Prod
ucts
Cou
ntries
Total
Party
Cou
ntries
Prod
ucts
Cou
ntries
13,636
832,710
1.0
1.0
1.0
926
1.2
1.2
1.0
29,089
221
6,667
1.3
1.3
1.1
2,422
1.5
1.5
1.1
319,602
488
13,731
1.8
1.7
1.3
5,871
1.9
1.8
1.2
439,083
1,057
26,162
671
2.4
2.1
1.6
12,921
386
2.4
2.2
1.3
576,677
2,254
47,753
1,263
3.2
2.7
2.0
28,924
991
3.0
2.8
1.4
6154,424
5,331
90,274
2,453
4.5
3.5
2.6
64,149
2,879
4.0
3.6
1.6
7324,256
14,500
175,594
5,695
6.3
4.5
3.4
148,661
8,805
5.5
4.7
1.9
8733,326
42,046
367,218
13,358
9.0
5.9
4.4
366,109
28,688
7.3
6.0
2.3
92,065,189
182,897
936,988
49,775
13.7
8.3
6.0
1,128,201
133,122
11.1
8.6
3.0
1088,061,648
39,984,764
32,075,318
10,515,436
56.2
23.4
12.8
55,986,328
29,469,326
42.0
23.0
6.6
Total
Expo
rts
Impo
rts
Related
Related
Prod
uct-
Related
Prod
uct-
Percentile
Trade
Party
Total
Party
Cou
ntries
Prod
ucts
Cou
ntries
Total
Party
Cou
ntries
Prod
ucts
Cou
ntries
903,435,321
357,656
1,490,421
100,988
16.8
9.8
7.1
1,944,900
256,668
14.7
11.0
3.5
914,023,476
443,004
1,745,703
105,011
18.3
10.4
7.5
2,277,773
337,993
14.3
10.5
3.7
924,745,500
540,808
2,051,352
122,827
20.2
11.2
8.0
2,694,148
417,981
15.9
11.7
3.9
935,699,326
749,423
2,360,996
178,258
22.0
12.2
8.4
3,338,330
571,165
16.6
12.3
4.0
946,976,046
942,954
2,916,673
231,552
24.1
13.0
9.1
4,059,373
711,402
17.9
13.0
4.3
958,759,872
1,198,860
3,537,986
267,746
25.4
13.6
9.2
5,221,886
931,115
20.2
14.4
4.7
9611,483,836
1,845,385
4,772,462
438,196
28.7
14.8
9.9
6,711,374
1,407,188
22.3
16.0
5.0
9715,995,423
2,856,674
6,607,454
675,232
34.1
16.6
11.4
9,387,969
2,181,443
26.1
18.3
5.6
9824,941,730
5,088,683
10,179,695
1,244,585
42.8
20.9
13.3
14,762,034
3,844,098
32.7
21.3
6.5
9949,822,084
12,626,625
20,263,520
3,136,505
63.2
28.4
17.1
29,558,564
9,490,120
44.8
28.4
8.6
100
748,328,256
373,635,840
266,373,648
98,775,784
261.7
86.0
31.4
481,954,592
274,860,064
193.4
78.2
18.0
39

Global Firms
We use this framework to structure our interpretation of U.S. firm and trade transactions data.
We show that only a subset of firms participate in international markets (through either exporting or
importing) and that these trading firms have superior performance characteristics: they are larger, more
productive, more capital-intensive, more skill-intensive and pay higher wages than purely domestic
firms. We find strong support for the model’s prediction of a correlation between the dierent margins
of firm participation in the global economy. A substantial fraction of firms that export or import do
both. More successful firms export more of each product to each market, export more products to each
market, export to more markets, import more of each product from each source country, importing
more products from each source country, and import from more source countries. Therefore small
dierences in exogenous firm characteristics have magnified eects on endogenous firm performance
(such as sales), because they are magnified by these endogenous market participation decisions, thereby
helping to explain how a relatively small number of firms dominate aggregate international trade.
While much already has been achieved within the literature on heterogeneous firms and trade, there
remains much to be done. One area for further research includes the implications of global firms for the
transmission of international shocks, the elasticity of trade with respect to trade costs, and the aggregate
welfare gains from trade. Although we consider many margins of firm participation in the international
economy, we abstract from the decision whether to organize global production chains within or beyond
the boundaries of the firm, which itself has been the subject of much recent research. Therefore another
interesting area for further inquiry is exploring the implications of this internalization decision for firm
performance and country comparative advantage in a world of such global firms.
40

Global Firms
A Appendix
A.1 Derivation of Equilibrium Pricing Rule
The first-order condition for the price of product k for firm f from production country i in market m
within sector g is:
QKmik + ∑
h∈ΩKmi f
PKmih
dQKmih
dPKmik−
dXmiγ
Kk
[Φi f h
(ΩNI
i f
)]− 1θKk
ϕi f
dQKmih
dPKmik
= 0. (30)
From equation (9), we have:
∂QKmih
∂PKmik
=(
σFg − 1
) QKmih
PGmg
∂PGmg
∂PKmik
+(
σKg − σF
g
) QKmih
PFmi f
∂PFmi f
∂PKmik− σK
gQK
mih
PKmik
∂PKmih
∂PKmik
.
We now can use the expenditure shares (7) and (8) to solve for the elasticities and rewrite ∂QKmih/∂PK
mikas
∂QKmih
∂PKmik
=(
σFg − 1
)( ∂PGmg
∂PFmi f
PFmi f
PGmg
)(∂PF
mi f
∂PKmik
PKmik
PFmi f
)QK
mihPK
mik+(
σKg − σF
g
)( ∂PFmi f
∂PKmik
PKmik
PFmi f
)QK
mihPK
mik− σK
gQK
mihPK
mik1k=h
=(
σFg − 1
)SF
mi f SKmik
QKmih
PKmik
+(
σKg − σF
g
)SK
mikQK
mihPK
mik− σK
gQK
mihPK
mik1k=h. (31)
If we now substitute equation (31) into equation (30) and divide both sides by QKmik, we get:
1 + ∑h∈ΩK
mi f
(σF
g − 1)
SFmi f SK
mikPK
mihQKmih
PKmikQK
mik+ ∑
h∈ΩKmi f
(σK
g − σFg
)SK
mikPK
mihQKmih
PKmikQK
mik− σK
g
− ∑h∈ΩK
mi f
(σF
g − 1)
SFmi f SK
mik
dXmiγ
Kk
[Φi f h
(ΩNI
i f
)]− 1θKk
ϕi fQK
mih
PKmikQK
mik− ∑
h∈ΩKmi f
(σK
g − σFg
)SK
mik
dXmiγ
Kk
[Φi f h
(ΩNI
i f
)]− 1θKk
ϕi fQK
mih
PKmikQK
mik(32)
+σKg
dXmiγ
Kk
[Φi f k
(ΩNI
i f
)]− 1θKk
ϕi f
PKmik
= 0.
Wedefine themarkup as µKmih ≡ PK
mih(
dXmiγ
Kk
[Φi f h
(ΩNI
i f
)]− 1θKk /ϕi f
). Since SK
mik1
PKmikYK
mik= 1
∑h∈ΩKmi f
PKmihYK
mih
and therefore ∑h∈ΩKmi f
SKmik
PKmihYK
mihPK
mikYKmik
= 1, we can rewrite equation (32) as:
[1 +
(σF
g − 1)
SFmi f +
(σK
g − σFg
)− σK
g
]−(
σFg − 1
)SF
mi f
∑h∈ΩK
mi f
dXmiγ
Kk
[Φi f h
(ΩNI
i f
)]− 1θKk
ϕi fQK
mih
∑h∈ΩK
mi f
PKmihQK
mih
−(
σKg − σF
g
) ∑h∈ΩK
mi f
dXmiγ
Kk
[Φi f h
(ΩNI
i f
)]− 1θKk
ϕi fQK
mih
∑h∈ΩK
mi f
PKmihQK
mih+ σK
g1
µKmik
= 0.
41

Global Firms
Note that µKmik is the only k-specific term in this expression. Hence, µK
mik must take the same value forall products k supplied by firm f from production country i to market m within sector g: µK
mik = µFmi f
for all k ∈ ΩKmi f . In other words, markups are the same across products within a given firm, market and sector.
We can now solve for µFmi f using:[
1 +(
σFg − 1
)SF
mi f +(
σKg − σF
g
)− σK
g
]−(
σFg − 1
)SF
mi f1
µFmi f−(
σKg − σF
g
) 1µF
mi f+ σK
g1
µFmi f
= 0
⇒ µFmi f =
σFg −
(σF
g − 1)
SFmi f
σFg −
(σF
g − 1)
SFmi f − 1
.
A.2 Proof of Proposition 1
Proof. (i) From the firm price index (6) and firm pricing rule (20), we have:
PFmi f =
(µF
mi f
ϕi f
)ΓF
mi f , (33)
where
ΓFmi f = dX
miγKk
∑k∈ΩK
mi f
[Φi f k
(ΩNI
i f
)]− 1θKk
λKmik
1−σK
g
11−σK
g
,
Φi f k
(ΩNI
i f
)= ∑
j∈ΩNIi f
TKjk(wjdI
ij)−θK
k .
Using the firm expenditure share (7) and (33), we obtain:
SFmi f =
(µF
mi f /ϕi f
)1−σFg(
ΓFmi f /λF
mi f
)1−σFg
∑i∈ΩN
∑o∈ΩF
mig
(µF
mio/ϕio)1−σF
g(ΓF
mio/λFmio
)1−σFg
. (34)
Using the mark-up (21) and perceived elasticity (22), we define the following implicit function:
Ξ = SFmi f −
(σF
g−(σFg−1)SF
mi f
(σFg−1)−(σF
g−1)SFmi f
)1−σFg
ϕσF
g−1i f
(ΓF
mi f /λFmi f
)1−σFg
∑i∈ΩN
∑o∈ΩF
mig
(σF
g−(σFg−1)SF
mio
(σFg−1)−(σF
g−1)SFmio
)1−σFg
ϕσF
g−1io
(ΓF
mio/λFmio
)1−σFg
= 0. (35)
From the implicit function theorem:
∂SFmi f
∂ϕi f= −
∂Ξ/∂ϕi f
∂Ξ/∂SFmi f
, (36)
where we hold constant wm, ΩNPf , ΩNX
i f , ΩNIi f , ΩK
mi f and all other model parameters except produc-
tivity. From (35), we have:∂Ξ
∂ϕi f= −
σFg − 1ϕi f
SFmi f
(1− SF
mi f
)< 0, (37)
42

Global Firms
∂Ξ∂SF
mi f= 1 +
(σF
g − 1)(∂µF
mi f
∂SFmi f
SFmi f
µFmi f
)(1− SF
mi f
)> 0, (38)
since∂µF
mi f
∂SFmi f
SFmi f
µFmi f
=σF
g − 1
εFni f − 1
SFmi f
(1− 1
µFmi f
)> 0. (39)
From (36)-(39), an increase in firm productivity raises expenditure shares within each market:
∂SFmi f
∂ϕi f> 0, (40)
(ii) Together (39) and (40) imply that an increase in firm productivity raises markups:
∂µFmi f
∂ϕi f> 0. (41)
From (34), the firm expenditure share is decreasing in the ratio of the markup to firm productivity
(µFmi f /ϕi f ):
∂SFmi f
∂(
µFmi f /ϕi f
) = −σF
g − 1(µF
mi f /ϕi f
)SFmi f
(1− SF
mi f
)< 0. (42)
Now we combine (40)-(42). The firm expenditure share increases in productivity in (40), even though
the firm markup increases in productivity in (41). Therefore, from (42), the firm markup must rise less
than proportionately with productivity (to ensure that the firm expenditure share increases in produc-
tivity), which implies that the price of each product must decrease in productivity:
∂PKmik
∂ϕi f=
∂
(µF
mi fϕi f
dXmiγ
Kk
[Φi f k
(ΩNI
i f
)]− 1θKk
)∂ϕi f
< 0. (43)
(iii) Sales of each product in each sector in each market can be written as:
EKmik = SK
mikSKmi f
(λG
mgwmLm
), (44)
where the share of each product k in firm expenditure (SKmik) is independent of firm productivity and
the markup because both are common across products within a given firm in a given market:
SKmik =
([Φi f k
(ΩNI
i f
)]− 1θKk /λK
mik
)1−σKg
∑n∈ΩK
mi f
([Φi f n
(ΩNI
i f
)]− 1θKk /λK
min
)1−σKg
. (45)
From (40), (44) and (45), the firm expenditure share (SKmi f ) increases in firm productivity, while the
product expenditure share (SKmik) is unaected by firm productivity. Therefore an increase in firm
productivity raises sales of each product in a given market:
∂EKmik
∂ϕi f> 0. (46)
43

Global Firms
Output of each product in a given sector and market can be written as:
QKmik =
EKmik
PKmik
. (47)
From (43) and (46), an increase in firm productivity raises sales (EKmik) and reduces (P
Kmik) of each product
in each market, which implies that it raises output (QKmik) of each product in each market:
∂QKmik
∂ϕi f> 0. (48)
Since an increase in firm productivity raises sales and output of each product in each market, it also
raises overall sales (EKik) and output (QK
ik) of each product across all markets:
∂EKik
dϕi f> 0,
∂QKik
∂ϕi f> 0, (49)
where EKik = ∑m∈ΩNX
i fEK
mik and QKik = ∑m∈ΩNX
i fQK
mik.
A.3 Proof of Proposition 2
Proof. From Proposition 1, we have:
∂EKmik
∂ϕi f> 0,
∂µFmi f
∂ϕi f> 0,
where we hold constant wm, ΩNPf , ΩNX
i f , ΩNIi f , ΩK
mi f , ΩKmi f and all model parameters except produc-
tivity. Therefore we have:
∂
((µF
mi f−1
µFmi f
)EK
mik
)∂ϕi f
> 0, for all k ∈
ΩKmi f \ΩK
mi f
,
which together with (27) establishes the proposition.
A.4 Proof of Proposition 3
Proof. From Proposition 1, we have:
∂EKmik
∂ϕi f> 0,
∂µFmi f
∂ϕi f> 0,
where we hold constant wm, ΩNPf , ΩNX
i f , ΩNIi f , ΩK
mi f , ΩKmi f and all model parameters except produc-
tivity. Therefore we have:
∂
((µF
mi f−1
µFmi f
)EK
mik
)∂ϕi f
> 0, for all k ∈ ΩKmi f ,
which together with (28) establishes the proposition.
44

Global Firms
A.5 Proof of Proposition 4
Proof. From Proposition 1, we have:
∂EKmik
(ΩNI
i f
)∂ϕi f
> 0,∂µF
mi f
(ΩNI
i f
)∂ϕi f
> 0,
where we make explicit that both the markup (µFmi f ) and sales of each product (EK
mik) are functions of
the set of source countries (ΩNIi f ); we also hold constant wm, ΩNP
f , ΩNXi f , ΩNI
i f , ΩKmi f , ΩK
mi f and all
model parameters except productivity. Therefore we have:
∂
((µF
mi f
(ΩNI
i f
)−1
µFmi f
(ΩNI
i f
))
EKmik
(ΩNI
i f
))∂ϕi f
> 0, for all k ∈ ΩKmi f ,
which together with (29) establishes the proposition.
45

Global Firms
References
ABOWD, J. M., R. H. CREECY, AND F. KRAMARZ (2002): “Computing Person and Firm Eects Using
Linked Longitudinal Employer-Employee Data,” LEHD Technical Paper, 2002-06.
ABOWD, J. M., F. KRAMARZ, ANDD.N.MARGOLIS (1999): “HighWageWorkers andHighWage Firms,”
Econometrica, 67(2), 251–333.
AHN, J., A. KHANDELWAL, AND S.WEI (2011): “The Role of Intermediaries in Facilitating Trade,” Journalof International Economics, 84(1), 73–85.
AKERMAN, A. (2010): “Wholesalers and Economies of Scope in International Trade,” Research Papers
in Economics, Department of Economics, Stockholm University 2010:1.
ALFARO, L., P. ANTRÁS, D. CHOR, AND P. CONCONI (2015): “Internalizing Global Value Chains: A
Firm-Level Analysis,” NBER Working Paper, 21582.
AMITI, M., AND D. R. DAVIS (2011): “Trade, Firms and Wages: Theory and Evidence,” Review of Eco-nomic Studies, 79(1), 1–36.
AMITI, M., O. ITSKHOKI, AND J. KONINGS (2015): “Importers, Exporters and Exchange Rate Disconnect,”
American Economic Review.
AMITI, M., AND J. KONINGS (2007): “Trade Liberalization, Intermediate Inputs, and Productivity: Evi-
dence from Indonesia,” American Economic Review, 97(5), 1611–1638.
ANTRÀS, P. (2003): “Firms, Contracts, and Trade Structure,” Quarterly Journal of Economics, 118(4),1375–1418.
(2015): Global Production: Firms, Contracts, and Trade Structure. Princeton University Press,
Princeton.
ANTRÀS, P., AND D. CHOR (2013): “Organizing the Global Value Chain,” Econometrica, 81(6), 2127–2204.
ANTRÀS, P., AND A. COSTINOT (2011): “Intermediated Trade,” Quarterly Journal of Economics, 126(3),1319–1374.
ANTRÀS, P., T. FORT, AND F. TINTELNOT (2014): “The Margins of Global Sourcing: Theory and Evi-
dence from U.S. Firms,” Harvard University, mimeograph.
ANTRÀS, P., AND E. HELPMAN (2004): “Global Sourcing,” Journal of Political Economy, 112(3), 552–80.
46
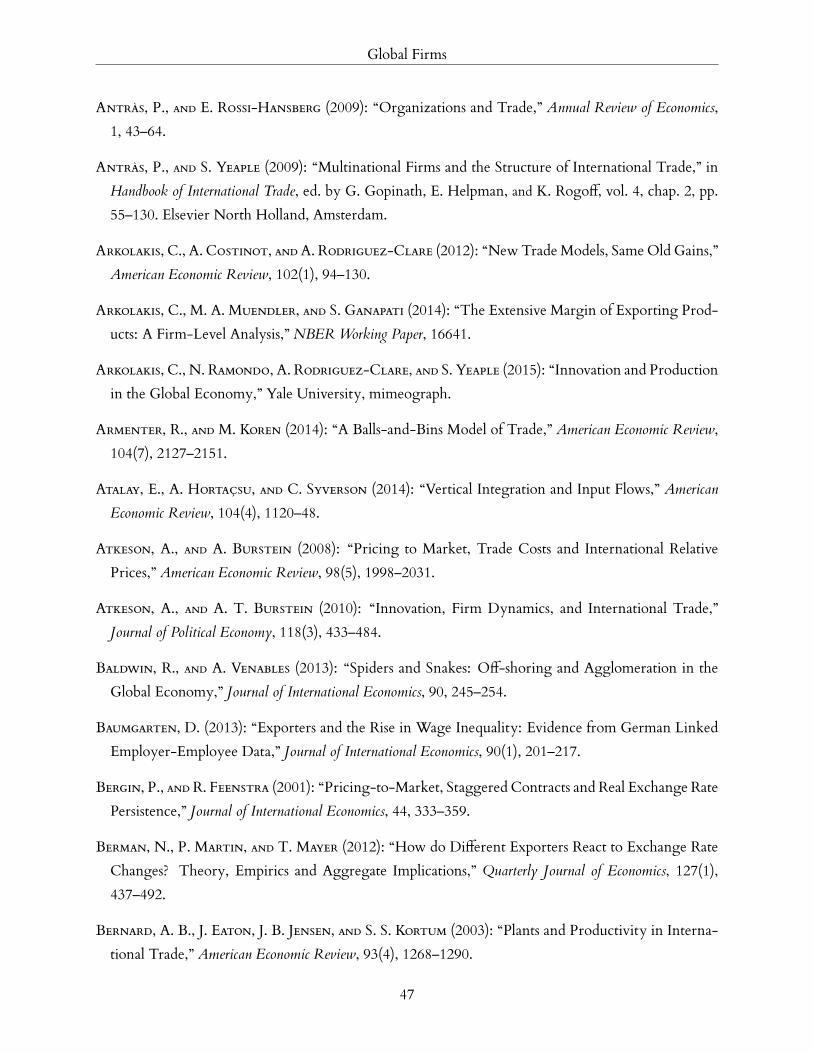
Global Firms
ANTRÀS, P., AND E. ROSSI-HANSBERG (2009): “Organizations and Trade,” Annual Review of Economics,1, 43–64.
ANTRÀS, P., AND S. YEAPLE (2009): “Multinational Firms and the Structure of International Trade,” in
Handbook of International Trade, ed. by G. Gopinath, E. Helpman, and K. Rogo, vol. 4, chap. 2, pp.
55–130. Elsevier North Holland, Amsterdam.
ARKOLAKIS, C., A. COSTINOT, ANDA. RODRIGUEZ-CLARE (2012): “NewTradeModels, SameOld Gains,”
American Economic Review, 102(1), 94–130.
ARKOLAKIS, C., M. A. MUENDLER, AND S. GANAPATI (2014): “The Extensive Margin of Exporting Prod-
ucts: A Firm-Level Analysis,” NBER Working Paper, 16641.
ARKOLAKIS, C., N. RAMONDO, A. RODRIGUEZ-CLARE, AND S. YEAPLE (2015): “Innovation and Production
in the Global Economy,” Yale University, mimeograph.
ARMENTER, R., AND M. KOREN (2014): “A Balls-and-Bins Model of Trade,” American Economic Review,104(7), 2127–2151.
ATALAY, E., A. HORTAÇSU, AND C. SYVERSON (2014): “Vertical Integration and Input Flows,” AmericanEconomic Review, 104(4), 1120–48.
ATKESON, A., AND A. BURSTEIN (2008): “Pricing to Market, Trade Costs and International Relative
Prices,” American Economic Review, 98(5), 1998–2031.
ATKESON, A., AND A. T. BURSTEIN (2010): “Innovation, Firm Dynamics, and International Trade,”
Journal of Political Economy, 118(3), 433–484.
BALDWIN, R., AND A. VENABLES (2013): “Spiders and Snakes: O-shoring and Agglomeration in the
Global Economy,” Journal of International Economics, 90, 245–254.
BAUMGARTEN, D. (2013): “Exporters and the Rise in Wage Inequality: Evidence from German Linked
Employer-Employee Data,” Journal of International Economics, 90(1), 201–217.
BERGIN, P., ANDR. FEENSTRA (2001): “Pricing-to-Market, Staggered Contracts and Real Exchange Rate
Persistence,” Journal of International Economics, 44, 333–359.
BERMAN, N., P. MARTIN, AND T. MAYER (2012): “How do Dierent Exporters React to Exchange Rate
Changes? Theory, Empirics and Aggregate Implications,” Quarterly Journal of Economics, 127(1),437–492.
BERNARD, A. B., J. EATON, J. B. JENSEN, AND S. S. KORTUM (2003): “Plants and Productivity in Interna-
tional Trade,” American Economic Review, 93(4), 1268–1290.
47

Global Firms
BERNARD, A. B., AND T. FORT (2015): “Factoryless Goods Producing Firms,” American Economic Review,forthcoming.
BERNARD, A. B., M. GRAZZI, AND C. TOMASI (2014): “Intermediaries in International Trade: Margins of
Trade and Export Flows,” NBER Working Paper, 17711.
BERNARD, A. B., AND J. B. JENSEN (1995): “Exporters, Jobs, andWages in US Manufacturing: 1976-87,”
Brookings Papers on Economic Activity: Microeconomics, pp. 67–112.
(1999): “Exceptional Export Performance: Cause, Eect or Both?,” Journal of International Eco-nomics, 47(1), 1–25.
BERNARD, A. B., J. B. JENSEN, S. J. REDDING, AND P. K. SCHOTT (2007): “Firms in International Trade,”
Journal of Economic Perspectives, 21(3), 105–130.
(2009): “The Margins of U.S. Trade,” American Economic Review, 99(2), 487–493, Papers andProceedings.
(2010a): “Intra-firm Trade and Product Contractibility,” American Economic Review, 100(2),444–448, Papers and Proceedings.
(2010b): “Wholesalers and Retailers in U.S. Trade,”American Economic Review, 100(2), 408–413,Papers and Proceedings.
(2012): “The Empirics of Firm Heterogeneity and International Trade,” Annual Review ofEconomics, 4, 283–313.
BERNARD, A. B., J. B. JENSEN, AND P. K. SCHOTT (2009): “Importers, Exporters and Multinationals: A
Portrait of Firms in the U.S. that Trade Goods,” in Producer Dynamics: New Evidence from Micro Data,ed. by T. Dunne, J. B. Jensen, and M. J. Roberts. Chicago University Press, Chicago.
BERNARD, A. B., A. MOXNES, AND Y. SAITO (2014): “Production Networks, Geography and Firm Per-
formance,” Tuck School of Business at Dartmouth, mimeograph.
BERNARD, A. B., S. J. REDDING, AND P. K. SCHOTT (2007): “Comparative Advantage and Heterogeneous
Firms,” Review of Economic Studies, 74(1), 31–66.
(2010): “Multi-product Firms and Product Switching,” American Economic Review, 100(1), 70–97.
(2011): “Multiproduct Firms and Trade Liberalization,” Quarterly Journal of Economics, 126(3),1271–1318.
48

Global Firms
BLAUM, J., C. LELARGE, AND M. PETERS (2013): “Non-Nomothetic Import Demand: Firm Productivity
and Quality Bias,” Brown University, mimeograph.
(2014): “Estimating the Productivity Gains from Importing,” Brown University, mimeograph.
BLUM, B., S. CLARO, AND I. HORSTMANN (2000): “Facts and Figures on Intermediated Trade,” AmericanEconomic Review, 100(2), 419–423, Papers and Proceedings.
BRAINARD, S. L. (1997): “An Empirical Assessment of the Proximity-Concentration Trade-o between
Multinational Sales and Trade,” American Economic Review, 87(4), 520–544.
BROOKS, E. (2006): “Why Don’t Firms Export More? Product Quality and Colombian Plants,” Journalof Development Economics, 80, 160–178.
BURSTEIN, A., AND J. VOGEL (2015): “International Trade, Technology, and the Skill Premium,”
Columbia University, mimeograph.
BUSTOS, P. (2011): “Trade Liberalization, Exports and Technology Upgrading: Evidence on the impact
of MERCOSUR on Argentinian Firms,” American Economic Review, 101(1), 304–340.
CAVES, D. W., L. R. CHRISTENSEN, AND W. E. DIEWERT (1982): “The Economic Theory of Index
Numbers and the Measurement of Input, Output, and Productivity,” Econometrica, 50(6), 1393–1414.
CHANEY, T. (2008): “Distorted Gravity: The Intensive and Extensive Margins of International Trade,”
American Economic Review, 98(4), 1707–1721.
CHERKASHIN, I., S. DEMIDOVA, H. L. KEE, AND K. KRISHNA (2010): “Firm Heterogeneity and Costly
Trade: A New Estimation Strategy and Policy Experiments,” Penn State, mimeograph.
CLERIDES, SOFRONIS, S. L., AND J. TYBOUT (1998): “Is Learning by Exporting Important? Micro-
dynamic Evidence from Columbia, Mexico and Morocco,” Quarterly Journal of Economics, 113(3),903–947.
CONSTANTINI, J. A., AND M. J. MELITZ (2008): “The Dynamics of Firm-Level Adjustment to Trade
Liberalization,” in The Organization of Firms in a Global Economy, ed. by E. Helpman, D. Marin, and
T. Verdier, pp. 107–141. Harvard University Press, Princeton.
CORCOS, G., M. DEL GATTO, G. MION, AND G. OTTAVIANO (2012): “Productivity and Firm Selection:
Quantifying the New Gains from Trade,” Economic Journal, 122(561), 754–798.
COSTINOT, A., J. VOGEL, AND S. WANG (2013): “An Elementary Theory of Global Supply Chains,”
Review of Economic Studies, 80, 109–144.
49

Global Firms
DAVIDSON, C., F. HEYMAN, S. MATUSZ, F. SJÖHOLM, AND S. C. ZHU (2014): “Globalization and Imperfect
Labor Market Sorting,” Journal of International Economics, 94(2), 177–94.
DE LOECKER, J., AND P. GOLDBERG (2014): “Firm Performance in a Global Market,” Annual Review ofEconomics, 6, 201–227.
DE LOECKER, J., P. GOLDBERG, A. KHANDELWAL, AND N. PAVCNIK (2015): “Prices, Markups and Trade
Reform,” Econometrica, forthcoming.
DE LOECKER, J., AND F. WARZYNSKI (2012): “Markups and Firm-level Export Status,” American EconomicReview, 102(6), 2437–2471.
DHINGRA, S. (2013): “Trading Away Wide Brands for Cheap Brands,” American Economic Review,103(6), 2554–84.
DI GIOVANNI, J., A. LEVCHENKO, AND I. MEJEAN (2014): “Firms, Destinations, and Aggregate Fluctua-
tions,” Econometrica, 82(4), 1303–1340.
DIXIT, A., AND G. M. GROSSMAN (1982): “Trade and Protection with Multi-Stage Production,” Reviewof Economic Studies, 49(4), 583–94.
DOMS, M. E., AND J. . B. JENSEN (1998): “Comparing Wages, Skills, and Productivity between Domes-
tically and Foreign-Owned Manufacturing Establishments in the United States,” in Geography andOwnership as Bases for Economic Accounting, pp. 235–258. Chicago University Press, Chicago.
EATON, J., AND S. KORTUM (2002): “Technology, Geography, and Trade,” Econometrica, 70(5), 1741–1779.
EATON, J., S. KORTUM, F. KRAMARZ, AND R. SAMPOGNARO (2014): “Firm-to-Firm Trade: Imports, Ex-
ports, and the Labor Market,” Yale University, mimeograph.
EATON, J., S. KORTUM, AND S. SOTELO (2012): “International Trade: Linking the Micro and the Macro,”
NBER Working Paper, 17864.
EATON, J., S. S. KORTUM, AND F. KRAMARZ (2004): “Dissecting Trade: Firms, Industries, and Export
Destinations,” American Economic Review, 94(2), 150–154, Papers and Proceedings.
(2011): “An Anatomy of International Trade: Evidence from French Firms,” Econometrica, pp.1453–1498.
ECKEL, C., AND P. J. NEARY (2010): “Multi-product Firms and Flexible Manufacturing in the Global
Economy,” Review of Economic Studies, 77, 188–217.
50

Global Firms
EDMOND, C., V. MIDRIGAN, AND D. Y. XU (2012): “Competition, Markups, and the Gains from Inter-
national Trade,” NBER Working Paper, 18041.
FEENSTRA, R., AND H. MA (2008): “Optimal Choice of Product Scope for Multiproduct Firms,” in TheOrganization of Firms in a Global Economy, ed. by D. M. Elhanan Helpman, and T. Verdier, chap. 6,
pp. 173–199. Harvard University Press, Cambridge MA.
FITZGERALD, D., AND S. HALLER (2015): “Pricing-to-Market: Evidence from Plant-Level Prices,”Reviewof Economic Studies, forthcoming.
FORT, T. (2014): “Technology and Production Fragmentation: Domestic versus Foreign Sourcing,”
Tuck School of Business, mimeograph.
FREUND, C., AND M. D. PIEROLA (2015): “Export Superstars,” Review of Economics and Statistics, 97(5),1023–1032.
FRÍAS, J. A., D. S. KAPLAN, AND E. A. VERHOOGEN (2015): “Exports and Wage Premia: Evidence from
Mexican Employer-Employee Data,” Columbia University, unpublished manuscript.
GABAIX, X. (2011): “The Granular Origins of Aggregate Fluctuations,” Econometrica, 79, 733–772.
GAUBERT, C., AND O. ITSKHOKI (2015): “Granular Comparative Advantage,” Princeton University,
mimeograph.
GOLDBERG, P., AND R. HELLERSTEIN (2013): “A Structural Approach to Identifying the Sources of Local-
Currency Price Stability,” Review of Economic Studies, 80, 175–210.
GOLDBERG, P., A. KHANDELWAL, N. PAVCNIK, AND P. TOPALOVA (2010): “Imported Intermediate Inputs
and Domestic Product Growth: Evidence from India,” Quarterly Journal of Economics, 125(4), 1727–67.
GOLDBERG, P., ANDM. KNETTER (1997): “Goods Prices and Exchange Rates: What HaveWe Learned?,”
Journal of Economic Literature, 35(3), 1243–1272.
GROSSMAN, G. M. (2013): “Heterogeneous Workers and International Trade,” Review of World Eco-nomics, 149(2), 211–245.
GROSSMAN, G. M., AND E. ROSSI-HANSBERG (2008): “Trading Tasks: A Simple Theory of Oshoring,”
American Economic Review, 98(5), 1978–97.
HALLAK, J. C., AND P. K. SCHOTT (2011): “Estimating Cross-Country Dierences in Product Quality,”
Quarterly Journal of Economics, 126(1), 417–474.
51

Global Firms
HALPERN, L., M. KOREN, AND A. SZEIDL (2015): “mported Inputs and Productivity,” American EconomicReview.
HARRIGAN, J., AND A. RESHEF (2015): “Skill-biased Heterogeneous Firms, Trade Liberalization and the
Skill Premium,” Canadian Journal of Economics.
HELPMAN, E. (1984): “A Simple Theory of International Trade with Multinational Corporations,” Jour-nal of Political Economy, 92(3), 451–471.
(2006): “Trade, FDI and the Organization of Firms,” Journal of Economic Literature, 44(3), 589–630.
HELPMAN, E., O. ITSKHOKI, M. A. MUENDLER, AND S. J. REDDING (2015): “Trade and Inequality: From
Theory to Estimation,” NBER Working Paper, 17991.
HELPMAN, E., O. ITSKHOKI, AND S. J. REDDING (2010): “Inequality and Unemployment in a Global
Economy,” Econometrica, 78(4), 1239–1283.
HELPMAN, E., M. J. MELITZ, AND Y. RUBINSTEIN (2008): “Estimating Trade Flows: Trading Partners
and Trading Volumes,” Quarterly Journal of Economics, 123(2), 441–87.
HELPMAN, E., M. J. MELITZ, AND S. R. YEAPLE (2004): “Export Versus FDI with Heterogeneous Firms,”
American Economic Review, 94(1), 300–316.
HOLMES, J., AND J. J. STEVENS (2012): “Exports, Borders, Distance and Plant Size,” Journal of InternationalEconomics, 88(1), 91–103.
HORNOK, C., AND M. KOREN (2014): “Per-Shipment Costs and the Lumpiness of International Trade,”
Review of Economics and Statistics, forthcoming.
(2015): “Administrative Barriers to Trade,” Journal of International Economics, forthcoming.
HOTTMAN, C., S. REDDING, AND D. WEINSTEIN (2015): “Quantifying the Sources of Firm Heterogene-
ity,” Quarterly Journal of Economics, forthcoming.
HSIEH, C.-T., AND R. OSSA (2011): “A Global View of Productivity Growth in China,” NBERWorkingPaper, 16778.
IRARRAZABAL, A., L. OPROMOLLA, AND A. MOXNES (2013): “The Margins of Multinational Production
and the Role of Intrafirm Trade,” Journal of Political Economy, 121(1), 74–126.
JARMIN, R. S., AND J. MIRANDA (2002): “The Longitudinal Business Database,”Center for Economic StudiesWorking Paper, 02(17).
52

Global Firms
JOHNSON, R. C., AND G. NOGUERA (2012): “Fragmentation and Trade in Value Added over Four
Decades,” NBER Working Paper, 18186.
KEHOE, T. J., AND K. J. RUHL (2013): “How Important Is the New Goods Margin in International
Trade?,” Journal of Political Economy, 121(2), 358–392.
KHANDELWAL, A. (2010): “The Long and Short (of ) Quality Ladders,” Review of Economic Studies, 77(4),1450–1476.
KRISHNA, P., J. P. POOLE, AND M. Z. SENSES (2014): “Wage Eects of Trade Reform with Endogenous
Worker Mobility,” Journal of International Economics, 93(2), 239–252.
KRUGMAN, P. (1980): “Scale Economies, Product Dierentiation, and the Pattern of Trade,” AmericanEconomic Review, 70(5), 950–59.
(1987): “Pricing to Market When the Exchange Rate Changes,” in Real Financial LinkagesAmong Open Economies, ed. by S. W. Arndt, and J. Richardson. MIT Press, London.
LILEEVA, A., AND D. TREFLER (2010): “Improved Access to Foreign Markets Raises Plant-Level Produc-
tivity... for Some Plants,” Quarterly Journal of Economics, 125(3), 1051–1099.
MANOVA, K., AND Z. ZHANG (2012): “Export Prices across Firms and Destinations,” Quarterly Journal ofEconomics, 127, 379–436.
MARKUSEN, J. R., AND A. J. VENABLES (1998): “Multinational Firms and the New Trade Theory,” Journalof International Economics, 46(2), 183–203.
(2000): “The Theory of Endowment, Intra-industry Trade and Multinational Trade,” Journalof International Economics, 52, 209–234.
MAYER, T., M. MELITZ, AND G. I. OTTAVIANO (2013): “Market Size, Competition, and the Product Mix
of Exporters,” American Economic Review, 104(2), 495–536.
MAYER, T., AND G. OTTAVIANO (2007): The Happy Few: New Facts on the Internationalization of EuropeanFirms. Bruegel-CEPR EFIM2007 Report, Bruegel Blueprint Series.
MELITZ, M., AND G. OTTAVIANO (2008): “Market Size, Trade, and Productivity,” Review of EconomicStudies, 75, 295–316.
MELITZ, M. J. (2003): “The Impact of Trade on Intra-Industry Reallocations and Aggregate Industry
Productivity,” Econometrica, 71, 1695–1725.
53
Global Firms
MELITZ, M. J., AND S. J. REDDING (2014a): “Heterogeneous Firms andTrade,” inHandbook of InternationalEconomics, ed. by E. Helpman, G. Gopinath, and K. Rogo, vol. 4, chap. 1, pp. 1–54. Elsevier: North
Holland, Amsterdam.
(2014b): “Missing Gains from Trade?,” American Economic Review, 104(5), 317–321, Papers andProceedings.
(2015): “New Trade Models, New Welfare Implications,” American Economic Review, 105(3),1105–1146.
MELITZ, M. J., AND D. TREFLER (2015): “Gains from Trade when Firms Matter,” Journal of EconomicPerspectives, 26(2), 91–118.
MRÁZOVÁ, M., AND J. P. NEARY (2015): “Selection Eects with Heterogeneous Firms,” University of
Oxford, mimeograph.
MUNCH, J. R., AND J. R. SKAKSEN (2008): “Human Capital and Wages in Exporting Firms,” Journal ofInternational Economics, 75(2), 363–372.
NEARY, J. P. (2015): “International Trade in General Oligopolistic Equilibrium,” University of Oxford,
mimeograph.
NOCKE, V., AND S. YEAPLE (2014): “Globalization and Endogenous Firm Scope,” International EconomicReview, 55(4), 993–1018.
NUNN, N., ANDD. TREFLER (2008): “The Boundaries of theMultinational Firm: An Empirical Analysis,”
in The Organization of Firms in a Global Economy, ed. by E. Helpman, D. Marin, and T. Verdier, pp.
55–83. Harvard University Press, Cambridge MA.
(2013): “Incomplete Contracts and the Boundaries of the Multinational Firm,” Journal of Eco-nomic Behavior and Organization, 94(1), 330–344.
OBERFIELD, E. (2015): “Business Networks, Production Chains, and Productivity: A Theory of Input-
Output Architecture,” Princeton University, mimeograph.
PERLA, J., C. TONETTI, AND M. E. WAUGH (2015): “Equilibrium Technology Diusion, Trade, and
Growth,” forthcoming.
PIERCE, J., AND P. K. SCHOTT (2012): “The Surprisingly Swift Decline of U.S. Manufacturing Employ-
ment,” NBER Working Paper, 18655.
RAMONDO, N., V. RAPPAPORT, AND K. RUHL (2015): “Intrafirm Trade and Vertical Fragmentation in
U.S. Multinational Corporations,” Journal of International Economics, forthcoming.
54

Global Firms
RAMONDO, N., AND A. RODRIGUEZ-CLARE (2013): “Trade, Multinational Production and the Gains from
Openness,” Journal of Political Economy, 121(2), 273–322.
REDDING, S. J. (2011): “Theories of Heterogeneous Firms and Trade,” Annual Review of Economics, 3,77–105.
RODRÍGUEZ-CLARE, A. (2010): “Oshoring in a Ricardian World,” American Economic Journal: Macroe-conomics, 2(2), 227–258.
SAMPSON, T. (2015): “Dynamic Selection: An Idea Flows Theory of Entry, Trade and Growth,” Quar-terly Journal of Economics, forthcoming.
SCHANK, T., C. SCHNABEL, AND J. WAGNER (2007): “Do Exporters Really Pay Higher Wages? First
Evidence from German Linked Employer-Employee Data,” Journal of International Economics, 72(1),52–74.
SCHOTT, P. K. (2004): “Across-Product versus Within-Product Specialization in International Trade,”
Quarterly Journal of Economics, 119(2), 647–678.
THISSE, J.-F., AND K.-I. SHIMOMURA (2012): “Competition Among the Big and the Small,” Rand Journalof Economics, 43(2), 329–347.
TINTELNOT, F. (2014): “Global Production with Export Platforms,” University of Chicago, mimeo-
graph.
YEAPLE, S. R. (2005): “A SimpleModel of FirmHeterogeneity, International Trade, andWages,” Journalof International Economics, 65, 1–20.
(2009): “Firm Heterogeneity and the Structure of U.S. Multinational Activity: An Empirical
Analysis,” Journal of International Economics, 78(2), 206–215.
YI, K.-M. (2003): “Can Vertical Specialization Explain the Growth ofWorld Trade?,” Journal of PoliticalEconomy, 111(1), 52–102.
55

CENTRE FOR ECONOMIC PERFORMANCE Recent Discussion Papers
1419 Marco Manacorda Andrea Tesei
Liberation Technology: Mobile Phones and Political Mobilization in Africa
1418 Jeremiah Dittmar Ralf R. Meisenzahl
State Capacity and Public Goods: Institutional Change, Human Capital and Growth in Early Modern Germany
1417 Holger Breinlich Swati Dhingra Gianmarco Ottaviano
How Have EU’s Trade Agreements Impacted Consumers?
1416 Stefan Bender Nicholas Bloom David Card John Van Reenen Stefanie Wolter
Management Practices, Workforce Selection and Productivity
1415 Emanuel Ornelas Special and Differential Treatment for Developing Countries
1414 Markus K. Brunnermeier Luis Garicano Philip R. Lane Marco Pagano Ricardo Reis Tano Santos David Thesmar Stijn Van Nieuwerburgh Dimitri Vayanos
The Sovereign-Bank Diabolic Loop and ESBies
1413 Antoine Dechezleprêtre Elias Einiö Ralf Martin Kieu-Trang Nguyen John Van Reenen
Do Tax Incentives for Research Increase Firm Innovation? An RD Design for R&D
1412 Luis Garicano Luis Rayo
Relational Knowledge Transfers
1411 João Paulo Pessoa International Competition and Labor Market Adjustment

1410 Claudia Olivetti Barbara Petrongolo
The Evolution of Gender Gaps in Industrialized Countries
1409 Quoc-Anh Do Kieu-Trang Nguyen Anh N. Tran
One Mandarin Benefits the Whole Clan: Hometown Favoritism in an Authoritarian Regime
1408 Caroline J. Charpentier Jan-Emmanuel De Neve Jonathan P. Roiser Tali Sharot
Models of Affective Decision-making: How do Feelings Predict Choice?
1407 Johannes Boehm Swati Dhingra John Morrow
Swimming Upstream: Input-output Linkages and the Direction of Product Adoption
1406 Felix Koenig Alan Manning Barbara Petrongolo
Reservation Wages and the Wage Flexibility Puzzle
1405 Gianluca Benigno Luca Fornaro
Stagnation Traps
1404 Brian Bell Stephen Machin
Minimum Wages and Firm Value
1403 Gene M. Grossman Elhanan Helpman Ezra Oberfield Thomas Sampson
Balanced Growth Despite Uzawa
1402 Emanuele Forlani Ralf Martin Giordano Mion Mirabelle Muûls
Unraveling Firms: Demand, Productivity and Markups Heterogeneity
1401 Holger Breinlich The Effect of Trade Liberalization on Firm-Level Profits: An Event-Study Approach
The Centre for Economic Performance Publications Unit Tel 020 7955 7673 Fax 020 7404 0612
Email [email protected] Web site http://cep.lse.ac.uk