CEO Presentation - s21.q4cdn.com · Vistra Energy Analyst Day Presentation 2018 VISTRA’S...
27
CEO Presentation Curt Morgan Chief Executive Officer
Transcript of CEO Presentation - s21.q4cdn.com · Vistra Energy Analyst Day Presentation 2018 VISTRA’S...

CEO Presentation
Curt MorganChief Executive Officer

Vistra Energy Analyst Day Presentat ion 2018
Vistra Energy:
Changing the Power Landscape

Vistra Energy Analyst Day Presentat ion 2018
EVOLUTION OF SECTOR & INVESTOR SENTIMENT
3
LATE 2016 /
EARLY 2017
TODAY
Overall Sector Sentiment Poor
Retail Multiple Low
IPP Model Long Generation Integrated
Leverage High
Costs Mixed Low
ValuationLow Multiples
High FCF Yield
Return of Capital Inconsistent to non-existentPriority, consistent with
leverage and FCF

Vistra Energy Analyst Day Presentat ion 2018
VISTRA’S EVOLUTION / HISTORY OF EXECUTION
4
1 $/MWh includes SG&A, O&M, and maintenance capex, and excludes nuclear. Pre-bankruptcy emergence: 2015A. Post-bankruptcy emergence: 2018E stand-alone. Post-merger includes non-nuclear projected annual
run-rate EBITDA value levers and $20mm projected capex savings. 2 Long-term leverage target.
MARKETS
GENERATION
COST
STRUCTURE
LEVERAGE
PRE-BK
EMERGENCE
100% ERCOT
67% Coal (2015 TWhs)
High Cost1
(~$20/MWh)
Less Focus
on Retail
High Leverage(>12x net debt / Adj.
EBITDA)
POST-BK
EMERGENCE
100% ERCOT
36% Gas / Renewables(2018E stand-alone TWhs)
Low Cost1
(~$10.80/MWh)
Emphasis on Retail and
Integrated Value
Low Leverage(2x net debt / Adj. EBITDA)
POST
MERGER
84% ERCOT, PJM,
ISO-NE
53% Gas / Renewables(2019E TWhs)
Lowest Cost1
(~$8.60/MWh)
Integrated Platform for Retail
Growth
Balance Sheet
Strength Maintained(2.5x net debt / Adj. EBITDA YE 20192)

Vistra Energy Analyst Day Presentat ion 2018
VISTRA’S INTEGRATED BUSINESS MODEL
5
Lowest costs through lean
support cost model and OPI to maximize
EBITDA and FCF
2. LOW-COST
OPERATIONS
2.5x net debt/EBITDAtarget by YE 2019;
exhibit discipline toward
growth investments
1. FINANCIAL
DISCIPLINE
Results in higher
integrated margins and greater
stability of earnings
4. LEADING RETAIL
PLATFORM
Highly efficient
gas-fueled fleet with
advantaged coal and
nuclear assets
5. IN-THE-MONEY
FLEET
Manage riskwhile
optimizing valueof portfolio
6. COMMERCIAL
OPTIMIZATION
Improved risk profile via earnings, geographic,
and fuel diversification
3. DIVERSIFICATION
Results in relatively stable EBITDA with substantial conversion to FCF

Vistra Energy Analyst Day Presentat ion 2018
VISTRA’S STRATEGIC PRIORITIES
6
• Rotate shareholders
• Generate stable EBITDA and FCF
• Exhibit investment discipline
• Return capital
INVESTORS
• Generate ~$9.8 billion in Adj. FCF;
>$6 billion in CAFA thru 2022
• 2.5x net debt/EBITDA by YE 2019
• Optimize cost of debt and maturities
• Maintain strong liquidity
• Minimize taxes
FINANCIAL
• Integrate DYN; capture synergies/OPI
• Retail expansion
• Portfolio assessment & rationalization
• Asset optimization/hedging
BUSINESS OPERATIONS
• FERC: improve/protect markets
• PJM: capacity and energy reforms
• ISO-NE: out of market compensation
• MISO: MPS and move to PJM
• ERCOT: stay the course
• Retail: support competitive markets
MARKETS

Vistra Energy Analyst Day Presentat ion 2018
VISTRA’S INTEGRATED BUSINESS MODEL
CAPITAL ALLOCATION
MARKET UPDATE
KEY TAKEAWAYS

Vistra Energy Analyst Day Presentat ion 2018
1. FINANCIAL DISCIPLINE
8
Vistra’s long-term leverage target is 2.5x net debt to EBITDA
Vistra Emerged From Bankruptcy With Materially
Lower Leverage vs. the Other Public IPPs
Average Net Debt / EBITDA
of Public IPP Peers
December 2016
VST
Net Debt / EBITDA
December 2016
Vistra’s Balance Sheet Is Forecast to Remain
Strong Following Merger With Dynegy
2018E 2019E
1 Assumes projected ~$1 billion excess cash remains on balance sheet.
2.9x 2.2x1
7x
2x
BALANCE SHEET DISCIPLINE
INVESTMENT DISCIPLINE
Vistra’s investment threshold is 500-600 bps above cost of capital

Vistra Energy Analyst Day Presentat ion 2018
$80 $65
$45
VST Stand-AloneOct. 2016
VST Stand-Alone2018E
VST Pro formafor Merger
2. LOW-COST OPERATIONS
9
$/RCE2
Vistra’s management team prioritizes low-cost leadership
$20
$10.80
$8.60
VST Stand-AloneOct. 2016
VST Stand-Alone2018E
VST Pro formafor Merger
$/MWh1
1 Includes Wholesale SG&A, O&M, and maintenance capex. Excludes nuclear. VST “pro forma for merger” includes non-nuclear projected annual run-rate EBITDA value levers and $20mm of projected capex savings.2 Includes Retail SG&A. “RCE” defined as Residential Customer Equivalent, on a Delivered RCE Basis.
WHOLESALE RETAIL
$8$6.50
$4.50
VST Stand-AloneOct. 2016
VST Stand-Alone2018E
VST Pro formafor Merger
$/MWh2

Vistra Energy Analyst Day Presentat ion 2018
$4.68 $8.08
$6.44
$4.44
$2.32
$10.57
PJM ISO-NE ERCOT 2017 ERCOT 2019
Capacity ($/kw-mo) Energy ($/kw-mo)
$11.12$12.52
New CCGT (Required $/kw-mo)
3. DIVERSIFICATION
10
Vistra’s fleet is well-positioned in the attractive ERCOT, PJM, and ISO-NE markets
ADUSTED EBITDA
BY MARKET1
24%
36%Wholesale
23%
5%12%
PJM ERCOT Other ISO-NE/NY
23%Retail
CAPACITY & ENERGY GROSS MARGIN BY MARKET2
1 2019E.2 2019E for representative CCGTs (other than ERCOT 2017, which is 2017A for ERCOT North/HSC). PJM reflects an average of WHUB/M3/MAAC, AD/ M2/RTO, and NI/CCG/COMED pricing points. ERCOT reflects
ERCOT North/HSC. ISO-NE reflects Mass Hub/Algonquin. Energy revenues reflect forward curves as of 5/21/18 and capacity revenues reflect calendar year 2019.
~60% Adj. EBITDA from ERCOT
~45% GM from Capacity and Retail
PJM AND ISO-NE TOTAL GROSS MARGIN HAVE BEEN RELATIVELY STABLE
BETWEEN ~$9-12/KW-MO; ERCOT HAS BEEN MORE VOLATILE WITH
HIGHER UPSIDE. MARKETS STILL DO NOT SUPPORT NEW BUILD
$2.32
$10.57
$17.00
$15.13
$17.42 $17.42Market representative CCGTs
Vistra Energy Analyst Day Presentat ion 2018
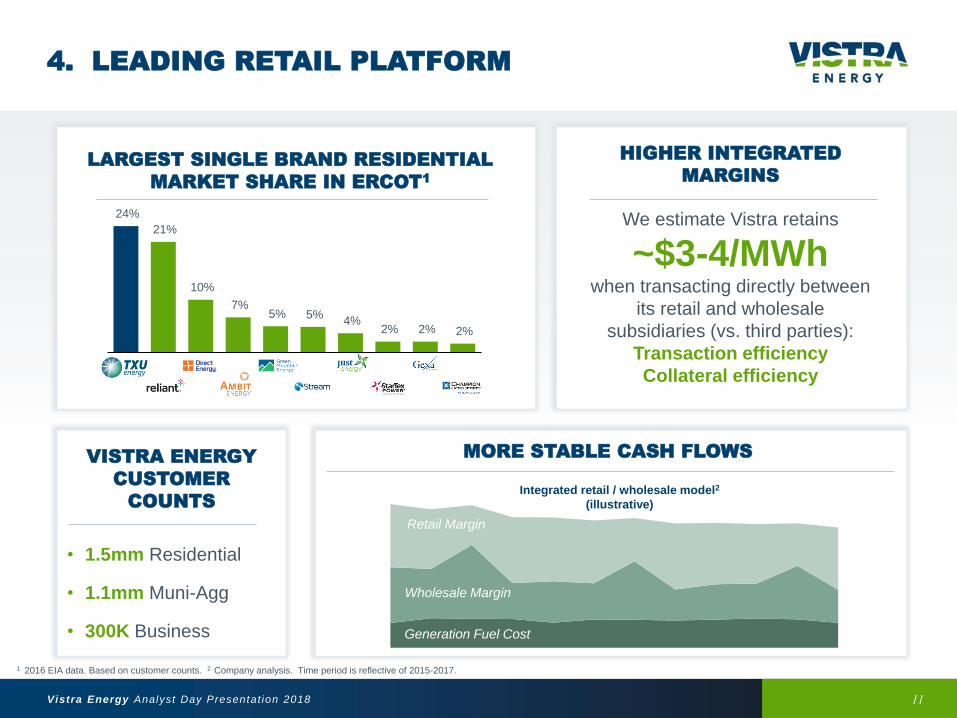
24%
21%
10%
7% 5% 5%
4% 2% 2% 2%
4. LEADING RETAIL PLATFORM
11
LARGEST SINGLE BRAND RESIDENTIAL
MARKET SHARE IN ERCOT1
HIGHER INTEGRATED
MARGINS
We estimate Vistra retains
~$3-4/MWh when transacting directly between
its retail and wholesale
subsidiaries (vs. third parties):
Transaction efficiency
Collateral efficiency
1 2016 EIA data. Based on customer counts. 2 Company analysis. Time period is reflective of 2015-2017.
Retail Margin
Wholesale Margin
MORE STABLE CASH FLOWS
Integrated retail / wholesale model2
(illustrative)
Generation Fuel Cost
VISTRA ENERGY
CUSTOMER
COUNTS
• 1.5mm Residential
• 1.1mm Muni-Agg
• 300K Business

Vistra Energy Analyst Day Presentat ion 2018
ERCOT PJM
5. IN-THE-MONEY FLEET
12
1 2019E. 2 2019E market forwards as of May 30, 2018.
52%38%
10%<1%
Gas Coal Nuclear Other
57%23%
20%
Energy Retail Capacity
GROSS MARGIN CONTRIBUTION
BY REVENUE SOURCE1
FORECAST GENERATION
BY FUEL TYPE1
MEANINGFUL ENERGY &
CAPACITY CONTRIBUTION FROM
GAS-PREDOMINANT FLEET
IN-THE-MONEY ASSETS IN CORE MARKETS
(~75% of Vistra Generation Capacity)
VISTRA IN-THE-MONEY
COAL & NUCLEAR ASSETS
VISTRA IN-THE-MONEY
CCGTs
$5-25
$34
$19-26
$/MWh Marginal Cost
$27
Market Clearing Marginal Cost (ATC) or Peak Heat Rate2
Heat Rate (mmbtu/MWh)
ERCOT PJM ISO-NE
6.8 - 7.7
17.5
6.8 - 8.6
13.5
7.1 - 8.3
10.3
7.2 GW 5.6 GW 7.8 GW 5.9 GW 3.5 GW
Range

Vistra Energy Analyst Day Presentat ion 2018
6. COMMERCIAL OPTIMIZATION
13
CREATE REALIZED PRICE CURVE HIGHER THAN POV AND SETTLED
PRICE – MINIMIZE DOWNSIDE RISK, PRESERVE UPSIDE
OPTIMIZE VALUE OF PORTFOLIO
1. Develop fundamental point of view; hedge at or above
2. Take advantage of volatility in forward curves to hedge through settled date,
optimizing value of fleet
3. Requires in-the-money generating assets to support initial hedge and strong
balance sheet to execute forward transactions
$25.15 $30.50
$33.93
$23.78 $21.06
$23.22
$39.88 $43.23 $46.56
$43.51 $37.57
$33.39
2012 2013 2014 2015 2016 2017
Annual Settled Power Price ($/MWh) Annual Realized Power Price ($/MWh)

Vistra Energy Analyst Day Presentat ion 2018
THE VISTRA INTEGRATED MODEL
14
4. LEADING
RETAIL PLATFORM
5. IN-THE-MONEY
FLEET
6. COMMERCIAL
OPTIMIZATION
1. FINANCIAL
DISCIPLINE
2. LOW-COST
OPERATIONS3. DIVERSIFICATION
Improved risk profile; Stable EBITDA and FCF:
Supports $3 billion+ annual Ongoing Operations Adj. EBITDA target;
~60% of Ongoing Operations Adj. EBITDA converted to Adj. FCF
Committed to capital discipline and creating value for our shareholders

Vistra Energy Analyst Day Presentat ion 2018
STABILITY OF EARNINGS
15
Vistra believes >60% of its earnings stream is visible 3 years out
0
25
50
75
100
Year 1 Year 2 Year 3
Retail Capacity Hedged Length Open
Illustrative

Vistra Energy Analyst Day Presentat ion 2018
VISTRA’S INTEGRATED BUSINESS MODEL
CAPITAL ALLOCATION
MARKET UPDATE
KEY TAKEAWAYS

Vistra Energy Analyst Day Presentat ion 2018
ATTRACTIVE EARNINGS PROFILE
17
STABLE EBITDA AND FCF
• Integrated operations
• Earnings, geographic, and fuel diversification
- ~45% of GM from Retail and Capacity
- ~60% of Adj. EBITDA from ERCOT
• Low-cost operations
• 2.5x net debt / EBITDA by year-end 20191
Creating visible long-term value through achievement of
value lever targets and a disciplined approach to capital allocation
VALUE CREATION
• On track to deliver an estimated:
- $500mm EBITDA value levers by YE 2019
- $258mm after-tax FCF benefits by YE 2019
- ~$1.7 billion tax/TRA savings; AMT refunds
• Forecasting ~60% conversion of adjusted EBITDA
from ongoing operations to FCF
~$1 billion Capital available for allocation
projected through
year-end 2019
>$6 billion Capital available for allocation projected
through year-end 2022; ~$9.8 billion in
Ongoing Ops Adj. FCF with ~$3.6 billion in
debt repayments
Does not include EBITDA or FCF from Retail Expansion or other Growth Opportunities
1 Long-term leverage target.

Vistra Energy Analyst Day Presentat ion 2018
NEAR-TERM CAPITAL ALLOCATION PLAN
18
Maintaining a strong balance sheet remains the top capital allocation priority
Announcing Authorization of $500mm Share Repurchase Program
Vistra intends to execute repurchases on an opportunistic basis
~$500mm in additional capital forecast to be available for
allocation through year-end 2019:
Recurring Dividend
Could institute a recurring
dividend with a meaningful yield
and opportunity for growth
Opportunistic Growth
Focus on organic retail growth;
highlight disciplined
acquisitions and renewables
Share Repurchases
Could allocate additional capital
toward opportunistic share
repurchases if best value
After achieving its 2.5x net debt / EBITDA target by year-end 2019,
Vistra estimates it will have ~$1 billion in capital available for allocation

Vistra Energy Analyst Day Presentat ion 2018
LONG-TERM PHILOSOPHY
19
DIVERSE ALLOCATION OF CAPITAL
• Hypothetical annual capital generation:
• ~$3+ billion in adjusted EBITDA from ongoing operations
• ~60% conversion to free cash flow
• Would result in ~$1.8+ billion in adjusted FCF from ongoing operations per year
• Hypothetical annual capital allocation:
• ~$400-500mm allocated to recurring dividend
• ~$1,300-1,400mm available for future dividend growth, opportunistic share
repurchases, or growth investments
• Incremental CAFA could be available if Vistra rationalizes non-strategic assets
>$6 billion in capital forecast to be available for allocation
through year-end 2022
Vistra expects to generate nearly $10 billion in ongoing operations
adjusted FCF through year-end 2022

Vistra Energy Analyst Day Presentat ion 2018
GROWTH OPPORTUNITIES
20
Vistra’s meaningful FCF and relationship with customers will enable strategic evolution
RETAIL EXPANSION
OPPORTUNITIES
GENERATION EVOLUTION
OPPORTUNITIES
• Vistra rotated supply base toward gas-
fueled assets
- ERCOT: ~4,200 MW coal retirements;
~8,000 MWs of attractive CCGT acquisitions
- Unlikely near-term focus
• New technologies present future
opportunities
- Flexible balance sheet and meaningful FCF
- Support retail / customer needs
- Storage offers selective opportunities
• Focus on organic growth
- Most economic
- Attractive markets
- Matched generation
• Acquisition opportunities
- Price discipline
- Quality of portfolio
- Highly Selective
Vistra’s length offers the opportunity to develop multiple retail channels with
higher integrated margins and lower collateral requirements

Vistra Energy Analyst Day Presentat ion 2018
PORTFOLIO OPTIMIZATION
21
Portfolio optimization activities could further increase Vistra’s capital available for allocation
MISO
• OPI process ongoing
• Multi-pollutant Standard (MPS)
• Pursue opportunity for MISO Zone 4 to join PJM
NYISO
• Single asset (Independence, ~1.2 GW CCGT)
• Well-positioned asset, but single asset ownership not a strategy
CAISO
• Attractive sites with opportunities to optimize value

Vistra Energy Analyst Day Presentat ion 2018
VISTRA’S INTEGRATED BUSINESS MODEL
CAPITAL ALLOCATION
MARKET UPDATE
KEY TAKEAWAYS

Vistra Energy Analyst Day Presentat ion 2018
ERCOT: MARKET FUNCTIONING AS DESIGNED
23
Vistra anticipates reserve margins will be below those forecast by the ERCOT May CDR
71.7 73.4 75.1 76.5 77.979.682.4 84.1 84.8 84.8
11.0%12.3% 12.0%
10.9%8.9%
2019 2020 2021 2022 2023
GW
Firm Peak Load, GW Total Capacity, GW Reserve Margin
ERCOT SUMMER CDR
~2% firm peak
load growth
forecast / year
2019 2020 2021 2022 2023
Wind 4,656 MW 4,862 MW 558 MW – –
Solar 1,057 MW 997 MW 200 MW – –
Thermal 1,289 MW 1,217 MW 1,067 MW 654 MW –
NEW BUILD ASSUMED (BY YEAR) IN ERCOT SUMMER CDR

Vistra Energy Analyst Day Presentat ion 2018
PJM AND ISO-NE: PRESERVING COMPETITION
24
PJM
• 21/22 BRA constructive
• MOPR-ex with no exemptions
is a viable solution
• Energy reform likely to follow
fast start and capacity reforms
ISO-NE
• CASPR is a constructive
solution
• Fuel security RMR proposal is
problematic and ill-timed
PJM and ISO-NE are taking constructive steps to combat out-of-market subsidies;
FERC must continue to support competitive markets, not incentivize state out -of-market actions
Vistra’s fleet is well-positioned in the PJM and ISO-NE markets
24

Vistra Energy Analyst Day Presentat ion 2018
VISTRA’S INTEGRATED BUSINESS MODEL
CAPITAL ALLOCATION
MARKET UPDATE
KEY TAKEAWAYS

Vistra Energy Analyst Day Presentat ion 2018
Good Fundamentals
• Irreplaceable product
• Inelastic demand
• Modest near-term growth ► electrification of
transport
FERC and ISOs Protecting
Markets Despite Intervention
• ISO-NE: LICAP ► FCM ► CASPR
• PJM: ICAP ► RPM ► CP
• ERCOT: System-wide offer cap; ORDC
• Involvement in DOE process
Renewables and Batteries an
Opportunity, Not a Threat
• Balance sheet and cash flow to participate
• Core business remains strong under possible
penetration
ANALYST DAY TAKEAWAYS
26
Relatively Stable Earnings With
Multi-Year Visibility
• Integrated with multi-channel Retail
• Assets in key capacity markets
• Capability and balance sheet to hedge “in-the-
money” assets
Low Leverage, Low Cost a Must
• Attract long-oriented investors ► investment grade
• Highly efficient assets and lean support costs
Right Business Model Leads
to Strong Conversion of
EBITDA to FCF
• Low sustaining capex; low debt ► low interest
expense
• Multiple capital allocation alternatives
Mitigation
measures

END SLIDE