CEO Energy Power Conference -...
24
Barclays CEO Energy ‐ Power Conference September 2017
-
Upload
vuongquynh -
Category
Documents
-
view
217 -
download
0
Transcript of CEO Energy Power Conference -...

Barclays CEO Energy‐Power ConferenceSeptember 2017
Forward‐Looking & Other Cautionary Statements
The fol lowing presentation includes forward‐ looking statements. These statements relate to future events, such as anticipated revenues, earnings, business strategies, competit ive position or other aspects of our operations or operating results or the industries or markets in which we operate or participate in general, including our acquisit ion and acreage trading strategies, projections regarding our rig count and abil ity to work through our dril led but uncompleted well backlog, our expectations regarding our hedging program, our abil ity to dril l high value Merge wells that reduce leverage over t ime, our abil ity to enhance current spacing assumptions in Merge and Woodford, our abil ity to execute on our development plan in the Merge, including our dril l ing and leasing programs, projections regarding total production, average daily production, lease operating expenses, production taxes as a percentage of revenue, ad valorem taxes, cash G&A expenses and projected internal rates of return, and the results of our hedging program. Actual outcomes and results may differ material ly from what is expressed or forecast in such forward‐ looking statements. These statements are not guarantees of future performance and involve certain risks, uncertainties and assumptions that may prove to be incorrect and are diff icult to predict such as oil and gas prices; operational hazards and dril l ing risks; potential fai lure to achieve, and potential delays in achieving, expected reserves or production levels from existing and future oil and gas development projects; our abil ity to identify and consummate acquisit ions and other growth opportunities, including acreage trades; unsuccessful exploratory activit ies; unsuccessful acquisit ions; unexpected cost increases or technical diff iculties in constructing, maintaining or modifying company faci l it ies; potential l iabi l ity for remedial actions under existing or future environmental regulations or from pending or future l it igation; l imited access to capital or signif icantly higher cost of capital related to i l l iquidity or uncertainty in the domestic or international f inancial markets; an inabil ity to improve well spacing; general domestic and international economic and polit ical conditions, as well as changes in tax, environmental and other laws applicable to our business and other economic, business, competit ive and/or regulatory factors affecting our business generally as set forth in our f i l ings with the Securit ies and Exchange Commission (SEC). We caution you not to place undue rel iance on our forward‐ looking statements, which are only as of the date of this presentation or as otherwise indicated, and we expressly disclaim any responsibil ity for updating such information.
2
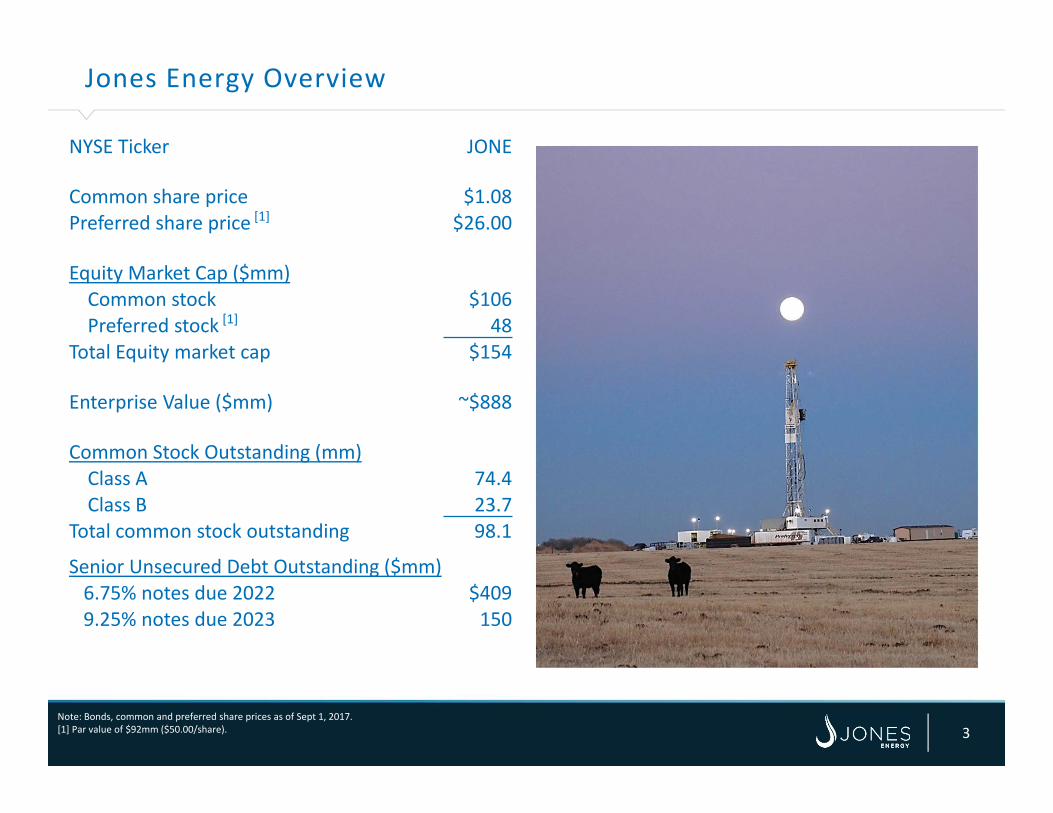
Jones Energy Overview
Note: Bonds, common and preferred share prices as of Sept 1, 2017.[1] Par value of $92mm ($50.00/share). 3
NYSE Ticker JONE
Common share price $1.08 Preferred share price [1] $26.00
Equity Market Cap ($mm)Common stock $106Preferred stock [1] 48
Total Equity market cap $154
Enterprise Value ($mm) ~$888
Common Stock Outstanding (mm)Class A 74.4Class B 23.7
Total common stock outstanding 98.1
Senior Unsecured Debt Outstanding ($mm)6.75% notes due 2022 $4099.25% notes due 2023 150

Corporate Snapshot
4
Asset Summary
• Eastern Anadarko Basin (Merge)• ~21,000 net acres• 2Q17 production of ~2.0 Mboe/d
• Western Anadarko Basin• ~158,000 net acres• 2Q17 production of ~17.4 Mboe/d
Operations Summary
• Merge• 7 wells online with current 2‐rig program • Focused on acreage trades and delineation strategy
• Western Anadarko Basin• Dropping to 1 rig program• Working through DUC backlog
Western Anadarko BasinCleveland
Eastern Anadarko BasinMerge

Financial Snapshot
5
Continue to manage the balance sheet and create financial flexibility• March 2017:
• Paid down revolver with $17.5 million from JEI to JEH via Class A stock dividend
• August 2017:
• Arkoma Woodford divestiture, sold for $65 million
• Proceeds used to pay down revolver
• Ongoing 2018/2019:
• Hedge unwinds bring forward value and pay down debt
• Undrawn revolver amount of $223 million[1]
• Working with lenders to create additional financial flexibility
• High PV Merge wells de‐lever the company over time
[1] As of August 31, 2017

What is the Merge Play?
Siluria
nDevon
ian
Mississippian
Blackjack Creek
Hunton
Chester/Caney
Springer Sands
AtokaMorrow
Cherokee
Oswego
Big Lime
Penn
sylvan
ian
Lower
Bois D’ Arc
Chimney Hill
Lower
Caney
Skinner
Prue
Anadarko Basin “Merge”Stratigraphic Column
Meramec
Osage/Sycamore
Woodford
Upper
Upper
Merge located between the STACK and the SCOOP within the Anadarko Basin
Key Points:• Unique and distinguishing
play characteristics• “Best of Both” attributes
including Meramec extension from STACK and Upper Woodford extension from SCOOP
• Multiple benches within proven productive zones
• Higher reservoir quality• Additional upside from
Hunton/Springer/etc.
JONE initial targets
STACK
NW STACK
MERGE
SCOOP
Mississippian Well
JONE Acreage
Woodford Well
Dewey Blaine
Caddo
Kiowa
Washita
Custer
Kingfisher
Grady
Comanche
Canadian
6
CLR Establishes SCOOP
2012‐13
2011 2011‐12
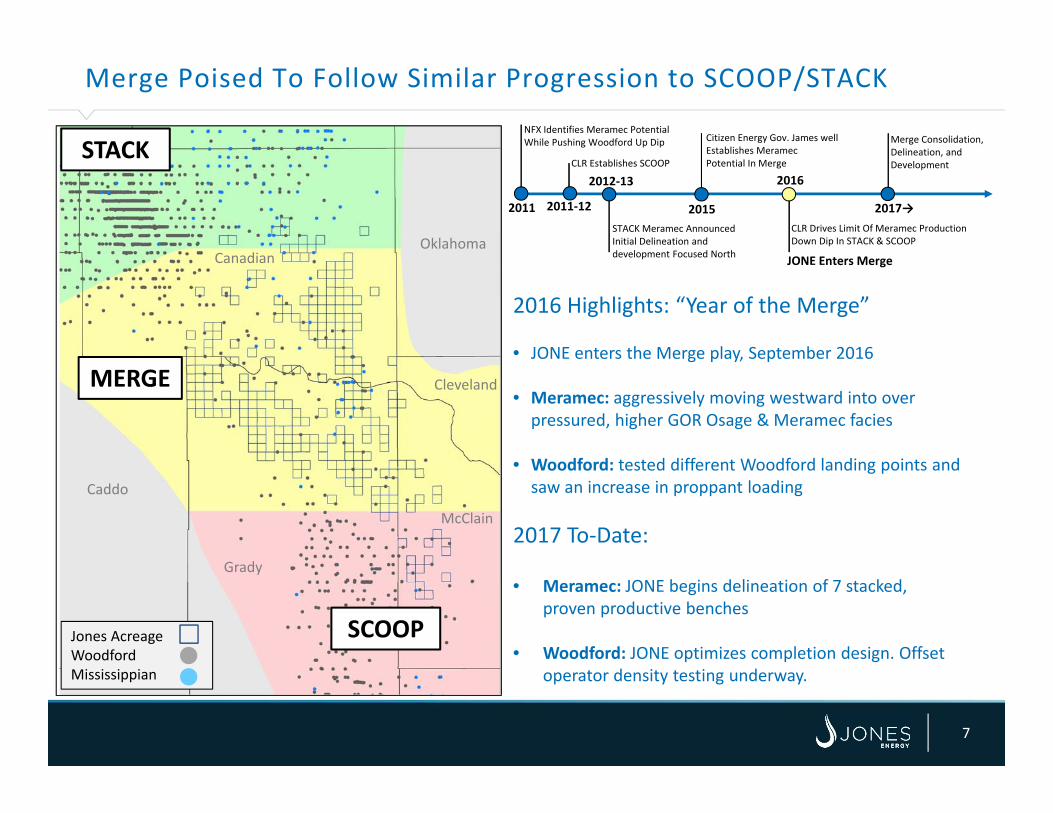
Merge Poised To Follow Similar Progression to SCOOP/STACK
7
NFX Identifies Meramec Potential While Pushing Woodford Up Dip
2015
Citizen Energy Gov. James well Establishes Meramec Potential In Merge
STACK Meramec AnnouncedInitial Delineation and development Focused North JONE Enters Merge
2016
Merge Consolidation, Delineation, and Development
CLR Drives Limit Of Meramec Production Down Dip In STACK & SCOOP
2017→
2016 Highlights: “Year of the Merge”
• JONE enters the Merge play, September 2016
• Meramec: aggressively moving westward into over pressured, higher GOR Osage & Meramec facies
• Woodford: tested different Woodford landing points and saw an increase in proppant loading
2017 To‐Date:
• Meramec: JONE begins delineation of 7 stacked, proven productive benches
• Woodford: JONE optimizes completion design. Offset operator density testing underway.
Jones AcreageWoodford Mississippian
STACK
MERGE
SCOOP
Grady
Caddo
CanadianOklahoma
Cleveland
McClain
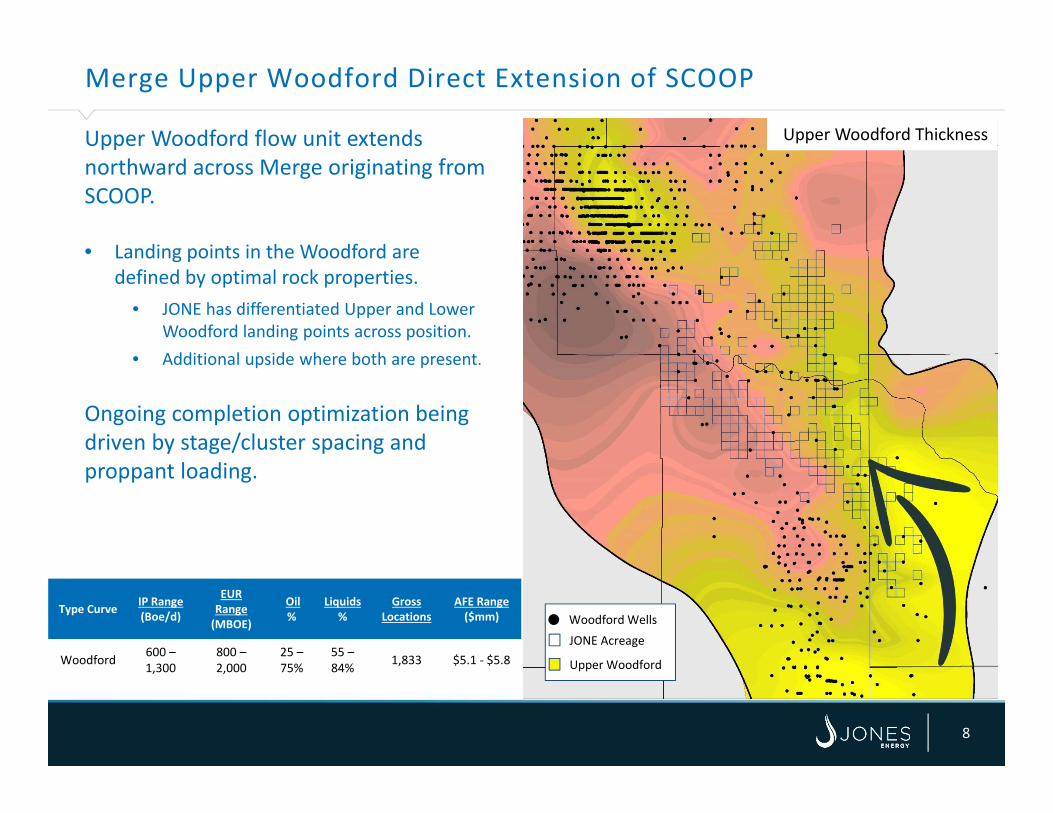
Merge Upper Woodford Direct Extension of SCOOP
8
Upper Woodford flow unit extends northward across Merge originating from SCOOP.
• Landing points in the Woodford are defined by optimal rock properties.
• JONE has differentiated Upper and Lower Woodford landing points across position.
• Additional upside where both are present.
Ongoing completion optimization being driven by stage/cluster spacing and proppant loading.
JONE Acreage
Woodford Wells
Upper Woodford Thickness
Type Curve IP Range(Boe/d)
EUR Range(MBOE)
Oil%
Liquids%
Gross Locations
AFE Range($mm)
Woodford 600 –1,300
800 –2,000
25 –75%
55 –84% 1,833 $5.1 ‐ $5.8 Upper Woodford

Keys to Woodford Success: Frac Design Evolution
9
Initial Conclusions: Tighter stage spacing and greater proppant loading
driving well performance.GEN 3Today
GEN 2JONE enters the Merge
GEN 1Early Merge Drilling
GEN Proppant(lbs. / ft.)
Fluid Concentration(Bbls. /ft.)
Cluster Spacing(ft.)
Stage Spacing(ft.)
3 2,000 65 48 194
2 1,600 37 60 235
1 <1,500 ≥ 30 ≥ 60 ≥240

Merge Meramec Direct Extension of STACK
10
Continuation of Mississippian age (Meramec) reservoir from STACK
• Southern extent of position transitions to organic shale and limestone (Sycamore conventional reservoir)
• Play boundaries continually being pushed westward with additional delineation
• Net‐to‐gross pay is higher than STACK core.
Shale Dominated SCOOP Sycamore (Conventional)
Siltstone Dominated STACK Meramec (Unconventional)
Reservoir Qualifier
JONE AcreageUnconventionalConventional
Mississippian Wells
Type Curve
IP Range(Boe/d)
EUR Range(MBOE)
Oil%
Liquids%
Gross Locations
AFE Range ($mm)
Meramec 1,000 –1,500
950 –1,200
25 ‐50%
65 –75% 1,016 $5.4 ‐ $6.1

JONE Merge Position
1 Acreage closed and funded2 Net unrisked resource potential based on Company internal estimates
11
Merge Entry:September 2016
Today:September 2017
Net Acres: 16,9751 21,279
Operated Sections: 19 35
Total Sections: 219 235
Gross Loc.
Resource2(MMBoe)
Gross Loc.
Resource2(MMBoe)
Meramec 740 115 1,106 193
Woodford 1,375 215 1,833 271
Hunton 0 0 252 32
Springer 0 0 60 9
TOTAL 2,115 330 3,251 505
Producing Wells: 27 51
Net Production (Boe/d): 138 ~3,000

Merge Key Players and JONE Well Highlights
12
Gary 1H‐3601X7,249’ Lateral Length
Peak IP30: 699 Bo/d & 3,488 Mcf/d
Osborn 1H‐204,930’ Lateral Length
Peak IP30: 166 Bo/d & 2,620 Mcf/d
Lydia 1‐16H 4,795’ Lateral Length
Peak IP30: 436 Bo/d & 3,617 Mcf/d
Bomhoff 20‐12‐7 2H4,428’ Lateral Length
Peak IP30: 544 Bo/d & 4,777 Mcf/d
Huffman 2H‐30‐197,128’ Lateral Length
Peak IP30: 543 Bo/d & 3,114 Mcf/d
Rosemary 2H‐1‐367,506’ Lateral Length
Peak IP30: 1,023 Bo/d & 3,302 Mcf
Garrett 4‐11‐6 1H4,697’ Lateral Length
Peak IP24: 693 Bo/d & 2,344 Mcfd
Bomhoff 20‐12‐7 1H4,366’ Lateral Length
Peak IP30: 222 Bo/d & 3,015 Mcf/d
Toy Darrow 1H‐7‐68,128’ Lateral Length
Peak IP30: 315 Bo/d & 2,428 Mcf/d
Radcliff 1‐17H4,338’ Lateral Length
Peak IP30: 246 Bo/d & 1,776 Mcf/d
1
2
3
4
5 1 2
34
5
10
9
8
7
6
78
9
10
6
Merge dominated by STACK and SCOOP players
APACitizen/LINN CLR DVNEagle EnergyGPORJONE MRO NFXXEC
Meramec WellWoodford WellJONE OperatedJONE Non‐op
CANADIAN
OKLAHOMA
GRADY
CADDO
MC CLAIN
Production data are reported as actuals, not normalized.

OKLAHOMA
CADDO
CLEVELAND
MC CLAIN
CANADIAN
GRADY
Current Merge Rig Activity
13
Rigs by operator on the JONE Merge footprint
# of Rigs by Drilling Targets
Denotes JONE RigMeramec (6)Woodford (10)Hunton (3)Unknown (1)
Operator # of Rigs
Citizen Energy 3
NFX 3
JONE 2
LINN 2
XEC 2
89 Energy 1
APA 1
Casillas Petroleum 1
Chaparral Energy 1
EOG 1
Gaedeke Energy 1
Travis Peak Resources 1
Total 20
Rigs as of 8/31/2017. Source: Drillinginfo, IHS

Full Field Development on the Horizon
14
JONE Current Location InventoryPotential Upside Inventory (tests underway today)
1 Mile
TARGET
JONE Current
Assumption
Upside From
Industry
UPPER MERAMEC 4 8
LOWER MERAMEC 4 8
UPPER WOODFORD 8 8
LOWER WOODFORD 0 7
Per Section TOTAL 16 31
Density tests currently underway in both the Meramec and Woodford could significantly enhance current spacing assumptions.

Merge Development Plan
15Note:[1] Reliable technology areas (RTA); SEC mechanism for unconventional reserve booking. RTA data acquisition includes rock, fluids, and active/passive seismic.
2017
2018
2019
2020
2 rigs delineate acreage Secure leases Confirm optimal landing points
Potential to add additional rigs Continue delineation Optimize spacing, landing points, completion
Finalize spacing tests Prioritize landing points Optimize operations
Full scale development
Defined development areas of consistent geology [1]
Hydrocarbon phase Pressure gradient Landing point Drilling depth range
Multi‐year strategy to maximize resource value
JONE Acreage
RTA
Yukon
Tuttle
W. Minco
El Reno
E. Minco
49
13
2
40
12
520
5
10
15
20
25
30
35
40
45
50
A JONES(Last 9Wells)
JONES(All
Wells)
B C D E F
Average Drilling Da
ys per 15,00
0'
Operator
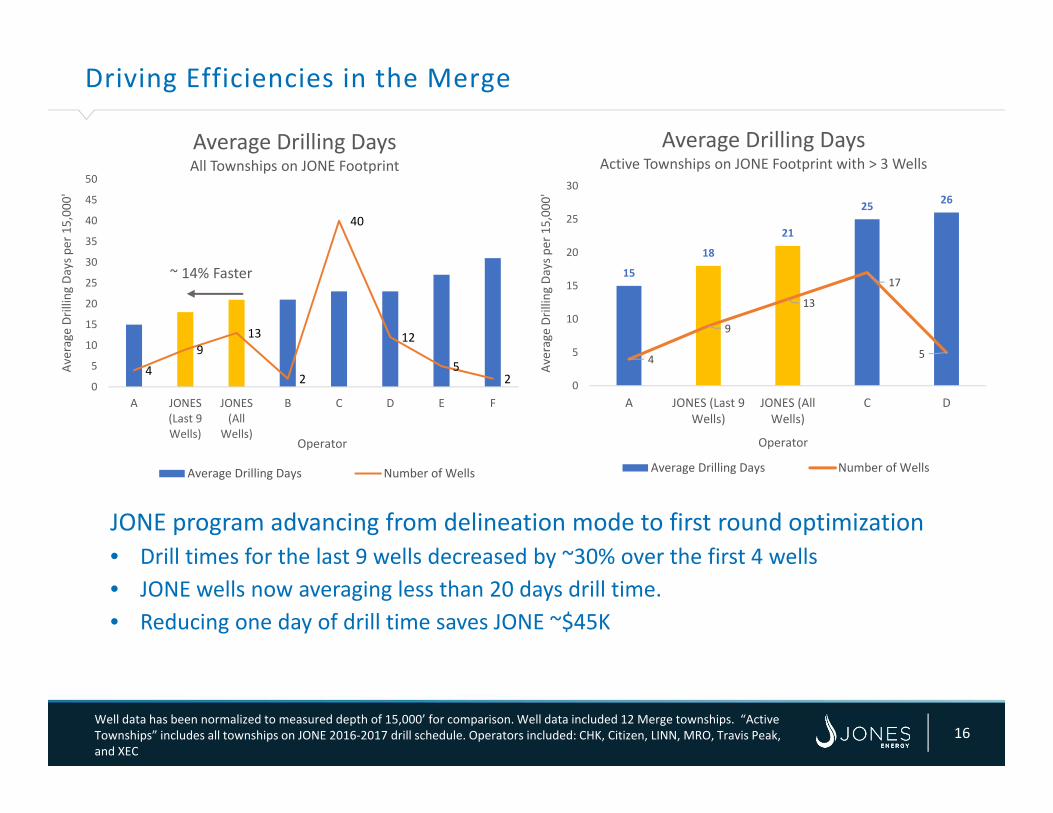
Average Drilling Days All Townships on JONE Footprint
Average Drilling Days Number of Wells
Driving Efficiencies in the Merge
16
JONE program advancing from delineation mode to first round optimization • Drill times for the last 9 wells decreased by ~30% over the first 4 wells• JONE wells now averaging less than 20 days drill time.• Reducing one day of drill time saves JONE ~$45K
~ 14% Faster
Well data has been normalized to measured depth of 15,000’ for comparison. Well data included 12 Merge townships. “Active Townships” includes all townships on JONE 2016‐2017 drill schedule. Operators included: CHK, Citizen, LINN, MRO, Travis Peak, and XEC
15
18
21
25 26
4
9
13
17
5
0
5
10
15
20
25
30
A JONES (Last 9Wells)
JONES (AllWells)
C D
Average Drilling Da
ys per 15,00
0'
Operator
Average Drilling Days Active Townships on JONE Footprint with > 3 Wells
Average Drilling Days Number of Wells
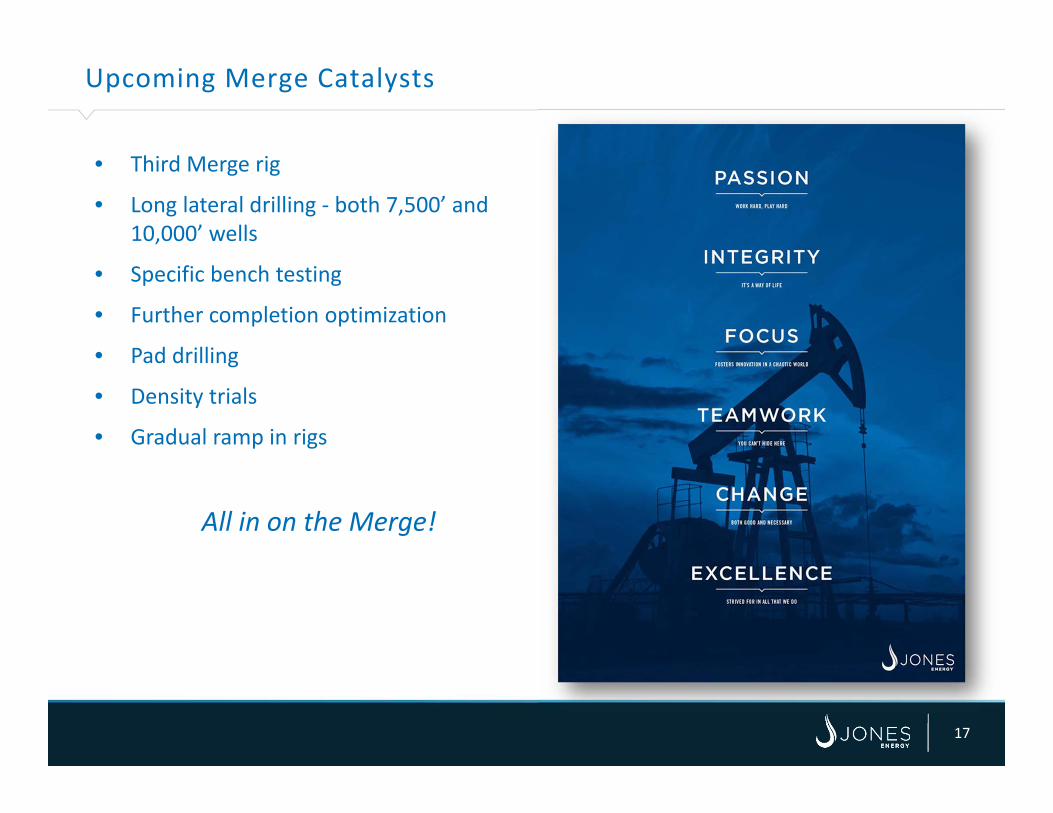
Upcoming Merge Catalysts
17
• Third Merge rig
• Long lateral drilling ‐ both 7,500’ and 10,000’ wells
• Specific bench testing
• Further completion optimization
• Pad drilling
• Density trials
• Gradual ramp in rigs
All in on the Merge!

APPENDIX

Merge Type Curve Data
19
Type Curve for 5,000’ lateral
IP Range(Boe/d)
EUR Range(MBOE)
% Oil % Liquids Gross Locations
AFE Range ($mm)
Meramec 1,000 – 1,500 950 – 1,200 25 ‐ 50% 65 – 75% 1,016 $5.4 ‐ $6.1
Woodford 600 – 1,300 800 – 2,000 25 – 75% 55 – 84% 1,833 $5.1 ‐ $5.8
Key Statistics:
Gas Shrink NGL Yield (Bbl/Mmcf)
NGL Realization (% of WTI)
Fixed Opex($/Mo./Well)
Differentials Production Tax
$/Bbl $/Mcf Gas/NGL (Yrs 1‐3)
Gas/NGL (Yrs 3+) Oil
27% 110 30% $3,500 ($4.00) ($1.60) 2.5% 7.5% 4.6%

2017 Guidance
20
Updated 2017E 3Q17ETotal Production (MMBoe) 7.6 – 8.0 1.8 – 1.9Average Daily Production (MBoe/d) 20.7 – 22.0 20.0 – 21.0Crude Oil (MBbl/d) 5.5 – 5.9 5.3 – 5.6Natural Gas (MMcf/d) 52 – 55.3 49.3 – 51.6NGLs (MBbl/d) 6.5 – 6.9 6.5 – 6.8
Lease Operating Expense ($mm) $40.0 – $45.0Production Taxes (% of Unhedged Revenue) * 4.5% – 5.5%Ad Valorem Taxes ($mm) * $2.7 – $3.0Cash G&A Expense ($mm) $23 – $25
Capital Expenditures ($mm)Merge JONE Operated D&C $83Merge Non‐Operated D&C and Other 17
Total Merge D&C $100Merge Leasing and Pooling 23
Total Merge Capital Expenditures $123Cleveland D&C $110Cleveland Leasing 5
Total Cleveland Capital Expenditures $115Other 12
Total Capital Expenditures $250
* Production and ad valorem taxes are included as one line item on the Company’s income statement.

Hedge Position
21[1] Swaps purchased to crystalize $15mm gainHedge position as of 9/1/2017
3Q17 4Q17 2017 2018 2019 2020Oil HedgesSwaps Sold (MBbl) 344 498 842 2,364 1,020 660 Price ($/Bbl) $62.78 $62.95 $62.88 $51.08 $50.04 $50.00
Swaps Sold (MBbl)[1] ‐ ‐ ‐ 294 ‐ ‐Price ($/Bbl) ‐ ‐ ‐ $78.58 ‐ ‐Offset Swaps Purchased (MBbl)[1] ‐ ‐ ‐ 294 ‐ ‐Price ($/Bbl) ‐ ‐ ‐ $46.79 ‐ ‐
Collars (MBbl) ‐ ‐ ‐ ‐ 810 ‐Floor ($/Bbl) ‐ ‐ ‐ ‐ $48.52 ‐Ceiling ($/Bbl) ‐ ‐ ‐ ‐ $59.64 ‐
Gas HedgesSwaps Sold (MMcf) 3,410 5,070 8,480 22,310 9,820 8,400 Price ($/Mcf) $3.72 $3.70 $3.71 $2.96 $2.83 $2.79
Swaps Sold (MMcf)[1] ‐ ‐ ‐ 3,930 ‐ ‐Price ($/Mcf) ‐ ‐ ‐ $4.27 ‐ ‐Offset Swaps Purchased (MMcf)[1] ‐ ‐ ‐ 3,930 ‐ ‐Price ($/Mcf) ‐ ‐ ‐ $2.81 ‐ ‐
Collars (MMcf) ‐ ‐ ‐ ‐ 11,890 ‐Floor ($/Mcf) ‐ ‐ ‐ ‐ $2.55 ‐Ceiling ($/Mcf) ‐ ‐ ‐ ‐ $3.19 ‐
NGL Swaps (MBbl)Ethane ‐ ‐ ‐ ‐ ‐ ‐Propane 154 227 381 850 ‐ ‐Iso Butane 16 24 40 120 ‐ ‐Butane 54 81 135 335 ‐ ‐Natural Gasoline 62 93 155 360 ‐ ‐Total NGLs 286 425 711 1,665 ‐ ‐
NGL Swap Prices ($/Gal)Ethane ‐ ‐ ‐ ‐ ‐ ‐Propane $0.47 $0.47 $0.47 0.57 ‐ ‐Iso Butane 0.57 0.57 0.57 0.72 ‐ ‐Butane 0.61 0.61 0.61 0.69 ‐ ‐Natural Gasoline 1.04 1.04 1.04 1.05 ‐ ‐
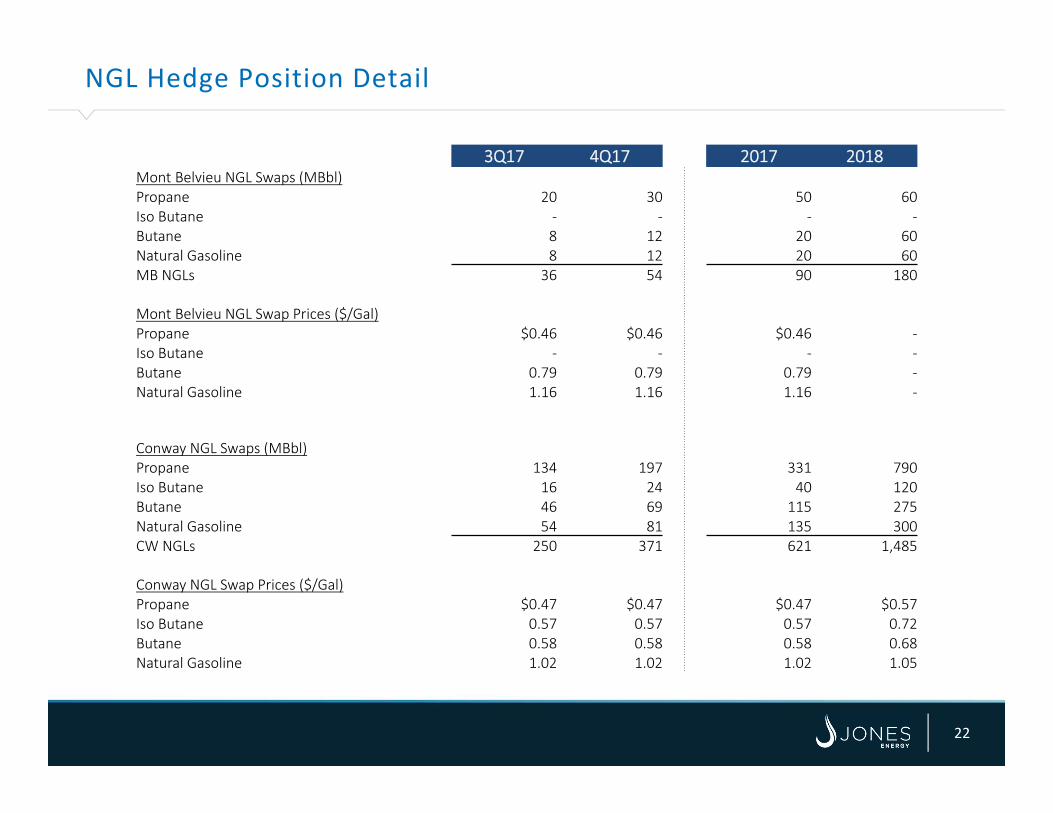
NGL Hedge Position Detail
22
3Q17 4Q17 2017 2018Mont Belvieu NGL Swaps (MBbl)Propane 20 30 50 60 Iso Butane ‐ ‐ ‐ ‐Butane 8 12 20 60 Natural Gasoline 8 12 20 60 MB NGLs 36 54 90 180
Mont Belvieu NGL Swap Prices ($/Gal)Propane $0.46 $0.46 $0.46 ‐Iso Butane ‐ ‐ ‐ ‐Butane 0.79 0.79 0.79 ‐Natural Gasoline 1.16 1.16 1.16 ‐
Conway NGL Swaps (MBbl)Propane 134 197 331 790 Iso Butane 16 24 40 120 Butane 46 69 115 275 Natural Gasoline 54 81 135 300 CW NGLs 250 371 621 1,485
Conway NGL Swap Prices ($/Gal)Propane $0.47 $0.47 $0.47 $0.57 Iso Butane 0.57 0.57 0.57 0.72 Butane 0.58 0.58 0.58 0.68 Natural Gasoline 1.02 1.02 1.02 1.05

Experienced Management Team
23
Eric Niccum(EVP & COO)
Joined Jones Energy in August 2011 23 years of industry experience Most recently Mid‐Continent Resource Manager and New Delivery Manager at BP for the Arkoma Woodford horizontal shale play Formerly Resource Manager at BP for the Anadarko Cleveland and Granite Wash horizontal drilling programs utilizing conventional and coil tubing drilling techniques Farmed‐out 28 Cleveland development wells to Jones in 2007‐2008 under an innovative cost cap deal structure Long history of field development at BP via horizontal drilling since 1995 Previously served various engineering and leadership roles in Louisiana and Deepwater Gulf of Mexico for BP / Amoco BS in Mechanical Engineering from Purdue University
Jonny Jones(Founder, Chairman & CEO)
Founded Jones Energy in 1988 33 years of industry experience focused in the US Mid‐Continent Formerly geologist with subsidiaries and affiliates of British Petroleum Active in the American Association of Petroleum Geologists and Independent Petroleum Association of America Served on the Advisory Council of the University of Oklahoma School of Geology and Geophysics and has been actively involved in fundraising efforts at the school Chairman of the U.S. Oil and Gas Association, immediate past Chairman of the Texas Oil & Gas Association Winner of Ernst & Young Entrepreneur of the Year 2012 Central Texas Award BS in Geology from the University of Oklahoma and an MA in Geology from the University of Texas
Mike McConnell(President)
Joined Jones Energy in 2004 33 years of industry experience Leads Jones Oklahoma City office Formerly CEO of the Generation and Production Group at Enron, CEO of Enron Global Markets LLC and President of Houston Pipe Line and Louisiana Resources Company Numerous other commercial positions in London and Houston Vice Chairman of the Independent Petroleum Association of America natural gas steering committee Past chairman of the Price Business School Board of Advisors for the University of Oklahoma BBA in Petroleum Land Management from the University of Oklahoma
Robert Brooks(EVP & CFO)
Joined Jones Energy in May 2013 25 years of industry experience Most recently Senior Managing Director and Head of Energy at Focus Capital Group Inc. / Whiteface Capital LLC Formerly served as Senior Managing Director and Head of U.S. Oil & Gas for Macquarie Capital Previously served as Principal at Bank of America Securities in the Global Energy and Power Group Prior to Bank of America, was Vice President in the Global Energy Group at Salomon Brothers BS in Mechanical Engineering from Massachusetts Institute of Technology, MS in Mechanical Engineering from Stanford, and MS in Management from Massachusetts Institute of Technology
Jeff Tanner(EVP – Geosciences)
Joined Jones Energy in September 2014 30 years of industry experience Most recently Vice President, Exploration for Southwestern Energy Formerly held a variety of leadership and technical positions for Laredo Petroleum, Cabot Oil and Gas, and Noble Energy Began career with Shell in Houston Member of the American Association of Petroleum Geologists and the Houston Geological Society B.S. in Geology from Texas A&M and an M.S. in Geology from the University of Houston
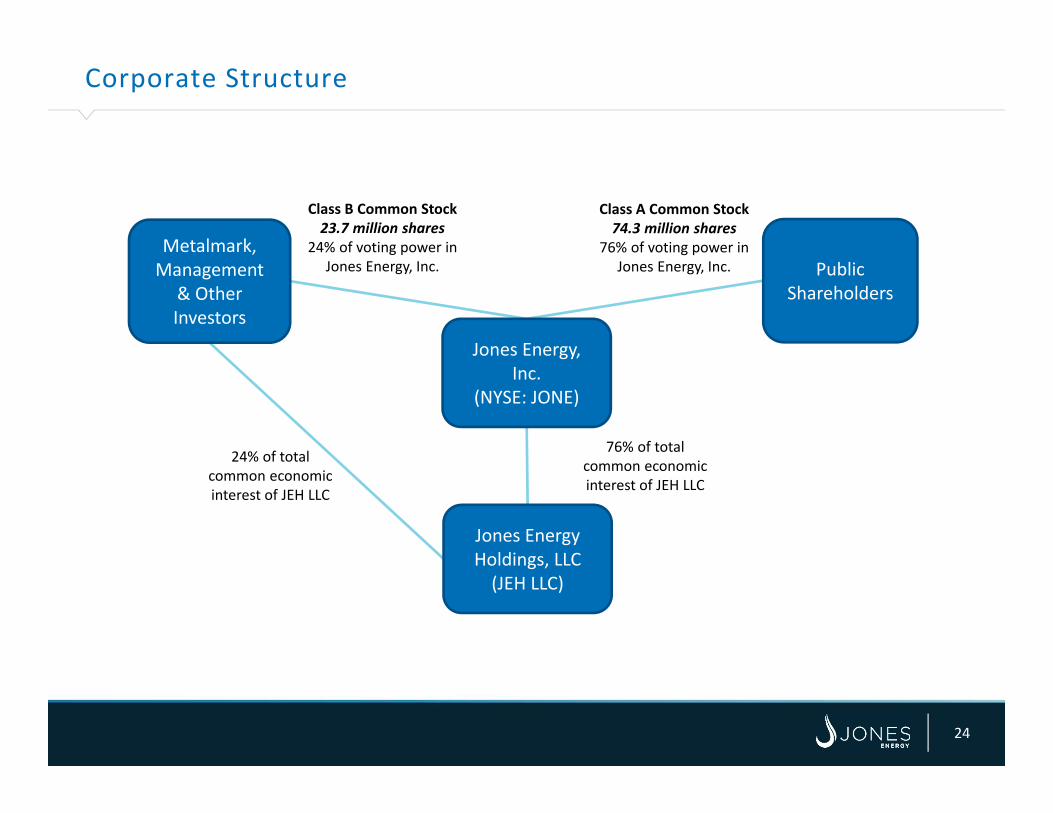
Corporate Structure
Jones Energy, Inc.
(NYSE: JONE)
Jones Energy Holdings, LLC(JEH LLC)
Class A Common Stock74.3 million shares
76% of voting power in Jones Energy, Inc.
24% of total common economic interest of JEH LLC
76% of total common economic interest of JEH LLC
Metalmark,Management
& Other Investors
PublicShareholders
Class B Common Stock23.7 million shares
24% of voting power in Jones Energy, Inc.
24