Entrepreneur characteristics, competitive strategy, firm ...

CEO Characteristics, Firm Performance, and Corporate Political Contributions:
A Firm Level Analysis
Manohar Singh,
The Pennsylvania State University-Abington
Email: [email protected]
Vijaya Subrahmanyam,
Mercer University-Atlanta
Email: [email protected]
Anita Pennathur,
Florida Atlantic University
Email: [email protected]

CEO Characteristics, Firm Performance, and Corporate Political Contributions:
A Firm Level Analysis
Abstract:
We investigate if CEO characteristics and firm performance determine the choice of Political
Action Committee (PAC) contributions by firms. Using a unique, hand-collected database, we
also focus on the identity of the politicians receiving PAC contributions to examine the impact of
the value-relevance of such contributions. Examining data on corporate contributions made to
candidates seeking federal office during the 2002, 2004, and 2006 election cycles, we find that
CEO dominance and interest alignment influence strategic choices of firms with regards to
establishing PACs. Our analysis of value-relevant contributions shows that firms prefer to donate
to politicians representing the state of a firm’s headquarters, validating the truth to the old adage
that all politics is local. However, these targeted political contributions do not impact upon firm
performance.
JEL Classification: G 3, G34, K2
Keywords: Corporate Political Contributions; CEO Dominance; CEO Characteristics; Firm
Performance, Agency Theory

1. INTRODUCTION
In 2010, the Supreme Court in a landmark ruling in Citizens United v. Federal Election
Commission legalized independent corporate political spending. The Super Political Action
Committees (Super PACs) play an increasingly pivotal role during the election cycle, and
corporations have to take a stand on whether, and how, to embrace this new doctrine which now
allows them to make direct contributions to political groups. Public companies (such as Bank of
America, Target, and 3M) have taken some dissent from shareholders who are pushing the issue
of super PACs at annual meetings. Corporate political spending has been a key focus of
shareholder resolutions with over 500 filed in the past five years alone1. With some trepidation
about shareholder reactions, corporations are increasingly supporting organized political giving.
Overall, super PACs have raised $314 million through the end of June 2015, compared with $26
million at the same time in 20112.
While limited, previous research in corporate finance has examined whether such political
contributions by firms are value-adding in terms of both accounting and stock price performance
of the firm. Although corporate political activities may yield strategic advantages to politically
active firms, they may also be a manifestation of self-serving behavior of top management,
including the CEO. Agency theory suggests that CEO dominance and interest alignment may
determine corporate decisions on political spending. These decisions do not focus only on whether
to engage in political spending, but also, and more importantly, on how to target such spending.
Thus, the research focus of this paper is twofold: first, to understand if CEO characteristics,
1 http://siinstitute.org/press/2012/02282012_ProxyPreview2012_PressRelease_FINAL.pdf; http://www.uspirg.org/news/usp/spring-
shareholder-meetings-investors-call-increased-transparency-corporate-lobbying-and; https://si2news.files.wordpress.com/2014/08/si2-2014-
proxy-season-mid-year-review-corporate-political-activity-excerpt.pdf?width=100 2 http://www.huffingtonpost.com/entry/oligarchy-super-pac-megadonors-have-conquered-american-
politics_55bc1eece4b0b23e3ce2f5ec

specifically those reflecting CEO dominance and interest alignment, determine the choice of PAC
contributions, and second, to examine if firm performance impacts corporate political spending
decisions. Specifically, our study seeks to explain the rationale for engaging in corporate political
activity, and whether participating firms are able to make value-relevant choices in the PACs and
politicians that they target for such contributions.
Financial accounting literature notes that CEO incentive structures affect the behavior and
outcomes of firms, (Bebchuk, Cremers, and Peyer, 2008; Morse, Nanda, and Seru, 2011) and as a
result dominant CEOs with weak firm performance may lean toward greater political contribution
to influence policy in their favor. Using aggregate data on corporate contributions made to
candidates seeking federal office during the 2002, 2004, and 2006 election cycles, we investigate
whether CEO dominance and interest alignment influence political spending choices in terms of
establishing PACs. Furthermore, while we begin with a simple, binary variable which examines
the factors that precipitate into a decision to form a PAC or not, we construct a more nuanced
measure to examine the impact of “good” or “value-relevant” participation. We compile a unique
firm-level database which allows us to focus on the identity of the specific politicians who are the
recipients of PAC contributions, the committees in which they serve, and their home-location.
This enables us to investigate the performance impact of such contributions.
The decision to participate in corporate political activities, if directed towards influencing
policy favorably for the firm, should result in increased revenue leading to improved accounting
performance and greater wealth for the shareholders. Major strategic choices, as proposed by firm
top management, are scrutinized and approved by board of directors. However, a dominant CEO
could influence and sway the board to pursue particular political engagements as non-market

strategies. While a value-maximizing dominant CEO may direct such political activities for the
benefit of the shareholders, he may very well try to benefit himself in terms of promoting political
clout, increasing social status, achieving career aspirations, and increasing his personal wealth.
Such influence by the CEO would depend largely on three factors: his dominance over the decision
making system, the degree of alignment of interests of the CEO with those of the shareholders in
terms of his ownership and compensation contract, and the level of firm performance. We define
firm performance to include both accounting and market value measures. To clearly delineate the
complexity of interaction among the three factors, we first examine the link between political
contributions and CEO characteristics. Second, we investigate whether or not political activities -
to the extent determined by CEO characteristics - enhance firm performance. While the first set
of tests will shed light on whether potential agency conflict, proxied by CEO dominance and
interest alignment, influences corporate political stances, the second set of tests will verify if
political contributions are actually detrimental to shareholder interests or whether they help align
CEO-shareholder interests. However, it may be possible that political engagements improve
accounting performance and shareholder wealth while simultaneously promoting a CEO’s
personal interests. In this sense, political engagements may not be strictly characterized as agency
costs.
While the analysis explains the rationales behind firm political participation, a more
important and interesting question asks how firms target their political contributions. From the
firm’s viewpoint, such targeted spending may be perceived as ‘good’ when the firm donates to
the politicians who can influence firm performance. We form a unique database and develop
several proxies to measure “good” political spending by firms. Our measure focuses on the
identity of the politicians who receive political contributions from the firm. We define a “value-

relevant” or a “good” political contribution as one where the contributions are directed to
members of the U.S. House of representatives or the Senate who are in a position to influence
the performance of the firm. To this end, we examine the specific committee assignments as
well as the location of the politicians to whom firms donate to see if firms are able to influence
policy. It is plausible to argue that by making donations to politicians from their home state or
to those who serve in relevant industry committees, firms stand to gain.
Recent literature (Hillman, Keim, and Schuler, 2004; Bebchuk and Cohen, 2005; Hersch,
Netter, and Pope, 2008; Bennett and Loucks, 2008; Cooper, Gulen, and Ovtchinkkikov, 2010;
Barclift, 2011; Mathur and Singh, 2011) has increasingly focused on corporate political
participation and its bearing on accounting performance and firm value. Mathur and Singh (2011)
summarize the literature and present two broad schools of thought on corporate political
contributions and shareholder value. One strand of thought holds that corporate political spending
may be value-adding when corporations make political contributions to favorably influence policy
stance(s). Conversely, agency-theoretic perspectives may view political contributions as a
manifestation of managerial consumption and consider them to be profligate expenditures. Farrell,
Hersch, and Netter (2001), Ozer (2010), and Prabhat (2012) suggest that political contributions
may or may not enhance shareholder value, and that there is often a playoff between managerial
versus shareholder power. To the extent that political engagements may help a firm promote
legislation restricting entry or competition in its industry, political contributions made by that firm
help create shareholder value. A firm's involvement in political activity, however, may be largely
driven by management who exercise control over the allocation of resources within a firm.
Executive ownership stake and compensation structures often dictate managerial preferences
regarding political leanings and consequent PAC contributions that may not always promote

optimal accounting performance or the shareholders’ interests, thus destroying firm value and
shareholder wealth.
While the ruling in Citizens United v. Federal Election Commission, and the last U.S.
election season, may have brought some of these issues to the forefront once again, issues
surrounding political contributions by firms are not unique to the U.S. Corporate political
spending activity can differ globally. Faccio (2006) documents that the most number of politically
connected firms are found in countries with high levels of corruption and weak legal systems.
Fisman (2001) examines political connections between Indonesian firms and the Suhorto family
to document a loss of firm value on the news of the President’s poor health. Research shows mixed
results in terms of the performance impact of political connectedness. Bobkari, Kosset, and Saffar
(2012) examine a sample of firms headquartered in 12 developed and 11 developing countries to
examine how the political connections of publically traded firms impact their accounting
performance and financing decisions. They find that politically connected firms have better
performance as measured by ROA, and that these firms are also more liquid than their non-
politically connected counterparts. Moreover, the authors document that political connection is
associated with increased financial leverage and debt maturity.
Mobarak and Purbasari (2006) find that firms with political ties to President Suhorto
are more profitable and export-oriented than their non-connected counterparts. However,
Facio (2010) documents that despite the advantages of political connectedness, such firms
document worse accounting performance when compared to their non-connected peers.
Similarly, examining politically connected firms in France, Bertrand et al. (2007) find a
negative correlation between firm performance and the political connections of its CEO.

Examining the impact of location, Facio and Parsley (2009) document that firms located in the
politician’s hometown lose value upon news of the unexpected death of the politician.
We extend this line of research by evaluating if political connectedness through PAC
participation is aimed at value creation and if it actually helps firms create value. Our results show
that firms with dominant CEOs, proxied by CEO duality, have a greater propensity to make PAC
contributions. While CEO age in absolute terms does not influence corporate political decisions,
CEO age relative to the board impacts such decisions. PAC contributions are more likely in
instances when the firm has a relatively older CEO. We also find support for the agency-theoretic
argument that political participation increases with CEO compensation. With respect to interest
alignment, larger ownership holdings by CEOs lessen the propensity for political engagement. The
second objective of our paper is to investigate the relationships between CEO characteristics,
political participation, and firm performance, as poorly performing firms may be more likely to be
politically engaged. Our full sample results show that strong CEOs with interests aligned with
those of shareholders, make value-maximizing decisions for the firm, as proxied by firm stock
return and firm ROA. Thus, it appears that, to the extent CEO characteristics predict PAC
contributions; PAC determines performance.
A unique aspect of this study is that we construct a hand-collected dataset of the politicians
receiving contributions from firms to examine the “value-relevance” of such contributions. We
match firm location and industry with the home-state and Committee assignments of the politicians
receiving PAC donations. We then investigate the sub-sample of participating firms to investigate
whether firms make value-relevant contributions. The results for CEO dominance reinforce
findings of the full sample results; while we document some linkages between CEO dominance
and value-relevant contributions, there is no strong evidence that dominant CEOs contribute more

to politicians who can impact the firm. From an interest alignment perspective, our results show
that CEOs with a higher equity stake in the firm align themselves by making greater contributions
to politicians from their home state. Interestingly, we find that firms with higher institutional
ownership donate less to politicians from the home state, perhaps reflecting a reluctance of large
investors to openly court politicians.
An important contribution of our paper is to investigate how firm performance impacts
PAC contributions, as it could be the case that poorly performing firms will make larger value-
relevant contributions in an attempt to favorably influence politicians. Overall, our results
demonstrate that well performing firms make fewer value-relevant donations. We find that better
performing firms, measured by stock return, donate less to politicians from their home state, while
firms with higher ROAs and ROEs tend to donate less to politicians who hold committee
assignments in the industry in which the firm operates. In summary, our results suggest that firm
performance may impact influence ‘good’ (value-enhancing) decision making.
The remainder of the paper is as follows. We discuss the theoretical and empirical
framework to develop our hypotheses in Section 2, and present the data and methodology in
Section 3. Section 4 provides the results and discussion, while conclusions are presented in the
Section 5.
2. LITERATURE REVIEW AND RESEARCH HYPOTHESES
In order to develop the hypotheses, we discuss three main strands of the literature
pertaining to CEO characteristics, political participation, and firm performance.
(i) CEO Dominance and Corporate Political Contributions

Leadership theorists often believe that CEOs make strategic and tough corporate decisions,
set the vision and direction for their companies, and thereby directly influence firm performance.
On the one hand, a powerful CEO with a strong network may benefit shareholders by garnering
valuable information via his connections and thus make value-adding decisions for the firm
(Engelberg, Gao, and Parsons, 2012). Alternately, a powerful CEO may heighten agency conflicts,
endorse managerial entrenchment, defuse the board, and endanger firm value (Bebchuk, Cremers,
and Peyer, 2011; Brown, Jr., 2012). Mande and Son (2012) find that CEO centrality, i.e., their
relative power within the board, can lead to earnings manipulation. For the most part, the board’s
role is defined by its relationship with corporate officers, particularly the CEO, since management
is privy to information while most directors have little ‘independent’ information other than that
provided at board meetings (Khurana, 2002; Brown, Jr., 2012). Moreover, if the CEO is also the
Chair of the board (CEO Duality), the agenda and information disseminated is controlled by the
CEO.
Literature has not reached any consensus on whether firms with CEO duality have
outperformed those firms with split CEO-Chairs (Jensen, 1993; Dahya and Travlos, 2000; Brown,
Jr., 2012). Lasfer (2006) studies the relationship between managerial ownership and board
structure for UK boards. He finds that higher managerial ownership entrenches managers by
allowing the CEO to create a board that is unlikely to monitor. Such a board is dominated by
executive directors, a dual CEO/Chairman, and has a lower probability of a non-executive director
as chairman. This result is more pronounced for large firms than for small firms. While board
composition has been shown to be an effective governance mechanism, Brown, Jr. (2012) argues
that by influencing board selection, the CEO neutralizes (renders the board less effective) the

monitoring function of the board and since the CEO hires and fires other managers, he often makes
the most important business decisions.
Decisions regarding corporate political activity, and the level of such commitments, often
rest with the CEO and senior executives. In examining the proclivity of top management in firms’
decision to engage in political activity, Ozer (2010) notes that CEOs with long-term tenure realize
how changes in the political environment impact their firm's decisions. Thus, older and longer
tenured CEOs may favorably influence decision making in the firms’ favor or in an agency-
theoretic construct, entrenchment may manifest itself in profligate consumption. Corporate
political contributions are often viewed as non-market strategies utilized by management of firms
to gain competitive advantage (Ozer and Lee, 2009; Ozer, 2010). This may take the form of
utilizing connections, lobbying, and donating (time and funds) so as to nudge politicians to
advance the agenda of the manager(s) or the firm by reducing disclosure requirements and industry
competition, and reducing legislative restrictions on executive compensation among others.
Given the literature detailed above, we hypothesize that CEO characteristics that define the
CEO centrality impact a firm’s decision to engage in corporate political activity through PACs.
CEO dominance hypothesis: Political engagements as perquisite consumption are agency
driven, and firms with dominant CEOs are more likely to be politically engaged. Firms
with greater number of executive board members (insiders), duality (same CEO-Chair),
older CEOs (entrenched) or long tenured CEOs - as measures of CEO dominance - have
greater likelihood of political engagement through PACs. Moreover, CEO dominance
characteristics will be positively related to the percentage of “value-relevant”
contributions made by participating firms.
(ii) Interest Alignment and Corporate Political Contributions
Morse, Nanda, and Seru (2011) find evidence that powerful CEOs get paid more. They
argue that powerful CEOs are able to persuade boards enough to slant the weights on their
performance in their favor, and thus opportunistically extract rents in the form of masked incentive
pay, consequently hurting firm performance. Agency-theoretic studies show that interest
alignment often manifests in compensation packages. Given asymmetry of information, and weak
governance structures, self-serving managers may promote their interests at the cost of
shareholders. Managers may use their political connections to promote their own career prospects
and attain socio-political status. Thus, political contributions may be more a management
perquisite consumption rather than being value relevant for the firm (Aggarwal, Meschke, and
Wang, 2012; Ozer, 2010). Studying the design of executive compensation contracts, Lord and
Saito (2012) examine factors that affect CEOs’ personal risks by examining the real value of
executive pay, the riskiness of firm equity, the value of their equity portfolios, and the delta of
such equity holdings and note that the impact on CEOs’ personal risks impacts the design of their
compensation contracts. Farrell, Hersch, and Netter (2001) focus on individual executive
contributions to PACs and their compensation packages and argue that well designed executive
contracts align interests of management and shareholders, and provide evidence that firms make
higher PAC contributions when their management has greater equity and stock-options. They
report that the incentive structures of CEOs are significantly related to PAC contributions.
Hartzell and Starks (2003) document the role played by institutions in corporate
governance and in determining compensation levels by voting preferences. They also note that
accounting for firm and industry, institutional ownership concentration is positively related to the
pay-for-performance sensitivity. Increasingly, global institutional investors call for more
transparency and disclosure in corporate political and lobbying expenditures3. Ozer, Oneonta, and
3 Gilbert, K, “Institutional Investors Demand Disclosure on Companies’ Political Spending,” Institutional Investor, June 06,
2012, http://www.institutionalinvestor.com/article.aspx?articleID=3041331; “Investor group reacts to Aetna political
contributions report, says lack of disclosure underscores need for greater transparency in corporate political and lobbying
expenditures”, The Sacramento Bee, August 30th, 2012;
http://www.sacbee.com/2012/08/30/4771462/investor-group-reacts-to-aetna.html

Ahsan (2010) examine the influence of the different institutional owners on corporate political
strategies. Their results demonstrate that institutional investors with a long time horizon are more
in favor of firms’ engagement in political strategies.
In strategic decisions such as political engagement by the firm, CEOs’ ownership stakes,
as well as their compensation, may influence their alignment with the investors in the firm. The
discussion from the literature above leads us to hypothesize as follows:
Interest-Alignment Hypothesis: Within agency conflict perspective, our null hypothesis is
formulated in terms of political activities as positive value propositions that are incentive
driven, and firms with CEOs who have higher ownership stakes, or better compensation
packages, have relatively greater degree of interest alignment with shareholders and thus
are more likely to participate in or contribute to firm’s PAC activities. Additionally, CEO
interest alignment characteristics will be positively related to the percentage of “value-
relevant” contributions made by participating firms.
(iii) CEO Characteristics, Corporate Political Contributions and Firm Performance
Given the research described earlier on CEO dominance, a value-maximizing CEO may
engage in political activity and use his connections to sway legislative policies that favor the firm.
Alternately, he may encourage such political activity largely to gain socio-political status for
himself and thus increase his own wealth, often at the expense of the shareholders. There is no
clear consensus in the literature that political contributions characterize investments that create
corporate value.
One stream of related research has demonstrated strong links between CEO dominance and
lowered firm value, lower profitability, exploitative behavior, poorer decision making, lower
turnover, and lower firm performance (Adams, Almeida, and Ferreira, 2005; Bebchuck, Cremers,
and Peyer, 2008). Adam, Almeida, and Farreira (2005) find that stock returns are most variable
in firms in which dominant CEOs can influence decision making. Measuring CEO centrality via
CEO's pay slice, Bebchuck, Cremers, and Peyer (2008) find that controlling for firm-specific

characteristics, high CEO pay slice is correlated with lower firm-specific variability of returns.
Coates (2011) compares valuations of firms, with varying levels of lobbying and contributions to
corporate PACs, before and after Citizens United, and finds that outside of heavily regulated
industries, political activity is associated with lower firm value. Examining corporate donations to
political candidates for federal offices in the US, Aggarwal, Meschke, and Wang (2012) note that
contributing firms’ operating characteristics show consistently low free cash flow and weak
performance (returns). They suggest that managers make political donations because of their own
political interests, which may often not coincide with the political interests of their shareholders.
An alternate stream of literature suggests that politically engaged firms may be better
positioned to sway policy in their favor, and such ‘political capital’ investment (in the form of
contributions) may be value-adding. Faccio (2006) suggests that there is a ‘political risk premium’
attached to politically engaged firms supporting a positive link between political engagements and
corporate performance. Cooper, Gulen, and Ovtchinnikov (2010) use US FEC data on political
contributions made by public firms and find a very high rate of return for firms participating in the
political contribution process, especially for firms that support candidates from the state where the
firm is headquartered. Farber, Johnson, and Petroni (2007) and Liebman and Reynolds (2009)
argue that if the benefits gained from political contributions are higher than PAC costs, there is a
real economic benefit for firms to participate in the political process.
The value consequences of corporate political contributions combined with an influential
and powerful CEO may lead to board decisions that may be less than optimal for the shareholder
unless the interests of the CEO are aligned with those of the shareholders via compensation
contracts or ownership stakes. Aslan and Grinstein (2012) study political contributions and their
relationship to CEO pay and note that controlling for industry and CEO and board characteristics,

a one standard deviation increase in CEOs’ political connections result in a 9 percent rise in CEO
compensation and a 17 percent decline in pay-performance sensitivity.
The literature above does not point to a definitive conclusion as to whether political
participation by firms is agency driven or not. Such an answer may only be reached after we test
and estimate the performance impact of such political activities. To summarize the arguments
from the literature above, in one possible scenario, political engagements reflect self-serving
behavior by the CEO at the cost of shareholders. Here, we expect a positive relation between CEO
characteristics reflecting agency conflict (dominance) and PAC contributions, and a negative
relation between PAC contributions and firm performance. In an alternative scenario, political
engagements are value-adding. In this case, we expect to see a positive relation between CEO
interest alignment (ownership and compensation) and PAC contributions and also between PAC
contributions and firm performance. Yet another scenario exists. In this instance, while political
engagements promote the personal interests of a CEO, they also are shareholder value enhancing.
While we may find a positive relation between CEO dominance (a proxy for agency conflict) and
the choice to associate with and contribute to a PAC, we cannot interpret these findings in terms
of agency conflict. Political engagements, in this instance, are actually interest aligning choices
wherein both the parties realize gain. So, formally hypothesizing the triangular relation between
CEO characteristics, political strategic choices, and firm performance is an interesting, albeit a
complex one. We postulate our third hypothesis relating CEO characteristics, corporate political
contributions, and firm performance as follows.
Firm performance hypothesis: Corporate political strategies are shareholder value
enhancing and promote CEO interests as well. A greater degree of CEO dominance and
greater interest alignment is associated with greater degree of political participation via
PACs and better firm performance. Moreover, CEO dominance and interest alignment
characteristics will be positively related to the “value-relevant” contributions made by
participating firms.

We first examine the impact of CEO characteristics and interest alignment on both the
likelihood of engaging in political activity. Next, we focus on participating firms alone to examine
the impact of CEO characteristics and interest alignment on the percentage of “value-relevant”
contributions made by the firm. Prior to describing the data and methodology adopted, we discuss
the control variables that also potentially impact the choice of political participation by firms.
(iv) Control Variables
Literature shows that firms that make political contributions on average have lower returns,
higher book-to-market, lower cash flow, and higher leverage compared to non-contributing firms
and that political connectivity gives firms greater access and more favorable rates to debt financing
(Faccio, Masulis, and McConnell, 2006; Faccio, 2010; Johnson and Mitton, 2003; Khwaja and
Mian, 2005; Cull and Xu, 2005; Claessens, Feijen, and Laeven, 2008; Cooper, Gulen, and
Ovtchinnikov, 2010). Furthermore, recent researchers point to a positive relationship between firm
size and political activity (Cooper, Gulen, and Ovtchinnikov, 2010; Macher, Mayo, and Schiffer,
2011). While board size appears to have a link to firm value, there is no clear consensus in literature
whether smaller boards are more effective than larger boards (Jensen, 1983; Yermack, 1996; Klein,
1998; Eisenberg, Sundgren, and Wells, 1998; Hermalin and Weisbach, 2003; and Coles, Daniel,
and Naveen, 2008). Research has shown that added growth opportunities as a result of political
connectedness increase the willingness of firms to contribute to PACs (Mathur, Singh, Thompson,
and Nejadmalayeri 2012). We utilize market to book ratio to capture higher growth opportunities.
Industry effects have been controlled for in the literature to capture the different regulatory and
policy issues (Schuler, Rehbein, and Cramer, 2002; Macher, Mayo, and Schiffer, 2011). In order
to isolate industry effects on PAC contributions and their performance impact, we use one-digit
SIC codes as industry dummies.

3. DATA AND METHODOLOGY
(i) Data
We begin with a sample of all S&P 500 firms. Next, we obtain information on PAC
contributions from the Center for Responsive Politics (CRP). CRP provides a record of PAC
contributions information derived from national corporate filings from the Federal Election
Commission (FEC). We compile data on aggregate corporate contributions made to candidates
seeking federal office during the 2002, 2004, and 2006 election cycles. The financial market crisis
that ensued in 2007 changed the political rhetoric and climate in the country leading to fierce
partisanship, and the emergence of extreme positions and factions in both political parties. As
both the fierce partisanship and the economic crisis have influenced the election cycles beginning
in 2008, we do not extend the sample period beyond the 2006 election cycle, since we do not want
to confound our results. Our initial sample of firms making political contributions comprises of
289 firms for 2002, 315 firms for 2004, and 301 firms for 2006. Next, we obtain annual income
statement and balance sheet information on the firms from COMPUSTAT, eliminating financial
firms (SIC codes 6000-6999) from our sample. We then acquire board information from The
Corporate Library’s (TCL) Board Analyst database, which compiles data on firm proxy
statements. We extract proxy information for our sample of firms for the years 2000-2006. Our
final sample matches PAC contributions data from the CRP, board data from TCL, and financial
data from COMPUSTAT, leaving us with a dataset of 1204 firm year observations for the period
of 2002 to 2006.
Table 1 provides the univariate tests of difference of means for the firms in our sample for
both the PAC contributing and non-contributing firms in our sample.
<insert Table 1 about here>

Within our sample of 1204 firm- observations, a total of 682 observations pertain to firms
that have an active PAC while 522 pertain to firms that do not. The politically active firms in our
sample have a significantly higher number of directors on their board (12) when compared to the
non-PAC contributing firms (10). However, PAC firms have a significantly lower percentage of
inside directors (14%) than non-PAC firms (17%). The average CEO in a PAC contributing firm
is 56 years of age, compared to the average CEO age of 55 years in a non- contributing firm; this
difference is statistically different at the 5% level. CEOs of contributing firms have served
significantly lower tenures (6 years) when compared to their non-contributing counterparts (8
years). Moreover, CEOs in politically active firms earn significantly higher total compensations
and variable compensations when compared to CEOs in firms which do not make political
contributions. Although there is no significant difference in the CEO ownership stake between
the two types of firms, PAC contributing firms have a marginally lower institutional ownership
than non-contributing firms. Contributing firms are significantly older as well and are, on average,
about 10 years older than non-contributing firms. The average contributing firm is also
significantly larger, with a market value of almost three times that of the non-contributing firm.
PAC contributing firms are also significantly more leveraged. However, the lagged returns and
market to book ratios are not significantly different for the two types of firms. Overall, the
univariate statistics presented above demonstrate significant differences in CEO and firm-level
characteristics between contributing and non-contributing firms.
(ii) Methodology
Full Sample:
We begin our analysis of the propensity of a firm to make a political contribution by
estimating the following probit model:

Likelihood to Contribute = ß0 + ß1 (CEO Dominance/Interest Alignment) + ß2 (Control Variables)
+ ɛ (1)
The dependent variable is a binary variable which equals one for PAC contributing firms,
and zero otherwise. The independent variables that measure CEO dominance include the ratio of
inside directors, CEO age, and CEO tenure to test the CEO dominance hypothesis. The
independent variables for the test of the interest alignment hypothesis include the ratio of CEO
holdings to total common equity, percentage of institutional ownership, the natural log of CEO’s
total compensation, and percent variable compensation. Our control variables are board size, firm
size (natural log of the market value of equity), lagged return, growth opportunities (market/book
ratio), leverage (debt/assets ratio), and industry effects (one-digit SIC code industry dummies).
In order to determine how PAC contributions, as determined by CEO characteristics,
impact firm performance, we estimate a two-stage model. At the first stage, we estimate the extent
to which CEO characteristics predict PAC contributions via the following model:
Total Contribution = ß0 + ß1 (CEO Dominance/Interest Alignment) + ß2 (Control Variables) + ɛ
(2)
where, the CEO dominance, interest alignment, and control variables are the same as
described earlier.
At the second stage, we relate the predicted PAC contribution to firm performance via the
following model:
Firm Performance = ß0 + ß1 (Predicted PAC Contribution) + ß2 (Control Variables) + ɛ (3)

where, contemporaneous stock return, ROA, and ROE, are the firm performance measures. The
predicted contributions are obtained from the first step of the estimations, and the control variables
are firm size, two-year sales growth rate, debt ratio, and industry effects.
Participating Firms Sample:
While one of the motivations of the paper is to analyze differences between
participating firms and non-participating firms, a more discerning aim is to examine whether firms
are able to benefit from such participation. We therefore repeat the estimations above for our
sample of participating firms alone. We develop proxies which focus on the identity of politicians
receiving political contributions from firms. We define a ‘value-relevant’ (good) contribution as
one where a firm donates to a politician who is deemed to be in a position to positively impact the
firm.
In order to develop variables that represent proxies for ‘value-relevant’ (good)
contributions by firms’ PACs, we hand-collected data from the FEC database using the following
steps. We first search in the full sample database for a PAC associated with each firm name in the
FEC database. If we find a PAC associated with the firm, we include the firm in a new
‘participating firm’ subsample to gather detailed data for each of these firms. For each of these
participating firms, we create three separate subsample datasets for each year to gather information
from the FEC database. Next, under the ‘PAC’ information from the FEC Database, we use the
‘Summary’ tab to find the ‘location’ and ‘Industry’ for each year for the participating firm in
question and add these fields to the participating firms’ subsample database. Following this, from
the ‘Recipients’ tab within the PAC Data (within the FEC Database), we collect the entire list of
names of House members and Senate recipients for each year along with the amount that each
politician received in ‘contributions’ for the year from the firm’s PAC for each participating firm.

We sort, by year, each list of Senators and House members, by the ‘amount of contribution’. We
then highlight the top five contributions for each firm for each year4 separately for the House and
Senate. Next, we select the tab ‘Politicians & Elections’ within the FEC database and do a search
within this section for each politician’s location and committee assignments for our list of
recipients for each firm for every year. Using the data from this section, we create corresponding
fields in the participating firms’ subsample database on each politician’s committee assignments
and location for each year.
In summary, we first examine if a firm is a participating firm and include it in a
‘participating’ firm database and collect information on its location and industry for the years 2002,
2004 and 2006. Following that, we gather information on a firm’s PAC contribution to the House
members and Senators (using the FEC database) and rank these contributions in descending order
of the dollar value of the contributions and also gather information on the location of the
politicians’ in question for each year for each firm. We then focus on the top 5 contributions of the
PAC to the House (and the Senate) members and define value-relevant contributions in two ways:
1. A contribution is considered value-relevant (good) if the recipient’s committee
assignment in the year in question (2002, 2004 or 2006) matches the industry in which
the contributing firm operates. If not we consider it a ‘non-value relevant’ (bad)
contribution.5 For each year, we define the value relevance ratio based on ‘industry
match’ as follows:
Industry Match = $ of value relevant contributions to the House (Senate)
members/Total $ value of all contributions to House (Senate) members.
4 The top five contributions may include several or all the contributions made. For instance if 30 house members received $5000 each, all 30 would be included. 5 The Congressional committee assignment was matched to the industry of the firm. The industry and location for each firm was listed under the FEC database under ‘Summary Information for each firm’ and was collected in creating the database. Besides matching the industry, in all cases, if the Congressional committee assignment for the House member or Senator was in ‘Appropriations’, ‘Budget’ or ‘Ways and Means’, we included it as value-relevant as well.

2. A contribution is considered value-relevant (good) if the Location of the House member
(or Senator) in the year in question (2002, 2004 or 2006) matches the contributing firm’s
headquarter location. If not, we consider it a ‘non-value relevant (or bad) contribution.
For each year, we define the value relevance ratio based on ‘location match’ as follows:
Location Match= $ value relevant contributions to the House (Senate) (based on
location)/Total $ value all contributions to the House (Senate).
4. EMPIRICAL RESULTS
Our first set of estimations test the CEO dominance hypothesis. We model the propensity
to make PAC contributions as a function of CEO dominance, as proxied by the ratio of inside
directors, CEO duality, CEO age, rCEOage (CEO age relative to the board) and CEO tenure. We
check for the VIF statistics and our results do not find any strong indication of multicollinearity
among our explanatory variables. Table 2 provides the results of the probit estimations for the
CEO dominance hypothesis.
<insert Table 2 about here>
Contrary to our null hypothesis that firms with a higher ratio of inside directors would be
more likely to make a PAC contribution; we find that such firms are significantly less likely to be
politically engaged via a PAC involvement. This result is both statistically and economically
significant. A 1% increase in the ratio of inside directors leads to a 2.25% decrease in the
probability of a PAC contribution. While the above results do not support the agency view of
political engagements, our results on CEO duality (Model 2 of Table 2) strongly support the

hypothesis that dominant CEOs who hold the dual title of CEO/Chair would be more likely to be
politically engaged.
We hypothesized that firms with older, and therefore more entrenched CEOs, would be
more likely to engage in a PAC contribution; however our results do not support such a link
between CEO age and PAC contributions. However, it is possible that the dynamics of the board
decision-making are influenced by the relative age of CEO with respect to that of the rest of the
board. For example, if there are several older board members, the CEO may not be as dominant as
in a firm where the board, on average, is younger. To measure the CEO age relative to the board
we construct a new variable, rCEOAGE. We define this variable as CEO age divided by the
number of directors on the board who are more than 70 years of age. This ratio captures relative
experience of the CEO compared to the board. The expectation is that for firms where the board
is composed of relatively younger directors, the CEO is more influential or dominant. This
variable combines the plurality of older directors as well as the relative age of the CEO. Indeed,
we find that firms with relatively older CEOs have a stronger positive propensity to make PAC
contributions (Model 4 of Table 2). Therefore, while CEO age in absolute terms may not influence
corporate political decisions, CEO age relative to the board impacts such decisions. Using tenure
as a proxy for CEO dominance, we had predicted that firms with longer serving CEOs would be
more likely to contribute to a PAC. Our results show the opposite; CEOs with longer tenures are
significantly less likely to be involved in PAC contributions.6
Overall, our results show mixed evidence that firms with dominant CEOs are more likely
to make firm level political contributions via PACs. However, for firms with entrenched CEOs,
6 The impact of CEO age and tenure may vary over firm performance; older CEOs or those with longer tenures in poorly performing firms may
be more likely to engage in PAC contributions. In order to test the impact of performance and CEO age (tenure), we interact return with CEO age (tenure). We find no significant relation between the interaction variables and the likelihood of making a PAC contribution.

the likelihood of PAC contributions decreases, except in instances where the CEO holds a dual
title, and when the CEO is older relative to the board of directors.
Examining the control variables, we find that firms that are larger, older, and those with a
greater number of directors are significantly more likely to be involved in a PAC contribution,
while firms with lower levels of leverage (total debt ratios) are significantly less likely to make
PAC contributions. We do not find any link between political contributions and lagged return or
market to book ratios. As we had anticipated that the likelihood of PAC contributions could
potentially vary by industry, our estimations include dummies for one-digit industry SIC codes.
We find that firms in SIC code 4, which encompasses transportation, communications, electric,
gas, and sanitary services are significantly more likely to be politically involved, perhaps due to
the regulatory nature of these industries. Thus, it appears that some industries see a significant
advantage to being politically active.
<insert Table 3 about here>
While the results above pertain to the complete sample of participating and non-
participating firms, we next turn to the sample of participating firms alone. As mentioned earlier,
this smaller set comprises of a hand-collected dataset where we match the politicians to firm-level
PAC donations by House (Senate) Committee assignments and by geographical location of the
firm headquarters and the home-state of the recipient politician. Table 3 provides the results for
CEO dominance estimations for value-relevant contributions made by committee assignment and
by location.7 Unlike the results for the full sample, we document a positive relation between the
ratio of inside directors and the percentage of value-relevant contributions made by the firm,
7 We report the results for contributions made to the U.S. House of Representatives members. Results for Senate contributions are available upon request.

measured by the Location variable. While the results for the full sample show that firms with more
inside directors are less likely to participate in a PAC, our results here show that in instances when
such firms do make PAC donations, inside directors appear to see the advantages of making
donations to ‘local’ politicians who may be in the position to impact the firm. However, when
value-relevance is measured by the committee assignment of the recipient politician, we are unable
to find a significant link between CEO dominance, as measured by the ratio of inside directors and
PAC contributions.
We find mixed results for our second model; CEO duality. While we find that for the full
sample, dual CEOs are more likely to contribute, our analysis of the value-relevance of
contributions shows that CEOs holding a dual title of CEO/Chair are significantly less likely to
make contributions to politicians in based on the location proxy. On the other hand, dual CEOs are
marginally more likely to make contributions to politicians holding committee assignments in the
industries in which their firms operate. We do not find any significant impact of CEO age, relative
CEO age (rCEOAGE), or CEO tenure on the value-relevant PAC contribution made by the firms,
measured by either geographical location or by committee assignment. So, in summary, while
overall the relative age of the CEO to the board (rCEOAGE) and CEO tenure does impact firm
decisions regarding whether to contribute to a PAC or not, it does not seem to stem from additional
value perceived to arise from the politician’s geographical location or committee assignments in
the given year. Examining the control variables, it appears that larger firms are significantly less
likely to make value-relevant contributions, regardless of the dominance proxy used in the models.
We also find some evidence that firms with higher debt ratios are less likely to participate in value-
relevant PAC donations. Overall, our results for CEO dominance follow our results for the full
sample, while there are some linkages between value-relevant contributions and our proxies for

CEO dominance, there is no strong evidence pointing to entrenched or dominant CEOs making
higher contributions to politicians who may be in positions to help their firm.
Our next set of estimations presents the impact of interest alignment characteristics on the
likelihood of PAC contributions by the firm. Based on the literature (Farrell, Hersch, and Netter,
2001; Ozer, 2010; Aslan and Grinstein, 2012), we hypothesized that firms having CEOs who are
more aligned with their shareholders are more active through PACs. Table 4 provides the results
of the interest alignment probit estimations, where we model the likelihood of setting up a PAC as
determined by the ratio of CEO holdings, institutional ownership, CEO total compensation, and
CEO variable compensation.
<insert Table 4 here>
Our results suggest that interest alignment, as proxied by CEO holdings, is negatively
related to the likelihood of making political contributions. Thus, our first proxy for interest
alignment refutes our hypothesis that CEOs who are more aligned with shareholders are more
likely to be politically active. Our compensation-based measures of interest alignment, total
compensation and incentive-based variable compensation, are positively related to the probability
of participating in firm’s PAC. Our results are consistent with past studies (Farrell, Hersch, and
Netter, 2001; Ozer, 2010; and Aslan and Grinstein, 2012); we also find that CEOs with higher
amounts of total compensation and variable compensation are significantly more likely to make
political contributions (at the 1% and the 5% levels of significance, respectively). Our findings of
positive link between total pay and the likelihood of having a PAC may reflect both, CEO
dominance and/or better interest alignment. In either case, it suggests that CEOs view political
activities as positive value propositions. We interpret the variable compensation results as
indicating that political engagements are viewed by CEOs as value-adding.

Given the argument that institutional ownership serves as an effective governance
mechanism, we expect that firms with greater institutional ownership are more likely to be
politically active via PACs. However, our results show that institutional ownership is not a
significant determinant of PAC contributions. This may appear to be in contrast with Ozer,
Oneonta, and Ahsan (2010) who note that institutional investors favor firms’ investment decisions
in corporate political strategies. However, these authors also state that the roles institutional owners
play in corporate political strategies differ based on the horizon of these institutional firms making
these decisions.
Our analysis of the control variables shows that larger firms and firms in the SIC code 4
(transportation, communications, electric, gas, and sanitary services) are significantly more likely
to be politically active. We also find that older firms and firms with larger boards are more likely
to make PAC contributions. These results are robust to choice of interest alignment proxy. There
is also evidence that larger firms are more likely to contribute to a PAC.
<insert Table 5 here>
Again, we examine the impact of value-relevant contributions for participating firms and
we next provide the results for the interest alignment variables. We had predicted a positive
relation between the interest alignment proxies and the percentage of value-relevant contributions
made by the firm. A perusal of Table 5 shows that all our CEO interest alignment variables are
highly significant (at the 1% level), as measured by the Location match variable. While our full
sample results show that CEOS with larger holdings are less likely to participate in PACs.
However, for those firms that do participate, we find that the CEO holdings is positively and
significantly related to the percent of value-relevant donations made by the firm. CEOs with larger
equity stakes donate more to local politicians whom they perceive to be in positions to help the

firm. On the other hand, we find the percentage of institutional ownership is negatively related to
the percentage of value-relevant contributions, as measured by location match of the politician
receiving such contributions. It may be that institutional owners are hesitant to allow the firm to
openly court politicians and may serve as a neutralizing agent when it comes to making blatant
political spending decisions. Ozer et al. (2010) find that institutional investors are mostly
concerned about the long-term value of the firm, and to this end, it appears that such owners do
not perceive contributing to local politicians as being of a long-term strategic advantage.
The other variables of total and variable compensation are also significantly negatively
related to the percentage of value-relevant contributions made by the firms. Contrasting these
findings with those for the full sample of participating and non-participating firms, our results
indicate that while CEOs earning higher total and variable compensation are more likely to
participate in PACs, it appears that this does not incentivize them to focus on local (value relevant)
contributions alone. The results are consistent with literature that indicates that political
contributions may be more a management perquisite consumption rather than being value-adding
for the firm. Interestingly, we are unable to document any significant linkages between our other
value-relevant proxy, the committee assignment of the recipient politician, and any of our interest
alignment proxies.
Furthermore, to judge if decisions by the CEO to engage in PAC is agency driven, we must
test if CEO characteristics relate to the decision to engage in a PAC, and to the extent that they do
relate, how PAC participation contributes to performance. Coates (2011) finds that outside of the
regulated industries where there is extensive political lobbying, political activity is associated with
lower firm value. Aslan and Grinstein (2012) note that compensation explained by ‘political
capital’ of executives is associated with an average increase of 0.3% in firms’ operating

performance. Our next set of estimations test for this relationship as defined in our firm
performance hypothesis, and we provide these results in Table 6. In the first step of our
estimations, we quantify the extent to which CEO dominance and interest alignment predict
political contributions. In the second step we relate the predicted contributions to performance.
Thus, we ask if CEOs make value-maximizing decisions for the firm when engaging in political
contributions. Our proxies for performance are contemporaneous firm return, firm ROA, and firm
ROE.
<insert Table 6 about here>
We present the results of our analysis for our first performance variable, contemporaneous return
in Columns 1 and 2 of Table 6, wherein we model total contribution as a function of the CEO
dominance and interest alignment characteristics detailed in the previous estimations. In the first
step, we ascertain whether dominant CEOs and those CEOs whose interests are aligned with those
of the firm are politically active (Column 1, Table 6). We find that the amount of total contribution
is significantly and negatively related to CEO holdings and increases when there are more inside
directors in the firm. Further, we document that firms with higher market value, firms with larger
boards, and more leveraged firms also make larger political contributions.
Having established that strong and less aligned CEOs are politically active, we next
investigate if such CEOs are able to make value-maximizing decisions for the firm. In the second
step of our estimations, we relate the predicted contributions to the measures of corporate
performance (measured by contemporaneous return). Column 2 of Table 6 presents these results.
Our results show that total PAC contributions, to the extent explained by CEO characteristics, are
strongly and positively related to firm performance, as measured by stock returns. Thus, the results

suggest that political engagement via PACs are performance enhancing and are not necessarily
agency driven and detrimental to shareholder interests.
Our second proxy for firm performance is contemporaneous ROA, and we provide the
results of the estimations in Column 3 and 4 of Table 6. We find that the amount of total
contribution is significantly and positively related to CEO total compensation and marginally
increases when there are more inside directors in the firm. Turning to the control variables, we
document that firms with higher market value, firms with larger boards, and more leveraged firms
also make larger political contributions. Once again, we find that firms with higher levels of
political contributions are better performing firms, as measured by their ROAs (Column 4). It
appears that the dominant and/or interest aligned CEOs use political engagement through PAC
contributions to enhance firm performance. Therefore, not only are PAC contributions value-
adding, they may not actually be agency conflict driven. Thus, our results support Cooper, Gulen,
and Ovtchinnikov (2010) who note that public firms that contribute to political campaigns are
significantly correlated with a high rate of return, but do not support those of Coates (2011) who
finds that more politically engaged firms tend to be poorly performing firms. In our third set of
performance estimations, we examine the impact of contributions on firm ROE. We note in
Column 5 that the amount of total contribution is positively and significantly related to both CEO
total compensation and the ratio of inside directors. However, unlike our other performance
variables, we are unable to document a significant relation between ROE and PAC contributions.
With respect to control variables, we document that firm size is negatively related to both firm
return and firm ROA, while sales growth is positively related to firm performance, measured by
both return and ROA.

In our last set of estimations, we examine the same performance variables for our sub-
sample of contributing firms and report these results in Table 7.
<insert Table 7 about here>
Panel A of Table 7 reports the results for the location match. Columns 1 and 2 examine
performance as measured by return. We show that total value-relevant contributions are positively
related to CEO holdings and negatively related to total compensation and firm size in the first stage
estimations. Examining the impact on contemporaneous return (Column 2), we note contributions
to local politicians are very significantly and negatively related to contemporaneous return. Thus,
value-relevant contributions, as defined by our measure in terms of contributions to local
politicians, may not be much value adding.
Turning to our next proxy of performance, ROA, we show that similar to
contemporaneous return, total value-relevant contributions are negatively related to CEO total
compensation and positively related to CEO holdings (Column 3). However, contributions based
on location appear to have no significant impact on firm ROA. One explanation for this could be
that ROA is typically used as a managerial performance measure that may have more to do with
asset efficiency and therefore may be influenced minimally by value relevant contributions based
on location
We turn to our last performance proxy, ROE, in Columns 5 and 6 of Table 7. Once again
we note a positive relation between CEO holdings and the firm’s value-relevant contribution
noting that as CEOs interests are more aligned to the shareholders, value-relevant contributions
increase. These value relevant contributions to local politicians appear to pay off in terms of

accounting returns, as measured by ROE, and we document a very significant and positive relation
between value-relevant contributions and firm ROE in Column 6 in Table 7, Panel A.
Panel B of Table 7 repeats the analysis for our other value-relevant measure, industry
match, based on committee assignments of the politicians. We do not find any significant relation
between value-relevant contributions and performance as measured by contemporaneous return
(Column 2). Thus, while the full-sample results show a positive relation between PAC
contributions and market return, there appears to be no additional value added by donating to
politicians holding industry relevant Committee Assignments. However, when examining
accounting measures, we see a significantly negative relation between firm performance
(measured by ROA and ROE) and value-relevant contributions (Columns 4 and 6). Thus, PAC
contributions based on industry match may in fact be detrimental to value. We also note that
smaller firms made larger value-relevant contributions. As political engagement is more costly for
smaller firms overall, we see that while they made lower contributions overall (Table 6), those
that contributed made significantly more value-relevant contributions based on industry match as
they perhaps more judiciously chose to contribute to those politicians that they perceived as value-
adding. Overall, the performance estimations provide evidence demonstrating a negative relation
between firm performance and value-relevant PAC contributions implying value relevant
contributions did not lead to better performance. Our estimations in Table 7 allow us to examine
the linkages among CEO characteristics, political engagement, and firm performance. Our results
show that value-relevant contributions are not agency driven.
5. CONCLUSIONS

Motivated by studies on corporate governance and agency theory, our study extends the
literature on CEO dominance and corporate strategy by examining CEO characteristics and firm
performance to investigate their impact on strategic choices regarding political engagement by
corporations. Academic research also explores whether corporate political activity, as a non-
market strategy, is value relevant. Therefore, our study uses a unique, hand-collected dataset to
investigate whether firms make value relevant political contributions.
The purpose of our study is two-fold. First we want to investigate the linkages between
CEO characteristics and the likelihood of PAC participation. For the full sample of firms, our
results on CEO characteristics and the likelihood of PAC contributions shows mixed results. We
find that firms with dominant CEOs, as measured by CEO duality, have a greater propensity to
make PAC contributions, while longer tenured CEOs are less likely to contribute. Furthermore,
while CEO age in absolute terms does not influence corporate political decisions, CEO age relative
to the board impacts such decisions. Firms with relatively older CEOs have a stronger propensity
to contribute to PACs. A unique contribution of our paper is that we examine the value-relevance
of firm contributions by matching firm location and industry with the home-state and committee
assignments of the politicians receiving contributions. Overall, our results for CEO dominance
follows that of the full sample results; while there are some linkages between CEO dominance and
value-relevant contributions, there is no strong evidence documenting that dominant CEOs
contribute more to politicians who are in the position to influence the environment in which the
firm operates.
Examining the interest alignment variables for the full sample, we find that our
compensation-based measures of interest alignment are positively linked to the firm participation
in a PAC. Looking at the value-relevance for contributing firms, we find that CEOs with a greater

equity stake in the firm align themselves by making higher contributions to politicians from their
home-state. However, firms with higher institutional ownership tend to donate less to politicians
from the home, perhaps reflecting a reluctance of large investors to openly court politicians.
It is plausible that PAC contributions impact performance. Therefore, the second objective
of our paper is to investigate the relationships between CEO characteristics, political participation,
and firm performance The results for the full sample of firms show that strong CEOs who are
aligned with the firm make value-maximizing decisions for the firm, as proxied by firm return and
firm ROA. We also investigate how firm performance is related to the value-relevance of the
contributions. Overall, our results demonstrate that contributions to local politicians are not value
adding and donations made to politicians who hold Committee assignments in the industry in
which the firm operates do not perform better.
Our results have implications in the CEO dominance and agency-theoretic literature since
we focus on CEO influence on decision making and strategy. Although not unequivocal, our
results - that dominant CEOs and CEOs with better interest alignment are more likely to be
politically active, and that PAC contribution associate positively with firm performance - suggest
that strategic political decisions may not be agency driven and may in fact be value enhancing.

REFERENCES
Adams, R.B., H. Almeida and D. Ferreira (2005), ‘Powerful CEOs and Their Impact on
Corporate Performance’, Review of Financial Studies, Vol. 18, pp. 1403-1432.
Aggarwal, R. K., Meschke, F., and Wang, T. Y. (2012). Corporate political donations: investment or agency?. Business and Politics, 14(1).
Agrawal, A. and C. Knoeber (2001), ‘Do Some Outside Directors Play a Political Role?’, Journal
of Law and Economics, Vol. XLIV, (April), pp. 179-198.
Aslan, H. and Y. Grinstein (2012), ‘Political Contributions and CEO Pay,’ Working paper,
University of Houston.
Barclift, J.Z. (2011), ‘Corporate Governance and CEO Dominance,’ Washburn Law Journal,
Vol. 50, pp. 611-634.
Bebchuk, L.A. and A. Cohen (2005), ‘The Costs of Entrenched Boards’, Journal of Financial
Economics, Vol. 78, pp. 409-33.
Bebchuk, L.A., M. Cremers and U. Peyer (2008), ‘CEO Centrality’, The Harvard John M. Olin
Discussion Paper Series, Discussion Paper No. 601, ISSN 1936-5349 (print), ISSN 1936-5357
(online).
Bebchuk, L.A., M. Cremers and U. Peyer (2011), ‘CEO Pay Slice and Firm Performance’,
Journal of Financial Economics, Vol. 102, Issue 1, (October), pp. 199–221.
Bertrand, M., F. Kramaraz, A. Schoar, and D. Thesmar (2007), ‘Politicians, Firms and the Political Business Cycle: Evidence from France’, Working Paper, University of Chicago.
Bennett, R.W. and C. Loucks (2008) ‘PAC Contributions from Sectors of the Financial Services
Industry - 1998-2002’, Atlantic Economic Journal, Vol. 36, pp. 395-405.
Boubkari, N., J.C. Cosset, and W. Saffar (2012), ‘The Impact of Political Connections on Firms’
Operating Performance and Financing Decisions’, The Journal of Financial Research, Vol .
34(3), pp. 397-423.
Brown, J. R. (2012), ‘Neutralizing the Board of Directors and the Impact on Diversity’,
Available at SSRN: http://ssrn.com/abstract=1938427 or http://dx.doi.org/10.2139/ssrn.1938427
Claessens, S., E. Feijen and L. Laeven (2008), ‘Political Connections and Preferential Access to
Finance: The Role of Campaign Contributions’, Journal of Financial Economics, Vol. 88, Issue
3, (June), pp. 554–580.
Coates, I. V., and John, C. (2012). Corporate politics, governance, and value before and after
Citizens United. Journal of Empirical Legal Studies, 9(4), 657-696.
Coles, J.L., N.D. Daniel and L. Naveen (2008), ‘Boards: Does One Size Fit All?’, Journal
of Financial Economics, Vol. 87, No. 2, pp. 329-356.

Cooper, M., H. Gulen and A.V. Ovtchinnikov (2010), ‘Corporate Political Contributions and
Stock Returns’, The Journal of Finance, Vol. LXV, No. 2, (April), pp. 687-724.
Cull, R. and L.C. Xu (2005), ‘Institutions, Ownership and Finance: The Determinants of Profit
Reinvestment among Chinese firms’, Journal of Financial Economics, Vol. 77, pp. 117–146.
Dahya, J. and N.G. Travlos (2000), ‘Does the One Man Show Pay? Theory and Evidence on the
Dual CEO Revisited’, European Financial Management, Vol. 6, No. 1, 88-98.
Fisman, R. (2001), ‘Estimating the Value of Political Connections’, American Economic
Review, Vol. 91, pp. 1095–1102.
Eisenberg, T., S. Sundgren and M. Wells (1998), ‘Larger Board Size and Decreasing Firm Value
in Small Firms’, Journal of Financial Economics, Vol. 48, No. 1, pp. 35-54.
Engelberg, J., Gao, P., and Parsons, C. A. (2012). The Price of a CEO's Rolodex. Review of
Financial Studies,.
Faccio, M. (2006), ‘Politically Connected Firms’, American Economic Review, Vol. 96, pp.
369–386.
Faccio, M., R.W. Masulis and J.J. McConnell (2006), ‘Political Connections and Corporate
Bailouts’, Journal of Finance, Vol. 61, pp. 2597-635.
Faccio, M., and D.C. Parsley, (2009), ‘Sudden Deaths: Taking Stock of Geographic Ties’,
Journal of Financial and Quantitative Analysis, Vol. 44(03), pp. 683-718.
Faccio, M. (2010), ‘Differences between Politically Connected and Nonconnected Firms: A
Cross-Country Analysis,’ Financial Management (Blackwell Publishing Limited), Vol. 39 Issue
3 (Autumn), pp. 905-928.
Farrell, K.A., P.L. Hersch and J.M. Netter (2001), ‘Executive Compensation and Executive
Contributions to Corporate PACs’, Advances in Financial Economics, Vol. 6., pp. 39-56
Farber, D.B., M.F. Johnson and K.R. Petroni (2007), ‘Congressional Intervention in the Standard
Setting Process: An Analysis of the Stock Option Accounting Reform Act of 2004’, Accounting
Horizons, Vol. 21, pp. 1-22.
Hartzell, J.C. and L.T. Starks (2003), ‘Institutional Investors and Executive Compensation’, The
Journal of Finance, Vol. 58, Issue 6 (December), pp. 2351–2374.
Hermalin, B. E. and M.S. Weisbach (2003), ‘Board of Directors as Endogenously Determined
Institution: A Survey of the Economic Literature’, Federal Reserve Bank of New York Economic
Policy Review, Vol. 9, No. 1, pp. 1-20.
Hersch, P., J.M. Netter and C. Pope (2008), ‘Do Campaign Contributions and Lobbying
Expenditures by Firms Create Political Capital?’, Atlantic Economic Journal, Vol. 36, pp. 395-
405.

Hillman, A.J., G.D. Keim and D. Schuler (2004), ‘Corporate Political Activity: A Review and
Research Agenda’, Journal of Management, Vol. 30, pp. 837
Jensen, M.C. (1993), ‘The Modern Industrial Revolution, Exit, and the Failure of Internal
Control systems’, Journal of Finance, Vol. 48, pp. 831-880.
Johnson, S. and T. Mitton (2003), ‘Cronyism and Capital Controls: Evidence from Malaysia’,
Journal of Financial Economics, Vol. 67, pp. 351–382.
Khurana, R. (2002), ‘Searching for a Corporate Savior: The Irrational Quest for Charismatic
CEOs’, Published by Princeton University Press, (pages 20-21).
Khwaja, A.I. and A. Mian (2005), ‘Do Lenders Favor Politically Connected Firms? Rent
Provision in an Emerging Financial Market’, Quarterly Journal of Economics, Vol. 120,
pp.1391–1411.
Klein, A. (1998), ‘Firm Performance and Board Committee Structure,’ Journal of Law and
Economics, Vol. 41, No. 1, pp. 275-304.
Liebman, B.H. and K.M. Reynolds (2009), ‘The Returns from Rent Seeking: Campaign
Contributions, Firm Subsidies and The Byrd Amendment’, Canadian Journal of Economics,
Revue Canadienne d’Economique, Vol. 39, pp. 1345-69.
Lasfer, M. A. (2006), 'The Interrelationship Between Managerial Ownership and Board
Structure', Journal of Business Finance & Accounting, Vol. 33, (7) & (8) (September/October),
pp. 1006-103
Lord, R. A., and Saito, Y. (2012). Does Compensation Structure Alleviate Personal CEO Risks?.
Journal of Business Finance & Accounting, 39(9‐10), 1272-1297.
Macher, J.T., J.W. Mayo and M. Schiffer (2011), ‘The Influence of Firms on Government’, The
B.E. Journal of Economic Analysis & Policy, Vol 11, Issue 1, pp. 1-25.
Mande, V. and M. Son (2012), ‘CEO Centrality and Meeting or Beating Analysts’ Forecasts’,
Journal of Business Finance and Accounting, Vol. 39, pp 82-112.
Mathur, I. and M. Singh (2011), ‘Corporate Political Strategies’, Accounting and Finance, Vol.
51, pp. 252-277.
Mathur, I., Singh, M., Thompson, F., and Nejadmalayeri, A. (2013). Corporate governance and
lobbying strategies. Journal of Business Research, 66(4), 547-553.
Mobarak, A.M., and D.P. Purbasari, (2006), ‘Corrupt Protection for Sale to Firms: Evidence from
Indonesia’, Unpublished working paper, University of Colorado at Boulder.
Morse, A., V. Nanda and A. Seru (2011), ‘Are Incentive Contracts Rigged by Powerful CEOs?’
The Journal of Finance, Vol. 66, No.5, (October), pp. 1461–1867.

Ozer, M. and S.H. Lee (2009), ‘When Do Firms Prefer Individual Action to Collective Action in
The Pursuit of Corporate Political Strategy? A New Perspective on Industry Concentration’,
Business and Politics, Vol. 11, Issue 1, article 4.
Ozer, M. (2010), ‘Top Management Teams and Corporate Political Activity: Do Top
Management Teams Have Influence on Corporate Political Activity?’, Journal of Business
Research, Vol. 63, Issue 11, pp. 1196-1201.
Ozer, M., E. Alakent and M. Ahsan (2010), ‘Institutional Ownership and Corporate Political
Strategies: Does Heterogeneity of Institutional Owners Matter?’, Strategic Management Review,
Vol. 4(1), pp. 18-29.
Prabhat, S. (2012), ‘Do Political Contributions Enhance, Shareholder Equity Value?’ Indian
School of Business, Working Paper.
Schuler, D., K. Rehbein and R. Cramer (2002), ‘Pursuing Strategic Advantage Through Political
Means: A Multivariate Approach’, Academy of Management Journal, Vol. 45, pp. 659-672.
Yermack, D. (1996), ‘Higher market Valuation of Companies with a Small Board of Directors’,
Journal of Financial Economics, Vol. 40, No. 2, pp. 185-211.
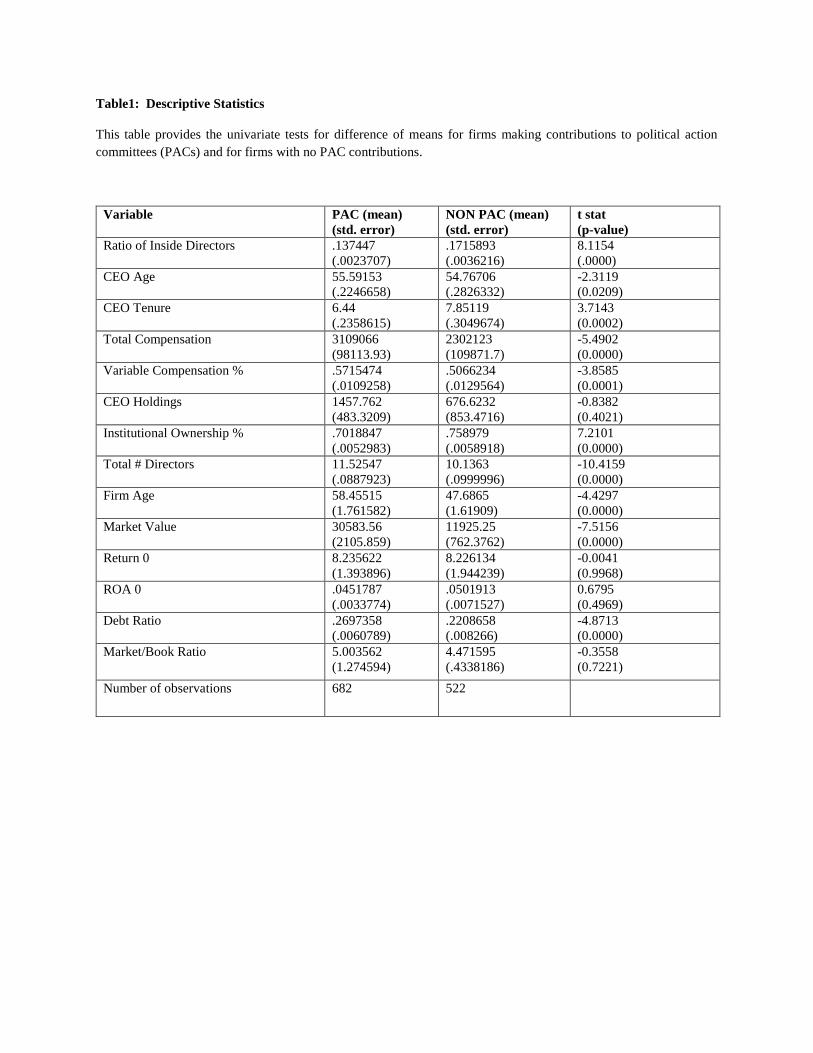
Table1: Descriptive Statistics
This table provides the univariate tests for difference of means for firms making contributions to political action
committees (PACs) and for firms with no PAC contributions.
Variable PAC (mean)
(std. error)
NON PAC (mean)
(std. error)
t stat
(p-value)
Ratio of Inside Directors .137447
(.0023707)
.1715893
(.0036216)
8.1154
(.0000)
CEO Age 55.59153
(.2246658)
54.76706
(.2826332)
-2.3119
(0.0209)
CEO Tenure 6.44
(.2358615)
7.85119
(.3049674)
3.7143
(0.0002)
Total Compensation 3109066
(98113.93)
2302123
(109871.7)
-5.4902
(0.0000)
Variable Compensation % .5715474
(.0109258)
.5066234
(.0129564)
-3.8585
(0.0001)
CEO Holdings 1457.762
(483.3209)
676.6232
(853.4716)
-0.8382
(0.4021)
Institutional Ownership % .7018847
(.0052983)
.758979
(.0058918)
7.2101
(0.0000)
Total # Directors 11.52547
(.0887923)
10.1363
(.0999996)
-10.4159
(0.0000)
Firm Age 58.45515
(1.761582)
47.6865
(1.61909)
-4.4297
(0.0000)
Market Value 30583.56
(2105.859)
11925.25
(762.3762)
-7.5156
(0.0000)
Return 0 8.235622
(1.393896)
8.226134
(1.944239)
-0.0041
(0.9968)
ROA 0 .0451787
(.0033774)
.0501913
(.0071527)
0.6795
(0.4969)
Debt Ratio .2697358
(.0060789)
.2208658
(.008266)
-4.8713
(0.0000)
Market/Book Ratio 5.003562
(1.274594)
4.471595
(.4338186)
-0.3558
(0.7221)
Number of observations 682 522

Table 2: Full Sample CEO Dominance Probit Estimations
This table reports the coefficients (std. errors) for the probit estimations for the CEO dominance Hypothesis, proxied
by the number of inside directors, whether the CEO has a dual title as the Chair of the Board, CEO age, CEO age
relative to the board (rCEOAGE), and the length of CEO tenure. All variables are calculated at the end of the previous
year.
CEO Dominance Ratio Inside
Directors (Model 1)
CEO Duality
(Model 2)
CEO Age
(Model 3)
rCEOAGE
(Model 4)
CEO Tenure
(Model 5)
sic1 .2724492
(.4400334)
-.232116
(.4996397)
.2716348
(.4352322)
.070438
(.5812199)
.2518409
(.4442467)
sic2 .2415012
(.4221549)
-.1271451
(.4851193 )
.2363694
(.4181347)
.233308
(.565334)
.1845773
(.4268812)
sic3 .1072101
(.4165076)
-.2885936
(.4776364)
.1090767
(.4126817)
-.2373496
(.5560905)
.0634694
(.4216539)
sic4 1.329513***
(.4359185)
.7848245
(.5018661)
1.357128***
(.4315208)
.9812011*
(.5824477)
1.311347***
(.4401104)
sic5 .2078236
(.4267784)
-.3304208
(.4880364)
.1823735
(.4226368)
.0253779
(.5686572)
.1290337
(.4312793)
sic6 .0190804
(.426561)
-.5376937
(.4896169)
.0060405
(.422303)
-.2289545
(.5656053)
.0086847
(.4307792)
sic7 .2635717
(.4275815)
-.0398671
(.4901924)
.2431479
(.423712)
-.1096676
(.5767403)
.2083619
(.4322126)
Ln Market Value .308081***
(.0402442)
.2651298***
(.0451656)
.3134045***
(.0405298)
.2522236***
(.0611903)
.315614 ***
(.0405958)
Market/Book
Ratio
.0006684
(.0014367)
-.0004285
(.0038517)
.0005471
(.0014368)
-.0069998
(.0058167)
.0006318
(.0014148)
Debt Ratio -1.28e-06**
(6.45e-07)
2.65e-06*
(1.55e-06)
-1.21e-06**
(6.44e-07)
-5.61e-07
(8.92e-07)
-1.35e-06**
(6.49e-07)
Return -.0014497
(.0010274)
-.001332
(.0011494)
-.0015811
(.0010234)
-.0012662
(.0016107)
-.0014018
(.0010221)
Firm Age .0025754***
(.0009261)
.0022639**
(.0010804)
.0028941***
(.0009302)
.0043517***
(.0016008)
.0027108***
(.0009294)
Total # of
Directors
.0963153***
(.0180895)
.0891413***
(.0201602)
.1042348***
(.0179102)
.1373882***
(.0254834)
.1014996***
(.0180277)
Ratio of Inside
Directors
-2.250875***
(.5266472)
Duality
.4227159***
(.0912257)
CEO Age .0006131
(.0060358)
rCEOAGE .0074441**
(.003393)
CEO Tenure -.0170916***
(.0055503)
Constant -3.793653***
(.5440881)
-3.408217***
(6148857)
-
4.315296***
(.6239018)
-
4.351267***
(.782413)
-4.102112***
(.5409512)
Number of Obs.
1197 969 1194 553 1190
Psuedo R2
.1588 .1549 .1497 .1666 .1536
***, **, * represents significance at the 1%, 5%, and 10% levels respectively

Table 3: Value-Relevant CEO Dominance Tobit Estimations This table reports the coefficients (std. errors) for the tobit estimations for the CEO dominance Hypothesis, proxied by the number of inside directors, CEO Duality, CEO age,
rCEOAge and the length of CEO tenure. All variables are calculated at the end of the previous year.
Ratio inside directors
(Model 1)
CEO Duality
(Model 2)
CEO Age
(Model 3)
rCEOAge
(Model 4)
CEO Tenure
(Model 5)
Location
match Industry match
Location match
Industry match
Location match Industry match
Location match Industry match Location match Industry match
sic1 .0800499
(.1395015)
-.2122155**
(.1082116 )
.1109114
(.1393431)
-.2392486**
(.1070961)
.0625371
(.1400335)
-.2139453**
(.108241)
-.02689
(.1024339)
-.4350935**
(.1800085)
.0612782
(.1407323)
-.213107*
(.1088758)
sic2 .2220131*
(.1331246)
-.1694254*
(.1023402)
.2699449**
(.1325165)
-.1971599*
(.1008072)
.2169994
(.1336127)
-.1732522*
(.1024067)
.208743***
(.0806271)
-.3116757*
(.1730292)
.221188*
(.1338836)
-.1679486
(.1025783)
sic3 .0756399
(.1324228) -.1725086* (.1016582)
.1230636 (.1319078)
-.2053093** (.100391)
.0726133 (.1328998)
-.1722673* (.1017178)
.0233285 (.0806784)
-.2345786 (.172921)
.0738211 (.1331413)
-.1710207* (.1018633)
sic4 .1007082
(.1336653)
-.1440668
(.1025958)
.1377206
(.1330155)
-.1575922*
(.1009825)
.0865913
(.1343069)
-.1486849
(.1027655)
.1017274
(.0899022)
-.2376519
(.176019)
.0923009
(.1343681)
-.141486
(.1027888)
sic5 .2875483**
(.1351916)
-.1716375
(.104387)
.3227413**
(.1344614)
-.1766264
(.1026474)
.285863**
(.1355723)
-.1706971
(.1043819)
.265681***
(.0902677)
-.2751599
(.1761258)
.2810341**
(.1360861)
-.1650424
(.1047238)
sic6 .1987382
(.1349213) -.1051829 (.1038049)
.2376684* (.1341018)
-.1270211 (.1020486)
.1904297 (.135428)
-.1073918 (.1038614)
-2.074651 .
-.2412094 (.1761215)
.1883079 (.1358638)
-.1040484 (.1041964)
sic7 .0101689
(.1378295)
-.144308
(.1057349)
.0430815
(.1363864)
-.1637005
(.1034058)
.0075184
(.1383616)
-.152997
(.1058453)
-.0607032
(.1127683)
-.2180805
(.1788966)
.0055094
(.1388273)
-.1471024
(.1062503)
Ln Market
Value
-.09315***
(.0110254)
-.027743***
(.0089597)
-.098425***
(.011079)
-.026763***
(.0088528)
-.092451***
(.0111301)
-.028755***
(.0090099)
-.098499***
(.0217532)
-.032134**
(.0159837)
-.093252***
(.0111416)
-.028670***
(.0090817)
Market/Boo
k Ratio
.0011014
(.0009592)
-.0013206
(.0009761)
.0011631
(.0009443)
-.0013611
(.0009477)
.0011464
(.0009637)
-.0013641
(.0009739)
.0023232
(.0020161)
-.0000886
(.0014859)
.0011031
(.0010385)
-.0016308
(.0011539)
Debt Ratio -5.67e-07*
(3.44e-07)
-3.78e-07
(2.35e-07)
-5.92e-07*
(3.39e-07)
-3.37e-07
(2.30e-07)
-5.83e-07*
(3.47e-07)
-3.69e-07
(2.36e-07)
-4.51e-07
(6.46e-07)
1.45e-07
(3.37e-07)
-5.78e-07*
(3.49e-07)
-3.69e-07
(2.37e-07)
Return .0005164
(.0003533)
.0003451
(.0002831)
.0004933
(.0003683)
.000305
(.0002912)
.0005416
(.000356)
.0003795
(.0002841)
.0011252*
(.0006505)
.0006101
(.0004683)
.0005031
(.0003556)
.0003571
(.0002842)
Ratio of Inside
Directors
.3265228*
(.1824166)
-.1564889
(.1484811)
CEO Duality -.0576845** (.0264947)
.0353349* (.0214088)
CEO Age .0019899
(.0021378)
.0020433
(.0017056)
rCEO Age .0009991
(.00137)
-.0002074
(.0009999)
CEO Tenure .0019008
(.0020817) .0002049
(.0016553)
Total # of
Directors
.0020398
(.0055736)
-.0019886
(.0045391)
.0023646
(.0055658)
-.0023168
(.0044657)
.0006163
(.0056259)
-.0025514
(.0045656)
.0048803
(.0108755)
-.0177831**
(.0080698)
.001258
(.0055919)
-.0017246
(.0045401)
Constant .821437***
(.1639589)
.6153104***
(.1285483)
.9139671***
(.1604144)
.5873986***
(.1240614)
.7724822***
(.1910032)
.4992958***
(.1501632)
.8731509***
(.2289847)
.9485118***
(.2283868)
.8705177***
(.1630825)
.5980518***
(.1275357)
# of Obs. 548 548 532 532 546 546 232 232 545 545
Psuedo R2 0.2738 0.1778 0.3005 0.2398 0.266 0.1812 0.2138 0.25 0.2643 0.1746 ***, **, * represents significance at the 1%, 5%, and 10% levels respectively

Table 4. Full Sample Interest Alignment Probit Estimations
This table reports the coefficients (std. errors) for the probit results for the Interest Alignment Hypothesis, proxied by
the natural log of CEO holdings, the percentage of institutional ownership, the natural log of CEO total compensation,
and the percentage of CEO variable compensation. All variables are calculated at the end of the previous year.
Compensation/Ownership Ln CEO
Holdings
(Model 1)
Institutional
Ownership
(Model 2)
Ln Total
Compensation
(Model 3)
Variable
Compensation %
(Model 4)
sic1 .0734766
(.4541163)
.3229737
(.4387778)
.199795
(.4362087)
.2646499
(.4372379)
sic2 . 0920088
(.4374143)
.2507958
(.4208645)
.2200498
(.4186916)
.2527113
(.4207103)
sic3 -.0337732
(.4317228)
.1334377
(.4154506)
.1540256
(.4130811)
.1510309
(.4151474)
sic4 1.171834***
(.4504957)
1.395333***
(.4355296)
1.363466***
(.4319658)
1.397182***
(.4343331)
sic5 .0340309
(.4418448)
.2360167
(.4264649)
.185081
(.4232739)
.2111039
(.4250827)
sic6 -.1197039
(.4409047)
.0389146
(.4252148)
-.0191071
(.4232317)
.0143457
(.4247056)
sic7 .189098
(.4428801)
.2749732
(.4274126)
.24377
(.4245339)
.286345
(.4264315)
Ln Market Value .2889431
(.0415943)
.3059919***
(.0416397)
.2861705***
(.0409176)
.3077733***
(.0406442)
Market/Book Ratio .0019686***
(.0018471)
.0006156
(.0014304)
.0004558
(.0014685)
.0005474
(.0014574)
Debt Ratio -1.09e-06*
(6.59e-07)
-9.62e-07
(7.04e-07)
-1.13e-06*
(6.76e-07)
-1.05e-06
(6.63e-07)
Return -.0011806
(.0010435)
-.001629
(.0010354)
-.0019041*
(.00105)
-.001521
(.0010257)
Firm Age .0029603***
(.000946)
.0028402***
(.0009339)
.0026425***
(.0009378)
.0028963***
(.000934)
Total # of Directors .1016598***
(.0183709)
.0974317***
(.0182235)
.1023293***
(.0182022)
.1027044***
(.0180578)
Ln CEO Holdings -.0663442***
(.0205638)
Institutional Ownership % -.3427152
(.2990284)
Ln Total Compensation .156605***
(.0438465)
Variable Compensation % .2950879**
(.1252167)
Constant -3.590641***
(.5775117)
-3.903024***
(.6235146)
-6.269178***
(.7923597)
-4.406727***
(.539842)
Number of Obs.
1149 1182 1185 1188
Pseudo R2
.1555 .1507 .1557 .1588
***, **, * represents significance at the 1%, 5%, and 10% levels respectively

Table 5. Value-Relevant Interest Alignment Tobit Estimations
This table reports the coefficients (std. errors) for the tobit results for the Interest Alignment Hypothesis, proxied by
the natural log of CEO holdings, the percentage of institutional ownership, the natural log of CEO total compensation,
and the percentage of CEO variable compensation. All variables are calculated at the end of the previous year.
Ln CEO Holdings
(Model I)
Institutional Ownership
(Model 2)
Ln Total Compensation
(Model 3)
Variable Compensation %
(Model 4)
Location
Match
Industry
Match
Location
Match
Industry
Match
Location
Match
Industry
Match
Location
Match
Industry
Match
sic1 .0763115
(.1386825)
-.1887829*
(.1059323)
.081787
(.1390035)
-.2113408*
(.1082576)
.0932422
(.1374581)
-.2064565*
(.1065366)
.0638684
(.1383352)
-.205131*
(.1062931)
sic2 .2488706* (.1318709)
-.1652042* (.0998099)
.2170987 (.132468)
-.1707867* (.1022499)
.2309879* (.130943)
-.1807624* (.1006035)
.2121148 (.1321031)
-.1745466* (.1006248)
sic3 .0850598
(.1312107)
-.1641548*
(.0991285)
.0805132
(.1320111)
-.171248*
(.1017574)
.0651724
(.1305261)
-.1716016*
(.1001071)
.0584174
(.1316268)
-.1665818*
(.1000641)
sic4 .1260983
(.1324254)
-.1315349
(.1000244)
.0641683
(.1335583)
-.1377397
(.1028865)
.0840607
(.1315646)
-.1458009
(.1008755)
.0767144
(.1327274)
-.1354571
(.1009055)
sic5 .3048918** (.1342466)
-.1574261 (.1020964)
.2963598** (.1347487)
-.1746256* (.1044931)
.2860859** (.1331522)
-.1724141* (.1027341)
.2712271** (.1342646)
-.1667897 (.1026861)
sic6 .2107301
(.1325924)
-.1031788
(.1003476)
.1861998
(.1335612)
-.1060784
(.1030852)
.1958007
(.1319806)
-.1100548
(.1014022)
.1866069
(.1329837)
-.1044844
(.1012942)
sic7 -.0297683
(.1373)
-.1555358
(.1036919)
-.0004665
(.1379125)
-.1427722
(.1061562)
.0017179
(.1363559)
-.1615828
(.1045653)
-.0083413
(.1372987)
-.1377089
(.1042605)
Ln Market Value
-.088128*** (.0108801)
-.0271795*** (.0087349)
-.0981774*** (.011021)
-.0288946*** (.0089663)
-.0857157*** (.0107566)
-.0276082*** (.0087455)
-.0890944*** (.0107162)
-.0269164*** (.0086395)
Market/Book
Ratio
.0002238
(.0010716)
-.0025794
(.0014623)
.0010167
(.0009619)
-.0013224
(.0009738)
.0009997
(.0009476)
-.0014519
(.0009777)
.0010613
(.000951)
-.0013157
(.0009645)
Debt Ratio -5.42e-07
(3.41e-07)
-3.82e-07*
(2.30e-07)
-5.67e-07
(3.47e-07)
-3.80e-07
(2.36e-07)
-4.89e-07
(3.47e-07)
-3.58e-07
(2.34e-07)
-5.59e-07
(3.45e-07)
-4.12e-07*
(2.32e-07)
Return .0002971
(.0003574) .0003338
(.0002821) .0006394* (.0003565)
.0003172 (.0002864)
.0005812* (.0003507)
.0004582 (.000281)
.0004554 (.0003508)
.0004604* (.0002797)
Ln CEO
Holdings
.0256612***
(.0078208)
.0093314
(.0061366)
Institutional
Ownership %
-.2599746***
(.0902438)
.0449611
(.073142)
LN Total
Compensation
-.048753***
(.0124754)
-.0056411
(.0100964)
Variable Compensation
%
-.1015684**
(.0403026)
.0451191
(.0323525)
Constant .7240777***
(.166496) .5266095*** (.1285262)
1.125816*** (.1819766)
.5504198*** (.1438995)
1.538978*** (.2315963)
.6538074*** (.1836977)
.9275795*** (.1602875)
.5315731*** (.1244927)
Number of
Obs. 526 526 544 544 541 541 543 543
Psuedo R2 0.3008 0.2356 0.2824 0.1755 0.3016 0.194 0.2854 0.1979
***, **, * represents significance at the 1%, 5%, and 10% levels respectively

Table 6: Full Sample Performance Impact Estimations
This table reports the coefficients (std. errors) for the performance impact estimations for PAC contributions. The first step
estimates the extent to which CEO characteristics predict PAC contributions. The second step relates the predicted PAC
contribution to firm performance. Predicted Contribution Level 1 is the predicted PAC contribution from the first stage estimations.
Return ROA ROE
1st Stage
Estimations
2nd Stage
Estimations
1st Stage
Estimations
2nd Stage
Estimations
1st Stage
Estimations
2nd Stage
Estimations
Column 1 Column 2 Column 3 Column 4 Column 5 Column 6
sic1 -22372.28
(163381.9)
8.540239
(9.94938)
-27173.82
(163228.1)
-.0256473
(.0434347)
-17494.48
(162149.5)
-.0504533
(.4127898)
sic2 -74713.62 (158313.5)
22.16183** (9.62565)
-76698.06 (157882)
.0088394 (.0420214)
-71265.96 (157045.7)
.1479223 (.4029749)
sic3 6153.035
(157415)
11.01258
(9.524368)
4293.328
(157193.9)
-.0369523
(.0415793)
16222.79
(156213.6)
.0211571
(.4017727)
sic4 207488.6
(157143.3)
4.230978
(10.07099)
199518.6
(157294.7)
-.068951
(.0439656)
200643.2
(155947.2)
-.0783152
(.4165874)
sic5 -63549.05
(159949.8)
16.87358*
(9.744961)
-61218.79
(159513.1)
.0086382
(.0425423)
-57105.52
(158680.1)
.118423
(.40745)
sic6 -92969.42 (158883.7)
19.36503**
(9.613583) -94334.62 (158937.1)
-.0436342 (.0419687)
-84166.02 (157669.6)
-.0127048 (.4031754)
sic7 -13571.91
(160122.5)
9.663007
(9.820455)
-11572.55
(160264)
-.0166643
(.0428719)
3659.411
(158996.1)
.0781823
(.4066295)
Ln Market Value 114380.8***
(10728.84)
-12.40567***
(1.8975)
114415.3***
(11036.36)
-.0157579*
(.0082837)
114160.9***
(10645.93)
-.0530922
(.0632371)
Market/Book Ratio
63.4971 (319.9936)
71.64758
(322.6754)
-109.4298 (356.1037)
Debt Ratio .4628243**
(.2326235)
6.877516
(5.437711)
.4748333**
(.2326832)
-.0407907*
(.0237387)
.444509*
(.229828)
2.22e-07
(6.29e-07)
Return -320.7306
(309.6774)
-38159.93
(164843.4)
20890.96
(19077.74)
Ratio of Inside Directors
323743.3** (167438.6)
321839.7* (166515.7)
400991.3** (167942.6)
CEO Tenure 729.272
(1790.695)
857.0116
(1781.451)
430.4159
(1802.704)
Ln CEO
Holdings
-2349.994***
(7305.307)
-3794.086
(7140.666)
-4926.366
(7197.998)
Institutional Ownership
24169.91 (87875.83)
5701.292
(85174.54)
-9546.139 (85279.08)
Ln Total
Compensation
36093.53
(12472.74)
34994.97***
(12323.77)
37854.36***
(12642.67)
Variable
Compensation %
54892.44
(39150.95)
57186.3
(38991.13)
59437.17
(39102.49)
Firm Age 62.89968
(238.4088)
103.715 (237.1984)
74.45287
(237.4894)
Total # of
Directors
14148.95***
(5128.817)
14038.71***
(5129.04)
13842.99***
(5086.674)
Predicted
Contribution
Level 1
.000059***
(.0000125)
1.21e-07**
(5.48e-08)
3.87e-07 (4.57e-07)
Sales Growth 16.86365***
(2.314726)
.0405102***
(.0101051)
.0124579
(.0780237)
Constant -1636998***
(258315.4) 91.28937***
(18.29102) -1602656 ***
(254557.2) .1994204*** (.0798507)
-1643256*** (256283.2)
.5711643 (.6505492)
Number of Obs. 622 1104 624 1104 615 615
R2 0.3297 0.1091 0.3324 0.0485 0.3352 0.0093
Adjusted R2 0.3086 0.1002 0.3115 0.0389 0.3139 -0.0088 ***, **, * represents significance at the 1%, 5%, and 10% levels respectively

Table 7: Value Relevant Performance Impact Estimations
This table reports the coefficients (std. errors) for the performance impact estimations for PAC contributions. The
first step estimates the extent to which CEO characteristics predict PAC contributions. The second step relates the
predicted PAC contribution to firm performance. Predicted Contribution Level 1 is the predicted PAC contribution
from the first stage estimations.
PANEL A – Location Match: Return ROA ROE
1st Stage
Estimations
2nd Stage
Estimations
1st Stage
Estimations
2nd Stage
Estimations
1st Stage
Estimations
2nd Stage
Estimations
Column 1 Column 2 Column 3 Column 4 Column 5 Column 6
sic1 .1072457
(.1343323) 35.22338** (15.38326)
.1238103 (.1345439)
-.0228524 (.0353766)
.1036505 (.1340463)
-.4738909 (.3451082)
sic2 .2449708*
(.1300466)
61.25747***
(15.44145)
.251453*
(.1300328)
-.0018644
(.0354994)
.243233*
(.1297973)
-1.160161***
(.345274)
sic3 .1391967
(.1288179)
50.7959***
(15.06393)
.150523
(.1290148)
-.0111293
(.0346382)
.1337237
(.1285503)
-.6575281*
(.3374139)
sic4 .131072
(.1291382) 47.9928*** (15.13316)
.1559178 (.1296111)
-.0466733 (.0347968)
.1299257 (.1288362)
-.6588002* (.3390119)
sic5 .3067758**
(.1313831)
61.1553***
(15.90051)
.3112053**
(.1313208)
.0058218
(.0365477)
.2939919
(.1310586)
-1.471743***
(.3535044)
sic6 .2267955
(.1307831)
57.98994***
(15.4296)
.2497221*
(.131268)
-.0471507
(.0354605)
.228804**
(.1304914)
-1.23342***
(.3443649)
sic7 .0624584
(.1318993) 35.28143** (15.15002)
.0811293 (.1324685)
-.0166423 (.034834)
.056834* (.1317037)
-.3375694 (.3400647)
Ln Market Value -.0704125***
(.0095602)
-13.56392***
(1.548556)
-.075031***
(.010053)
.0106136***
(.0035291)
-.0726323
(.009603)
.4110699***
(.0325829)
Market/Book
Ratio
-.0001397
(.0009451)
-.0002182
(.000946)
-.0001465***
(.0009421)
.0927304
(.0649226)
Debt Ratio -7.18e-08 (2.26e-07)
.0000119 (.0000213)
-5.09e-08 (2.26e-07)
-2.07e-07*** (4.89e-08)
-1.45e-07 (2.24e-07)
1.63e-06*** (4.76e-07)
Return .0003798
(.0002933)
.290607* (.163968)
.048529*** (.0178035)
Ratio of Inside
Directors
.0994808
(.1562437)
.0930862
(.1561315)
.1381761
(.1583952)
CEO Tenure .001104
(.0018398)
.001191
(.0018369)
.0018249
(.0018574)
Ln CEO Holdings
.0210985*** (.0067878)
.0197638*** (.0068207)
.0198315*** (.0069336)
Institutional
Ownership
-.1092692
(.0803365)
-.0842189
(.079252)
-.1110962
(.0796941)
Ln Total
Compensation
-.0255385**
(.0108052)
-.0243406**
(.0107289)
-.0145712
(.0112553)
Variable Compensation %
-.0442215 (.0361726)
-.0407976 (.0360738)
-.0553104 (.0362672)
Firm Age .0001567
(.0002195)
.0001621
(.0002185)
.0001402
(.0002198)
Total # of
Directors
.0022203
(.0046761)
.0041476
(.0047079)
.0021279
(.0046706)
Predicted Contribution
Level 1
-108.8701***
(17.11105)
-.0147946
(.038574)
5.51688***
(.3388932)
Sales Growth 17.79811*** (2.896078)
.02016
(.006634)
.0927304 (.0649226)
Constant 1.015096***
(.221728)
104.2339***
(20.92275)
.979477***
(.2199997)
-.0277044***
(.0477684)
.8805357***
(.2234231)
-3.971848***
(.4531751)
Number of Obs. 492 613 493 616 485 615
R2 0.2386 0.1742 0.2398 0.2033 0.25 0.3109
Adjusted R2 0.2079 0.1591 0.2092 0.1888 0.2194 0.2984
***, **, * represents significance at the 1%, 5%, and 10% levels respectively

PANEL B – Industry Match:
Return ROA ROE
1st Stage
Estimations
2nd Stage
Estimations
1st Stage
Estimations
2nd Stage
Estimations
1st Stage
Estimations
2nd Stage
Estimations
Column 1 Column 2 Column 3 Column 4 Column 5 Column 6
sic1 -.1826196
(.1138536)
27.31426*
(16.49184)
-.1839323
(.1141674)
-.0535173
(.0366638
-.1837972
(.1143781)
-.9187465**
(.4127153)
sic2 -.1410675
(.1102213)
37.55978**
(16.01505)
-.1435238
(.1103395)
-.0317528
(.0355628
-.1419485
(.1107526)
-.6463326
(.4001767)
sic3 -.1402638
(.1091799)
37.52828**
(15.83874)
-.1428754
(.1094757)
-.0364912
(.0351515
-.1427005
(.1096886)
-.6631645*
(.3959397)
sic4 -.1442168
(.1094514)
35.20031**
(15.89841)
-.1449195
(.1099817)
-.0715268**
(.0352856
-.1424732
(.1099325)
-.6741889*
(.397436)
sic5 -.1393482
(.1113541)
30.63336*
(16.04778)
-.1430722
(.1114324)
-.0215033
(.035613
-.1426758
(.1118288)
-.5676992
(.4010816)
sic6 -.1105058
(.1108455)
34.72708**
(15.75647)
-.1109308
(.1113877)
-.0697194**
(.0349529
-.1110397
(.1113448)
-.591829
(.3938572)
sic7 -.1476918
(.1117916)
28.13547*
(16.05135)
-.1548735
(.1124063)
-.0417135
(.0356306
-.1459911
(.1123793)
-.606512
(.4004992)
Ln Market
Value
-.0292959***
(.0081028)
-5.467573***
(1.191987)
-.0279311***
(.0085305)
.0069801***
(.0027014
-.0289795***
(.008194)
-.1470122***
(.0303257)
Market/Book
Ratio
-.0010235
(.000801)
-.0009305
(.0008027)
-.0009589
(.0008038)
Debt Ratio -2.96e-07
(1.92e-07)
.0000366
(.0000228)
-3.27e-07*
(1.92e-07)
-2.49e-07***
(5.08e-08
-3.13e-07
(1.91e-07)
-9.08e-07
(5.71e-07)
Return .0002227
(.0002486)
-.0412252
(.1391353)
-.0026778
(.0151912)
Ratio of Inside
Directors
-.2005673
(.1324247)
-.1966562
(.1324856)
-.2033511
(.1351544)
CEO Tenure -.0021027
(.0015593)
-.0020955
(.0015587)
-.0019064
(.0015848)
Ln CEO
Holdings
.0076952
(.005753)
.0081269
(.0057877)
.0079453
(.0059162)
Institutional
Ownership
.0124909
(.0680894)
.0176677
(.0672494)
.0252569
(.0680009)
Ln Total
Compensation
-.0052011
(.009158)
-.0042249
(.0091041)
-.005287
(.0096039)
Variable
Compensation
%
.0460106
(.0306581)
.0422392
(.0306104)
.0483774
(.0309458)
Firm Age -.0003305*
(.000186)
-.000346*
(.0001854)
-.0003229*
(.0001876)
Total # of
Directors
.00019
(.0039632)
-.0003275
(.0039949)
.0003253
(.0039853)
Predicted
Contribution
Level 1
3.354105
(23.5282)
-.1487598***
(.0547085)
-4.484665***
(.6057245)
Sales Growth 19.20899***
(3.000006)
.0221366***
(.0066141)
.0795009
(.0748443)
Constant .6642974***
(.187926)
21.95473
(22.76536)
.6468502***
(.1866811)
.0561306
(.05167)
.6525982*
(.1906411)
3.026529***
(.577974)
Number of
Obs.
492 613 493 616 485 615
R2 0.0939 0.1186 0.0929 0.2127 0.0929 0.0908
Adjusted R2 0.0574 0.1025 0.0565 0.1984 0.0558 0.0742
***, **, * represents significance at the 1%, 5%, and 10% levels respectively