CEO AGM presentation - Avocado Industry Council · CEO AGM presentation Jen Scoular 20 August 2014...
22
CEO AGM presentation Jen Scoular 20 August 2014
Transcript of CEO AGM presentation - Avocado Industry Council · CEO AGM presentation Jen Scoular 20 August 2014...

CEO AGM presentation Jen Scoular
20 August 2014

Agenda • The year under review • 2013-14 financial accounts • Reserves • Crop estimate • 2014-15 budget • Primary growth partnership • MBIE
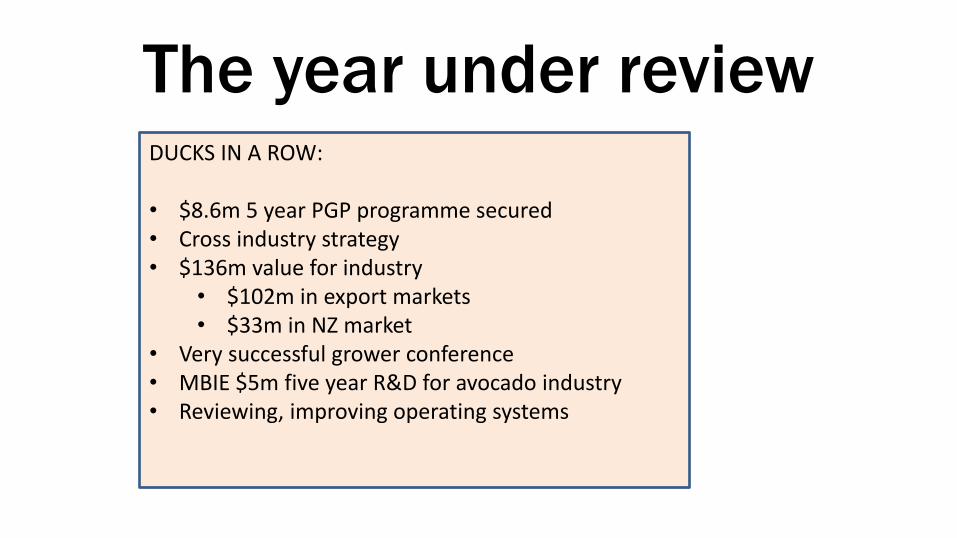
The year under review DUCKS IN A ROW: • $8.6m 5 year PGP programme secured • Cross industry strategy • $136m value for industry
• $102m in export markets • $33m in NZ market
• Very successful grower conference • MBIE $5m five year R&D for avocado industry • Reviewing, improving operating systems

The year under review
DUCKS IN A ROW: • $8.2m PGP secured • Cross industry strategy • $136m value for industry
• $102m in export markets • $33m in NZ market
• Successful grower conference • MBIE $5m five year R&D for avocado
industry • Reviewing & improving systems
HOW? • Leverage expertise • Build capability • Sharing information • Engagement:
• AVEC • Rural professionals • Working groups
• Monitoring & reporting • Benchmarking

The year under review
Resources: Board support to drive success Team aligned to deliver on strategy
The Prize: $280m sales
12 t/ha By 2023
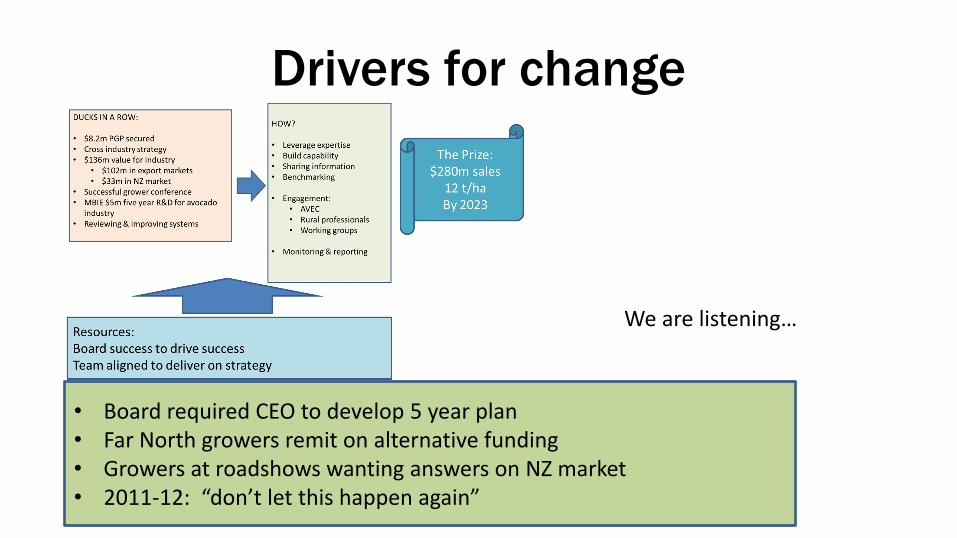
Drivers for change
• Board required CEO to develop 5 year plan • Far North growers remit on alternative funding • Growers at roadshows wanting answers on NZ market • 2011-12: “don’t let this happen again”
We are listening…

“Business as Usual” to Growth
Business as Usual, BAU • Strong relationship with growers • Export system including quality standards • Implement promotions in export and NZ markets • R&D programme • Strong cross-regional governance
MBIE R&D – funded externally
Primary Growth Partnership: - Co-investors - In-kind contribution - $4.3m govt funding

A growth industry
ENGAGEMENT/PARTNERS Scientists, Plant & Food
Rural professionals Govt: MBIE, MPI, NZTE
Other industries Nutritionists
Media/PR agencies
CROSS INDUSTRY Growers, Packers, Processors, NZ Marketers, Exporters, NZ Avocado, Board

5 year plan – in review
To ensure the industry produces a consistent and sustainable supply of New Zealand avocados to meet consumer needs
An effective framework enables the NZ avocado story to be told, which supports market retention & development which delivers value to growers
To engage stakeholders to achieve an integrated NZ avocado industry
Supply
Demand
Strong industry
Optimise value from export markets
Optimise value from the NZ market
Export return
NZ market return
VISION: to maximise industry value over the long term
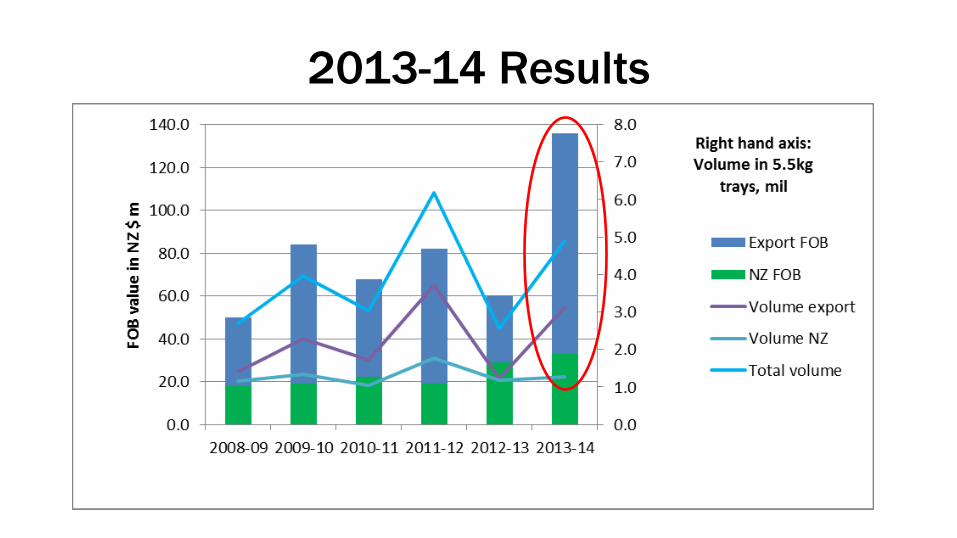
2013-14 Results

Revenue 2013-14 2012-13 2011-12
Commodity and other levies 1,432.5 1,032.7 1,378.4
Promotion levy 627.4 243.4 744.0
EMS management fee 392.1 395.6 1,004.9
Registrations 229.5 181.1 265.5
Other income 117.9 146.7 97.6
Total Revenue 2,799.5 1,999.5 3,490.4
Expenses
Communications 168.9 215.9 170.5
Promotions & market development 366.9 215.0 708.9
Export management & systems 260.3 315.7 334.4
Research & development 151.5 92.2 216.9
Director Fees 113.7 132.6 119.3
Other Governance 77.9 144.5 133.2
Salaries and overheads 1,333.1 1,359.0 1,340.7
Total Expenses 2,472.4 2,475.0 3,023.8Net Surplus / (deficit) 327.1 -475.5 466.6
2013-14 Financials $000’s

Actuals Actuals Actuals
2013-14 Allocations 2013-14 2012-13
Communications 168.9 330.3 499.1 608.8
Promotion and mkt dev 366.9 102.2 469.2 289.3
Export system 260.3 446.4 706.8 680.0R&D programme 151.5 296.3 447.8 508.8Governance 191.6 114.0 305.6 350.7
Salaries, overheads, depn 1,333.1 -1,289.3 43.8 37.4
Total costs 2,472.4 0.0 2,472.4 2,475.0
Total excluding promotion 2,003.2 2,185.8
Allocated costs – comparatives $ 000’s

NZ AGA Group Accounts
NZAGA + AIC = Group
Revenue 2,085,828 713,629 2,799,457
Intercompany Revenue 1,194,914
Total Revenue 2,085,828 1,908,543
Expenses 563,828 1,908,543 2,472,371
Intercompany Expense 1,194,914
Total Expenses 1,758,742 1,908,543
Surplus 327,086 - = 327,086

Reserves Year ended April 2009-10 2010-11 2011-12 2012-13 2013-14 Total
$ 000's B/fwd Deficit Surplus Surplus Surplus Deficit Surplus C/fwd
Total reserves 1,232.7 -247.5 344.8 164.8 466.6 -475.5 327.0 1,812.9
"Ring-fenced"
Promotions 32.6 88.6 34.1 -59.1 -45.8 158.2 208.6
ASBV'd -475 96.5 76.9 185.4 60.8 - -
Spent out of reserves
Capital Expenditure -52.2
Balance 985.2 1,330.0 1,494.8 1,961.4 1,485.9 1,812.9
2009
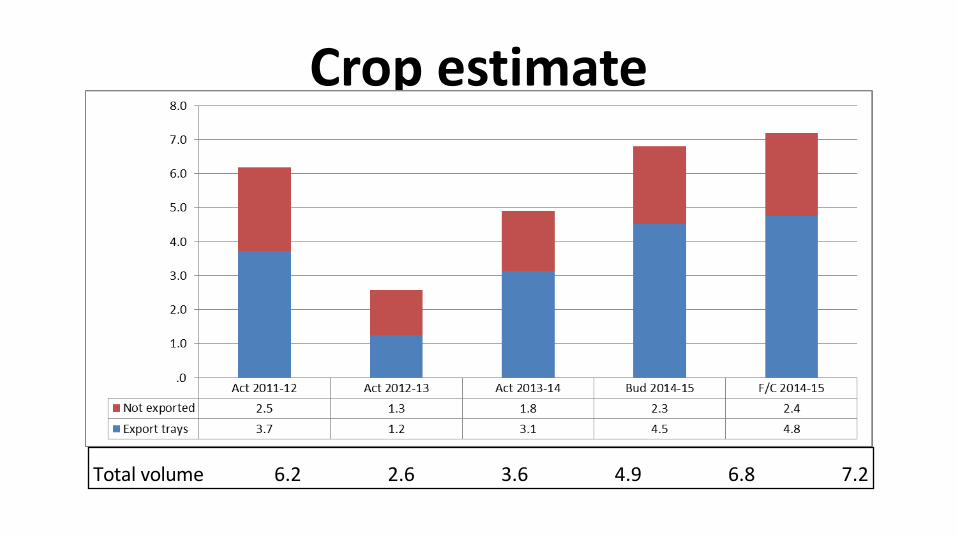
Crop estimate
Total volume 6.2 2.6 3.6 4.9 6.8 7.2

2014-15 2013-14 2012-13 2011-12
Revenue Budget Actuals Actuals Actuals
Commodity and other levies 1,455.3 1,432.5 1,032.7 1,378.4
Promotion levy 900.0 627.4 243.4 744.0
EMS management fee 675.0 392.1 395.6 1,004.9
Registrations 313.2 229.5 181.1 265.5
Other income 166.9 117.9 146.7 97.6
Total Revenue 3,510.4 2,799.5 1,999.5 3,490.4
Expenses
Communications 210.8 168.9 215.9 170.5
Promotions & market development 1,119.0 366.9 215.0 708.9
Export management & systems 361.5 260.3 315.7 334.4
Research & development 107.7 151.5 92.2 216.9
PGP 148.9
MBIE 112.5
Director Fees 120.6 113.7 132.6 119.3
Other Governance 111.4 77.9 144.5 133.2
Salaries, overheads, depn 1,436.2 1,333.1 1,359.0 1,340.7
Total Expenses 3,728.6 2,472.4 2,475.0 3,023.8Net Surplus / (deficit) -218.2 327.1 -475.5 466.6
2014-15 Budget

Budget Actuals Actuals Actuals
2014-15 2013-14 2012-13 2011-12
Total costs 3,728.6 2,472.4 2,475.0 3,023.8
less promotions 1,119.0 366.9 215.0 708.9
2,609.6 2,105.4 2,260.1 2,315.0
Primary growth partnership 148.9
MBIE 112.5
2,348.1 2,105.4 2,260.1 2,315.0
Budget costs


NZ Avocados Go Global
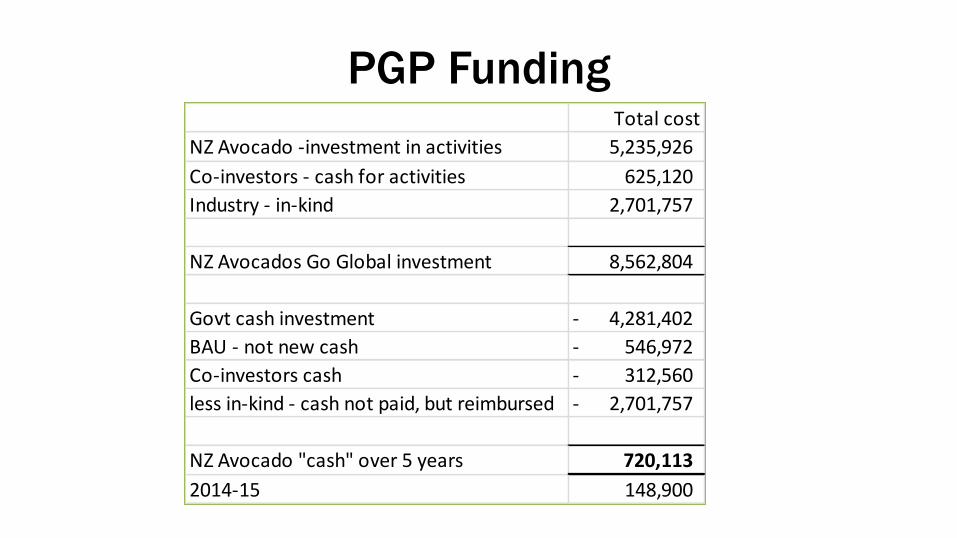
PGP Funding Total cost
NZ Avocado -investment in activities 5,235,926
Co-investors - cash for activities 625,120
Industry - in-kind 2,701,757
NZ Avocados Go Global investment 8,562,804
Govt cash investment 4,281,402-
BAU - not new cash 546,972-
Co-investors cash 312,560-
less in-kind - cash not paid, but reimbursed 2,701,757-
NZ Avocado "cash" over 5 years 720,113
2014-15 148,900
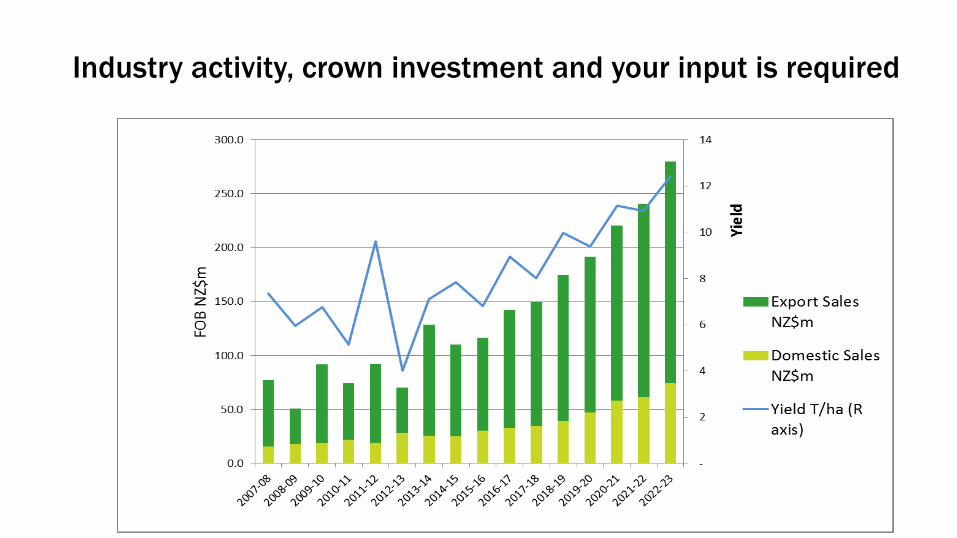
Industry activity, crown investment and your input is required