CENTURY PROPERTIES GROUP, INC.
48
CENTURY PROPERTIES GROUP, INC. Analysts Presentation: FY 2013 Results April 2014
Transcript of CENTURY PROPERTIES GROUP, INC.

CENTURY PROPERTIES GROUP, INC. Analysts Presentation: FY 2013 Results
April 2014

1
These materials have been prepared by Century Properties Group Inc. (together with its subsidiaries, the
"Company” or “Century”), and have not been independently verified. No representation or warranty,
expressed or implied, is made and no reliance should be placed on the accuracy, fairness or
completeness of the information presented in these materials.
Neither the Company nor any of its affiliates, advisers or representatives accepts any liability whatsoever
for any loss howsoever arising from any information presented in these materials. The information
presented or contained in these materials is subject to change without notice and its accuracy is not
guaranteed. These materials contain statements that constitute forward-looking statements. These
statements include descriptions regarding the intent, belief or current expectations of Century or its officers
with respect to the consolidated results of operations and financial condition of Century. These statements
can be recognized by the use of words such as "targets", "believes", "expects", "aims", "intends", "will",
"may", "anticipates", "would", "plans", "could", "predicts", "projects", "estimates", "foresees," or words of
similar meaning. Such forward-looking statements are not guarantees of future performance and involve
risks and uncertainties, and actual results may differ from those in the forward-looking statements as a
result of various factors and assumptions. Century has no obligation and does not undertake to revise
forward-looking statements to reflect future events or circumstances.
Representative examples of these factors and assumptions include (without limitation) general industry
and economic conditions, interest rate trends, cost of capital and capital availability, availability of real
estate properties, competition from other companies and venues for sale of projects, shifts in customer
demands, customers and partners, changes in operating expenses, including employee wages, benefits
and training, governmental and public policy changes and continued availability of financing in the
amounts and the terms necessary to support future business.
IMPORTANT NOTICE AND DISCLAIMER
1 INTRODUCTION 3
2 PRE-SALES AND COLLECTION 7
3 FINANCIAL PERFORMANCE AND
CAPITAL MANAGEMENT 16
4 “PROOF OF CONCEPT” 22
5 FUTURE PROJECTS 43
CONTENTS

INTRODUCTION 1

4
WHERE WE ARE NOW
Earnings Momentum
FY 2013 Revenue of P10.8 B, representing 12.5% growth from P9.6 B in FY 2012
FY 2013 Gross Profit from Real Estate Development of P4.2 B, representing 5.8% growth from P4.0 B in FY
2012
FY 2013 EBITDA of P2.8 B, representing 8.0% growth from P2.6 B in FY 2012
FY 2013 Net Income of P1.84 B, representing a slight decline of -0.3% from P1.85 B FY 2012
Earnings Quality
Steady Increase In Selling Price
• Average price increase of 8%, 25%, 15% for Luxury, Middle Income and Affordable Markets, respectively,
between December 2013 and December 2012 based on sold units
• Average PSM sold of 208,000 (Luxury), 166,696 (Middle Income), and 115,348 (Affordable) for the 12
months 2013
Increased Construction Cost
• GP margin declined to 42.1% from 44.5% due to the focus on brand building
• CPG believes that brand building translates into differentiation and will result in long-term market share
Healthy Collection
• Middle Income: 57% cash, 42% bank, 1% in house
• Affordable: 39% cash, 58% bank, 3% in house

5
WHERE WE ARE NOW
Earnings Sustainability
Pre-Sales
• FY 2013 Pre-Sales of P24.6 B, representing 15% growth from P21.4 B in FY 2012
• Total un-booked revenues amounting to P35.1 B as of December 2013
• FY 2013 pre-sales as % of new launches was at 124% mitigating inventory buildup
Liquidity
• Total debt capacity increased to P10.6 B by March 2014
• Cash flow from operations improved to –P1.6 B in FY 2013 vs -P3.4B in FY 2012
Recurring Income
• Initial foray into the recurring income space with the completion of 17,000 net leasable sqm Century City
mall that is 99% leased and 100% reserved as of March 2014
• Finished excavation for office building with GFA of 29,530 sqm1 in Fort Bonifacio
(1) CPG’s share is 49% : 14,470 sqm

6
RESULTS OVERVIEW
(1) With Interest Accretion
PHP (Million) FY 2011 FY 2012 FY 2013
Total Revenues 4,702 9,611 10,809
Gross Profit from Real Estate
Development1 1,751 3,962 4,192
EBITDA1 1,353 2,543 2,786
Net Income 866 1,850 1,845
Gross Profit Margin from Real
Estate Development1 41.7% 44.5% 42.1%
Net Income Margin 18.4% 19.2% 17.1%
ROE 23.8% 29.4% 23.4%
Net Debt / Equity 0.12x 0.33x 0.40x

PRE-SALES AND COLLECTION 2
8
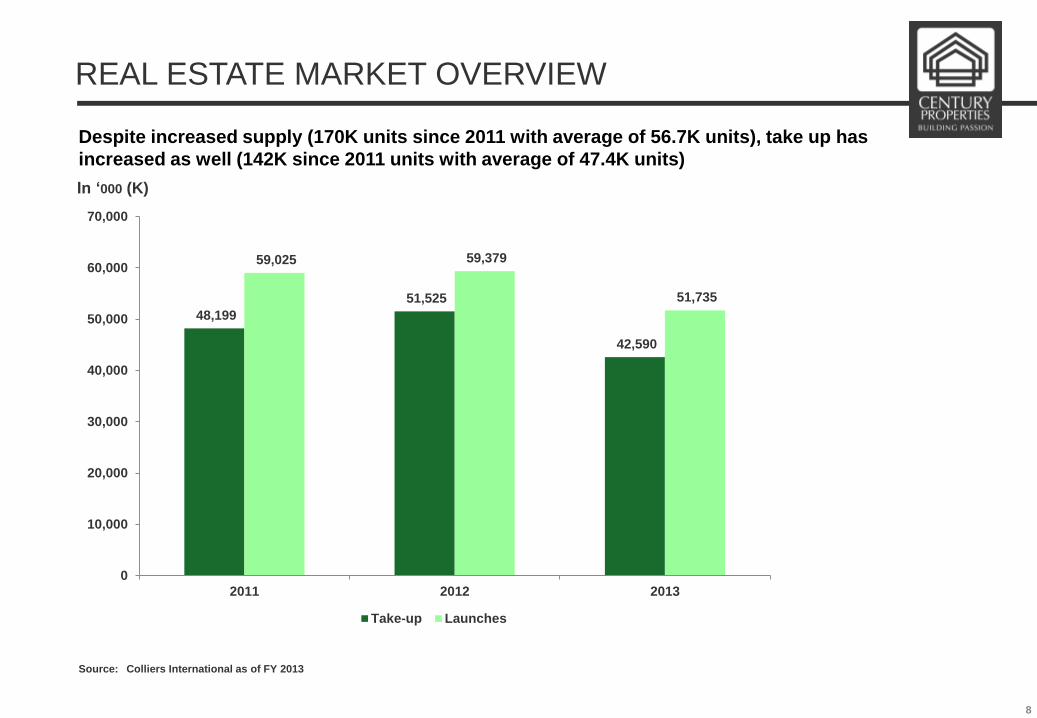
REAL ESTATE MARKET OVERVIEW
Source: Colliers International as of FY 2013
Despite increased supply (170K units since 2011 with average of 56.7K units), take up has
increased as well (142K since 2011 units with average of 47.4K units)
In ‘000 (K)
48,199
51,525
42,590
59,025 59,379
51,735
0
10,000
20,000
30,000
40,000
50,000
60,000
70,000
2011 2012 2013
Take-up Launches

9
CPG’s TARGET MARKETS
Colliers’ Price Points CPG’s Price Points
Economic Below P1.25M None
Affordable P1.25M to P3.0M P2.3M to P3.6M
Middle Income P3.0M to P5.0M
P3.7M to P7.2M
Upscale P5.0M to P7.0M
Luxury P7.0M and above P7.3M and above
Premium pricing across all market segments

10
1.0
0.6
0.8
1.2
1.4
2.6
1.4 1.5 1.5
1.8
1.3
1.6
1.3 1.3
1.0
1.3 1.4
1.9
0.0
0.5
1.0
1.5
2.0
2.5
3.0
2011 2012 2013
Economic Affordable Middle Income Upscale Luxury All Segments
Remaining Inventory Life (in # of Years)
REAL ESTATE MARKET OVERVIEW
Source: Colliers International as of FY 2013

11
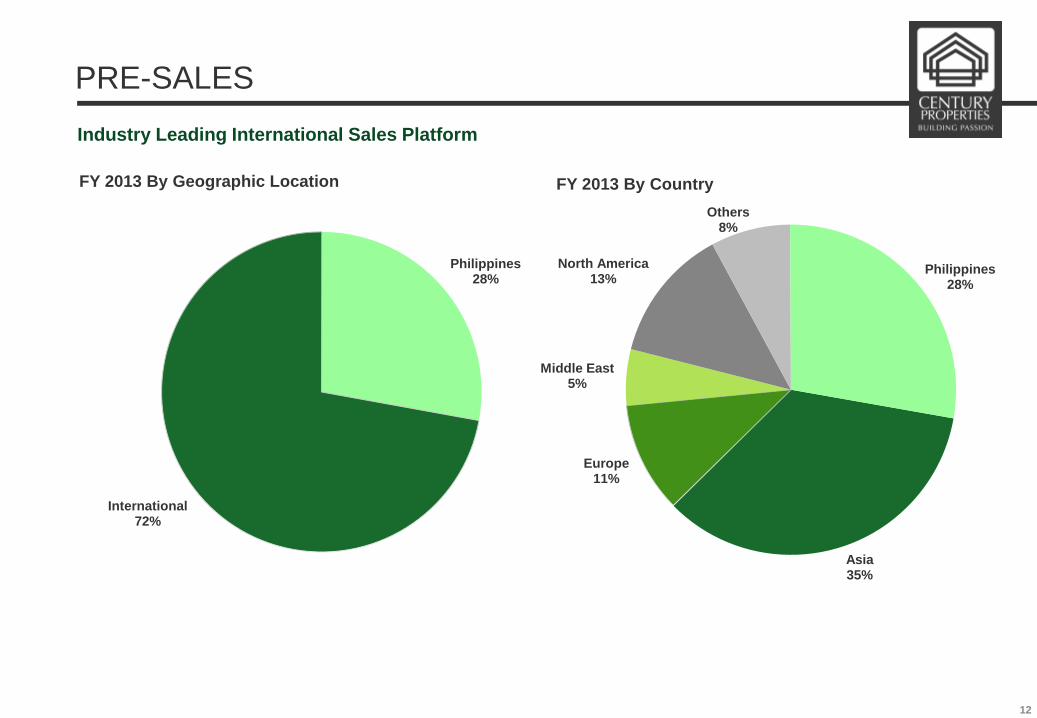
PRE-SALES
Balanced Product Mix
FY 2012 By Product: Php21.4 B Total Pre-sales
Note: Luxury, Middle Income and Affordable markets are defined wherein majority of the units’ total contract price is over P7.3M, between P3.7M to P7.2M and between P2.3M to
P3.6M respectively.
FY 2013 By Product: Php24.6 B Total Pre-sales
Luxury 26%
Middle Income
23%
Affordable 51%
Luxury 22%
Middle Income
33%
Affordable 45%
Visibility on earnings with P35.1 B of un-booked revenue
15 %
Increase
12
PRE-SALES
Industry Leading International Sales Platform
FY 2013 By Geographic Location FY 2013 By Country
Philippines 28%
International 72%
Asia 35%
Europe 11%
Middle East 5%
North America 13%
Others 8%
Philippines 28%

13
UNPARALLELED INTERNATIONAL SALES PLATFORM
AND PRUDENT LAUNCHES
CPG is #3 in terms of value of units sold as of FY 2013
Increased market share through dominant international sales and marketing presence
Launching projects in a staggered manner to prevent build-up of inventory
ALI 43%
MEG 23%
CPG 15%
DMC 13%
SMDC 6%
Source: Colliers International as of FY 2013
Total inventory for FY 2013: 16,872 units
Sold 89%
Unsold 11%

14
193,146
208,000
185,000
190,000
195,000
200,000
205,000
210,000
FY 2012 FY 2013
99,972
115,348
90,000
95,000
100,000
105,000
110,000
115,000
120,000
FY 2012 FY 2013
133,084
166,696
120,000
130,000
140,000
150,000
160,000
170,000
FY 2012 FY 2013
ABILITY TO INCREASE SELLING PRICE DUE TO
PREMIUM PRODUCTS
Luxury (Ave. PSM, Sold) Middle Income (Ave. PSM, Sold)
Affordable (Ave. PSM, Sold)
Note: Reflects pre-sold units pricing on above mentioned time periods

15
COLLECTION SNAPSHOT
Middle Income
Note: Past collection efficiency is not an indication of future collection efficiency.
Payment of Turnover Balances
Affordable
Payment of Turnover Balances
Cash Payment
57%
Bank Financing
42%
In-house Financing
1%
Cash Payment
39%
Bank Financing
58%
In-house Financing
3%

FINANCIAL PERFORMANCE AND CAPITAL MANAGEMENT 3

17
180
866
1,850 1,845
0
500
1,000
1,500
2,000
2010 2011 2012 2013
370
1,353
2,603 2,810
0
500
1,000
1,500
2,000
2,500
3,000
2010 2011 2012 2013
3,072
4,702
9,611
10,809
0
2,000
4,000
6,000
8,000
10,000
12,000
2010 2011 2012 2013
994
1,751
3,962 4,192
0
1,000
2,000
3,000
4,000
5,000
2010 2011 2012 2013
37 42 45 42
SUSTAINED EARNINGS GROWTH MOMENTUM
Key Income Statement Details
Total revenues (Php Million)
Gross profit from real estate development1 (Php Million)
Margin (%)
EBITDA1 (Php Million)
Margin (%)
Profit After Tax (Php Million)
Margin (%) 12 29 27 26 6 18 19 17
(1) With Interest Accretion

18
Amount in
Php Million 2010 2011 2012 2013
Cash and Cash
Equivalents 283 367 902 1,439
Total Assets 7,555 10,033 18,556 26,166
Total
Borrowings 1,226 883 3,661 6,039
Net Debt 943 516 2,759 4,600
Stockholder’s
Equity 2,950 4,322 8,241 11,435
HEALTHY BALANCE SHEET
Debt-to-Equity Ratio Net Debt-to-Equity Ratio
41.6%
20.4%
44.4%
52.8%
0%
10%
20%
30%
40%
50%
60%
2010 2011 2012 2013
32.0%
11.9%
33.5%
40.2%
0.0%
10.0%
20.0%
30.0%
40.0%
50.0%
2010 2011 2012 2013

19
Amount in
Php Million 2010 2011 2012 2013
Cash Flow from
Operations (922) (252) (3,414) (1,586)
Cash Flow from
Investing (109) 325 (863) (1,548)
Cash Flow from
Financing 1,177 11 4,812 3,670
Change in Cash 147 84 535 537
Beginning Cash 136 283 367 902
Ending Cash 283 367 902 1,439
IMPROVING OPERATING CASH FLOW

20
MORE CREDIT FACILITIES, LOWER COST OF DEBT
Approved Credit Facilities (Php Million)
3 3 11 12
Number
Of Banks
Cost of Debt
Weighted Average Interest Rate1
1,695 2,395
6,571
10,645
1,000
3,000
5,000
7,000
9,000
11,000
13,000
2010 2011 2012 Mar-2014
9.5%
8.9%
7.5%
6.1%
5.0%
5.5%
6.0%
6.5%
7.0%
7.5%
8.0%
8.5%
9.0%
9.5%
10.0%
2010 2011 2012 Mar-2014
(1) Based on total credit lines, and interest rate is before hedging costs

21
INCREASING REVENUES FROM PROPERTY
MANAGEMENT
As of Dec. 2013
No. of
projects
GFA
(‘000 sqm)
Residential 21 1,253
Commercial 28 1,302
Total 49 2,555
Asian Development Bank
Makati Medical Center
Pacific Star Building
Globe Telecom Plaza (Cebu, Mandaluyong, Makati)
PNB Building
BPI Buendia Center
One San Miguel Avenue
Largest Independent Property Manager with 49
Buildings Totaling 2.6M sqm under Management
Notable Projects Under Management, with 80%
of contracts with 3rd parties
Total Revenues from Property Management (Php Million)
172 192
222
254
0
50
100
150
200
250
300
2010 2011 2012 2013

PROOF OF CONCEPT 4
23
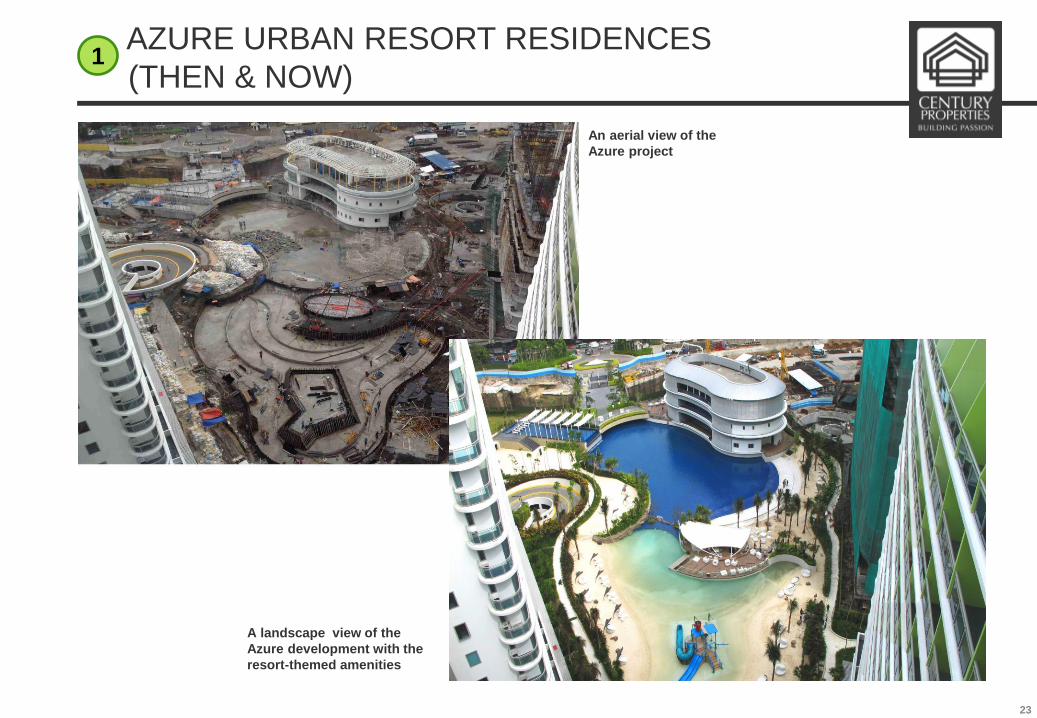
AZURE URBAN RESORT RESIDENCES
(THEN & NOW) 1
A landscape view of the
Azure development with the
resort-themed amenities
An aerial view of the
Azure project

24
AZURE URBAN RESORT RESIDENCES (NOW)
The Paris Beach Club was inaugurated on March 13
1
25
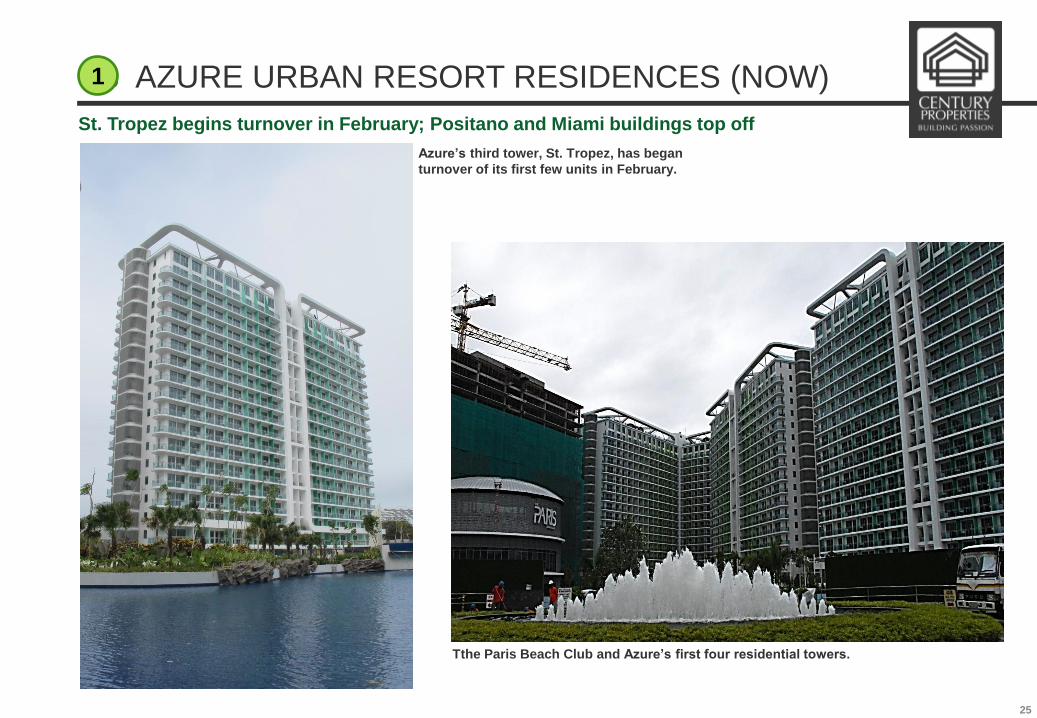
3 AZURE URBAN RESORT RESIDENCES (NOW)
St. Tropez begins turnover in February; Positano and Miami buildings top off
1
Tthe Paris Beach Club and Azure’s first four residential towers.
Azure’s third tower, St. Tropez, has began
turnover of its first few units in February.

26
3 AZURE URBAN RESORT RESIDENCES (NOW)
Miami and Positano towers
1
Positano completed its superstructure
Following structural completion, the Miami and
Positano Towers have moved on to interior
activities.

27
3 AZURE URBAN RESORT RESIDENCES (NOW)
Boracay and Maldives towers
1
The Boracay Tower and Maldives
Tower are undergoing basement
works.

28
ACQUA PRIVATE RESIDENCES (THEN & NOW) 2

29
3 ACQUA PRIVATE RESIDENCES (NOW)
Niagara undergoing finishing works; Sutherland has topped of already
2

30
3 ACQUA PRIVATE RESIDENCES (NOW)
Frameworks and rebar installation for Detifoss tower, while Livingstone is
progressing well in its construction
2

31
3 ACQUA PRIVATE RESIDENCES
The Niagara Tower
2
Ceramic flooring and light
wood kitchen cabinets
have been installed in this
corner unit.
Dark wood finishes
and cream walls are
shown in this unit’s
kitchen area.

32
3 CENTURY CITY (THEN & NOW) 3

33
GRAMERCY (NOW) 3
71 Gramercy dining entrance
71 Gramercy lounge bar
View from 71 Gramercy
34
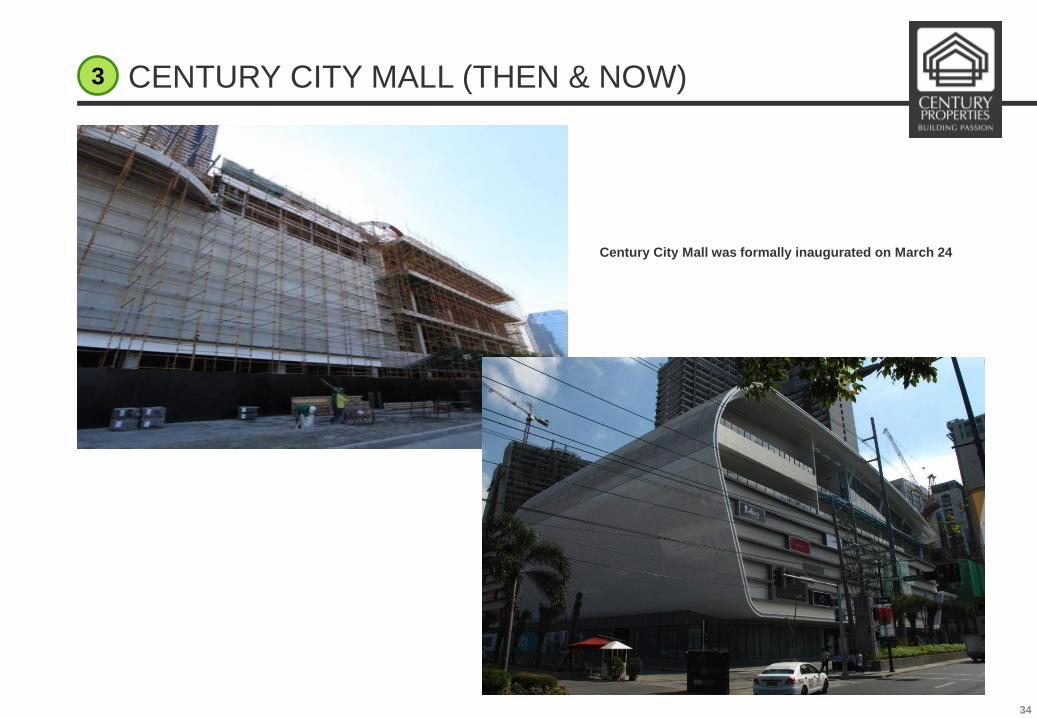
CENTURY CITY MALL (THEN & NOW) 3
Century City Mall was formally inaugurated on March 24

35
CENTURY CITY MALL (NOW) 3

36
CENTURY CITY MALL (NOW) 3
37
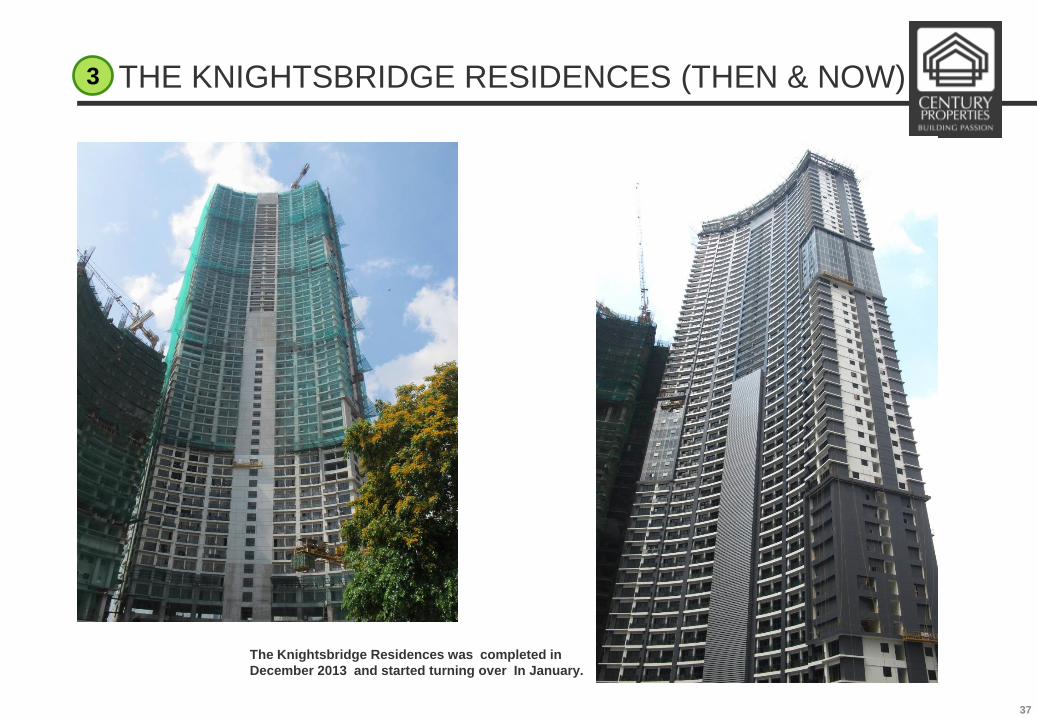
THE KNIGHTSBRIDGE RESIDENCES (THEN & NOW) 3
The Knightsbridge Residences was completed in
December 2013 and started turning over In January.

38
THE KNIGHTSBRIDGE RESIDENCES (NOW) 3

39
CENTURIA MEDICAL MAKATI (THEN & NOW) 3
Centuria Medical Makati continues interior works in preparation for turnover
this year
Century Properties’ IT-medical outpatient facility, moves on
with masonry activities, painting works, and dry wall
partitioning on various levels of the tower.
Centuria Medical Makati is targeted for turnover to clinic
unit owners in 2014.

40
3 MILANO RESIDENCES (THEN & NOW)
Milano Residences is almost complete with its topping off, for completion in
December 2015
3

41
THE RESIDENCES AT COMMONWEALTH (THEN) 4

42
THE RESIDENCES AT COMMONWEALTH (NOW)
Finishing works at the first tower. Second and third towers continue structural
progress
The Osmeña East Tower is currently on 4th
level formworks and rebar installation.
The first tower, Osmeña West (right), is
undergoing exterior painting works.
The second tower, Quezon North (left), is on 6th
floor structural activities.
4

FUTURE PROJECTS 5

44
NEW PROJECT LAUNCH
Earnings Sustainability: New Project Launches in 2014
GFA (sqm, excl parking) Projected
Project Launch Date
Estimated
Completion
For Sale
Residential
For Sale
Commercial
For Lease
Commercial Total (Sqm)
Sales
Revenue
(P Million)
Mall 2011 2013 - - 33,943 33,943 NA
Centuria1 2010 2014 - 37,068 8,035 45,103 NA
Fort2 2013 2016 - - 14,765 14,765 NA
Spire 2013 2018 73,416 - 27,047 100,463 8,400
Subtotal 73,416 37,068 83,790 194,274 8,400
Acqua 63 Q3 2014 2018 29,848 - 10,303 40,151 2,200
Forbes Q3 2014 2018 - 40,496 22,795 63,291 5,500
Pampanga4 Q3 2014 TBD 25,140 - TBD 25,140 1,800
Batulao, Batangas TBD
Subtotal 54,988 40,496 33,098 128,582 9,500
Grand Total 128,404 77,564 116,888 322,856 17,900
Note: For un-launched projects, represents indicative plans and is subject to change
(1) Century is currently evaluating keeping more for leasing income
(2) CPG share: 49%
(3) For lease component represents a condotel product
(4) Represents first phase only

45
NEW PROJECT LAUNCH - FORBES
3

46
NEW PROJECT LAUNCH – ACQUA 6

Q & A 6