Centrifugal Compressor
10
- 792 - A NUMERICAL/EXPERIMENTAL STUDY OF A MULTI-STAGE CENTRIFUGAL COMPRESSOR * Nabil H. Mostafa, Ahmed F. Abdul-gawad, and Mohamed S. Emeara** Mechanical Power Engineering Department, Zagazig University, Egypt. ABSTRACT Both computational and experimental investigations were utilized to study the flow behavior inside the four-stage centrifugal compressor. Computational study was carried out by the commercial code “CFD-RC”. Experimental work was accomplished by the use of a data acquisition system, advanced sensors and “LabView” interface software. Comparisons between computational and experimental outputs were performed. The computational code was validated experimentally and numerically. Compressor map was drawn numerically and experimentally. Surge was unsteadily simulated. Surge predicted at mass flow equal to 0.0093 kg/s for 12,000 rpm with full-domain solution. Using the parallel computational technology, by “HPC” program, is recommended for future work. KEY WORDS: Surge Simulation, Multi-stage, Centrifugal Compressor, Unsteady, full-domain. UNE ETUDE NUMERIQUE / EXPERIMENTALE D'UN COMPRESSEUR MULTI-ETAGE CENTRIFUGE RÉSUMÉ Les deux enquêtes informatiques et expérimentales ont été utilisées pour étudier le comportement de l'écoulement à l'intérieur du compresseur centrifuge en quatre étapes. Étude computationnelle a été réalisée par le code du commerce "CFD-RC". Le travail expérimental a été réalisé par l'utilisation d'un système d'acquisition de données, capteurs et de logiciels avancés "LabView" interface. Les comparaisons entre les sorties numériques et expérimentales ont été effectuées. Le code de calcul a été validé expérimentalement et numériquement. Compresseur carte a été dessinée numériquement et expérimentalement. Surge a été chancelant simulées. Surgé prédit au débit massique égal à 0.0093 kg / s pour 12 000 rpm avec plein de domaine solution. Utilisation de la technologie parallèle de calcul, par «HPC» du programme, est recommandée pour les travaux futurs. MOTS CLÉS: Simulation de surtension, multi-stade, un compresseur centrifuge, instable, plein de domaine. * Received: 21/11/2010, accepted: 22/5/2011 (Original Paper) ** Contact author ([email protected], 0149067505) EIJEST The Egyptian Int. J. of Eng. Sci. and Technology Vol.14, No. 2 (May 2011)
-
Upload
judith-smith -
Category
Documents
-
view
127 -
download
0
description
Centrifugal Compressor
Transcript of Centrifugal Compressor
- 792 -
A NUMERICAL/EXPERIMENTAL STUDY OF A MULTI-STAGE
CENTRIFUGAL COMPRESSOR *
Nabil H. Mostafa, Ahmed F. Abdul-gawad, and Mohamed S. Emeara**
Mechanical Power Engineering Department, Zagazig University, Egypt.
ABSTRACT Both computational and experimental investigations were utilized to study the flow behavior
inside the four-stage centrifugal compressor. Computational study was carried out by the
commercial code “CFD-RC”. Experimental work was accomplished by the use of a data
acquisition system, advanced sensors and “LabView” interface software. Comparisons between
computational and experimental outputs were performed.
The computational code was validated experimentally and numerically. Compressor map was
drawn numerically and experimentally. Surge was unsteadily simulated. Surge predicted at mass
flow equal to 0.0093 kg/s for 12,000 rpm with full-domain solution. Using the parallel
computational technology, by “HPC” program, is recommended for future work.
KEY WORDS: Surge Simulation, Multi-stage, Centrifugal Compressor, Unsteady, full-domain.
UNE ETUDE NUMERIQUE / EXPERIMENTALE D'UN COMPRESSEUR
MULTI-ETAGE CENTRIFUGE
RÉSUMÉ
Les deux enquêtes informatiques et expérimentales ont été utilisées pour étudier le
comportement de l'écoulement à l'intérieur du compresseur centrifuge en quatre étapes. Étude
computationnelle a été réalisée par le code du commerce "CFD-RC". Le travail expérimental a été
réalisé par l'utilisation d'un système d'acquisition de données, capteurs et de logiciels avancés
"LabView" interface. Les comparaisons entre les sorties numériques et expérimentales ont été
effectuées.
Le code de calcul a été validé expérimentalement et numériquement. Compresseur carte a été
dessinée numériquement et expérimentalement. Surge a été chancelant simulées. Surgé prédit au
débit massique égal à 0.0093 kg / s pour 12 000 rpm avec plein de domaine solution. Utilisation
de la technologie parallèle de calcul, par «HPC» du programme, est recommandée pour les
travaux futurs.
MOTS CLÉS: Simulation de surtension, multi-stade, un compresseur centrifuge, instable, plein
de domaine.
* Received: 21/11/2010, accepted: 22/5/2011 (Original Paper)
** Contact author ([email protected], 0149067505)
EIJEST
The Egyptian Int. J. of Eng. Sci. and Technology
Vol.14, No. 2 (May 2011)
- 793 -
Nomenclature
k specific kinetic energy 𝑚2/𝑠2
𝑚 mass flow rate kg/s
P pressure Pa
Greek Letters
𝜖 dissipation rate coefficient 𝑚2/𝑠3
subscripts
1 Inlet to compressor duct
2 Compressor inlet
3 Compressor outlet
c Compressor
1. INTRODUCTION
Centrifugal compressors are identified
as radial turbomachines. This type of
compressor is composed of three main
elements, namely, the rotating part or
impeller, and stationary parts; diffuser and
manifold. An important part up stream of the
impeller is the inducer duct.
Air is sucked into the impeller eye and
whirled round at high speed by the vanes on
the impeller disc. The normal practice is to
design the compressor so that about half the
pressure rise occurs in the impeller and half
in the diffuser, Cohen et al., [1].
Large variations in pressure contours are
not observed when crossing the boundary
between the two major components, but
noticeable gradients are present at the
diffuser outlet because of the sudden
increase in width at the volute inlet. Still
heavier distortions in the pressure are
present at the volute tongue because of the
large incidence, creating a separation like
flow on the suction side of the tongue,
Rangwala, [5].
1.1. Previous Work
Niazi et. al., [4] employed a sector-
domain (or passage) between two successive
blades) in the impeller for numerical
calculations for the flow in an impeller of
single-stage centrifugal compressor. He
generated a grid of 400,000 nodes; next he
increased the number of nodes till 1.8
million nodes in a mesh sensitivity analysis.
Code validation with achieved via
comparison with experimental data. He was
able to simulate surge and studied surge
control by air-injection. He also examined
other parameters such as velocity and total
pressure.
Tijl, [7] studied experimentally surge
avoidance. Transient simulation of flow
parameters was accomplished. He obtained a
qualitative evaluation of the behavior of the
modeled compressor.
Xu and Muller, [8] presented a detailed
flow simulation in the volute of a single-
stage centrifugal compressor. Their
computational domain had 782,000 nodes.
The “Frozen-rotor” method is used at
interfaces between rotating and stationary
elements. They considered a full-domain
flow study and plotted the pressure
distribution of the volute.
Yutaka et al., [10] carried out a
numerical and experimental study of the
centrifugal-compressor noise affected by the
flow in the tapered diffuser. Experimentally,
they presented advanced experimental set-
up. Numerically, 3D steady model was used
to simulate flow. The numerical model
utilized a full-domain mesh (single-stage)
and a sliding mesh method.
Ling et al., [2] simulated a small
centrifugal compressor undertaken at the
MPG and KJ66 gas turbine design. They
studied improving the efficiency of the
compressor by increasing the impeller
diameter from 66 mm to 71 mm. They found
that the performance of the new design is
better than the old one within a certain
operating ranges.
Abbreviations
3D three dimension
A/D analog to digital
CFD-RC Computational Fluid Dynamics
Research Cooperation, name of a
commercial code
FFT fast Fourier transformation
InstaCall install and calibrate
MPG Micro Propulsion Group
NPT negative pressure transducer
PPT positive pressure transducer
rpm revolutions per minute
UDM uniform design method
A NUMERICAL/EXPERIMENTAL STUDY OF A MULTI-STAGE CENTRIFUGAL COMPRESSOR
Mostafa, Abdul-gawad, and Emeara
- 794 -
Xinwei et al., [9] An efficient
optimization approach to centrifugal
impeller blades is developed and applied to
the design of a 3D impeller using; UDM,
CFD, regression analysis method, and
genetic algorithm. Global optimization of
the approximate function is obtained by
genetic algorithms. Taking maximum
isentropic efficiency as objective function,
this optimization approach has been applied
to the optimum design of a certain
centrifugal compressor blades. The results,
compared with those of the original one,
show that isentropic efficiency of the
optimized impeller has been improved
which indicates the effectiveness of the
proposed optimization approach such as
CFD, structural dynamics, and thermal
analysis combined with the emergence of
improved optimization algorithms makes it
possible to perform blade shape automatic
optimization process.
Tang et al., [6] studied numerically a 3D
impeller and vaneless diffuser of a small
centrifugal compressor. The influence of
impeller tip clearance on the flow field of
the impeller was investigated. Then, a new
partially shrouded impeller was designed.
They used a sector-domain and 110,000 grid
points. Numerical results show that the
secondary flow region becomes smaller at
the exit of the impeller. Better performance
is achieved in comparison with the un-
shrouded impeller.
The previous works supported the
present research as will be mentioned.
Comparison between these works is
performed in Table 1.
Table 1 Comparison between some previous works.
Xu Stein Yutaka
solution dim. 3D 3D 3D
CFD domain full sector full
stages no. single single single
no. of nodes 782,000 400,000 1,425,000
rotating model Frozen-rotor no rotation Sliding-mesh
1.2. Compressor Surge
Surge is an axisymmetrical oscillation of
the flow through the compressor, and is
characterized by a limit cycle in the
compressor characteristic. An example of
such characteristic is shown as S-shape
curve. The characteristic shows the pressure
rise over the compressor as a function of the
mass flow rate. The surge severity can be
classified in two levels: mild and deep surge
Mostafa, [3].
1.3. Case Study
A four-stage centrifugal compressor was
used. The compressor design point is at
12,000 rpm, 0.022 kg/s, and 1.25 static
pressure ratio. The compressor is
manufactured by Armfeild Company and its
serial number is C1-MKII. Experimental
work was done in Measurements Lab.,
Mechanical Power Dept., Faculty of
Engineering, Zagazig University.
2. NUMERICAL ANALYSIS
In the numerical simulation, a 3D steady
and un-steady flow field is calculated.
Steady flow was in order to draw a
numerical compressor map. Un-steady was
in order to investigate the surge. “CFD-RC”
code is used in CFD study.
2.1. Governing Equations
The simulations are carried out by
solving governing equations of a continuity
equation, a 3D unsteady compressible
Navier-Stokes equation, an energy equation
and an equation of the state of an ideal gas.
The 𝑘 − 𝜖 turbulence model was used in the
simulation.
Continuity equation:
0)(
i
i
Vxt
(1)
where:
iV : the velocity in the thi direction
ix : the coordinate in the thi
direction : is the air density.
i : a tensor indicating 1, 2, 3.
Eijest, Vol. 14, No. 2
- 795 -
3D Navier-stokes equation:
j
ij
i
ji
j
i
xx
pVV
xt
V
)(
)( (2)
where p is the static pressure, and ij is the viscous
stress tensor given by
𝜏𝑖𝑗 = 𝜇 𝜕𝑉𝑖
𝜕𝑥𝑗+
𝜕𝑉𝑗
𝜕𝑥𝑖−
2
3
𝜕𝑉𝑙
𝜕𝑥𝑙 (3)
where; : is the absolute viscosity.
lji ,, : are tensor indices indicating
1, 2, 3.
Energy equation:
hiji
j
ij
ii
i
i
VJhx
TK
xpEV
xt
E
)()(
)(
(4)
where;
E : is the total energy of the air.
K : is the air thermal conductivity.
iJ :
is the diffusion flux of thj species in the
thi direction.
Turbulence model Equations:
1- Equation of turbulence energy (k): 𝜕
𝜕𝑡 𝜌𝑘 +
𝜕
𝜕𝑥𝑖
𝜌𝑘𝑢𝑖 =𝜕
𝜕𝑥𝑗 𝜇 +
𝜇𝑡
𝜎𝑘
𝜕𝑘
𝜕𝑥𝑗 − 𝜌𝜖 (5)
2- Equation of rate of dissipation of
turbulence kinetic energy (𝜖): 𝜕
𝜕𝑡 𝜌𝜖 +
𝜕
𝜕𝑥𝑖
𝜌𝜖𝑢𝑖 =𝜕
𝜕𝑥𝑗
𝜇 +𝜇𝑡
𝜎𝜖
𝜕𝜖
𝜕𝑥𝑗
+ 𝐶1𝜖
𝜖
𝑘𝐶3𝜖 − 𝐶2𝜖
𝜖2
𝑘 (6)
The model constants 𝐶1𝜖 , 𝐶2𝜖 ,
𝐶𝜇 , 𝜎𝑘 , and 𝜎𝜖have the following default values:
𝐶1𝜖 = 1.44, 𝐶2𝜖 = 1.92, 𝐶𝜇 = 0.09, 𝜎𝑘 =
1.0, and 𝜎𝜖 = 1.3.
2.2. Computational Settings
The computational grid used in the
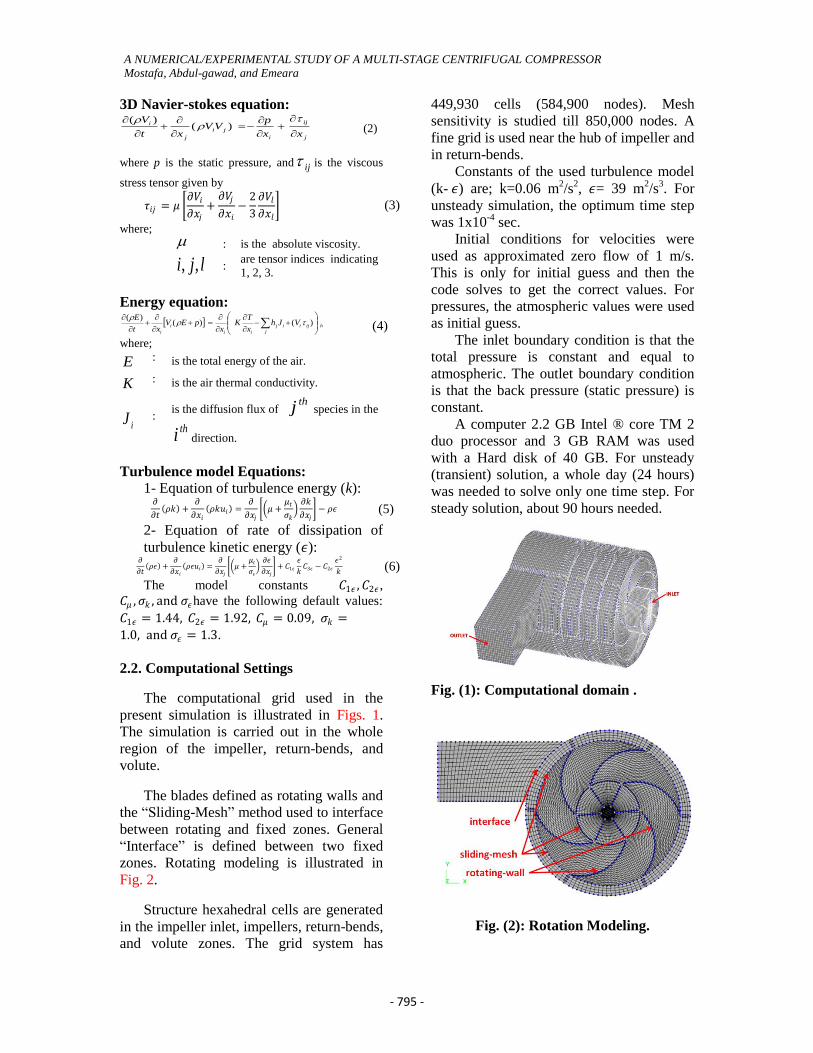
present simulation is illustrated in Figs. 1. The simulation is carried out in the whole
region of the impeller, return-bends, and
volute.
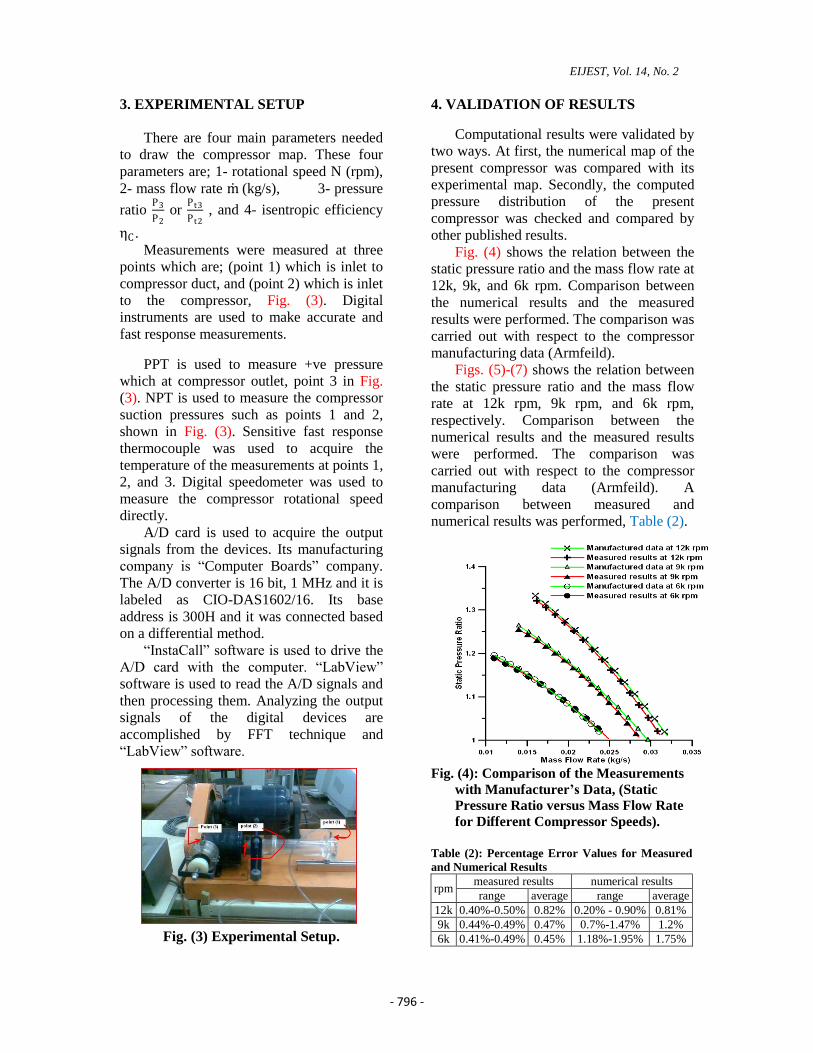
The blades defined as rotating walls and
the “Sliding-Mesh” method used to interface
between rotating and fixed zones. General
“Interface” is defined between two fixed
zones. Rotating modeling is illustrated in
Fig. 2.
Structure hexahedral cells are generated
in the impeller inlet, impellers, return-bends,
and volute zones. The grid system has
449,930 cells (584,900 nodes). Mesh
sensitivity is studied till 850,000 nodes. A
fine grid is used near the hub of impeller and
in return-bends.
Constants of the used turbulence model
(k- 𝜖) are; k=0.06 m2/s
2, 𝜖= 39 m
2/s
3. For
unsteady simulation, the optimum time step
was 1x10⁻⁴
sec.
Initial conditions for velocities were
used as approximated zero flow of 1 m/s.
This is only for initial guess and then the
code solves to get the correct values. For
pressures, the atmospheric values were used
as initial guess.
The inlet boundary condition is that the
total pressure is constant and equal to
atmospheric. The outlet boundary condition
is that the back pressure (static pressure) is
constant.
A computer 2.2 GB Intel ® core TM 2
duo processor and 3 GB RAM was used
with a Hard disk of 40 GB. For unsteady
(transient) solution, a whole day (24 hours)
was needed to solve only one time step. For
steady solution, about 90 hours needed.
Fig. (1): Computational domain .
Fig. (2): Rotation Modeling.
A NUMERICAL/EXPERIMENTAL STUDY OF A MULTI-STAGE CENTRIFUGAL COMPRESSOR
Mostafa, Abdul-gawad, and Emeara
- 796 -
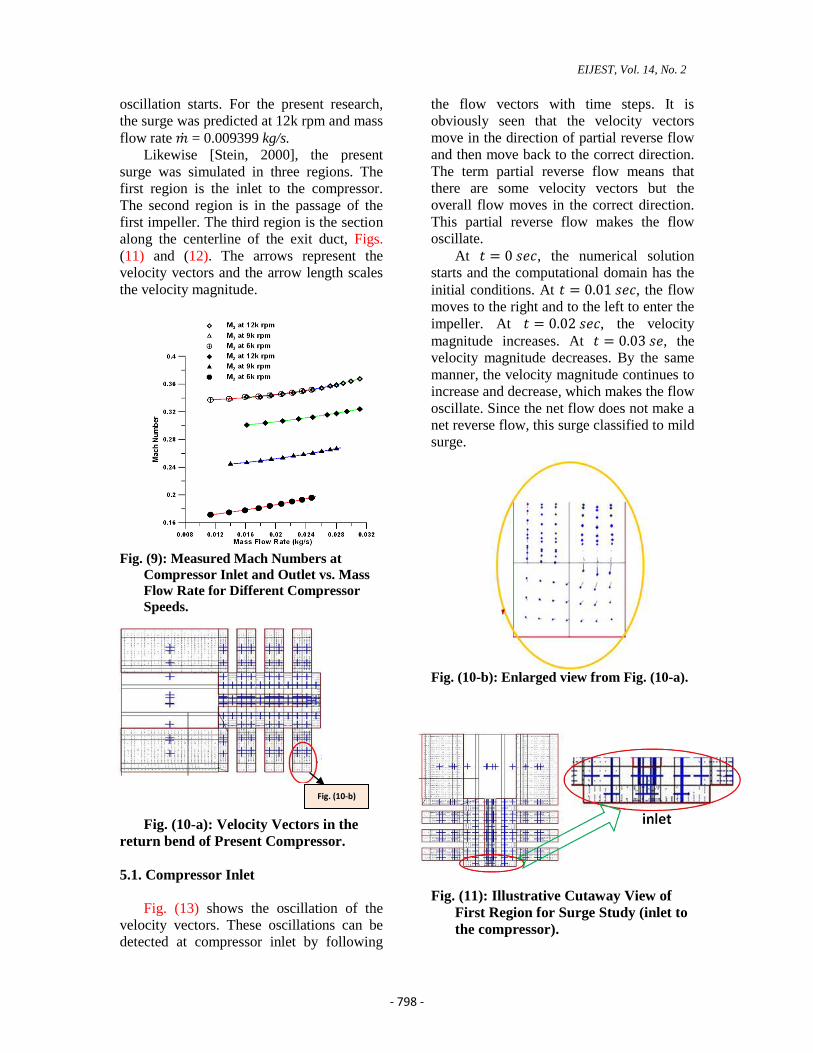
3. EXPERIMENTAL SETUP
There are four main parameters needed
to draw the compressor map. These four
parameters are; 1- rotational speed N (rpm),
2- mass flow rate m (kg/s), 3- pressure
ratio P3
P2 or
Pt3
Pt2 , and 4- isentropic efficiency
ηC .
Measurements were measured at three
points which are; (point 1) which is inlet to
compressor duct, and (point 2) which is inlet
to the compressor, Fig. (3). Digital
instruments are used to make accurate and
fast response measurements.
PPT is used to measure +ve pressure
which at compressor outlet, point 3 in Fig.
(3). NPT is used to measure the compressor
suction pressures such as points 1 and 2,
shown in Fig. (3). Sensitive fast response
thermocouple was used to acquire the
temperature of the measurements at points 1,
2, and 3. Digital speedometer was used to
measure the compressor rotational speed
directly.
A/D card is used to acquire the output
signals from the devices. Its manufacturing
company is “Computer Boards” company.
The A/D converter is 16 bit, 1 MHz and it is
labeled as CIO-DAS1602/16. Its base
address is 300H and it was connected based
on a differential method.
“InstaCall” software is used to drive the
A/D card with the computer. “LabView”
software is used to read the A/D signals and
then processing them. Analyzing the output
signals of the digital devices are
accomplished by FFT technique and
“LabView” software.
Fig. (3) Experimental Setup.
4. VALIDATION OF RESULTS
Computational results were validated by
two ways. At first, the numerical map of the
present compressor was compared with its
experimental map. Secondly, the computed
pressure distribution of the present
compressor was checked and compared by
other published results.
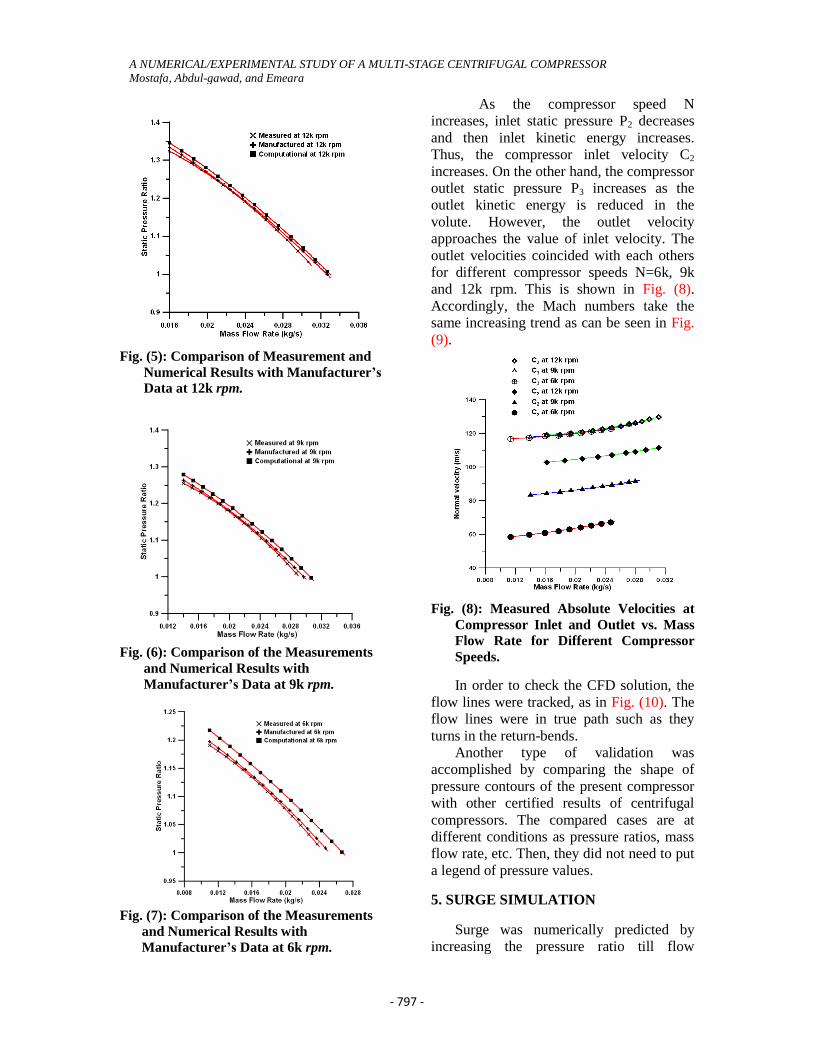
Fig. (4) shows the relation between the
static pressure ratio and the mass flow rate at
12k, 9k, and 6k rpm. Comparison between
the numerical results and the measured
results were performed. The comparison was
carried out with respect to the compressor
manufacturing data (Armfeild).
Figs. (5)-(7) shows the relation between
the static pressure ratio and the mass flow
rate at 12k rpm, 9k rpm, and 6k rpm,
respectively. Comparison between the
numerical results and the measured results
were performed. The comparison was
carried out with respect to the compressor
manufacturing data (Armfeild). A
comparison between measured and
numerical results was performed, Table (2).
Fig. (4): Comparison of the Measurements
with Manufacturer’s Data, (Static
Pressure Ratio versus Mass Flow Rate
for Different Compressor Speeds).
Table (2): Percentage Error Values for Measured
and Numerical Results
rpm measured results numerical results
range average range average
12k 0.40%-0.50% 0.82% 0.20% - 0.90% 0.81%
9k 0.44%-0.49% 0.47% 0.7%-1.47% 1.2%
6k 0.41%-0.49% 0.45% 1.18%-1.95% 1.75%
EIJEST, Vol. 14, No. 2
- 797 -
Fig. (5): Comparison of Measurement and
Numerical Results with Manufacturer’s
Data at 12k rpm.
Fig. (6): Comparison of the Measurements
and Numerical Results with
Manufacturer’s Data at 9k rpm.
Fig. (7): Comparison of the Measurements
and Numerical Results with
Manufacturer’s Data at 6k rpm.
As the compressor speed N
increases, inlet static pressure P2 decreases
and then inlet kinetic energy increases.
Thus, the compressor inlet velocity C2
increases. On the other hand, the compressor
outlet static pressure P3 increases as the
outlet kinetic energy is reduced in the
volute. However, the outlet velocity
approaches the value of inlet velocity. The
outlet velocities coincided with each others
for different compressor speeds N=6k, 9k
and 12k rpm. This is shown in Fig. (8).
Accordingly, the Mach numbers take the
same increasing trend as can be seen in Fig.
(9).
Fig. (8): Measured Absolute Velocities at
Compressor Inlet and Outlet vs. Mass
Flow Rate for Different Compressor
Speeds.
In order to check the CFD solution, the
flow lines were tracked, as in Fig. (10). The
flow lines were in true path such as they
turns in the return-bends.
Another type of validation was
accomplished by comparing the shape of
pressure contours of the present compressor
with other certified results of centrifugal
compressors. The compared cases are at
different conditions as pressure ratios, mass
flow rate, etc. Then, they did not need to put
a legend of pressure values.
5. SURGE SIMULATION
Surge was numerically predicted by
increasing the pressure ratio till flow
A NUMERICAL/EXPERIMENTAL STUDY OF A MULTI-STAGE CENTRIFUGAL COMPRESSOR
Mostafa, Abdul-gawad, and Emeara
- 798 -
oscillation starts. For the present research,
the surge was predicted at 12k rpm and mass
flow rate 𝑚 = 0.009399 kg/s.
Likewise [Stein, 2000], the present
surge was simulated in three regions. The
first region is the inlet to the compressor.
The second region is in the passage of the
first impeller. The third region is the section
along the centerline of the exit duct, Figs.
(11) and (12). The arrows represent the
velocity vectors and the arrow length scales
the velocity magnitude.
Fig. (9): Measured Mach Numbers at
Compressor Inlet and Outlet vs. Mass
Flow Rate for Different Compressor
Speeds.
Fig. (10-a): Velocity Vectors in the
return bend of Present Compressor.
5.1. Compressor Inlet
Fig. (13) shows the oscillation of the
velocity vectors. These oscillations can be
detected at compressor inlet by following
the flow vectors with time steps. It is
obviously seen that the velocity vectors
move in the direction of partial reverse flow
and then move back to the correct direction.
The term partial reverse flow means that
there are some velocity vectors but the
overall flow moves in the correct direction.
This partial reverse flow makes the flow
oscillate.
At 𝑡 = 0 𝑠𝑒𝑐, the numerical solution
starts and the computational domain has the
initial conditions. At 𝑡 = 0.01 𝑠𝑒𝑐, the flow
moves to the right and to the left to enter the
impeller. At 𝑡 = 0.02 𝑠𝑒𝑐, the velocity
magnitude increases. At 𝑡 = 0.03 𝑠𝑒, the
velocity magnitude decreases. By the same
manner, the velocity magnitude continues to
increase and decrease, which makes the flow
oscillate. Since the net flow does not make a
net reverse flow, this surge classified to mild
surge.
Fig. (10-b): Enlarged view from Fig. (10-a).
Fig. (11): Illustrative Cutaway View of
First Region for Surge Study (inlet to
the compressor).
Fig. (10-b)
EIJEST, Vol. 14, No. 2
- 799 -
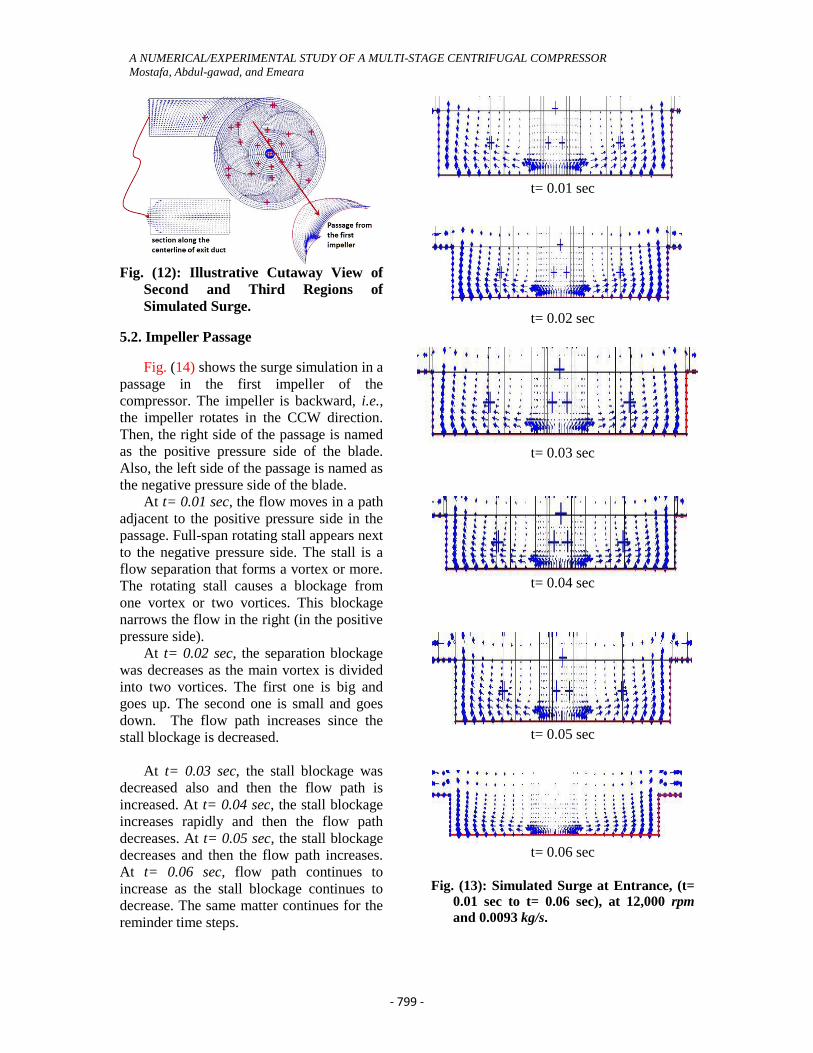
Fig. (12): Illustrative Cutaway View of
Second and Third Regions of
Simulated Surge.
5.2. Impeller Passage
Fig. (14) shows the surge simulation in a
passage in the first impeller of the
compressor. The impeller is backward, i.e.,
the impeller rotates in the CCW direction.
Then, the right side of the passage is named
as the positive pressure side of the blade.
Also, the left side of the passage is named as
the negative pressure side of the blade.
At t= 0.01 sec, the flow moves in a path
adjacent to the positive pressure side in the
passage. Full-span rotating stall appears next
to the negative pressure side. The stall is a
flow separation that forms a vortex or more.
The rotating stall causes a blockage from
one vortex or two vortices. This blockage
narrows the flow in the right (in the positive
pressure side).
At t= 0.02 sec, the separation blockage
was decreases as the main vortex is divided
into two vortices. The first one is big and
goes up. The second one is small and goes
down. The flow path increases since the
stall blockage is decreased.
At t= 0.03 sec, the stall blockage was
decreased also and then the flow path is
increased. At t= 0.04 sec, the stall blockage
increases rapidly and then the flow path
decreases. At t= 0.05 sec, the stall blockage
decreases and then the flow path increases.
At t= 0.06 sec, flow path continues to
increase as the stall blockage continues to
decrease. The same matter continues for the
reminder time steps.
t= 0.01 sec
t= 0.02 sec
t= 0.03 sec
t= 0.04 sec
t= 0.05 sec
t= 0.06 sec
Fig. (13): Simulated Surge at Entrance, (t=
0.01 sec to t= 0.06 sec), at 12,000 rpm
and 0.0093 kg/s.
A NUMERICAL/EXPERIMENTAL STUDY OF A MULTI-STAGE CENTRIFUGAL COMPRESSOR
Mostafa, Abdul-gawad, and Emeara
- 800 -
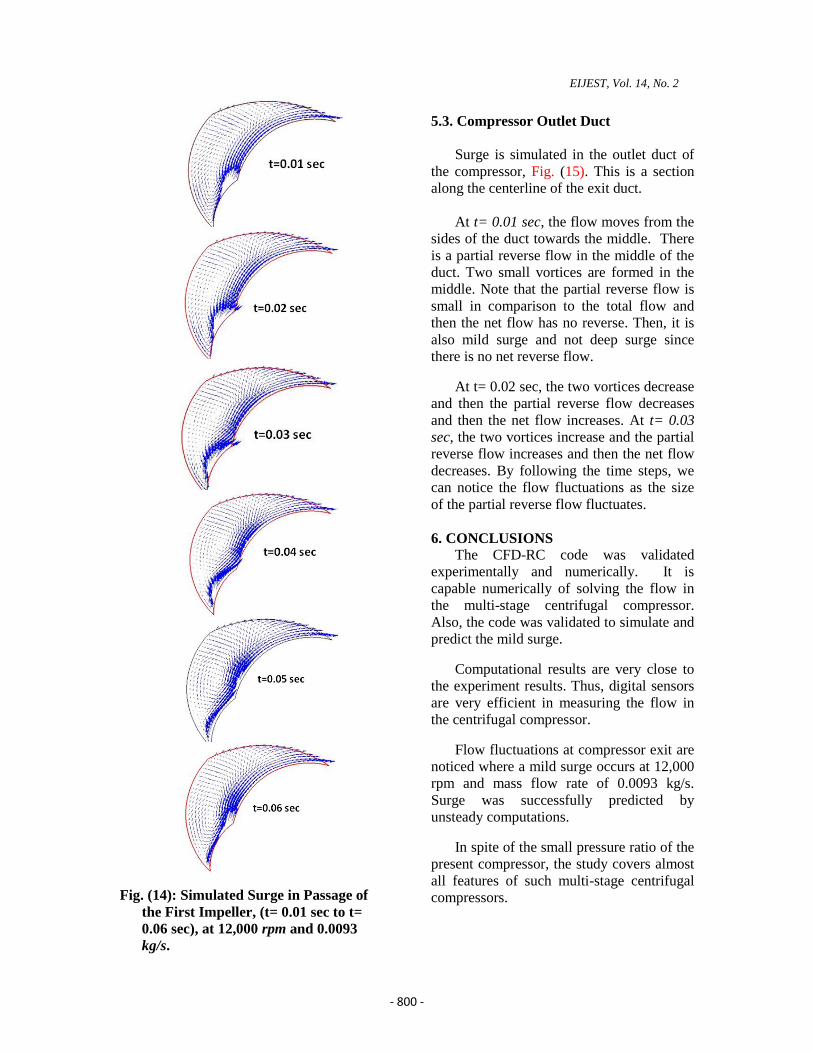
Fig. (14): Simulated Surge in Passage of
the First Impeller, (t= 0.01 sec to t=
0.06 sec), at 12,000 rpm and 0.0093
kg/s.
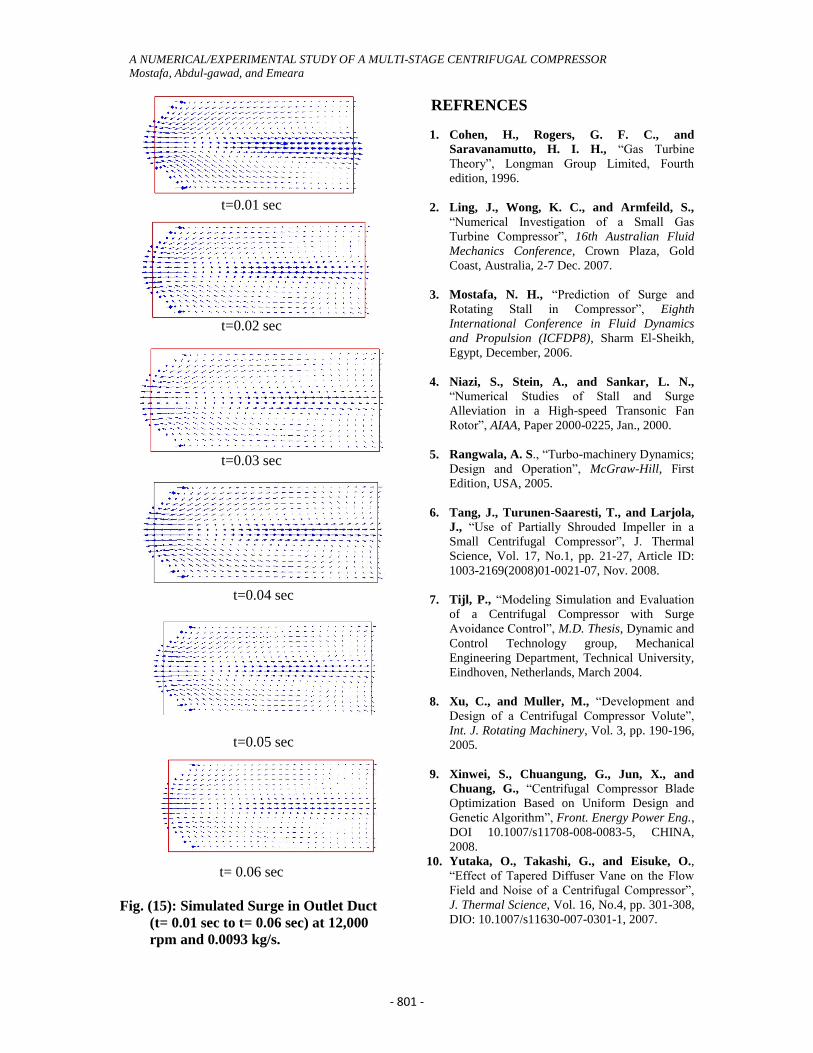
5.3. Compressor Outlet Duct
Surge is simulated in the outlet duct of
the compressor, Fig. (15). This is a section
along the centerline of the exit duct.
At t= 0.01 sec, the flow moves from the
sides of the duct towards the middle. There
is a partial reverse flow in the middle of the
duct. Two small vortices are formed in the
middle. Note that the partial reverse flow is
small in comparison to the total flow and
then the net flow has no reverse. Then, it is
also mild surge and not deep surge since
there is no net reverse flow.
At t= 0.02 sec, the two vortices decrease
and then the partial reverse flow decreases
and then the net flow increases. At t= 0.03
sec, the two vortices increase and the partial
reverse flow increases and then the net flow
decreases. By following the time steps, we
can notice the flow fluctuations as the size
of the partial reverse flow fluctuates.
6. CONCLUSIONS
The CFD-RC code was validated
experimentally and numerically. It is
capable numerically of solving the flow in
the multi-stage centrifugal compressor.
Also, the code was validated to simulate and
predict the mild surge.
Computational results are very close to
the experiment results. Thus, digital sensors
are very efficient in measuring the flow in
the centrifugal compressor.
Flow fluctuations at compressor exit are
noticed where a mild surge occurs at 12,000
rpm and mass flow rate of 0.0093 kg/s.
Surge was successfully predicted by
unsteady computations.
In spite of the small pressure ratio of the
present compressor, the study covers almost
all features of such multi-stage centrifugal
compressors.
EIJEST, Vol. 14, No. 2
- 801 -
t=0.01 sec
t=0.02 sec
t=0.03 sec
t=0.04 sec
t=0.05 sec
t= 0.06 sec
Fig. (15): Simulated Surge in Outlet Duct
(t= 0.01 sec to t= 0.06 sec) at 12,000
rpm and 0.0093 kg/s.
REFRENCES
1. Cohen, H., Rogers, G. F. C., and
Saravanamutto, H. I. H., “Gas Turbine
Theory”, Longman Group Limited, Fourth
edition, 1996.
2. Ling, J., Wong, K. C., and Armfeild, S.,
“Numerical Investigation of a Small Gas
Turbine Compressor”, 16th Australian Fluid
Mechanics Conference, Crown Plaza, Gold
Coast, Australia, 2-7 Dec. 2007.
3. Mostafa, N. H., “Prediction of Surge and
Rotating Stall in Compressor”, Eighth
International Conference in Fluid Dynamics
and Propulsion (ICFDP8), Sharm El-Sheikh,
Egypt, December, 2006.
4. Niazi, S., Stein, A., and Sankar, L. N.,
“Numerical Studies of Stall and Surge
Alleviation in a High-speed Transonic Fan
Rotor”, AIAA, Paper 2000-0225, Jan., 2000.
5. Rangwala, A. S., “Turbo-machinery Dynamics;
Design and Operation”, McGraw-Hill, First
Edition, USA, 2005.
6. Tang, J., Turunen-Saaresti, T., and Larjola,
J., “Use of Partially Shrouded Impeller in a
Small Centrifugal Compressor”, J. Thermal
Science, Vol. 17, No.1, pp. 21-27, Article ID:
1003-2169(2008)01-0021-07, Nov. 2008.
7. Tijl, P., “Modeling Simulation and Evaluation
of a Centrifugal Compressor with Surge
Avoidance Control”, M.D. Thesis, Dynamic and
Control Technology group, Mechanical
Engineering Department, Technical University,
Eindhoven, Netherlands, March 2004.
8. Xu, C., and Muller, M., “Development and
Design of a Centrifugal Compressor Volute”,
Int. J. Rotating Machinery, Vol. 3, pp. 190-196,
2005.
9. Xinwei, S., Chuangung, G., Jun, X., and
Chuang, G., “Centrifugal Compressor Blade
Optimization Based on Uniform Design and
Genetic Algorithm”, Front. Energy Power Eng.,
DOI 10.1007/s11708-008-0083-5, CHINA,
2008.
10. Yutaka, O., Takashi, G., and Eisuke, O.,
“Effect of Tapered Diffuser Vane on the Flow
Field and Noise of a Centrifugal Compressor”,
J. Thermal Science, Vol. 16, No.4, pp. 301-308,
DIO: 10.1007/s11630-007-0301-1, 2007.
A NUMERICAL/EXPERIMENTAL STUDY OF A MULTI-STAGE CENTRIFUGAL COMPRESSOR
Mostafa, Abdul-gawad, and Emeara