CENTRE NATIONAL D'ETUDES SPATIALES SATCOM FOR ATM
108
RESTRICTED TO SATCOM FOR ATM CNES TOULOUSE (CST) : 18 av. E.Belin 31401 TOULOUSE Cedex 9 CENTRE NATIONAL D'ETUDES SPATIALES SATCOM FOR ATM DCT RF ST EPSC (UPC) Change : Date : 22/07/2009 Issue : Date : 22/07/2009 Ref. : TFC report Distribution Code : STAGE FINAL REPORT ESTIMATION OF CAPACITY REQUIRED FOR AMS(R)S COMMUNICATIONS AROUND 2020 OVER EUROPEAN AREA Written by : CASQUERO-ROVIRA, Albert Date : 22/07/09 Approved by : PRATS MENENDEZ, Xavier GONZALEZ PEREZ, Hugo Date : 22/07/09 For application : Date :
Transcript of CENTRE NATIONAL D'ETUDES SPATIALES SATCOM FOR ATM

RESTRICTED TO SATCOM FOR ATM
CNES TOULOUSE (CST) : 18 av. E.Belin 31401 TOULOUSE Cedex 9
CENTRE NATIONAL D'ETUDES SPATIALES SATCOM FOR ATM
DCT RF ST EPSC (UPC)
Change : Date : 22/07/2009 Issue : Date : 22/07/2009 Ref. : TFC report Distribution Code :
STAGE FINAL REPORT
ESTIMATION OF CAPACITY REQUIRED FOR AMS(R)S COMMUNICATIONS AROUND 2020 OVER EUROPEAN AREA
Written by : CASQUERO-ROVIRA, Albert Date : 22/07/09
Approved by : PRATS MENENDEZ, Xavier GONZALEZ PEREZ, Hugo
Date : 22/07/09
For application :
Date :

Centre National d'Etudes Spatiales EPSC (UPC)
SATCOM for ATM Issue : Date : 22/07/2009
Rev. : Date : 22/07/2009
Reference : TFC report Page : 1

Centre National d'Etudes Spatiales EPSC (UPC)
SATCOM for ATM Issue : Date : 22/07/2009
Rev. : Date : 22/07/2009
Reference : TFC report Page : 2
TABLE OF CONTENTS
RESUM ...................................................................................................................... 6
OVERVIEW ............................................................................................................... 8
ACKNOWLEDGEMENTS ....................................................................................... 10
GLOSSARY ............................................................................................................. 12
REFERENCE DOCUMENTS .................................................................................. 16
ENVIRONMENT OF THE INTERNSHIP ................................................................. 18
CNES ........................................................................................................................... 18
TOULOUSE SPACE CENTRE (CST) .................................................................. 18
The CNES department proposing the training ................................................. 19
1. INTRODUCTION ......................................................................................... 20
1.1. FUTURE ATM OPERATIONAL CONCEPT ................................................... 20
1.2. EVOLUTION OF MOBILE COMMUNICATIONS FOR ATM .......................... 21
1.3. FUTURE AERONAUTICAL COMMUNICATIONS INFRASTRUCTURE ....... 22
1.4. SATELLITE COMMUNICATIONS FOR ATM ................................................ 24
2. STATE OF THE ART .................................................................................. 26
3. ESTIMATION OF CAPACITY REQUIRED FOR AMS(R)S COMMUNICATIONS AROUND 2020 OVER EUROPEAN AREA ......................... 28
3.1. INTRODUCTION ............................................................................................ 28
3.2. MODELING POLICY ...................................................................................... 28
3.2.1. One single aircraft model ..................................................................... 29
3.2.1.1. ATM Communications profile ........................................................ 29
3.2.1.2. Message generation methods: Pseudo-deterministic, Poisson Law and Exponential inter-arrival time ............................................................ 30
3.2.1.3. Experimental results for one single aircraft ................................... 31
Centre National d'Etudes Spatiales EPSC (UPC)
SATCOM for ATM Issue : Date : 22/07/2009
Rev. : Date : 22/07/2009
Reference : TFC report Page : 3
3.2.2. Estimation of capacity required for AMS(R)S communications around 2020 over European Area ..................................................................... 42
3.2.2.1. Simulation profile ........................................................................... 42
3.2.2.2. Pseudo-deterministic method results ............................................ 45
3.2.2.3. Exponential inter-arrival time method results ................................ 52
3.2.2.4. Validation Tests ............................................................................. 54
3.2.2.5. ESA’s European Area Test ........................................................... 55
3.2.2.6. Type of aircraft .............................................................................. 55
3.2.2.7. Sectorization contribution .............................................................. 58
4. COMMUNICATIONS PROTOCOL ASSESSMENT ................................... 60
4.1. ACKNOWLEDGEMENT IMPLEMENTATION ............................................... 60
4.2. DESCRIPTION OF GMR1 STANDARD ......................................................... 61
4.2.1. Introduction to GMR1 ........................................................................... 61
4.2.2. From GSM to GMR1 .............................................................................. 61
4.2.3. GMR1 Description ................................................................................ 62
4.3. GMR-1 SIMULATOR ANALYSIS ................................................................... 65
4.3.1. Comparison between SSP simulator results obtained by Astrium and SSP simulator results obtained with CNES traffic profile for different input configurations ........................................................................................... 66
4.3.2. Modification of PDCH number of carriers and results evaluation .... 70
4.3.3. Conclusions .......................................................................................... 70
5. ECONOMICAL VIABILITY FOR SATELLITE SYSTEMS PROVIDINGSAFETY AERONAUTICAL COMMUNICATIONS .............................. 72
5.1. SATELLITE SOLUTIONS FOR SAFETY AERONAUTICAL COMMUNICATIONS ................................................................................................... 72
5.2. MARKET STRUCTURE AND SERVICE PROVISION ................................... 73
5.3. BUSINESS CASE FOR THE SATELLITE OPERATOR ................................ 74
5.3.1. The selected business scenarios ........................................................ 74

Centre National d'Etudes Spatiales EPSC (UPC)
SATCOM for ATM Issue : Date : 22/07/2009
Rev. : Date : 22/07/2009
Reference : TFC report Page : 4
5.3.2. Cost and revenue profiles .................................................................... 75
5.3.3. A PPP to operate the satellite communication service ..................... 76
5.4. CONCLUSIONS ............................................................................................. 77
6. CONCLUSIONS AND WAY FORWARD .................................................... 78
PERSONAL EVALUATION ........................................................................................ 78
ANNEX A: SIMULATION RESULTS OBTAINED .................................................. 82
VALIDATION OF RESULTS WITHOUT TAKING INTO ACCOUNT TYPE OF AIRCRAFT .................................................................................................................. 82
RESULTS SORTED BY PRIORITY ............................................................................ 85
DIFFERENT ATSC/AOC SERVICES’ RESULTS ....................................................... 90
RESULTS FOR 80% TYPE II AIRCRAFT ................................................................... 95
ANNEX B: SAMPLE OF RESULT FILES OBTAINED BY SIMULATOR .............. 98
DETAILED ACCESS FILE .......................................................................................... 98
DETAILED CAPACITY FILE ....................................................................................... 98
ANNEX C: SSP SIMULATOR OUTPUTS ............................................................ 100
CNES RESULTS FOR PNB 2-6 HALF DUPLEX CONFIGURATION WITH 44-68 CARRIERS ................................................................................................................ 100
CNES RESULTS FOR PNB 4-3 FULL DUPLEX CONFIGURATION WITH 44-68 CARRIERS ................................................................................................................ 104

Centre National d'Etudes Spatiales EPSC (UPC)
SATCOM for ATM Issue : Date : 22/07/2009
Rev. : Date : 22/07/2009
Reference : TFC report Page : 5

Centre National d'Etudes Spatiales EPSC (UPC)
SATCOM for ATM Issue : Date : 22/07/2009
Rev. : Date : 22/07/2009
Reference : TFC report Page : 6
RESUM
En els propers anys es preveu un important creixement en el nombre de moviments de tràfic aeri, amb la qual cosa, seran necessaris nous sistemes de comunicació. El primer pas en la fase de disseny d’un sistema de comunicació és la definició de les seves necessitats. Degut a les necessitats operacionals i, d’acord amb el programa SESAR (Single European Sky ATM Research), l’arquitectura del sistema de comunicacions aeronàutiques segures estarà composat probablement per dos sistemes (un terrestre i un satèl·lit). Els sistemes d’avui en dia estan basats en tecnologies cel·lulars per tant, no es disposa d’informació pel disseny d’un sistema de comunicacions satèl·lit.
L’objectiu del projecte és desenvolupar una metodologia, independent de la tecnologia utilitzada, per avaluar el perfil de les comunicacions aeronàutiques segures d’acord amb la informació de que es disposa actualment sobre les futures comunicacions aire-terra. L’estudi pretén ser un punt de partida per una possible tesi doctoral. Aquesta tesi es pot enfocar des de dos punts de vista, o ambdós:
1) Desenvolupar un model per tal de definir l’intercanvi de missatges i el perfil de comunicacions del tràfic aeri del futur tenint en compte situacions adverses que provocarien un canvi en un hipotètic contracte 4D. Per dur a terme aquesta activitat, caldrà utilitzar els principis de sistemes complexos basats en probabilitat, així com desenvolupar un model de causal. Un cop s’hagi definit el perfil de comunicacions, s’analitzarà un solució per un sistema satèl·lit.
2) El concepte de trajectòria 4D encara no ha estat definit. En el programa SESAR s’està treballant en la seva definició. Amb la tesi es pretén endinsar-se en profunditat en aquest concepte per tal d’arribar a ser capaç de discutir les publicacions sobre aquest tema, així com arribar a ser útil en la definició del concepte.
Les activitats que s’han portat a terme durant el projecte es poden resumir en:
1) Documentació • Comprensió del problema de saturació de les comunicacions ATM i la necessitat de millorar-les • Contractes basats en trajectòries 4D • Protocols de comunicació per les comunicacions aeronàutiques del futur
2) Estudi del perfil de comunicació de les comunicacions aeronàutiques segures
• Perfil de tràfic per un sol avió i estudi de diferents mètodes de generació de missatges - Perfil de tràfic previst pel 2020 sobre la zona ECAC (European Civil Aviation Conference) - Anàlisi dels paràmetres d’entrada i els resultats obtinguts - Test dels resultats per validar-los i correcció d’errors en el simulador (C++) - Extracció d’estadístiques a partir dels resultats (MATLAB) - Millores sobre el simulador - Comparació amb els resultats obtinguts per l’Agència Espacial Europea (ESA)
3) Estudi dels protocols de comunicació per un sistema satèl·lit
• GMR-1 (Geo Mobile Radio-1) Comprensió del simulador d’Astrium i anàlisi dels primers resultats
Les conclusions i resultats que es presenten en aquest document poden ser útils com a base per una futura discussió oberta que sense cap dubte ajudarà a millorar els resultats i apropar-los a una previsió més propera a la realitat.

Centre National d'Etudes Spatiales EPSC (UPC)
SATCOM for ATM Issue : Date : 22/07/2009
Rev. : Date : 22/07/2009
Reference : TFC report Page : 7

Centre National d'Etudes Spatiales EPSC (UPC)
SATCOM for ATM Issue : Date : 22/07/2009
Rev. : Date : 22/07/2009
Reference : TFC report Page : 8
OVERVIEW
Air traffic forecast projects an important growth of aircraft movements and new communications means will be necessary. First step in the design phase is the communication needs definition. Due to operational needs and according to SESAR (Single European Sky ATM Research) Master Plan, future air-ground communication architecture for safety aeronautical communications will be probably composed by two systems (one terrestrial and one satellite-based). Since current communication means are based on cellular technologies, past methodologies do not provide information for satellite design.
The objective of this project is to develop a technologically independent methodology to evaluate the safety aeronautical communications profile according to current information about future data-based air-ground communications. This assessment pretends to be a starting point for a possible doctoral thesis. This thesis can be focused on two items, or both of them:
1) Develop a model in order to define the messages exchange and the communications profile of the future
air traffic taking into account adverse situations that will cause a change on 4D contract. To do that, complex systems theories based on probability must be used and a causality model must be developed. Once the communications profile is defined, a satellite system solution will be analyzed.
2) 4D trajectory concept hasn’t been defined yet. SESAR is working on it. With the thesis, it is pretended to go into this concept in depth in order to be able to discuss SESAR publications and be useful as a feedback for the concept definition.
The activities carried out with this project can be summed up in:
4) Documentation • Understanding the ATM communications saturation problem and the need to improve them • 4D trajectory-based contracts • Communication protocols for future aeronautical communications
5) Safety aeronautical communications profile assessment
• Traffic profile for 1 flight and study of instances generation methods • Traffic profile for 2020 forecasted traffic over ECAC (European Civil Aviation Conference) area
- Analysis of input parameters and results - Result testing to validate them and simulator bugs correction (C++) - Statistics extraction from results (MATLAB) - Simulator improvements - Comparison with ESA (European Space Agency) results
6) Satellite-based communication protocol assessment
• GMR-1 (Geo Mobile Radio-1) Astrium’s simulator behaviour and results analysis
Conclusions and results presented in this document can be used in order to provide the basis for a future open discussion which will help to enhance the results.

Centre National d'Etudes Spatiales EPSC (UPC)
SATCOM for ATM Issue : Date : 22/07/2009
Rev. : Date : 22/07/2009
Reference : TFC report Page : 9

Centre National d'Etudes Spatiales EPSC (UPC)
SATCOM for ATM Issue : Date : 22/07/2009
Rev. : Date : 22/07/2009
Reference : TFC report Page : 10
ACKNOWLEDGEMENTS
Gràcies a l’Hugo per la seva implicació, companyerisme, saber estar i atenció durant tota la meva estància.
Gràcies als meus pares i germana pel seu suport abans, durant i després de la meva etapa d’estudiant.
Gràcies als meus amics per fer fàcils els moments difícils.
Gràcies a la Verònica per la seva paciència i els seus consells.
Gràcies a en Xevi per confiar en mi.

Centre National d'Etudes Spatiales EPSC (UPC)
SATCOM for ATM Issue : Date : 22/07/2009
Rev. : Date : 22/07/2009
Reference : TFC report Page : 11

Centre National d'Etudes Spatiales EPSC (UPC)
SATCOM for ATM Issue : Date : 22/07/2009
Rev. : Date : 22/07/2009
Reference : TFC report Page : 12
GLOSSARY 4D Four-dimensional A/C Aircraft AAC Aeronautical administrative communications ACARS Aircraft communications addressing and reporting system ACL ATC Clearances ACM ATC Communication Management ADS-B Automatic Dependent Surveillance - Broadcast AMC ATC Microphone Check AMS(R)S Aeronautical mobile satellite (route) service AMSS Aeronautical mobile-satellite service AOC Airline Operational Communications AOCDLL AP-17
AOC Data Link Logon Action Plan 17
APC Air Passenger Communications ARMAND Arrival Manager Information Delivery Service ATC Air Traffic control ATM Air Traffic management ATS Air traffic service ATSC Air Traffic Services Communications Bps BACH
bits per second Basic Alert Channel
CABINLOG Cabin Log Book Transfer CAPEX Capital Expenditures CNES French National Space Agency COCR Communication Operating Concept and Requirement for Future Radio System COTRAC Common Trajectory Co-ordination CSP CST
Communication Service Provider Toulouse Space Centre
D-ATIS Data Link ATIS DCL Departure Clearance D-FLUP Data Link Flight Update Service D-ORIS Data Link Operational En-Route Information Service D-RVR Data Link Runway Visual Range DSC Downstream Clearance D-SIGMET Data Link Significant Meteorological Information D-TAXI Data Link Taxi Clearance Delivery DYNAV Dynamic Route Availability ECAC European civil aviation conference ENGINE Engine Performance Report ESA ETSI
European Space Agency European Telecommunications Standard Institute
EUROCONTROL European organization for the safety of air navigation FCI Future Communications Infrastructure

Centre National d'Etudes Spatiales EPSC (UPC)
SATCOM for ATM Issue : Date : 22/07/2009
Rev. : Date : 22/07/2009
Reference : TFC report Page : 13 FDD Frequency Division Duplex FEC FIS FL
Forward Error Correction Flight Information Services Forward Link
FLIPCY Flight Plan Consistency FLIPINT Flight Plan Intent FLTLOG Flight Log Transfer FLTPLAN Flight Plan FLTSTAT FRS
Flight Status Future Radio System
FUEL Fuel Status GEO Geostationary satellite GMR GMPRS
Geo Mobile Radio Global Mobile Positioning Radio System
GPS GPRS
Global positioning system Global Positioning Radio System
GTS GES Traffic Sub-system HF HFDL
High Frequency HF Data Link
HPA High Power Amplifier ICAO IFE IIR ITU
International civil aviation organization In Flight Entertainment Internal Rate of Return International Telecommunications Union
kbps kilo bits per second kHz Kilo-Hertz LOADSHT Load sheet MAINTPR MES NET
Maintenance Troubleshooting Mobile Earth Station Network
NOTAM Notice to airman OOOI PNB PCH PP
Out the gate, Off the ground, On the ground, Into the gate Packet Normal Burst Physical Channel Public Procurement
PPD Pilot Preference Downlink PPP Public Private Partnership PSTN PV
Public Switch Telephony Network Private Venture
QoS Quality of service QPSK RL
Quadrature Phase Shift Keying Return Link
SAP System Access Parameter SATM Satcom for ATM SESAR S-AMACS
Single European Sky ATM Research Satellite – All-purpose Multi-channel Aviation Communications System
Centre National d'Etudes Spatiales EPSC (UPC)
SATCOM for ATM Issue : Date : 22/07/2009
Rev. : Date : 22/07/2009
Reference : TFC report Page : 14 SSP Satellite Simulator Platform S-UMTS Satellite Universal Mobile Telecommunication System SWLOAD SWOT
Software Load Strengths, Weaknesses, Opportunities and Threads
TDMA Time division multiple access TIS-B Traffic Information Service – Broadcast TMA Terminal Manoeuvring Area TV Television UPLIB Uplink Electronic Library URCO VDL
Urgent Contact Service VHF Data Link
VHF Very high frequency WXGRAPH Graphical Weather WXRT Real Time Weather Report

Centre National d'Etudes Spatiales EPSC (UPC)
SATCOM for ATM Issue : Date : 22/07/2009
Rev. : Date : 22/07/2009
Reference : TFC report Page : 15

Centre National d'Etudes Spatiales EPSC (UPC)
SATCOM for ATM Issue : Date : 22/07/2009
Rev. : Date : 22/07/2009
Reference : TFC report Page : 16
REFERENCE DOCUMENTS
RD1 “Communication Operating Concept and Requirements for the Future Radio System” Eurocontrol/FAA, 01/06/2007, Issue 2, Rev. 0 COCRv2.0
RD2 Eurocontrol ATM communications projects
http://www.eurocontrol.int/eec/public/standard_page/PROJ_Projects.html
RD3 EUROCONTROL (SESAR) http://www.eurocontrol.int/sesar
RD4 SESAR Consortium http://www.sesar-consortium.aero/
RD5 GONZALEZ PEREZ H., BES C., PRATS MENENDEZ, X., “Capacity modeling for future aeronautical safety communications over wide areas”, American Institute of Aeronautics and Astronautics, Ref: 092407 RD6 ESA/CNES “WP1000 Report- Consolidation of service requirements”, Ref: CSS/C1987/TN, Nov.
2006 RD7 Space Communications Internal Journal, Volume 21, Numbers 3, 4 (2007/2008) RD8 RTCA SC-214/EUROCAE WG-78, “Air Traffic Services Safety and Interoperability Requirements”,
Paper Ref: 4DTRAD-OSD, Dec. 2008 RD9 PREVOT T., CALLANTINE T., LEE P., MERCER J., BATTISTE V., JOHNSON W., PALMENR E.,
SMITH N., “Co-operative air traffic management: a technology enabled concept for the next generation air transportation system”, 5th USA/Europe Air Traffic Management Research and Development Seminar, Baltimore, MD, 2005
RD10 Cooperative Air Traffic Management (C-ATM) Phase 1, “C-ATM High Level Operational Concept”,
v. 1.2, Ref: CATM-WP111-ERC-HLOC-D111-V0120, Feb- 2005 RD11 “En Route Air Traffic Soft Management Ultimate System (ERASMUS) – Concept of Operations v.
2.0”, Eurocontrol, WP2, D2.2.1, 16/06/2007 RD12 Annex 10 to the Convention on International Civil Aviation: Aeronautical Telecommunications,
Volume III: Communications Systems, Part I ICAO, Second Edition, July 2007 RD13 “Contract-Based Air Transportation System (CATS) Exploitation & Dissemination Plan”, Eurocontrol, Ref: CIFE01EN10003.10, Nov. 2007 RD14 GARCIA BAÑOS A., GUERRERO F., “Sobre la correcta manipulación de números aleatorios”,
Magazine “El Hombre y la Máquina, No 29”, Jul-Dec 2007

Centre National d'Etudes Spatiales EPSC (UPC)
SATCOM for ATM Issue : Date : 22/07/2009
Rev. : Date : 22/07/2009
Reference : TFC report Page : 17
RD15 “SATM Simulator Development”, v. 1.1, CNES/UPM Project, Jan. 2008 RD16 “Etude comparative des performances des protocoles de communication pour les besoins des
communications aéronautiques, WP2100 : Description du standard GMR", Thales Alenia Space, Ref: COM_AERO_TAS_TN_721, Oct. 2008
RD17 GONZALEZ PEREZ H., BES C., “List of criteria for evaluation of communication standards for
ATM”, Ref: DCT/RF/ST 2008-0005391, Mar. 2008 RD18 GONZALEZ PEREZ H., BES C., “Communication standard for aeronautical safety
communications”, Ref: DCT/RF/ST 2008-0005597, Mar. 2008 RD19 GAUBERT J-M., LE HO E., LOBERT B., “Etude de la gestion de petits messages dans les
systèmes de communication par satellite”, Thales Alenia Space/Atmosphere, Ref : 100305605G, Feb. 2009 RD20 GONZALEZ PEREZ H., DENEUFCHATEL L., BIRKINSHAW W., BOITHIAS H., GAUBERT J-M.,
MAIOLLA V., ALLEMAND C. and GAUCHE J-F., “SATCOM for ATM Final Report”, Ref: DCT/RF/ST 2007-0033222, rev. 6, 2008

Centre National d'Etudes Spatiales EPSC (UPC)
SATCOM for ATM Issue : Date : 22/07/2009
Rev. : Date : 22/07/2009
Reference : TFC report Page : 18
ENVIRONMENT OF THE INTERNSHIP
CNES
Founded in 1961, the Centre National d’Etudes Spatiales (CNES) is the government agency responsible for shaping and implementing France’s space policy in Europe. Its task is to invent space systems, bring space technologies to development and guarantee France’s independent access to space. CNES is an essential player in Europe’s space programmes, and a major source of initiatives and proposals that aim to maintain France and Europe’s competitive edge. It conceives and executes space programmes with its partners in the scientific community and industry, and is closely involved in many international cooperation programmes. The agency’s strong workforce constitutes an exceptional pool of talent, with some 1,800 engineers and executives.
Through its ability to innovate and its forward-looking vision, CNES is helping to promote new technologies that will benefit society as a whole, focusing on:
• Access to space • Civil applications of space • Sustainable development • Science and technology research • Security and defence
TOULOUSE SPACE CENTRE (CST)
The place of the internship is the Toulouse Space Centre (CST), one of the centres of CNES, located in Toulouse. The opening of the CST in 1968 was the result of the decentralization of French high-tech industries from the Paris area to the provinces. The CST replaced the former space centre at Brétigny-sur-Orge. At this key site for space research, the centre develops complete space systems with its partners in industry and the scientific community, right up to their entry into operational service.
The CST is unique in terms of its size and the diversity of its activities. The CST participates in scientific and instrumentation projects, and leads research and application programmes such as Spot, Helios and Argos. It also conducts satellite positioning operations.
Figure 0-1: The CST entrance in Toulouse
Centre National d'Etudes Spatiales EPSC (UPC)
SATCOM for ATM Issue : Date : 22/07/2009
Rev. : Date : 22/07/2009
Reference : TFC report Page : 19
The CNES department proposing the training
The training that I have carried out within the CNES has been proposed by the department “Système Télécommunications Spatiales” (ST) which is also integrated in the “Radiofréquences” (RF) department. My master of training was:
Mr. Hugo Gonzalez Perez, System Engineer, “Système Télécommunications Spatiales” department, CNES, Toulouse Space Center.

Centre National d'Etudes Spatiales EPSC (UPC)
SATCOM for ATM Issue : Date : 22/07/2009
Rev. : Date : 22/07/2009
Reference : TFC report Page : 20
1. INTRODUCTION
Air Traffic is forecast to grow steadily over the next 15 years. In the Core Area of ECAC (European Civil Aviation Conference), EUROCONTROL is forecasting a traffic increase estimated between 55% and 90% for the years 2007-2025[RD1]. Air Communication services and their supporting systems are based on technologies which are already running at maximum of their capacity. It means that they won’t be able to assure the safety requirements if the tendency continues growing up.
In order to accommodate future Air Traffic needs, a “paradigm shift”, supported by state-of-the-art and innovative technologies, is required.
Evolution in aeronautical communication requirements will depend on two major factors:
1) Strong aircraft traffic growth in Europe: this growth will lead to an increase in the aeronautical communication requirements needed to support Air Traffic Management (ATM), progressively replacing the current ATM operational concept that will have reached its limits.
2) Evolution of the ATM operational concept: existing studies [RD2] predict a shift of paradigm in the use of mobile communications to support the future ATM operational concept. The main trends are:
• Decrease on pilot-controller voice communications
• Introduction of new air-ground data-link services using voice as a back-up
• Introduction of more intensive air-to-air data exchanges
1.1. FUTURE ATM OPERATIONAL CONCEPT
SESAR programme is the European Air Traffic Management (ATM) modernisation programme. It will combine technological, economic and regulatory aspects to synchronise the plans and actions of the different stakeholders and federate resources for the development and implementation of the required improvements throughout Europe, in both airborne and ground systems.
There are four objectives for SESAR operational concept:
1) Triple the system capacity
2) Multiply by ten the safety
3) Divide by two the user costs per flight
4) Reduce the environmental ATM impact per flight on 10%
So as to achieve these objectives, SESAR is based on two concept paradigms:

Centre National d'Etudes Spatiales EPSC (UPC)
SATCOM for ATM Issue : Date : 22/07/2009
Rev. : Date : 22/07/2009
Reference : TFC report Page : 21
• Trajectory based operations
- 4D Trajectory Management - Collaborative Planning
• Conflict Management
- Automation support - Separation Provision - Collision Avoidance - Airspace Organization
For more information, it is useful to visit SESAR program webpage: http://www.eurocontrol.int/sesar [RD3] or http://www.sesar-consortium.aero/ [RD4].
The improvements that will be carried out with SESAR program can be classified in Communications, Navigation and Surveillance. The project will focus on the first one: Communications.
1.2. EVOLUTION OF MOBILE COMMUNICATIONS FOR ATM
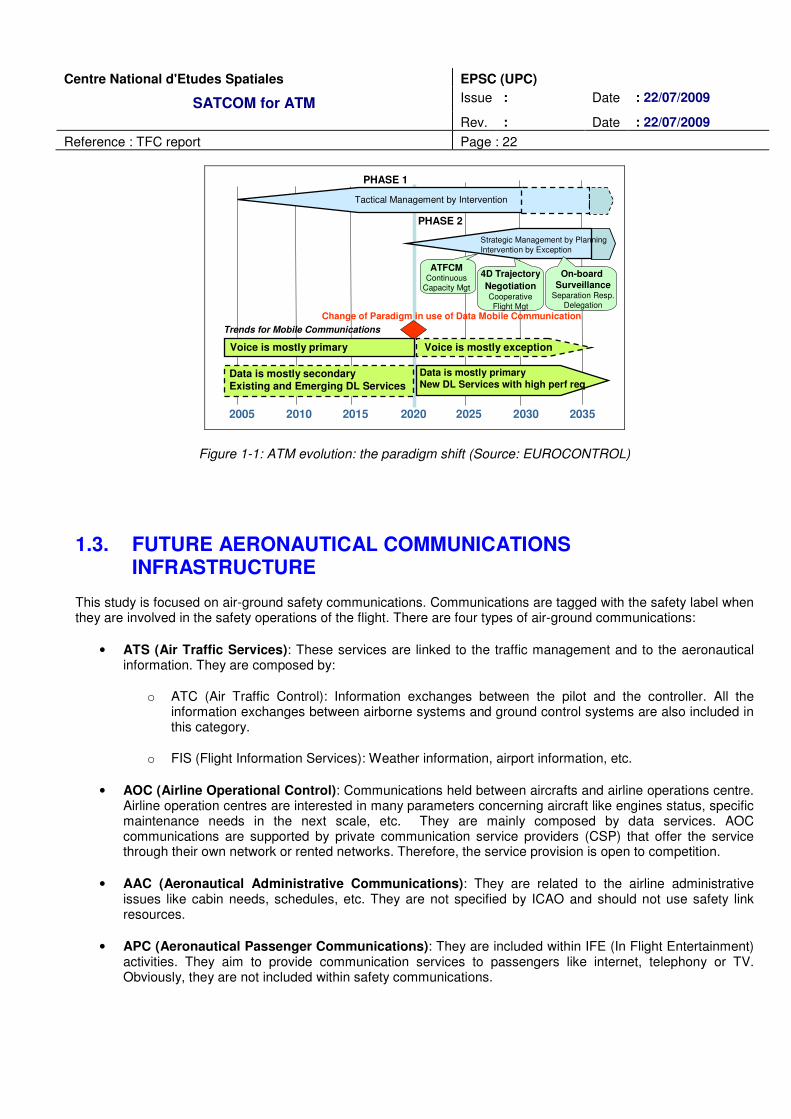
EUROCOTROL considers two main phases of communications to support Air Traffic Management. The first phase is based on existing or emerging data communication services, mixed with actual air-ground voice communications. Initial steps of this phase have been started in some regions of the world. The second phase represents a new paradigm in the use of data communications. It introduces new data communication services that replace or supplement those in Phase 1 and data communications become the standard method of air-ground communication and supports increased automation in the aircraft and on the ground. Phase 2 is predicted to start operating around 2020. To sum up, data communications based on 4D contracts (a concept not defined yet) will replace progressively the actual air-ground voice communications. The Common Trajectory Co-ordination (COTRAC) has undergone significant development, aided by avionics that allow the creation of 4D trajectories.
The following figure illustrates the paradigm shift for both the ATM operational concept and the use of mobile data communications, as described above. There is an initial phase where Data-Link (DL) services start to emerge and voice continues being the primary communication mode and a future more strategic phase where DL services are primary and Air Traffic Flow and Capacity Management (ATFCM), 4D trajectory based operations and On-board surveillance will centre the attention.
Centre National d'Etudes Spatiales EPSC (UPC)
SATCOM for ATM Issue : Date : 22/07/2009
Rev. : Date : 22/07/2009
Reference : TFC report Page : 22
2005 2010 2015 2020 2025 2030 2035
Change of Paradigm in use of Data Mobile Communication
4D Trajectory NegotiationCooperative Flight Mgt
Voice is mostly exception
PHASE 1
Voice is mostly primary
Data is mostly secondaryExisting and Emerging DL Services
Data is mostly primaryNew DL Services with high perf req
Trends for Mobile Communications
Tactical Management by Intervention
PHASE 2
Strategic Management by PlanningIntervention by Exception
ATFCMContinuous
Capacity Mgt
On-board Surveillance
Separation Resp.Delegation
Figure 1-1: ATM evolution: the paradigm shift (Source: EUROCONTROL)
1.3. FUTURE AERONAUTICAL COMMUNICATIONS INFRASTRUCTURE
This study is focused on air-ground safety communications. Communications are tagged with the safety label when they are involved in the safety operations of the flight. There are four types of air-ground communications:
• ATS (Air Traffic Services): These services are linked to the traffic management and to the aeronautical information. They are composed by:
o ATC (Air Traffic Control): Information exchanges between the pilot and the controller. All the information exchanges between airborne systems and ground control systems are also included in this category.
o FIS (Flight Information Services): Weather information, airport information, etc.
• AOC (Airline Operational Control): Communications held between aircrafts and airline operations centre. Airline operation centres are interested in many parameters concerning aircraft like engines status, specific maintenance needs in the next scale, etc. They are mainly composed by data services. AOC communications are supported by private communication service providers (CSP) that offer the service through their own network or rented networks. Therefore, the service provision is open to competition.
• AAC (Aeronautical Administrative Communications): They are related to the airline administrative issues like cabin needs, schedules, etc. They are not specified by ICAO and should not use safety link resources.
• APC (Aeronautical Passenger Communications): They are included within IFE (In Flight Entertainment) activities. They aim to provide communication services to passengers like internet, telephony or TV. Obviously, they are not included within safety communications.

Centre National d'Etudes Spatiales EPSC (UPC)
SATCOM for ATM Issue : Date : 22/07/2009
Rev. : Date : 22/07/2009
Reference : TFC report Page : 23
Consequently, only ATS and AOC have been considered during this study (safety communications).
Current air-ground communication infrastructure is mainly based on voice systems for ATS communications. Over continental areas, analogue AM-DSB voice channels in VHF (Very High Frequency) band are widely used. They are operated at 25 kHz channel spacing and, since 1999, new 8.33 kHz spacing is used in some areas. Additionally, in some airport areas, gate-link communication services provided by private network operators are used. In oceanic areas, long-range air-ground communications are based on two technologies: High Frequency (HF) and Aeronautical Mobile Satellite Services (AMSS). Both allow for voice and data transmission.
Current data links are commonly used for AOC services. In continental areas, VHF data-links are used, the most widespread being ACARS (Aircraft Communications Addressing and Reporting System) Mode A link; VDL2 (VHF Data Link) is a more efficient technology that currently is in its initial deployment. In oceanic, polar and remote airspaces, HF provides low data link services whereas AMSS provides higher data rates but it does not provide coverage in polar areas.
In 2007, Iridium system has been standardized at ICAO level for safety aeronautical communications use. Therefore, equipped aircrafts can use Iridium for voice and data exchanges in all airspaces. Iridium system is available for long time, bit its aeronautical safety service is just beginning.
In order to cope with new operational needs, several initiatives (Action Plan-17 (AP-17), SESAR or NextGen) have analyzed the future architecture required to support new communication services. They show a strong convergent trend to the following:
• IEEE 802.16 derived technologies to provide future mobile communication services en the airport surface for ATS and AOC.
• A new terrestrial data-link system operating in L band to support ATC communications for the en route or TMA (Terminal Manoeuvring Area) airspace.
• A dedicated satellite system for TMA, en route airspace as a complement to the terrestrial data-link.
• Satellite systems to provide ATC and AOC communication services in oceanic/remote areas. These areas are natural domain of application of satellite technologies. The trend is initial migration from a primary HF voice service to primary satellite voice service; lately, these services will migrate to data services.
Figure 1-2 shows a scheme of this purposed architecture. In black colour, inherited systems from present ones as ACARS (Aircraft Communications Addressing and Reporting System), VHF (Very High Frequency), HF (High Frequency), VDL (VHF Data Link) or IEEE 802.16 standard for airports; in green colour, new satellite and terrestrial (Data Link) systems to provide ATC and AOC services over ENR, Oceanic and Remote Areas.

Centre National d'Etudes Spatiales EPSC (UPC)
SATCOM for ATM Issue : Date : 22/07/2009
Rev. : Date : 22/07/2009
Reference : TFC report Page : 24
AOC
Airport Surface En-Route/TMA Oceanic/remote
ATS
Legacy SystemsFuture Systems
Airport Network
SatelliteAMSS SatCom
VHF 25/8.33KhZAOA (ACARS/VDL2)ATN/VDL2
HF
IEEE 802.16 • FANS1/A (ACARS) SATCOM data 2• ATN/SATCOM data 3
Satellite New Link
Terrestrial
New Link
Next GenerationSatellite
Figure 1-2: Future Communication Infrastructure (Source: Eurocontrol)
1.4. SATELLITE COMMUNICATIONS FOR ATM
Forecasted air traffic growth is being seriously hampered by frequency channel congestion in the current Air Traffic Management (ATM) communications infrastructure using the VHF frequency band. This underpins a density increase over continental areas and so, the need of new ATM procedures. In order to allocate these new ATM procedures, additional communications capacity will be essential. Satellite communications is considered in this context a potentially valuable resource and shall be hence regarded at as an integral part of the foreseen long term solution providing global ATM service availability. Satellite systems shall be investigated as a complement of the terrestrial infrastructure to jointly meet the future capacity and availability requirements in high-density continental airspaces.
Aviation regulatory bodies place stringent requirements on safety critical communications to/from aircraft in terms of performance and existence of a protected spectrum, in order to ensure highest availability and integrity. Any satellite system wishing to provide safety critical services must develop technical manuals that prove that SARP (Standards and Recommended Practices) compliance (ICAO certification). As of today, Iridium and MSTAT are the only satellite systems certified to provide aeronautical safety services. Other projects under development are ESA’s Iris Program, ANASTASIA (Airbone New Advanced Satellite Techniques and Technologies in a System Integrated Approach), EUROCONTROL’s NexSat experts group and INMARSAT system.
The Aeronautical Mobile Satellite (Route) Service (AMS(R)S) defines the worldwide spectrum allocation for aeronautical safety services via satellite, namely 1545.0-1555.0 MHz (Space-to-Earth) and 1646.5-1656.5 MHz (Earth-to-Space).
Table 1 summarises the main strengths, weaknesses, opportunities and threads (SWOT) related to the usage of satellite communications for ATM services. A suitable candidate satellite communications technology should be

Centre National d'Etudes Spatiales EPSC (UPC)
SATCOM for ATM Issue : Date : 22/07/2009
Rev. : Date : 22/07/2009
Reference : TFC report Page : 25
able to provide convincing solutions to the weaknesses and threads mentioned in the table. In particular, optimised radio resource management solutions, tailored to the specific features of the ATM traffic in order to optimise performance and reduce bandwidth usage, shall be an integral part of any proposed solution.
Strengths
• Global coverage
• Ideal for broadcast and multicast services
• Rapid deployment
Weaknesses
• Demanding service requirements vs. inherently large delay (mainly for GEO)
• High cost of bandwidth and terminals
• Critical failure point
• New operation concept
Opportunities
• Scarcity of radio spectrum resources in the VHF band
• Envisaged ATM paradigm shift (voice to data) => DUAL LINK
Threads
• Suitable frequency allocation
• Lack of full acceptance by part of civil aviation entities
Table 1-1: SWOT analysis of satellite communications for ATM
Extended information about satellite communications for ATM can be found in [RD5], [RD6] and [RD7].

Centre National d'Etudes Spatiales EPSC (UPC)
SATCOM for ATM Issue : Date : 22/07/2009
Rev. : Date : 22/07/2009
Reference : TFC report Page : 26
2. STATE OF THE ART
Nowadays, there are many European organizations, companies and workgroups developing studies about future Air Traffic Management. Brief descriptions of some of them, whose publications have been used for the project development, are presented next:
COCR (Communications Operating Concepts and Requirements) [RD1] is a document developed by EUROCONTROL and FAA that must be treated as an initial point of view of the future communication system services. Most of the capacity assessments published since now are based on this document. But there is some lack of information, like the bidirectional communications message exchange protocol, and the capacity assessment at the end of the document is not technology independent as many assumptions have been carried out.
RTCA SC-124/EUROCAE WG-78 [RD8] is a EEUU/European workgroup to develop standards to define the safety, performance and interoperability requirements for future Air Traffic Services (ATS) supported by data communications. Some service behaviours are being detailed on their documents. It will be important to take care about their publications and news during the thesis development.
C-ATM (Cooperative-ATM) [RD9] and [RD10]: Cooperative Air Traffic Management is a European Commission Air Traffic Management research project, targeting deployment of a validated operational concept from 2012. The C-ATM concept focuses on increased collaboration in an integrated air and ground ATM system in order to make it more predictable and coherent, aiming to deliver aircraft consistently according to user schedules and agreed traffic sequences, with predefined scenarios that cater for degraded situations.
ERASMUS project [RD11]: ERASMUS Strategic De-Conflicting function aims at adjusting the 4D trajectory in order to optimize the separation management with the provision of conflict free trajectory on short segment of 15 minutes, reducing controller’s workload associated with routine monitoring and conflict detection as well as reducing the interventions of ATC in changing flight profiles to resolve potential conflicts. Their publications can be useful to be informed about conflict situations message exchange.
PHARE (Programme for Harmonised ATM Research in EUROCONTROL) was a collaborative research programme within Europe to investigate a future Air Traffic Management (ATM) concept. The objective of PHARE was to organise, coordinate and conduct studies and experiments to demonstrate the feasibility and benefits of a future air-ground integrated air traffic management system in all phases of flight. The programme which started in 1989 and was completed in 1999 involved a number of European research establishments, assisted by national authorities. A review of the results and the issues coming from the PHARE provides a sound basis for current programs and avoids the same issues being rediscovered.
NUP2+ (NEAN Update Program 2+) was the first project to use the 4D trajectory in Europe with real aircraft flying. Based on 4D Trajectory data together with ADS-B data, the NUP2+ project aimed to develop applications that have the potential to provide benefits to the ATM domain.
These are the most useful ATM programs for the possible thesis, but there are many other programs that could be useful. Information of most of them can be found at [RD2].
It is useful to be up to date about future ATM communications and 4D-trajectory concept, for example with [RD12] and [RD13] documents.
As it has been mentioned, a satellite system consequences evaluation for ATM will be developed. According to this, nowadays there are some European projects analysing this chance. Some of them are presented here:

Centre National d'Etudes Spatiales EPSC (UPC)
SATCOM for ATM Issue : Date : 22/07/2009
Rev. : Date : 22/07/2009
Reference : TFC report Page : 27
Iris Program: Iris is the European Space Agency’s initiative on the use of satellite system for ATM air-ground communications. It aims to develop satellite communications for exchanges between aircraft and flight control centres, complementing existing and future systems in support of the growth on worldwide air traffic operations.
ANASTASIA (Airbone New Advanced Satellite Techniques & Technologies in a System Integrated Approach): ANASTASIA will carry out research of future technology and system architectures for navigation, communication and surveillance. On the communication side, work will concentrate on the design and implementation of a prototype satellite communications system to meet the ATM requirements.
NexSat: The NexSat Steering Group is a EUROCONTROL group which provides a forum for all the interested parties in satellite communications for ATM, to discuss ongoing developments, share information, and provide EUROCONTROL with advice on ongoing and planned activities.
INMARSAT, Globalstar and Iridium are existing and planned satellite systems providing aeronautical services. These are not ATM services, but could be useful as a starting point for a new system specification or for a piggy-back or rented capacity solution.
Extended information and references about satellite communications systems for ATM can be found in [RD6].

Centre National d'Etudes Spatiales EPSC (UPC)
SATCOM for ATM Issue : Date : 22/07/2009
Rev. : Date : 22/07/2009
Reference : TFC report Page : 28
3. ESTIMATION OF CAPACITY REQUIRED FOR AMS(R)S COMMUNICATIONS AROUND 2020 OVER EUROPEAN AREA
3.1. INTRODUCTION
To define the future communications system, it is important to identify the communications profile or, what is the same, to compute the system capacity. The future ATM procedures will be based principally on data-link. Therefore, the next aeronautical air-ground communications infrastructure should provide more demanding performances in terms of bandwidth and QoS. Obviously the required information to enhance the future operation cannot be transmitted by the current voice channels so, specific data systems are necessary to support new services. It can be noticed that some of them will be transparent to the human factors (pilots and controllers). This particular feature will bring mainly operational benefits, but is also the origin of new constraints as for example, backup service in case of link interruption and notification of loss of information in case of link outage during automatic service exchange. SESAR Plan proposes to use a terrestrial system and a satellite-based system for the future aeronautical communications infrastructure. In terms of capacity planning, terrestrial cellular systems are less complicate and hazardous to design than satellite systems.
This section provides a technologically independent estimation of the Future Radio System safety communication load associated with Aeronautical services over ECAC area in order to help to the global system design.
3.2. MODELING POLICY
First of all, in order to determine the best suited message generation implementation method, three different methods have been considered and compared for one single aircraft. First method called Pseudo-Deterministic had been implemented by CNES and some improvements have been carried out on it. Second (Poisson) and third (Exponential) stochastic methods have been completely implemented and several parameter and output studies and simulations have been done over them.
This model has been used next for the global simulation. CNES had implemented a global ECAC area simulator with STATFOR Eurocontrol’s data for 2020 as inputs, with COCR [RD1] services characteristics. All the activities that I have carried out along my stage using this simulator can be summed up in:
• Global simulator’s behavior understanding • Results validation tests (errors correction and improvements) • Statistics (results processing) • Exponential method results • Simulator improvements according to COCR [RD1]:
o Aircraft type implementation o ACK message implementation
• Comparison with University of Saalzburgh assessment (ESA) • Results are presented in the current document.

Centre National d'Etudes Spatiales EPSC (UPC)
SATCOM for ATM Issue : Date : 22/07/2009
Rev. : Date : 22/07/2009
Reference : TFC report Page : 29
3.2.1. One single aircraft model
A simulation model for one single aircraft has been considered, taking into account services information provided at COCR [RD1]. These services are listed at section 3.2.2.1. As this model must be technologically independent (including satellite), no system architecture assumptions have been done during the analysis. It means that only useful load has been considered without assumption of any system parameters like number of carriers, number of channels, modulation, system configuration etc.
As a general rule, the information is a basic input for any communication network architecture activity. For a satellite based system, the capacity needs distribution has a heavy impact on several technical points, like antenna design, beam location, global throughput, resource allocation, etc. In a terrestrial design case, traffic distribution is a key input for cells distribution or base station load analysis. In any case, the communication needs distribution could be applied, allowing comparison between terrestrial and satellite-based system performances.
The communication needs are defined by the services supported by the system. In order to define them, two different ways of computing have been considered: simultaneous access to the system and capacity:
The first one gives information about communication requests. When one entity wants to send information to another distant entity, it requests to communication system for it. Then, the communication equipment manages the procedures to connect the entity to the communication system that conveys the information to the destination. To the end of propose the communication protocol that provides the best performances with regard to the requirements (efficiency, transmission delay, availability, etc.), it is necessary to identify the communication profile to be supported by the system. This profile is defined by the number of data exchanges and the instant the application ask for them.
The second parameter analyzed is capacity. This parameter is very important during system communication planning phase, mainly to compute the necessary frequency bandwidth for the system operation. Capacity estimations are based on assumptions willing to determine the worst case scenario, taking into account the communication profile.
3.2.1.1. ATM Communications profile
The first point to take into account during a communication system design is the type of information to be transmitted. System optimization is directly linked to this analysis. Certainly, some communication systems are able to convey almost every type of information, but it does not mean that they do it in efficient way. When it is about radio systems, the scarcity of available spectrum usually leads engineers to look for the best fitted solution. Moreover, the safety nature of communications under study imposes mission requirements to be respected. All these constraints ask for a carefully protocol choice.
The COCR document [RD1] is the main and unique up to date reference document to provide qualitative and quantitative requirements to build upon the future communication infrastructure. COCR [RD1] should be used mainly as a common framework to enable comparison between different technologies, but it must be recognized that the service description provided is not covering all the elements that could be required for a complete system profile definition.
As explained before, COCR [RD1] defines two phases in the system deployment: for present simulation, only phase 2 services are considered as the new communication infrastructure will be deployed at the same time. Consequently, only data exchanges are considered and no voice capacity is required.
Data communications services vary by the domain in which the aircraft is operating. COCR [RD1] divides airspace

Centre National d'Etudes Spatiales EPSC (UPC)
SATCOM for ATM Issue : Date : 22/07/2009
Rev. : Date : 22/07/2009
Reference : TFC report Page : 30
into five representative airspace domains: Airport (APT), Terminal Manoeuvring Area (TMA), En Route (ENR), Oceanic, Remote, Polar (ORP) and Autonomous Operations Area (AOA). During analyses, only air/ground point to point services have been considered in the TMA and ENR domains (the airport domain is already covered by a terrestrial technology), because only them are concerned by satellite technology. Air/air exchanges (as ADS-B related services) have not been considered too, but the same methodology would be applied to them for another system design. A-EXEC and WXGRAPH services have not been taken into account for one single aircraft due to operational reasons.
One of the major points missed in COCR [RD1] concerns bidirectional services and their exchange procedures, which have not been defined within the references. In a normal basis, messages exchanged should follow a required procedure so, the following assumptions have been done: the messages related to one service are sent one after another by the initiator separated with three seconds. Once the service has been received, the receiver sends the reply messages also one after another. It has been considered a propagation delay of one second. It is important to emphasize that these parameters are selectable.
The simulator receives the following inputs for each domain and service, drawn from COCR [RD1]: transmission service duration, instances number (can be per domain, per sector or seconds between instances), number of messages per instance (uplink and downlink), message size (uplink and downlink), a service code and the communication initiator (aircraft or ground station). Uplink has been considered as communication from ground to aircraft, downlink vice versa.
Once the considered services taken into account are settled, the communications profile for one aircraft depends on flight duration, the number of sectors crossed and the duration of arrival and departure TMA phases. It is important not to forget two important parameters: seed, used to initiate the random number generator, and flagpaq, used to select the output information: access or capacity. All these parameters’ influence will be analyzed at section 3.2.1.3.
3.2.1.2. Message generation methods: Pseudo-deterministic, Poisson Law and Exponential inter-arrival time
One of the most important parameter that must be defined is the message generation method. There are many random generation methods and it is desired to evaluate them with the goal in mind of comparing different developed assessments by CNES, TriaGnoSys, Eurocontrol, and ESA, validating their behaviour for ATM application and choosing the most computationally optimized one to be subsequently applied. Three random message generation methods have been considered:
1) Pseudo-deterministic method: for each service, the analyzed domain duration (TMA or ENR) is divided by the number of instances of this service along the domain. One instance arrives in a uniform random way along each division.
2) Poisson’s instance rate distribution method: instance rate mean for each service is computed with a simple division between the number of instances of each service and the analyzed domain duration. Then, the instance generation follows a Poisson’s distribution with the mean computed before. It is needed to analyse for every second and every service if an instance has arrived.
3) Exponential inter-arrival time distribution method: inter-arrival time mean for each service is computed with a simple division between the analyzed domain duration and the number of instances of each service. Then, the time that goes by between one instance of the analyzed service and the next one follows an exponential distribution with the mean computed before. In fact, this method is technically the same than the previous one, as the time between instances in a Poisson distribution follows an

Centre National d'Etudes Spatiales EPSC (UPC)
SATCOM for ATM Issue : Date : 22/07/2009
Rev. : Date : 22/07/2009
Reference : TFC report Page : 31
exponential law with the same mean value. The results will be different because the implementation method is considerably different. This method is more efficient in terms of execution time as not every second must be attended.
It is important to emphasize that there are two services (Real Time Weather and System Access Parameters Periodic Report) dealt in a different way due to their deterministic nature according to COCR [RD1]. These services are sent periodically for Poisson and Exponential methods.
For stochastic methods implementation, information from [RD14] and [RD15] has been used.
3.2.1.3. Experimental results for one single aircraft
The simulator implemented provides four output data files:
Global_downlink_unicast: Access/capacity downlink information
Global_uplink_unicast: Access/capacity uplink information
Services_counter_down: Number of downlink instances of each service.
Services_counter_up: Number of uplink instances of each service.
As has been previously reported, only TMA and ENR domains have been considered. For the first analysis, it has been set TMA departure duration of 1500 seconds segregated in 4 sectors, ENR duration of 3500 seconds segregated in 3 sectors, TMA arrival duration of 2000 seconds segregated in 3 sectors and seed parameter of 283. Figures 3-1, 3-2, 3-3, 3-4, 3-5 and 3-6 show the capacity needs in bytes per second for each message generation methods discussed:

Centre National d'Etudes Spatiales EPSC (UPC)
SATCOM for ATM Issue : Date : 22/07/2009
Rev. : Date : 22/07/2009
Reference : TFC report Page : 32
Figure 3-1: Pseudo-deterministic uplink bit rate (bps) Figure 3-2: Pseudo-deterministic downlink bit rate (bps)
Figure 3-3: Poisson law uplink bit rate (bps) Figure 3-4: Poisson law downlink bit rate (bps)

Centre National d'Etudes Spatiales EPSC (UPC)
SATCOM for ATM Issue : Date : 22/07/2009
Rev. : Date : 22/07/2009
Reference : TFC report Page : 33
Figure 3-5: Exponential uplink bit rate (bps) Figure 3-6: Exponential downlink bit rate (bps)
Mean
(bytes/s) Median
(bytes/s) Variance
Channel utilization
Instances sent
Maximum (bytes/s)
Pseudo-deterministic downlink 20.49 21 2045 82.53% 879 573
Poisson downlink 21.63 21 2023 82.39% 864 333
Exponential downlink 22.22 21 2458 78.31% 895 580
Pseudo-deterministic uplink 11.23 0 1824 37.70% 98 414
Poisson uplink 12.25 0 2991 37.43% 79 438
Exponential uplink 11.12 0 2580 33.49% 111 436
Table 3-1: Different methods characteristics
From previous figures it can be said that safety aeronautical communications are mainly composed by short bursty exchanges due to their operational nature. Maximum stocked values are around 600 bytes/sec, but they are quite strange along the flight. Volumes of information stocked in the buffer are normally significantly lower. It’s important to face this analysis in terms of transmission delay for each service. Table 3-1 shows some numeric parameters extracted from previous graphics.

Centre National d'Etudes Spatiales EPSC (UPC)
SATCOM for ATM Issue : Date : 22/07/2009
Rev. : Date : 22/07/2009
Reference : TFC report Page : 34
With the aim toward assessing how the input parameters (seed and domain duration) affect the communication profile behaviour, the analysis has been repeated changing the parameter values and results are presented at figures 3-7 to 3-18 and tables 3-2 and 3-3:
a) Seed = 1000:
Figure 3-7: Pseudo-deterministic uplink bit rate (bps) Figure 3-8: Pseudo-deterministic downlink bit rate (bps)
Figure 3-9: Poisson law uplink bit rate (bps) Figure 3-10: Poisson law downlink bit rate (bps)

Centre National d'Etudes Spatiales EPSC (UPC)
SATCOM for ATM Issue : Date : 22/07/2009
Rev. : Date : 22/07/2009
Reference : TFC report Page : 35
Figure 3-11: Exponential uplink bit rate (bps) Figure 3-12: Exponential downlink bit rate (bps)
Mean
(bytes/s) Median
(bytes/s) Variance
Channel utilization
Instances sent
Maximum (bytes/s)
Pseudo-deterministic downlink
20.49 21 2061 82.79% 879 580
Poisson downlink 20.37 21 1803 81.37% 852 552
Exponential downlink 21.48 21 2232 84.50% 888 587
Pseudo-deterministic uplink 11.23 0 1890 42.71% 98 447
Poisson uplink 11.26 0 2693 39.19% 67 715
Exponential uplink 12.72 0 2460 42.89% 102 445
Table 3-2: Different methods characteristics for seed = 1000
Centre National d'Etudes Spatiales EPSC (UPC)
SATCOM for ATM Issue : Date : 22/07/2009
Rev. : Date : 22/07/2009
Reference : TFC report Page : 36
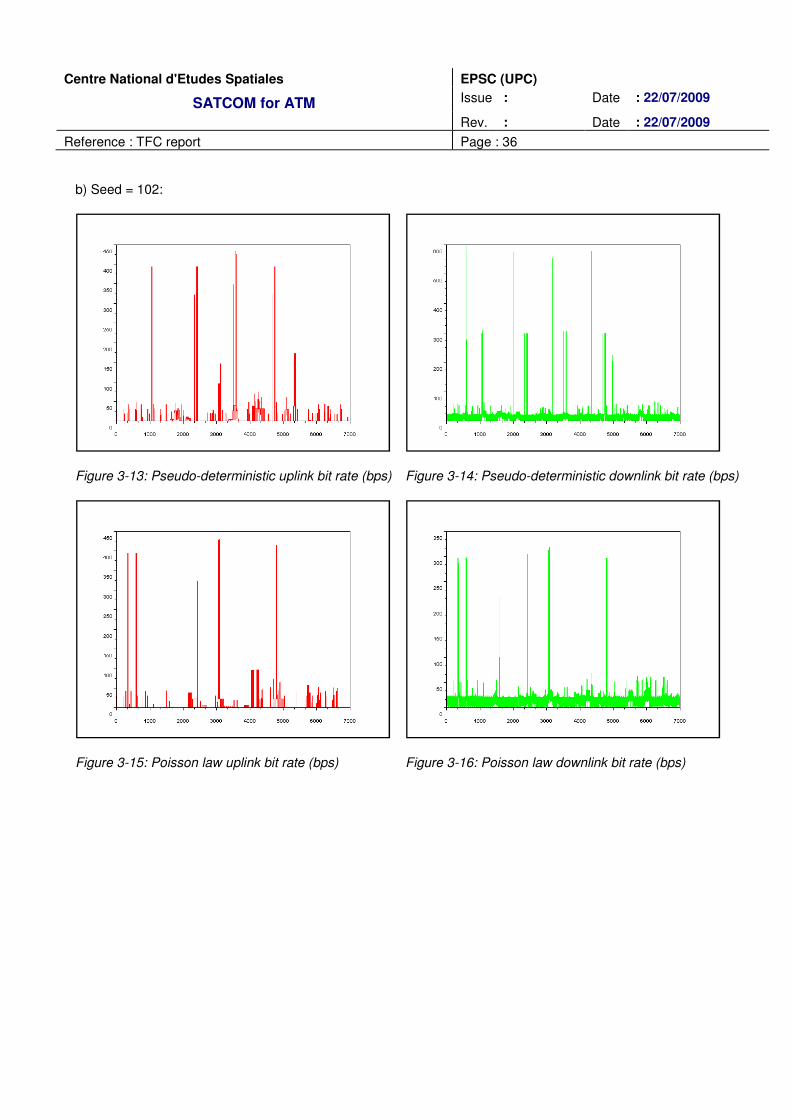
b) Seed = 102:
Figure 3-13: Pseudo-deterministic uplink bit rate (bps) Figure 3-14: Pseudo-deterministic downlink bit rate (bps)
Figure 3-15: Poisson law uplink bit rate (bps) Figure 3-16: Poisson law downlink bit rate (bps)

Centre National d'Etudes Spatiales EPSC (UPC)
SATCOM for ATM Issue : Date : 22/07/2009
Rev. : Date : 22/07/2009
Reference : TFC report Page : 37
Figure 3-17: Exponential uplink bit rate (bps) Figure 3-18: Exponential downlink bit rate (bps)
Mean
(bytes/s) Median
(bytes/s) Variance
Channel utilization
Instances sent
Maximum (bytes/s)
Pseudo-deterministic downlink
20.49 21 2065 81.46% 879 596
Poisson downlink 18.06 21 1104 78.79% 856 318
Exponential downlink 23.54 21 2575 83.97% 885 579
Pseudo-deterministic uplink 11.23 0 1874 38.81% 98 432
Poisson uplink 9.35 0 1644 34.54% 74 429
Exponential uplink 14.44 0 3041 43.94% 103 416
Table 3-3: Different methods characteristics for seed = 102
Some more seed analyses have been carried out and the following conclusions can be extracted:
Pseudo-deterministic method is really stable faced with seed parameter. This seems to be logical as it could be labelled as a nearly deterministic method. Mean capacity and the number of instances sent do not change.
On the other side, the other two methods are really sensitive with this parameter, especially at uplink, where the number of instances is lower and one more or one less service sent is notable in terms of capacity. These methods are more stochastic than the first one. This parameter sensibility decreases with the population (as occurs on any stochastic process) so, it won’t be problematic for next global ECAC area simulation.

Centre National d'Etudes Spatiales EPSC (UPC)
SATCOM for ATM Issue : Date : 22/07/2009
Rev. : Date : 22/07/2009
Reference : TFC report Page : 38
Another important detail shows that the number of instances sent with the exponential method is always higher than with Poisson’s method due to the implementation details of the random number generators implemented.
Finally, the domain duration and number of sectors per domain parameters’ influence is analyzed. Results extracted using hereafter parameters are presented at figures 3-19 to 3-24 and table 3-4:
a) TMA1=5000 sec. going through 5 sectors; ENR=9000 sec. going through 6 sectors; TMA2=6000 sec. going through 5 sectors:
Figure 3-19: Pseudo-deterministic uplink bit rate (bps) Figure 3-20: Pseudo-deterministic downlink bit rate (bps)
Figure 3-21: Poisson law uplink bit rate (bps) Figure 3-22: Poisson law downlink bit rate (bps)

Centre National d'Etudes Spatiales EPSC (UPC)
SATCOM for ATM Issue : Date : 22/07/2009
Rev. : Date : 22/07/2009
Reference : TFC report Page : 39
Figure 3-23: Exponential uplink bit rate (bps) Figure 3-24: Exponential downlink bit rate (bps)
Mean
(bytes/s) Median
(bytes/s) Variance
Channel utilization
Instances sent
Maximum (bytes/s)
Pseudo-deterministic downlink
16.51 21 1320 75.37% 2377 591
Poisson downlink 14.52 21 595 75.44% 2343 305
Exponential downlink 17.01 21 1734 73.81% 2379 828
Pseudo-deterministic uplink 5.27 0 1064 21.64% 140 419
Poisson uplink 4.71 0 769 16.81% 99 413
Exponential uplink 4.86 0 1057 18.03% 142 435
Table 3-4: Different methods characteristics for different domains duration and different number of sectors per domain
Rising up the flight duration not significant changes are seen. The number of instances sent tends to approach using the different methods, especially at downlink, where the instances number is higher.
According to COCR [RD1], the average parameters are the following ones, and these are the parameters used for the next simulation: TMA1=360 sec. going through 2 sectors; ENR=4920 sec. going through 5 sectors; TMA2=600 sec. going through 2 sectors; Seed=283:

Centre National d'Etudes Spatiales EPSC (UPC)
SATCOM for ATM Issue : Date : 22/07/2009
Rev. : Date : 22/07/2009
Reference : TFC report Page : 40
Figure 3-25: Pseudo-deterministic uplink bit rate (bps) Figure 3-26: Pseudo-deterministic downlink bit rate (bps)
Figure 3-27: Poisson law uplink bit rate (bps) Figure 3-28: Poisson law downlink bit rate (bps)

Centre National d'Etudes Spatiales EPSC (UPC)
SATCOM for ATM Issue : Date : 22/07/2009
Rev. : Date : 22/07/2009
Reference : TFC report Page : 41
Figure 3-29: Exponential uplink bit rate (bps) Figure 3-30: Exponential downlink bit rate (bps)
Mean
(bytes/sec) Median
(bytes/sec) Variance
Channel utilization
Instances sent
Maximum (bytes/sec)
Pseudo-random downlink
21.59 21 2430 79.66% 722 590
Poisson downlink 18.86 21 1226 79.18% 700 307
Exponential downlink 19.33 21 1396 81.36% 729 783
Pseudo-random uplink 13.03 0 2152 47.02% 87 414
Poisson uplink 14.95 0 1875 45.63% 61 427
Exponential uplink 12.41 0 1143 49.68% 94 393
Table 3-5: Different methods characteristics for COCR [RD1] domains duration and COCR number of sectors per domain
Using these parameters, figures 3-25 to 3-30 and table 3-5 shows that differences between instance generation methods are not meaningful and will be less simulating for more aircraft. It is important to recall that in terms of computational time pseudo-deterministic and exponential methods are really similar, exponential is a little bit faster but not so much. On the other hand, Poisson’s method is considerably slower. The reason of this is the function implementation: exponential function returns the number of seconds between instances while Poisson function returns true if at the analyzed second an instance arrives and false if not so, all seconds are tested.
In conclusion, all three methods can be used for global simulation over ECAC Area with no meaningful differences in terms of capacity as population (number of aircraft) will be high.

Centre National d'Etudes Spatiales EPSC (UPC)
SATCOM for ATM Issue : Date : 22/07/2009
Rev. : Date : 22/07/2009
Reference : TFC report Page : 42
3.2.2. Estimation of capacity required for AMS(R)S communications around 2020 over European Area
Starting from the present information about future data communications services, provided by the document COCR [RD1] and EUROCONTROL STATFOR data for 2020, capacity estimation for a satellite data communications system has been carried out. The results are presented in the current document.
3.2.2.1. Simulation profile
Before presenting the capacity results, it is important to define the main input parameters used for the simulation as well as the communication profile.
From now on if no other information about it is presented, European Area will be considered as the sector of Earth included between latitude 15º to 85º and longitude -40º to 40º. The European area is divided in cells of 0.5º in both directions that can be considered the spatial granularity parameter of the simulation.
For the whole simulation, 45000 flights over 24h. at European Area have been considered. It is a EUROCONTROL forecast for a 2020 busy day. It is important to say that flights coming from previous day and ending next day are not considered so results at firsts five hours and last five hours of the day should not be considered. The interesting results are the central ones, where the maximum appears.
From all services described at COCR [RD1], the following phase II AOC, ATSC and NET unicast services (the ones concerning safety satellite communications) have been considered over TMA and ENR domains:
ATSC Services:
Service Name Service Id
ACL 1
ACM 2
AMC 5
ARMAND 6
COTRAC-L 8
COTRAC-W 9
D-ALERT 10
D-ATIS Arrival 11
D-ATIS Departure 12
Service Name Service Id
DCL 13
D-FLUP 14
DLL 15
D-ORIS 16
D-OTIS 17
D-RVR 18
DSC 19
D-SIG 20
D-SIGMET 21
Service Name Service Id
D-TAXI 22
DYNAV 23
FLIPCY 24
FLIPINT 25
PPD 32
SAP CS 33
SAP R 34
URCO 37

Centre National d'Etudes Spatiales EPSC (UPC)
SATCOM for ATM Issue : Date : 22/07/2009
Rev. : Date : 22/07/2009
Reference : TFC report Page : 43
AOC Services:
Service Name Service Id
AOCDLL 39
CABINLOG 40
ENGINE 41
FLTLOG 42
FLTPLAN 43
FLTSTAT 44
FREETXT 45
FUEL 46
Service Name Service Id
GATES 47
LOADSHT 48
MAINTPR 49
MAINTRT 50
NOTAM 51
OOOI 52
POSRPT 53
SWLOAD 54
Service Name Service Id
TECHLOG 55
UPLIB 56
WXGRAPH 57
WXRT 58
WXTEXT 59
NET Services:
Some services from COCR [RD1] deserve special attention as they have specific characteristics, and some assumptions must be carried out to simulate their behavior for a satellite communications system:
ATSC Services:
A-EXEC: This service is only applicable on a very limited basis in critical situations so it has not been considered.
AIRSEP: This service is only used on AOA domain so, it has not been considered.
C&P, M&S, PAIRAPP and SURV: This service is sent every 3 seconds on ENR and TMA domains. It has not been considered as his frequency is too high.
TIS-B: This service is not necessary for phase 2.
D-ALERT: One instance per aircraft has been considered.
Services defined “for 30% of aircraft” at COCR [RD1]: Only one of three domains is considered.
The rest of services described at COCR [RD1] that are not presented on this document are broadcast
Service Name Service Id
NETCONN 60
NETKEEP 61
Centre National d'Etudes Spatiales EPSC (UPC)
SATCOM for ATM Issue : Date : 22/07/2009
Rev. : Date : 22/07/2009
Reference : TFC report Page : 44
services.
AOC Services:
WXGRAPH: The number of bytes sent at every instance of this service is much larger than the rest of the services (21077 bytes). Then, a simulation with and another without this service has been carried out in order to compute his influence basically on global uplink capacity.
NET Services:
NETKEEP: This is a keep-alive service, exchanged to maintain the status of the connection. As we are dealing with a satellite system and as it is only sent every 30 minutes, this message will not be sent as frequently as if it were a terrestrial system so, only in ENR domain has been considered.
Other important parameters used for the simulation are the following ones:
Time between instances of the same service: 3 seconds
Propagation time: 1 second
Number of ENR sectors: 1/720 seconds
TMA 1 duration / number of sectors: 420 seconds / 2 sectors
TMA 2 duration / number of sectors: 600 seconds / 3 sectors
From the three instances generation methods presented previously, pseudo-deterministic and exponential inter-arrival time methods (this method is the same than Poisson’s, but more efficient at computational time) have been studied. Pseudo-deterministic method results are presented hereafter. Finally, a comparison with the exponential inter-arrival time method results is carried out.
It will be seen that some testing simulations of the results have been done in order to validate the output data.

Centre National d'Etudes Spatiales
SATCOM for ATM
Reference : TFC report
3.2.2.2. Pseudo-deterministic method results
Aircraft at airspace:
Figure 3-31: Number of aircraft at TMA/ENR
Figure 3-31 shows the number of aircraft flying along the day. The maximum is 9.4% of the whole number of aircrafts.
Figure 3-32 shows the number of active aircraft (in communication process) in both directions: uplink and downlink. The maximum number of simultaneous active aircraft is important to see that the two maximums dondominant service on one direction not present on the other direction. It will be seen that this service is WXGRAPH.
Cell Number:
Figure 3-33: Number of squared 0.5º communication process cells with aircraft
EPSC (UPC)
SATCOM for ATM Issue :
Rev. :
Page : 45
deterministic method results
Active aircraft:
raft at TMA/ENR domain Figure 3-32: Number of aircraft in communication process both uplink and downlink
shows the number of aircraft flying along the day. The maximum is 4237of the whole number of aircrafts.
shows the number of active aircraft (in communication process) in both directions: uplink and downlink. The maximum number of simultaneous active aircraft is 2153 downlink and 1221important to see that the two maximums don’t occur at the same time. This observation means that there is one
on one direction not present on the other direction. It will be seen that this service is WXGRAPH.
Active cells:
.5º latitude/longitude Figure 3-34: Number of squared 0.5º latitude/longitude in communication process cells with aircraft cells with active aircraft both uplink and downlink
Date : 22/07/2009
Date : 22/07/2009
: Number of aircraft in communication process
4237 around 14:20. It represents
shows the number of active aircraft (in communication process) in both directions: uplink and downlink. 1221 uplink, almost one half. It is
’t occur at the same time. This observation means that there is one on one direction not present on the other direction. It will be seen that this service is WXGRAPH.
: Number of squared 0.5º latitude/longitude in cells with active aircraft both uplink and downlink

Centre National d'Etudes Spatiales
SATCOM for ATM
Reference : TFC report
European Area has been defined as a matrix of 33, the number of cells with at less one aircraft flying along the day is presented. The maximum number of cells is 2332 and it occurs at 13:45.
Figure 3-34 represents the number of cells where active cells downlink and 955 active cells uplink.
Uplink Capacity:
Figure 3-35: Uplink required load
These two figures show the most importantaeronautical data communications according to COCR
For uplink communications (figure 3presented without WXGRAPH service,
For downlink communications (figure 3capacity. Figure 3-37 permits to compare orders of magnitude in both directions:
EPSC (UPC)
SATCOM for ATM Issue :
Rev. :
Page : 46
European Area has been defined as a matrix of 160x140 squared cells of 0.5º of latitude and longitude. At , the number of cells with at less one aircraft flying along the day is presented. The maximum number of cells is
represents the number of cells where flights are active in both directions. There is a maximum of active cells uplink.
Downlink Capacity:
Figure 3-36: Downlink required load
show the most important information of the assessment: the required load (in aeronautical data communications according to COCR [RD1] and the communications profile defined.
3-35), there is a capacity peak of 3507 Kbps. Later, the same graphic will be without WXGRAPH service, in order to show its influence on uplink capacity.
figure 3-36), the capacity peak is 1236 Kbps, approximately 1/3 average of uplink permits to compare orders of magnitude in both directions:
Date : 22/07/2009
Date : 22/07/2009
squared cells of 0.5º of latitude and longitude. At figure 3-, the number of cells with at less one aircraft flying along the day is presented. The maximum number of cells is
flights are active in both directions. There is a maximum of 1461
: Downlink required load
information of the assessment: the required load (in kbps) for and the communications profile defined.
. Later, the same graphic will be to show its influence on uplink capacity.
, approximately 1/3 average of uplink

Centre National d'Etudes Spatiales
SATCOM for ATM
Reference : TFC report
Figure 3-37: Uplink &
ATSC/AOC Uplink Capacity:
Figure 3-38: Separated ATSC/AOC uplink required load
EPSC (UPC)
SATCOM for ATM Issue :
Rev. :
Page : 47
: Uplink & downlink required load for aeronautical communications
ATSC/AOC Downlink Capacity:
C uplink required load Figure 3-39: Separated ATSC/AOC downlink required load
Date : 22/07/2009
Date : 22/07/2009
ownlink required load for aeronautical communications
ATSC/AOC Downlink Capacity:
: Separated ATSC/AOC downlink required load

Centre National d'Etudes Spatiales
SATCOM for ATM
Reference : TFC report
Figures above represent separated capacity contribution for ATSC and AOC servicesNET services have been considered AOC services)needed capacity for AOC services. At downlink, ATSC services capacity is almost eight times AOC services’. It could result strange because this result is absolutely opposite to uplink’s. Later, the influence of WXGRAPH service on AOC uplink capacity will be analyzed and this result will be cl
Priority 1/2 Services Uplink Capacity:
Figure 3-40: Separated priorities uplink required load
Different priorities has not been taken into account to develop the capacity assessmentequally on priority terms), but a services classification has been carriedservices that could be deterministic (priority 1) and services that could be bestfigures 3-40 and 3-41, priority 2 services need more capacity than priority 1 services, overcoat at uplinkWXGRAPH influence). It is necessary to remark that this is a tentative classification.
EPSC (UPC)
SATCOM for ATM Issue :
Rev. :
Page : 48
separated capacity contribution for ATSC and AOC servicesNET services have been considered AOC services). At uplink, capacity for ATSC services isneeded capacity for AOC services. At downlink, ATSC services capacity is almost eight times AOC services’. It could result strange because this result is absolutely opposite to uplink’s. Later, the influence of WXGRAPH service
OC uplink capacity will be analyzed and this result will be cleared up.
Priority 1/2 Services Uplink Capacity: Priority 1/2 Services Downlink Capacity:
uplink required load Figure 3-41: Separated priorities
Different priorities has not been taken into account to develop the capacity assessment, but a services classification has been carried out. All services
could be deterministic (priority 1) and services that could be best-effort (priority 2). According to , priority 2 services need more capacity than priority 1 services, overcoat at uplinkIt is necessary to remark that this is a tentative classification.
Date : 22/07/2009
Date : 22/07/2009
separated capacity contribution for ATSC and AOC services (NET load is much smaller so capacity for ATSC services is almost one fifth of the
needed capacity for AOC services. At downlink, ATSC services capacity is almost eight times AOC services’. It could result strange because this result is absolutely opposite to uplink’s. Later, the influence of WXGRAPH service
Priority 1/2 Services Downlink Capacity:
priorities downlink required load
Different priorities has not been taken into account to develop the capacity assessment (all services are treated All services have been set between
effort (priority 2). According to , priority 2 services need more capacity than priority 1 services, overcoat at uplink (see

Centre National d'Etudes Spatiales
SATCOM for ATM
Reference : TFC report
Instance services contribution uplink:
Figure 3-42: Percentage of instances pe
Figures above show the percentage of instances for each service at both directions. Services from 1 to 38 are ATSC services, services from 39 to 59 are AOC services, and 60 and 61 are NET services. Uplink that instances are distributed without any prevailing service. The most instanced service is D
Downlink figure 3-43 show that SAPevery 10 seconds. The same graphic without SAP
The global number of instances sent along the day is approximately
EPSC (UPC)
SATCOM for ATM Issue :
Rev. :
Page : 49
s contribution uplink: Instance services contribution d
: Percentage of instances per service uplink Figure 3-43: Percentage of instances
Figure 3-44: Percentage of instances per service downlink without considering SAP-R (service 34)
Figures above show the percentage of instances for each service at both directions. Services from 1 to 38 are ATSC services, services from 39 to 59 are AOC services, and 60 and 61 are NET services. Uplink
hout any prevailing service. The most instanced service is D
show that SAP-R is instanced much more than other services every 10 seconds. The same graphic without SAP-R is presented at figure 3-44.
The global number of instances sent along the day is approximately 9.9M uplink and
Date : 22/07/2009
Date : 22/07/2009
s contribution downlink:
: Percentage of instances per service downlink
: Percentage of instances per service downlink R (service 34)
Figures above show the percentage of instances for each service at both directions. Services from 1 to 38 are ATSC services, services from 39 to 59 are AOC services, and 60 and 61 are NET services. Uplink figure 3-42 show
hout any prevailing service. The most instanced service is D-OTIS (9%).
R is instanced much more than other services (68%) as it is instanced once
uplink and 31,8M downlink.

Centre National d'Etudes Spatiales
SATCOM for ATM
Reference : TFC report
Bit services contribution uplink:
Figure 3-45: Percentage of bits sent per service uplink
Figure 3-47: Percentage of bits sent per service uplinkwithout considering WXGRAPH (service 57)
Figures 3-45, 3-46 and 3-47 show the that although WXGRAPH service is not the most instanced service, requires high capacity (almost 77%), as its size is 21077 bytes, much bigger than the rest. The same graphic without this service is also presented.
At downlink graphic, SAP-R is the service with higher number of bits sent as it is the most instanced service too.
The whole number of bits sent is 1.4e11 for uplink and 5e10 downlink. Although there are more instances downlink, WXGRAPH service makes the number
EPSC (UPC)
SATCOM for ATM Issue :
Rev. :
Page : 50
Bit services contribution downlink:
ent per service uplink Figure 3-46: Percentage of bits sent per service downlink
: Percentage of bits sent per service uplink without considering WXGRAPH (service 57)
show the percentage of bits sent for each service. It is fast to see on uplink graphic that although WXGRAPH service is not the most instanced service, requires high capacity (almost 77%), as its size
, much bigger than the rest. The same graphic without this service is also presented.
R is the service with higher number of bits sent as it is the most instanced service too.
The whole number of bits sent is 1.4e11 for uplink and 5e10 downlink. Although there are more instances downlink, WXGRAPH service makes the number of bits uplink higher.
Date : 22/07/2009
Date : 22/07/2009
Bit services contribution downlink:
Percentage of bits sent per service downlink
It is fast to see on uplink graphic that although WXGRAPH service is not the most instanced service, requires high capacity (almost 77%), as its size
, much bigger than the rest. The same graphic without this service is also presented.
R is the service with higher number of bits sent as it is the most instanced service too.
The whole number of bits sent is 1.4e11 for uplink and 5e10 downlink. Although there are more instances downlink,

Centre National d'Etudes Spatiales EPSC (UPC)
SATCOM for ATM Issue : Date : 22/07/2009
Rev. : Date : 22/07/2009
Reference : TFC report Page : 51
WXGRAPH influence:
Figure 3-48: Global uplink capacity with and without WXGRAPH
As it has been said, there is a high influence of WXGRAPH service over uplink capacity because of its large size. The figure above shows the global uplink bit rate with and without this service. The needed uplink capacity is reduced more than 4 times. The uplink capacity peak without this service is 913 kbps, absolutely different than the 3.5 Mbps needed with it. The variance of the capacity is reduced too.
It is important to say that this service practically has no influence on downlink capacity.
WXGRAPH has been considered a priority 2 AOC service. Other figures comparing uplink capacity with and without this service can be found at annexe A.

Centre National d'Etudes Spatiales
SATCOM for ATM
Reference : TFC report
3.2.2.3. Exponential inter
The same simulator with this different instance generation method has been developed in order to compare the results. Three different program versions have been tested and output data of the one which results aconsistent with previous method is presented. Naturally, the aircraft and cell number results are the same than with the previous method (flights and traffic information is the same).
Uplink Capacity:
Figure 3-49: Uplink required load using both ingeneration methods: exponential and pseudo
As it can be seen on figures abovedifference that uplink capacity is a little bit larger and downlink capacity is a little bit lower.
Service contribution Uplink:
Figure 3-51: Percentage of instances per for both methods: exponential and pseudo
EPSC (UPC)
SATCOM for ATM Issue :
Rev. :
Page : 52
Exponential inter-arrival time method results
The same simulator with this different instance generation method has been developed in order to compare the results. Three different program versions have been tested and output data of the one which results aconsistent with previous method is presented. Naturally, the aircraft and cell number results are the same than with
and traffic information is the same).
Downlink Capacity:
oad using both instance Figure 3-50: Downlink required load using both instance generation methods: exponential and pseudo-determ. generation methods: exponential and pseudo
n on figures above, overall communications profile is alike the previous one with the main difference that uplink capacity is a little bit larger and downlink capacity is a little bit lower.
Service contribution Downlink:
ces per service uplink Figure 3-52: Percentage of instances per service downlink for both methods: exponential and pseudo-determ. for both methods: exponential and pseudo
Date : 22/07/2009
Date : 22/07/2009
The same simulator with this different instance generation method has been developed in order to compare the results. Three different program versions have been tested and output data of the one which results are more consistent with previous method is presented. Naturally, the aircraft and cell number results are the same than with
: Downlink required load using both instance generation methods: exponential and pseudo-determ.
ile is alike the previous one with the main difference that uplink capacity is a little bit larger and downlink capacity is a little bit lower.
Service contribution Downlink:
: Percentage of instances per service downlink for both methods: exponential and pseudo-determ.

Centre National d'Etudes Spatiales EPSC (UPC)
SATCOM for ATM Issue : Date : 22/07/2009
Rev. : Date : 22/07/2009
Reference : TFC report Page : 53
Figure 3-53: Percentage of instances per service downlink for both methods: exponential and pseudo-determ. Without SAP-R (service 34)
Percentage of instances and bits per service are presented hereafter. These figures permit us to compare the results accurately as well as analyze the small difference between two methods.
There are some more WXGRAPH instances with exponential method. As WXGRAPH is the most capacity contributor service, the global capacity becomes a little bit larger.
Opposite behaviour for downlink services: there are some less SAP-R instances than with pseudo-deterministic method so global capacity becomes a little bit lower.
Numerical results can be seen at table 5-6:
Exponential Peak
Capacity Increase vs.
Pseudo-determ. Global instances
number Increase vs.
Pseudo-determ.
Uplink 3.725 Mbps 6.2% 9923282 0.15%
Downlink 1.19 Mbps -3.8% 29514682 -7%
Table 3-6: Numerical results using exponential instance generation method and pseudo-deterministic method comparison

Centre National d'Etudes Spatiales
SATCOM for ATM
Reference : TFC report
3.2.2.4. Validation Tests
Simulator outputs are different text files containing all output information. These output files two lists:
Global files: contain a single output parameter number for each simulated second.
Detailed files: contain all parameters insecond.
A sample of these files content can be found at
In order to accept the results and extract specific information from output data, a testing C program has been developed:
- Sum of capacities of each instance at every second must be the same that the capacity contained at global file at both uplink and downlink directions.
- Sum of instances multiplied by capacity/instglobal file at both uplink and downlink directions. A sample of this test and 3-55:
- Sum of flights at detailed files must be the flights number at global file.
- Number of instances per service must be consistent with input d
- Exponential and Pseudoexposed.
Validated Global Uplink Capacity:
Figure 3-54: Validated global uplink required load
All these tests have been carried out with
EPSC (UPC)
SATCOM for ATM Issue :
Rev. :
Page : 54
Tests
Simulator outputs are different text files containing all output information. These output files
: contain a single output parameter number for each simulated second.
: contain all parameters information, every instance, capacity, area and flight for each
A sample of these files content can be found at annexe B.
In order to accept the results and extract specific information from output data, a testing C program has been
of capacities of each instance at every second must be the same that the capacity contained at global file at both uplink and downlink directions.
Sum of instances multiplied by capacity/instance ratio must be the same thanile at both uplink and downlink directions. A sample of this test results
Sum of flights at detailed files must be the flights number at global file.
Number of instances per service must be consistent with input data.
Exponential and Pseudo-Deterministic methods results must be consistent and similar, as have been
: Validated Global Downlink Capacity
54: Validated global uplink required load Figure 3-55: Validated global downlink required load
All these tests have been carried out with satisfactory results.
Date : 22/07/2009
Date : 22/07/2009
Simulator outputs are different text files containing all output information. These output files can be classified in
: contain a single output parameter number for each simulated second.
formation, every instance, capacity, area and flight for each
In order to accept the results and extract specific information from output data, a testing C program has been
of capacities of each instance at every second must be the same that the capacity contained at
ance ratio must be the same than capacity contained at results is presented at figures 3-54
Deterministic methods results must be consistent and similar, as have been
idated Global Downlink Capacity:
Validated global downlink required load

Centre National d'Etudes Spatiales
SATCOM for ATM
Reference : TFC report
3.2.2.5. ESA’s European Area Test
European Space Agency (ESA), through University of Snot as close as expected to CNES ones. ESA’s uplink obtained capacity is larger than CNES’, and downlink obtained capacity is lower.
In order to identify the differences to bring results closer, CNES has executed a simulation over ESA’s EuropArea of study. This area is not squared so flights and the results are presented over ESA’s area of study and with blue colour same results over CNES area of study.
Uplink Capacity:
Figure 3-56: Required uplink load at ESA & CNES areas
As it can be seen, results are almost the same over ESA European Area and CNESpeak results are 32.8 Kbps uplink and 11.8 Kbps downlinkdifferences on European Area is not a cause of difference on capacity res
3.2.2.6. Type of aircraft
Along a conversation with ESA agentsdifferent aircraft types:
• Type I aircraft equipped with basic data
• Type II aircraft equipped with COTRAC
Before that, CNES had considered that all aircraft usesome ATSC services that are only sent by type I or type new input parameter: the percentage of Type II aircraft.aircraft type. Using this parameter CNES and ESA results are more 2025 University of Saalzburg’s inputs and average values
EPSC (UPC)
SATCOM for ATM Issue :
Rev. :
Page : 55
ESA’s European Area Test
European Space Agency (ESA), through University of Saalzburg has developed a similar studynot as close as expected to CNES ones. ESA’s uplink obtained capacity is larger than CNES’, and downlink
In order to identify the differences to bring results closer, CNES has executed a simulation over ESA’s Europ. This area is not squared so a program has been done in order to f
and the results are presented at figures 3-56 and 3-57; with green colour there are CNES input traffic results dy and with blue colour same results over CNES area of study.
Downlink Capacity:
ad at ESA & CNES Figure 3-57: Required downlink load at ESA & CNES areas
almost the same over ESA European Area and CNESKbps uplink and 11.8 Kbps downlink larger than CNES results so it can be concluded that
differences on European Area is not a cause of difference on capacity results.
Type of aircraft
ESA agents, CNES realized that as explained in COCR [RD1]
Type I aircraft equipped with basic data-link
Type II aircraft equipped with COTRAC capabilities
Before that, CNES had considered that all aircraft used all services, but it was not a realistic assumptionservices that are only sent by type I or type II aircraft so, the simulator have been modified including a
er: the percentage of Type II aircraft. The simulator uses a uniform random function to determine this parameter CNES and ESA results are more consistent (not the same because ESA is using
inputs and average values while CNES is using 2020
Date : 22/07/2009
Date : 22/07/2009
similar study whose results are not as close as expected to CNES ones. ESA’s uplink obtained capacity is larger than CNES’, and downlink
In order to identify the differences to bring results closer, CNES has executed a simulation over ESA’s European been done in order to filter ESA’s flights over CNES’ ; with green colour there are CNES input traffic results
dy and with blue colour same results over CNES area of study.
: Required downlink load at ESA & CNES
almost the same over ESA European Area and CNES’ one. ESA European Area larger than CNES results so it can be concluded that
[RD1], they have considered two
a realistic assumption. There are aircraft so, the simulator have been modified including a
The simulator uses a uniform random function to determine (not the same because ESA is using
CNES is using 2020 Eurocontrol inputs and peak

Centre National d'Etudes Spatiales
SATCOM for ATM
Reference : TFC report
values). New CNES results for 80% of type II aircraft and 20% of type I aircraftpresented hereafter:
Figure 3-58: Uplink and downlink nee
Moreover, as it can be seen at, SAPorder to simulate this behavior, it has been considered one instance every 30s, a valid assumption accordinnumbers law. This little change reduces downlink capacity almost 200 Kbps.
As It can be seen at figure 3-58, uplink needed Mbps), while downlink needed peak Kbps). This is because of the fact that SAPonly is instanced by type I aircraft. are presented simultaneously:
EPSC (UPC)
SATCOM for ATM Issue :
Rev. :
Page : 56
for 80% of type II aircraft and 20% of type I aircrafts (as forecasted by Eurocontrol)
: Uplink and downlink needed load with 80% of type II aircraft
Moreover, as it can be seen at, SAP-R at ENR domain is defined as “one instance , it has been considered one instance every 30s, a valid assumption accordin
This little change reduces downlink capacity almost 200 Kbps.
, uplink needed peak load has decreased a little bitpeak load has decreased significantly, almost one third
is because of the fact that SAP-R, the most instanced service without taking into account aircraft type, only is instanced by type I aircraft. Next figures corroborate this fact. Previous and present services contributions
Date : 22/07/2009
Date : 22/07/2009
(as forecasted by Eurocontrol) are
ded load with 80% of type II aircraft
every 10s 30% of the time”. In , it has been considered one instance every 30s, a valid assumption according to big
load has decreased a little bit (from 3.507 Mbps to 3.447 almost one third (from 1.236 Mbps to 810.5
R, the most instanced service without taking into account aircraft type, us and present services contributions

Centre National d'Etudes Spatiales EPSC (UPC)
SATCOM for ATM Issue : Date : 22/07/2009
Rev. : Date : 22/07/2009
Reference : TFC report Page : 57
Service contribution Uplink: Service contribution Downlink:
Figure 3-59: Percentage of instances per service uplink Figure 3-60: Percentage of instances per service downlink for 80% type II aircraft and without type aircraft for 80% type II aircraft and without type aircraft
Figure 3-61: Percentage of instances per service downlink for 80% type II aircraft and without type aircraft both without SAP-R
There are several important conclusions that can be extracted from graphics. First of all, the only services whose percentage of instances decreases are services for only type I aircraft (6, 13, 19, 24, 33 and 34) or only type II aircraft (8, 9, 23 and 37). Percentage of the rest of services increases as consequence of this fact (the instances number is the same).
SAP-R downlink delivers special attention again: as now it is only used by 20% aircrafts, instances number is reduced a lot and so, ATSC downlink capacity, as can be seen hereafter:

Centre National d'Etudes Spatiales
SATCOM for ATM
Reference : TFC report
ATSC/AOC Uplink Capacity:
Figure 3-62: Separated ATSC/AOC uplink required load
It is easy to see comparing with previous results that only ATSC(439 Kbps). ATSC uplink capacity has decreased a little bit (100
Finally, in order to evaluate aircraft type contribution, several simulations with different type II aircraft percentages have been carried out. Peak values of cpercentage of type II aircraft is, the higher the needed load is.
0% type II
aircraft
Uplink 3.138 Mbps
Downlink 617.6 Kbps
Table 3-7: Needed load for different type II
It is important to remember that many parameters will probably change (for example, percentage of type II aircraft)The main objective is to offer a global approximation and to evaluate hrequirements.
3.2.2.7. Sectorization contribution
In order to evaluate air space sectors size sectors/domain have been carried out. Results are presented next:
EPSC (UPC)
SATCOM for ATM Issue :
Rev. :
Page : 58
ATSC/AOC Downlink Capacity:
C uplink required load Figure 3-63: Separated ATSC/AOC downlink required load
It is easy to see comparing with previous results that only ATSC downlink capacity has suffered significant changes ). ATSC uplink capacity has decreased a little bit (100 Kbps).
Finally, in order to evaluate aircraft type contribution, several simulations with different type II aircraft percentages carried out. Peak values of capacity are presented at table 3-7. It can be seen that the higher
, the higher the needed load is.
50% type II aircraft
60% type II aircraft
80% type II aircraft
3.311 Mbps 3.396 Mbps 3.447 Mbps
726.8 Kbps 751.3 Kbps 810.5 Kbps
: Needed load for different type II/type I aircraft percentage
It is important to remember that many assumptions are being carried out along the assessment, that service (for example, percentage of type II aircraft) even some of them will never be used.
The main objective is to offer a global approximation and to evaluate how input parameters affect
contribution
In order to evaluate air space sectors size influence over global capacity, simulations with different number of sectors/domain have been carried out. Results are presented next:
Date : 22/07/2009
Date : 22/07/2009
ATSC/AOC Downlink Capacity:
: Separated ATSC/AOC downlink required load
downlink capacity has suffered significant changes
Finally, in order to evaluate aircraft type contribution, several simulations with different type II aircraft percentages . It can be seen that the higher
80% type II aircraft
100% type II aircraft
3.447 Mbps 3.564 Mbps
810.5 Kbps 888.3 Kbps
aircraft percentage
assumptions are being carried out along the assessment, that service even some of them will never be used. ow input parameters affect capacity
over global capacity, simulations with different number of

Centre National d'Etudes Spatiales EPSC (UPC)
SATCOM for ATM Issue : Date : 22/07/2009
Rev. : Date : 22/07/2009
Reference : TFC report Page : 59
TMA1 (duration/sectors)
ENR (sector’s duration)
TMA2 (duration/sectors)
Uplink load Downlink load
420s / 2 720 s 600s / 3 3.447 Mbps 810.5 Kbps
420s / 1 720 s 600s / 2 3.438 Mbps (-9 Kbps) 803.1 Kbps (-7.4 Kbps)
420s / 3 720 s 600s / 4 3.450 Mbps (+3 Kbps) 816.0 Kbps (+5.5 Kbps)
420s / 2 600 s 600s / 3 3.453 Mbps (+3 Kbps) 900.3 Kbps (+89.8
Kbps)
420s / 2 840 s 600s / 3 3.374 Mbps (-73 Kbps) 740.2 Kbps (-70.3 Kbps)
420s / 1 840 s 600s / 2 3.368 Mbps (-79 Kbps) 736.2 Kbps (-74.3 Kbps)
420s / 3 600 s 600s / 4 3.456 Mbps (+9 Kbps) 911.5 Kbps (+101 Kbps)
Table 3-8: Required load for different number of sectors and different sector’s duration
At first row there are the original values, the ones used for simulations before. Input values in bold type are modified values. Two last output rows represent lower and upper borders, and they set the variance margin on needed load due to increasing and decreasing one sector per TMA domain and one minute per ENR sector’s duration: 88 Kbps uplink and 175 Kbps downlink.
The reason why downlink margin is bigger than uplink margin (even when absolute value is lower) is clear: WXGRAPH, the prevailing uplink service, is defined periodically, independently of sector number. Only changes on flight times would modify uplink capacity considerably.
To finish this section, it is important to emphasize that:
• After test and verification, it can be said that results are correct according to COCR [RD1] requirements.
• Uplink resulting bit rate has a hard dependency on WXGRAPH service.
• The most emphasizing service on downlink bit rate is SAP-R, but not as dependent as WXGRAPH on uplink bit rate.
• There is no significant difference between Pseudo-Deterministic and Exponential instance generation methods, as it was expected.
• Type I/II aircraft consideration has an important impact on global bit rate and it has brought results between CNES and ESA closer. Both entities had agreed a figure number of needed useful load for ATM safety communications to suggest to ITU (International Telecommunication Union).
• It must be taken into account that COCR [RD1] requirements are a starting point for ATM safety communications. It means that most of the services defined will suffer changes and so, all results obtained at the present assessment, but it provides an idea of the figure numbers that will be treated.

Centre National d'Etudes Spatiales
SATCOM for ATM
Reference : TFC report
4. COMMUNICATIONS PROTO
CNES developed a complex compariscommunications: S-UMTS (Satellite (Satellite – All-purpose Multi-channel Aviation Communications System)requirements document [RD17] was
Astrium developed a GMR-1 simulator behavior, simulation parameters and results hav1 simulator to compare outputs. Resu
4.1. ACKNOWLEDGEMENT IMPL
Previous to Astrium protocol evaluation, packet ESA did on his simulator. The aim is to evaluate the capacity weight of this ACK messages.
Bidirectional ACK messages of 77 bytescapacity with and without ACK messages is compared
Uplink Capacity:
Figure 4-1: Global uplink required loadwithout ACK
It is important to remember that these resultsprevious standard input values.
EPSC (UPC)
SATCOM for ATM Issue :
Rev. :
Page : 60
COMMUNICATIONS PROTOCOL ASSESSMENT
complex comparison between three communication protocols that c(Satellite – Universal Mobile Telecommunications System)
channel Aviation Communications System). After that and according to, a was written and delivered to Astrium for a protocol implementation.
1 simulator (Satellite Simulator Platform) for CNES. In order to validate the protocol behavior, simulation parameters and results have been analyzed and CNES net load has been introduced to GMR
sults are presented at section 4.3.1.
ACKNOWLEDGEMENT IMPLEMENTATION
protocol evaluation, packet responses have been implemented at CNES net simulator. The aim is to evaluate the capacity weight of this ACK messages.
77 bytes (as ESA’s) are sent a second after messages reception and capacity with and without ACK messages is compared hereafter:
Downlink Capacity:
uplink required load with and Figure 4-2: Global downlink required load ACK
these results were taken for 80% of Type II aircraft at CNES European Zone with
Date : 22/07/2009
Date : 22/07/2009
COL ASSESSMENT
protocols that could suit well for ATM Universal Mobile Telecommunications System), GMR-1 and S-AMACS
After that and according to, a protocol implementation.
CNES. In order to validate the protocol e been analyzed and CNES net load has been introduced to GMR-
have been implemented at CNES net load simulator as simulator. The aim is to evaluate the capacity weight of this ACK messages.
a second after messages reception and global
downlink required load with and without
were taken for 80% of Type II aircraft at CNES European Zone with

Centre National d'Etudes Spatiales EPSC (UPC)
SATCOM for ATM Issue : Date : 22/07/2009
Rev. : Date : 22/07/2009
Reference : TFC report Page : 61
Maximum required load
with ACK Increase of required load
due to ACK Percentage of increase
Uplink 3.572 Mbps 125 Kbps 3.5%
Downlink 902 Kbps 92 Kbps 10.1%
Table 4-1: Acknowledgement contribution data
It can be seen at graphics 4-1 and 4-2 that ACK messages addition behaves seemingly as a load multiplier as load increase is proportional to its previous value and the profile distribution shape along the day does not change significantly.
4.2. DESCRIPTION OF GMR1 STANDARD
Information from this section has been extracted from [RD16].
4.2.1. Introduction to GMR1
The GMR-1 (Geo Mobile Radio-1) air interface has been developed for a mobile satellite to support circuit switched services. The interface definition draws its heritage from the internationally accepted and successful GSM terrestrial cellular specification, including a migration path to GPRS or UMTS packet switched (PS) service, yet it incorporates many important features that optimize it to the peculiarities of the satellite channel. Some unique capabilities are provided which do not exist in the terrestrial system that are very important in the satellite system, such as integrated position-based services and single-hop terminal to terminal calling. The air interface has been standardized jointly by ETSI (European Telecommunications Standard Institute) and GMR1.
4.2.2. From GSM to GMR1
The evolution from GSM/GPRS to GMR-1/GMPRS is presented at figure 4-3:
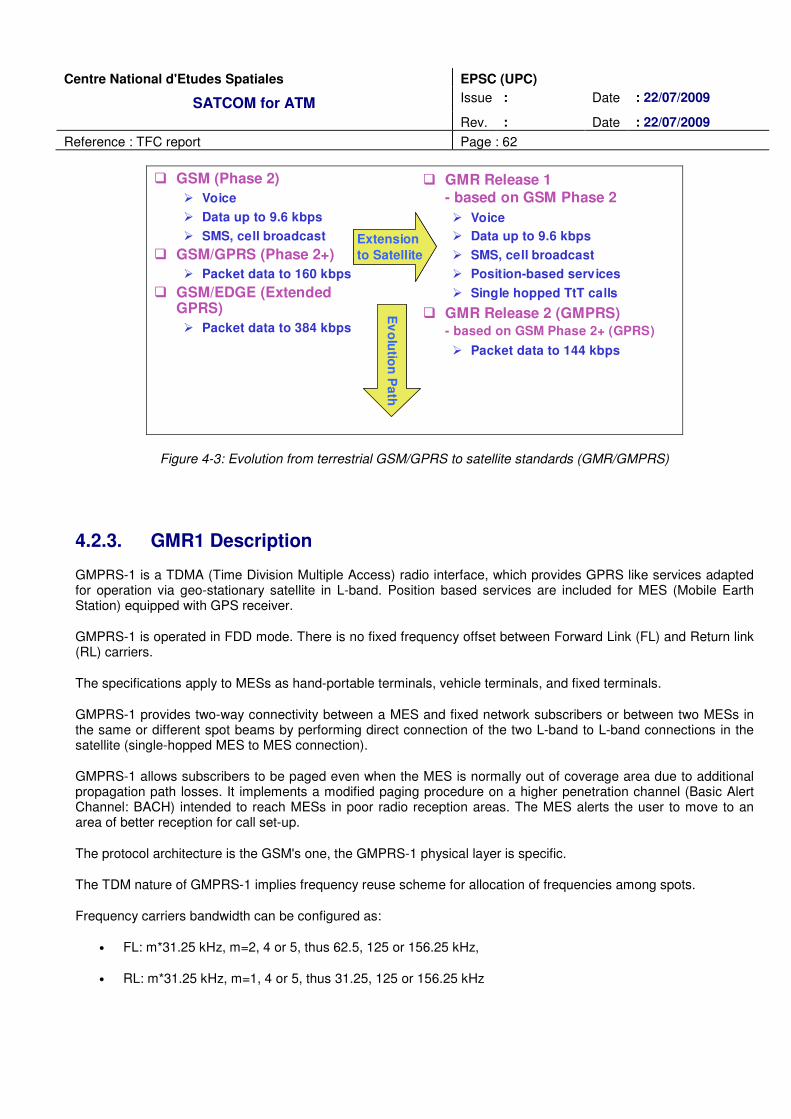
Centre National d'Etudes Spatiales EPSC (UPC)
SATCOM for ATM Issue : Date : 22/07/2009
Rev. : Date : 22/07/2009
Reference : TFC report Page : 62
� GSM (Phase 2) � Voice
� Data up to 9.6 kbps
� SMS, cell broadcast
� GSM/GPRS (Phase 2+)� Packet data to 160 kbps
� GSM/EDGE (Extended GPRS)� Packet data to 384 kbps
� GMR Release 1- based on GSM Phase 2� Voice� Data up to 9.6 kbps
� SMS, cell broadcast
� Position-based services
� Single hopped TtT calls
� GMR Release 2 (GMPRS)- based on GSM Phase 2+ (GPRS)
� Packet data to 144 kbps
Extensionto SatelliteExtensionto Satellite
Ev
olu
tion
Path
Ev
olu
tion
Path
Figure 4-3: Evolution from terrestrial GSM/GPRS to satellite standards (GMR/GMPRS)
4.2.3. GMR1 Description
GMPRS-1 is a TDMA (Time Division Multiple Access) radio interface, which provides GPRS like services adapted for operation via geo-stationary satellite in L-band. Position based services are included for MES (Mobile Earth Station) equipped with GPS receiver.
GMPRS-1 is operated in FDD mode. There is no fixed frequency offset between Forward Link (FL) and Return link (RL) carriers.
The specifications apply to MESs as hand-portable terminals, vehicle terminals, and fixed terminals.
GMPRS-1 provides two-way connectivity between a MES and fixed network subscribers or between two MESs in the same or different spot beams by performing direct connection of the two L-band to L-band connections in the satellite (single-hopped MES to MES connection).
GMPRS-1 allows subscribers to be paged even when the MES is normally out of coverage area due to additional propagation path losses. It implements a modified paging procedure on a higher penetration channel (Basic Alert Channel: BACH) intended to reach MESs in poor radio reception areas. The MES alerts the user to move to an area of better reception for call set-up.
The protocol architecture is the GSM's one, the GMPRS-1 physical layer is specific.
The TDM nature of GMPRS-1 implies frequency reuse scheme for allocation of frequencies among spots.
Frequency carriers bandwidth can be configured as:
• FL: m*31.25 kHz, m=2, 4 or 5, thus 62.5, 125 or 156.25 kHz,
• RL: m*31.25 kHz, m=1, 4 or 5, thus 31.25, 125 or 156.25 kHz

Centre National d'Etudes Spatiales EPSC (UPC)
SATCOM for ATM Issue : Date : 22/07/2009
Rev. : Date : 22/07/2009
Reference : TFC report Page : 63
TDMA frames are 40 ms duration and segmented in 24 time slots (slot duration ~ 1.67 ms).
For traffic, radio resource allocation unit for packet channels is Packet Normal Burst (PNB) defined as:
• for 125 kHz and for 156,25 kHz carriers : 3 time slots,
• for 31.25 kHz carrier (RL) : 6 time slots,
• for 62.5 kHz carrier (FL): 6 time slots.
Initial random access is done on 31.25 kHz carriers bandwidth only.
There is asymmetrical pairing for the case of FL 62.5 kHz carrier: it is paired to 2 RL 31.25 kHz carriers, one carrying traffic, and the other carrying random access.
GMPRS-1 allows resource sharing on both FL and RL: different packet data logical channels, i.e. different signalling or traffic packet can be multiplexed on the same physical channel (PCH). The MES identity allows the MES to determine if the received packets were directed to it. Resource sharing on RL implies tight MES synchronisation.
GMPRS-1 provides the following physical layer configurations:
• Modulation: • Symbol rate per carrier: m*23.4 ksps, m=2, 4 or 5 for FL, m=1, 4 or 5 for RL. The number m
corresponds to the number m used to calculate the frequency bandwidth of the channels above
• Pulse shaping using a root raised cosine filter with a roll-off factor of 0.35
• For traffic, Common Control Channels (CCCH) and Broadcast Control Channel (BCCH): Π/4-CQPSK (Coherent QPSK)
• For signalling channels (SDCCH, FACCH): Π/4-CBPSK (Coherent BPSK). This, along with some additional Forward Error Correction (FEC), allows these channels to operate in a disadvantaged channel condition compared to the normal traffic channels
• To save MES battery and satellite power, reduce co-channel interference, add-comfort noise, and maintain the power control and timing/frequency synchronization, a Dual Keep-Alive-Burst (DKAB) is transmitted during periods of speech/traffic inactivity: Π/4-DBPSK (Differential BPSK)
• For higher penetration alerting channel (BACH): 6-PSK (Phase Shift Keying)
• For frequency correction (Frequency Correction Channel: FCCH): real chirp signal spanning three slots
• Channel coding: convolutional coding with constraint length of 5 and rates of 1/2,3/5, 5/8, 7/10, 3/4, 4/5
• Interleaving: intra-burst or inter-burst
• Error protection: 8, 12 or 16 bits CRC
• Frame duration: 40 ms
One main carrier carries common signalling and traffic while additional carriers carry traffic only.
A multi-frame is made of 64 frames. Its structure is specified so that particular positions are reserved for common signalling for BCCH, FCCH, etc., on the main carrier. This consumes 6% of the main forward carrier capacity. In case basic alerting (BACH) is used, the common signalling consumes up to 25% of the main carrier capacity.

Centre National d'Etudes Spatiales EPSC (UPC)
SATCOM for ATM Issue : Date : 22/07/2009
Rev. : Date : 22/07/2009
Reference : TFC report Page : 64
Main parameters are synthesised in the following table:
Multiplexing TDM
Duplex mode FDD, Possibility of asymmetric
RL/FL Half-duplex and full-duplex modes for MES
supported
Carrier Bandwidth 31.25 kHz *m
FL : m=2, 4, 5 � 62.5/125/156.25 kHz RL : m=1, 4, 5 � 31.25/125/156.25 kHz
Nb carriers per sub-bands
5 carriers � Granularity of carrier allocation per spot = 1 sub-band = 5 carriers
Bandwidth pairing
1 FL 62.5 kHz carrier paired with 2 RL 31.25 kHz carriers
No fixed frequency offset between paired carriers
Asymmetric pairing applies only to m=1 in RL/m=2 in FL
1 RL carrier carries data, the other RL carrier carries PRACH
Minimum Freq. reuse 3
Frequency planning Required Frequency reuse to be adjusted according to spot
size and satellite antenna C/I
Required Rx C/N From 2.5 to 8.1 dB depending on coding rate and channel bandwidth
MES sensitivity From –110 to –115 dBm (depending on coding rate and channel bandwidth)
OBO operating point 2 dB if multi-carrier satellite
transponder, else 1 dB
In case of multi-carrier satellite transponder, the opportunity to optimize OBO (which is inherent to
TDMA) is lost
MES antenna diversity gain
None
Common signaling overhead (FL)
6/(24*nb FL carriers) 25% of the main carrier if BACH allocated, else 6%
Maximum data rate per carrier (FL)
From 47.2 to 148.8 kbps depending on coding rate and channel bandwidth
Data rate variation Explicit allocation from the network, requires signaling exchange
Maximum doppler Return link : 528 Hz
Forward link : 495 Hz Includes both satellite and MES contributions
Maximum level of MES ACLR
due to modulation
1st adjacent channel (@ ±m*31.25 kHz):25 dBc, 2nd adjacent channel (@± m*62.5 kHz):40 dBc, 3rd adjacent channel (@± m*93.75 kHz):53 dBc,
4th adjacent channel and beyond (> ± m*125 kHz):60 dBc
Maximum level of ACLR due to switching transients for MES.
1st adjacent channel (@ ±m*31.25 kHz):18 dBc, 2nd adjacent channel (@± m*62.5 kHz):33 dBc,
3rd adjacent channel (@± m*93.75 kHz) : 46 dBc, 4th adjacent channel and beyond (> ± m*125 kHz) : 53 dBc
ACS minimum level for MES.
@ m*31.25 kHz : 15 dB, @ m*93.75 kHz : 25 dB, > 500 kHz : 45 dB
Table 4-2: GMR1 main parameters

Centre National d'Etudes Spatiales EPSC (UPC)
SATCOM for ATM Issue : Date : 22/07/2009
Rev. : Date : 22/07/2009
Reference : TFC report Page : 65
Architecture:
The GMR-1 system extends terrestrial GSM cellular system coverage. The GMR-1 system provides GSM-like services and features such as voice, data, fax, point-to-point short messages service, cell broadcast short message service and supplemental services between mobile and fixed users and provides world-wide connectivity through public and private switched telecommunications networks. Fixed network connectivity includes the Public Switched Telephone Network (PSTN); Public Land Mobile Networks (PLMNs); and private networks (PN).
The elements of a typical GMR-1 system are shown in the following figure:
Space segment
Spot-beamcoverageat L-band
Feeder links
Mobile Earth Stations
PSTN
PSTN
Gatewaystations
Gateway station
PSTNGS
SOC
PSTN
Figure 4-4: Example of GMR-1 system elements
The system elements include one or more GEO satellites, a Satellite Operations Centre (SOC), a number of Gateway Stations (GS), and a large number of user terminals, referred to as Mobile Earth Stations (MES) in the GMR-1 specifications. The Gateway stations have external interfaces to existing fixed telecommunications infrastructure as well as to the GSM mobility management networks. A GS includes one or more gateway transceiver subsystems (GTS) which correspond to a GSM BTSs, one or more gateway station controllers (GSC), which correspond to a GSM BSCs, one or more mobile switching centres (MSC) which may be GSM MSCs, and one Traffic Control Subsystem (TCS) which has no corresponding functional element in the GSM base station. The GMR-1 TCS is required to support position based services, optimal routing and other satellite specific services and features, not found in GSM.
4.3. GMR-1 SIMULATOR ANALYSIS
As it has been said, Astrium has developed a GMR protocol simulator over Linux for CNES. An analysis of its

Centre National d'Etudes Spatiales EPSC (UPC)
SATCOM for ATM Issue : Date : 22/07/2009
Rev. : Date : 22/07/2009
Reference : TFC report Page : 66
inputs and results has been carried out and it is presented on this section.
SSP (Satellite Simulator Platform) has a previous application to convert CNES traffic profile to SSP input format called CNES file reader. This application generates four files:
• Aes_traffic_4H_0.txt, with information of all messages sent (source, destination, message ID, time, packet ID and duration)
• Aes_session.txt, with information about flights LOG-ON (time and duration)
• Aes_position.txt, with information about flights position (latitude, longitude and time)
• Aes_handover.txt, with information about handovers
It uses an input table (services_TNA_CNES.conf) with information about services parameters (ID, quantity of instances, latency, size and priority) and CNES traffic profile files to generate these four files.
These four files, together with a file containing SSP simulator parameters (number of carriers for each logical channel, configuration, etc.) are used as inputs.
Outputs of SSP simulator are several files used in junction to generate several graphics about protocol parameters and behaviour. Some of them will be presented next.
Before analysing output files, an extended work of comprehension of SSP simulator behaviour and its input parameters was carried out. After that, two tasks were developed in order to validate its behaviour:
1) Comparison between SSP simulator results obtained by Astrium and SSP simulator results obtained with CNES traffic profile for different input configurations
2) Modification of PDCH number of carriers and results evaluation.
4.3.1. Comparison between SSP simulator results obtained by Astrium and SSP simulator results obtained with CNES traffic profile for different input configurations
Configuration:
Simulation has been done for four hours. The numbers of carriers considered for PDCH logical channel are:
• 44 carriers for uplink communications = 44 * 31.25 kHz = 1.375 MHz
• 68 carriers for downlink communications = 68 * 31.25 kHz = 2.125 MHz
It has been checked that with two more carriers for each link COCR [RD1] delay requirements are accomplished so, this number of carriers have been selected in order to see if there are collisions.
The other logical control channels implemented on SSP simulator are RACH, PRACH, AGCH, PAGCH, and PACCH. For each of them, an integer number of physical channels have been selected. This is the first bug found on SSP simulator: according to GMR1 standard definition, control channels are mapped over physical channels without using a dedicated physical channel for each of them, only some slots of some frame are used for those control channels. More information about logical channels mapping over physical channels can be found at [].
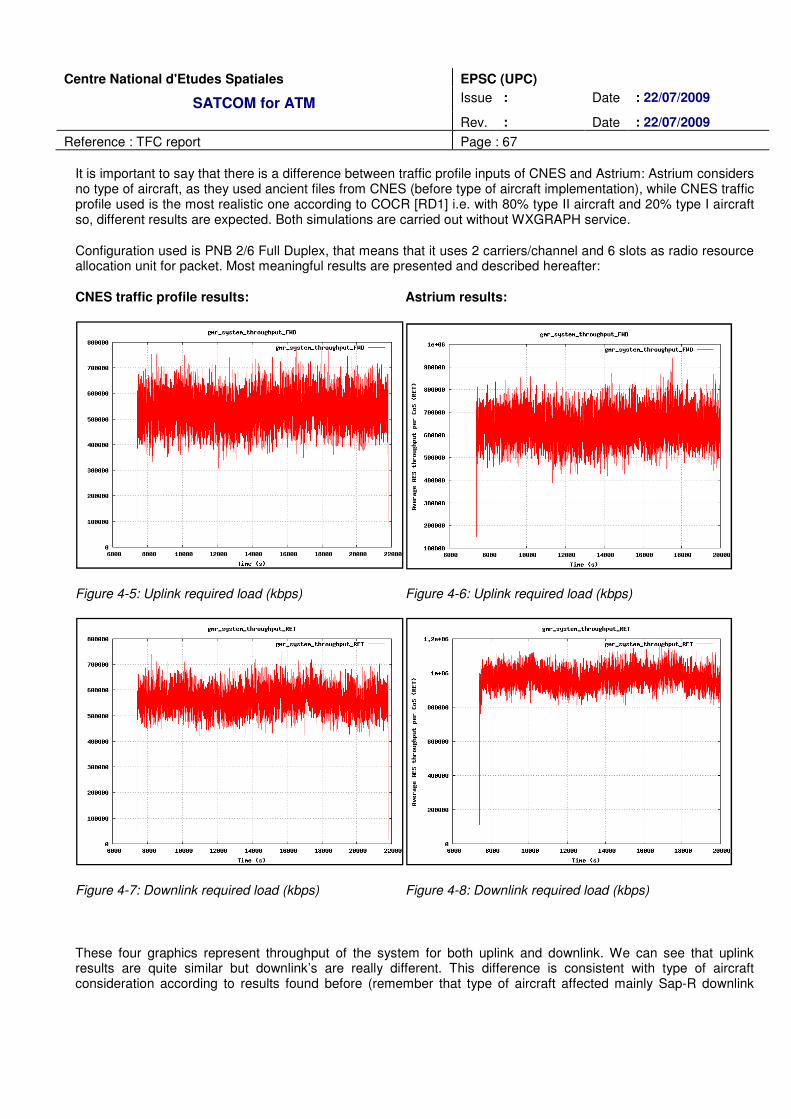
Centre National d'Etudes Spatiales EPSC (UPC)
SATCOM for ATM Issue : Date : 22/07/2009
Rev. : Date : 22/07/2009
Reference : TFC report Page : 67
It is important to say that there is a difference between traffic profile inputs of CNES and Astrium: Astrium considers no type of aircraft, as they used ancient files from CNES (before type of aircraft implementation), while CNES traffic profile used is the most realistic one according to COCR [RD1] i.e. with 80% type II aircraft and 20% type I aircraft so, different results are expected. Both simulations are carried out without WXGRAPH service.
Configuration used is PNB 2/6 Full Duplex, that means that it uses 2 carriers/channel and 6 slots as radio resource allocation unit for packet. Most meaningful results are presented and described hereafter:
CNES traffic profile results: Astrium results:
Figure 4-5: Uplink required load (kbps) Figure 4-6: Uplink required load (kbps)
Figure 4-7: Downlink required load (kbps) Figure 4-8: Downlink required load (kbps)
These four graphics represent throughput of the system for both uplink and downlink. We can see that uplink results are quite similar but downlink’s are really different. This difference is consistent with type of aircraft consideration according to results found before (remember that type of aircraft affected mainly Sap-R downlink

Centre National d'Etudes Spatiales EPSC (UPC)
SATCOM for ATM Issue : Date : 22/07/2009
Rev. : Date : 22/07/2009
Reference : TFC report Page : 68
service) without WXGRAPH.
Figure 4-9: Percentage of PDCH channels utilization Figure 4-10: Percentage of PDCH channels utilization uplink uplink
Figure 4-11: Percentage of PDCH channels utilization Figure 4-12: Percentage of PDCH channels utilization downlink downlink
These graphics show the mean PDCH channel utilization. Results are consistent with previous ones.

Centre National d'Etudes Spatiales EPSC (UPC)
SATCOM for ATM Issue : Date : 22/07/2009
Rev. : Date : 22/07/2009
Reference : TFC report Page : 69
Figure 4-13: PDF of packet delay Figure 4-14: PDF of packet delay
At delay distribution graphics can be seen that there are more messages with a high delay (over 2 seconds) on CNES results than on Astrium ones, what is quite surprising taking into account previous graphics.
Figure 4-15: Number of rejected packets uplink Figure 4-16: Number of rejected packets uplink
On these graphics, collisions can be quantified. It is surprising that there are no collisions downlink. There are uplink collisions on Astrium results but no collisions on CNES ones. This can be considered consistent with previous results, as Astrium’s uplink throughput is much larger than CNES’ one.
Until now, no more conclusions can be extracted. Other simulations with different configurations were done. A comparison of results for different configurations is presented next. Detailed results can be found at annexe C.

Centre National d'Etudes Spatiales EPSC (UPC)
SATCOM for ATM Issue : Date : 22/07/2009
Rev. : Date : 22/07/2009
Reference : TFC report Page : 70
PNB 2/6 Half Duplex:
Using Half Duplex configuration, results show only one difference: packets delay is a little bit larger. Throughput should be lower as there must be a scheduler managing uplink and downlink communications, they cannot be simultaneous, but it doesn’t happen. It was checked that there was a problem with this configuration: no scheduler was implemented so results cannot be validated.
PNB 4/3 Full Duplex:
Differences on results between this configuration and PNB 2/6 Full Duplex are that with this new configuration, less delay and more PDCH channel utilization is obtained. It can be considered consistent as more bandwidth/channel is used.
To sum up, possible inconsistencies found on SSP simulator are:
• Delay and absence of downlink collisions
• Same throughput for Full Duplex and Half Duplex configurations (no scheduler implementation)
4.3.2. Modification of PDCH number of carriers and results evaluation
In order to check absence of downlink collisions problem, other simulations with less number of PDCH carriers were executed. It has been checked that for 20 downlink PDCH carriers, number of collisions uplink increases really fast and there are no downlink collisions although number of uplink PDCH carriers is maintained.
4.3.3. Conclusions
The main information that can be extracted from this section about SSP simulator using GMR-1 standard is:
• There is a problem with SSP simulator implementation, maybe a mixing between uplink and downlink communications.
• There are never collisions at downlink, even if the number of dedicated channels is really low.
• Throughput with full duplex and half duplex configurations is the same one for the same number of carriers. It is probable that there is no half duplex scheduler implementation.
• Same throughput for Full Duplex and Half Duplex configurations (no scheduler implementation)
When I finished my stage at CNES, these conclusions were being commented and analyzed with Astrium so they were not verified at that moment.
GMR-1 standard is not the only standard under study at CNES as commented at the beginning of this section. Astrium has also developed an S-AMACS standard simulator for CNES. These assessments are the beginning point for a satellite-based ATM communications standard and it is prompt to extract meaningful conclusions.
Extended information about satellite communications protocols for ATM can be consulted at [RD16], [RD17], [RD18] and [RD19].

Centre National d'Etudes Spatiales EPSC (UPC)
SATCOM for ATM Issue : Date : 22/07/2009
Rev. : Date : 22/07/2009
Reference : TFC report Page : 71

Centre National d'Etudes Spatiales EPSC (UPC)
SATCOM for ATM Issue : Date : 22/07/2009
Rev. : Date : 22/07/2009
Reference : TFC report Page : 72
5. ECONOMICAL VIABILITY FOR SATELLITE SYSTEMS PROVIDINGSAFETY AERONAUTICAL COMMUNICATIONS
In the past, it has been already demonstrated that satellite systems can cope with the new safety aeronautical communication performances. Nevertheless, they have been rejected because of economical reason: high cost, poor return on investment, etc.
So as to demonstrate that a satellite-based system can propose an economical viable solution, ESA and CNES funded a joint to study dealing with the business case of such a solution [RD20]. A summary of the results of this activity is presented on this section.
5.1. SATELLITE SOLUTIONS FOR SAFETY AERONAUTICAL COMMUNICATIONS
Several options in terms of space, ground or user segment were investigated to seek for the more suitable solution for each one of the deployment scenarios considered. With regard to the space segment, only geostationary solutions have been considered because of cost impact on the business case. Non-geostationary solutions could provide better performances in terms of latency, coverage and redundancy, but the current mission scenario can be supported by geostationary solutions (regional coverage, data-link is less sensitive to GEO propagation delay, geostationary redundancy is enough).
Three different options have been retained:
• Dedicated space segment covering the ECAC area and also an extended area (global beam)
• Dedicated payload on a host platform covering the ECAC area (piggy-back case)
• Rented capacity on existing satellites
All of them aim to fulfill mission requirements but CAPEX (CAPital EXpenditures), opportunity and risks for each one are different.
Since capacity needs of safety aeronautical communications are quite low, a small payload can cope with the mission needs. The antenna size and their accommodation are one of the most critical points. Its size depends on the terminal performance and the system coverage. Several options have been analyzed form multi-beams to single beam solution constrained to a rigid reflector easy to accommodate within the launcher fairing. The single beam solution appeared to be the one presenting the best performances in terms of gain. Besides, this solution allows to reducing the number of handovers to deal with, so reducing the system complexity.
In the aircraft terminal domain, the main drivers are the antenna and the HPA (High Power Amplifier) dissipation. In order to reduce the cost terminal, the use of omni-directional antenna and passive cooling was selected.
Using such architecture, the QoS requirements are supported by the system. Dedicated availability analyses should be conducted in future studies. An inter-redundancy policy (including satellite cold redundancy in order to cope with eventual satellite outage) instead of an intra-redundancy scheme was selected.

Centre National d'Etudes Spatiales EPSC (UPC)
SATCOM for ATM Issue : Date : 22/07/2009
Rev. : Date : 22/07/2009
Reference : TFC report Page : 73
5.2. MARKET STRUCTURE AND SERVICE PROVISION
The major uncertainties are not in the technical domain, but in the commercial environment and the organizational structure required for the delivery of a mobile aeronautical satellite service for ATSC and AOC.
In the past, several satellite communication providers have worked on aeronautical communication (Iridium, Globalstar) but the mission requirements slow down their motivation: a small amount of data has to be transmitted with a high QoS required. Return on investment for aeronautical communication appeared not to be as advantageous as other open markets.
In addition to the normal constraints and regulations that would be applied to satellite communications, a future Satcom for ATM will also be subject to the constraints and regulations that apply to the provision of Air Navigation Services. With the advent of Single European Sky (SESAR) initiative, these have converged for the ECAC area. Nevertheless, the need for a high reliable communication system leads to a carriage mandate of communication avionics. This is a major difference between past situation and the future one. A carriage mandate implies a minimum guaranteed market, i.e. guaranteed revenues.
For the experience, it is known that a limited competition could be necessary to reduce the monopolistic effects even if the market is quite small. Depending on the market structure and the service provision, competition could be done in different ways or parts of the value chain.
The provision of AOC services is open to all kind of systems, so there will be an open competition between existing (Inmarsat, Iridium, HFDL, VDL2, etc.) and new systems.
With regard to current terrestrial communication services, the supply chain for a satellite-based service will be slightly different. New actors due to satellite component will enter in the market: satellite manufacturers, launchers, satellite operator, satellite service provider, etc.
In such a context, satellite communication service can be provided in two different ways to the end-user:
• A bundled service from a CSP including other data-link services: in this case the CSP takes full responsibility for the end-end service.
• A directly service from the Hub-Gateway Operator: this option implies an unbundling of services. Under this situation, the end-user has different contracts with each communication providers (satellite service provider, terrestrial data-link provider, etc.). In this case, it assumes increased responsibilities: communication management and multiple agreements for each communication system.
In general, success of any satellite initiative providing safety aeronautical communications will no doubt depend on the acceptance by airlines. The new operational concept proposed by SESAR foresees an important reduction of the airlines charges, which is a key point for their acceptance. FCI is one of the enablers to achieve the benefits of the new operational concept. A new satellite-based communication system must demonstrate that it will provide benefits to FCI while satisfying the regulatory requirements (e.g. safety).

Centre National d'Etudes Spatiales EPSC (UPC)
SATCOM for ATM Issue : Date : 22/07/2009
Rev. : Date : 22/07/2009
Reference : TFC report Page : 74
5.3. BUSINESS CASE FOR THE SATELLITE OPERATOR
5.3.1. The selected business scenarios
In the preset study, the key question is to evaluate: who is going to pay for the satellite system for ATM? This study aims at checking if a satellite operator can be attracted by the ATM communications business. The main assumptions for this business case are listed hereafter:
• ECAC coverage (en-route, ATM and oceanic areas)
• Carriage mandate of satellite communications avionics for ATSC.
• AOC market open to competition
• Inter-redundancy policy between terrestrial and satellite communication systems
• Two dedicated satellites in the satellite system
Figure 5-1: Identification of possible scenarios
Due to the high number of scenarios, only one will be studied. The business case exercise was done with the baseline scenario (Figure 5-1 number 5) using two dedicated satellites. It assumes the need to launch in 2013 a first dedicated satellite (for validation and pre-operational phase), the second one being launched in 2018 in order to obtain the final redundant configuration.
Therefore, it has been assumed that the opportunities to get leased capacity or to share the platform with other
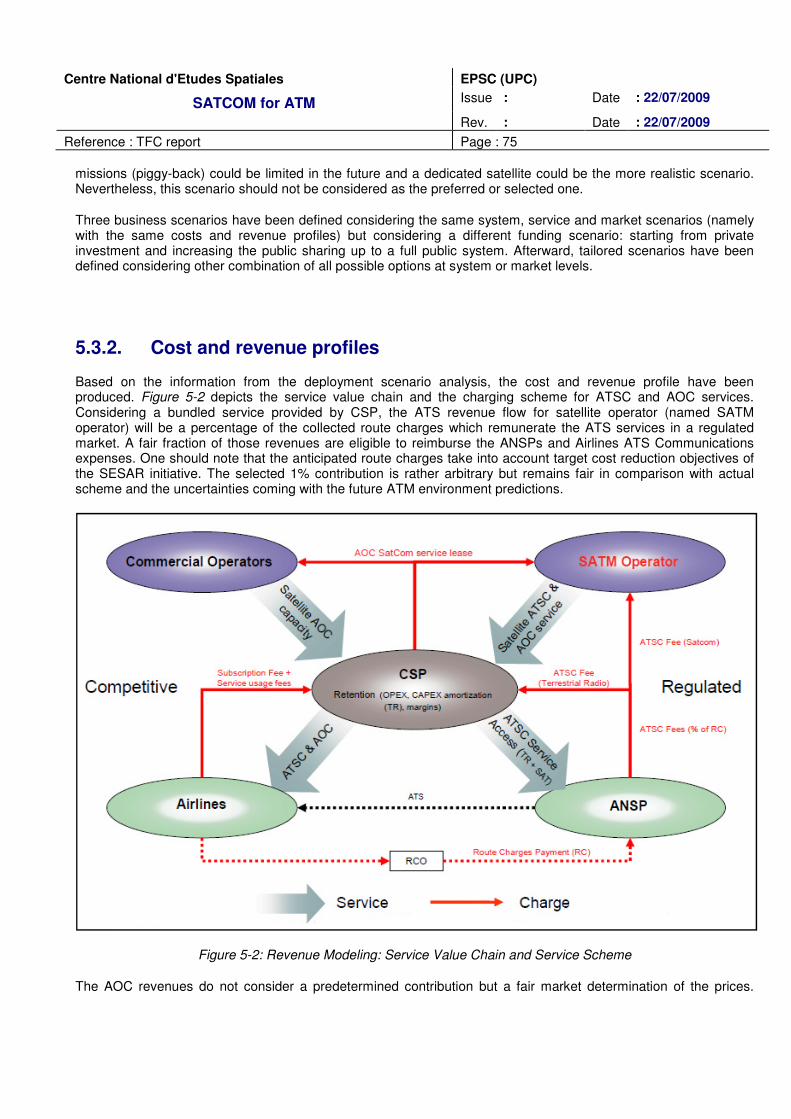
Centre National d'Etudes Spatiales EPSC (UPC)
SATCOM for ATM Issue : Date : 22/07/2009
Rev. : Date : 22/07/2009
Reference : TFC report Page : 75
missions (piggy-back) could be limited in the future and a dedicated satellite could be the more realistic scenario. Nevertheless, this scenario should not be considered as the preferred or selected one.
Three business scenarios have been defined considering the same system, service and market scenarios (namely with the same costs and revenue profiles) but considering a different funding scenario: starting from private investment and increasing the public sharing up to a full public system. Afterward, tailored scenarios have been defined considering other combination of all possible options at system or market levels.
5.3.2. Cost and revenue profiles
Based on the information from the deployment scenario analysis, the cost and revenue profile have been produced. Figure 5-2 depicts the service value chain and the charging scheme for ATSC and AOC services. Considering a bundled service provided by CSP, the ATS revenue flow for satellite operator (named SATM operator) will be a percentage of the collected route charges which remunerate the ATS services in a regulated market. A fair fraction of those revenues are eligible to reimburse the ANSPs and Airlines ATS Communications expenses. One should note that the anticipated route charges take into account target cost reduction objectives of the SESAR initiative. The selected 1% contribution is rather arbitrary but remains fair in comparison with actual scheme and the uncertainties coming with the future ATM environment predictions.
Figure 5-2: Revenue Modeling: Service Value Chain and Service Scheme
The AOC revenues do not consider a predetermined contribution but a fair market determination of the prices.

Centre National d'Etudes Spatiales EPSC (UPC)
SATCOM for ATM Issue : Date : 22/07/2009
Rev. : Date : 22/07/2009
Reference : TFC report Page : 76
Competition with both terrestrial and satellite systems have been considered. The today pricing schemes along the value chain are based on forecasts starting from the today’s reference. The use of AOC is expected to grow rapidly from 2014 to provide more services more frequently. In parallel, it is foreseen that the AOC capacity exploitation will be optimized with new techniques. As a consequence the expected AOC total volume in kbps per A/C should double in 10 years.
In figure 5-3, the step in the revenue profile flow is linked to the assumption that this service is conditioned by the certification of the operator in conjunction to the full equipment of the airlines fleets. The dashed area stands for revenues that could be generated if the system is able to provide ATM services on an extended footprint out of the nominal coverage area of Europe.
5.3.3. A PPP to operate the satellite communication service
The selection of the best suited solution is based on the following key drivers:
• Operator viability/service permanency
• Cost efficiency/profitability
• Exposure to market, space and liability risks
• Quality of Service vs. charging
• Integration in the ATM environment
The business case exercise demonstrates that a Private Public Partnership (PPP) option provides the best compromise in terms of financing, risk sharing, robustness to market uncertainties and permanency over the years. The analysis of a Private Venture (PV) situation shows that the profitability is too low to attract private investors considering the baseline cost and revenues. In a Public Procurement (PP) case, the high investment to be supported by public entities due to the lack of private funds could be the constraint. Therefore, PPP solution seems to be the most appropriate for this type of mission.
The PPP scenario assumes that the first satellite will be paid by a public entity, whereas second satellite and operations are led using private funds. The public development agencies will support completely the initial investment and then handover the purchased assets to a concessionaire when necessary.

Centre National d'Etudes Spatiales EPSC (UPC)
SATCOM for ATM Issue : Date : 22/07/2009
Rev. : Date : 22/07/2009
Reference : TFC report Page : 77
Figure 5-3: Simulated revenue flow for nominal scenario
The simulations show that an interesting IIR (Internal Rate of Return) (21% over 20 years) for the satellite service provider can be achieved under a PPP scheme while using quite pessimistic market parameters. Therefore, if the most expensive scenario presents a positive business case, the rest of scenarios should have better performances in terms of IIR.
Extended information about the economical viability for satellite systems providing safety aeronautical communications can be found at [RD6] and [RD20].
5.4. CONCLUSIONS
In general, this studio demonstrates that a satellite-based system for safety aeronautical communications is economically viable. Surely, institutional issues associated with a supranational service provision need to be addressed and solved by the aviation community to accept such a solution. A new dedicated solution, using dedicated payloads or leased capacity, can meet the future aviation needs even in dense continental airspace while being affordable for the aviation community.
Centre National d'Etudes Spatiales EPSC (UPC)
SATCOM for ATM Issue : Date : 22/07/2009
Rev. : Date : 22/07/2009
Reference : TFC report Page : 78
6. CONCLUSIONS AND WAY FORWARD
Nowadays, design phase of the future air-ground communications system is in a starting point, and many considerations and different points of view must be considered before taking crucial decisions. One of them is a good forecast of the communications profile and a correct definition of the services that will be used. All stakeholders from aeronautical and space communities, as well as regulatory entities, should work together to success at system design and it is necessary to get agree in several key points. Before thinking about which is the best technology, service requirements and characteristics should be correctly defined and with it, a forecasted capacity assessment for the communications system. For example, it is almost sure that there will be 4D contracts, but does anybody know how to define it?
About capacity results presented at this document it must be taken into account that COCR [RD1] requirements are a starting point for ATM safety communications. It means that most of the services defined will suffer changes and so, most of results obtained, but this document provides an idea of the figure numbers that will be treated.
WXGRAPH service current definition is being a discussion fact between aeronautical stakeholders and communications system designers. The first ones think that this is an imperative service and the second ones, that this service compromises too much system design. This has been demonstrated within the results obtained.
Another key point is the communications protocol selected in case a satellite solution is used. CNES is working on it jointly with Astrium and Thales Alenia.
The economic viability of a satellite based solution demonstrates that it is economically viable. Surely, institutional issues associated with a supranational service provision need to be addressed and solved by the aviation community to accept such a solution.
What I want to transmit is that there is a lot of work to do in order to get a good system to ATM communications and this work cannot stop taking into account the future air traffic growing forecasted.
PERSONAL EVALUATION
I would like to hereby state that my stage at CNES has been a very fulfilling experience as I applied very different knowledge acquired along my university life period, like programming, telematics, aeronautics and communications. It has woken up on me a high interest for future aeronautical communications system design and the wish to continue working on it even if it is in a company or if it is in a thesis program.

Centre National d'Etudes Spatiales EPSC (UPC)
SATCOM for ATM Issue : Date : 22/07/2009
Rev. : Date : 22/07/2009
Reference : TFC report Page : 79

Centre National d'Etudes Spatiales
SATCOM for ATM
Reference : TFC report
TÍTOL DEL TFC/PFC: ESTIMATION OF CAPACITY REQUIRED FOR AMS(R)S COMMUNICATIONS AROUND 2020 OVER EUROPEAN AREA
TITULACIÓ: Tècnica Aeronàutica, especialitat Aeronavegació
AUTOR: Albert Casquero Rovira
DIRECTOR: Xavier Prats Menéndez
DATA: 22 de juliol de 2009
EPSC (UPC)
SATCOM for ATM Issue :
Rev. :
Page : 80
ANNEX
ESTIMATION OF CAPACITY REQUIRED FOR AMS(R)S COMMUNICATIONS AROUND 2020 OVER EUROPEAN AREA
Aeronàutica, especialitat Aeronavegació
DIRECTOR: Xavier Prats Menéndez
Date : 22/07/2009
Date : 22/07/2009
ESTIMATION OF CAPACITY REQUIRED FOR AMS(R)S COMMUNICATIONS

Centre National d'Etudes Spatiales EPSC (UPC)
SATCOM for ATM Issue : Date : 22/07/2009
Rev. : Date : 22/07/2009
Reference : TFC report Page : 81

Centre National d'Etudes Spatiales EPSC (UPC)
SATCOM for ATM Issue : Date : 22/07/2009
Rev. : Date : 22/07/2009
Reference : TFC report Page : 82
ANNEX A: SIMULATION RESULTS OBTAINED
VALIDATION OF RESULTS WITHOUT TAKING INTO ACCOUNT TYPE OF AIRCRAFT
Figure A-1: Validation of uplink bit rate by adding capacity from detailed files

Centre National d'Etudes Spatiales EPSC (UPC)
SATCOM for ATM Issue : Date : 22/07/2009
Rev. : Date : 22/07/2009
Reference : TFC report Page : 83
Figure A-2: Validation of downlink bit rate by adding capacity from detailed files
Figure A-3: Validation of uplink capacity by conversion from access files to capacity

Centre National d'Etudes Spatiales EPSC (UPC)
SATCOM for ATM Issue : Date : 22/07/2009
Rev. : Date : 22/07/2009
Reference : TFC report Page : 84
Figure A-4: Validation of downlink capacity by conversion from access files to capacity

Centre National d'Etudes Spatiales EPSC (UPC)
SATCOM for ATM Issue : Date : 22/07/2009
Rev. : Date : 22/07/2009
Reference : TFC report Page : 85
RESULTS SORTED BY PRIORITY
Figure A-5: Comparison between priority 1 and priority 2 uplink load without WXGRAPH (priority 2)

Centre National d'Etudes Spatiales EPSC (UPC)
SATCOM for ATM Issue : Date : 22/07/2009
Rev. : Date : 22/07/2009
Reference : TFC report Page : 86
Figure A-6: Comparison between priority 1 and priority 2 uplink load with WXGRAPH
Figure A-7: Comparison between priority 1 and priority 2 downlink load

Centre National d'Etudes Spatiales EPSC (UPC)
SATCOM for ATM Issue : Date : 22/07/2009
Rev. : Date : 22/07/2009
Reference : TFC report Page : 87
Figure A-8: Comparison between global uplink capacity and uplink priority 2 capacity without WXGRAPH
Figure A-9: Comparison between global uplink capacity and uplink priority 2 capacity with WXGRAPH

Centre National d'Etudes Spatiales EPSC (UPC)
SATCOM for ATM Issue : Date : 22/07/2009
Rev. : Date : 22/07/2009
Reference : TFC report Page : 88
Figure A-10: Comparison between global downlink capacity and downlink priority 2 capacity
Figure A-11: Compararison between global uplink capacity and uplink priority 1 capacity

Centre National d'Etudes Spatiales EPSC (UPC)
SATCOM for ATM Issue : Date : 22/07/2009
Rev. : Date : 22/07/2009
Reference : TFC report Page : 89
Figure A-12: Comparison between global downlink capacity and downlink priority 1 capacity

Centre National d'Etudes Spatiales EPSC (UPC)
SATCOM for ATM Issue : Date : 22/07/2009
Rev. : Date : 22/07/2009
Reference : TFC report Page : 90
DIFFERENT ATSC/AOC SERVICES’ RESULTS
Figure A-13: Global uplink capacity with and without WXGRAPH

Centre National d'Etudes Spatiales EPSC (UPC)
SATCOM for ATM Issue : Date : 22/07/2009
Rev. : Date : 22/07/2009
Reference : TFC report Page : 91
Figure A-14: Comparison between global uplink capacity and ATSC uplink capacity
Figure A-15: Comparison between global downlink capacity and ATSC downlink capacity
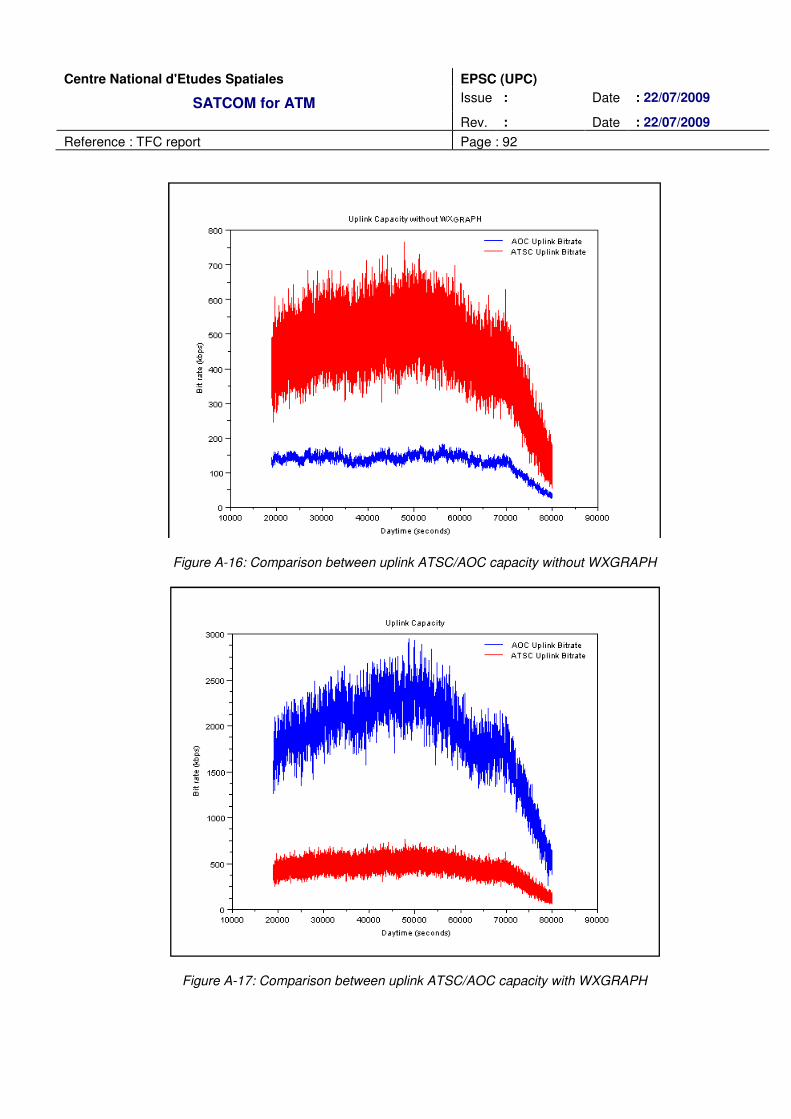
Centre National d'Etudes Spatiales EPSC (UPC)
SATCOM for ATM Issue : Date : 22/07/2009
Rev. : Date : 22/07/2009
Reference : TFC report Page : 92
Figure A-16: Comparison between uplink ATSC/AOC capacity without WXGRAPH
Figure A-17: Comparison between uplink ATSC/AOC capacity with WXGRAPH

Centre National d'Etudes Spatiales EPSC (UPC)
SATCOM for ATM Issue : Date : 22/07/2009
Rev. : Date : 22/07/2009
Reference : TFC report Page : 93
Figure A-18: Comparison between global and AOC uplink capacity without WXGRAPH
Figure A-19: Comparison between global uplink capacity and AOC uplink capacity without WXGRAPH

Centre National d'Etudes Spatiales EPSC (UPC)
SATCOM for ATM Issue : Date : 22/07/2009
Rev. : Date : 22/07/2009
Reference : TFC report Page : 94
Figure A-20: Comparison between global uplink capacity and AOC uplink capacity
Figure A-21: Comparison between global downlink capacity and AOC downlink capacity

Centre National d'Etudes Spatiales EPSC (UPC)
SATCOM for ATM Issue : Date : 22/07/2009
Rev. : Date : 22/07/2009
Reference : TFC report Page : 95
RESULTS FOR 80% TYPE II AIRCRAFT
Figure A-22: Global uplink and downlink capacity for 80% type II aircraft (as COCR [RD1])

Centre National d'Etudes Spatiales EPSC (UPC)
SATCOM for ATM Issue : Date : 22/07/2009
Rev. : Date : 22/07/2009
Reference : TFC report Page : 96
Figure A-23: Uplink instances sent with 80% type II aircraft and without taking into account type of aircraft
Figure A-24: Downlink instances sent with 80% type II aircraft and without taking into account type of aircraft

Centre National d'Etudes Spatiales EPSC (UPC)
SATCOM for ATM Issue : Date : 22/07/2009
Rev. : Date : 22/07/2009
Reference : TFC report Page : 97
Figure A-25: ATSC/AOC uplink capacity for 80% type II aircraft
Figure A-26: ATSC/AOC downlink capacity for 80% type II aircraft

Centre National d'Etudes Spatiales EPSC (UPC)
SATCOM for ATM Issue : Date : 22/07/2009
Rev. : Date : 22/07/2009
Reference : TFC report Page : 98
ANNEX B: SAMPLE OF RESULT FILES OBTAINED BY SIMULATOR
DETAILED ACCESS FILE
Access-----TIME:55500-----Acft:4008-----Cells:2132-----Cell_on_do:319-----
Cell:-0.500000;0.000000;51.000000;51.500000;2;1;1;4;1
DO:21;1;27055
Cell:-1.000000;-0.500000;51.500000;52.000000;3;4;4;11;3
DO:18;1;27112
DO:48;1;27617
DO:60;1;29305
Cell:12.500000;13.000000;55.500000;56.000000;2;0;1;3;1
DO:58;1;27126
Cell:10.000000;10.500000;52.000000;52.500000;0;0;1;1;1
DO:46;1;27157
Cell:-2.000000;-1.500000;52.000000;52.500000;3;4;3;10;2
DO:11;1;27396
DO:34;1;27396
Cell:-8.500000;-8.000000;43.000000;43.500000;0;0;1;1;1
DO:34;1;27170
Cell:-0.500000;0.000000;39.500000;40.000000;0;0;1;1;1
DO:58;1;27176
DETAILED CAPACITY FILE
Capa-----TIME:1800-----Acft:2-----Cells:2-----Cell_on_up:2-----
Cell:-2.500000;-2.000000;51.000000;51.500000;0;1;0;1;3;137.807693
UP:43;74.461540
UP:51;11.038462
UP:59;52.307693
Cell:14.000000;14.500000;56.000000;56.500000;0;1;0;1;1;96.500000
UP:17;96.500000
Capa-----TIME:1801-----Acft:2-----Cells:2-----Cell_on_up:1-----
Cell:-2.500000;-2.000000;51.000000;51.500000;0;1;0;1;5;394.730774
UP:16;239.000000
UP:43;74.461540
UP:49;17.923077
UP:51;11.038462
UP:59;52.307693

Centre National d'Etudes Spatiales EPSC (UPC)
SATCOM for ATM Issue : Date : 22/07/2009
Rev. : Date : 22/07/2009
Reference : TFC report Page : 99

Centre National d'Etudes Spatiales EPSC (UPC)
SATCOM for ATM Issue : Date : 22/07/2009
Rev. : Date : 22/07/2009
Reference : TFC report Page : 100
ANNEX C: SSP SIMULATOR OUTPUTS
CNES RESULTS FOR PNB 2-6 HALF DUPLEX CONFIGURATION WITH 44-68 CARRIERS
Figure C-1: SSP simulator uplink output capacity

Centre National d'Etudes Spatiales EPSC (UPC)
SATCOM for ATM Issue : Date : 22/07/2009
Rev. : Date : 22/07/2009
Reference : TFC report Page : 101
Figure C-2: SSP simulator downlink output capacity
Figure C-3: SSP simulator uplink PDCH channel utilization

Centre National d'Etudes Spatiales EPSC (UPC)
SATCOM for ATM Issue : Date : 22/07/2009
Rev. : Date : 22/07/2009
Reference : TFC report Page : 102
Figure C-4: SSP simulator downlink PDCH channel utilization
Figure C-5: SSP simulator PDF transmission delay

Centre National d'Etudes Spatiales EPSC (UPC)
SATCOM for ATM Issue : Date : 22/07/2009
Rev. : Date : 22/07/2009
Reference : TFC report Page : 103
Figure C-6: SSP simulator uplink rejected packets
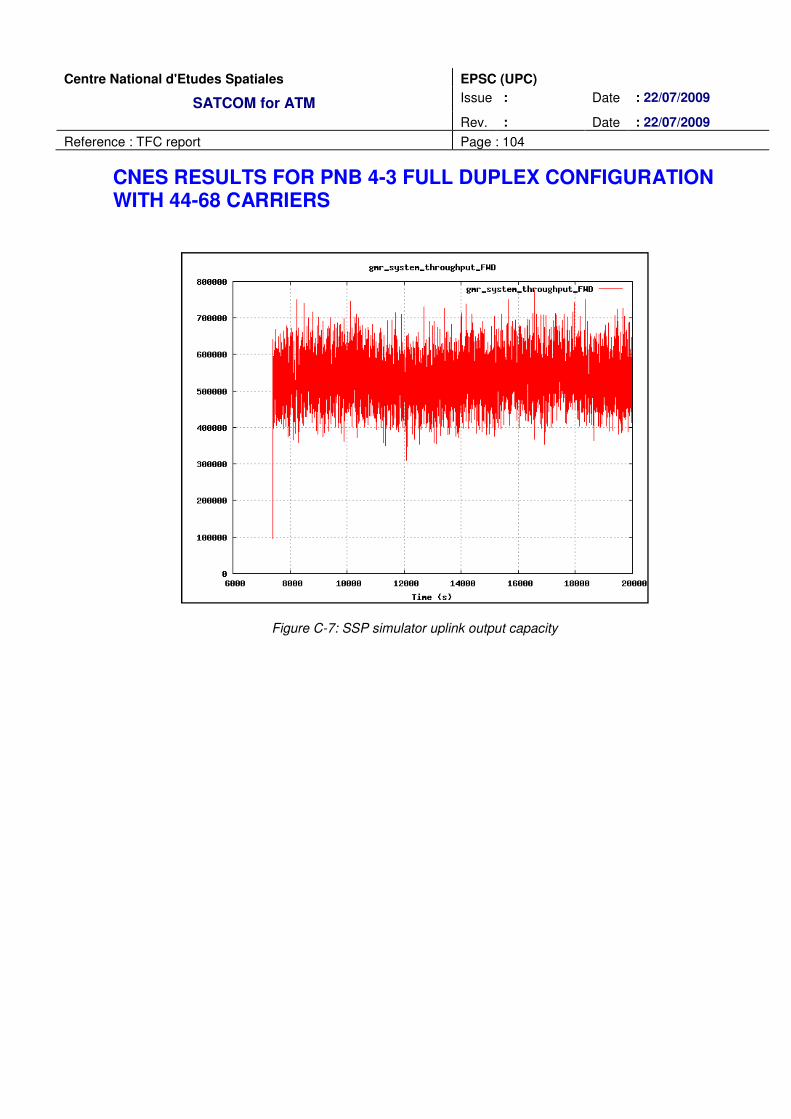
Centre National d'Etudes Spatiales EPSC (UPC)
SATCOM for ATM Issue : Date : 22/07/2009
Rev. : Date : 22/07/2009
Reference : TFC report Page : 104
CNES RESULTS FOR PNB 4-3 FULL DUPLEX CONFIGURATION WITH 44-68 CARRIERS
Figure C-7: SSP simulator uplink output capacity
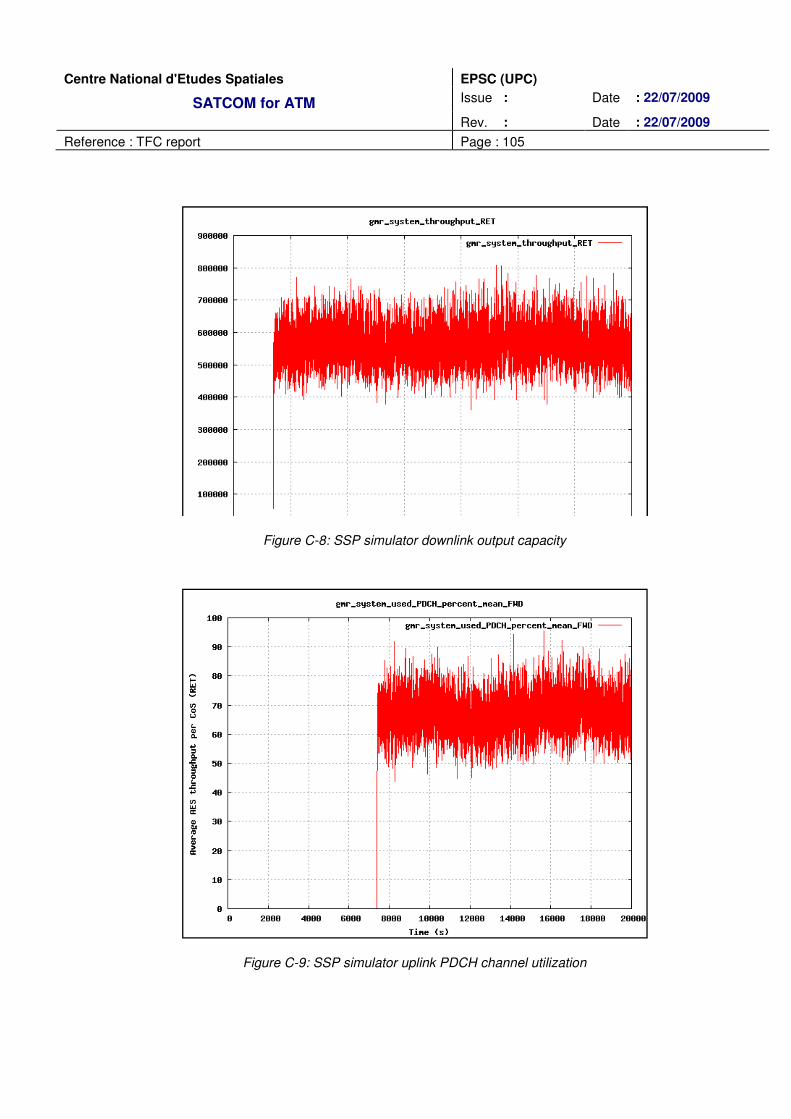
Centre National d'Etudes Spatiales EPSC (UPC)
SATCOM for ATM Issue : Date : 22/07/2009
Rev. : Date : 22/07/2009
Reference : TFC report Page : 105
Figure C-8: SSP simulator downlink output capacity
Figure C-9: SSP simulator uplink PDCH channel utilization

Centre National d'Etudes Spatiales EPSC (UPC)
SATCOM for ATM Issue : Date : 22/07/2009
Rev. : Date : 22/07/2009
Reference : TFC report Page : 106
Figure C-10: SSP simulator downlink PDCH channel utilization
Figure C-11: SSP simulator PDF transmission delay

Centre National d'Etudes Spatiales EPSC (UPC)
SATCOM for ATM Issue : Date : 22/07/2009
Rev. : Date : 22/07/2009
Reference : TFC report Page : 107
Figure C-12: SSP simulator uplink rejected packets