CENTRE FOR OFFSHORE FOUNDATION SYSTEMS …Randolph, Cassidy, Gourvenec & Erbrich 1 ... (onshore)...
34
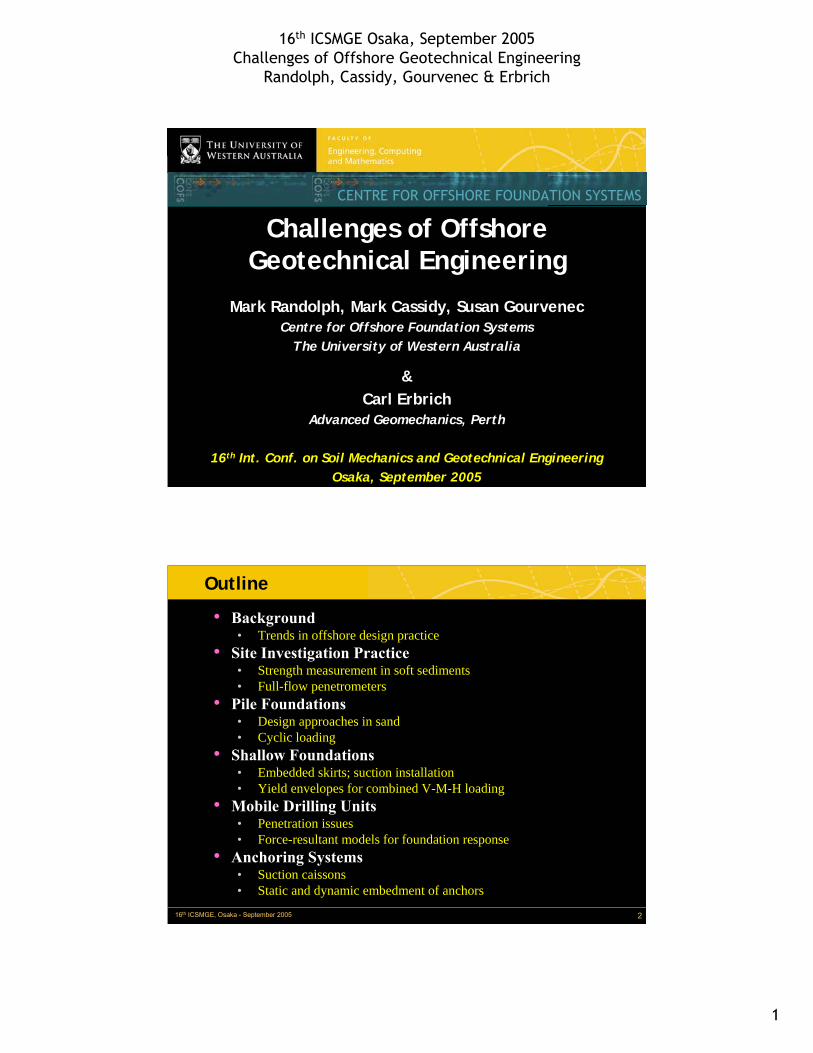
16 th ICSMGE Osaka, September 2005 Challenges of Offshore Geotechnical Engineering Randolph, Cassidy, Gourvenec & Erbrich 1 Mark Randolph, Mark Cassidy, Susan Gourvenec Centre for Offshore Foundation Systems The University of Western Australia CENTRE FOR OFFSHORE FOUNDATION SYSTEMS Challenges of Offshore Geotechnical Engineering & Carl Erbrich Advanced Geomechanics, Perth 16 th Int. Conf. on Soil Mechanics and Geotechnical Engineering Osaka, September 2005 16 th ICSMGE, Osaka - September 2005 2 Outline • Background • Trends in offshore design practice • Site Investigation Practice • Strength measurement in soft sediments • Full-flow penetrometers • Pile Foundations • Design approaches in sand • Cyclic loading • Shallow Foundations • Embedded skirts; suction installation • Yield envelopes for combined V-M-H loading • Mobile Drilling Units • Penetration issues • Force-resultant models for foundation response • Anchoring Systems • Suction caissons • Static and dynamic embedment of anchors
Transcript of CENTRE FOR OFFSHORE FOUNDATION SYSTEMS …Randolph, Cassidy, Gourvenec & Erbrich 1 ... (onshore)...
16th ICSMGE Osaka, September 2005Challenges of Offshore Geotechnical Engineering
Randolph, Cassidy, Gourvenec & Erbrich
1
Mark Randolph, Mark Cassidy, Susan GourvenecCentre for Offshore Foundation Systems
The University of Western Australia
CENTRE FOR OFFSHORE FOUNDATION SYSTEMS
Challenges of Offshore Geotechnical Engineering
&Carl Erbrich
Advanced Geomechanics, Perth
16th Int. Conf. on Soil Mechanics and Geotechnical EngineeringOsaka, September 2005
16th ICSMGE, Osaka - September 2005 2
Outline
• Background• Trends in offshore design practice
• Site Investigation Practice• Strength measurement in soft sediments• Full-flow penetrometers
• Pile Foundations• Design approaches in sand• Cyclic loading
• Shallow Foundations• Embedded skirts; suction installation • Yield envelopes for combined V-M-H loading
• Mobile Drilling Units• Penetration issues• Force-resultant models for foundation response
• Anchoring Systems• Suction caissons• Static and dynamic embedment of anchors

16th ICSMGE Osaka, September 2005Challenges of Offshore Geotechnical Engineering
Randolph, Cassidy, Gourvenec & Erbrich
2
16th ICSMGE, Osaka - September 2005 3
Evolution of Platforms
Piles,gravity bases
or suction caissons Piles
Piles or suction caissons
300 m50 m 500 m 1200 m
Courtesy: Minerals Management Services
16th ICSMGE, Osaka - September 2005 4
Evolution of Floating and Subsea Facilities
Courtesy: Minerals Management Services
Suction caissons
SkirtedFoundations
1750 m 2000 m
Piles Drag anchors
16th ICSMGE Osaka, September 2005Challenges of Offshore Geotechnical Engineering
Randolph, Cassidy, Gourvenec & Erbrich
3
16th ICSMGE, Osaka - September 2005 5
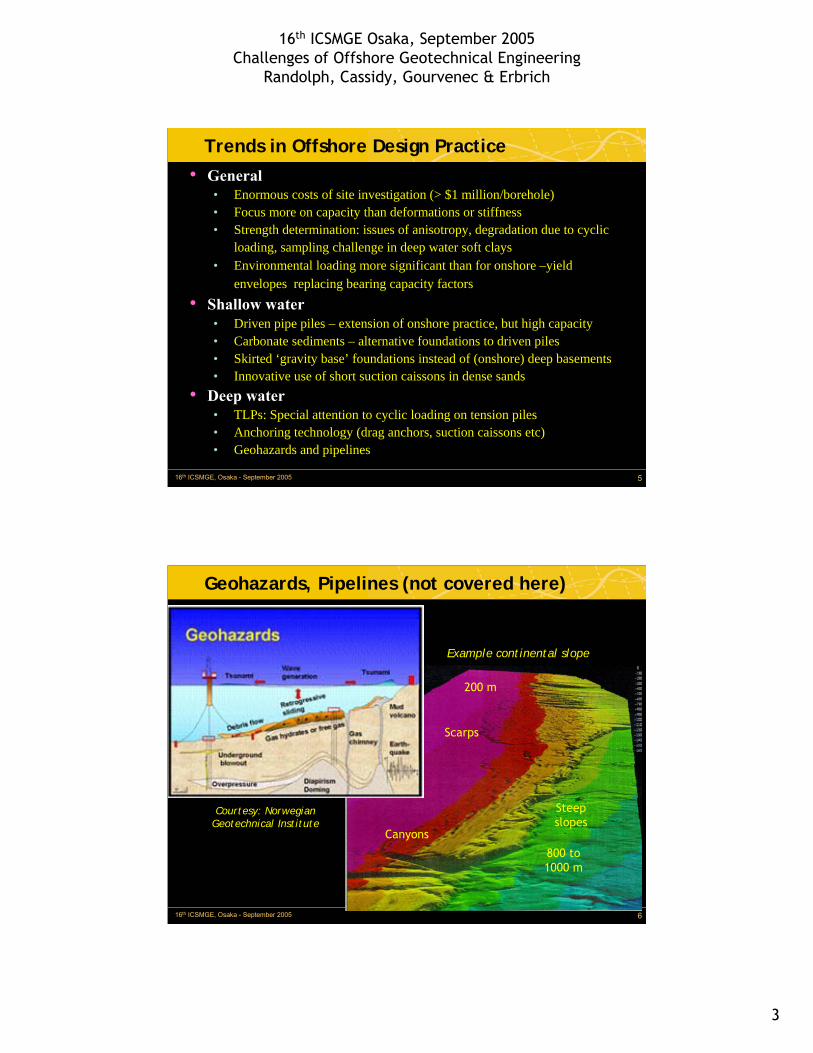
Trends in Offshore Design Practice• General
• Enormous costs of site investigation (> $1 million/borehole)• Focus more on capacity than deformations or stiffness• Strength determination: issues of anisotropy, degradation due to cyclic
loading, sampling challenge in deep water soft clays• Environmental loading more significant than for onshore –yield
envelopes replacing bearing capacity factors• Shallow water
• Driven pipe piles – extension of onshore practice, but high capacity• Carbonate sediments – alternative foundations to driven piles• Skirted ‘gravity base’ foundations instead of (onshore) deep basements• Innovative use of short suction caissons in dense sands
• Deep water• TLPs: Special attention to cyclic loading on tension piles• Anchoring technology (drag anchors, suction caissons etc)• Geohazards and pipelines
16th ICSMGE, Osaka - September 2005 6
Geohazards, Pipelines (not covered here)
Courtesy: Norwegian Geotechnical Institute
200 m
Scarps
Canyons
800 to 1000 m
Steep slopes
Example continental slope
16th ICSMGE Osaka, September 2005Challenges of Offshore Geotechnical Engineering
Randolph, Cassidy, Gourvenec & Erbrich
4
16th ICSMGE, Osaka - September 2005 7
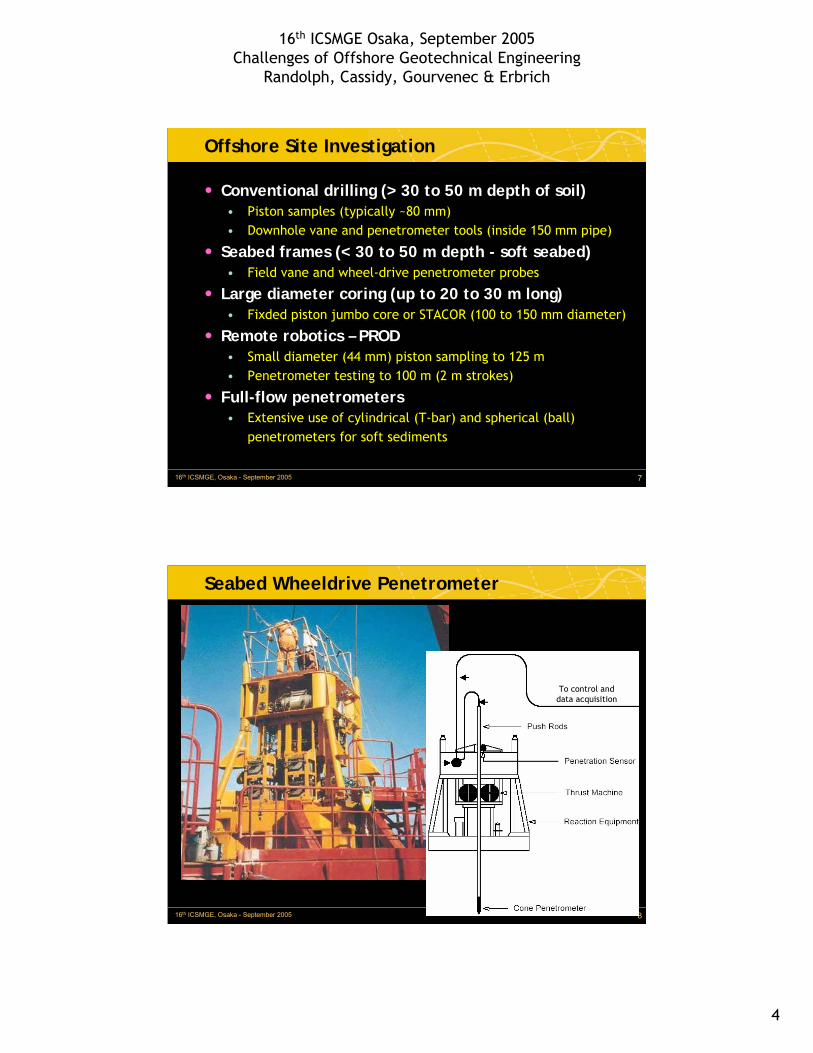
Offshore Site Investigation
• Conventional drilling (> 30 to 50 m depth of soil)• Piston samples (typically ~80 mm) • Downhole vane and penetrometer tools (inside 150 mm pipe)
• Seabed frames (< 30 to 50 m depth - soft seabed)• Field vane and wheel-drive penetrometer probes
• Large diameter coring (up to 20 to 30 m long)• Fixded piston jumbo core or STACOR (100 to 150 mm diameter)
• Remote robotics – PROD• Small diameter (44 mm) piston sampling to 125 m• Penetrometer testing to 100 m (2 m strokes)
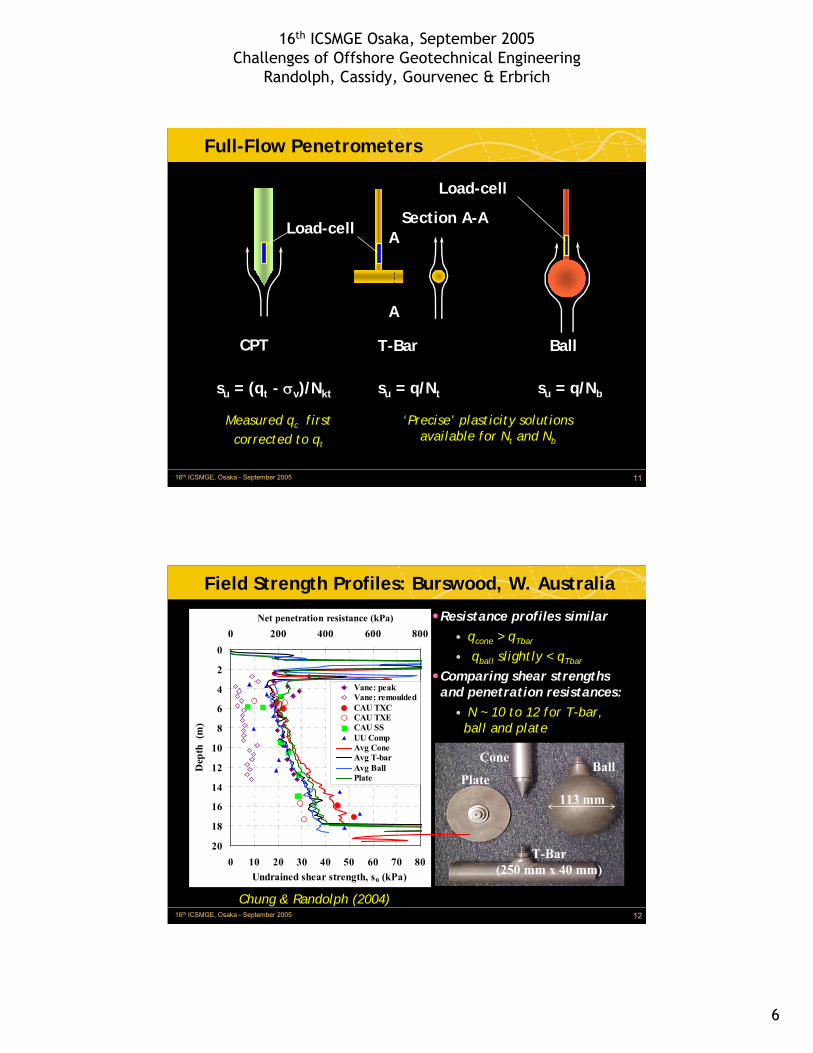
• Full-flow penetrometers• Extensive use of cylindrical (T-bar) and spherical (ball)
penetrometers for soft sediments
16th ICSMGE, Osaka - September 2005 8
Seabed Wheeldrive Penetrometer
To control anddata acquisitionTo control and
data acquisition

16th ICSMGE Osaka, September 2005Challenges of Offshore Geotechnical Engineering
Randolph, Cassidy, Gourvenec & Erbrich
5
16th ICSMGE, Osaka - September 2005 9
Portable Remotely Operated Drill (PROD)
Schematic ofdeployed PROD
LaunchingPROD off boat
16th ICSMGE, Osaka - September 2005 10
Comparison of Downhole and Seabed Cone Profile
0
5
10
15
20
25
30
0 200 400 600 800 1000Net cone resistance, qcnet (kPa)
Depth(m)
Downhole
Seabed frame
(Variablydisturbed)
16th ICSMGE Osaka, September 2005Challenges of Offshore Geotechnical Engineering
Randolph, Cassidy, Gourvenec & Erbrich
6
16th ICSMGE, Osaka - September 2005 11
Full-Flow Penetrometers
Load-cell
Load-cell
‘Precise’ plasticity solutionsavailable for Nt and Nb
CPT
su = (qt - σv)/Nkt
T-Bar
Section A-AA
A
su = q/Nt
Ball
su = q/Nb
Measured qc first corrected to qt
16th ICSMGE, Osaka - September 2005 12
Field Strength Profiles: Burswood, W. Australia
•Resistance profiles similar• qcone > qTbar
• qball slightly < qTbar
•Comparing shear strengths and penetration resistances:
• N ~ 10 to 12 for T-bar, ball and plate
113 mm
Cone
Plate
T-Bar(250 mm x 40 mm)
Ball
0
2
4
6
8
10
12
14
16
18
200 10 20 30 40 50 60 70 80
Undrained shear strength, su (kPa)
Dep
th (
m)
0 200 400 600 800Net penetration resistance (kPa)
Vane: peakVane: remouldedCAU TXCCAU TXECAU SSUU CompAvg ConeAvg T-barAvg BallPlate
Chung & Randolph (2004)

16th ICSMGE Osaka, September 2005Challenges of Offshore Geotechnical Engineering
Randolph, Cassidy, Gourvenec & Erbrich
7
16th ICSMGE, Osaka - September 2005
Resistances Factors For Simple Shear Strength
0
5
10
15
20
25
30
0 5 10 15 20Resistance factors, Nkt-SS and NTbar-SS
Depth(m)
OffshoreWest Africa
OnshoreNorway
OffshoreAustralia
OnshoreAustralia
Open symbols: coneSolid symbols: T-bar
Coefficient of variation of average N values for each site:T-bar: 2 % ; Cone: 14 %
16th ICSMGE, Osaka - September 2005 14
Comments on Offshore Data
• Vane • Typically more scattered than other data (compensating effects
of disturbance, consolidation and rate effects)
• Cone and T-bar penetrometer data• Significant correction of cone data from measured to net values
• Net cone and T-bar resistances similar but cone resistance increases faster with depth than T-bar
• Correlations with laboratory simple shear data suggest resistance factors of ~12, but greater variance among different sites with cone (e.g. Gulf of Mexico: Nkt ~ 17)
• Field tests: typical strain rates ~105 to 107 higher than for standard laboratory test
16th ICSMGE Osaka, September 2005Challenges of Offshore Geotechnical Engineering
Randolph, Cassidy, Gourvenec & Erbrich
8
16th ICSMGE, Osaka - September 2005 15
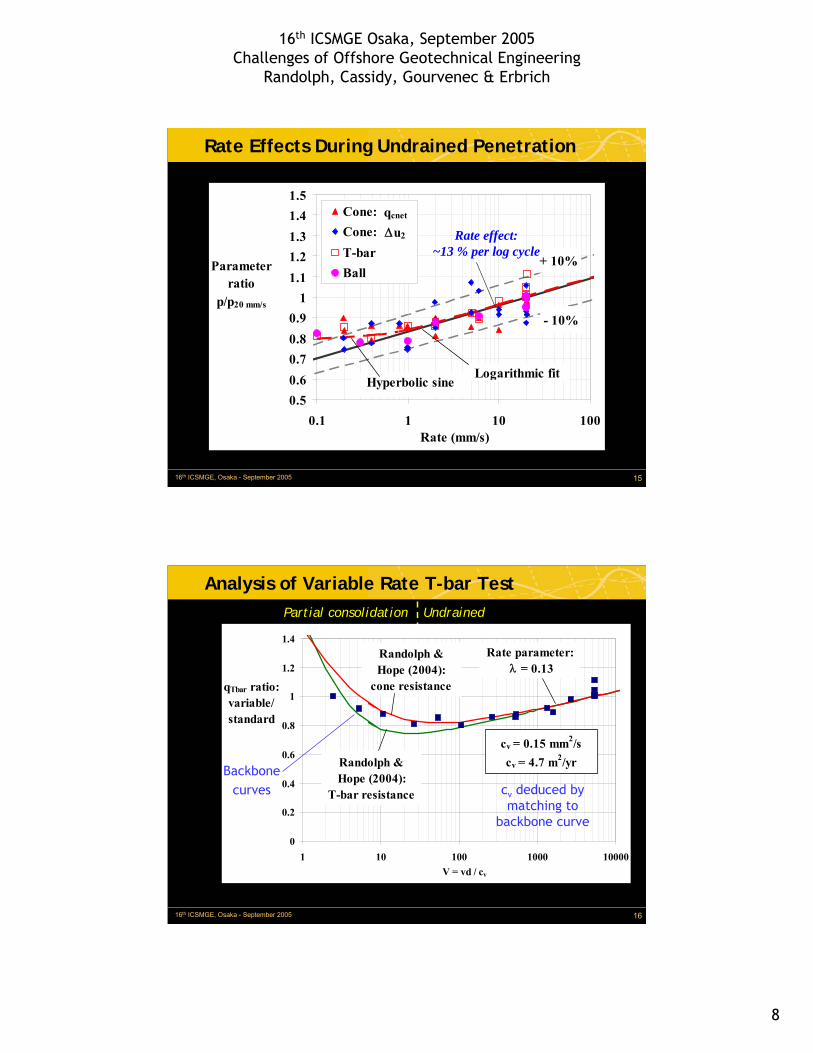
Rate Effects During Undrained Penetration
0.50.60.70.80.9
11.11.21.31.41.5
0.1 1 10 100Rate (mm/s)
Parameter ratio
p/p20 mm/s
Cone: qcnetCone: Du2T-barBall
+ 10%
- 10%
Δu2
qcnet
Hyperbolic sine Logarithmic fit
Rate effect:~13 % per log cycle
16th ICSMGE, Osaka - September 2005 16
Partial consolidation Undrained
Analysis of Variable Rate T-bar Test
0
0.2
0.4
0.6
0.8
1
1.2
1.4
1 10 100 1000 10000V = vd / cv
qTbar ratio: variable/standard
cv = 0.15 mm2/scv = 4.7 m2/yr
Randolph &Hope (2004):
cone resistance
Randolph &Hope (2004):
T-bar resistance
Rate parameter: λ = 0.13
Backbonecurves cv deduced by
matching to backbone curve

16th ICSMGE Osaka, September 2005Challenges of Offshore Geotechnical Engineering
Randolph, Cassidy, Gourvenec & Erbrich
9
16th ICSMGE, Osaka - September 2005 17
Rate Effects and Softening
• Shear strength dependency on strain rate• strength increase per log cycle: rate (μ) ~ 5 to 20 %
• Expect ~50 to 100 % increase due to rate effects
• Strain-softening or damage• soil gradually remoulded as it passes through T-bar or ball
mechanism
• net (average) strength therefore less than peak strength
Rate and strain-softening effects compensate;quantify using strain path approach
⎟⎟⎠
⎞⎜⎜⎝
⎛γγ
μ+=ouo
u log1ss
&
&
( ) ( ) 95/3remremuus e1s/s ξξ−δ−+δ==ξδ
16th ICSMGE, Osaka - September 2005 18
T-bar Factors: Strain Rate and Softening
5
10
15
20
25
0 0.05 0.1 0.15 0.2 0.25Rate parameter μ
NTbar ξ95 = 50ξ95 = 25ξ95 = 15
No strainsoftening
Parametersα = δ rem = 0.2ξTbar = 3.85
ξ95 = 10
For typical rate parameter, μ ~ 0.1, NTbar ~ 11 to 13
Corresponding theoretical range for Nball ~ 13 to 16
Strain to 95 % remoulded
16th ICSMGE Osaka, September 2005Challenges of Offshore Geotechnical Engineering
Randolph, Cassidy, Gourvenec & Erbrich
10
16th ICSMGE, Osaka - September 2005 19
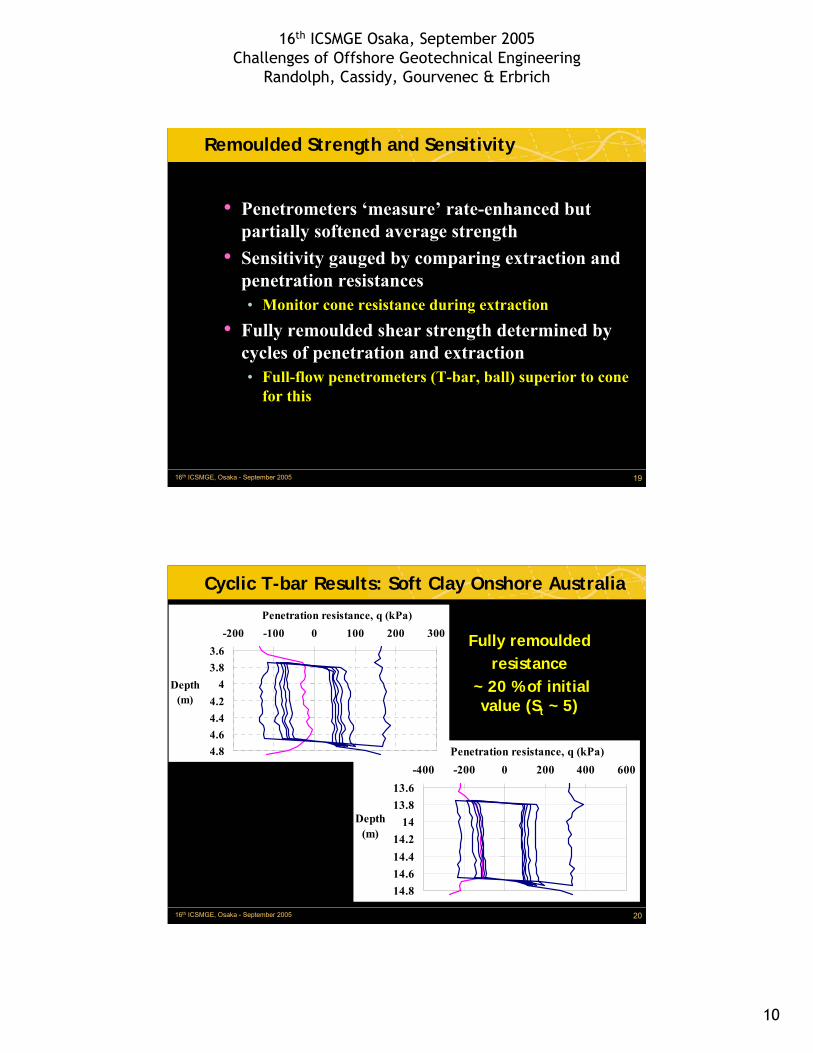
Remoulded Strength and Sensitivity
• Penetrometers ‘measure’ rate-enhanced but partially softened average strength
• Sensitivity gauged by comparing extraction and penetration resistances • Monitor cone resistance during extraction
• Fully remoulded shear strength determined by cycles of penetration and extraction• Full-flow penetrometers (T-bar, ball) superior to cone
for this
16th ICSMGE, Osaka - September 2005 20
13.613.8
1414.214.414.614.8
-400 -200 0 200 400 600Penetration resistance, q (kPa)
Depth(m)
Cyclic T-bar Results: Soft Clay Onshore Australia
3.63.8
44.24.44.64.8
-200 -100 0 100 200 300Penetration resistance, q (kPa)
Depth(m)
Fully remoulded resistance
~ 20 % of initial value (St ~ 5)

16th ICSMGE Osaka, September 2005Challenges of Offshore Geotechnical Engineering
Randolph, Cassidy, Gourvenec & Erbrich
11
16th ICSMGE, Osaka - September 2005 21
Summary of Overall Rate Effects
• Rate effects significant• Field data show rate dependency from 10 % to 20 % per log cycle
• High plasticity clays show particularly high rate effects
• Partially drained response for V = vd/cv < ~ 30• Burswood: d = 40 mm, cv ~ 0.15 mm2/s: vmin = 0.1 mm/s
• Partial drainage detectable at V ~ 100 from Bq
• Benefits from testing at varying rates:• Assessment of rate effects
• Determination of degree of consolidation and cv
16th ICSMGE, Osaka - September 2005 22
Example Application: Spudcan in Calcareous Silt
0
5
10
15
20
25
0 0.5 1 1.5 2
Penetration Resistance (MPa)
Depth(m)
T-barCone(net)
Spudcan
Bearing pressure: 0.35 MPa
Spudcan
T-bar Spudcan
Strain rate (v d) 0.5 0.5 x 10⁻³ s-1
Consolidation (vd) 10-3 10-1 m2s-1
Erbrich (2005)
cone
16th ICSMGE Osaka, September 2005Challenges of Offshore Geotechnical Engineering
Randolph, Cassidy, Gourvenec & Erbrich
12
16th ICSMGE, Osaka - September 2005 23
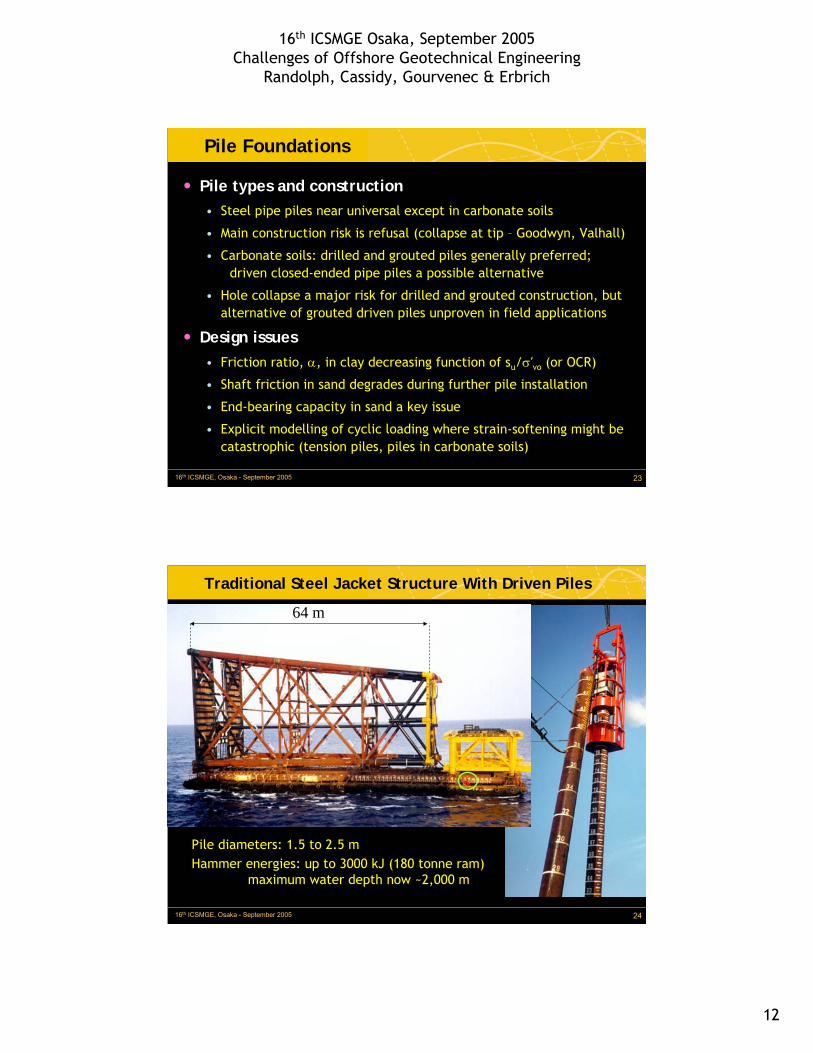
Pile Foundations
• Pile types and construction• Steel pipe piles near universal except in carbonate soils
• Main construction risk is refusal (collapse at tip – Goodwyn, Valhall)
• Carbonate soils: drilled and grouted piles generally preferred; driven closed-ended pipe piles a possible alternative
• Hole collapse a major risk for drilled and grouted construction, but alternative of grouted driven piles unproven in field applications
• Design issues• Friction ratio, α, in clay decreasing function of su/σ′vo (or OCR)
• Shaft friction in sand degrades during further pile installation
• End-bearing capacity in sand a key issue
• Explicit modelling of cyclic loading where strain-softening might be catastrophic (tension piles, piles in carbonate soils)
16th ICSMGE, Osaka - September 2005 24
64 m
Traditional Steel Jacket Structure With Driven Piles
Pile diameters: 1.5 to 2.5 mHammer energies: up to 3000 kJ (180 tonne ram)
maximum water depth now ~2,000 m

16th ICSMGE Osaka, September 2005Challenges of Offshore Geotechnical Engineering
Randolph, Cassidy, Gourvenec & Erbrich
13
16th ICSMGE, Osaka - September 2005 25
Pile Capacity in Sand – Recent Reassessment
• Modern approach entirely based on cone resistance, qc
• End-bearing (Xu et al., 2005)
• Design for capacity mobilised at displacement of 0.1D
• Fractional mobilisation of qc depends on displacement ratio of pile
• Closed ended (or plugged) : qbu ~ 0.6qc – independent of diameter
• Open ended: qbu ~ qc[0.15 + 0.45 Ar] (typically ~ 0.2qc minimum)
• Shaft friction (White, Lehane, Schneider, 2005)
• Maximum value close to pile tip proportional to qc x f(Area ratio: Ar)
• Shaft friction degrades due to further pile installation: f(h/D)
• Friction degradation limits use of driven piles in carbonate sands
Design approach:Major extroplation in pile size required
16th ICSMGE, Osaka - September 2005 26
End-bearing Capacity in Sand
Closed endedqbu = 0.6qc
Area ratio of pile base0 0.2 0.4 0.6 0.8 1
qb-0.1/qc
0
0.2
0.4
0.6
Typicaloffshore
qbu = 0.2qc
Open ended database
Lehane, Schneider& Tao (2005)
0 0.2 0.4 0.6 0.8 1Pile diameter (m)
qb-0.1/qc
0
0.2
0.4
0.6
0.8
1
Closed ended database

16th ICSMGE Osaka, September 2005Challenges of Offshore Geotechnical Engineering
Randolph, Cassidy, Gourvenec & Erbrich
14
16th ICSMGE, Osaka - September 2005 27
Shaft Friction Degradation
cv
3.0rc
f tanD/h
Aq03.0δ=τ
Cone resistanceqc/100
h/d = 25
h/d = 14h/d = 4
Data from Lehane et al (1993)
Cyclic shearing undernormal stiffness condition
(White & Bolton 2004)
Lehane, Schneider& Tao (2005):
16th ICSMGE, Osaka - September 2005 28
Grouted Pile Construction and Design
0
0.05
0.1
0.15
0.2
0.25
0.3
0 50 100 150 200 250qc/pa
p /qc
50 kPa75 kPa100 kPa150 kPa200 kPa250 kPa300 kPa500 kPaTrend upper boundTrend lower bound
Grouting pressures
drivinghammer
primarypile
Installationof primary pile
Drilling borehole
Grouting insert pile
rotary drill
insert pile
grouting string
Drilled & grouted pile design: τp = 0.02qc
c
p
qτ
ac p/q
Laboratory test results for grouted driven piles
16th ICSMGE Osaka, September 2005Challenges of Offshore Geotechnical Engineering
Randolph, Cassidy, Gourvenec & Erbrich
15
16th ICSMGE, Osaka - September 2005 29
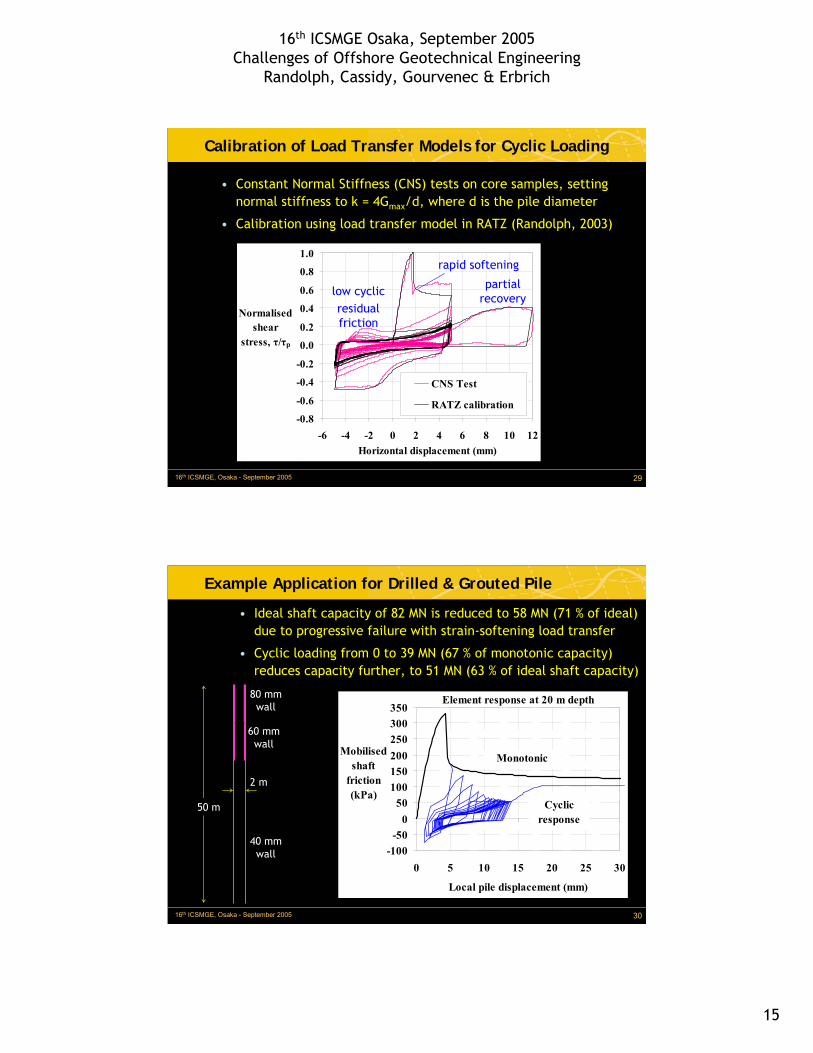
Calibration of Load Transfer Models for Cyclic Loading
• Constant Normal Stiffness (CNS) tests on core samples, setting normal stiffness to k = 4Gmax/d, where d is the pile diameter
• Calibration using load transfer model in RATZ (Randolph, 2003)
-0.8
-0.6
-0.4
-0.2
0.0
0.2
0.4
0.6
0.8
1.0
-6 -4 -2 0 2 4 6 8 10 12Horizontal displacement (mm)
Normalised shear
stress, τ/τp
CNS Test
RATZ calibration
rapid softening
low cyclicresidual friction
partialrecovery
16th ICSMGE, Osaka - September 2005 30
Example Application for Drilled & Grouted Pile
• Ideal shaft capacity of 82 MN is reduced to 58 MN (71 % of ideal) due to progressive failure with strain-softening load transfer
• Cyclic loading from 0 to 39 MN (67 % of monotonic capacity) reduces capacity further, to 51 MN (63 % of ideal shaft capacity)
-100-50
050
100150200250300350
0 5 10 15 20 25 30
Local pile displacement (mm)
Mobilised shaft
friction (kPa)
Monotonic
Cyclicresponse
Element response at 20 m depth
2 m
50 m
40 mmwall
80 mmwall
60 mmwall
16th ICSMGE Osaka, September 2005Challenges of Offshore Geotechnical Engineering
Randolph, Cassidy, Gourvenec & Erbrich
16
16th ICSMGE, Osaka - September 2005 31
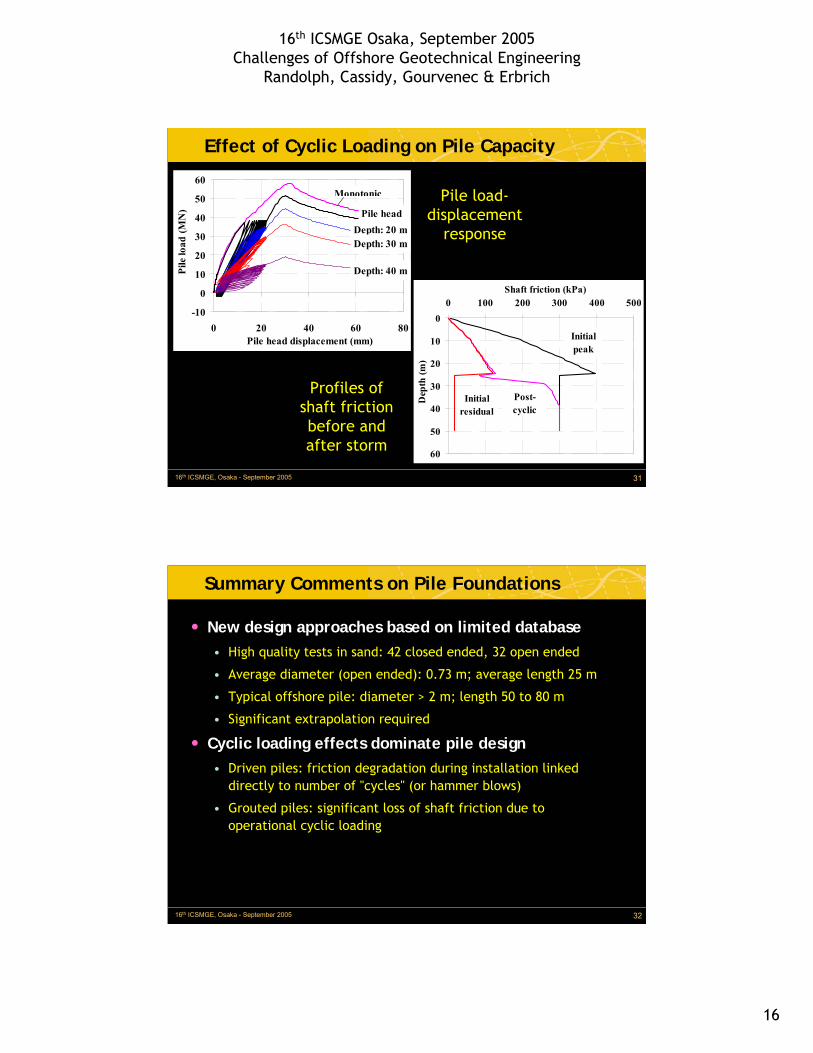
Effect of Cyclic Loading on Pile Capacity
-10
0
10
20
30
40
50
60
0 20 40 60 80Pile head displacement (mm)
Pile
load
(MN
) Pile headDepth: 20 mDepth: 30 m
Depth: 40 m
Monotonic
0
10
20
30
40
50
60
0 100 200 300 400 500Shaft friction (kPa)
Dep
th (m
)
Initial peak
Initial residual
Post-cyclic
Pile load-displacement
response
Profiles of shaft friction before and after storm
16th ICSMGE, Osaka - September 2005 32
Summary Comments on Pile Foundations
• New design approaches based on limited database• High quality tests in sand: 42 closed ended, 32 open ended
• Average diameter (open ended): 0.73 m; average length 25 m
• Typical offshore pile: diameter > 2 m; length 50 to 80 m
• Significant extrapolation required
• Cyclic loading effects dominate pile design• Driven piles: friction degradation during installation linked
directly to number of "cycles" (or hammer blows)
• Grouted piles: significant loss of shaft friction due to operational cyclic loading
16th ICSMGE Osaka, September 2005Challenges of Offshore Geotechnical Engineering
Randolph, Cassidy, Gourvenec & Erbrich
17
16th ICSMGE, Osaka - September 2005 33
Shallow Foundations
• Gravity-base foundations • Large (> 400 m tall, plan area > 15,000 m2)• High environmental loading (cyclic, large moment component)
• Embedded skirts• Serves equivalent purpose as deep excavation, encasing soft sediments• Consolidation within skirts contributes to settlement (long time scale) • Suction-assisted installation and local strengthening of soils• In sands, suction installation cause quasi-piping failure within soil plug
• Yield envelopes for combined V-M-H loading• Design codes gradually replacing factors for inclined and eccentric
loading by yield envelopes in V-M-H space• Uniaxial bearing capacities (Vult, Mult, Hult) need to allow for strength
gradient and embedment
16th ICSMGE, Osaka - September 2005 34
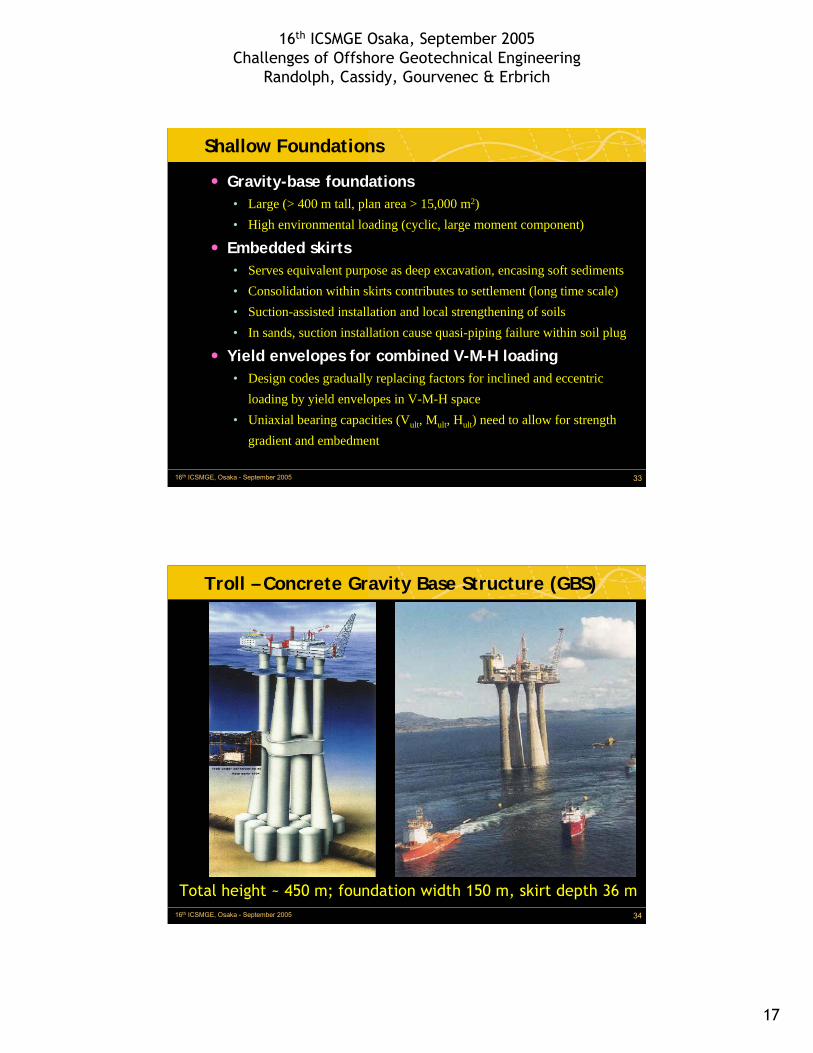
Troll – Concrete Gravity Base Structure (GBS)
Troll (1995)Total height ~ 450 m; foundation width 150 m, skirt depth 36 m
16th ICSMGE Osaka, September 2005Challenges of Offshore Geotechnical Engineering
Randolph, Cassidy, Gourvenec & Erbrich
18
16th ICSMGE, Osaka - September 2005 35
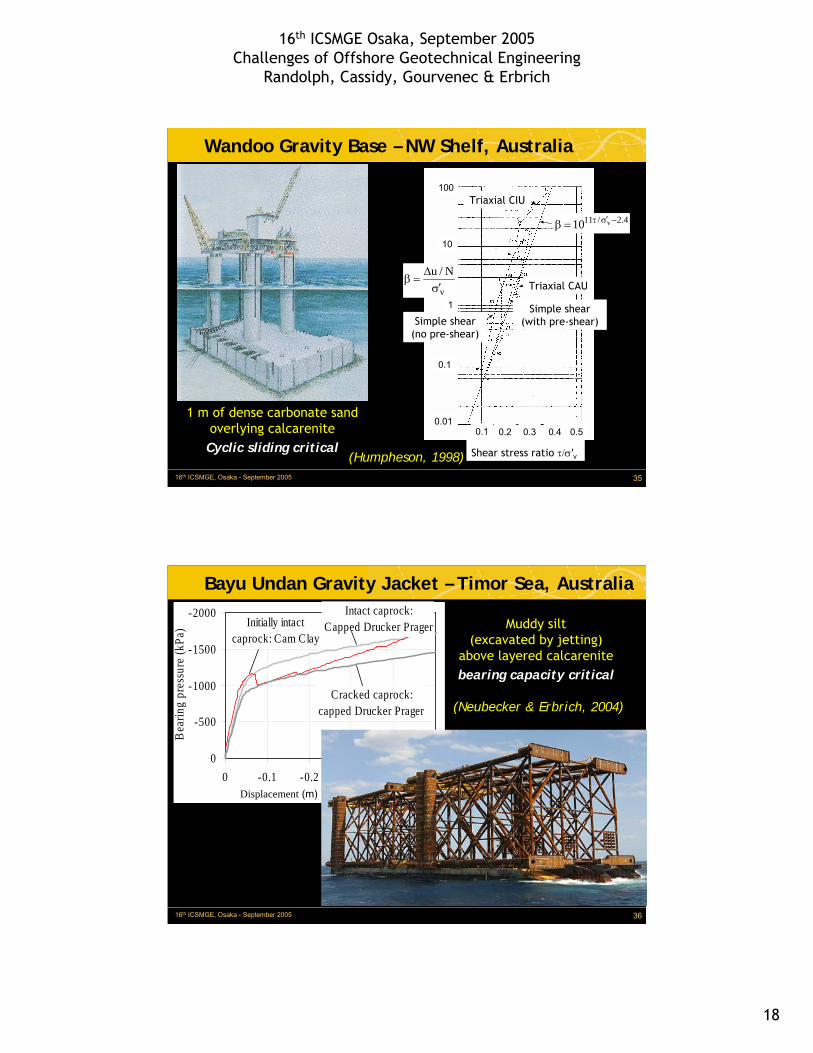
Wandoo Gravity Base – NW Shelf, Australia
1 m of dense carbonate sandoverlying calcareniteCyclic sliding critical
(Humpheson, 1998) Shear stress ratio τ/σ′v
Simple shear (with pre-shear) Simple shear
(no pre-shear)
Triaxial CAU
Triaxial CIU100
10
0.1
1
0.010.1 0.2 0.3 0.4 0.5
v
N/uσ′
Δ=β
4.2/11 v10 −σ′τ=β
16th ICSMGE, Osaka - September 2005 36
Bayu Undan Gravity Jacket – Timor Sea, Australia
Muddy silt(excavated by jetting)
above layered calcarenitebearing capacity critical
(Neubecker & Erbrich, 2004)
-2000
-1500
-1000
-500
0-0.5-0.4-0.3-0.2-0.10
Displacement (m)
Bea
ring
pres
sure
(kPa
)
Intact caprock:Capped Drucker Prager
Cracked caprock: capped Drucker Prager
Initially intactcaprock: Cam Clay
Displacement (m)

16th ICSMGE Osaka, September 2005Challenges of Offshore Geotechnical Engineering
Randolph, Cassidy, Gourvenec & Erbrich
19
16th ICSMGE, Osaka - September 2005 37
Yolla Hybrid Gravity Base – Bass Strait, Australia
Uncementedcarbonate
sands & siltsmomentloadingcritical
(Watson & Humpheson, 2005)
50 m square, 5.4 m deep skirts(suction-assisted installation)
16th ICSMGE, Osaka - September 2005 38
Bearing Capacity of Shallow Foundations in Clay
VH
M = f(Hzw)
zw
z
h
suo su
k
sum
Shear strength
κ = kD/suoD
Nc = qu/suo
Bearing capacity expressed as
With Nc a function of:strength profile, κ = kD/suo
loading (H/V, M/DV) shape, embedment

16th ICSMGE Osaka, September 2005Challenges of Offshore Geotechnical Engineering
Randolph, Cassidy, Gourvenec & Erbrich
20
16th ICSMGE, Osaka - September 2005 39
Shallow Foundations on Clay – Vertical Loading
B or D
0
2
4
6
8
10
12
0 0.5 1 1.5 2Embedment, h/D
Bearingcapacity
factorNc
kD/sum = 10
kD/sum = 01
25
Lower bound results (circle)Martin (2001)
z
h
suo su
k
sum
Nc = qu/suo
Shear strength
κ = kD/suo
16th ICSMGE, Osaka - September 2005 40
Yield Envelopes for Combined V-M-H Loading
• Establish Vult, Mult, Hult for uniaxial loading• Develop generic 3-dimensional shape, allowing for
• Whether suction (tension) allowed at foundation-soil interface
• Strength profile (kD/suo)
• Shape of foundation
0
0.1
0.2
0.3
0.4
0.5
0.6
0.7
-1 -0.8 -0.6 -0.4 -0.2 0 0.2 0.4 0.6 0.8 1
M/ADsuo
H/Asuo
ISO(no tension)
FEA(allowing tension)
Yield envelope in M-H planeCircular foundationHomogeneous soilV = 0.5Vult
neglectedcapacity

16th ICSMGE Osaka, September 2005Challenges of Offshore Geotechnical Engineering
Randolph, Cassidy, Gourvenec & Erbrich
21
16th ICSMGE, Osaka - September 2005 41
Three-Dimensional Yield Envelopes
M/ADsuo
0.2
0.6
0.4
0.8
H/Asuo
V/Asuo
0
1
2
3
4
5
6-1.0
-0.5
0.0
0.51.0
V/Asuo
H/Asuo
M/ADsuo
0.0
0.2
0.6
0.4
0
1
2
3
4
5
6-1.0
-0.50.0
0.51.0
based on strip footinginclination andshape factors
FE Analysis(circular, allowing tension)
ISO Guidelines (no tension)
16th ICSMGE, Osaka - September 2005 42
Enhanced Capacity due to Embedment
Vertical ddh
Horizontal
Moment
Deeper mechanisms involve stronger soil- and also greater tension capacity
16th ICSMGE Osaka, September 2005Challenges of Offshore Geotechnical Engineering
Randolph, Cassidy, Gourvenec & Erbrich
22
16th ICSMGE, Osaka - September 2005 43
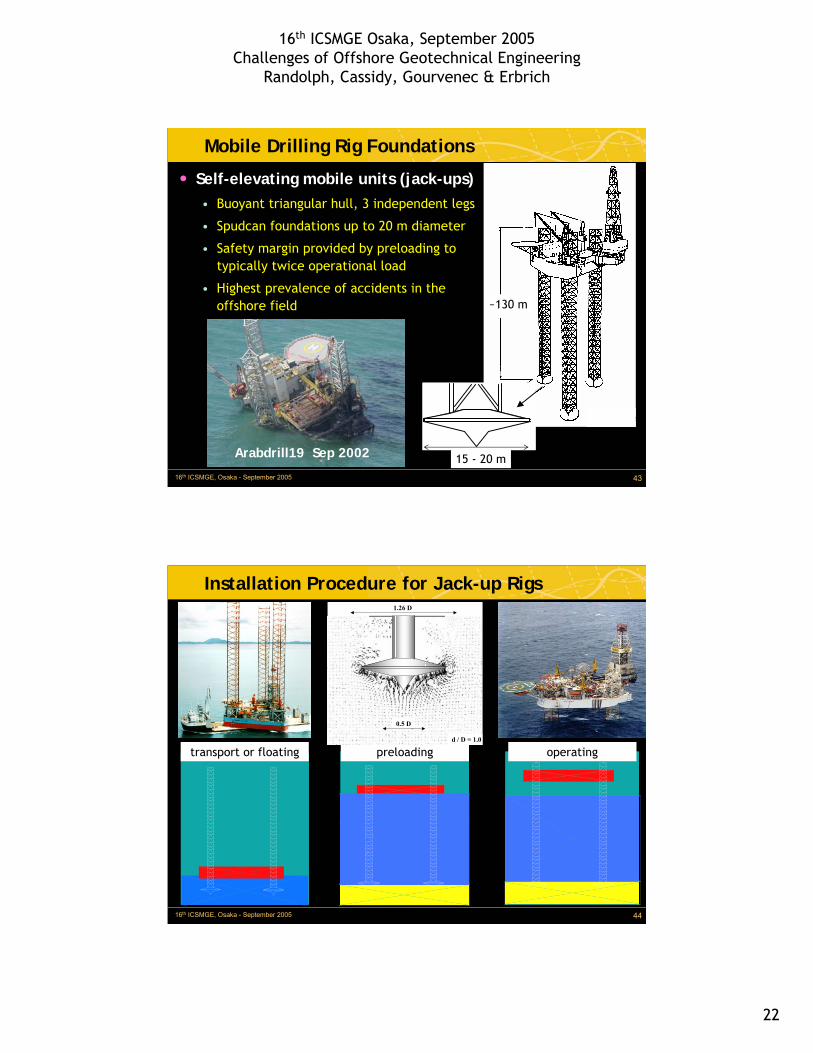
Mobile Drilling Rig Foundations
• Self-elevating mobile units (jack-ups)• Buoyant triangular hull, 3 independent legs
• Spudcan foundations up to 20 m diameter
• Safety margin provided by preloading to typically twice operational load
• Highest prevalence of accidents in the offshore field
15 - 20 m
~130 m
Arabdrill19 Sep 2002
16th ICSMGE, Osaka - September 2005 44
preloadingd / D = 1.0
1.26 D
0.5 D
Installation Procedure for Jack-up Rigs
transport or floating operating

16th ICSMGE Osaka, September 2005Challenges of Offshore Geotechnical Engineering
Randolph, Cassidy, Gourvenec & Erbrich
23
16th ICSMGE, Osaka - September 2005 45
Spudcan Penetration
• Circular, shallow conical, foundations for mobile drilling (jack-up) units• Typically 15 to 20 m diameter, penetrating 1 to 3 diameters
• Cavity depth above spudcan critical for• Bearing capacity
• Extent to which suctions may develop beneath spudcan during uplift or moment loading
H
V
p
D
Cavity
K-latticeleg
Spudcan
Hosseinet al (2005)
16th ICSMGE, Osaka - September 2005 46
0.01
0.1
1
10
0.001 0.01 0.1 1 10su / γ′D
H / DCentrifuge test (average)Centrifuge test (bound)
γ′ = 17 kN/m3, D = 18 mγ′ = 7 kN/m3, D = 18 mγ′ = 17 kN/m3, D = 12 mγ′ = 7 kN/m3, D = 12 mγ′ = 17 kN/m3, D = 6 mγ′ = 7 kN/m3, D = 6 m
Unstable
Stable
Designrange
FE Analyses
Stable Cavity Depth During Spudcan Penetration
55.0uD
sDH
⎟⎟⎠
⎞⎜⎜⎝
⎛γ′
≈
Hossein et al (2005)
16th ICSMGE Osaka, September 2005Challenges of Offshore Geotechnical Engineering
Randolph, Cassidy, Gourvenec & Erbrich
24
16th ICSMGE, Osaka - September 2005 47
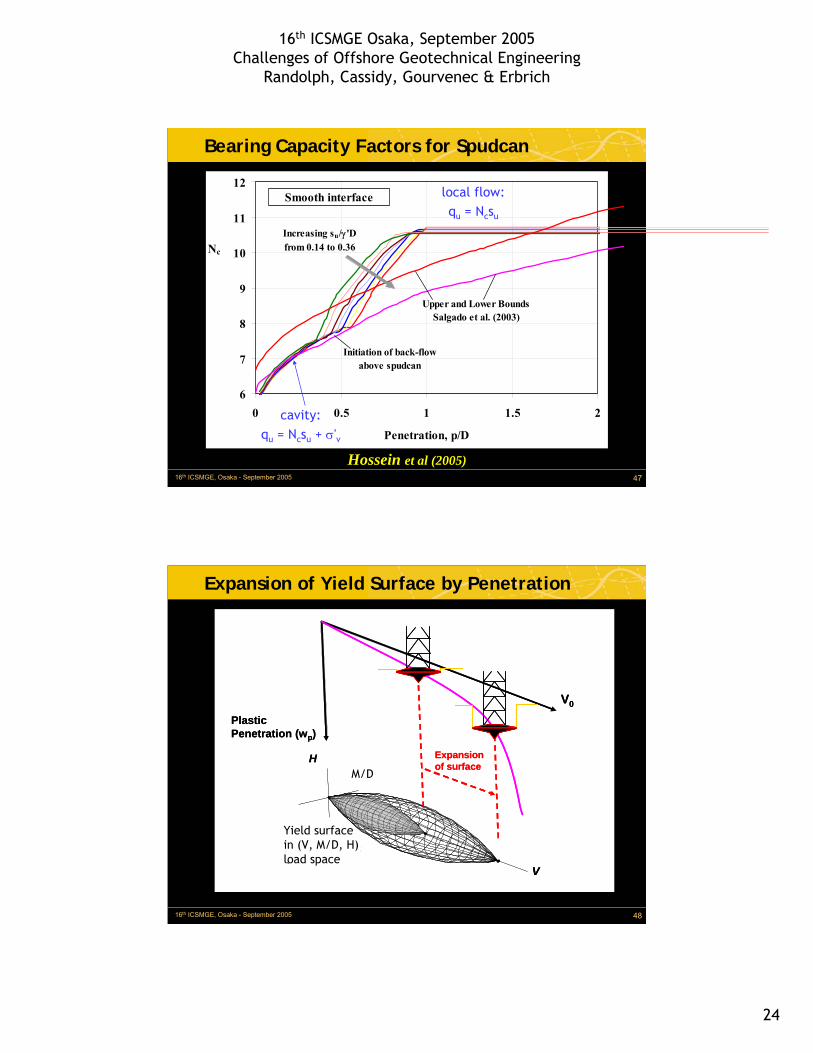
Bearing Capacity Factors for Spudcan
6
7
8
9
10
11
12
0 0.5 1 1.5 2
Penetration, p/D
Nc
Smooth interface
Upper and Lower BoundsSalgado et al. (2003)
Increasing su/γ 'Dfrom 0.14 to 0.36
Initiation of back-flow above spudcan
Hossein et al (2005)
cavity:qu = Ncsu + σ'v
local flow:qu = Ncsu
16th ICSMGE, Osaka - September 2005 48
Expansion of Yield Surface by Penetration
V
M/2R
Yield surface in (V, M/2R, H)load space
V0
Plastic Penetration (wp)
H Expansion of surface
V
M/2R
Yield surface in (V, M/2R, H)load space
V
M/2R
Yield surface in (V, M/2R, H)load space
V0
Plastic Penetration (wp)
H Expansion of surface
Yield surfacein (V, M/D, H)load space
M/D

16th ICSMGE Osaka, September 2005Challenges of Offshore Geotechnical Engineering
Randolph, Cassidy, Gourvenec & Erbrich
25
16th ICSMGE, Osaka - September 2005 49
Consider cases wherespudcans are:
• pinned (no moment)• encastre (no rotation)• resting on "sand"
(partial restraint)
Example Dynamic Analysis of Jack-Up Rig
52m
90m115m
UPWAVE DOWNWAVEDOWNWAVE
WAVES
16th ICSMGE, Osaka - September 2005 50
Horizontal Hull Movement During Wave Loading
pinnedsandencastre
downwave legsupwave leg
wav
e el
evat
ion
(m)
0-4-8
-12
48
12
-0.5
0.50
-1-1.5
11.5
hull
sway
(m
)
time (s)-50 -50 1000

16th ICSMGE Osaka, September 2005Challenges of Offshore Geotechnical Engineering
Randolph, Cassidy, Gourvenec & Erbrich
26
16th ICSMGE, Osaka - September 2005 51
Extension of Footing Models for Cyclic Loading
• Force-resultant models a major advance, but• Need to allow for gradual yielding (non-linearity) prior to yield
• Experiments show hysteretic unloading-reloading response
• Real soil exhibits cyclicdegradation
Horizontal Load
Vertical Load
Yield envelope under monotonic preload
Degraded cyclic yield envelope
Material factored cyclic yield envelope
'Equivalent' preload
Safe zone (shaded)
Unsafe zone
Applied preload
16th ICSMGE, Osaka - September 2005 52
Anchoring Systems
• Deep-water developments increasingly dominate• Floating production units anchored to seabed
• Catenary (chain) moorings: quasi-horizontal loading of anchors
• Trend towards taut, or semi-taut, moorings (polyester cable)
Gravity anchors Embedded anchorsBox Anchor pileGrillage and berm Suction caisson
Drag anchor (fixed fluke)Vertically loaded drag anchorSuction embedded plate anchorDynamically embedded anchor
16th ICSMGE Osaka, September 2005Challenges of Offshore Geotechnical Engineering
Randolph, Cassidy, Gourvenec & Erbrich
27
16th ICSMGE, Osaka - September 2005 53
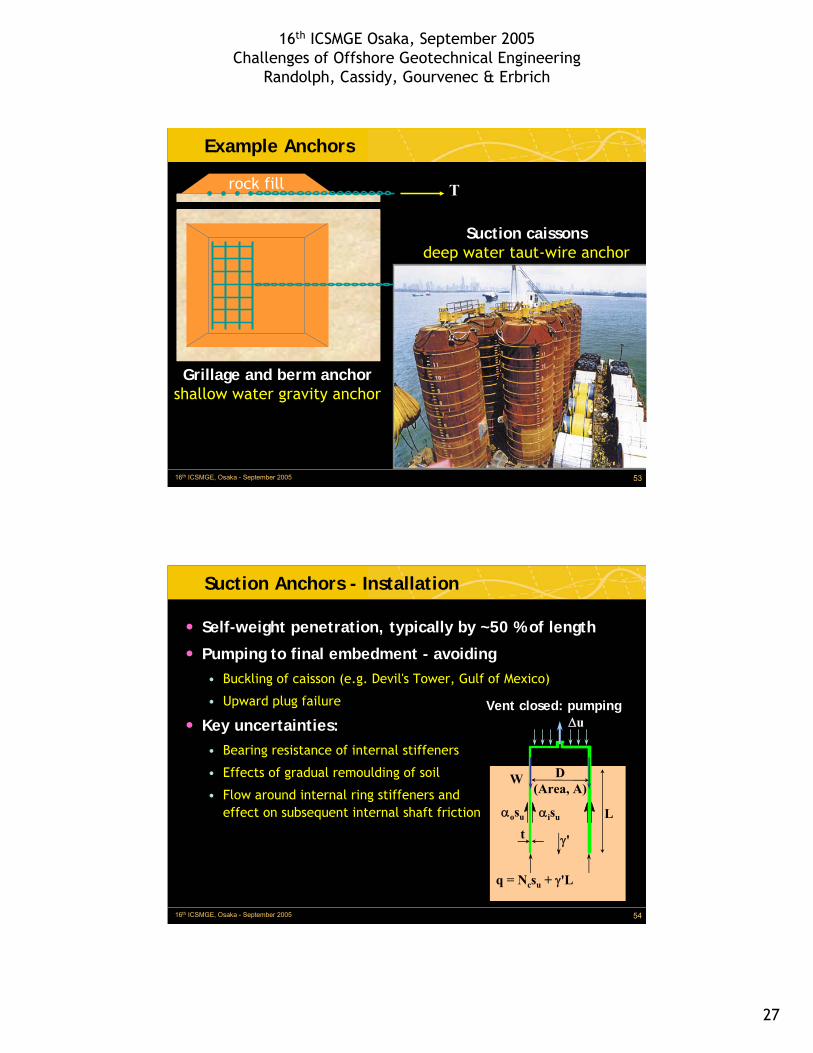
Example Anchors
Grillage and berm anchorshallow water gravity anchor
T
Suction caissonsdeep water taut-wire anchor
rock fill
16th ICSMGE, Osaka - September 2005 54
Suction Anchors - Installation
• Self-weight penetration, typically by ~50 % of length
• Pumping to final embedment - avoiding• Buckling of caisson (e.g. Devil's Tower, Gulf of Mexico)
• Upward plug failure
• Key uncertainties:• Bearing resistance of internal stiffeners
• Effects of gradual remoulding of soil
• Flow around internal ring stiffeners andeffect on subsequent internal shaft friction
Vent closed: pumping
γ'
αisuαosu
q = Ncsu + γ'L
L
W
Δu
D(Area, A)
t
16th ICSMGE Osaka, September 2005Challenges of Offshore Geotechnical Engineering
Randolph, Cassidy, Gourvenec & Erbrich
28
16th ICSMGE, Osaka - September 2005 55
Measured and Predicted Under-Pressure
0
5
10
15
20
25
30
35
0 50 100 150
Required Underpressure (kPa)D
epth
(m)
M easured
P1
P2 Total
P2 Effective
P3
P4
Consolidationduring delay
δ = 12º δ = 17º
0
2
4
6
8
10
12
14
16
18
0 25 50 75 100Required Underpressure (kPa)
Dep
th (m
)
Diana (Gulf of Mexico) Girassol (West Africa)Andersen et al (2005)
16th ICSMGE, Osaka - September 2005 56
Lateral Capacity of Suction Anchors
Caisson
D*
LD2D1
Taut wire
Catenary mooring
d
θ2
θ1
h
Centre ofrotation
O
Horizontal caissonvelocity at depth, z
⎟⎟⎠
⎞⎜⎜⎝
⎛
−
−= *oh
Dhzhvv
ψ⎟⎟⎠
⎞⎜⎜⎝
⎛
−
−⎟⎠
⎞⎜⎝
⎛=
μ
cosDhzh
rr
vv *o
or
Horizontal soil velocity
D* ~ 0.7L for optimum lateral capacity
(Murff & Hamilton, (1993)
16th ICSMGE Osaka, September 2005Challenges of Offshore Geotechnical Engineering
Randolph, Cassidy, Gourvenec & Erbrich
29
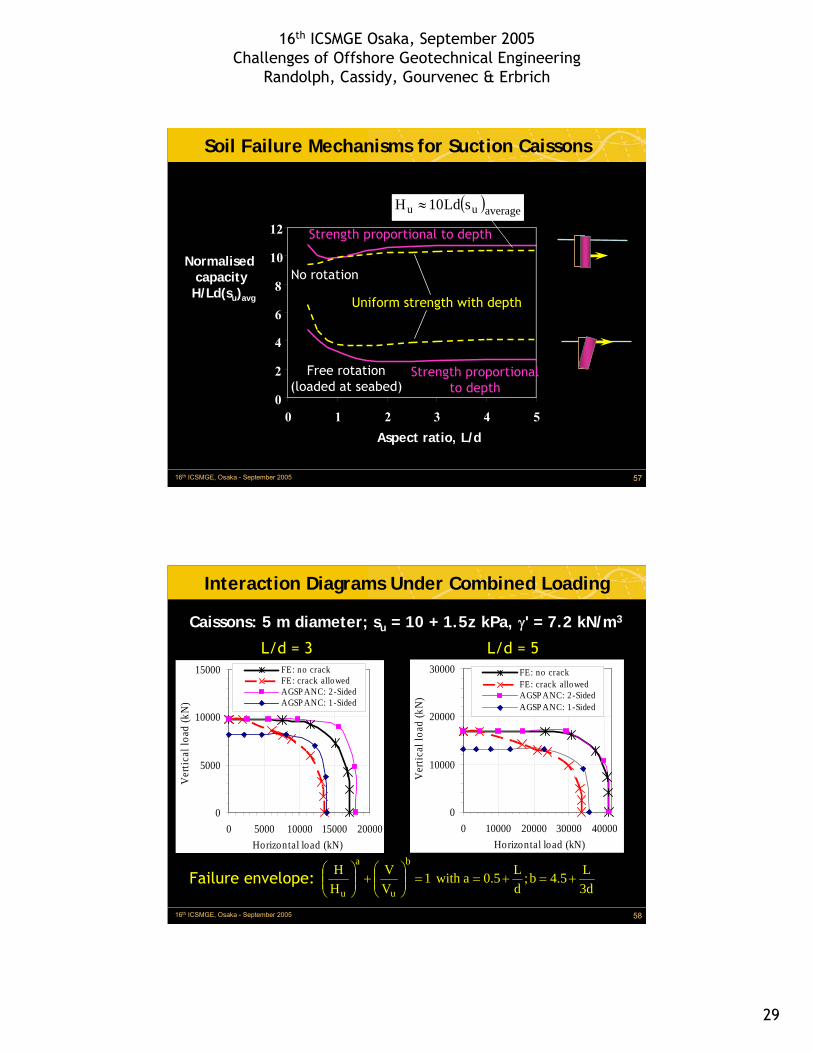
16th ICSMGE, Osaka - September 2005 57
Soil Failure Mechanisms for Suction Caissons
0
2
4
6
8
10
12
0 1 2 3 4 5Aspect ratio, L/d
Normalised capacityH/Ld(su)avg
No rotation
Free rotation(loaded at seabed)
Uniform strength with depth
Strength proportional to depth
Strength proportional to depth
( )averageuu sLd10H ≈
16th ICSMGE, Osaka - September 2005 58
Interaction Diagrams Under Combined Loading
0
5000
10000
15000
0 5000 10000 15000 20000Horizontal load (kN)
Ver
tical
load
(kN
)
FE: no crackFE: crack allowedAGSP ANC: 2-SidedAGSP ANC: 1-Sided
0
10000
20000
30000
0 10000 20000 30000 40000Horizontal load (kN)
Ver
tical
load
(kN
)
FE: no crackFE: crack allowedAGSP ANC: 2-SidedAGSP ANC: 1-Sided
3dL5.4b;
dL5.0a with 1
VV
HH
b
u
a
u+=+==⎟⎟
⎠
⎞⎜⎜⎝
⎛+⎟⎟
⎠
⎞⎜⎜⎝
⎛
L/d = 3 L/d = 5
Caissons: 5 m diameter; su = 10 + 1.5z kPa, γ' = 7.2 kN/m3
Failure envelope:
16th ICSMGE Osaka, September 2005Challenges of Offshore Geotechnical Engineering
Randolph, Cassidy, Gourvenec & Erbrich
30
16th ICSMGE, Osaka - September 2005 59
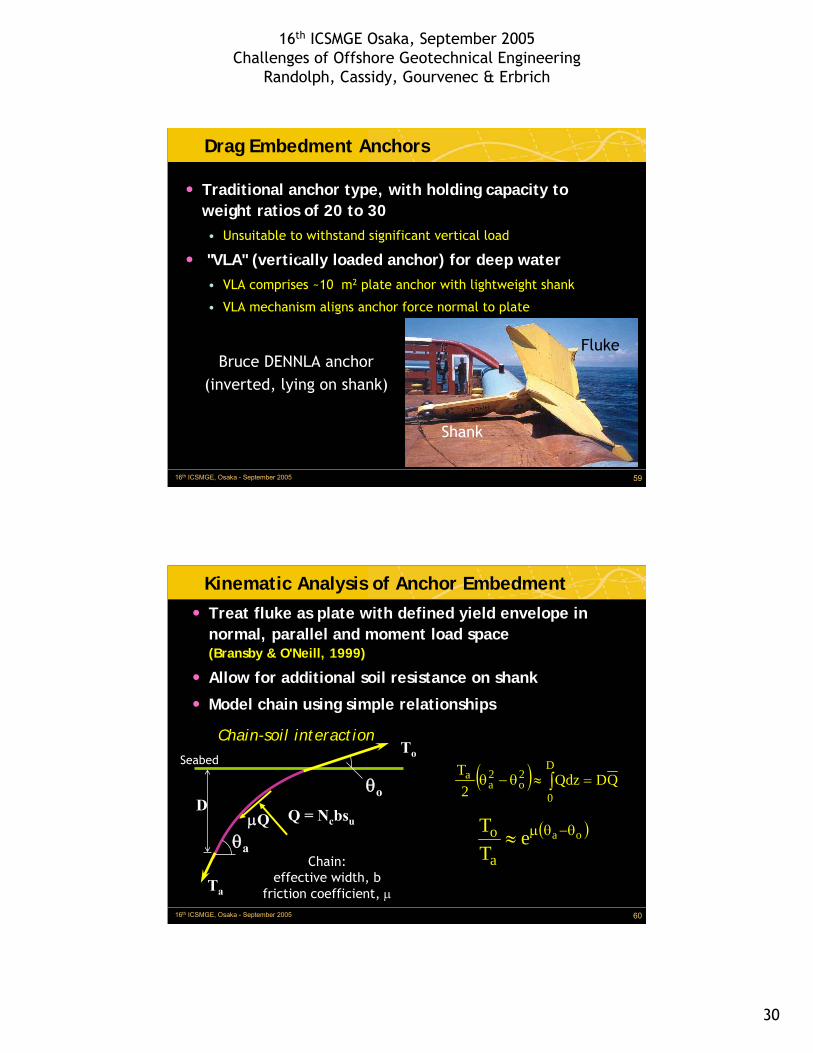
Drag Embedment Anchors
• Traditional anchor type, with holding capacity to weight ratios of 20 to 30• Unsuitable to withstand significant vertical load
• "VLA" (vertically loaded anchor) for deep water• VLA comprises ~10 m2 plate anchor with lightweight shank
• VLA mechanism aligns anchor force normal to plate
Bruce DENNLA anchor(inverted, lying on shank)
Shank
Fluke
16th ICSMGE, Osaka - September 2005 60
Kinematic Analysis of Anchor Embedment • Treat fluke as plate with defined yield envelope in
normal, parallel and moment load space(Bransby & O'Neill, 1999)
• Allow for additional soil resistance on shank
• Model chain using simple relationships
θa
Ta
To
D
Seabed
θo
Chain-soil interaction
Chain:effective width, b
friction coefficient, μ
Q = NcbsuμQ
( ) QDQdz2
T D
0
2o
2a
a =≈θ−θ ∫
( )oaeTT
a
o θ−θμ≈

16th ICSMGE Osaka, September 2005Challenges of Offshore Geotechnical Engineering
Randolph, Cassidy, Gourvenec & Erbrich
31
16th ICSMGE, Osaka - September 2005 61
Plate Anchor Interaction Envelopes and Response
0
1
2
3
4
5
0 2 4 6 8 10 12Normal factor, Nn
L/t = 7, fully rough
Normal-parallel
Normal-moment
-1
-0.5
0
0.5
1
00.20.40.60.81fn/fnmax
Yield locus:fs = 0
-1
-0.5
0
0.5
1
0 0.2 0.4 0.6 0.8 1
fs/fsmax
m/m
max
Yield locus:fn = 0
Nm : Nn curve
Ns : Nn curve
Strip anchor(Murff et al, 2005)Kinematic analysis
(O'Neill et al, 2003)
u
normaln Ls
fN =
u
shears Ls
fN =
u2m sLmN =
16th ICSMGE, Osaka - September 2005 62
Anchor: Overall Performance
Kinematic analysis (O'Neill et al, 2003)
0
1
2
3
0 10 20 30 40
Drag length x/L
Pade
ye d
epth
D/L
0
5
10
15
20
0 10 20 30 40
Drag length x/L
Anc
hor e
ffici
ency
-0.2
0
0.2
0.4
0.6
0.8
1
0 10 20 30 40Drag length x/L
Nor
mal
ised
fluk
e lo
ad .
fn/fnmax
fs/fsmax
m/mmax
16th ICSMGE Osaka, September 2005Challenges of Offshore Geotechnical Engineering
Randolph, Cassidy, Gourvenec & Erbrich
32
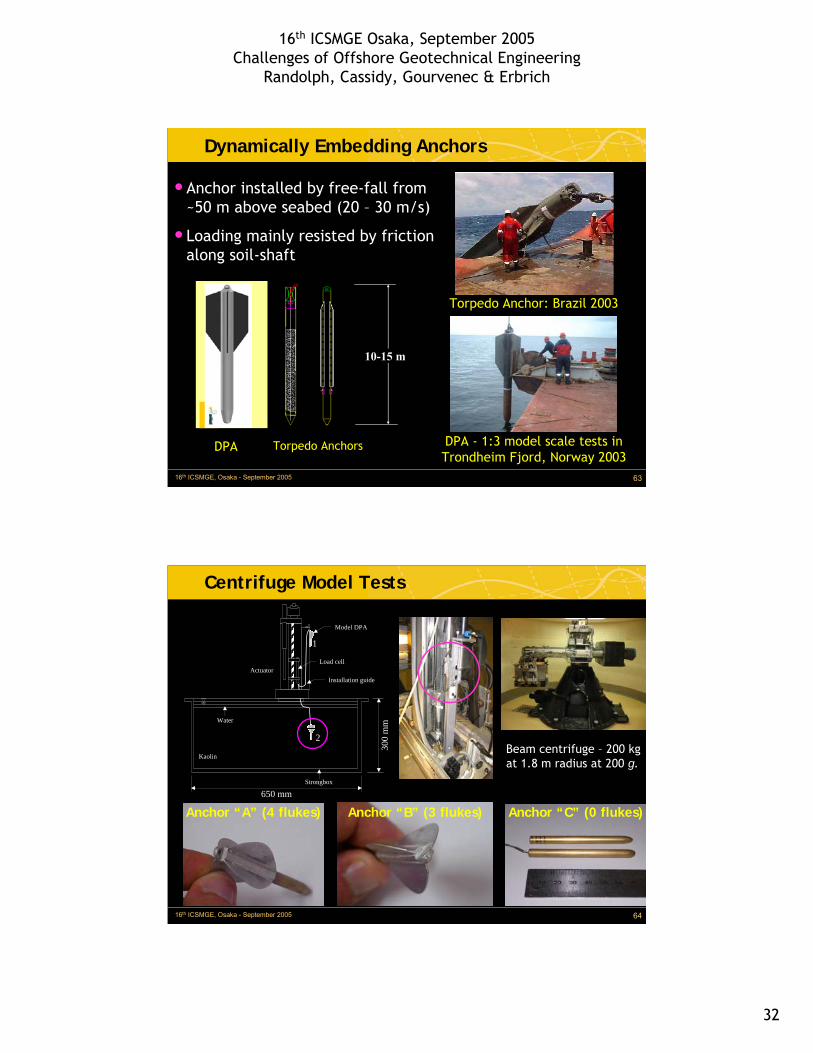
16th ICSMGE, Osaka - September 2005 63
•Anchor installed by free-fall from ~50 m above seabed (20 – 30 m/s)
•Loading mainly resisted by friction along soil-shaft
DPA - 1:3 model scale tests inTrondheim Fjord, Norway 2003
Torpedo Anchor: Brazil 2003
Dynamically Embedding Anchors
DPA Torpedo Anchors
10-15 m
16th ICSMGE, Osaka - September 2005 64
Centrifuge Model Tests
Anchor “A” (4 flukes) Anchor “B” (3 flukes) Anchor “C” (0 flukes)
Water
650 mm
300
mm
1
2
Installation guide
Model DPA
Load cellActuator
Kaolin
Strongbox
Beam centrifuge – 200 kg at 1.8 m radius at 200 g.

16th ICSMGE Osaka, September 2005Challenges of Offshore Geotechnical Engineering
Randolph, Cassidy, Gourvenec & Erbrich
33
16th ICSMGE, Osaka - September 2005 65
Dynamic Anchor Capacity
O’Loughlin et al. (2004)
300
250
200
150
100
50
0
0 2 4 6 860
50
40
30
20
10
00 50 100 150 200
PETROBRASfield trials
Prototype Vertical Capacity, Fv (MN)
4 fluke DPA 3 fluke DPA 0 fluke DPA Predicted
0 fluke DPA
3 fluke DPA
4 fluke DPA
Prot
otyp
e em
bedm
ent (
m)
Model Vertical Capacity, Fv (N)
Mod
el E
mbe
dmen
t (m
m)
Centrifuge models:
16th ICSMGE, Osaka - September 2005 66
Deep-Water Anchoring Options
Anchor TypesSuction Caissons
Drag EmbeddedPlate Anchors
(VLAs)
Suction EmbeddedPlate Anchors
(SEPLAs)
Dynamically Embedded Anchors
Advantages- proven installation record- wide experience- robust design
- low weight- wide experience- small, high efficiency
- proven suction technology- robust design- lowest cost of anchor
- conventional (API) design- economical to fabricate- simplest to install
Disadvantages- need ROV to install- concern for layered soils- awkward to transport
- uncertain installation- need ROV & 2 vessels- poor quality assurance
- patented design- need keying & proving- long installation times
- patented designs- low efficiency- limited field experience
Ehlers et al. (2004)

16th ICSMGE Osaka, September 2005Challenges of Offshore Geotechnical Engineering
Randolph, Cassidy, Gourvenec & Erbrich
34
16th ICSMGE, Osaka - September 2005 67
Concluding Remarks
• Exploiting hydrocarbon resources in deep-water an increasing challenge, especially site characterisation of very soft sediments
• Calibration of in situ test results by variably disturbed laboratory strengths is a losing strategy
• Strive for improved design basis with foundation and anchor performance related directly to in situ penetration resistance
• Cost-benefits for improvement in design approachesfor conventional shallow and pile foundations
• Simple and robust anchoring systems a priority
16th ICSMGE, Osaka - September 2005 68
Acknowledgements
Grateful acknowledgements to:
Australian Research Council’s Research Centres Program for funding COFS (Centre for Offshore Foundation Systems)
Many colleagues at COFS and Advanced Geomechanics for their input into ideas presented here
Colleagues throughout the world, in particular at the Norwegian Geotechnical Institute and the
Offshore Technology Research Center