
Centre for Marketing - London Business Schoolfacultyresearch.london.edu/docs/96-302.pdf · No....
37
Centre for Marketing CONSUMER PROMOTIONS: TAMING THE MULTIBUY DRAGON Bruce G S Hardie Patrick Barwise Centre for Marketing Working Paper No. 96-302 October 1996 The authors are, respectively, Assistant Professor of Marketing and Professor of Management and Marketing at London Business School. They thank Procter & Gamble for funding this study and ITV for providing further analyses. The data are from Taylor Nelson AGB’s Superpanel. London Business School, Regent's Park, London NW1 4SA, U.K. Tel: +44 (0)171 262-5050 Fax: +44 (0)171 724-1145 [email protected] [email protected] http://www.lbs.lon.ac.uk Copyright © London Business School 1996.
Transcript of Centre for Marketing - London Business Schoolfacultyresearch.london.edu/docs/96-302.pdf · No....

�Centre for Marketing
CONSUMER PROMOTIONS:TAMING THE MULTIBUY DRAGON
Bruce G S HardiePatrick Barwise
Centre for Marketing Working PaperNo. 96-302
October 1996
The authors are, respectively, Assistant Professor of Marketing and Professor ofManagement and Marketing at London Business School. They thank Procter & Gamblefor funding this study and ITV for providing further analyses. The data are from Taylor
Nelson AGB’s Superpanel.
London Business School, Regent's Park, London NW1 4SA, U.K.Tel: +44 (0)171 262-5050 Fax: +44 (0)171 724-1145
[email protected] [email protected] http://www.lbs.lon.ac.uk
Copyright © London Business School 1996.

2
Table of Contents
Page
EXECUTIVE SUMMARY 1
1. INTRODUCTION 4
1.1 Report Outline 41.2 Scope and Limitations of the Study 4
2. THE ESCALATION OF PROMOTIONS 6
2.1 General Business Trends 62.2 An Overview of the Machine Wash Category 72.3 The Growth of Price Dealing in Machine Wash 82.4 The Impact of Private Label Price Deals 92.5 The Use of Different Types of Price Deal 92.6 The Increasing Depth of the Multibuy Offer 11
3. WHICH CONSUMERS BENEFIT FROM MULTIBUYS? 12
3.1 Creating a Household Grouping 123.2 Characterising Household Types 123.3 Demographics 133.4 Deal Purchasing by Buyer Type 143.5 The Minority Versus the Majority 16
4. CONSUMER ATTITUDES 18
4.1 Perceptions of Promotional Activity 184.2 Consumer Preferences 19
5. EXAMINING ALTERNATIVES TO MULTIBUYS 21
5.1 Designing More Equitable Promotions 215.2 A “What-if?” Scenario 215.3 The Impact of a New Promotional Regime on Efficiency 24
6. OTHER CATEGORIES 26
6.1 Instant Coffee and Yellow Fats 266.2 Low-Penetration and Price-Elastic Categories 28
7. CONCLUSION: TAMING THE MULTIBUY DRAGON 29
APPENDICES
A. Details of Calculations for Consumer Classification 31B. Details of Calculations for “New” Promotional Regime 32

3
Executive Summary
This study, commissioned by Procter & Gamble, is about the recent escalation of deep-discount price promotions in UK fast-moving consumer goods markets. We focus ona detailed analysis of the £730 million machine wash category, but also cite supportingevidence from research by AGB for ITV on the instant coffee and yellow fats (butterand margarine) categories.
The Escalation of Promotions
Price promotions do not increase the total annual volume of a mature, stable,functional category like machine wash. In fact, category volume has decreased by2.5% over the last three years, although this largely reflects switching between productforms (e.g., concentrated and unconcentrated). Instead, the only overall effect ofescalating price promotions has been to reduce the value of the category by 8.4% overthe last three years – about 13% taking inflation into account.
Although “extra free” promotions (e.g., special packs with 10% extra) continue – stillaccounting for 18% of consumers’ promotional purchases of machine wash – mostprice promotions today are either multibuys (“Buy 2, Get 1 Free”) or price offs (“20%off”). These can be implemented quickly, cheaply, and flexibly using EPOStechnology, which may have encouraged their use. The availability of weekly scannerdata also allows manufacturers and retailers to measure the short-term effects ofpromotions: given the pressure for short-term performance and for accountability, thishas further reinforced the escalation.
In this study, we focus especially on multibuys, which involve deep discounts andwhich account for over 70% of consumers’ promotional purchases of machine washproducts. The primary reason for the 8.4% reduction in the value of the category overthe last three years is the promotion-induced reduction in the average price paid, whichis due to an increase in the frequency of promotional events and an increase in theaverage level of discount (with a resulting increase in consumer take up). In the caseof multibuys, the average level of discount per promotional event has increased from18% to 25%, and multibuy purchases now account for 11.9% of total consumerexpenditure on machine wash (up from 9.1%).
This escalation has reduced manufacturers’ profits and directed resources fromadvertising, product development, and other long-term brand-building activities. Sinceit has not increased the category’s volume – merely reduced its value – it is also likelyto have reduced retailers’ profits, especially since private labels have been even moreheavily promoted than manufacturers’ brands.
Who Is Buying on Deal?
The beneficiaries have been consumers – but not all consumers equally. An analysis ofAGB Superpanel data for the year ending June 1996 shows that:

4
71% of multibuy purchases were made by only 13.7% of households – called“multibuy” households.
Almost all of the rest (24% out of 29%) was made by the next 13.6% ofhouseholds.
All other households (73% of households) accounted for just 5% of multibuypurchases; some of these were light buyers and some bought mostly discountbrands, but most were normal buyers of the category and its brands, who didnot shop around for multibuys – called “normal” households.
“Multibuy” households were not economically disadvantaged (the less well-offtended instead to buy budget brands); instead they tended to be slightlyupscale, larger households with children and include a housewife working part-time.
“Multibuy” households are less brand and store loyal than average.
In other words, the consumer benefits of multibuys are distributed highly inequitablyand, far from brand-building, manufacturers and retailers are rewarding disloyalty.
Consumer Attitudes
We briefly review relevant responses from a June 1996 attitude survey by Survey &Marketing Services for Procter &Gamble. Among the findings are that 60% ofconsumers agreed or strongly agreed that “products are priced artificially high inorder to afford big promotions,” 75% that “it irritates me when my brand is sold outbecause it was on special offer,” and 78% that “I’d rather they brought the pricesdown and stopped all those offers.”
Only 18% agreed or strongly agreed that “if there were no special offers in my usualstore for washing products, I’d shop somewhere else.” Even this seems an inflatedfigure, since in reality consumers have little idea as to whether their usual store hasmore or fewer special offers than other stores: Asda shoppers tend to believe that Asdahas an above-average number of special offers whereas in reality it has fewer, whileexactly the reverse applies for Sainsbury – it has more special offers than average butits shoppers think it has about the same or even fewer than average.
Escalating promotions are not liked by most consumers, do not build brand or storeloyalty, and do not even seem to be effective at gaining new customers.
Examining Alternatives to Multibuys
We have explored the likely consequences of manufacturers reallocating promotionalresources away from deep-discount multibuy and price off promotions towards a moreequitable mix of events. Specifically, we model the effects of a simplified scenario inwhich the depth of discount on multibuy and price off events is halved (from 30% to15% and from 20% to 10% respectively) and the resulting saving allocated to longer-term promotions such as loyalty card points or to price cuts.
5
The model predicts that the net effect would be that the “multibuy” households(13.7%) would still receive a disproportionate share of promotional resources (33%),but to a much lesser extent than now, so that their average expenditure on machinewash would increase by 9.2%. The next most deal-prone group (13.6% ofhouseholds) would also end up paying slightly more (0.9%). But the majority wouldpay less. In particular, the 56% “normal” households would save 3.5%.
The result would be much more equitable, as well as rewarding brand and storeloyalty. It would also lead to cost-savings by reducing the inefficiencies caused bylarge and unpredictable promotion-induced sales fluctuations.
Other Product Categories
We briefly review the results of a recent analysis of the instant coffee and yellow fats(butter and margarine) categories done by AGB for ITV. The results for instant coffeeare very close to those for machine wash, while those for yellow fats (a less heavilypromoted category) are similar but a bit less extreme: deal prone households (16.6%)account for 60% of multibuy-based purchasing of yellow fats – still highly inequitable.
Further work is needed to extend these analyses to less mature and more price-elasticcategories.
Taming the Multibuy Dragon
We believe that multibuys and other price promotions have escalated almost out ofcontrol in the last three years in the machine wash category and at least some otherfmcg categories. The only people who have benefited are a minority of households.
We argue that it would be better for manufacturers, retailers, and the majority ofconsumers if the escalation of deep-discount price promotions was reversed, byreducing the depth (and possibly frequency) of the offers and reallocating the resourcessaved into longer term loyalty programmes, price cuts, advertising, productdevelopment, and other brand-building activities.

6
1. Introduction
As marketing managers see more and more of their marketing budgets being spent on
price-based promotions, there is a concern that all these promotions are conditioning
consumers to look for bargains and may be having negative consequences on brand
and store loyalty. There is also some evidence that the proliferation of special deals is
unwelcome to the many consumers who would prefer to be rewarded for loyalty
instead of having to shop around for special offers. A number of managers are
therefore starting to question whether the promotional tools currently being used are
the best means of increasing the value associated with buying their brands.
In light of this, the aim of this study is twofold. First, we wish to better understand the
nature and consequences of current promotional activities, with a particular focus on
the machine wash product category. Second, we wish to explore whether there exist
avenues for marketing managers to design more equitable and/or efficient promotional
strategies.
1.1 Report Outline
Following a discussion of the study’s scope and limitations, we examine trends in
promotional activity, both generally and in the context of the machine wash category.
Our attention then shifts to the question of how equitable is the distribution of the
manufacturers’ promotional expenditures among the consumers of their products. This
is followed by an examination of consumer perceptions and attitudes towards
promotions. We then explore possible changes in promotional activities that
manufacturers could undertake to improve the equity of their promotions and the
efficiency of the supply chain. Having focused our attention on the machine wash
category, we then briefly extend the analysis beyond this category. The concluding
section summarises the various analyses conducted in this study and gives an overview
of the main findings and implications.
1.2 Scope and Limitations of the Study
This study has two main limitations. First, the “what-if” scenario discussed in Section
5 – an alternative to deep-discount multibuys – is based on reasonable assumptions

7
about how consumers with varying degrees of deal-proneness would respond to a
reallocation of promotional spend. These assumptions are derived from our analysis of
panel data (Section 3) and consumer attitudes (Section 4). The assumptions and
detailed calculations are given in Appendix B. However, these assumptions cannot be
directly tested from the data. It might be possible to refine them with a more complex
econometric analysis – we have not explored this – but we believe that the only way to
discover the consumer response for certain would be through a live experiment,
perhaps for just one or two categories in one or two regions.
Second, faced with a choice between an in-depth analysis of one product category and
a more superficial analysis of several product categories, we chose the former. As the
issues at stake are of great importance to both manufacturers and retailers, it is
important that clear insights and research approaches are developed. The machine
wash category is a classic example of a mature, stable fmcg market. We would expect
our results to generalize to other such product categories, and the results of a recent
ITV study of instant coffee and yellow fats (discussed briefly in Section 6) support this
assertion. We do not know the extent to which the conclusions generalise to less
mature and/or stable categories such as soft drinks or premium ice cream. More
research using the same methods as here would be needed to explore the issues of
promotional equity and efficiency across the full range of fmcg product categories.

8
2. The Escalation of Promotions
2.1 General Business Trends
The past decade has seen a shift in marketing expenditures from above-the-line to
below-the-line activities, in particular, to price-based sales promotions. A number of
factors have lead to this increase in promotional spending:
As markets became more competitive due the proliferation of brands and,
especially, SKUs (many of which lacked meaningful product differentiation),
and the maturing of categories, marketing practitioners turned to short-term
promotions as a means of achieving share targets.
This trend was reinforced by the increasing pressure for marketing
accountability: price promotions produce large measurable short-term sales
increases. Pressures from the sales force (many of whom are evaluated and
compensated on the basis of volume movement) have also encouraged such
activities.
The increased usage of promotions, along with the economic downturn of the
late 80s/early 90s, is thought to have conditioned many consumers to be more
price-oriented, thus making managers feel they need to make even more use of
price promotions.
The increasing power of retailers and the growth in private label activity has
also “forced” managers to make more use of promotions, be it due to retailer
pressure (e.g., the desire of retail buyers to meet volume levels so as to qualify
for (annual) quantity-based manufacturer discounts, and to meet internal annual
category volume and profit targets) or the need to meet the threat of lower-
priced brands.
Some commentators argue that there has been a decline in advertising
efficiency, especially for television, due to increased media fragmentation and
clutter combined with large increases in the cost per thousand viewers (CPT)
over the period 1975-90.
Finally, the availability of POS scanner technology and weekly scanner data
means that it is now very easy both to implement and to measure the immediate
effects of promotions.

9
Along with the increase in promotional spending, we have seen changes in the
promotional tools used by marketing managers. In the past, coupons were more
widely used, whereas multibuys were less popular as they often required the
manufacturer to create banded packs, which required forward planning and increased
the cost of production and distribution. However, the introduction of EPOS systems
meant that multibuys and price offs could be implemented at minimal notice and in a
virtually costless manner. Given that it is easy to communicate the nature of a
multibuy deal to the consumer (e.g., “Buy 2, Get 1 Free”), it is not surprising that
these promotions have increased in popularity. For example, in 1990-91, Procter &
Gamble spent about 20% of its consumer promotion budget on multiple purchase
promotional events in the laundry, cleaning and paper categories in which it has a
presence. This rose to almost 40% in 1993-4 and about 65% in 1995-6. The absolute
spend on multibuys has increased even more, since the total budget has also increased
(much faster than inflation).
2.2 An Overview of the Machine Wash Category
Moving beyond generalities, we now focus on the machine wash category. This is
considered to be a mature category, with very high-penetration of households (92% of
UK households, as measured by the AGB Superpanel) and limited scope for increased
household consumption: while consumers may “stock up” on machine wash products,
frequency of washing is primarily driven by the number of dirty clothes. Machine wash
is an important category on which the average household spends £32 per year
(approximately 2% of total grocery expenditure). Table 2.1 gives an overview of
category sales for the past three years.
Table 2.1 - Machine Wash Retail Sales 1994-6
Year Ending June1994 1995 1996
Category Turnover £million1
Index796100
75494.7
72991.6
Category Volume2 100 99.1 97.5Price/Volume3 100 95.6 93.9Base Price (non promotion) 2 100 96.9 98.4
1 Source: AGB Superpanel2 Source: Nielsen Store Audit3 Derived from 1 & 2

10
What is striking is that the past three years have seen an 8.4% reduction in category
turnover (index from 100 to 91.6); taking inflation into account, this represents
approximately a 13% reduction in real terms. As would be expected in such a mature
and stable category, there was little change in volume sales – a mere 2.5% reduction,
primarily due to switching between product forms. Consequently, most of the
reduction in turnover is due to a 6.1% reduction in the average price paid by
consumers (approximately 11% in real terms). Given that the average base price has
decreased by less than 2%, most of the decline in category turnover is attributable to
the increase in promotional price reductions, as we now discuss.
2.3 The Growth of Price Dealing in Machine Wash
For the year ending June 1996, 92% of the promotional events in the machine wash
category were directly price-based (e.g., multibuys, special offers). Price deals are
typically conveyed to the consumer in the form of a price reduction, a multibuy
purchase, or extra product free (i.e., extra fill). Looking at AGB Superpanel data for
the past three years, we can classify each consumer’s machine wash purchase as either
a budget brand purchase (Tesco Value, Safeway Savers, Kwiksave No Frills, Q Matic,
Netto, Aldi) or a non-budget brand purchase. The non-budget brand purchases can be
further classified as either deal (price off, multibuy, extra free) or normal (no price
deal) purchases. Table 2.2 reports the proportion of total machine wash expenditure
accounted for by each purchase type for the past three years.
Table 2.2 - Dealing Trends
% of TotalExpenditure
YearEndingJune1994 1995 1996
Normal 81.9 79.7 77.5Deal 12.9 14.5 16.4Budget 5.2 5.8 6.1
Over the past three years, we have seen a 27% increase in the proportion of
consumers’ expenditure on machine wash products accounted for by purchases on
some form of price deal (i.e., from 12.9% to 16.4 of total expenditure)..

11
This increase is due to a combination of three factors:
i) an increase in the number of price deals,
ii) an increase in the size of the average deal value, and
iii) an increase in consumer response.
Specifically, the number of events (including multibuy, link save, special offer and extra
product free) in the top 7 retailers for all brands in the machine wash category
increased from 388 in 1993-4 to 894 in 1995-6. An anecdotal study of individual
promotional events suggests that in 1993-4, multibuy events were showing typical
short-term sales builds of 25-40%; this had increased to 50-200% during 1995-6. This
increased take-up appears to be due to both increased offer levels and the “training” of
consumers.
2.4 The Impact of Private Label Price Deals
The past few years have seen an increase in private label activity in the machine wash
category. It is therefore natural for us to examine to what extent this is driving the
increase in deal expenditures. Table 2.3 separates the figures reported in Table 2.2
into amounts associated with branded and private label products, as well as their
respective market shares.
Table 2.3 - The Impact of Private Label Price Deals
Brand Private Label1994 1995 1996 1994 1995 1996
Share 88.7 86.0 82.4 11.3 14.0 17.6% Total Expenditure Normal 84.0 83.5 81.6 65.6 56.6 58.3 Deal 12.1 13.4 15.7 18.7 21.3 19.6 Budget 3.9 3.2 2.7 15.7 22.3 22.1
It is clear that the increase in category deal expenditure is due to both increased private
label share (accompanied by an increase in dealing by private label brands) and an
increase in the proportion of purchases of branded products on some form of price
deal. In value terms, the increase in deal expenditures is almost equally split between

12
branded and private label products. Whilst the increase in private label share is
obviously of concern to the manufacturers of branded products, the 30% increase in
the proportion of their sales on deal (12.1% to 15.7%) should be of equal, if not
greater, concern.
2.5 The Use of Different Types of Price Deal
Up to this point, our documentation of the proliferation of price dealing in the machine
wash category has ignored the type of deal being used. Table 2.4 breaks down the deal
expenditure
Table 2.4 - Trends in Price Deal Type Usage
% of Consumers’Expenditure
YearEndingJune1994 1995 1996
Price off 0.8 0.8 1.5 Multibuy 9.1 10.2 11.9 Extra free 2.9 3.5 2.9Total Price Deal 12.9 14.5 16.4
figures into the percentages associated with each of the three deal types.
Although price offs have grown by more in relative terms (0.8% to 1.5%), it is the
growth in multibuys (9.1% to 11.9%) which largely account for the 27% overall
growth in the proportion of consumers’ expenditure on price promotions (12.9% to
16.4%). This is because multibuys account for about 70% of consumers’ price
promotion-based purchases of manufacturers’ brands and about 80% for private labels
(Table 2.5).

13
Table 2.5 - Trends in Deal Type Mix
% ofConsumers’Purchaseson PricePromotion
YearEndingJune
1994 1995 1996Total: % Price off
% Multibuy% Extra free
67123
67024
97318
Brand: % Price off% Multibuy% Extra free
67025
47027
107120
Private Label: % Price off% Multibuy% Extra free
107812
127315
88110
Overall, the mix has been fairly stable, apart from a recent decline in the usage of extra
free promotions. Digging deeper, for manufacturers’ brands there is a clear shift from
extra free to price off promotions, and a slight shift from both offer types to multibuys
for private labels. The main pattern, however, is the dominance of multibuy
promotions in the machine wash category.
2.6 The Increasing Depth of the Multibuy Offer
The growth of the proportion of consumer expenditures on multibuys, which has
driven the growth of consumers’ purchases on price deals, has been driven not only by
an increase in the frequency of multibuy promotions but also by an increase in their
average depth. The average multibuy offer level has increased from 18% in 1993-4 to
25% in 1995-6. Over this time frame, the range of discount levels has not changed;
rather there has been a shift to events with higher effective discount values. As larger
discounts tend to generate greater sales volume, we can assume that the average event
discount values correspond to sales-weighted averages of 20% and 30%, respectively.
This suggests that manufacturers’ funding of multibuys has more than doubled over the
same period!1 Given the stability of this category, the growth in promotional discounts
1 From Tables 2.1 and 2.4 we can compute that consumers’ purchases on multibuys amounted to£72.4m in 1993-4 and £86.8m in 1995-6. An average discount of 20% suggests that themanufacturers’ funding amounted to £72.4/(1 0.2)*0.2 = £18.1m in 1993-4. With an average
14
has not lead to volume increases – as we saw in Table 2.1, volumes have if anything
decreased. All that has been achieved is a significant reduction in the value of the
category, combined with an increase in total supply chain costs due to the large and
only partly predictable short-term swings in volume caused by deep-discount
promotions. Nor do these promotions seem to be effective in increasing brand share or
store share (as we discuss in Sections 4 and 6).
Thus, price promotions, especially deep-discount multibuys, have hurt manufacturers
and not benefited (or even, by reducing category value, also hurt) retailers. Leaving
aside supply-chain inefficiencies, the beneficiaries have been consumers. But how
many, and which consumers? This is the question addressed in Section 3.
discount of 30% in 1995-6, the manufacturers’ funding of multibuys amounted to £86.8/(1 0.3)*0.3 =£37.2m, which represents a doubling of expenditure.

15
3. Which Consumers Benefit from Multibuys?
Up to this point, our focus on promotions has been at the total market level. We now
turn our attention to the consumer, with a view to understanding which consumers are
benefitting from all this promotional activity, and how equitable the allocation of
promotional monies is. (The numbers reported in this section are based on an analysis
conducted by Taylor Nelson AGB.)
3.1 Creating a Household Grouping
We start by classifying households in the AGB Superpanel according to their
propensity to buy machine wash products on multibuy. For the year ending June 1996,
households are classified according to the proportion of their total category
expenditure made on some form of multibuy deal. Five categories are created in the
following manner:
Multibuy Buyer - the proportion of machine wash purchases on
multibuy was more than one standard deviation above
the panellist’s expected multibuy spend (after allowing
for his/her pattern of store choice).2
Average Deal Buyer - the proportion of machine wash purchases on
multibuy was within one standard deviation of the
panellist’s expected multibuy spend.
Normal Buyer - the proportion of machine wash purchases on
multibuy was below the panellist’s expected multibuy
spend by more than one standard deviation
Budget Buyer - more than 50% of the panellist’s machine wash spend
was on budget brands.
Light Buyer - the panellist made less than 3 machine wash
purchases.
2 See Appendix A for details regarding the expected multibuy spend and standard deviationcalculations.

16
3.2 Characterising Household Types
The purchasing patterns of each group are summarised in Table 3.1. Whilst 17% of
the households are classified as “budget” or “light” buyers, they accounted for only 6%
of category turnover; we will therefore mainly focus our attention on the remaining
three groups of households.
Table 3.1 - Purchasing Patterns by Household Type(Year Ending June 1996)
“Multibuy” “AverageDeal”
“Normal” “Budget” “Light”
% Households 13.7 13.6 55.8 6.6 10.3% Expenditure on DealAvg # Brands
48 2.9
21 3.0
5 2.5
7 2.5
17 1.2
Avg # Category PurchasesCategory Share (%)Average Category Spend
11.7 20 £47
13.9 19 £45
11.2 55 £31
11.3 4 £21
1.6 2 £5
Average Basket SizeShare of Store Turnover (%)Avg # Stores
£41 16 5.0
£42 17 4.8
£34 55 4.5
£30 6 4.8
£21 6 4.6
The 14% of households classified as “multibuy” buyers were heavy category buyers
and, not surprisingly, a large proportion of their expenditure in the machine wash
category was made on some form of price deal (48%). 92% of these deal purchases
were multibuys. While these “multibuy” households tended to have large weekly
shopping bills (based on an analysis of total till roll expenditure), there is a regression-
to-the-mean effect: their disproportionate share of category purchases was only partly
reflected in their share of store turnover. These “multibuy” buyers were less brand
loyal and less store loyal than “normal” buyers: they had large brand and store
portfolios.
Those households classified as “normal” buyers accounted for 56% of households,
55% of category sales, and 55% of total store turnover. Yet only 5% of their
expenditure in the machine wash category was made on some form of price deal.
Moreover, they had high levels of both brand and store loyalty.
17
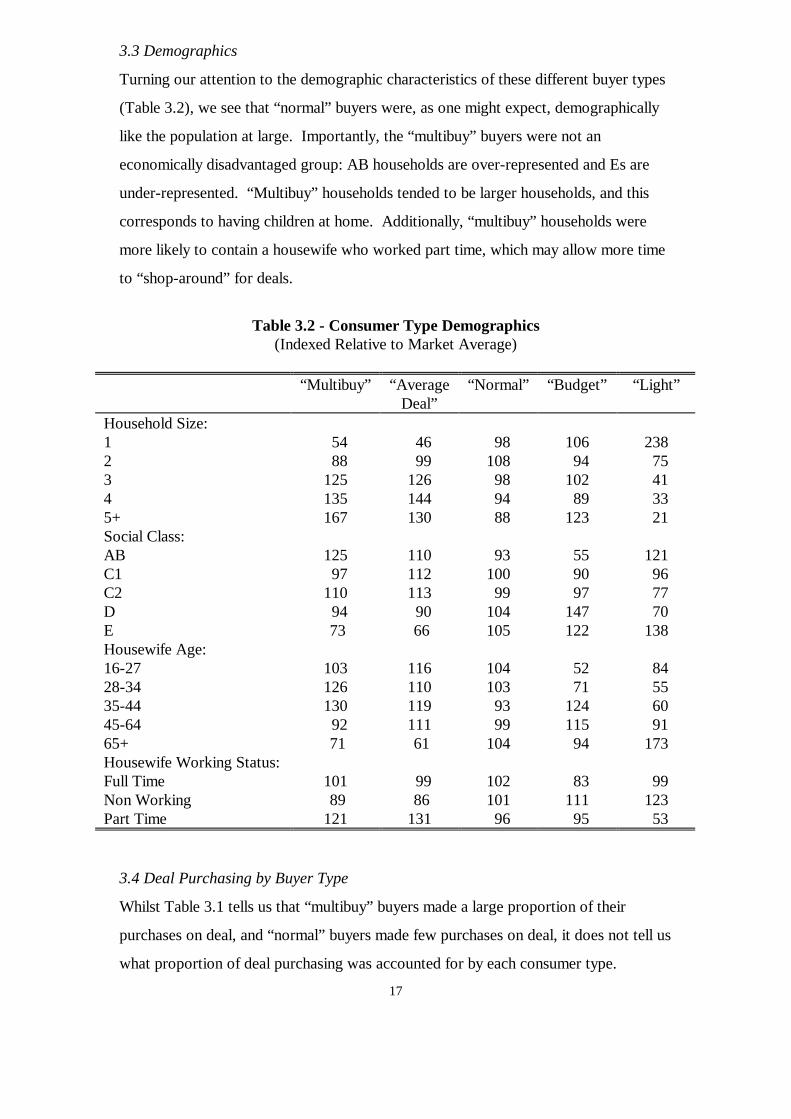
3.3 Demographics
Turning our attention to the demographic characteristics of these different buyer types
(Table 3.2), we see that “normal” buyers were, as one might expect, demographically
like the population at large. Importantly, the “multibuy” buyers were not an
economically disadvantaged group: AB households are over-represented and Es are
under-represented. “Multibuy” households tended to be larger households, and this
corresponds to having children at home. Additionally, “multibuy” households were
more likely to contain a housewife who worked part time, which may allow more time
to “shop-around” for deals.
Table 3.2 - Consumer Type Demographics(Indexed Relative to Market Average)
“Multibuy” “AverageDeal”
“Normal” “Budget” “Light”
Household Size:12345+
54 88125135167
46 99126144130
98108 98 94 88
106 94102 89123
238 75 41 33 21
Social Class:ABC1C2DE
125 97110 94 73
110112113 90 66
93100 99104105
55 90 97147122
121 96 77 70138
Housewife Age:16-2728-3435-4445-6465+
103126130 92 71
116110119111 61
104103 93 99104
52 71124115 94
84 55 60 91173
Housewife Working Status:Full TimeNon WorkingPart Time
101 89121
99 86131
102101 96
83111 95
99123 53
3.4 Deal Purchasing by Buyer Type
Whilst Table 3.1 tells us that “multibuy” buyers made a large proportion of their
purchases on deal, and “normal” buyers made few purchases on deal, it does not tell us
what proportion of deal purchasing was accounted for by each consumer type.
18
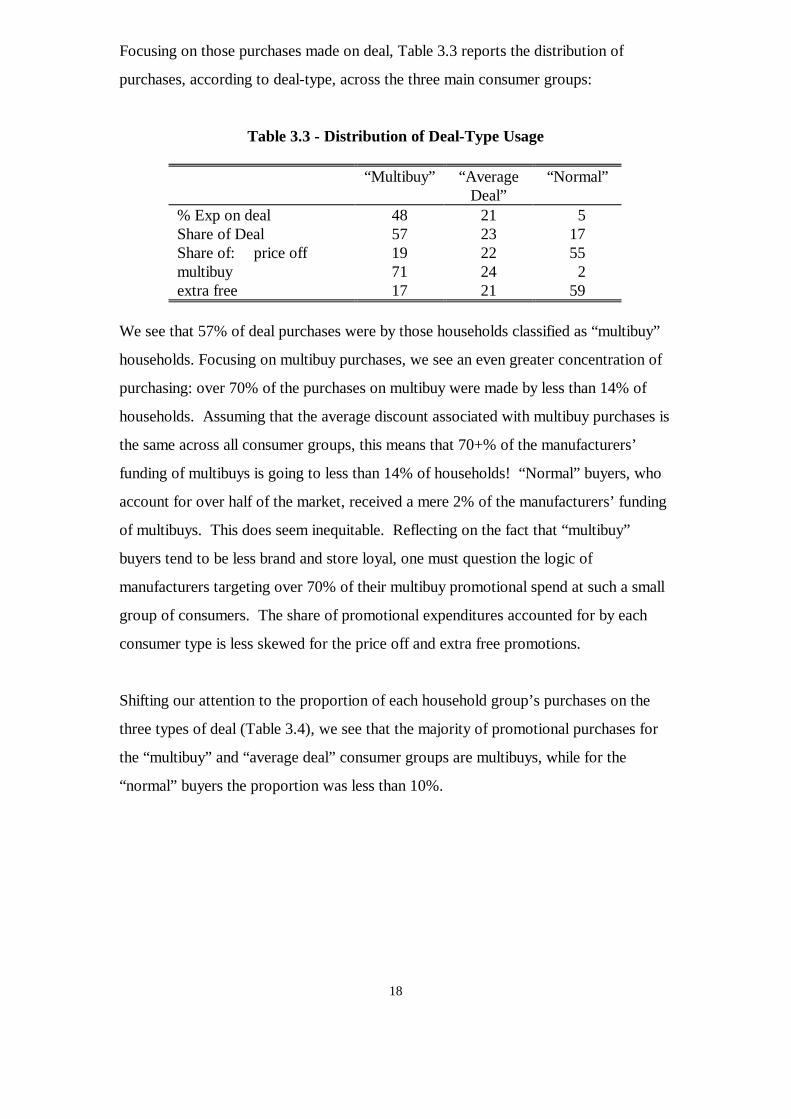
Focusing on those purchases made on deal, Table 3.3 reports the distribution of
purchases, according to deal-type, across the three main consumer groups:
Table 3.3 - Distribution of Deal-Type Usage
“Multibuy” “AverageDeal”
“Normal”
% Exp on deal 48 21 5Share of Deal 57 23 17Share of: price offmultibuyextra free
197117
222421
55 259
We see that 57% of deal purchases were by those households classified as “multibuy”
households. Focusing on multibuy purchases, we see an even greater concentration of
purchasing: over 70% of the purchases on multibuy were made by less than 14% of
households. Assuming that the average discount associated with multibuy purchases is
the same across all consumer groups, this means that 70+% of the manufacturers’
funding of multibuys is going to less than 14% of households! “Normal” buyers, who
account for over half of the market, received a mere 2% of the manufacturers’ funding
of multibuys. This does seem inequitable. Reflecting on the fact that “multibuy”
buyers tend to be less brand and store loyal, one must question the logic of
manufacturers targeting over 70% of their multibuy promotional spend at such a small
group of consumers. The share of promotional expenditures accounted for by each
consumer type is less skewed for the price off and extra free promotions.
Shifting our attention to the proportion of each household group’s purchases on the
three types of deal (Table 3.4), we see that the majority of promotional purchases for
the “multibuy” and “average deal” consumer groups are multibuys, while for the
“normal” buyers the proportion was less than 10%.

19
Table 3.4 - Percentage of Deal Purchasing by Buyer Type
“Multibuy” “AverageDeal”
“Normal”
Price off 3.0 8.6 29.9Multibuy 92.0 75.7 9.8Extra free 5.0 15.7 60.3
Table 3.5 shows the buyer types’ sharply differing propensities to buy on each of the
three deal types (by expressing the above proportions of purchases on the three deal
types as an index relative to the proportions for all households).
Table 3.5 - Propensity to Buy on Deal Type(Index relative to Market Average)
“Multibuy” “AverageDeal”
“Normal”
Price off 33 95 331Multibuy 125 103 13Extra free 29 91 349
“Normal” buyers have a clear propensity not to buy on multibuy. One must wonder
whether the roots of this are attitudinal (e.g., they dislike multibuys), behavioural (e.g.,
they walk past without noticing multibuys), or economic (e.g., they can’t afford to
stock up on the product). Their greater propensity to make price off and extra free
purchases presumably largely reflects the fact that they automatically benefit from such
promotions even when they buy their main brand(s) in a loyal manner. On the other
hand, the greater propensity of “multibuy” buyers to make multibuy purchases suggests
an active search for such deals.
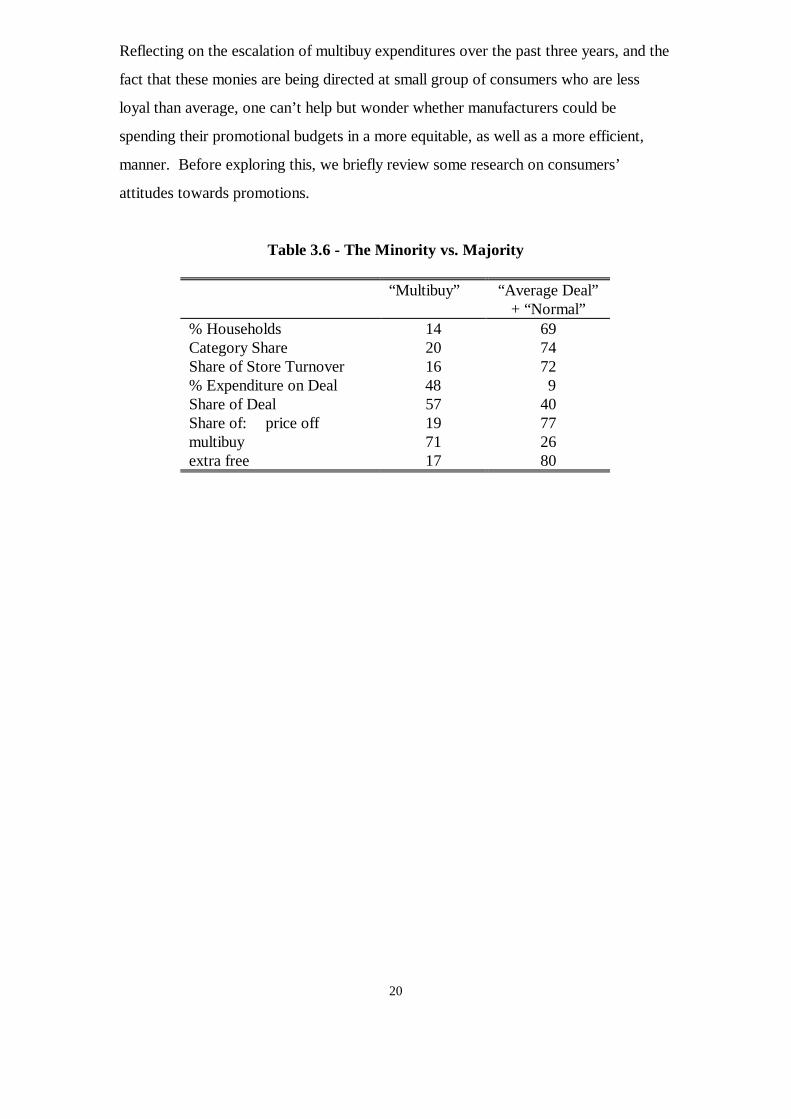
3.5 The Minority Versus the Majority
Table 3.6 summarizes the above information, combining the “average deal” and
“normal” buyer groups for simplicity. This “majority” accounts for almost 70% of
households, and over 70% of category sales and store turnover. They make only 9%
of their purchases on deal, and capture only 26% of multibuy expenditures. On the
other hand, the “multibuy” buyers – less than 14% of households – capture over 70%
of the manufacturers’ expenditures on multibuy promotions.
20
Reflecting on the escalation of multibuy expenditures over the past three years, and the
fact that these monies are being directed at small group of consumers who are less
loyal than average, one can’t help but wonder whether manufacturers could be
spending their promotional budgets in a more equitable, as well as a more efficient,
manner. Before exploring this, we briefly review some research on consumers’
attitudes towards promotions.
Table 3.6 - The Minority vs. Majority
“Multibuy” “Average Deal”+ “Normal”
% Households 14 69Category Share 20 74Share of Store Turnover 16 72% Expenditure on Deal 48 9Share of Deal 57 40Share of: price offmultibuyextra free
197117
772680
21
4. Consumer Attitudes
In order to examine a number of consumer attitudes towards promotions, we draw on
a study undertaken by Survey & Marketing Services Ltd for Procter & Gamble. The
study was a hall test using self-completion questionnaires run in eight locations across
the UK. A total of 839 consumers were interviewed during the last two weeks of June
1996. Some of the questions asked are relevant to the issues explored in this paper.
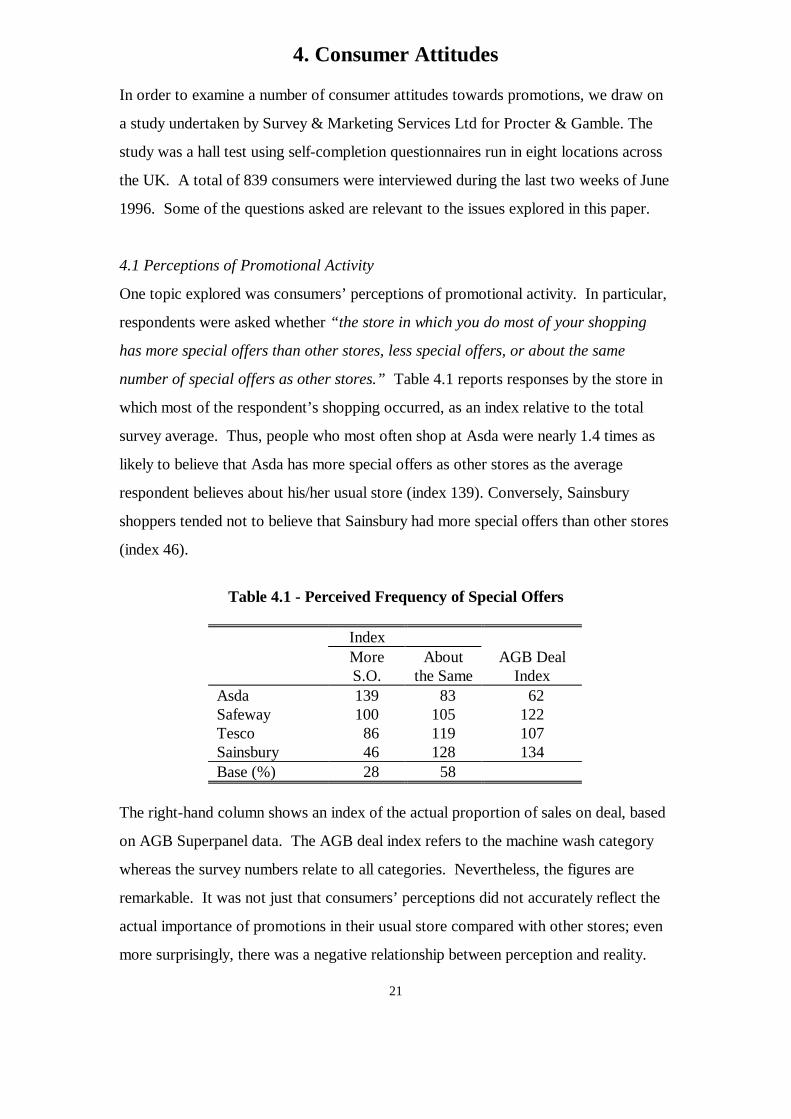
4.1 Perceptions of Promotional Activity
One topic explored was consumers’ perceptions of promotional activity. In particular,
respondents were asked whether “the store in which you do most of your shopping
has more special offers than other stores, less special offers, or about the same
number of special offers as other stores.” Table 4.1 reports responses by the store in
which most of the respondent’s shopping occurred, as an index relative to the total
survey average. Thus, people who most often shop at Asda were nearly 1.4 times as
likely to believe that Asda has more special offers as other stores as the average
respondent believes about his/her usual store (index 139). Conversely, Sainsbury
shoppers tended not to believe that Sainsbury had more special offers than other stores
(index 46).
Table 4.1 - Perceived Frequency of Special Offers
IndexMoreS.O.
Aboutthe Same
AGB DealIndex
AsdaSafewayTescoSainsbury
139100 86 46
83105119128
62122107134
Base (%) 28 58
The right-hand column shows an index of the actual proportion of sales on deal, based
on AGB Superpanel data. The AGB deal index refers to the machine wash category
whereas the survey numbers relate to all categories. Nevertheless, the figures are
remarkable. It was not just that consumers’ perceptions did not accurately reflect the
actual importance of promotions in their usual store compared with other stores; even
more surprisingly, there was a negative relationship between perception and reality.

22
For example, Asda, whose buyers were the most likely to say it had more special offers
than other stores, actually had significantly fewer. The opposite was true for
Sainsbury. More research is needed to confirm this result. To the extent that
perceptions of promotional activity drive perceptions of overall store value, this mis-
match should trouble retailers, although it does suggest opportunities for improvement,
especially for Sainsbury.
Shoppers are also confused when it comes understanding how promotions are funded.
When asked whether special offers are funded by the store or the manufacturer, 56%
chose the store, with only 44% choosing the manufacturer. This should perhaps
trouble the manufacturer, who might prefer the consumer to attribute promotions to
the manufacturer, thereby building loyalty to his brand - although not if the effect is the
opposite, i.e., if repeated promotions reduce brand equity. (Conversely, the retailer
may prefer the consumer to feel that promotions are funded by the store, thereby
thinking that they are not available in other stores and increasing the shopper’s loyalty
towards the store.) Closely related to this is the belief that “products are priced
artificially high in order to afford big promotions” (60% agree/ strongly agree). Such
perceptions could prove damaging as manufacturers and retailers seek to position
themselves in terms of value.
4.2 Consumer Preferences
Promotions are not as important to most consumers as we might think. 78% of those
surveyed expressed agreement (agree/strongly agree) with the statement “I’d rather
they brought the prices down and stopped all those offers.” Similarly, only 18% of
those surveyed expressed agreement (agree/strongly agree) with the statement “if
there were no special offers in my usual store for washing products, I’d shop
somewhere else.”
Even though consumers are willing to “buy more than one pack if the offer’s good”
(84% agree/strongly agree), the various promotional activities can have negative
consequences: consumers are frustrated by promotion-induced stockouts (75%
agree/strongly agree that “it irritates me when my brand is sold out because it was on
special offer”) as well as perceived inequity in promotional activities (47% “get
23
irritated when I buy my usual brand and another brand is on special offer”). It is
also troubling to note that 65% agree/strongly agree that “there is currently no
incentive for being loyal to a brand.”
Finally, when asked to rate various types of special offer from most preferred to least
preferred, extra free received the highest rating, followed by price off and then
multibuys. In-store coupons were least preferred. Given current promotional
practices, this suggests that there is plenty of scope for manufacturers to realign their
promotional activities, and explore approaches that encourage loyalty to both the
brand and the store. We examine this issue in the next section.

24
5. Examining Alternatives to Multibuys
Based on the observation that we have seen an escalation in price promotions over the
past three years, especially in the depth of multibuys, and that these marketing
expenditures are being directed at a small group of consumers who are less brand and
store loyal than average, we now explore the issue of whether there are more equitable
and efficient ways for manufacturers to spend their promotional budgets.
5.1 Designing More Equitable Promotions
We first consider the issue of equity in the distribution of promotional spend. New
technologies such as retailers’ loyalty cards represent new opportunities for
manufacturers to create promotional tools which reward consumers for brand loyalty,
e.g., by issuing bonus points on the basis of brand purchases over a six-month period.
This also enables manufacturers to co-develop promotions with retailers to reward
both brand and store loyalty. In the following analysis, we simply assume that such
mechanisms exist; we leave their creative design to the appropriate marketing and sales
executives.
Our aim is to evaluate the impact of cutting back the depth of short-term price
promotions by a fixed amount, and returning a proportion of the savings to consumers
via longer-term promotions (e.g., linked to loyalty cards). The purpose of the analysis
is to demonstrate some of the potential consequences of a de-escalation in promotional
activities, and to challenge readers to think of the possibilities associated with the
redesign of their organization’s promotional activities.
The approach we take is to view the year ending June 1996 as a “base year” and
examine the likely changes in market behaviour given a few simple assumptions.
Specifically, we compute expected sales under the new promotional regime and the
associated savings for the manufacturer. This money is then redistributed to
consumers, and we compute the average change in total spend for each buyer type.
The exact details of the calculations are described in Appendix B.

25
5.2 A “What-if?” Scenario
Let us first assume that the average price off discount was 20%, the average multibuy
discount was 30%, and the average extra free discount was 20% (i.e., 25% extra free).
Suppose there was a unilateral move on the part of all manufacturers whereby they
halved the value of their price off and multibuy discounts (to 10% and 15%,
respectively), and that there was no trade reaction. (It is assumed that there is no
reduction in the format of extra free packages due to manufacturing constraints, and
therefore no change in the equivalent price discount.)
Next, we have to make some assumptions regarding the reduction in promotional sales
following the reduction in discount values. Let us
i)condition our analysis on a stated reduction in promotional sales associated
with the reduction in average price discounts, and
ii) assume that the purchases which replace the dropped promoted purchases are
made at price levels the same as the non-promoted price of the same brand
which would have been purchased on promotion (as opposed to switching
to a lower price-tier brand).
More specifically, let us assume that halving the discount levels for price offs and
multibuys results in a 40% reduction in promotional sales volume for each promotional
type.
Under these simple assumptions, we would observe the following purchasing patterns
for each of the five consumer groups (Table 5.1).
Table 5.1 - Purchasing Patterns Under New Promotional Regime
“Multibuy” “AverageDeal”
“Normal” “Budget” “Light”
Avg Spend on: price offmultibuyextra free
0.4615.10 1.13
0.53 5.06 1.44
0.33 0.12 0.98
0.15 0.69 0.23
0.030.440.22
Avg Total Spend 52.99 46.78 31.47 21.37 5.41% Increase (vs. act 1995-6) 13.6 5.0 0.4 1.5 3.6

26
(Note that under the assumption that the average discount for each promotion type is
the same across all consumer groups, each groups’ share of purchases by deal type
remains the same as the figures reported in Table 3.4.) These reductions would free up
£128.55/100HHs, or a total of approximately £29m in retail terms.
Let us assume that the manufacturers decided to return all of this saving directly to
consumers via longer-term promotions (e.g., a loyalty card-based scheme or a
reduction in base price). We assume that the savings are redistributed on the basis of
each household’s category purchases. Over the year ending June 1996, this would
correspond to just under 4 pence in the pound.
Table 5.2 - Revised Expenditures and Allocations
“Multibuy” “AverageDeal”
“Normal” “Budget” “Light”
% Households 13.7 13.6 55.8 6.6 10.3Avg Reallocation 2.05 1.81 1.22 0.83 0.21Avg Category Spend 50.93 44.97 30.25 20.54 5.20% Increase/Decrease (vs. act) 9.2 0.9 -3.5 -2.4 -0.4Share of Promotional Exp 33 21 41 3 2
From Table 5.2 we see that “multibuy” buyers receive the greatest “refund” (£2.05), as
they are heavy category buyers. This, however, does not compensate them for the
decrease in multibuy and price off discount levels; their average category expenditure
increases by 9.2%.
On the other hand, since “normal” buyers made hardly any purchases on deal, they are
more than compensated for the reduction in discount levels; they are now spending
3.5% less on the category. What is encouraging is that we now have a far more
equitable distribution of the manufacturers’ promotional expenditures. Whereas
“multibuy” buyers (14% of households accounting for 20% of category sales) used to
capture 57% of total promotional expenditures, their share has dropped to 33%: still
far more than their share of category sales but to a much lesser extent than now.
Under the old promotional regime, “normal” buyers received only 17% of the
manufacturers’ promotional expenditures; this has now risen to 41%, much closer to
their 55% share of category purchases. This is clearly a more equitable scenario, and
through the appropriate design of the reallocation mechanisms, could encourage
loyalty to the brand and the store.

27
Other scenarios could be examined. For example, rather than redistributing all of the
savings directly to the consumer, say 25% could be held back and invested in media
advertising, product development and other long-term brand building activities.
5.3 The Impact of a New Promotional Regime on Efficiency
Aside from the above equity and loyalty benefits, there are number of cost savings that
would naturally flow from a de-escalation of deep-discount multibuy and price off
promotions. Even if this de-escalation involved no reduction in the frequency of
promotions but merely a reduction in the discount value (as in the above analysis), we
would see a smoothing of the standard sales patterns.
The benefits to the manufacturer of this reduction in the variance of sales include lower
inventories of raw materials and finished goods (with a reduction in working capital),
improved production coordination, reduced overtime, more efficient use of warehouse
facilities (and possibly a reduction in the need to use outside storage), and more
efficient management of the process of distributing the product to the retailers’
distribution centres.
From the retailers’ perspective, there are a number of benefits associated with less
fluctuating sales rates. There should be a reduction in the need to store large amounts
of product before and during promotions, with clear impacts on storage, financing, and
handling costs. Additionally, there should be less disruption of work in the retailers’
distribution centres. In the store itself, the likelihood of stockouts should be reduced,
thereby minimizing the problems of customer dissatisfaction and lost purchases.
Moreover, in-store personnel can be freed from some of the burden of managing the
implementation of these promotions.
Without access to commercially confidential company information, we cannot quantify
the cost savings associated with improved efficiency of the logistics system. However,
viewing the development of more efficient promotional strategies as a part of category
management and ECR initiatives, we can reflect on the cost savings presented in the

28
ECR literature. In particular, we consider some figures from the value chain analysis
conducted by Coopers & Lybrand as part of the ECR Europe project.
In a study of fifteen product categories (including machine wash), expected cost
reductions attainable through the implementation of ECR were estimated to average
5.7% of consumer retail price, with 4.8% stemming from reduced operating costs and
the remaining 0.9% attributable to a reduction in inventory costs. Almost 30% of the
operating cost reductions result from optimized promotions and synchronized
production; in the case of inventory reductions, synchronized production accounts for
40% of the savings. In all, Coopers & Lybrand estimate that savings of approximately
1.8% of retail price can be obtained through optimized promotions and synchronized
production. In order to realise such benefits, all parties in the supply chain would need
to cooperate. Whilst we would not claim that a re-thinking of promotional activities
along the lines of those previously discussed would lead to savings as high as this, they
do indicate the scale of savings available.
Clearly, further work is needed in order to appreciate how a de-escalation of
promotional activities contributes to the widely touted potential savings associated
with the implementation of ECR This lies beyond the scope of this study.
29
6. Other Categories
Our analysis of the impact of current promotional practices and the possible
consequences of changes in these activities has focused on the machine wash category.
A natural question is how generalizable are the ideas discussed in this paper? This can
be addressed in two stages:
i) do we observe similar levels of inequity in the allocation of promotional
expenditures in other mature categories where there is little scope for
promotion-induced increases in total annual consumption, and
ii) do we observe similar levels of inequity in the allocation of promotional
expenditures in categories for which there may be scope for increases in
total annual consumption?
6.1 Instant Coffee and Yellow Fats
In order to partially answer the first part of this question, we re-examine the results of
an analysis, similar to that presented in Section 3, commissioned by ITV and presented
at BAFTA, 17 July 1996. In addition to machine wash, two other major high-
penetration consumer categories – instant coffee and yellow fats – were examined.
The classification of consumers differs slightly from that used in our study in that
households were classified according to the proportion of their total category
expenditure made at promotional prices (i.e., including price offs and extra free as well
as multibuy). Therefore, the “multibuy” group of buyers becomes the “deal prone”
group. All the other buyer group names remain the same.3
The results for instant coffee are similar to those for machine wash. For the 1995
calendar year, 17% of total expenditure was on one of the three deal types previously
considered (versus 15.6% for machine wash over the same period). Moreover,
multibuys were the dominant form of promotional tool, accounting for 71% of deal
purchases. Price off and extra free deals accounted for 19% and 10% of deal
purchases, respectively. Turning our attention to the consumer, and using the same
rules for categorizing households, we observe very similar distribution patterns (Table
6.1).
3 Note that our group names are not exactly the same as those used in the ITV report.

30
Table 6.1 - Instant Coffee: The Minority vs. Majority
“DealProne”
“AverageDeal”
+ “Normal”% Households 14.4 62.1Category Share 23 73% Expenditure on Deal 48 8Share of Deal 62 35Share of: price offmultibuyextra free
44 68 50
53 28 47
The inequitable allocation of promotional resources is similar to that observed in the
machine wash category. Moreover, “deal prone” buyers again have the largest brand
portfolios, suggesting less brand loyalty than other consumers. Finally, the “normal”
buyers account for over 40% of households, yet only make 2% of their purchases on
deal, and receive a mere 3% of the manufacturers’ funding of multibuys.
Table 6.2 presents the equivalent analysis for the yellow fats (butter and margarine)
category.
Table 6.2 - Yellow Fats: The Minority vs. Majority
“DealProne”
“AverageDeal”
+ “Normal”% Households 16.6 80.7Category Share 19 79% Expenditure on Deal 22 4Share of Deal 57 43Share of: price offmultibuyextra free
55 60 70
44 41 29
Whilst this category is less promotion intensive than machine wash and instant coffee
(only 7% of expenditure on deal) and the mix of promotional tools is quite different
(price off accounts for 73% of promotional expenditure), we again find a highly

31
inequitable distribution of the manufacturers’ promotional spend, with 17% of
households receiving 57% of the spend.
As reported in the original ITV presentation, the “deal prone” buyers are not an
economically disadvantaged group of consumers. (Whether we can say that it is
almost the same group of consumers across the three categories who are benefitting
from these promotions is beyond the scope of this analysis and could be examined in
future research.) Future research may wish to examine the applicability of the
proposals outlined in this report to these two categories.
6.2 Low-Penetration and Price-Elastic Categories
Clearly, the strategies explored in Section 5 are not necessarily desirable in all
categories. In particular, for low-penetration categories (e.g., yoghurt drinks) where
there are no “natural” barriers to increased penetration (cf., disposable diapers),
promotions may play an important role in increasing consumer acceptance of the
product category, and the negative aspects of promotions we observe in the machine
wash category are unlikely to hold to the same extent.
Also, in many other categories, even mature categories with high household
penetration, there may be scope to create incremental household consumption via
promotions (e.g., chocolate, crisps, fresh fruit juice). Clearly promotions can be a
“good thing” in such categories. Moreover, as we have not documented either the
trends in promotional activity or the concentration of promotional purchases for such
categories, we are not in a position to comment on the wisdom of changing current
marketing practices. Such further research should be a priority.
32
7. Conclusion: Taming the Multibuy Dragon
The aims of this study were to better understand the nature and consequences of
current promotional activities, with a particular focus on the machine wash product
category, and to explore possible avenues for marketing managers to develop more
equitable and/or efficient promotional strategies.
Over the past three years, turnover in the machine wash category has decreased by
8.4% in money terms – approximately 13% in real terms. The primary cause of this
decline is a 6.1% reduction in the average price paid, mainly resulting from an increase
in deep-discount price promotions. By the year ending June 1996, 16.4% of
consumers’ expenditure on machine wash products was on some form of price deal.
Within this category, multibuy promotions are the dominant promotional tool,
accounting for 73% of deal purchases. The past three years have seen a doubling in
manufacturers’ funding of multibuy promotions.
With so much money spent on one promotional tool, we explore what is happening
with this expenditure. Turning our attention to the consumer, we see that a mere
13.7% of households account for 57% of purchases on deal and 71% of multibuy
purchases. Assuming that the average discount associated with multibuy purchases is
the same across all consumer groups, this means that 71% of the manufacturers’
funding of multibuys is going to just 14% of consumers! On the other hand, over half
of the households receive a mere 2% of the manufacturers’ funding of multibuys. This
clearly is not equitable. Moreover, the “multibuy” buyers tend to be less brand and
store loyal, bringing into question the logic of manufacturers targeting over 70% of
their multibuy promotional monies at such a small and disloyal group of consumers.
Additionally, current practices need to be re-evaluated in light of consumer attitudes
towards promotions (see Section 4).
In light of this, in Section 5 we explored a scenario in which there was a unilateral
move on the part of all manufacturers whereby they halved the value of their price off
and multibuy discounts, and there was no trade reaction. Given some simple
assumptions regarding the reduction in promotional sales following this de-escalation

33
in the depth of promotional discounts, and the redistribution of the associated savings
in promotional expenditures, we project a far more equitable distribution of
promotional expenditures. The “multibuy” buyers’ share of promotional expenditures
drops from 57% to a more acceptable 33%. In addition to equity improvements, there
is also scope for improvements in the efficiency of logistics systems.
Examining some recent research commissioned by ITV, it is clear that these results are
not specific to the machine wash category. However, further work is required to
understand the equity and efficiency of promotions, especially in product categories
that are less mature and/or able to have their usages rates temporarily increased. We
hope that this report motivates organisations to examine whether their promotional
activities can be redesigned in such a manner so that the majority of consumers are
better off, and that both manufacturers and retailers can improve the efficiency of their
systems. We believe that deep price promotions – especially multibuys – have recently
escalated almost out of control and that it is time to tame this particular dragon.

34
Appendix ADetails of Calculations for Consumer Classification
In the analysis presented in Section 3, the households in the AGB Superpanel were
classified as belonging to one of five groups of buyers according to their purchasing
patterns. Allocations to the “multibuy”, “average deal” and “normal” groups were on
the basis of their deviation from their expected purchasing on multibuy deals. These
household-level averages and standard deviations are computed in the following
manner (based on documentation provided by Taylor Nelson AGB).
Assuming it is not a “light” or “budget” buyer, a household’s expected multibuy
purchasing is based on where it shops and what proportion of sales in each store was
on multibuy. Suppose for a given household that 70% of its machine wash purchases
last year were made in Sainsbury and the remaining 30% in Tesco. Suppose that the
percentage of all machine wash purchasing on some form of multibuy-based deal in
Sainsbury and Tesco is 15% and 10% respectively. The expected proportion of spend
on multibuy for this household is therefore (70% × 15%) + (30% × 10%) = 13.5%.
If this household made 10 purchases over the course of the year, the standard deviation
of the expected spend proportion can be estimated by the binomial distribution
formula:
which is 10.8% for this example. If
the household’s actual proportion of purchasing on multibuy deal was greater than p+
= 24.3% then it will be classified as a “multibuy” buyer, if the proportion was less than
p = 2.7% it is classified as a “normal” buyer, and if it was between 2.7% and 24.3% it
is classified as an “average deal” buyer.
sigma~=~ sqrt{p(1-p)/n}

35
Appendix BDetails of Calculations for “New” Promotional Regime
This appendix explains the detailed calculations used in the analysis presented in
Section 5.2. In order to examine the impact of changes in promotional activity, we
compute the projected impact for each of the five buyer types, then aggregate to the
total market. This appendix gives step-by-step details that show the logic of the
calculations for the “multibuy” buyer group; the calculations for the remaining groups
naturally follow.
From the base AGB Superpanel analysis, we know that the average “multibuy”
household’s spend in the machine wash category for the year ending June 1996 was
£46.65, 48.3% of which was on deal. The distribution of its deal purchases across the
three deal types was 3% on price off, 92% on multibuy, and 5% on extra free. This
corresponds to the following sterling values:
Price off
£
0.68
Multibuy 20.73
Extra free 1.13
Non deal 24.12
Now the average discount for price off deals is given at 20%. Therefore, the non-deal
value of these purchases is £0.68/(1 0.20) = £0.85. This implies that deal purchases
are being funded by the manufacturers to the extent of 17 pence (85p minus 68p).
Similarly, the non-deal value of the multibuy and extra free purchases are £20.73/(1
0.30) = £29.61 and £1.13/(1 0.20) = £1.41 respectively, indicating manufacturer
funding to the extent of £8.88 and £0.28 respectively. Therefore, manufacturers have
been funding the average “multibuy” buyer’s purchases to the extent of £9.33.
Under the proposed new promotional plan, the average discounts for price off and
multibuy deals would drop to 10% and 15% respectively, leading to an assumed 40%
reduction in these promotional sales. Considering that the multibuy sales were
previously worth £29.61 at non-deal prices, 40% (valued at £29.61×0.40 = £11.84)

36
become non-deal sales, whilst the remaining 60% are now sold to the consumer at a
discount of only 15%; therefore, the average “multibuy” consumer now pays
£29.61×0.60×(1 0.15) = £15.10 on multibuy with the manufacturers’ funding equalling
£29.61×0.60×0.15 = £2.66. Similar calculations for the price off purchases previously
worth £0.85 results in £0.34 becoming non-deal purchases, with the on-deal purchases
costing the consumer £0.46, reflecting manufacturers’ funding to the level of 5 pence.
Note that the assumed 40% reduction in sales volume associated with the halving of
the average discounts for price off and multibuys corresponds to a value reduction in
sales on each deal type of 33% and 27%, respectively.
As we assume no reduction in the implicit discount associated with extra free deals,
there is no change in consumer expenditure on this deal type. The breakdown of an
average “multibuy” buyer’s purchasing is now as follows:
Price off
£
0.46
Multibuy 15.10
Extra free 1.13
Non deal 36.30
52.99
This means that the average “multibuy” buyer’s expenditure in the machine wash
category has increased by 13.6% to £52.99. The manufacturers’ funding of the deal
purchases has dropped from £9.33 to £2.99, representing a saving of £6.34 per
“multibuy” household.
Replicating this analysis for the other four buyer types, the total manufacturers’
savings/100HHs associated with the new promotional plan is simply created by
multiplying the number of households for each deal type that could be expected in a
sample of 100 households by the savings associated with each deal type (13.7×£6.34 in
the case of “multibuy” buyers). As noted in Section 5.1, this equals £128.55/100HHs.
Reallocation of these “savings” in promotion expenditure is assumed to be
proportional to the total value of each household’s category purchases. Under the new

37
promotional regime, total category purchases amount to £3315.15/100HHs,
suggesting a “refund” of 3.878 pence for every pound spent on machine wash
(£128.55/£3315.15). Consequently the “multibuy” household would be reimbursed
£52.99×0.03878 = £2.05, bringing its average category spend for 1996 to £50.94,
which represents an increase of 9.2% over the actual spend in 1995-6. The total
amount of manufacturers’ promotional funds allocated to the average “multibuy” buyer
is £2.99 + £2.05 = £5.04.
Replicating this analysis for the other four buyer types, we can then calculate each
buyer type’s share of promotional expenditures (Table 5.2).
These assumptions have been built into a spreadsheet model.


![[XLS] · Web view1 302 2 302 3 302 4 302 5 302 6 363 7 363 8 302 9 302 10 307 11 302 12 302 13 223244 14 302 15 302 16 224 17 302 18 302 19 302 20 302 21 302 22 23 24 25 26 302 27](https://static.fdocuments.in/doc/165x107/5b00c3a37f8b9a952f8d6104/xls-view1-302-2-302-3-302-4-302-5-302-6-363-7-363-8-302-9-302-10-307-11-302-12.jpg)

