CENTRE FOR EVIDENCE-BASED CONSERVATION Effectiveness of the
43
1 CENTRE FOR EVIDENCE-BASED CONSERVATION Effectiveness of the Control of Ragwort (Senecio) Species Systematic Review Series: SYSTEMATIC REVIEW N o. 5b. “Can biological control by the use of natural enemies effectively control Senecio jacobaea (common ragwort)?” REVIEW REPORT COMPILED BY Roberts, P.D. & Pullin, A.S. Centre for Evidence-Based Conservation School of Biosciences The University of Birmingham Edgbaston Birmingham B15 2TT U.K. February 2005 This review should be cited as: Roberts, P.D. & Pullin, A.S. (2005) Effectiveness of the control of ragwort (Senecio) species: “Can biological control by the use of natural enemies effectively control Senecio jacobaea (common ragwort)?” Systematic Review N o. 5b. Centre for Evidence-Based Conservation, Birmingham, U.K.
Transcript of CENTRE FOR EVIDENCE-BASED CONSERVATION Effectiveness of the

1
CENTRE FOR EVIDENCE-BASED CONSERVATION
Effectiveness of the Control of Ragwort (Senecio) Species Systematic Review Series:
SYSTEMATIC REVIEW No. 5b.
“Can biological control by the use of natural enemies effectively control Senecio jacobaea (common ragwort)?”
REVIEW REPORT
COMPILED BY Roberts, P.D. & Pullin, A.S.
Centre for Evidence-Based Conservation School of Biosciences The University of Birmingham Edgbaston Birmingham B15 2TT U.K. February 2005 This review should be cited as: Roberts, P.D. & Pullin, A.S. (2005) Effectiveness of the control of ragwort (Senecio) species: “Can biological control by the use of natural enemies effectively control Senecio jacobaea (common ragwort)?” Systematic Review No. 5b. Centre for Evidence-Based Conservation, Birmingham, U.K.

2
COVER SHEET Title Can natural enemies effectively control common ragwort
(Senecio jacobaea) Reviewer(s) Roberts, P.D., (PDR) & Pullin, A.S. (ASP)
Date protocol first published on website
28th June 2004
Date review first published on website
March 2005
Date of most recent amendment
-
Date of most recent SUBSTANTIVE amendment
-
Most recent changes -
Contact address Philip Roberts Centre for Evidence-Based Conservation School of Biosciences University of Birmingham Edgbaston Birmingham B15 2TT UK Tel: 0121 4144090 Email: [email protected]
Systematic review No. No. 5 part b
Sources of support NERC, English Nature.
Conflict of interests None reported.

3
SUMMARY
BACKGROUND Biological control is the purposeful introduction of natural enemies (biocontrol agents) by land managers and scientists as a means to weaken and/or suppress invading plants or animals. Since the 1930s natural enemies, such as Tyria jacobaeae and Longitarsus jacobaeae have been used in an attempt to control Senecio jacobaea due to its potential to poison livestock and cause economic loss to agriculture. This systematic review uses explicit methodology to capture and evaluate primary evidence for the effectiveness of natural enemies as control agents of S. jacobaea. OBJECTIVE To assess the effectiveness of T. jacobaeae (cinnabar moth); L. jacobaeae (ragwort flea-beetle); or a combination of both for the control of S. jacobaea (common ragwort). SEARCH STRATEGY Electronic databases: ISI Web of Knowledge (WoK) containing ISI Web of Science and ISI Proceedings; Science Direct; JSTOR; Index to Thesis; UMI ProQuest Digital Dissertations; COPAC (incl. British Library); Natural History Museum Library; AGRICOLA and SCIRUS. English Nature (EN); Countryside Council for Wales (CCW) and Scottish Natural Heritage (SNH) publications were all searched online. Other searches: Additional references not captured by the initial searches, were located via the inspection of all reference lists of studies accepted at full text. SELECTION CRITERIA Studies were included if they fulfilled the following selection criteria: Subject: All studies which focused on S. jacobaea (common / tansy ragwort). Intervention: The use of the natural enemy, T. jacobaeae (cinnabar moth); L. jacobaeae (ragwort flea-beetle); or a combination of both to control S. jacobaea. Outcome(s): A measure of the ragwort population densities or a measure of an aspect of the plants characteristics (such as dry weight, capitula per plant or seed viability). Type of study: All primary, quantitative studies and reports with a comparator of an appropriate control were included within formal meta-analysis. In addition time series studies which lacked a comparator were collated and the relative change in the S. jacobaea population was calculated. DATA COLLECTION AND ANALYSIS Both reviewers assessed study inclusion / exclusion, methodological quality & data extraction. Any discrepancies were resolved by discussion. Information on the population focus, methodology, interventions and outcomes were abstracted from the original studies into a specially designed, pre-tested spreadsheet. Data synthesis using

4
standardised mean difference (SMD), random effects model meta-analysis was performed by one reviewer, with the results being discussed by both reviewers. MAIN RESULTS Meta-analysis: Although the overall density of S. jacobaea plants (SMD d+ = -0.27; p = 0.4473 ns (positive sensitivity analysis) and SMD d+ = -0.27; p = 0.995 ns (negative sensitivity analysis)) is not significantly reduced by the T. jacobaeae treatment, certain plant characteristics are significantly reduced therefore affecting the reproductive ability of S. jacobaea plants: capitula per plant (SMD d+ = -8.71; sig. = 0.0076** (positive analysis) and SMD d+ = -7.90; p = 0.0455* (negative analysis)) and seeds per plant (SMD d+ = -693.92; p = 0.0174*). Due to the limited sample sizes for the meta-analyses for L. jacobaeae and the combined T. jacobaeae & L. jacobaeae treatment no robust results could be calculated for their effectiveness in controlling S. jacobaea. Time series: Results from the captured time series datasets show considerable variability in the reduction of the S. jacobaea using T. jacobaeae, with some sites even showing increases in plant densities. Using L. jacobaeae all sites showed a considerable decline (mean = 96.5%; range = 93.1% to 99.9%, n =2) in S. jacobaea densities. The combination treatment using both T. jacobaeae & L. jacobaeae again results in considerable decline (mean = 99.53%; range = 98.46% – 100%, n = 5) of S. jacobaea densities. REVIEWERS’ CONCLUSIONS The best available evidence suggests that T. jacobaeae reduces the reproductive ability of S. jacobaea therefore potentially reducing the further spread of the plant. Although densities of S. jacobaea were reduced, the result was not statistically significantly. From the time series evidence T. jacobaeae showed vast variability for its effectiveness in controlling S. jacobaea densities. There were insufficient datasets available to draw any robust conclusions from the meta-analyses for both L. jacobaeae and the combination of both natural enemies on S. jacobaea. The additional evidence provided by the time series shows that: L. jacobaeae caused major reductions of S. jacobaea densities and plant characteristics in all datasets. However, it is the use of the combination treatment; of both T. jacobaeae & L. jacobaeae that shows the greatest potential for the effective control of S. jacobaea densities. The inclusion of time series datasets, without a comparator, within this systematic review allows for further tentative conclusions to be drawn for all three treatments. These results should be treated with caution due to uncertainty of confounding effects and the reduced methodological quality used to obtain the original datasets. Further randomised control trials (RCTs) with multiple replicates and at least a two year time period are required to investigate the effectiveness of all three treatments on S. jacobaea densities and plant characteristics.

5
CONTENT PAGE 1. BACKGROUND 6 2. OBJECTIVES 7 3. METHODS 7
3.1. Search Strategy for Identification of Studies 7 3.2. Criteria for Inclusion of Studies within Systematic Review 8
3.2.1. Types of Study 9 3.2.2. Population Focus 9 3.2.3. Interventions of Interest 10 3.2.4. Desired Outcome Measures 10
3.3. Study Quality Assessment 10 3.4. Data Extraction 12 3.5. Data Checking 12 3.6. Data Synthesis 12
4. RESULTS 13
4.1. Results of Search 13 4.2. Results of the Study Methodological Quality 14
5. OUTCOME OF THE REVEIW 16
5.1. The Effectiveness of Tyria jacobaeae 16 5.2. The Effectiveness of Longitarsus jacobaeae 16 5.3. The effectiveness of combining T. jacobaeae & L. jacobaeae 16 5.4. Time series datasets 16
6. DISCUSSION 20 7. REVIEWERS’ CONCLUSIONS 21
7.1. Implications for Conservation 21 7.2. Implications for Research 21
8. SOURCES OF SUPPORT 22 9. ACKNOWLEDGEMENTS 22 10. REFERENCES 22
10.1. References to Studies Included in this Systematic Review 22 10.2. References to Studies Excluded from this Systematic Review 23 10.3. Additional References 23
Appendix 1 24 Appendix 2 26

6
Effectiveness of the control of ragwort (Senecio) species: Can biological control by the use of natural enemies effectively control Senecio jacobaea (common ragwort).
1. BACKGROUND Biological control is the purposeful introduction of natural enemies (biocontrol agents) by land managers and scientists as a means to weaken and suppress weed and pest species. Natural enemies are used to decrease an invasive plants' competitive advantage over native species and to weaken the invading population by increasing leaf mortality; decreasing plant size; reducing flower and seed production; and/or limiting population expansion (Cameron, 1935). The use of natural enemies to control S. jacobaea was first undertaken in the early 1930s by the introduction of Tyria jacobaeae (cinnabar moth, also previously named Callimorpha jacobaeae L.) into Australia. Since then the addition of other natural enemies, such as the widely used Longitarsus jacobaeae (ragwort flea-beetle); the rarely used Cochylis atricapitana (crown boring moth) and Botanophila seneciella (ragwort seed fly) have been employed in an attempt to control the spread of S. jacobaea.
The first instar larva (caterpillar) of T. jacobaeae is yellow with a black head. Later, they become more brightly coloured with black and yellow bands. They feed initially on the leaves, but as the foodplant matures, they move onto the flowers. They however, rarely attack the rosettes of mature plants unless all the flowering plants have been consumed. Numerous studies give detailed description of the life cycle of T. jacobaeae (e.g. Cameron, 1935) and the seeking of a biotype that can be acclimatised to the region where control is desired (Schmidl, 1972).
The adults of L. jacobaeae feed on the rosettes and the leaves, causing a holed “shot-gun” appearance, while the larvae eat the roots. There have been two different biotypes described which have been introduced to different regions (Frick, 1971, Frick and Johnson 1973). Apart from the separate use of these two natural enemies, they have been used as a combined treatment (e.g. Hawkes & Johnson, 1976) in an attempt to control S. jacobaea from both ends of the plant (above and below ground). S. jacobaea is a problem in many countries around the world. Biological control has been undertaken to various degrees of success in Australia, New Zealand, Canada, U.S.A. and Europe (James et al., 1992, Schmidl, 1972). However, the Australian dairy industry estimated that this species still causes $2,428,211/year (£1,011,595/year) in lost milk production and $434,327/year (£180,941/year) in lost beef production. Based on these figures alone, the annual cost of S. jacobaea to Australia would be in excess of $4.0 million (>£1.6 million).

7
2. OBJECTIVES
To evaluate the effectiveness of natural enemies used for the control of common ragwort (S. jacobaea), by the use of datasets concerning measures of population density or plant characteristics following biological control experiments. To explore, when possible, the following reasons for heterogeneity within the datasets: 1. the number of natural enemies; 2. the length of follow-up period; 3. the soil type; 4. altitude of sites; 5. weather / climate of the sites and 6. age of plants.
3. METHODS
3.1. Search Strategy for Identification of Studies The following electronic databases were searched for the identification of a ragwort library of all possible relevant studies for this systematic review. All dates listed below show the years covered by that particular database.
1. ISI Web of Knowledge (WoK) using CrossSearch Form involving the searching of the following products:
ISI Web of Science (1981 to present). ISI Proceedings (1990 to present).
2. Science Direct – Agricultural and Biological Sciences (1823 to present). 3. JSTOR. 4. Index to Theses (1970 to 2003). 5. UMI ProQuest Digital Dissertations (1950s to 2003). 6. COPAC – database of the 24 main British and Irish university libraries and
the British Library and National Library of Scotland. 7. UK Natural History Museum Library (1980 to present + 80% prior). 8. AGRICOLA – two databases for the National Agricultural Library of
America: Online Public Access Catalogue (books). Journal Article Citation Index (journals).
9. SCIRUS – Scientific Search Engine. 10. Wildlink – English Nature's Library Catalogue (only available on-site).
The following search terms were used on all the above electronic databases to identify the initial library of all possibly relevant studies. This created an initial general ragwort control library of studies, from which filtering for particular control methods could take place (section 3.2)
1. Ragwort AND Control 2. Senecio AND Control 3. Pulling AND (Ragwort OR Senecio) 4. Herbicide AND (Ragwort OR Senecio) 5. Spraying AND (Ragwort OR Senecio) 6. Wiping AND (Ragwort OR Senecio) 7. “Spot Treatment” AND (Ragwort OR Senecio)

8
8. Cutting AND (Ragwort OR Senecio) 9. Mechanical AND (Ragwort OR Senecio) 10. Biological AND Control AND (Ragwort OR Senecio) 11. Cinnabar AND Moth 12. Tyria AND jacobaeae 13. Ragwort AND “flea beetle” 14. Longitarsus AND jacobaeae
Searches on www.alltheweb.com were constructed using the search terms below. In all cases only the website that was captured by the alltheweb search was assessed, in the order that they appeared from each search, no links were followed from identified sites. The first 50 websites were assessed for their relevance.
1. Ragwort + control 2. Ragwort + control + results 3. Senecio + control 4. Senecio + control + results
All of the electronic and web searches were initially completed in May 2004 with additional web searches being undertaken in August 2004 & January 2005. Relevant organisations such as English Nature, Scottish Natural Heritage, Countryside Council for Wales, The National Trust, UK Wildlife Trusts & Agricultural Libraries were contacted and their website publication lists searched for pertinent grey literature or unpublished data. Attempts were made to contact first authors of included studies, if any queries about the clarification of the reported results, missing data values or further explanation of their findings were required. 3.2. Criteria for Inclusion of Studies within Systematic Review As briefly mentioned above, the initial library of studies was developed as a general library enabling further filtering for applicability to a particular review. This was generated from the 14 search terms across the 10 electronic databases (with the removal of all duplications) and the web based searches. See figure one, for the number of studies at each step of the assessment for inclusion relevance. From the general library an initial inclusion criterion for title and abstract assessment was developed. All studies to be included within the systematic review were required to be focused, or partially focused, on any ragwort species and also to contain any intervention which was undertaken to control/reduce the amount of ragwort present on the site/area. All studies which fulfilled this first assessment at title and abstract or those that lacked sufficient detail to make an assessment were placed in a second library for further assessment at full text. All reference lists of the remaining studies were checked to identify any additional studies missed in the initial search. These were also added to the second library to give the grand total of studies to be viewed at full text.
9
Full text assessment of these remaining studies was undertaken with the added inclusion criteria that all studies had to contain either: a study comparator (i.e. a treatment plot and a control plot), compare two or more sites (treatment site and control site) or have a measurement of the plants density / characteristics over a time period without a comparator (these are referred to from here as “time series”). A random subset of 20 studies at full text inclusion was independently assessed by a second reviewer. Cohen’s Kappa analysis was performed to test the level of agreement and repeatability between reviewers. In this case the level of agreement was good, with K = 0.87. Any disagreements for a studies inclusion / exclusion were resolved through discussion. After full text assessment the final library of accepted studies were split in relation to the relevant management intervention used to control ragwort species. For inclusion within this systematic review on the effectiveness of natural enemies the following final inclusion criteria had to be fulfilled. 3.2.1. Types of Study To be eligible for inclusion within meta-analysis, studies had to contain a comparator, of a treatment/control plot. This criterion therefore allows for the inclusion of randomised control trials (RCTs), control trials (CTs) and site comparisons studies (SCSs). These were collated for each natural enemy and combination prior to the data analysis. Time series data could not be included within the meta-analysis, due to the lack of a comparator component within the experimental design which is required when calculating each study’s individual point estimate and the overall effect size for the intervention in question. All time series studies that have been identified by the search strategy are however presented in tables, so that the data are available for interested parties and for subsequent analysis. Studies were not rejected due to country of origin or language of publication. All foreign language papers were translated prior to final full text assessment. 3.2.2. Population Focus All studies which focused on common / tansy ragwort or S. jacobaea were considered for inclusion within the systematic review. 3.2.3. Interventions of Interest Studies which focused on the biological control of S. jacobaea using the following natural enemies:
1. Cinnabar Moth larvae (Tyria jacobaeae). 2. Ragwort Flea Beetle larvae & adult (Longitarsus jacobaeae). 3. A combination of the both the above.

10
Studies which focused on the plant-insect population dynamics / interaction were rejected as the main concern of these studies is not normally the eradication / control of S. jacobaea. 3.2.4. Desired Outcome Measures The outcomes of interest for this review were:
i. Measures of the ragwort population densities. ii. Measures of the plant characteristics (e.g. dry weight or seed viability).
Due to the biennial nature of ragwort, it would be ideal for the outcome measures (follow-up period) to cover at least two seasons after the intervention. However, it is anticipated that there would be substantial variation in the length of follow-up, therefore all studies which conformed to the above criteria were accepted and an assessment of the follow-up periods for all datasets would be used as one of the measures to test for heterogeneity within analyses. 3.3. Study Quality Assessment The quality of each of the accepted papers was assessed in accordance with the study quality assessment instrument (Appendix 1) by one reviewer. The quality assessment involved looking at each individual study design; baseline comparators; intra-treatment variation; measurement of co-/intervention and outcome measures. The details of the study quality assessments were recorded for each study on their individual study characteristic table (see Appendix 2).

11
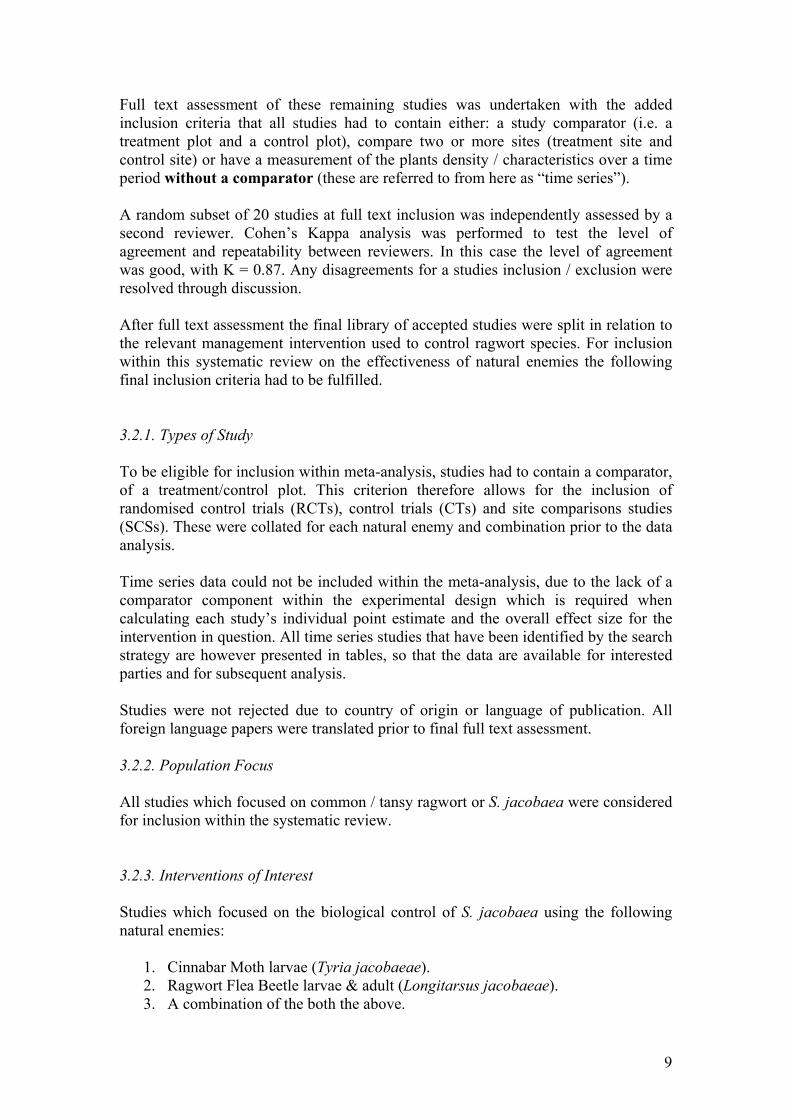
Figure 1: A diagrammatic representation of the study selection phase for inclusion of evidence within
the systematic process. The number of studies at each stage is represented by N.
No. of hits identified by database & internet searches using key words N = 3413
No. of articles identified for assessment at title & abstract level N = 1712
Removal of all duplicates N = 1701
First Filter Stage No. irrelevant to the review N = 1531
Total articles identified by first filter to view at full text level N = 181
Articles identified by reviewing reference lists of those being viewed at full text N = 53
Total articles to assess at the full text level N = 234
Total articles identified for inclusion in ragwort systematic review N = 66
Second Filter Stage No. irrelevant to the review N = 168
Number of articles unable to locate out of the 234 N = 27
Intervention Grouping No. irrelevant to specific review N = 50
Number of articles relevant for biological control of ragwort systematic review N = 16

12
3.4. Data Extraction Information on the population focus; methodology; interventions; and outcomes were abstracted from all the original studies viewed at full text assessment onto a specially designed spreadsheet. Studies which fulfilled all inclusion criteria had the following additional data and methodological characteristics extracted onto the spreadsheet, to allow investigation of instances of heterogeneity within meta-analyses: Title, year of publication, site location, habitat, experimental area, species of ragwort, age of the plants, soil type, natural enemies used, month application, year of application, number applied, altitude of site, notable previous interventions undertaken, methods of application, time of follow-up, additional applications, other site activities during experiment, number of replicates, method of recording (use of scales, health scores etc.), outcome measure with related standard deviation values (e.g. % data, ragwort plants m2, ragwort plants per plot etc.) and adverse effects. In all cases the mean, number of replicates and the standard deviation measures were required from both the treatment and control to allow meta-analyses to be performed on the datasets. The data that were extracted from the original studies and used within the meta-analyses are presented within the study characteristic tables (Appendix 2). All data were derived from the field/plot level avoiding pseudo-replication. 3.5. Data Checking Attempts were made to contact first authors of included studies for missing data and standard deviation measures and / or if there were any errors and inconsistencies in the data. 3.6. Data Synthesis The spreadsheets of extracted data were grouped by natural enemy and used with the StatsDirect™ programme for data synthesis. All outcomes were in the form of continuous data, which were pooled across trials using Standardised Mean Difference (SMD) meta-analysis and the random effects model (Sutton et al. 2000). Sensitivity analyses were performed on the data to determine the effect of the inclusion of non-independent datasets. These are defined as those studies which in their experimental design compared a number of different treatments plots against only one control plot. For non-independent data, effect sizes were generated for all data and combined in meta-analyses of most positive and negative independent effect sizes (sensitivity analyses) to assess the impact of the intervention.
13
4. RESULTS
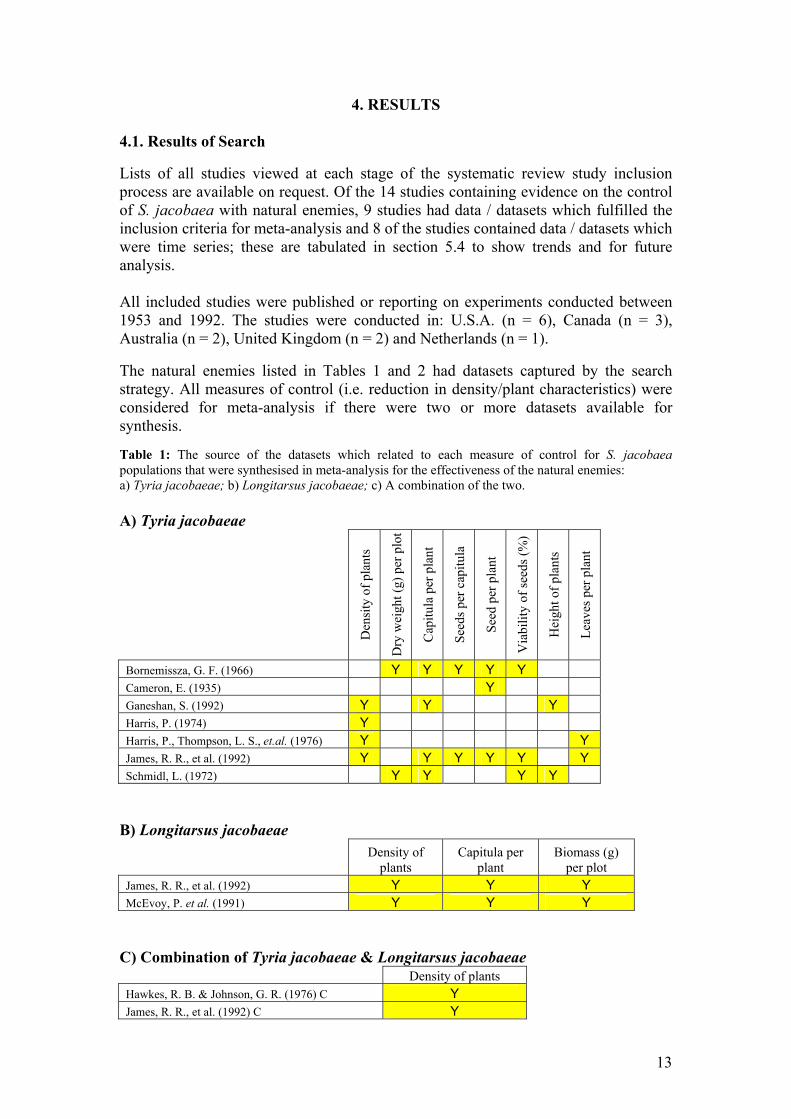
4.1. Results of Search Lists of all studies viewed at each stage of the systematic review study inclusion process are available on request. Of the 14 studies containing evidence on the control of S. jacobaea with natural enemies, 9 studies had data / datasets which fulfilled the inclusion criteria for meta-analysis and 8 of the studies contained data / datasets which were time series; these are tabulated in section 5.4 to show trends and for future analysis. All included studies were published or reporting on experiments conducted between 1953 and 1992. The studies were conducted in: U.S.A. (n = 6), Canada (n = 3), Australia (n = 2), United Kingdom (n = 2) and Netherlands (n = 1). The natural enemies listed in Tables 1 and 2 had datasets captured by the search strategy. All measures of control (i.e. reduction in density/plant characteristics) were considered for meta-analysis if there were two or more datasets available for synthesis. Table 1: The source of the datasets which related to each measure of control for S. jacobaea populations that were synthesised in meta-analysis for the effectiveness of the natural enemies: a) Tyria jacobaeae; b) Longitarsus jacobaeae; c) A combination of the two. A) Tyria jacobaeae
Den
sity
of p
lant
s
Dry
wei
ght (
g) p
er p
lot
Cap
itula
per
pla
nt
Seed
s per
cap
itula
Seed
per
pla
nt
Via
bilit
y of
seed
s (%
)
Hei
ght o
f pla
nts
Leav
es p
er p
lant
Bornemissza, G. F. (1966) Y Y Y Y Y Cameron, E. (1935) Y Ganeshan, S. (1992) Y Y Y Harris, P. (1974) Y Harris, P., Thompson, L. S., et.al. (1976) Y Y James, R. R., et al. (1992) Y Y Y Y Y Y Schmidl, L. (1972) Y Y Y Y
B) Longitarsus jacobaeae
Density of
plants Capitula per
plant Biomass (g)
per plot James, R. R., et al. (1992) Y Y Y McEvoy, P. et al. (1991) Y Y Y
C) Combination of Tyria jacobaeae & Longitarsus jacobaeae Density of plants Hawkes, R. B. & Johnson, G. R. (1976) C Y James, R. R., et al. (1992) C Y

14
Table 2: The number of datasets (grouped by outcome measure and natural enemy), available for inclusion within meta-analysis. First number = only independent datasets; Number in brackets = all datasets (independent & non-independent data).
Tyria jacobaeae
Longitarsus jacobaeae
Combination
Density of plants 5(10) 2 3 Dry weight (g) per plot
2(3) - -
Capitula per plant 5(8) 2 - Seed per capitula 2 - -
Seed per plant 4 - - Viability of seeds
(%) 3 - -
Height of plants 3(5) - - Leaves per plant 2(5) - -
Biomass (g) per plot
- 2 -
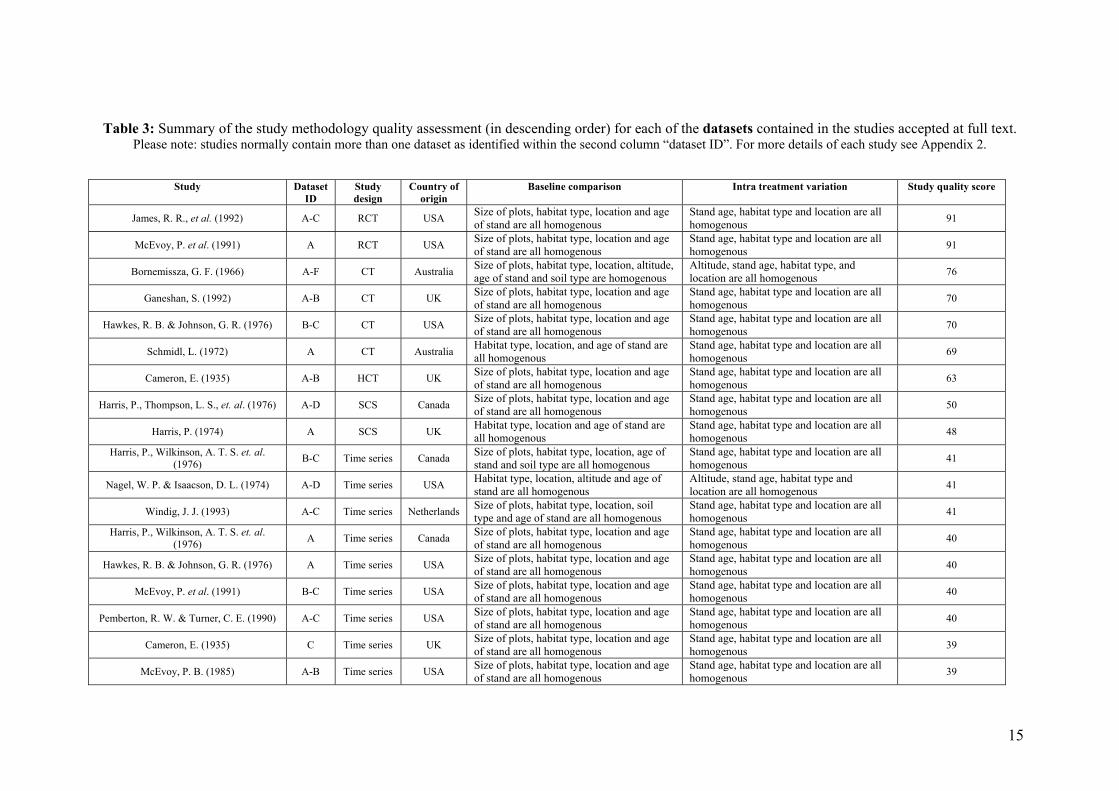
4.2. Results of the Studies Methodological Quality Assessment Low scores were assigned to the following datasets: Cameron, E. (1935) dataset C; Harris, P., Thompson, L. S., et al. (1976); Hawkes, R. B. & Johnson, G. R. (1976); McEvoy, P. B. (1985); McEvoy, P. et al. (1991) datasets B & C; Nagel, W. P. & Isaacson, D. L. (1974); Pemberton, R. W. & Turner, C. E. (1990) and Windig, J. J. (1993) as they were all time series, lacking comparator, information about methodology and experimental area. The highest scores were assigned to: James, R. R., et al. (1992) and McEvoy, P. et al. (1991) dataset A, as they were both randomised controlled trials with potential reasons for heterogeneity clearly stated. A summary of the study quality assessment is presented overleaf (Table 3) for more details see the individual study characteristic tables (Appendix 2).
15
Table 3: Summary of the study methodology quality assessment (in descending order) for each of the datasets contained in the studies accepted at full text. Please note: studies normally contain more than one dataset as identified within the second column “dataset ID”. For more details of each study see Appendix 2.
Study Dataset
ID Study design
Country of origin
Baseline comparison Intra treatment variation Study quality score
James, R. R., et al. (1992) A-C RCT USA Size of plots, habitat type, location and age of stand are all homogenous
Stand age, habitat type and location are all homogenous 91
McEvoy, P. et al. (1991) A RCT USA Size of plots, habitat type, location and age of stand are all homogenous
Stand age, habitat type and location are all homogenous 91
Bornemissza, G. F. (1966) A-F CT Australia Size of plots, habitat type, location, altitude, age of stand and soil type are homogenous
Altitude, stand age, habitat type, and location are all homogenous 76
Ganeshan, S. (1992) A-B CT UK Size of plots, habitat type, location and age of stand are all homogenous
Stand age, habitat type and location are all homogenous 70
Hawkes, R. B. & Johnson, G. R. (1976) B-C CT USA Size of plots, habitat type, location and age of stand are all homogenous
Stand age, habitat type and location are all homogenous 70
Schmidl, L. (1972) A CT Australia Habitat type, location, and age of stand are all homogenous
Stand age, habitat type and location are all homogenous 69
Cameron, E. (1935) A-B HCT UK Size of plots, habitat type, location and age of stand are all homogenous
Stand age, habitat type and location are all homogenous 63
Harris, P., Thompson, L. S., et. al. (1976) A-D SCS Canada Size of plots, habitat type, location and age of stand are all homogenous
Stand age, habitat type and location are all homogenous 50
Harris, P. (1974) A SCS UK Habitat type, location and age of stand are all homogenous
Stand age, habitat type and location are all homogenous 48
Harris, P., Wilkinson, A. T. S. et. al. (1976) B-C Time series Canada Size of plots, habitat type, location, age of
stand and soil type are all homogenous Stand age, habitat type and location are all homogenous 41
Nagel, W. P. & Isaacson, D. L. (1974) A-D Time series USA Habitat type, location, altitude and age of stand are all homogenous
Altitude, stand age, habitat type and location are all homogenous 41
Windig, J. J. (1993) A-C Time series Netherlands Size of plots, habitat type, location, soil type and age of stand are all homogenous
Stand age, habitat type and location are all homogenous 41
Harris, P., Wilkinson, A. T. S. et. al. (1976) A Time series Canada Size of plots, habitat type, location and age
of stand are all homogenous Stand age, habitat type and location are all homogenous 40
Hawkes, R. B. & Johnson, G. R. (1976) A Time series USA Size of plots, habitat type, location and age of stand are all homogenous
Stand age, habitat type and location are all homogenous 40
McEvoy, P. et al. (1991) B-C Time series USA Size of plots, habitat type, location and age of stand are all homogenous
Stand age, habitat type and location are all homogenous 40
Pemberton, R. W. & Turner, C. E. (1990) A-C Time series USA Size of plots, habitat type, location and age of stand are all homogenous
Stand age, habitat type and location are all homogenous 40
Cameron, E. (1935) C Time series UK Size of plots, habitat type, location and age of stand are all homogenous
Stand age, habitat type and location are all homogenous 39
McEvoy, P. B. (1985) A-B Time series USA Size of plots, habitat type, location and age of stand are all homogenous
Stand age, habitat type and location are all homogenous 39

16
5. OUTCOME OF THE REVIEW
Studies were sorted according to which natural enemy they studied and the outcome measure used for measuring their effectiveness in controlling S. jacobaea populations. DerSimonian-Laird pooled d+ values give overall pooled effect sizes for each of the meta-analyses (Egger et al, 2003; Sutton et al, 2000). Negative values for the effect sizes indicate a reduction in the parameter of control being measured for the effectiveness of the natural enemy in reducing S. jacobaea. The approximate 95% confidence intervals and DerSimonian-Laird chi squared significance values are also presented for each meta-analysis (Table 4, 5 & 6). When non-independent data is present, sensitivity analyses were performed. This is when the most positive results (those that had the greatest effect from each dataset) or most negative results (those that had the least effect from each dataset) are re-analysed together thus forming independent datasets to derive the overall effect size (Sutton et al, 2000). It was not possible to investigate reasons for heterogeneity within the meta-analyses due to insufficient recording of the control measures and the limited number of datasets. 5.1. The effectiveness of T. jacobaeae Although the overall density of S. jacobaea plants (SMD d+ = -0.27; p = 0.4473 ns (positive sensitivity analysis) and SMD d+ = -0.27; p = 0.995 ns (negative sensitivity analysis)) is not significantly reduced by T. jacobaeae, certain characteristics are significantly reduced therefore affecting the reproductive ability of S. jacobaea (Table 4): capitula per plant (SMD d+ = -8.71; sig. = 0.0076** (positive analysis) and SMD d+ = -7.90; p = 0.0455* (negative analysis)) and seeds per plant (SMD d+ = -693.92; p = 0.0174*). Other plant characteristics of S. jacobaea with significant reductions include: seeds per capitula and dry weight of plants, however sample sizes are very small (n = 2). 5.2. The effectiveness of L. jacobaeae The analyses of the three outcome measures show reductions in all characteristics of S. jacobaea (Table 5). However, due to the limited number of dataset (sample sizes = 2 for all), none proved significant, as the 95% confidence intervals of each outcome measure crossed the zero line (line of no effect): Density of plants (p = 0.3377); capitula per plant (p = 0.1929) and biomass (g) per plant (p = 0.7736). 5.3. The effectiveness of combining T. jacobaeae & L. jacobaeae The analysis of the density of plants showed a very marginal reduction in S. jacobaea, but again proved not significant with the confidence intervals crossing the line of no effect: Density of plants (SMD = -0.086; 95% CI = -1.47 to 1.30; p = 0.9028). However, again sample sizes are very small (n = 2).

17
Table 4: The effectiveness of Tyria jacobaeae on the reduction of S. jacobaea. n = number of datasets; CI = confidence intervals and χ2 sign. = chi-squared significance.
Control Measure
Result Independent Positive Sensitivity Analysis
Negative Sensitivity Analysis
Density of plants
Not significant,
robust sample size
n Effect Size
95% CI χ2 sign.
5 -0.27 -0.97 to 0.43 0.4473 (ns)
5 0.002 -0.70 to 0.71 0.995 (ns)
Capitula per plant
Significant, robust
sample size
n Effect Size
95% CI χ2 sign.
5 -8.71 -15.10 to -2.31 0.0076**
5 -7.90 -15.65 to -0.16 0.0455*
Seeds per plant
Significant, robust
sample size
n Effect Size
95% CI χ2 sign.
4 -693.92 -1265.75 to -122.09 0.0174*
Not required Not required
Viability (%)
of seeds
Very significant, robust but
small sample size
n Effect Size
95% CI χ2 sign.
3 -0.74 -1.11 to -0.36 < 0.0001***
Not required Not required
Seeds per capitula
Very significant, robust but very small sample size
n Effect Size
95% CI χ2 sign.
2 -1.25 -1.53 to -0.97 < 0.0001***
Not required Not required
Dry weight (g) per plant
Significant, robust but very small sample size
n Effect Size
95% CI χ2 sign.
2 -0.67 -1.16 to -0.19 0.0061**
2 -0.69 -1.04 to -0.34 < 0.0001***
Height of plants
Not significant, robust but
small sample size
n Effect Size
95% CI χ2 sign.
3 -0.008 -0.89 to 0.87 0.9862 (ns)
3 0.19 -0.69 to 1.07 0.6713 (ns)
Leaves per plant
Not significant, robust but very small sample size
n Effect Size
95% CI χ2 sign.
2 -0.09 -1.22 to 1.05 0.8814 (ns)
2 -0.06 -1.20 to 1.07 0.9108 (ns)
Table 5: The effectiveness of Longitarsus jacobaeae on the reduction of S. jacobaea. n = number of datasets; CI = confidence intervals and χ2 sign. = chi-squared significance.
Control Measure
Result Independent/ Non-Independent
Positive Sensitivity Analysis
Negative Sensitivity Analysis
Density of plants
Not significant, robust but
small sample size
n Effect Size
95% CI χ2 sign.
2 -45.67 -139.03 to 47.69 0.3377 (ns)
Not required Not required
Capitula per plant
Not significant, robust but
small sample size
n Effect Size
95% CI χ2 sign.
2 -31.51 -78.95 to 15.92 0.1929 (ns)
Not required Not required
Biomass (g) per plant
Not significant, robust but
small sample size
n Effect Size
95% CI χ2 sign.
2 -1.69 -13.20 to 9.82 0.7736 (ns)
Not required Not required

18
Table 6: The effectiveness of combining Tyria jacobaeae & Longitarsus jacobaeae. n = number of datasets; CI = confidence intervals and χ2 sign. = chi-squared significance.
Control Measure
Result Independent/ Non-Independent
Positive Sensitivity Analysis
Negative Sensitivity Analysis
Density of plants
Not significant, robust but
small sample size
n Effect Size
95% CI χ2 sign.
2 -0.086 -1.47 to 1.30 0.9028 (ns)
Not required Not required
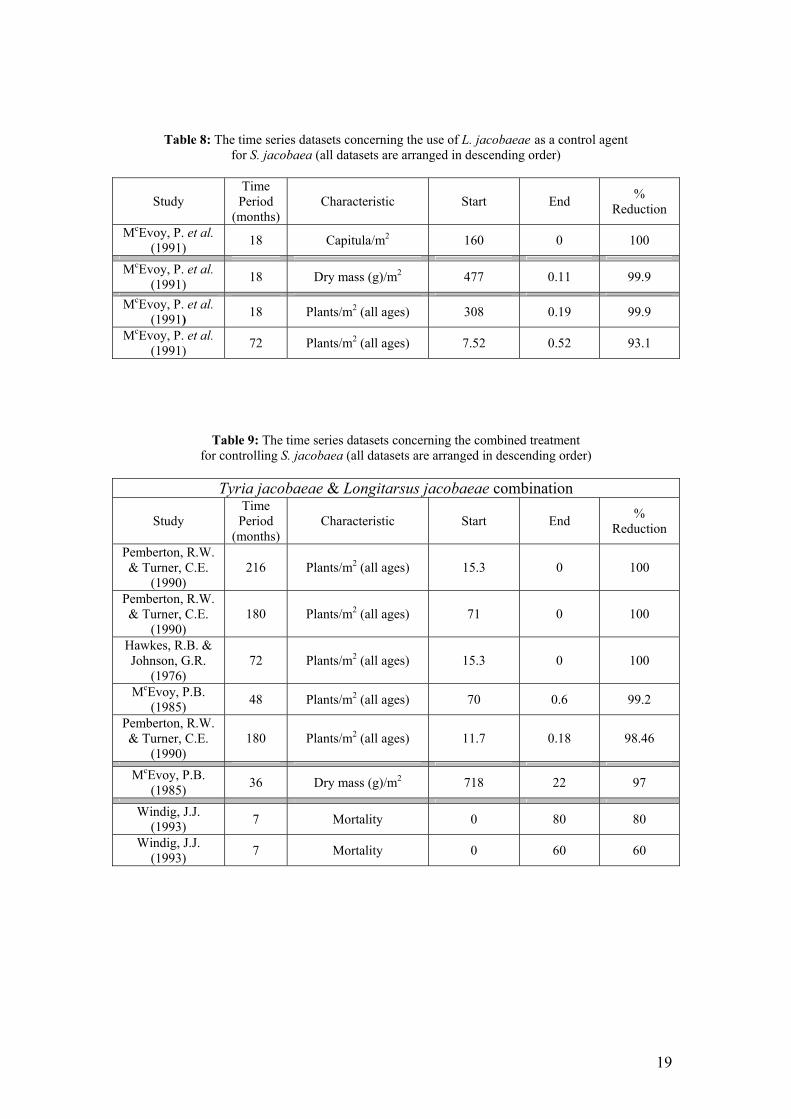
5.4. Time series data Time Series experiments that studied the control of S. jacobaea could not be included within a formal meta-analysis due to the lack of comparator. These datasets are instead presented for each of the natural enemies below in tables 7, 8 and 9, with the addition of the overall reduction of S. jacobaea characteristic being calculated for each study.
Table 7: The time series datasets concerning the use of T. jacobaeae as a control agent for S. jacobaea (ordered in descending percentage reduction).
Study Time Period (months) Characteristic Start End % Reduction
Harris, P., Wilkinson, A.T.S. et al. (1976) 36 Stem/m2
(all ages) 0.46 0 100
Cameron, E. (1935) 12 Mature Plants/m2 26.9 0.0002 99.99 Cameron, E. (1935) 12 Young Plants/m2 31.5 0.00004 99.99
Harris, P., Wilkinson, A.T.S. et al. (1976) 60 Stem/m2
(all ages) 2.5 0.008 99.68
Nagel, W.P. & Isaacson D.L. (1974) 48 Mature Plants/m2 3.1 0.4 87.10 Harris, P., Wilkinson, A.T.S. et al.
(1976) 48 Rosettes/m2
(all ages) 10 4.2 58
Nagel, W.P. & Isaacson D.L. (1974) 48 Mature Plants/m2 0.8 0.4 50.00
Nagel, W.P. & Isaacson D.L. (1974) 48 Young Plants/m2 19.4 11.2 42.27
Nagel, W.P. & Isaacson D.L. (1974) 48 Mature Plants/m2 4.4 2.8 36.36
Nagel, W.P. & Isaacson D.L. (1974) 48 Mature Plants/m2 1.8 1.2 33.33 Harris, P., Wilkinson, A.T.S. et al.
(1976) 96 Stem/m2
(all ages) 2.7 2 25.92
Nagel, W.P. & Isaacson D.L. (1974) 48 Young Plants/m2 16.7 13.2 20.96
Nagel, W.P. & Isaacson D.L. (1974) 48 Young Plants/m2 11.7 9.4 17.09
Nagel, W.P. & Isaacson D.L. (1974) 48 Young Plants/m2 6.1 5.3 13.11 Harris, P., Wilkinson, A.T.S. et al.
(1976) 36 Rosettes/m2
(all ages) 0.03 0.43 increase
Pemberton, R.W. & Turner, C. E. (1990) 72 Plants/m2
(all ages) 53.3 71.1 increase
19
Table 8: The time series datasets concerning the use of L. jacobaeae as a control agent for S. jacobaea (all datasets are arranged in descending order)
Study Time
Period (months)
Characteristic Start End % Reduction
McEvoy, P. et al. (1991) 18 Capitula/m2 160 0 100
McEvoy, P. et al. (1991) 18 Dry mass (g)/m2 477 0.11 99.9
McEvoy, P. et al. (1991) 18 Plants/m2 (all ages) 308 0.19 99.9
McEvoy, P. et al. (1991) 72 Plants/m2 (all ages) 7.52 0.52 93.1
Table 9: The time series datasets concerning the combined treatment for controlling S. jacobaea (all datasets are arranged in descending order)
Tyria jacobaeae & Longitarsus jacobaeae combination
Study Time
Period (months)
Characteristic Start End % Reduction
Pemberton, R.W. & Turner, C.E.
(1990) 216 Plants/m2 (all ages) 15.3 0 100
Pemberton, R.W. & Turner, C.E.
(1990) 180 Plants/m2 (all ages) 71 0 100
Hawkes, R.B. & Johnson, G.R.
(1976) 72 Plants/m2 (all ages) 15.3 0 100
McEvoy, P.B. (1985) 48 Plants/m2 (all ages) 70 0.6 99.2
Pemberton, R.W. & Turner, C.E.
(1990) 180 Plants/m2 (all ages) 11.7 0.18 98.46
McEvoy, P.B. (1985) 36 Dry mass (g)/m2 718 22 97
Windig, J.J. (1993) 7 Mortality 0 80 80
Windig, J.J. (1993) 7 Mortality 0 60 60

20
6. DISCUSSION The purpose of this review was to determine the effectiveness of natural enemies at controlling S. jacobaea populations. Using global studies, SMD meta-analyses (Table 4) demonstrates that T. jacobaeae significantly reduced certain reproductive characteristics (capitula per plant; seeds per plant / per plot and the viability of seeds) of the S. jacobaea plants. The reduction of these characteristics is important in terms of plant resource allocation theory. The results show that S. jacobaea plants, in response to herbivory, are possibly allocating more resources to increasing their own survival through their vegetative form (height and rosette size) at the expense of future generations due to their reduced reproductive ability (capitula per plant; seeds per plant / per plot and the viability of seeds). In addition plant resources will also be allocated to the production of pyrrolizidine alkaloids (Pa's) to increase their toxicity and unattractiveness to certain herbivore species attack, (Vrieling & van Wijk, 1994). There were only 2 datasets for both the L. jacobaeae and the T. jacobaeae & L. jacobaeae combination meta-analyses (Tables 5 & 6). This small sample size increases the risks of generating Type I errors. It is crucial that further high quality primary research is undertaken to allow the effectiveness of these natural enemies to be accurately investigated. Significantly, the possible reasons for heterogeneity could not be investigated due the small sample sizes within the meta-analyses and, maybe more crucially, the lack of experimental details and site characteristics recorded within the original reports and studies. Future experiments could include the reporting of factors, such as: the soil type / fertility level, which is considered to possibly affect the impact of root feeding insect herbivores such as L. jacobaeae (Muller-Scharer, 1991; Steinger & Muller-Scharer 1992). This will allow specific conclusions relating to each factor to be drawn and allow detailed guidance on the effectiveness of each natural enemy under specific site conditions to be available to the practitioner. The inclusion of time series datasets allows for additional conclusions to be drawn and will assist in the choice of natural enemy in the current absence of higher quality evidence. However, caution is required when using time series as the lower methodological quality allows for confounding factors to creep into the datasets. There was extreme variability for the effectiveness of T. jacobaeae (Table 7), with some of the experiments resulting in eradication (no plants left) while others showed an increase in overall S. jacobaea densities. Time series datasets for L. jacobaeae (Table 8) showed major reductions of S. jacobaea densities. However, it was the combination of T. jacobaeae & L. jacobaeae (Table 9) which showed most consistency in reduction of S. jacobaea densities. The length of follow-up monitoring periods in the included experiments is of concern, with few of those included in the meta-analyses running longer than 12 months. As S. jacobaea conforms normally to a biennial nature there might be an initial reduction in the plants densities / characteristic however over a longer follow-up period regeneration of the plant might occur. In future, control projects / experiments should be designed to cover at least a two year time period (hopefully longer).

21
There are two factors which are crucial in the use of natural enemies in controlling plant populations, especially when using introduced insects. Firstly, the natural enemies have to be able to survive in the environment to which they are introduced. Schmidl (1972) describes experiments on T. jacobaeae and its’ acclimatisation to new environments. Secondly, the use of natural enemies is unlikely to be successful in countries where there is also a pool of their parasites and predators (e.g. United Kingdom). For a detailed description of the parasites and predators of T. jacobaeae see Cameron (1935).
7. REVIEWERS’ CONCLUSIONS
7.1. Implications for Conservation/Land Management The best available evidence suggests that T. jacobaeae reduces the reproductive ability of S. jacobaea therefore potentially reducing the further spread of the plant. The meta-analysis of T. jacobaeae on the densities of S. jacobaea showed that the results were not significantly reduced. In addition time series evidence showed vast variability for T. jacobaeae effectiveness in controlling S. jacobaea densities, with some sites showing total eradication while others had increases. There were insufficient datasets available to draw any robust conclusions from the meta-analyses for both L. jacobaeae and the combination of both natural enemies on S. jacobaea. The additional evidence provided by the time series shows that: L. jacobaeae caused major reductions of S. jacobaea densities and plant characteristics in all datasets. However, it is the use of the combination treatment; of both T. jacobaeae & L. jacobaeae that shows the greatest potential for the effective control of S. jacobaea densities. The inclusion of time series datasets (those without a comparator), within this systematic review allows for further conclusions to be drawn for all three treatments and will assist the conservation practitioner / policy officer in the choice of which natural enemy to use, until sufficient high quality evidence is available. Caution should be given to these results due to uncertainty of confounding effects and the reduced methodological quality used to obtain the original datasets. 7.2. Implications for Research Further randomised control trials (RCTs) with multiple replicates and at least two year time periods are required to investigate the effectiveness of all three treatments on S. jacobaea densities and plant characteristics. If large sample size and various treatment concentrations (varying the number of natural enemies) are tested, external validity (the generalisations that can be drawn from the observed effects to other populations, settings, or conditions) may be high. Future trials need vast improvement in the level of details reported on the experimental methodology & results (especially including: number of replicates and the inclusion of a standard deviation measure), along with the site characteristics so that reasons for heterogeneity can be investigated.

22
8. SOURCES OF SUPPORT NERC and English Nature grants.
9. ACKNOWLEDGEMENTS
The reviewers would like to thank CEBC team members for their support. Kevin Charman & John Bacon from English Nature and Matthew Oates from The National Trust, for all their support and provision of additional information. We would also like to thank all the practitioners and policy makers who responded to our enquires.
10. REFERENCES
10.1. References to Studies Included in this Systematic Review Bornemissza, G.F. (1966) An attempt to control ragwort in Australia with the cinnabar moth (Callimorpha jacobaeae)(Arctiidae:Lepidoptera). Australian Journal of Zoology, 14, 201-243. Cameron, E. (1935) A Study of the Natural Control of Ragwort (Senecio Jacobaea L.). The Journal of Ecology, 23, 265-322. Ganeshan, S. (1992) Direct effect and indirect interactions between flea beetles and cinnabar moths on the ragwort. (M.Sc and D.I.C.), Imperial College, London, U.K. Harris, P. (1974) The impact of the cinnabar moth on ragwort in east and west Canada and its implication for biological control. Commonw Inst Biol Control, 8, 119-123. Harris, P., Thompson, L.S., Wilkinson, A.T.S., & Neary, M.E. (1976) Reproductive biology of tansy ragwort, climate and biological control by the cinnabar moth in Canada. In IV International symposium on biological control of weeds, pp. 163-173, Gainesville, Florida, USA. Harris, P., Wilkinson, A.T.S., Thompson, L.S., & Neary, M.E. (1976) Interaction between the cinnabar moth, Tyria jacobaeae and ragwort, Senecio jacobaea in Canada. In IV International symposium on biological control of weeds, pp. 174-180, Gainesville, Florida, USA. Hawkes, R.B. & Johnson, G.R. (1976) Longitarsus jacobaeae Aids Moth in the Biological Control of Tansy Ragwort. In Proceedings of the 4th International Symposium on Biological Control of Weeds, pp. 193-196. James, R.R., McEvoy, P.B., & Cox, C.S. (1992) Combining the Cinnabar Moth (Tyria-Jacobaeae) and the Ragwort Flea Beetle (Longitarsus-Jacobaeae) for Control of Ragwort (Senecio-Jacobaea) - an Experimental-Analysis. Journal of Applied Ecology, 29, 589-596. McEvoy, P.B. (1985) Depression in ragwort (Senecio jacobaea) abundance following introduction of Tyria jacobaea and Longitarsus jacobaeae on the central coast of Oregon. Proceedings of the VI International Symposium on Biological Control of Weeds / edited by Ernest S. Delfosse. Ottawa : Agriculture Canada, 57-64. McEvoy, P., Cox, C., & Coombs, E. (1991) Successful Biological Control of Ragwort, Senecio Jacobaea, by Introduced Insects in Oregon. Ecological Applications, 1, 430-442. Nagel, W.P. & Isaacson, D.L. (1974) Tyria jacobaea and tansy ragwort in western Oregon. Journal of economic entomology, 67, 494-496. Pemberton, R.W. & Turner, C.E. (1990) Biological-Control of Senecio-Jacobaea in Northern California, an Enduring Success. Entomophaga, 35, 71-77. Schmidl, L. (1972) Studies on the control of ragwort, Senecio jacobaea L., with the cinnabar moth, Callimorpha jacobaeae (L.) (Arctiidae: Lepidoptera), in Victoria. Weed research, 12, 46-57.

23
Windig, J.J. (1993) Intensity of Longitarsus-Jacobaeae Herbivory and Mortality of Senecio-Jacobaea. Journal of Applied Ecology, 30, 179-186. 10.2. References to Studies Excluded from this Systematic Review All references viewed at both the title and abstract or at the full text filtering stages are available on request as either an Endnote Library or Excel file. 10.3. Additional References Eggar, M., Smith, G.D., & Altman, D.G., eds. (2003) Systematic Reviews in Health Care: Meta-analysis in context, 2nd edn. BMJ Publishing Group, London. Frick, K.E. (1971) Longitarsus jacobaeae, a flea beetle for the biological control of tansy ragwort II. Ann. Entomol. Soc., 64, 834. Frick, K.E. & Johnson, G.R. (1973) Longitarsus jacobaeae, a flea beetle for the biological control of tansy ragwort 4: Life history and adult aestivation of an Italian biotype. Ann. Entomol. Soc., 66, 358-367. Muller-Scharer, H. (1991) The impact of root herbivory as a function of plant density and competition: survival, growth and fecundity of Centaurea maculosa in field plots. Journal of Applied Ecology, 28, 759-776 Steinger, T. & Muller-Scharer, H. (1992) Physiological and growth responses of Centaurea maculosa (Asteraceae) to root herbivory under varying levels of interspecific plant competition and soil nutrient availability. Oecologia, 91, 141-149. Sutton, A.J., Abrams, K.R., Jones, D.R., Sheldon, T.A., & Song, F. (2000) Methods for Meta-Analysis in Medical Research John Wiley & Sons, Chichester. Vrieling K., van Wijk C.A.M. (1994) Cost assessment of the production of pyrrolizidine alkaloids in ragwort (Senscio jacobaea L.). Oecologia, 97, 541-546.
24
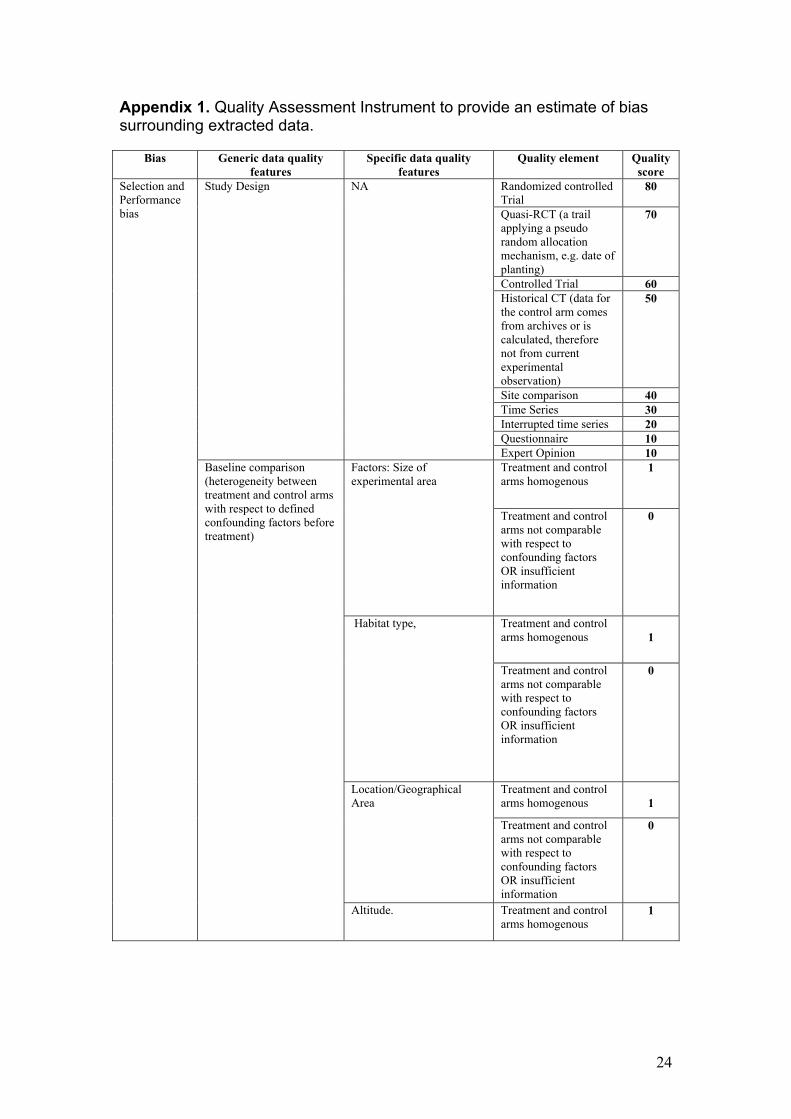
Appendix 1. Quality Assessment Instrument to provide an estimate of bias surrounding extracted data.
Bias Generic data quality features
Specific data quality features
Quality element Quality score
Randomized controlled Trial
80
Quasi-RCT (a trail applying a pseudo random allocation mechanism, e.g. date of planting)
70
Controlled Trial 60 Historical CT (data for the control arm comes from archives or is calculated, therefore not from current experimental observation)
50
Site comparison 40 Time Series 30 Interrupted time series 20 Questionnaire 10
Study Design
NA
Expert Opinion 10 Treatment and control arms homogenous
1 Factors: Size of experimental area
Treatment and control arms not comparable with respect to confounding factors OR insufficient information
0
Treatment and control arms homogenous
1
Habitat type,
Treatment and control arms not comparable with respect to confounding factors OR insufficient information
0
Treatment and control arms homogenous
1
Location/Geographical Area
Treatment and control arms not comparable with respect to confounding factors OR insufficient information
0
Selection and Performance bias
Baseline comparison (heterogeneity between treatment and control arms with respect to defined confounding factors before treatment)
Altitude.
Treatment and control arms homogenous
1

25
Treatment and control arms not comparable with respect to confounding factors OR insufficient information
0
Treatment and control arms homogenous
1 Plant age at time of treatment
Treatment and control arms not comparable with respect to confounding factors OR insufficient information
0
Treatment and control arms homogenous
1
Baseline comparison (cont.)
Soil Type
Treatment and control arms not comparable with respect to confounding factors OR insufficient information
0
No heterogeneity within treatment and control arms
1 Factors: Plant age at time of treatment
Replicates within treatment and control arms not comparable
0
No heterogeneity within treatment and control arms
1 Habitat type,
Replicates within treatment and control arms not comparable
0
No heterogeneity within treatment and control arms
1 Location, Replicates within
treatment and control arms not comparable
0
No heterogeneity within treatment and control arms
1
Intra treatment variation
Altitude.
Replicates within treatment and control arms not comparable
0
Factor equal in treatment and control
1 Biological control agent
Factor not equal or unreported
0
Measurement of intervention and Co-interventions
Well replicated objective parameter of abundance used ( >5 replications)
4
Replicated objective parameter of abundance used (>2 replications)
2
Unreplicated however parameter measured sensible
1
Assessment bias
Measurement of outcome
Replication, parameter of abundance (accuracy)
Unreplicated observations or subjective parameter of abundance used
0

26
Appendix 2. Study Characteristics Tables for each study accepted at full text.
Study 1 Bornemissza, G. F. (1966) Methods A control trial (CT) on an abandoned diary farm, comparing defoliated plants (by
cinnabar moths) against control (moth excluded). Size of experimental area: Unknown size of area – however a total of
200 plants (100 in each arm), all contained within sleeving were used in the experiment.
Habitat: Abandoned dairy farm pasture fields – reverting to weed & scrub.
Location: nr. Gunyah, Victoria, Australia. Altitude: approx. 365m a.s.l. Plant age at time of treatment: Unknown, however all of similar age and
size within & between experimental arms.
Population
Soil type: Heavy-textured soils. Data from 3km from the study site (Olsen Bridge, Victoria, Australia.).
The region has an average annual rainfall of 1371mm, well distributed over the year but 1016mm falling within the months of May-November. Drought conditions are frequent in summer, while winter is foggy and cold with mild morning ground-
frosts. The values are the means for the decade 1952-61. Observation J F M A M J J A S O N D
Max. air temp (0C)
23 22 21 18 14 12 11 12 14 16 18 20
Rainfall (mm)
61 67 66 87 160 181 151 145 139 141 139 109
Hot days (+270C)
11 7 6 3 - - - - - 1 4 5
Weather
Rainy days 9 11 12 14 21 21 21 22 18 19 18 14 Intervention & Comparator
Each arm of the experiment has 100 ragwort plants of similar age and size (200 plants in total). Organdie sleeves are used to either enclose 25 Tyria (cinnabar moth caterpillars) on ragwort plants(Treatment group) or to exclude them (Control group). The dry weight (g), capitula per plant, seed per capitula, and seed per plant were recorded. Values are means of 100 plants = 33 plants after defoliation, 66 plants after regeneration. Control values marked with * are from the beginning of January. The values for Effective Reduction are taken from the paper. Measurements were made simultaneously – after defoliation = end of January; after regeneration = mid-April, after the plants have had time to regenerate after Tyria attack.
Treatment Control Effective Reduction
After defoliation 16 33 Dry Weight (g)
After regeneration 17 34
33%
After defoliation 0 560 Capitula per
Plant After
regeneration 87 565 83%
After defoliation 0 Seed per
Capitula After
regeneration 43 75* 43%
After defoliation 0 Seed
per Plant After
regeneration 3741 42280* 88%
Outcomes
Viability of Seeds (%) after a 4 month follow-up Treatment = 39% Control = 52%

27
Study design
Control Trial 60pts
Baseline comparison
All factors known (Size, Habitat, Location, Altitude, Plant Age and Soil) 6pts
Intra treatment variation
All factors again know (Age, Habitat, Location, Altitude)
4ptsMeasurement of intervention and co-interventions
All factors know (bio-control agent & number, no other interventions)
2pts
Replication & parameter of abundance
Replication even for each experimental arm, with outcome parameter measured equally and simultaneously between arms.
4ptsData Quality Score Total
76pts
Other notes Data extracted from Table 2 of the original paper. Plants that were attacked / defoliated usually produced vigour secondary growth and a belated crop of seeds. Larvae feed more voraciously during their last two instars. This occurred at the study site at the height of the ragwort flowering season. Thus, larval attack will cease and defoliation will normally have been effected, before all the small buds have developed into flowering capitula and while most plants still possess substantial reserves.

28
Study 2 Cameron, E. (1935)
Methods A historical (estimated) control trial (HCT) using estimated seed yields based on a calculation from previous experiments to calculate the control arm of the experiment. Also a timeseries of the effectiveness of Tyria on decreasing ragwort plant densities. Size of experimental area: Varies with each area – see below Habitat: Impoverish pastures Location: Varies – see below Altitude: Unknown Plant age at time of treatment: Given by plant height – see below
Population
Soil type: Unknown Weather No weather data was presented / recorded for any of the sites within this study. Intervention & Comparator
Datasets A & B A HCT based on a calculation of estimated seed yield for the control arm of the experiment. Each of the experimental areas varies in size, number of plants and number of Tyria attacking the ragwort. All plants = common ragwort (S. jacobaea). n is based on number of plants
Area ID Plot Size (m2)
Number of Plants
Av. Height of
plants (cm)
Number of Tyria
Treatment (av. Seed yield per
plant)
Control (est. Seed yield per
plant)
Length of follow-
up (months)
Wentworth (site A) 1.5 14 61 15 974 20000 2
Outcomes
Stoke Poges (B) 114 14 70 15 0 23689 4
Intervention & Comparator
Dataset C A timeseries showing the effectiveness of Tyria at controlling ragwort plant densities – when secondary growth, owing to an unfavourable session, was eliminated. Record from fields at Fawley Court Hill, Henley, U.K. 1932. Timeseries length = 12 months. Area of the field = 4.86 hectares, values below have been recalculated from per acre. Average of 12 Tyria on each plant observed. Date Mature Plants Young Plants Per hectare Total field Per hectare Total field
Start June 1931 269278 1306800 315364 1529520 End June 1932 2.47 12 0.41 2
Outcomes
Change 99.99% 99.99% 99.99% 99.99% 2 historical control trial (HCT) (datasets A-B) 50ptsStudy
design 1 timeseries (dataset C) 30ptsBaseline comparison
Unknown factors include – altitude of the site & soil type. All datasets = 4pts
Intra treatment variation Again unknown factors included – altitude. All datasets = 3ptsMeasurement of intervention and co-interventions
Tyria used as Bio-control agent – the number per plant was recorded for all sites and no other co-interventions were being undertaken.
All datasets = 2ptsAll HCT experiments were well replicated and even between each arm of the experiment.
4pts
Replication & parameter of abundance No replication seemed to be undertaken 0pts
Datasets A-B Dataset C Data Quality Score Total 63pts 39pts Other notes Paper draws the following conclusions:
1. Providing that the attack is general & that no secondary growth follows, either in the shape of a new crop of flowers, or as new growth from base, to carry the ragwort over into another year, Tyria can be a very effective control agent.
2. When poor plants, growing on very inferior soil, are heavily and uniformly attacked by Tyria the ragwort infestation should be wiped out.
3. Once an infestation is under control, certain precautions have to be taken in order that the area may be kept free of ragwort. These take the form of (a) stimulation of grasses in the area, (b) avoidance of overgrazing.

29
Study 3 Ganesham (1992)
Methods A Control trial investigating the effect of cinnabar moth herbivory on density of plants, number of capitula produced and mean height of flowering plants. Size of experimental area: Plots of 10m2 (0.001 hectares) Habitat: Field Location: Silwood Park, Berkshire, U.K.
(Grid Ref: 41/944 691) Altitude: Unreported – sloped field Plant age at time of treatment: Varies naturally random – no set age
Population
Soil type: Unreported Weather No weather data was presented. Intervention & Comparator
Control Trial consisting of 3 factors with two levels each as follows: 1. Cinnabar moth +/- 2. Rabbits +/- 3. Soil Insecticide +/-
The cinnabar moths were hand picked from plots to remain free from damage and transferred to those plots where cinnabar moths were meant to be present. Rabbit grazing was prevented by fencing. Soil insecticide, Dursban (chlorpyrifos), was applied from autumn 1991 every 6-8 weeks. 4 replicates were taken for the experiments. The density of plants, number of capitula produced and mean height of flowering plants were recorded for each plot. (The impact of insecticides and rabbits could not be investigated as the other contributing data to the meta-analysis did not have sufficient detail to allow investigation). Dataset A Dataset B Cinnabar Insecticide No soil insecticide + Rabbit - Rabbit +Rabbit - Rabbit With (treatment) 3.25 0.25 5.00 0.25
Outcomes (density of ragwort plants)
Without (control) 6.25 0.25 2.25 1.00 Dataset A Dataset B Cinnabar Insecticide No soil insecticide + Rabbit - Rabbit +Rabbit - Rabbit With (treatment) 9.364 2.00 37.216 0
Outcomes (mean number of capitula per plant) Without (control) 14.130 0 16.667 42.577
Dataset A Dataset B Cinnabar Insecticide No soil insecticide + Rabbit - Rabbit +Rabbit - Rabbit With (treatment) 43.82 77.00 48.08 66.00
Outcomes (mean height (cm) of flowering plants) Without (control) 46.22 72.00 32.33 60.19 Study design A control trial 60pts Baseline comparison
Altitude & soil type are unknown 4pts
Intra treatment variation
Altitude varies as the field is on a slope & soil type/characteristics are unknown 3pts
Measurement of intervention and co-interventions
Co-interventions are known (rabbits & soil insecticide) and are factored into account with experimental design. However unknown number of Tyria per plot.
1ptsReplication & parameter of abundance
4 replicates – measures are all sensible 2pts
Data Quality Score Total For both datasets A & B 70pts Other notes

30
Study 4 Harris, P. (1974)
Methods Site Comparison of cinnabar moth herbivory on ragwort at Nova Scotia, Canada.
Size of experimental area: Unreported
Habitat: Pasture fields and roadsides
Location: Nova Scotia & Prince Edward Island, Canada.
Altitude: Unreported
Plant age at time of treatment: Immature plants
Population
Soil type: Unreported
Weather No weather data was presented within the study.
Intervention & Comparator
A site comparison study, with records of the ragwort plants density m2 for the year 1972 at Nova Scotia, Canada. The comparison site was the nearest permanent pasture which was unaffected by the cinnabar moth (Tyria) defoliation. The number taken for replication = 1.
Immature plants m2
Treatment 0.03
Outcomes (Control Trial)
Control 62.2 Study design Site Comparison 40pts
Baseline comparison
Size of the experimental area, Altitude of sites and soil type are all unreported. The plant ages are all immature. 3pts
Intra treatment variation
Measurement of intervention and co-interventions
No co-interventions reported. However, an unknown number of Tyria per plot/plant.
1ptReplication & parameter of abundance
Number of replicates unknown therefore only 1 used. Sensible measure of density (m2)
1ptData Quality Score Total 45ptsOther notes Ragwort recorded as being perennial within Canada – most perennial plants can
tolerate a single defoliation with few ill effects unless it is timed to force the plant into a period of stress such as winter or drought while it is in a physiologically unstable state. Therefore, it is worth-while making an effort to determine this period before introducing an agent to control a perennial weed. However, if the climate is equitable throughout the year, the only strategy that will succeed is to attack the weed throughout the growing season. This can be achieved by a multivoltine agent or a series of univoltine agents.

31
Study 5 Harris, P., Thompson, L. S., Wilkinson, A. T. S. & Neary, M. E. (1976)
Known as: Harris, P., Thompson, L. S. et.al. (1976) Methods A site comparison study with 4 sites defoliated by cinnabar moths and 1 site left as
an untreated control Size of experimental area: Each plot was 1m2 Habitat: Pasture fields Location: Canada
(Nanaimo, British Columbia & Durham, Nova Scotia). Altitude: Unreported Plant age at time of treatment: Both rosettes & flowering plants
Population
Soil type: Unreported Weather No weather was reported within the study. Intervention & Comparator
Site comparison data Both flowering plants & rosettes on two 1m2 plots at Nanaimo, B.C. were tagged & the number of leaves on each rosette were recorded. The plants were then defoliated by adding several hundred field-collected cinnabar larvae. One year later the survival of each plant was noted and the numbers of leaves on the rosettes were counted. A similar procedure was followed at Durham, N.S. except that one plot was left un-defoliated as a control site. The follow-up time was 12 months with the experiment ending in 1973. An average of 3 cinnabar moth larvae to plant was calculated. Again the number of replication = 1.
Dataset
Number of rosettes
(density m2)
Number rosette leaves/plot
Average leaves/plant
A 183 612 3.255 B 71 244 3.437 C 59 336 5.695 D 3 0 0
Outcomes
Control 72 541 7.514 Study design Study comparison study 40pts Baseline comparison
Soil type/characteristics and the altitudes of each site are unknown. All other factors reported and similar. 4pts
Intra treatment variation
Only details of altitude of each of the sites unreported. 3pts
Measurement of intervention and co-interventions
The average number of Tyria per plant could be approximately calculated from the text. No co-interventions reported on sites during the experiment.
2ptsReplication & parameter of abundance
No replication of results only one plot per field recorded. Sensible parameter of assessment was used. 1pt
Data Quality Score Total For datasets A-D 50pts Other notes

32
Study 6 Harris, P., Wilkinson, A. T. S., Thompson, L. S. & Neary, M. E. (1976)
Known as: Harris, P., Wilkinson, A. T. S. et.al. (1976) Methods Three different timeseries measuring ragwort/m2 against cinnabar moth larvae/m2
for the east and west coasts of Canada. Size of experimental area: Varies – see below. Habitat: Farmland pastures and abandoned fields. Location: Three sites in Canada as follows:
a) Durham, Nova Scotia b) Selkirk, Prince Edward Island c) Nanaimo, British Columbia
Altitude: Unreported Plant age at time of treatment: All ages – as measuring stems/m2
Population
Soil type: Varies with site: a) Unreported b) Sandy loam (poor drainage) c) Gravelly sandy loam
Weather No weather was reported within the study.
Intervention & Comparator
Dataset A – Durham, Nova Scotia Release field = 3,500m2 with a dense stand of ragwort since 1955, caused by over grazing and uneven ground. Recording was undertaken during mid-July, allowing the majority of eggs to hatch and the ragwort to be bloom. Rosettes m2 were also recorded for some of the timeseries.
Year Stems/m2 Rosettes/m2 Larvae/m2 Larvae/stem 1969 2.5 8.0 3.2 1970 0.25 1.4 18.0 1971 0.06 0.6 10.0 1972 0.001 0.03 0.09 90.0 1973 0.008 0.06 0.004 0.5
Outcomes
1974 0.008 0.43 0.008 1.0 Intervention & Comparator
Dataset B – Selkirk, Prince Edward Island Release field = 26,200m2 (2.62ha) of abandoned farmland with a continuous sward of grass & mouse-eared hawkweed (Hieracium pilosella) and was not cut or grazed. The flowering stems shorter and the density of the ragwort was considerably less than at Durham; however heavy stands of infestation were present. Sampling completed during mid-July, the week after that for Durham, as emergence of larvae was later than that in Nova Scotia. Ragwort densities calculated at paced intervals across the field.
Year Stem/m2 Larvae/m2 Larvae/stem 1971 0.46 1.2 2.6 1972 0.02 0.1 5.0
Outcomes
1973 0.0 0.0 0.0 Intervention & Comparator
Dataset C – Nanaimo, British Columbia Release field = 75,000m2 (7.5ha) with an easterly exposure. Much of the field was subject to severe summer drought, which usually defoliated ragwort rosettes. Field was surrounded by Douglas fir (Pseudotsuga menziesii), hemlock (Tsuga heterophylla) and western red cedar (Thuja plicata). Sampling occurred over a period of June to July for the moth with the ragwort stems being counted over the summer. Rosettes m2 were also recorded for some of the timeseries.
Year Stems/m2 Rosettes/m2 Larvae/m2 Larvae/stem 1968 2.7 10.4 3.8 1969 2.0 8.0 4.1 1970 2.5 6.5 5.2 1971 1.4 2.5 5.3 1972 2.1 10.0 1.2 2.3 1973 0.5 14.9 0.5 1.0 1974 0.4 5.0 0.2 0.5
Outcomes
1975 2.0 4.2 0.1 0.05
33
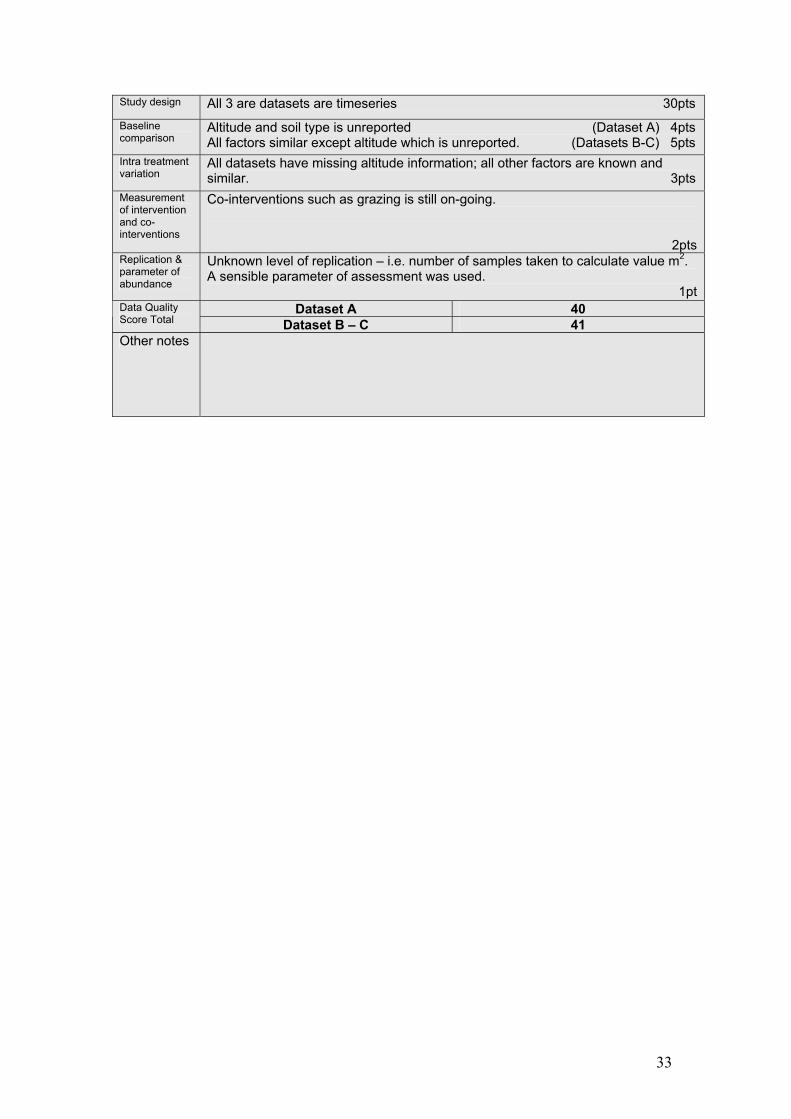
Study design All 3 are datasets are timeseries 30pts Baseline comparison
Altitude and soil type is unreported (Dataset A) 4pts All factors similar except altitude which is unreported. (Datasets B-C) 5pts
Intra treatment variation
All datasets have missing altitude information; all other factors are known and similar. 3pts
Measurement of intervention and co-interventions
Co-interventions such as grazing is still on-going.
2ptsReplication & parameter of abundance
Unknown level of replication – i.e. number of samples taken to calculate value m2. A sensible parameter of assessment was used.
1ptDataset A 40 Data Quality
Score Total Dataset B – C 41 Other notes

34
Study 7 Hawkes, R. B. & Johnson, G. R. (1976)
Methods A timeseries and two control trials using the ragwort flea-beetle (Longitarsus jacobaeae) as a singular or combined control agent with cinnabar moth larvae across three sites in Fort Bragg, California, U.S.A. Size of experimental area: Varies with each site – see below. Habitat: River bottom pastures Location: Fort Bragg, California, U.S.A. Altitude: Unreported Plant age at time of treatment: All ages
Population
Soil type: Unreported Weather No weather was reported within the study. Intervention & Comparator
Dataset A – Timeseries – Site 1 The original release site for L. jacobaeae in the Fort Bragg region. It is ca. 5 ha of river bottom pasture with heavy grass vegetation which originally contained ragwort. Grazed by sheep, sometimes feeding on ragwort in small quantities. Plant density was recorded with a 1m2 quadrat, every five paces along a transect. Based on a 72 month (6 year) timeperiod.
Ragwort density/m2 Start (1969) 15.3
Outcomes
End (1975) 0.0 Intervention & Comparator
Dataset B &C – Control Trial – Site 2 & 3 Site 2 – has not been grazed for years, with a dense stand of velvetgrass (Holcus lanatus) & several spp of annual & perennial forbs. In October 1972 ca. 2000 flea beetles were released on the site. A control site 500m to the east was established where just cinnabar moths were naturally present (this distance was required due to the dispersal of L. jacobaeae. Site 3 – ca. 5 ha, it is closely grazed by cattle, which ignore feeding on the ragwort. Ca. 5000 L. jacobaeae were released in October 1972. A control plot was established 200m to the west of the treatment site. Data was extracted for a follow-up period of 2 years prior to L. jacobaeae dispersing to the control site. The average L. jacobaeae was 31.7 larvae/rosette. Data was extracted and converted to reduction of ragwort /m2. Replication, n = 1 for both datasets.
Densities (plant/m2) Site 2 (dataset B) Site 3 (dataset C) Treatment Control Treatment Control
Start 71.1 36.1 18.3 7.7 End 6.9 14.5 7.4 9.0
Outcomes
Overall reduction
64.2 21.6 10.9 -1.3 (increased
density) Study design Timeseries (dataset A) 30pts
Control Trial (datasets B-C) 60pts Baseline comparison
Altitude and soil type is unreported (all datasets) 4pts
Intra treatment variation
Only altitude is unreported, all other factors are similar (all datasets) 3pts
Measurement of intervention and co-interventions
Co-interventions such as grazing are reported and is still on-going at sites 1 & 3.
(all datasets) 2ptsReplication & parameter of abundance
Unknown level of replication to obtain data – parameter of abundance is suitable. (all datasets) 1pt
Dataset A 40 Data Quality Score Total Datasets B – C 70 Other notes

35
Study 8 James, R. R., McEvoy, P. B. & Cox, C. S. (1992)
Known as: James, R. R., et al. (1992) Methods An exclusion experiment (RCT) was conducted using cages & experimental
ragwort populations to determine which of the following was most effective in depressing plant populations: Tyria jacobaeae, Longitarsus jacobaeae, or a combination of both. Size of experimental area: 0.9 ha divided into four blocks each with 15
plots of 0.25m2. Habitat: Meadow Location: Cascade Head Scenic Research Area,
central coast Oregon. U.S.A. Altitude: Unreported Plant age at time of treatment: All ages – from transplanted plants & seed
Population
Soil type: Unreported Weather No weather was reported within the study. Intervention & Comparator
Meadow was divided into four blocks. 15 plots of 0.25m2 were placed within a randomly located 3*4m area in each of the blocks. Natural vegetation was removed from the meadow other than ragwort and ragwort transplants were thinned to recreate the situation of when the biocontrol agents were introduced to the area. Insects were excluded from the area via cages for 1 year, while the plants became established (flowering plants and seedlings). Experimental plots were covered with 61*61*61cm frames constructed of 2.5cm diameter plastic (PVC) tubes covered with bags of ‘Leno weave’ nylon mesh screens. Each plot was assigned to one of five treatments:
1. Neither insect (control) 2. Moth only – cages which excluded flea-beetle but opened June – July for
cinnabar moth; flowering plant defoliated. 3. Beetle only – cages open to flea-beetle but closed June – July to exclude
moth. 4. Both insects – cages continuously open. 5. Open control – to see the side effects of the cages.
Each of the treatments were replicated three times, within each block to allow for two destructive samples and a census plot, results are a mean of 4 plots. The experiment was randomised block design. Some flea-beetles did manage to enter cages however less than 1% of that in the beetle only treatment and 1.2% of total beetles in the both insect treatment. For further details please see original study.
Control Tyria only (A)
Longitarsus (B) Both (C)
Ragwort Density 53.25 50.37 43.1
Total Biomass (g/plot) 165.3 149.7 207.5 167.0
Beetle larvae per plot 4.9 322.8 251.1 Leaves
per stem 37.9 37.0 31.5 8.8 Capitula per stem 240.6 53.9 144.0 2.4 Achenes
per catitula 65.5 55.0 66.5 53.5
Outcomes
% Viable Achenes 34.9 25.7 54.3 0.0
Study design Randomised control trial (RCT) 80pts
Baseline comparison
Altitude and soil type is unreported
4ptsIntra treatment variation
Only altitude is unreported, all other factors are similar
3pts

36
Measurement of intervention and co-interventions
No co-intervention on-site, excellent recording of biocontrol methods
2pts
Replication & parameter
Replicated experiment with suitable parameters of abundance reported 2pts
Data Quality Score Total For Dataset A-C 91pts
Other notes Taken from the Discussion: “…support the hypothesis that two insects together, feeding on different plant parts & at different times of the year, can have a greater impact on host-plants than either insect acting alone.” “Alone, beetles decreased vegetative plan biomass & density and the cinnabar moth treatment reduced fecundity.” “The combination of both herbivore treatments reduced achene production & viability to the extent that fecundity was negligible.” “The high mortality of young plants (80-99%) caused by beetle activity undermined the pyramidal structure of the plant population, leaving fewer individuals to be recruited into the reproductive stage.”

37
Study 9 McEvoy, P. B. (1985)
Methods A timeseries reporting the number releases of cinnabar moth and flea beetle comparing it to the annual estimates of standing crop (dry g/m2). Size of experimental area: 0.9 ha Habitat: Abandoned diary farm pasture Location: Cascade Head Scenic Research Area,
central coast Oregon. U.S.A. Altitude: Unreported Plant age at time of treatment: All ages
Population
Soil type: Unreported Weather No weather was reported within the study. Intervention & Comparator
Timeseries A Total release of biocontrol agents at the site included 2000 cinnabar moths in 1978 and 230 flea-beetles in 1979 and an additional 485 in 1980. Biocontrol agent’s populations remained low until 1982/3 when a population explosion occurred. Four years worth of data was recorded.
Ragwort density/m2 Start (1980) 71 End (1984) 0.6
Outcomes
Total decline (over 48 months) 70.4 (99.2% reduction) Intervention & Comparator
Timeseries B The standing crop (dry g/m2) is recorded using quadrats randomly placed over the site. This is based on 3 years worth of records
Standing ragwort crop (dry g/m2) Start (1981) 718 End (1984) 22
Outcomes
Total decline (over 36 months) 696 (97% reduction) Study design Timeseries 30pts Baseline comparison
Altitude and soil type is unreported 4pts
Intra treatment variation
Only altitude is unreported, all other factors are similar
3ptsMeasurement of intervention and co-interventions
No co-intervention on-site, previous activities on site (dairy farming). Biocontrol methods and numbers introduced are reported
2ptsReplication & parameter of abundance
No replication as timeseries
0ptsData Quality Score Total Datasets A-B 39pts
Other notes While the ragwort crop declined – the standing crop of other species increased by 10 fold (707 dry g/m2). This lead to a no net change in mean standing crop of the plant communities.

38
Study 10 McEvoy, P., Cox, C. & Coombs, E. (1991)
Known as: McEvoy, P., et al (1991) Methods A number of Randomised Control Trials and Timeseries studying the response of
ragwort to Longitarsus jacobaeae defoliation. Size of experimental area: 0.9 ha with plots 0.25m2 Habitat: Abandoned diary farm pasture Location: Cascade Head Scenic Research Area,
central coast Oregon. U.S.A. Altitude: Only for dataset C – see appendix of
original study Plant age at time of treatment: All ages
Population
Soil type: Unreported Weather Average precipitation mm/yr given for dataset C in appendix of the original study. Intervention & Comparator
Dataset A – Perturbation Experiment The objective of this experiment was to “create high-density ragwort populations & then to compare ragwort density, biomass & reproduction (capitulum) after the plants were exposed to & protected from introduced biological control trial.” A single-factor randomised-block design with two treatments (treat & control), four blocks & 1 replication per block. Beetles were removed from the control (caged) plots over a period of a year before experiment started and insecticide was sprayed during the experiment so the plots remained clear. Most of the values below have been scaled up to value/m2 and read from figure 3 in the original paper. The beetle density was 906/per plot or 3624/per m2.
End Levels – August 88 Treatment Control
Density/m2 0.76 1000 Dry mass (g)/m2 0.44 80
Outcomes
Capitula/m2 0 600 Intervention & Comparator
Dataset B – Perturbation Experiment (timeseries) As above – a timeseries of 18 months.
Start End % change Density/m2 308 0.76 -99.9
Dry mass (g)/m2 477 0.44 -99.9
Outcomes
Capitula/m2 160 0 -100 Intervention & Comparator
Dataset C – site comparison Follow-up of 6 years (72 months) measuring the ragwort densities/m2 following the release of Longitarsus jacobaeae. Data is based on 14 sites across Oregon
Start End % change Outcomes Density/m2 7.52 0.52 -93.1
Study design Randonised Control Trial (dataset A) 80pts Timeseries (datasets B-C) 30pts
Baseline comparison
Altitude and soil type is unreported (datasets A-B) 4pts Only soil type unreported – Altitude is given for each site (dataset C) 5pts
Intra treatment variation
All other factors are similar – expect altitude (all datasets) 3pts
Measurement of intervention and co-interventions
All factors known for the site (datasets A-B) 2pts Co-interventions are unknown for all the sites (dataset C) 1pt
Replication & parameter of abundance
Replicated dataset with suitable parameter measured (dataset A) 2pts No replication, however suitable parameter is measured (dataset B-C) 1pt
Dataset A 91 pts Dataset B 40 pts
Data Quality Score Total
Dataset C 40 pts
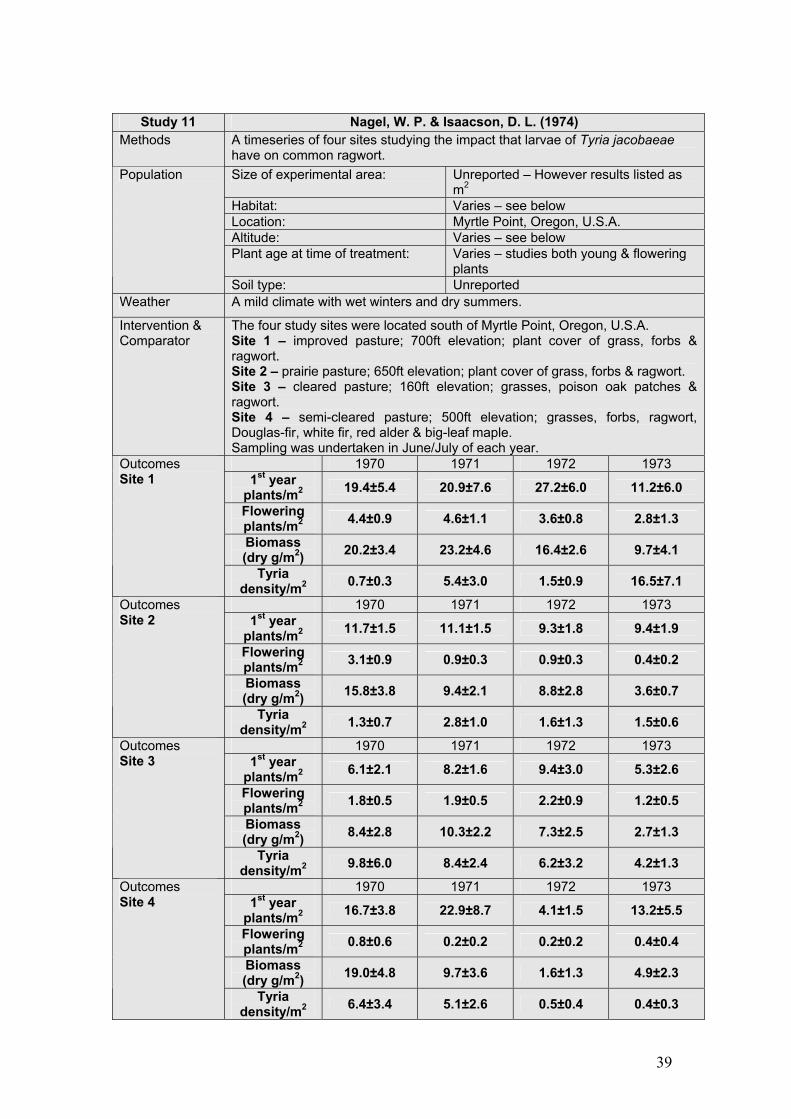
39
Study 11 Nagel, W. P. & Isaacson, D. L. (1974)
Methods A timeseries of four sites studying the impact that larvae of Tyria jacobaeae have on common ragwort. Size of experimental area: Unreported – However results listed as
m2 Habitat: Varies – see below Location: Myrtle Point, Oregon, U.S.A. Altitude: Varies – see below Plant age at time of treatment: Varies – studies both young & flowering
plants
Population
Soil type: Unreported Weather A mild climate with wet winters and dry summers.
Intervention & Comparator
The four study sites were located south of Myrtle Point, Oregon, U.S.A. Site 1 – improved pasture; 700ft elevation; plant cover of grass, forbs & ragwort. Site 2 – prairie pasture; 650ft elevation; plant cover of grass, forbs & ragwort. Site 3 – cleared pasture; 160ft elevation; grasses, poison oak patches & ragwort. Site 4 – semi-cleared pasture; 500ft elevation; grasses, forbs, ragwort, Douglas-fir, white fir, red alder & big-leaf maple. Sampling was undertaken in June/July of each year.
1970 1971 1972 1973 1st year
plants/m2 19.4±5.4 20.9±7.6 27.2±6.0 11.2±6.0
Flowering plants/m2 4.4±0.9 4.6±1.1 3.6±0.8 2.8±1.3
Biomass (dry g/m2) 20.2±3.4 23.2±4.6 16.4±2.6 9.7±4.1
Outcomes Site 1
Tyria density/m2 0.7±0.3 5.4±3.0 1.5±0.9 16.5±7.1
1970 1971 1972 1973 1st year
plants/m2 11.7±1.5 11.1±1.5 9.3±1.8 9.4±1.9
Flowering plants/m2 3.1±0.9 0.9±0.3 0.9±0.3 0.4±0.2
Biomass (dry g/m2) 15.8±3.8 9.4±2.1 8.8±2.8 3.6±0.7
Outcomes Site 2
Tyria density/m2 1.3±0.7 2.8±1.0 1.6±1.3 1.5±0.6
1970 1971 1972 1973 1st year
plants/m2 6.1±2.1 8.2±1.6 9.4±3.0 5.3±2.6
Flowering plants/m2 1.8±0.5 1.9±0.5 2.2±0.9 1.2±0.5
Biomass (dry g/m2) 8.4±2.8 10.3±2.2 7.3±2.5 2.7±1.3
Outcomes Site 3
Tyria density/m2 9.8±6.0 8.4±2.4 6.2±3.2 4.2±1.3
1970 1971 1972 1973 1st year
plants/m2 16.7±3.8 22.9±8.7 4.1±1.5 13.2±5.5
Flowering plants/m2 0.8±0.6 0.2±0.2 0.2±0.2 0.4±0.4
Biomass (dry g/m2) 19.0±4.8 9.7±3.6 1.6±1.3 4.9±2.3
Outcomes Site 4
Tyria density/m2 6.4±3.4 5.1±2.6 0.5±0.4 0.4±0.3
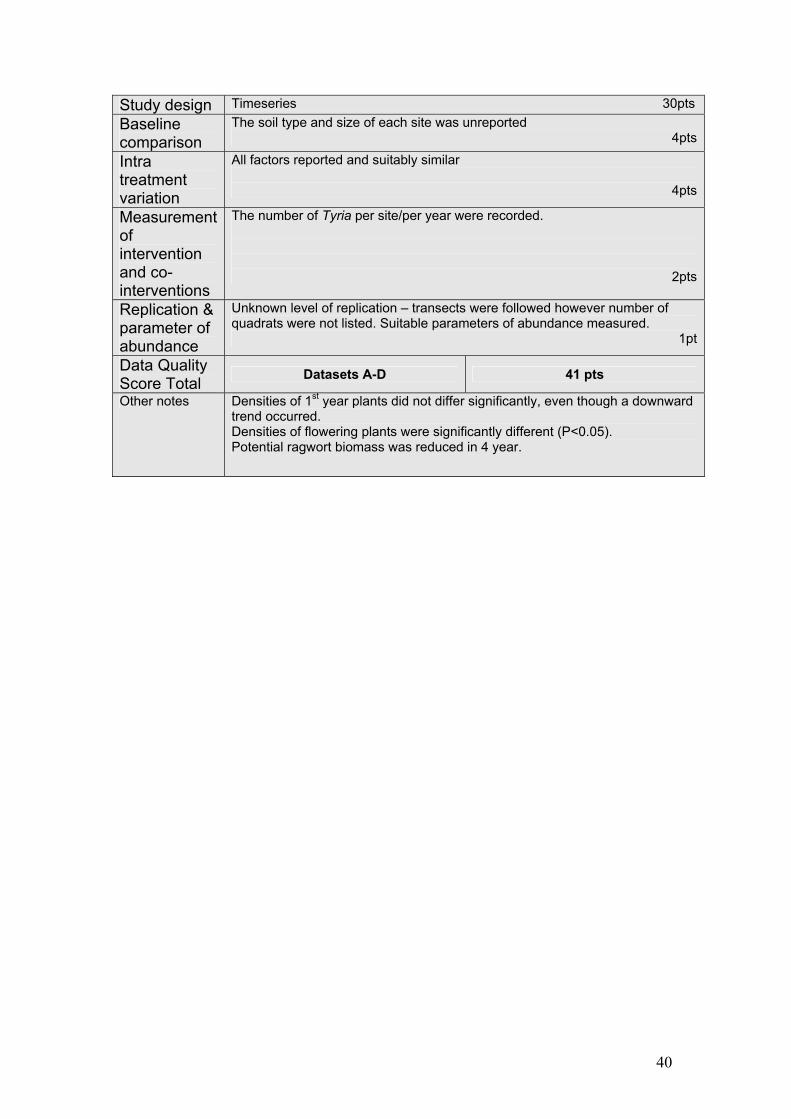
40
Study design Timeseries 30pts Baseline comparison
The soil type and size of each site was unreported 4pts
Intra treatment variation
All factors reported and suitably similar
4pts
Measurement of intervention and co-interventions
The number of Tyria per site/per year were recorded.
2pts
Replication & parameter of abundance
Unknown level of replication – transects were followed however number of quadrats were not listed. Suitable parameters of abundance measured.
1pt
Data Quality Score Total Datasets A-D 41 pts
Other notes Densities of 1st year plants did not differ significantly, even though a downward trend occurred. Densities of flowering plants were significantly different (P<0.05). Potential ragwort biomass was reduced in 4 year.

41
Study 12 Pemberton, R. W. & Turner, C. E. (1990)
Methods A timeseries of three sites studying the impact that larvae of Tyria jacobaeae & Longitarsus jacobaeae have on common ragwort. Size of experimental area: Varies – see description below Habitat: Varies – see description below Location: 3 sites near Fort Bragg, California, U.S.A. Altitude: Unreported Plant age at time of treatment: All ages
Population
Soil type: Unreported Weather No weather was reported within the study. Intervention & Comparator
Data from the following three sites were extracted: Site 1 – Foresti Ranch – ca. 4 ha of pasture of moist prairie on river bottomland (Ten Mile River); lightly grazed. Longitarsus ≥ 10/plant. Site 2 – Todd Point – ca. 30 ha coastal prairie; old pasture no longer grazed; vegetation now dense 1m high. Site 3 – Smith Ranch – ca. 1 ha pasture; heavily grazed; Longitarsus ≤ 10/plant. Sampling was undertaken in the Autumn measuring ragwort plants/m2.
Foresti Ranch Todd Point Smith Ranch 1966
(Tyria only)
53.3 1968
1969 (Tyria already present – Longitarsus introduced)
15.3 (Tyria already present)
1972 71.1 (Longitarsus introduced) (Longitarsus introduced)
1973 39.5 11.7 1974 6.9 7.4 1975 0.0 0.6 0.5 1976 0.6 0.2
Outcomes
1987 0.0 0.0 0.18 Study design Timeseries 30pts Baseline comparison
The soil type and altitude of each site was unreported 4pts
Intra treatment variation
All factors are similar – expect altitude (unreported) 3pts
Measurement of intervention and co-interventions
The number of Tyria & Longitarsus per site/per m2 were recorded. Co-interventions were listed for each of the sites – namely grazing.
2ptsReplication & parameter of abundance
Suitable parameters of abundance measured, 200 quadrats taken for the mean ragwort plants/m2 however sd/se not reported. 1pt
Data Quality Score Total Dataset A-C 40 pts Other notes

42
Study 13 Schmidl, L. (1972)
Methods A control trial of the response of ragwort to defoliation of Tyria jacobaeae.
Size of experimental area: Unreported Habitat: Abandoned dairy farm – overgrown pasture
Location: Victoria, Australia
Altitude: Unreported
Plant age at time of treatment: All ages – natural population
Population
Soil type: Unknown
Weather Mean rainfall for the area is 1097mm, uniform throughout the year, averaging 60-80mm/month in summer & 100-110mm/month in winter & early spring. The hottest months are Jan & Feb but seldom exceed 390C.
Intervention & Comparator
The site was a dairy farm until abandoned in the 1930s. Area was overgrown with species of Acacia, Cassinia & Rubus with dominant grasses Agrostis tenuis, Anthoxanthum odoratum & Holcus lanatus. Plant characteristics were assessed in April/May, (4 month follow-up). n = 1 for level of replication.
Dry weight (g) Height (cm) No. of capitula
Seed germination
(%) Treatment 11 76 143 52
Control 26 89 393 84
Outcomes
Reduction (%) 58 15 64 38 Study design Control Trial 60pts Baseline comparison
The size of the experimental area; the altitude & soil type are unknown 3pts
Intra treatment variation
Again only altitude is unknown 3pts
Measurement of intervention and co-interventions
All parameters are known and similar. No co-interventions are reported.
2ptsReplication & parameter of abundance
Unknown level of replication. However parameters measured are sensible 1pt
Data Quality Score Total 69ptsOther notes Feeding tests have shown that 15-20 larvae were sufficient to cause almost
complete defoliation of small plants. 51% of ragwort plants attacked by a dense population of Tyria formed fresh growth and all regenerated plants produced a second crop of flowers and seeds. At the time of the assessment 72% of the recovered plants produced axial shoots, with an mean of 6 shoots/plant. 100% of the plants had signs of crown regeneration. Ragwort is a serious problem in the high-rainfall, high fertility areas of southern Victoria, Australia.

43
Study 14 Windig, J. J. (1993) Methods A timerseries assessing the effect of ragwort mortality via the investigation of two
sites within the Dutch dunes. Size of experimental area: Two sites: Site 1 – 10x90m, Site 2 – unknown
With sites 102 permanent 2x2m plots monitored. Habitat: Sand dunes/dune grasslands Location: Meijendel, Netherlands (52o08’N, 4o22’E) Altitude: <50m (Coastal Dune Lowlands) Plant age at time of treatment: Mixed – naturally
Population
Soil type: Sand based soils – mainly free draining. Weather No detailed reporting of weather conditions was undertaken within the study.
However frost damage was reported on plants. Intervention & Comparator
Site 1 – dataset A Measuring 10x90 (900m2), positioned in a shady part of the dunes. Transition from open sands with minimal vegetation to dense vegetation consisting mostly of grasses. All S. jacobaea plants were marked. The rate of larval herbivory was estimated by sampling each month from January-June 1987. Ten randomly selected plants of various sizes were dug up and dissected to estimate the number of larvae per plant. Site 2 – dataset B An open area of dunes. The rate of herbivory was established as above. Plants on this site were at least double the size of site 1, with twice as many “shot-holes” of adult herbivory. The disappearance of above ground plant parts were checked every month for all plants in both sites, as was done for the regrowth. Also present on site were natural populations of Tyria jacobaeae. The results presented as percentage mortality – measured as a timeseries since January 1st 1987.
Site 1 Site 2 Start 0 0 End 60 80
Outcomes
Longitarsus larvae /per plant 4.6 46.7
Study design Timeseries 30pts Baseline comparison
The altitude of each site was unreported 5pts
Intra treatment variation
Again only altitude is unknown 3pts
Measurement of intervention and co-interventions
Longitarsus numbers given, however Tyria numbers were unknown. No other co-interventions or activities to confound results.
2ptsReplication & parameter of abundance
Parameter measured suitable, however unknown replication. 1pt
Data Quality Score Total Both dataset A-B 41pts Other notes Twice at both sites (90 & 210 days) mortality of the S. jacobaea plants nearly
reached 100%, however later regrowth meant that not all the plants had died. Mortality increased on both sites until 120 days after 1st Jan then at site 1 – (shady area) mortality was near constant at 60% of all S. jacobaea plants. However at site 2 – mortality continued to steadily rise until 150 days then steadied peaking at 180 days (80%) before becoming constant. It was shown that Light Intensity was an important factor for the