Centralized Statistical Monitoring to Detect Data Integrity Issues … Statistical... ·...
36
Centralized Statistical Monitoring (CSM) to Detect Data Integrity Issues Alun Bedding PhUSE Single Day Event 21 st July 2016
-
Upload
phungthuan -
Category
Documents
-
view
255 -
download
0
Transcript of Centralized Statistical Monitoring to Detect Data Integrity Issues … Statistical... ·...

Centralized Statistical Monitoring (CSM) to Detect Data Integrity Issues
Alun BeddingPhUSE Single Day Event 21st July 2016

Agenda
What is CSM and why use it?
Debunking some of the myths around CSM
What is the regulatory position?
What sorts of tests are carried out?
What is going on externally?
Conclusions
2

Agenda
What is CSM and why use it?
Debunking some of the myths around CSM
What is the regulatory position?
What sorts of tests are carried out?
What is going on externally?
Conclusions
3

Centralised Statistical Monitoring (CSM)
4
• An approach for identifying and managing issues affecting data integrity such as
non-random errors, GCP misconduct including fraud at investigational sites
• Sophisticated modeling methods to pick up non-random errors or patterns
• CSM should be performed at limited times during a trial, and then prior to any
important analysis (interim or final)
– Why? It requires sufficiently large amounts of data to pick up signals

Why Centralized Statistical Monitoring?
• Much of this has background in fraud and falsification.
• FDA proposed rule for “Reporting Information Regarding
Falsification of Data” defines falsification of data as: • creating, altering, recording or omitting data in such a way that the data do not represent what
actually occurred
• Examples of falsification of data include but are not limited to:• Creating data that were never obtained
• Altering data that were obtained by substituting different data
• Recording or obtaining data from a specimen, sample or test whose origin is not accurately
described or in a way that does not accurately reflect the data
• Omitting data that were obtained and ordinarily would be recorded
• Used to identify strange patterns in the data.• Could be mis-calibration of equipment.
• Sites not properly trained
• Other less serious issues
5

Agenda
What is CSM and why use it?
Debunking some of the myths around CSM
What is the regulatory position?
What sorts of tests are carried out?
What is going on externally?
Conclusions
6

Debunking Some Myths Around CSM!!!!
• Isn’t it just data cleaning?• NO - It is a statistical analysis of the data.
• Not comparing treatments but an analysis comparing sites with each other, patients with each
other irrespective of treatment.
• What is the difference between CSM and looking at thresholds?• No formal statistical analyses are carried out when using simple thresholds.
• CSM involves univariate and multivariate statistical analysis of all data to compare within and
across sites.
• Should be carried out by people trained in statistics?• Yes. It involves the use of sophisticated statistical methods, however, the interpretation should
be done with the study teams.
7
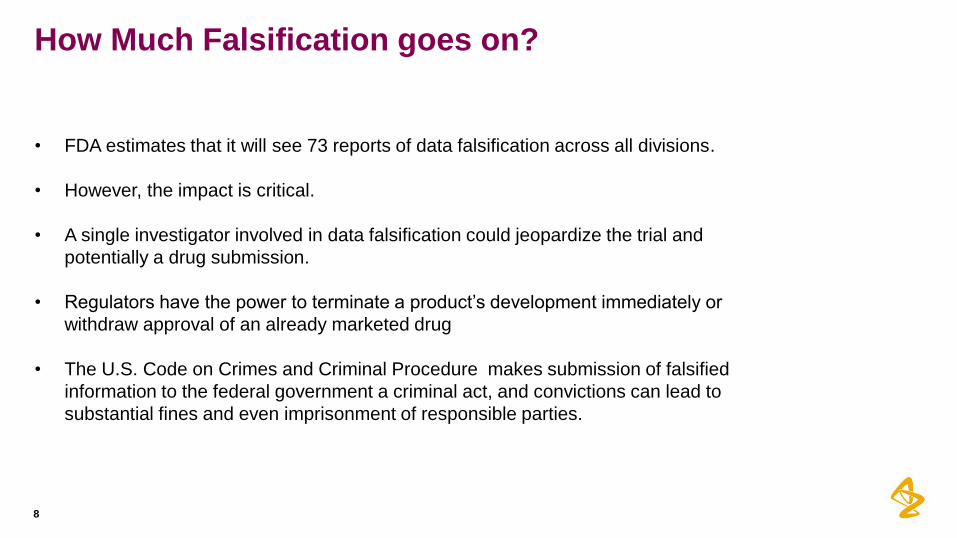
How Much Falsification goes on?
• FDA estimates that it will see 73 reports of data falsification across all divisions.
• However, the impact is critical.
• A single investigator involved in data falsification could jeopardize the trial and
potentially a drug submission.
• Regulators have the power to terminate a product’s development immediately or
withdraw approval of an already marketed drug
• The U.S. Code on Crimes and Criminal Procedure makes submission of falsified
information to the federal government a criminal act, and convictions can lead to
substantial fines and even imprisonment of responsible parties.
8


Agenda
What is CSM and why use it?
Debunking some of the myths around CSM
What is the regulatory position?
What sorts of tests are carried out?
What is going on externally?
Conclusions
10

FDA thoughts?
11Source: FDA Guidance for Industry: Oversight of clinical investigations: a risk based approach to monitoring
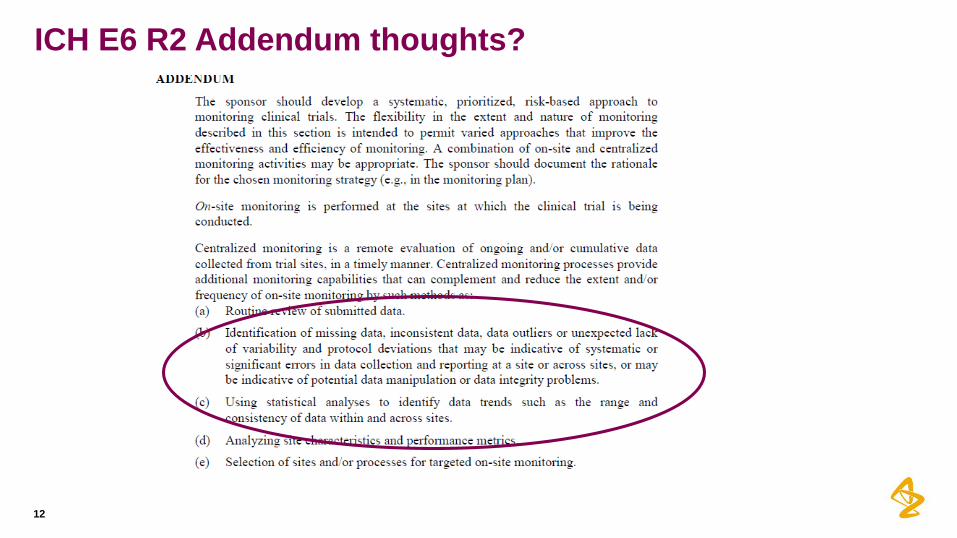
ICH E6 R2 Addendum thoughts?
12

Agenda
What is CSM and why use it?
Debunking some of the myths around CSM
What is the regulatory position?
What sorts of tests are carried out?
What is going on externally?
Conclusions
13
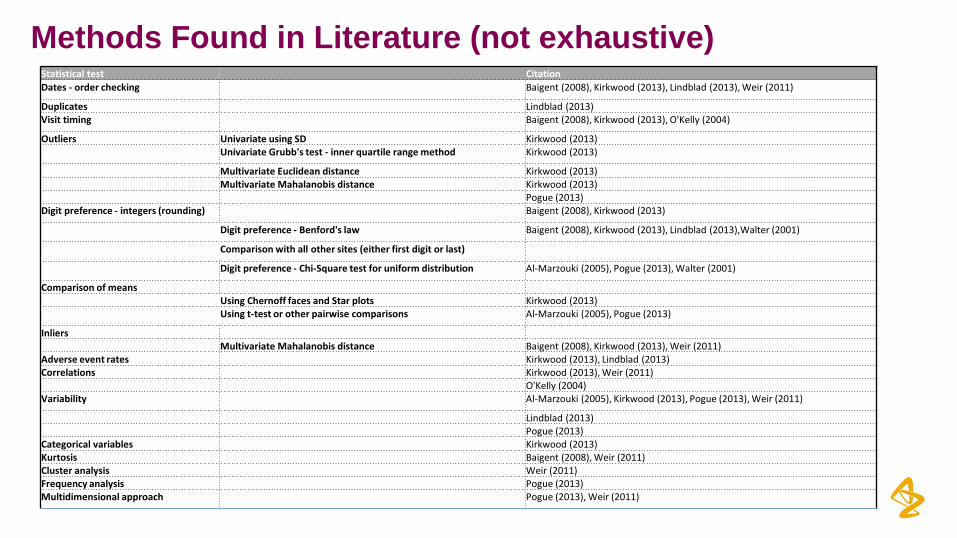
Methods Found in Literature (not exhaustive)Statistical test Citation
Dates - order checking Baigent (2008), Kirkwood (2013), Lindblad (2013), Weir (2011)
Duplicates Lindblad (2013)Visit timing Baigent (2008), Kirkwood (2013), O'Kelly (2004)
Outliers Univariate using SD Kirkwood (2013)Univariate Grubb's test - inner quartile range method Kirkwood (2013)
Multivariate Euclidean distance Kirkwood (2013)Multivariate Mahalanobis distance Kirkwood (2013)
Pogue (2013)Digit preference - integers (rounding) Baigent (2008), Kirkwood (2013)
Digit preference - Benford's law Baigent (2008), Kirkwood (2013), Lindblad (2013),Walter (2001)
Comparison with all other sites (either first digit or last)
Digit preference - Chi-Square test for uniform distribution Al-Marzouki (2005), Pogue (2013), Walter (2001)
Comparison of means Using Chernoff faces and Star plots Kirkwood (2013)Using t-test or other pairwise comparisons Al-Marzouki (2005), Pogue (2013)
InliersMultivariate Mahalanobis distance Baigent (2008), Kirkwood (2013), Weir (2011)
Adverse event rates Kirkwood (2013), Lindblad (2013)Correlations Kirkwood (2013), Weir (2011)
O'Kelly (2004)Variability Al-Marzouki (2005), Kirkwood (2013), Pogue (2013), Weir (2011)
Lindblad (2013)Pogue (2013)
Categorical variables Kirkwood (2013)Kurtosis Baigent (2008), Weir (2011)Cluster analysis Weir (2011)Frequency analysis Pogue (2013)Multidimensional approach Pogue (2013), Weir (2011)

CSM Methods
• Cluster Analysis
• Cluster Subjects Across Sites – Patients going to multiple
sites or possible fabrication across sites
• Cluster Subjects Within Study Sites – Patients within a site to
identify possible fabricated data
• Digit Preference (leading and trailing)
• Multivariate Inliers and Outliers – to close to the mean or too far
might indicate fabricated data
15

Clustering Subjects Across Sites and Within Sites
• Both use similar methods
• Euclidian distance is calculated between subjects for a number
of covariates (age, sex, vital signs, ECG, lab data)
• If the distance is small there is similarity and maybe they are the
same subject.
• Subjects twice in the same study or in more than one site.
• Why clustering?
• It can help identify sets of similar subjects
16

Clustering Subjects Across Sites
17
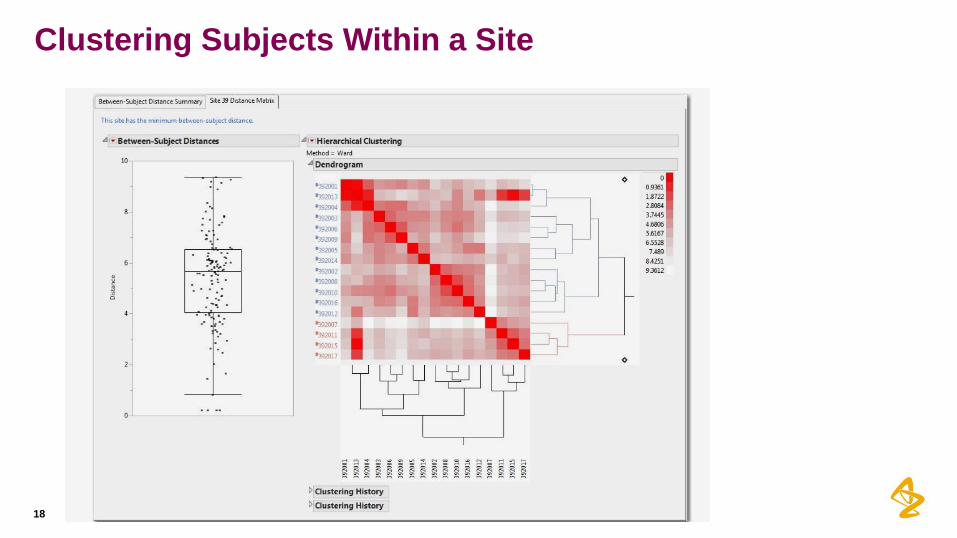
Clustering Subjects Within a Site
18

Drill Downs
19

Digit Preference
• Identify potential issues such as:
• Investigators doing manual data entry
• Miscalibrated equipment
• The use of methods different from the protocol or problems with
subjective measurements.
• The consistency of the trailing or leading digit for variables at a
site compared to that of all the other sites combined.
• Compared using a Cochran-Mantel Haenszel test.
• This assumes that the data is ordinal, which the trailing/leading
digit should be, ranging from 0 to 9.
20
Digit Preference
• For each variable k, let be the distribution of the trailing digit of the
kth variable at the ith site. Then want to test:
where there are s sites involved in the study
• Displayed using:
• Volcano plots of –log10(p-value) versus max percent difference
• Multiplicity adjustments are easily applied in the volcano plot
• Any of the raw p-values at or above the reference line are considered significant when
accounting for the False Discovery Rate (FDR) method of Benjamini and Hochberg.
• Among the rejected null hypotheses from a family or set of multiple tests, the expected
proportion of erroneous rejections is defined as the FDR (typically set at 0.05).
21
ikF ,
skk FFH ,1,0 :
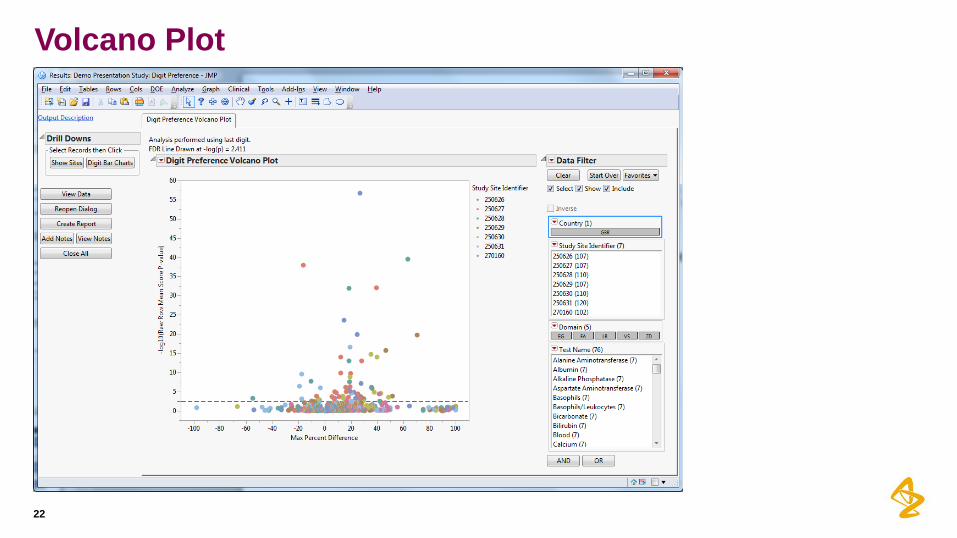
Volcano Plot
22

Digit Preference Histogram
23
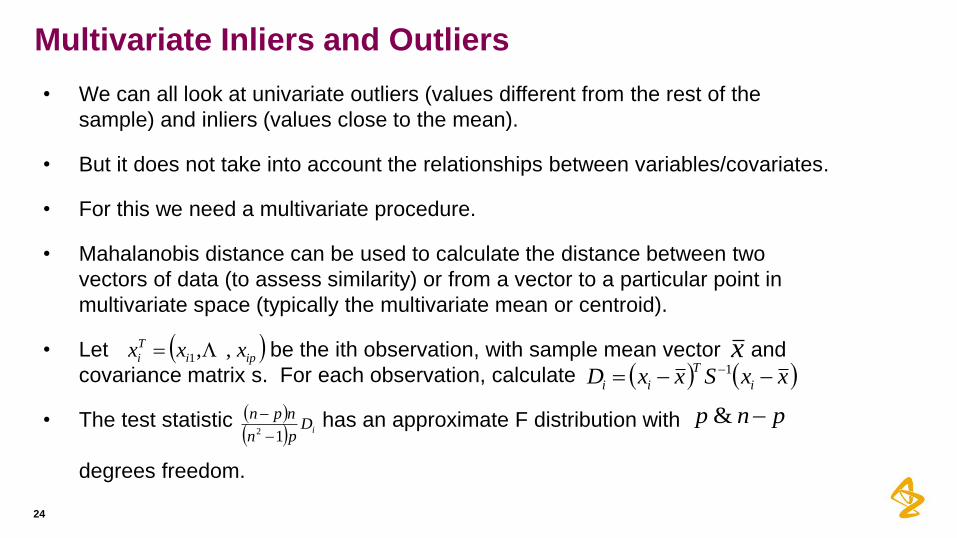
Multivariate Inliers and Outliers
• We can all look at univariate outliers (values different from the rest of the
sample) and inliers (values close to the mean).
• But it does not take into account the relationships between variables/covariates.
• For this we need a multivariate procedure.
• Mahalanobis distance can be used to calculate the distance between two
vectors of data (to assess similarity) or from a vector to a particular point in
multivariate space (typically the multivariate mean or centroid).
• Let be the ith observation, with sample mean vector and
covariance matrix s. For each observation, calculate
• The test statistic has an approximate F distribution with
degrees freedom.
24
ipi
T
i xxx ,,1 x xxSxxD i
T
ii 1
iD
pn
npn
12
pnp &
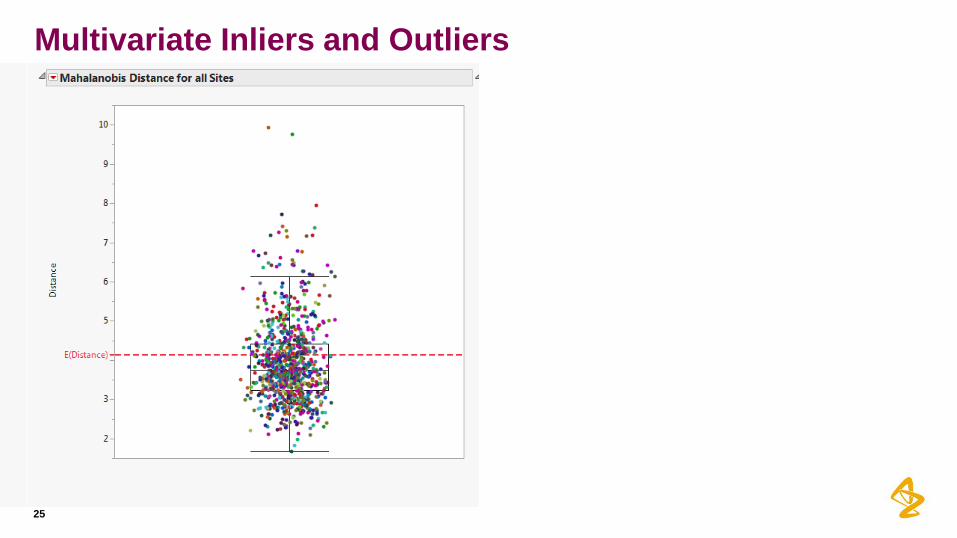
Multivariate Inliers and Outliers
25

Agenda
What is CSM and why use it?
Debunking some of the myths around CSM
What is the regulatory position?
What sorts of tests are carried out?
What is going on externally?
Conclusions
26

What is Being Done Externally?
27

28
Survey by TransCelerate

Survey by TransCelerate
• TransCelerate member companies were sent a survey to collect high level
information specific to fraud and misconduct.
• 18 companies replied
• The three most common tactics used to detect fraud and misconduct are detecting
exists, and detecting duplicate results.
• Other tactics used include variation not as expected, site performance measures,
that patient is unique, and data quality indicators.
29
Strategies Total
Responses
Strategy
Used
Not
Used
All
Studies
Site Monitoring 18 17 1 16
Auditing 17 14 3 14
Data Review Activities 17 14 3 13
Central Monitoring 17 14 3 4
Advanced Statistical Analysis 17 8 9 3
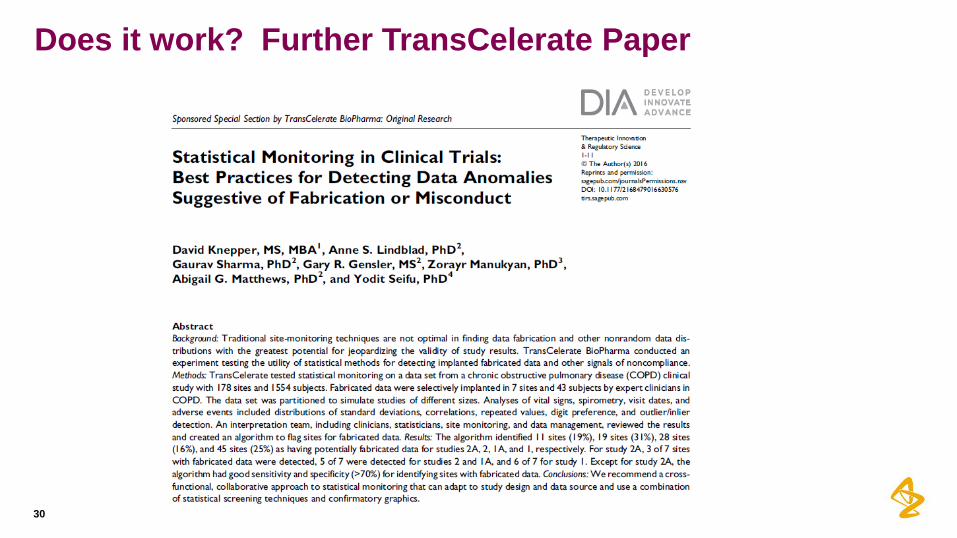
Does it work? Further TransCelerate Paper
30

Preparing the Database
31
• De-identified a large completed COPD database
• 178 sites, 1154 subjects
• Objective data including spirometry data and vital signs
• Replaced real data with fabricated data
• Selected spirometry and vital sign data for fabrication
• Selected 43 subjects at 7 sites for implantation of fabricated data
• Asked independent physicians knowledgeable in COPD to replace missing
real data with plausible fabricated data in a manner likely to evade detection

Four Test Conditions to Mimic Four Studies
32
• Created four data sets mimicking four study conditions
• All sites and all subjects … Large completed study
(178 sites and 1154 subjects)
• Some sites and all subjects … Small completed study
(61 sites and 824 subjects)
• All sites and some subjects … Large study mid-study
(178 sites and 627 subjects)
• Some sites and some subjects … Small study mid-study
(61 sites and 338 subjects)

Statistical Analysis
33
• Sent four data sets to a blinded independent data analysis center
• Asked data analysis center to perform battery of statistical tests to:
• Find all sites with fabricated data
• Identify which data are fabricated
• Evaluate which statistical tests are more or less effective in the four test
conditions
• Domains included
• Enrollment, randomization, visit timing
• Clinical outcomes (spirometry data: FEV1, FVC, VS)
• Safety (Adverse Events)

Results
34
• Results yielded >70% sensitivity and specificity for all but the smallest study (small study,
mid-study condition)
• >70% of sites were detected in three of the four test conditions
• Only 3 of 7 sites were detected in the smallest study
• >79% of subjects were detected across all studies
• Correctly identified >74% of sites without fabricated data
• Correctly identified >70% of subjects without fabricated data
• Overall, >92% of sites and >97% of subjects were correctly flagged

Agenda
What is CSM and why use it?
Debunking some of the myths around CSM
What is the regulatory position?
What sorts of tests are carried out?
What is going on externally?
Conclusions
35

Conclusions
36
• CSM is an integral part of a risk based approach to the over-sight of a study,
however, the utility of Statistical Monitoring can be challenged by small, fast
enrolling studies
• The timing and cadence of Statistical Monitoring activities is dependent on the
volume and rate of change of the dataset
• The Data-Science model, using a multi-disciplinary interpretation team, is
optimal to determine the clinical relevance of the statistical findings
• The field is evolving and still experimental, although the methods have been
used in other industries
• Statistical Monitoring is useful to augment traditional and central monitoring
approaches to detect data quality issues