Centralised Codigestion Plants in Denmark Present ...
43
Centralised Codigestion Plants in Denmark Present situation and future perspectives Kurt Hjort-Gregersen Food and Ressource Economics Institute Denmark
Transcript of Centralised Codigestion Plants in Denmark Present ...

Centralised Codigestion Plants in Denmark
Present situation and future perspectives
Kurt Hjort-Gregersen
Food and Ressource Economics Institute
Denmark

1973-1985
Oil crisis - domestic energy supplyLess dependency on imported fuels – especially oil
1985-1995
Reduce nutrient losses from agricultureRenewable energy
1995-2005
Tool for green house gas reductionSustainability in livestock production
Biogas Plants in Denmark 1973 – 2005
Under changing motivations

Biogas rests on three legs
Biogas
Energy EnvironmentAgriculture

Development of plants
1973-1985
Pilot and farm scale plants – not successful
From 1984 -
Centralised co digestion plants, increasingly successful
2000-2001
Many, now relatively successful, farm scale plants
Future
Centralised Co digestion plants – separation, removal of surplus manure.

Structure and Activities of theBiogas Demonstration and Development Programmes
Investmentgrants
MonitoringProgram
Exchange ofexperience
RD&D
PROGRAM
ACTIVTIES
New plants received up to 40 % of investmentcosts as a government investment grant
Production data and results were registeredcollected and analysed. Economic resultswere collected and analysed
Results were communicated to plant operatorsin working papers, reports and in seminars
General problem fields and speciealdevelopment tasks were pointed outfor closer investigation

Actual situation in Denmark
20 centralised plants in operation
60 farm scale plants in operation
Technically well operating
Economically viable
-but co-digestion is very important.

Centralised AD plants in Denmark
= existing= planed

Centralised Co-digestion Plant ConceptFarms Food processing industry
Manure Organic waste
Electricityand heat


Energy application – Danish plants
Electricity – sold to the public power grid
Heat sold to district heating systems

Biomass resources
Liquid manure – could be different
Organic waste – 0-20 %, depending on the quality
-From food processing industries.
Why is waste important ?
1 tonne liquid manure 5% DM = 20 m3 biogas1 tonne organic waste = 0 – 1000 m3 biogas
And treatment fees

Biomass used in Danish biogasplants
Fat/f lottation sludgeFood w asteFish w asteFruit w asteBrew ery w asteDairySucker industryPlantoil w asteGarverierMucosaMedicin industryEnergy cropsSlaughter w asteOther manureCattle manurePig manure

Manure application
Spread in the fields and used as a fertiliser
nowadays, nomally by using trailing hoses.
(In Denmark)

What's in it for the farmers ?
In general, it makes it easier to comply with environmental restrictions
-9 months storage capacity-Maximum amounts of manure to be spread per hectare
The AD plant company provides
-The needed storage capacity-Redistribution or disposal of surplus manure
Farmers gain cost savings in
-Manure storage-Manure transport-Manure spreading-Fertiliser purchase-In Denmark, 0,7 € per tonne manure treated

Fertilizer plan for nitrogen for 1 ha grass
250250N-requirement, kg170170N in slurry, kg total6040N-utilization, %10268N in slurry, utilized,kg
3420
--
Saved, kgSaved, €
148182
Digested slurry
Cattle slurryPer hectare
Case 1: Case 2:
Mineral fertilizer
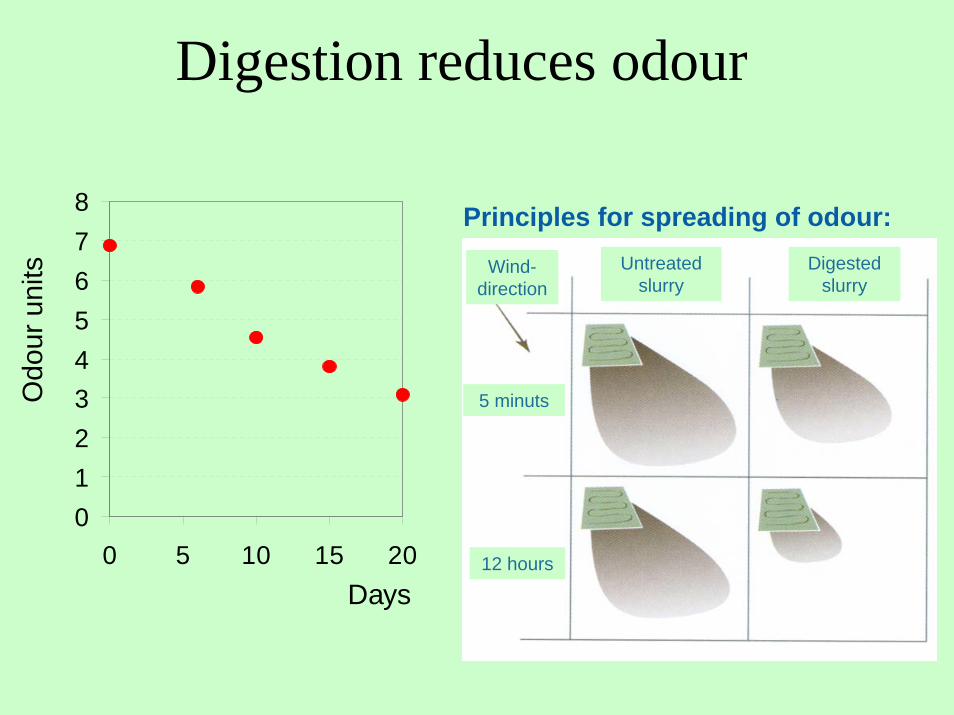
Digestion reduces odour
012345678
0 5 10 15 20Days
Odo
ur u
nits Wind-
directionUntreated
slurryDigested
slurry
5 minuts
12 hours
Principles for spreading of odour:

What's in it for food processing industries
- Cheap and easy way to dispose waste
-Environmental friendliness can be used as argument for marketing purposes
-Improved image
-Easy compliance with requirements on waste recycling
-In Denmark, approx. 17 € per tonne waste

What's in it for energy consumers
-Energy from renewable source at competitive prices
-The satisfaction of environmental energy consupmption

What's in it for the businessman
-Market options for green electricity trade
-Market options for heat from renewable sources
-Construction and operation of extensive technical facilities
-Market for financing and insurance of extensive technical facilities.

What's in it for local society
-New business, new local activity
-New jobs, 1-10 directly associated to the plant
-Related business – who knows ???
-Environmental improvements
-Fresh water systems-Improved hygienic standards due to sanitation of manure
-Less odour nuisances.

What's in it for society in general
-Contribution to meet national environmental targets
-Rural development-New business, new activity in rural areas-New jobs
-Green House Gas reduction-CO2-CH4-N2O
-Improved standards in fresh water systems
-Increased waste recycling
-Improved hygienic standards
-Implementation of green heat and electricity

Green House Gas emission, with and without biogas production
Emission of GreenHouse Gas
CH
4 em
issi
on, C
O2
eqv.
per
Liv
esto
ck u
nit
0
500
1000
1500
2000
Bio
gas
Ref
eren
ce
Pig Cattle
Ref
eren
ce
Bio
gas
Housing
BiogasStore

Economic situation in Danish centralised biogas plants end 2001 Year
of construction
Acceptable
Balance
Under
pressure
Unacceptable
V. Hjermitslev 1984 X Vegger 1985 X Revninge 1989 X Ribe 1990 X Lintrup 1990 X Lemvig 1992 X Hashøj 1994 X Thorsø 1994 X Århus Nord 1995 X Filskov 1995 X Energigr. Jylland 1988/93/96 X Blåbjerg 1996 X Snertinge 1996 X Blåhøj 1997 X Vaarst-Fjellerad 1997 X Nysted 1998 X

1997/98 1998/99 1999/00 2000/01 2001/02
Investments, 1000 € 480 420 143 95 216
Further investments needed after start - up
Snertinge

Snertinge S og F Energiselskab
Sales and operating costs
0100020003000400050006000700080009000
10000
00/01 01/02 02/03 03/04 04/05
1000
kr
TurnoverOperating costs

Investment and treatment costs, 2000 prices.
Per day treatment capacity
Investment costs: 300 m3 550 m3 800 m3
-Biogas Plant 5,5 mil € 7,9 mil € 9,6 mil €-Vehichles 0,4 mil € 0,6 mil € 1 mil €
Inv. Costs per m3 biomasstreated per year 55 €/m3 44 €/m3 37 €/m3
Treatment costs per m3
biomass treated per year-Transport 2,2 €/m3 2,2 €/m3 2,4 €/m3
-Biogas Plant 7,1 €/m3 5,5 €/m3 4,7 €/m3

Per day treatment capacity, m3 biomass/day 300 m3/day 550 m3/day 800 m3/day Break even level of waste admixture
21 %
13 %
10 %
m3 biogas/ m3 biomass Break even biogas yield 34 27 25
Break even levels of waste admixture and biogas yields
Key preconditions:-Gasyield from manure 22 m3 biogas/m3 biomass-Gasyield from waste 75 m3 biogas/m3 biomass-Gate fee (receipt of waste) 50 DKK/m3 waste-Biogas sales price 2 DKK/m3 biogas

Other aspects: Security of energy supply, ..
Socio-economic effectsof the CAD plant
Agriculture
Energy-sector
Industry
Environment
Alternative
Consequences for:
Reference

Monetised ExternalitiesBiogas plant of treatment capacity:
550 ton/day (20% waste)
Monetised externalities: Results based on biogas plant:Socio-economic value per ton biomass Biogas plant size: 550ton/day (20% waste)
Agriculture MonetisedStorage, handling and distribution of liquid manure:
Storage savings for liquid manure 0.13 EUR/ton liquid manureTransport savings in agriculture 0.07 EUR/ton liquid manure
Value of improved manurial value (NPK) 0.73 EUR/ton degassed Value of reduced obnoxious smells 0.67 EUR/ton liquid manure
IndustrySavings related to organic waste treatment 16.82 EUR/ton org. waste
Environment Value of GHG reduction (CO2, CH4, N2O-reduction) 3.01 EUR/ton degassed
Value of reduced N-eutrophication of ground water: 0.39 EUR/ton degassed Liquid manure 0.37 EUR/ton liquid manureOrg. waste spread on farm land in reference case 1.64 EUR/ton org. wasteOrg. waste not spread on farm land in reference ca -3.03 EUR/ton org. waste

Annual costs and benefitsSocio-economic results Results based on biogas plant:Annual costs and benefits Biogas plant size: 550ton/day (20% waste)
Result 0 Result 1 Result 2 Result 3Costs (levellised annuity) mio.EUR/yearInvestments, operation and maintenance: 1.481 1.481 1.481 1.481
Benefits (levellised annuity) mio.EUR/year
Energy production:Biogas sales 0.526 0.526 0.526 0.526Electricity sales 0.061 0.061 0.061 0.061
Agriculture:Storage, handling and distribution of liquid manure 0.032 0.032 0.032Value of improved manurial value (NPK) 0.186 0.186 0.186Value of reduced obnoxious smells 0.097
Industry:Savings related to organic waste treatment 0.675 0.675 0.675
Environment:Value of GHG reduction (CO2, CH4, N2O-reduction) 0.605 0.605Value of reduced N-eutrophication of ground water: 0.079 0.079
Sum: 0.588 1.481 2.165 2.262
Result 0 Result 1 Result 2 Result 3mio.EUR/year
Surplus as annuity: Benefits - costs -0.893 0.000 0.684 0.781

Reduced Green House Gas emissions
90 kg CO2 EQ per tonne biomass treated
Reduced Nitrogen leaches to fresh water systems
0,11 kg N per tonne biomass treated
Estimated Environmental Benefits
under Danish Conditions

Conclusions
Economically and socio – economically feasible when:
-Organic waste is included, and
-Environmental and economic externalities are takeninto account
Very cost-efficient as a tool for Green House Gas reduction
Beneficial for related farmers
Creates jobs and local activity

So…
We have the perfect technology
We have relatively good preconditions
…….Why does nothing happen ??

Barriers
Reduced public acceptance – fear of smell
difficult to find sites for construction of plants
Uncertainty about economic performance
due to reduced average electricity price
uncertainty about waste supplies
Lack of incentives for farmers
wish to get rid of surplus manure

Farms
On farm separation
Transportsystem
Pretreatment
Biogas plant
posttreatment
Storage tanks
Spreading and utilof manure
Long distance transport
Chem. fertiliser
Present reseacrch field:
Plant concepts of the future