Central schemes of NYKS - Planning Commission / MANAGEMENT AUDIT OF CENTRAL SCHEMES OF NYKS (NEHRU...
107
EVALUATION / MANAGEMENT AUDIT OF CENTRAL SCHEMES OF NYKS (NEHRU YUVA KENDRA SANGATHAN) in ASSAM, BIHAR, ORISSA, WEST BENGAL and MANIPUR DRAFT REPORT Submitted to Planning Commission New Delhi. Submitted by VISION FOUNDATION FOR DEVELOPMENT MANAGEMENT C-16,III Floor, Amar Colony Market, Lajpat Nagar-IV, New Delhi-110024. Ph : 6434214, Telefax : 6213930. Email : [email protected] January,2003
Transcript of Central schemes of NYKS - Planning Commission / MANAGEMENT AUDIT OF CENTRAL SCHEMES OF NYKS (NEHRU...

EVALUATION / MANAGEMENT AUDIT
OF
CENTRAL SCHEMES OF NYKS (NEHRU YUVA KENDRA SANGATHAN)
in
ASSAM, BIHAR, ORISSA, WEST BENGAL and MANIPUR
DRAFT REPORT
Submitted to
Planning Commission
New Delhi.
Submitted by
VISION FOUNDATION FOR DEVELOPMENT MANAGEMENT
C-16,III Floor, Amar Colony Market, Lajpat Nagar-IV,
New Delhi-110024.
Ph : 6434214, Telefax : 6213930. Email : [email protected]
January,2003

VISION
TABLE OF CONTENTS
ACKNOWLEDGEMENT
EXECUTIVE SUMMARY
1.0 BACKGROUND 1
1.1 Nehru Yuva Kendra Sangathan ( NYKS) – an introduction 1
1.1.1 Establishment 1
1.1.2 Fields of operation. 1
1.2 Objectives of NYKS 1
1.2.1 Development 2
1.2.2 Awareness 2
1.2.3 Organisation 2
1.2.4 Channelization 2
1.3 Programmes implemented at all India level 2
1.3.1 Regular programmes 3
1.3.2 District level Co-ordination Programmes 5
1.3.3 Programmes conducted by Foreign Agencies 6
1.4 Organizational set-up of NYKS 6
1.4.1 Four tier set up 6
1.4.2 National Level 6
1.4.3 Zonal level 7
1.4.4 Regional level 7
1.4.5 District level 7
1.4.6 Information Development and Resource Agencies 7
1.5 Management Information System in NYKS 7
2.0 OBJECTIVE & METHODOLOGY FOR THE STUDY 9
2.1 Main Object 9
2.2 Parameters of study 9
2.2.1 Impact 9
2.2.2 Process ( Audit) 9
2.3 Methodology for the study 10
2.3.1 Planning and fieldwork 10
2.4 Geographical Coverage 10
2.5 Sampling Scheme 10
2.5.1 Universe 10
2.5.2 Sampling technique and sample size 10
2.6 Collection of Information 12
2.7 Analysis of Information 12

VISION
3.0 FINDINGS OF THE STUDY 13
3.1 Profile of the Respondents 13
3.2 Programmes and Activities of NYKS / Impact-I 25
3.2.1 General 25
3.2.2 Organizing the programmes 26
3.2.3 Perceived Benefit out of the NYKS Programmes 29
3.2.4 Awareness Programme on various issues 31
3.2.5 Perceived Change in community due to awareness
Generation Programmes 36
3.2.6 Major Achievements/Developments through NYKS 39
3.3 Programme Implementation / Process 40
3.3.1 Implementing Agencies 40
3.3.2 Number of NYKS Activities carried out 41
3.3.3 Incentives provided 42
3.3.4 Number of Development Projects undertaken 45
3.3.5 Women participation 46
3.4 Programmme effectiveness / Impact-II 49
3.4.1 Visit of NKYS officials to the Districts 49
3.4.2 Perceived effect of visits on the programme 52
3.4.3 Public Participation 54
3.4.4 Relationship between NYKS official and
the beneficiaries & community 57
3.4.5 Ratings of implementation of the Programme
of NYKS 61
4.0 CONCLUSIONS & RECOMMENDATION 72
4.1 Summary of findings 72
4.2 Analysis - (SWOT analysis ) 76
4.3 Recommendations 77
Appendix I Regular Programmes undertaken in NYKS
Appendix II Organisation Chart
Appendix III District-wise Percentage of Ratings by Informants as per Rating
points.

List of Tables Table 2.1 Distribution of informants over the districts selected for the study. 12 Table 3.1 State wise representation of genders among the information. 13 Table 3.2 Gender distribution of the informants in the Sixteen selected districts 14 Table 3.3 Percentage Distribution of Informants between The social groups in each of the six states 16 Table 3.4 Age group wise Percentage distribution of the informants within each state 17 Table 3.5 Percentage distribution of informants with in each
state according to their period of association with NYKS 19 Table 3.6 State wise enrollment details 20 Table 3.7 Distribution of each type of enrollment as per their
period of association with NYKS activities. 22 Table 3.8 Distribution of informants in each state according to their motivation agents 23 Table 3.9 Age wise distribution of the informants motivated by each of the agencies 25 Table 3.10 District wise percentage of villages where the
programmes where organized. 27 Table 3.11 Percentages of villages in each of the states Where NYKS programmes are arranged. 29 Table 3.12 State wise number of informants benefited 30 Table 3.13 District wise benefited in the states of Bihar, Jharkhand and Orissa. 31 Table 3.14 Percentage of villages in each State where Awareness generation programmes have
been organized as per area of intervention 34 Table 3.15 Percentage of villages in each district where Awareness generation programmes have
been organized as per area of intervention 35 Table 3.16 Extent of significant changes due to awareness Programmes of NYKS(within state) 37 Table 3.17 Extent of significant changes due to awareness Programmes of NYKS(within district) 38 Table 3.18 Level of achievements in various major areas 39 Table 3.19 Details of implementing agencies of NYKS Programmes 40 Table 3.20 Percentage of villages as per number times an Activity was carried out 41 Table 3.21 The extent to which incentives were provided To the participants 43 Table 3.22 The state wise position of payment of incentives To the participants in the programmes 43 Table 3.23 District wise position regarding payment of Incentives. 44 Table 3.24 The extent of Development Programmes Undertaken with the support of NYKS 46 Table 3.25 Level of participation women in the programmes 47

Table 3.26 State wise level of women participation In the programmes 47 Table 3.27 District wise level of participation of Women in The Programmes 48 Table 3.28 Frequency of visits of officials of NYKS to
The Districts. 50 Table 3.29 State wise position of visits by NYKS officials to the Districts. 50 Table 3.30 District wise details of visit by NYKS officials 51 Table 3.31 State wise picture of effectiveness of the visit of the NYKS officials 53 Table 3.32 District effectiveness of the visits of NYKS officials 54 Table 3.33 State wise level of public participation in the Programmes of NYKS. 55 Table 3.34 District wise level of public participation in the Programmes of NYKS 56 Table 3.35 Rating of the relationship between NYKS official and the Beneficiaries & the community 58 Table 3.36 Level of relationship with in each state between NYKS officials and the beneficiaries and the Community 59 Table 3.37 Level of relationship with in each district between NYKS Officials and the beneficiaries and the community 60 Table 3.38 Ratings of important programmes of NYKS 62 Table 3.39 Percentage of ratings of implementation of Youth club Development programmes in each of the states. 63 Table 3.40 Percentage of ratings of implementation of Vocational
Training programmes in each of the state 64 Table 3.41 Percentage of ratings of implementation of Awareness Generation programmes in each of the states. 64 Table 3.42 Percentage of ratings of implementation of work Camps in each of the states. 65 Table 3.43 Percentage of ratings of implementation of Sports Promotion Programme in each of the states. 66 Table 3.44 Percentage of ratings of implementation of cultural Programme in each of the states. 67 Table 3.45 Percentage of the ratings of implementation of Adventure promotion in each of the states 68 Table 3.46 Percentage of the ratings of implementation of Celebration of national days in each of the states Table 3.47 Percentage of the ratings of implementation of Adventure promotion in each of the states 68
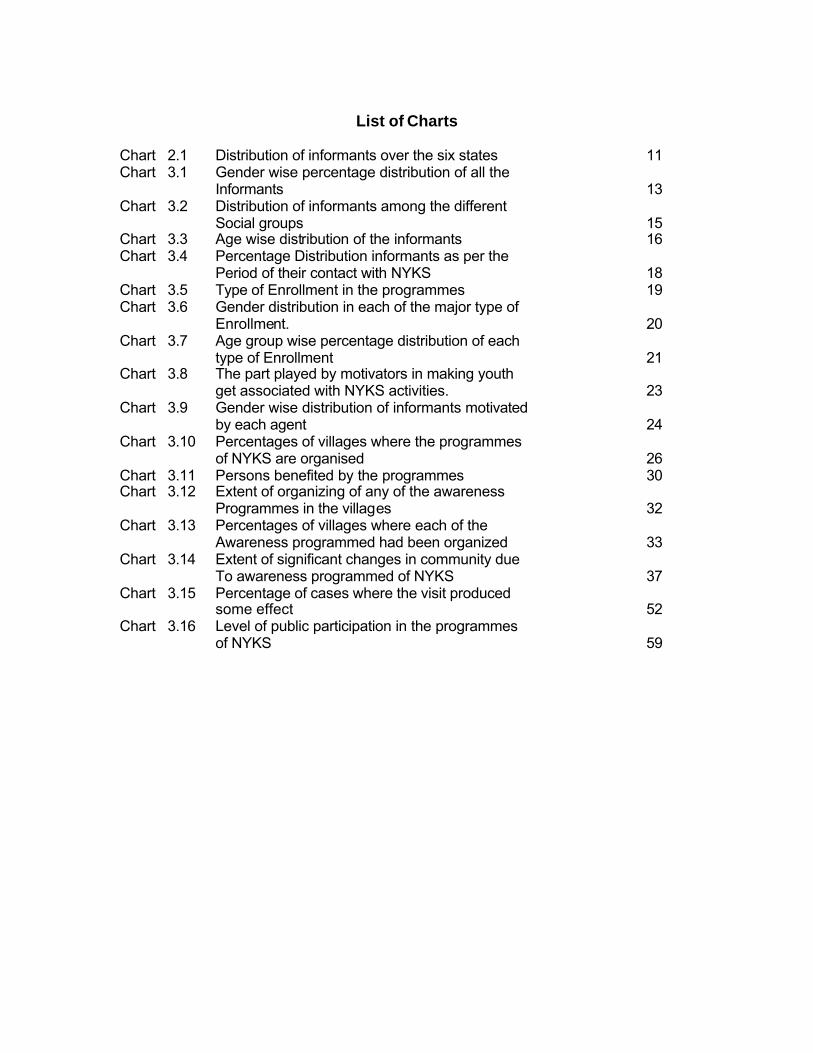
List of Charts
Chart 2.1 Distribution of informants over the six states 11 Chart 3.1 Gender wise percentage distribution of all the
Informants 13 Chart 3.2 Distribution of informants among the different Social groups 15 Chart 3.3 Age wise distribution of the informants 16 Chart 3.4 Percentage Distribution informants as per the Period of their contact with NYKS 18 Chart 3.5 Type of Enrollment in the programmes 19 Chart 3.6 Gender distribution in each of the major type of Enrollment. 20 Chart 3.7 Age group wise percentage distribution of each type of Enrollment 21 Chart 3.8 The part played by motivators in making youth get associated with NYKS activities. 23 Chart 3.9 Gender wise distribution of informants motivated by each agent 24 Chart 3.10 Percentages of villages where the programmes of NYKS are organised 26 Chart 3.11 Persons benefited by the programmes 30 Chart 3.12 Extent of organizing of any of the awareness Programmes in the villages 32 Chart 3.13 Percentages of villages where each of the
Awareness programmed had been organized 33 Chart 3.14 Extent of significant changes in community due To awareness programmed of NYKS 37 Chart 3.15 Percentage of cases where the visit produced some effect 52 Chart 3.16 Level of public participation in the programmes of NYKS 59

VISION
ACKNOWLEDGEMENT
We are thankful to the officials of, Planning Commission and the Ministry of Youth and Sports,
Govt. of India, New Delhi, for giving us an opportunity to conduct the study titled,
” Evaluation/Management Audit of Central schemes of NYKS ".
At the same time, we also take this opportunity to thank the officials of NYKS at New Delhi and all
the State and Regional Offices covered by us. We would specifically like to thank Shri V
Muraleedharan, Director General, Shri R. K. Mishra, former Director General, Shri S.K.Thakur,
Director (F,B & A), Shri A.K. Verma, Asst. Director (EMI), Shri V. K Shukla, Dy. Director(Audit),
Shri Labh Singh,former Zonal Director for their time to provide valuable inputs to the
researchers, which helped us conceptualize and draw more meaning out of the findings of the
primary information collected from the fieldwork .
Shri A. Kachhap, Dy. Adviser, Planning Commission deserves special thanks for giving various
inputs during the course of the study and clearly specifying the areas to be focussed, which made
our task simpler.
We are also thankful to all the Respondents from the States, who shared their experiences with
development initiatives, which provided us with the insights, so valuable for this report.
We are thankful to all the Youth Club members, Volunteers and Opinion leaders at the
district, block and village level, who provided their time, information and insights to our
Researchers, which forms the backbone of this report and without whose co-operation, the study
could not have been completed.
Prof. S. Ranjan Mohapatra
Project Director

VISION
Executive Summary
Nehru Yuva Kendra Sangathan (NYKS) an autonomous organization under Department of Youth Affairs &
Sports, Ministry of HRD, GOI and the largest grass-root level organization in the Asia Pacific region, catering
to the developmental needs non-student rural youth in the age group of 15-35 years, with the objective of
mobilizing and organizing rural youth who are not attending the schools and colleges who spend most of
their time almost without any contribution to the socio-economic development of the nation and to generate
greater awareness and interest among them for national development programmes and channelise hither to
untapped manpower of rural youth for the development of the nation. The programmes implemented by
NYKS can be broadly grouped into three categories, namely, Regular Programmes, District level co-
ordination Programmes and Programmes conducted by Foreign Agencies. NYKS has a four tier
organizational structure, National level, Zonal level, Regional level and District level.
OBJECTIVE & METHODOLOGY FOR THE STUDY
The main objective for the study is to make an evaluation as well as to carry out an audit of the
Central Schemes of NYKS implemented in Assam. Bihar, Orissa, West Bengal, and Manipur, which
involved assessment of the process of implementation of all the 9 centrally funded programmes,
assess the resultant impact of each of the programmes on the target group, analysis of the findings and
recommend strategies/ action Plans for improving the impact and ensuring better productivity of the
investment made in case of these programmes.
METHODOLOGY FOR THE STUDY
Predominantly Qualitative Research Methods like using In-depth-Interviews, Group Discussions and
Observation, were adopted , selecting key respondents based on an exploratory research study conducted
before the field study. The study covered the states of Assam, Erstwhile Bihar, which includes the
present State of Jharkhand, Orissa, West Bengal and Manipur. The 744 informants were selected from
over 16 districts in the six States in addition, Zonal Directors and Youth Coordinators of each District
were also interviewed. Further 64 Focus Group Discussions were also conducted with active participation
of the youth club members and villagers. The primary and secondary data collected were thoroughly
analyzed using appropriate technology and tools .

VISION
SUMMARY OF FINDINGS
1. Youth Club played a major role in enrolling the youth for the various programmes. Youth Club's role in
enrolling the members was best in Orissa and worst in Assam.
2. The Block Coordinators of NYKS played the best roll in motivating the youth to get associated with NYKS
and the local NGOs played the least role.
The leading role players in the different States were as follows
♦ Block coordinators in Assam and Manipur
♦ Youth leaders in Bihar, Jharkhand & Orissa and
♦ NGOs in West Bengal
The poor players in the various States are listed below:
♦ Youth leaders in Assam
♦ Social workers and local NGOs in Bihar & Jharkhand
♦ National Service Volunteers in Orissa
♦ Block coo rdinator of NYKS in West Bengal and
♦ National Service Volunteers, Youth Leaders and Local NGOs in Manipur.
3. The programmes on awareness of social issues was arranged in maximum number
of villages where as Seminars and workshops were arranged in minimum number of villages.
4. The programmes that were arranged in at least 50% of the villages in a district are
♦ Programmes for Income Generation work Camps, Seminars and Workshops in Vaisali
♦ Youth Club Development and Work Programmes in Muzzafarpur
♦ Awareness Generation on relevant social issues and youth clubs development in Gumla.
♦ Employment Generation, Seminar Workshops and Sports promotions in Hazaribagh.
♦ Employment Generation/Income Generation for the Rural Youth in Khurda.
♦ Income Generation in Koraput.
♦ Employment Generation and Income Generation in Imphal.
♦ Employment Generataion, Income Generation Seminars and Workshops and Sports promotion
in Nalbari.
♦ Youth Club Development, Work Camps, Seminars and Workshops and Sports promotion in
Kamrup.
♦ Employment Generation, Income Generation and Seminars and Workshops in Silchar.
VISION
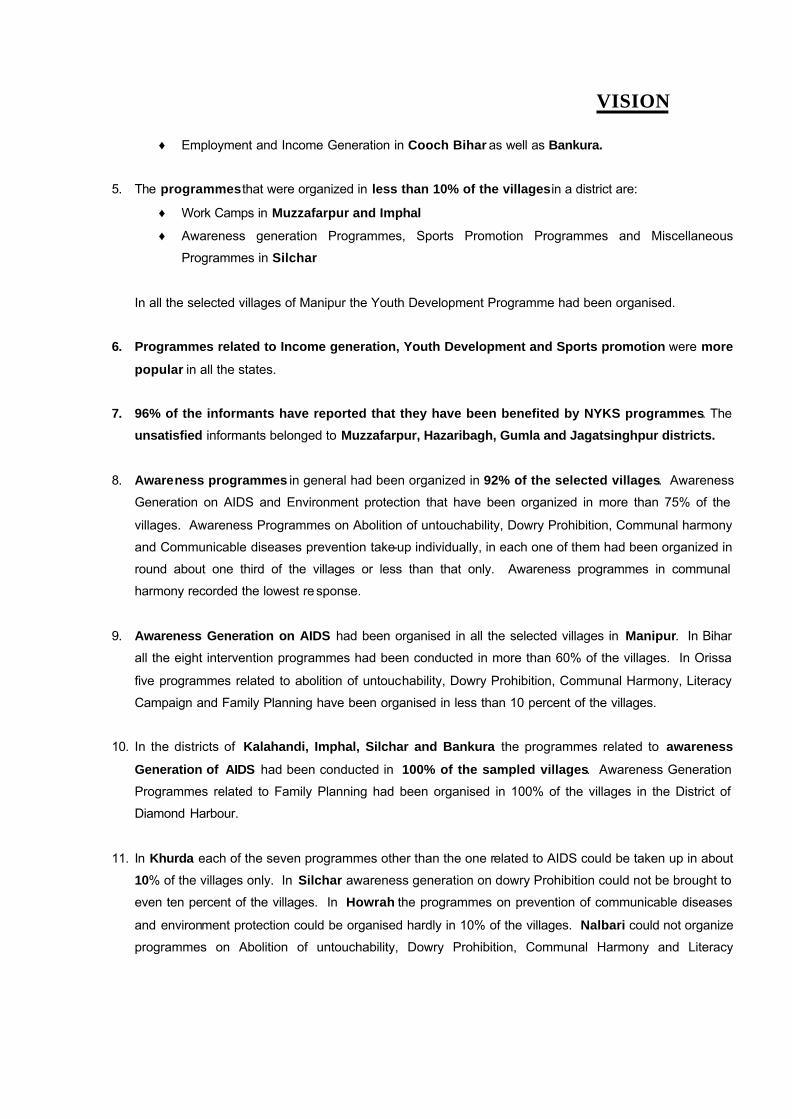
♦ Employment and Income Generation in Cooch Bihar as well as Bankura.
5. The programmes that were organized in less than 10% of the villages in a district are:
♦ Work Camps in Muzzafarpur and Imphal
♦ Awareness generation Programmes, Sports Promotion Programmes and Miscellaneous
Programmes in Silchar
In all the selected villages of Manipur the Youth Development Programme had been organised.
6. Programmes related to Income generation, Youth Development and Sports promotion were more
popular in all the states.
7. 96% of the informants have reported that they have been benefited by NYKS programmes. The
unsatisfied informants belonged to Muzzafarpur, Hazaribagh, Gumla and Jagatsinghpur districts.
8. Awareness programmes in general had been organized in 92% of the selected villages. Awareness
Generation on AIDS and Environment protection that have been organized in more than 75% of the
villages. Awareness Programmes on Abolition of untouchability, Dowry Prohibition, Communal harmony
and Communicable diseases prevention take-up individually, in each one of them had been organized in
round about one third of the villages or less than that only. Awareness programmes in communal
harmony recorded the lowest re sponse.
9. Awareness Generation on AIDS had been organised in all the selected villages in Manipur. In Bihar
all the eight intervention programmes had been conducted in more than 60% of the villages. In Orissa
five programmes related to abolition of untouchability, Dowry Prohibition, Communal Harmony, Literacy
Campaign and Family Planning have been organised in less than 10 percent of the villages.
10. In the districts of Kalahandi, Imphal, Silchar and Bankura the programmes related to awareness
Generation of AIDS had been conducted in 100% of the sampled villages. Awareness Generation
Programmes related to Family Planning had been organised in 100% of the villages in the District of
Diamond Harbour.
11. In Khurda each of the seven programmes other than the one related to AIDS could be taken up in about
10% of the villages only. In Silchar awareness generation on dowry Prohibition could not be brought to
even ten percent of the villages. In Howrah the programmes on prevention of communicable diseases
and environment protection could be organised hardly in 10% of the villages. Nalbari could not organize
programmes on Abolition of untouchability, Dowry Prohibition, Communal Harmony and Literacy

VISION
Campaign and the programmes related to Family Planning was witnessed only in less than 10 of its
villages. In Bankura Programmes on Communal harmony, Literacy Campaign and Family Planning
could not be organised and the programmes on prevention of communicable diseases could be
organised only in 5% of the villages. Jagatsinghpur had been the worst only two types of programmes
related to awareness of AIDS and Environment Protection could be organised that too in 10% and 5% of
the villages respectively.
12. Nearly in 91% of the villages the awareness generation programmes have made significant changes in
the community as envisaged by NYKS. West Bengal and Manipur are the only two states where every
informant has said that the awareness programmes have brought in significant changes as has
been envisaged by NYKS.
13. Jagatsinghpur is the only district where not even one informant has expressed that the awareness
programmes have brought any significant changes as envisaged by NYKS.
14. Substantial change in the level of achievements / developments in any of the development
programmes of NYKS had been observed in less than 17% of the cases.
15. Registered Youth Clubs had played a major role as an implementing agency. Local bodies other than
the Youth Club and NGOs have operated in less than one fourth of the selected villages.
16. The only activity which has been repeated more then 5 times in about one fourth of the villages is
Cultural Programme. In about 40% of the villages the adventure Promotion Programmes and the
seminars and workshops have not been repeated at all.
17. In 90 % of the selected villages the incentives have been provided. In Assam and Manipur, and in
the districts of Kalahandi, Khurda, Nalbari, Kamrup, Silchar, Howra and Bankura the incentives have
been paid in 100% of the cases. In Bihar in as many as 31% of the villages the incentives have not been
paid. The situation is alarming and may need immediate attention in the case of Jagatisinghpur since in
that district in as many as 58% of the cases the incentives have not been paid.
18. Participation of women was low in about one fourth of the selected villages. In Manipur the
participation of women was moderate in 100% of the cases. Insignificant participation was recorded in
some of the cases only in Bihar and Jharkhand. In Orissa the participation was High in 100% of the
cases in Jagatsinghpur.
VISION
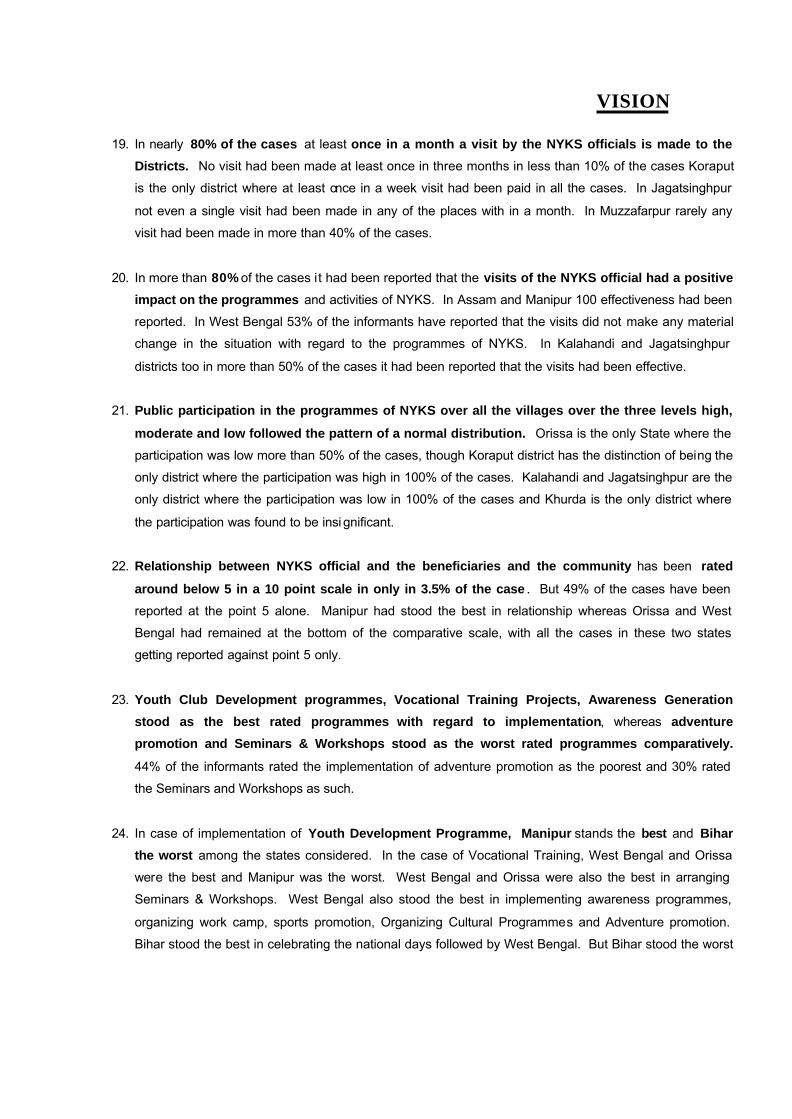
19. In nearly 80% of the cases at least once in a month a visit by the NYKS officials is made to the
Districts. No visit had been made at least once in three months in less than 10% of the cases Koraput
is the only district where at least once in a week visit had been paid in all the cases. In Jagatsinghpur
not even a single visit had been made in any of the places with in a month. In Muzzafarpur rarely any
visit had been made in more than 40% of the cases.
20. In more than 80% of the cases it had been reported that the visits of the NYKS official had a positive
impact on the programmes and activities of NYKS. In Assam and Manipur 100 effectiveness had been
reported. In West Bengal 53% of the informants have reported that the visits did not make any material
change in the situation with regard to the programmes of NYKS. In Kalahandi and Jagatsinghpur
districts too in more than 50% of the cases it had been reported that the visits had been effective.
21. Public participation in the programmes of NYKS over all the villages over the three levels high,
moderate and low followed the pattern of a normal distribution. Orissa is the only State where the
participation was low more than 50% of the cases, though Koraput district has the distinction of being the
only district where the participation was high in 100% of the cases. Kalahandi and Jagatsinghpur are the
only district where the participation was low in 100% of the cases and Khurda is the only district where
the participation was found to be insi gnificant.
22. Relationship between NYKS official and the beneficiaries and the community has been rated
around below 5 in a 10 point scale in only in 3.5% of the case . But 49% of the cases have been
reported at the point 5 alone. Manipur had stood the best in relationship whereas Orissa and West
Bengal had remained at the bottom of the comparative scale, with all the cases in these two states
getting reported against point 5 only.
23. Youth Club Development programmes, Vocational Training Projects, Awareness Generation
stood as the best rated programmes with regard to implementation, whereas adventure
promotion and Seminars & Workshops stood as the worst rated programmes comparatively.
44% of the informants rated the implementation of adventure promotion as the poorest and 30% rated
the Seminars and Workshops as such.
24. In case of implementation of Youth Development Programme, Manipur stands the best and Bihar
the worst among the states considered. In the case of Vocational Training, West Bengal and Orissa
were the best and Manipur was the worst. West Bengal and Orissa were also the best in arranging
Seminars & Workshops. West Bengal also stood the best in implementing awareness programmes,
organizing work camp, sports promotion, Organizing Cultural Programmes and Adventure promotion.
Bihar stood the best in celebrating the national days followed by West Bengal. But Bihar stood the worst

VISION
in the case of awareness programmes. Assam remained at the bottom in organizing Workshops, Sports
promotion organizing cultural programmes, Adventure promotion Celebration of National Days and
arranging Seminars & Workshops. Jharkhand showed the poor performance in promotion of sports.
25. At District level Kalahandi was the best in implementation youth Development programmes and
Gumla the worst. Kalahandi, Koraput, Cooch, Bihar and Bankura scored excellent rating for
implementation of vocational training and Gumla the poorest. Diamond Harbour, Cooch Bihar and
Bankura and Khurda stood the best districts in executing awareness programmes and Jagatisinghpur
stood the worst. Cooch Bihar and Howarh were on top in arranging the work Camps. All the districts of
West Bengal were rated high in sports promotion. Nalbari and Kamrup were at the bottom in arranging
work camps as well as in sports promotion. All the districts other than Howarh of West Bengal were the
best in arranging cultural programmes whereas Gumla and Kamrup shoed the poorest performance.
Diamond Harbour is the only district, which has been rated as excellent in adventure promotion where as
in Gumla Kamrup and Nalbari all the informants have rated the performance as at the lowest point of the
measuring scale. Vaisali, Muzzafarpur, Kalahandi, Cooch Bihar and Howarh stood comparatively on a
higher pedestal with regarding celebration of National holidays whereas Kamrup is the only District
where all the informants ranked the performance at the lowest point of the scale. Cooch Bihar and
Howarh and Khurda were the best in arranging Seminars & Workshops and Gumla and Kamrup were
the worst.
26. The Programme Planning, Budgeting and implementation Process of NYKS is found to be more
PRECEDENCE oriented than NEED BASED,
27. The established procedures for planning and implementation involving programme design and
implementation guid elines for the regular programmes are being implemented year after year with
modified budgets without major fundamental CHANGE in the APPROACH / MINDSET of the
organisaton.
28. CHANGE is inevitable for any organisation in the area of STRATEGY, STRUCTURES and SYSTEMS
for conducting itself to achieve the desired goals in CHANGED CIRCYMSTANCES.

VISION
1
1.0 BACKGROUND
1.1 NEHRU YUVA KENDRA SANGATHAN (NYKS)- AN INTRODUCTION
1.1.1 Establishment
Nehru Yuva Kendra Sangathan (NYKS) is an autonomous organization under Department of
Youth Affairs & Sports, Ministry of Human Resource Government of India. It is the largest grass-
root level organization in the Asia Pacific region, catering to the developmental needs of nearly
more than 8 million non-student rural youth in the age group of 15-35 years, the beneficiaries
being enrolled through village based Youth Clubs and Mahila Mandals, such Clubs and Mandals
numbering more than 1.83 lakh and distributed all over India.
1.1.2 Fields of operation
The Fields in which NYKS is carrying out its operations for the development of the rural youth
mainly relate to Education, Training, Employment Promotion, Income Generation, Self-
employment, Enterprise Creation, Financial Assistance etc. In addition to the above, NYKS
also undertakes various awareness programmes for the overall development of the rural
community. These awareness programmes embrace the fields of Health and Family Welfare,
Preservation and Enrichment of the Eco-System, Adult Literacy, People's Empowerment, Social
Welfare, Eradication of Social Evils and Superstition, AIDS, Drug and Alcohol Abuse, Maintaining
Dignity of Labour, and other developmental works. These awareness programmes lay their
emphasis on value, vision and voluntary action.
1.2 OBJECTIVES OF NYKS
The major objective of NYKS is to mobilize and organize rural youth who are not attending the
schools and colleges who spend most of their time almost without any contribution to the socio-
economic development of the nation and to generate greater awareness and interest among
them for national development programmes and channelise hither to untapped manpower of rural
youth for the development of the nation
The major objective can be broadly be classified into four groups as follows
(i) bringing all round Development
(ii) creating an awareness among the rural youth

VISION
2
(iii) developing organizations for the youth to participate
(iv) Find ways to channelise the youth energy for the welfare of the nation.
1.2.1 Development
NYKS is basically interested in bringing out an all round development of the nation in the
various fields such as social, economic, cultural, educational and political and to being an
upliftment of the youth especially the rural uneducated ones through the harmonious participation
of all concerned.
1.2.2 Awareness
NYKS is working for arousing consciousness among non-student rural youth to enable them have
a clear understanding of various problems and social evils that are confronting the nation and the
society as a whole such as atrocities on women, drug abuse, population explosion, environmental
degration, AIDS, illiteracy, etc.
1.2.3 Organization
NYKS helps in the formation of Youth Clubs at village level, arranging for group activities among
the youth, organizing community work camp and creating circumstances for the democratic
leadership development etc., so that the non-student rural youth could be employed as a catalyst
for social change and they may be ultimately prepared to meet the various challenges facing the
Nation and work for the National Development.
1.2.4 Channelization
The energy of the rural youth especially those who are not educated is practically getting wasted,
NYKS aims to tap the enormous unorganized potential of non-student rural youth in a manner
that can bring forth avenues for their own total development and channelise their energies in the
most constructive manner for the welfare of the Nation.
1.3 PROGRAMMES IMPLEMENTED AT ALL INDIA LEVEL
The major programmes in which NYKS involves itself can be broadly grouped into three
categories, namely,
(i) Regular Programmes

VISION
3
(ii) District level co-ordination Programmes
(iii) Programmes conducted by Foreign Agencies
1.3.1 Regular Programmes
Until recently NYKS was conducting 9 different types of regular programmes. With effect from the
year 2002-2003, based on the recommendations from the District and State Headquarters one
more type of regular programmes under the caption “ Local Need Based Programmes” is being
taken up as part of the regular programmes of NYKS. The other 9 types of programmes are
narrated below
(i) Youth Club Development Programmes
The Major objectives of this programmed is to Mobilize rural youths to establish Youth
Club movement to bring awareness and create a determination in their minds to change
the rural lives to the better by fighting against poverty and other social evils. These
programmes aim to develop leadership qualities among rural youths and to develop self-
respect, pride and feeling of nationalism, solidarity and unity among them. Through these
programmes the rural youth eventually become self-reliant through mutual co-operation
and spirit of services
(ii) Vocational Training Programmes
The manpower in the form of rural uneducated youth is practically wasted as many of the
rural youth do not possess the requisite skill for the developmental activities and
whatever skill some of them may possess is of primitive stage and quite out dated. The
vocational Training Programmes imparting the rural uneducated youth the necessary skill
and improving the skill if any they already possess. Thus these programmes provide
opportunity for them to learn new skills and increase their productivity. This in turn helps
them to earn their livelihood or supplement their income. These programmes are also
aimed at tackling the problem of unemployment by equipping the rural uneducated youth
for taking up income generating projects based on locally available raw materials,
resources and markets and thus become self employed. Emphasis is laid here on skill
that are locally needed and could be marketed such as those relate to agricultural
practices, repair and maintenance of agricultural implements, dairy, poultry, sheep
rearing. Sericulture. Floriculture tailoring, carpentry, shoe making handicrafts, gadgets
repair agro based industrial activities etc.,
VISION
4
(iii) Awareness Campaigns
The main aim of NYKS arranging the Awareness Camps is to address the immediate
problems or issues of social importance at the local level such as Literacy, Life style,
Gender Issues, Sanitation, Disaster, child right, health and family welfare etc., that affect
the life of rural sector and the village communities in general and the youth in particular.
(iv) Work Camps
NYKS regularly arranges the work camps. These camps are intended to give the rural
uneducated youth an opportunity to gain Experience in Implementation of various
developmental works in their own village communities. These camps by its very nature
also provide an opportunity to the rural uneducated youth to acquire leader ship skills as
they involve coordination, group discussion shram dhan and cultural and social activities.
(v) Sports Promotion Programmes
The strength energy and ability of the rural youth have not been properly tapped to have
some gain in the field of sports. NYKS’ Sports Promotion Programmes aim at
establishing sports as part of daily ways of life, as a part of Village culture and national
culture and to improve the spirit of sportsmanship in the rural scenario. These
programmes specifically pay attention to popularize rural sports, which require minimum
infrastructure, equipment and finance.
(vi) Workshops and Seminars
The workshops and seminars are normally arranged before the celebration of selected
national and international days or weeks.
The objective, philosophy spirit and history behind these days or weeks are discussed in
these seminars and workshops. These4 programmes besides enhancing the awareness
of cultural heritage and history brings cohesiveness among the youth to enable them to
identify themselves with the main stream of the nation and the world

VISION
5
(vii) Cultural Programmes
These programmes are aimed at preserving cultural heritage and disseminating
messages on important national and international issued through the media of folk art
and culture. Emphasis is given here to give importance to local festivals of communities
in the villages to make them feel at home. This is aimed at educating and motivating
people on important developmental issues relevant to the village in particular and the
nation in general.
(viii) Celebration of National and International days and weeks
Each NYK celebrates a minimum of 12 important days or weeks in a year. This is aimed
at creating more awareness and propagating the significance of these national and
international days or weeks.
(ix) Adventure Promotion Programmes
These programmes are aimed at promoting a spirit of adventure among the youth. Under
these programmes assistance is given to youth in undertaking adventure programmes.
This is aimed at inculcating the spirit of appreciation of nature, conservation of natural
resources and lays emphasis on various ecological aspects.
A Chart depicting the details of the 9 programmes giving their Objective, Content, Duration,
Budget, additional inputs etc., is annexed as appendix I.
1.3.2 District level Co-ordination Programmes
NYKS undertakes the implementation of various central schemes at the district, block,
Panchayat, and village levels. Some of them are indicated hereunder.
(i) Swarna Jayanti Gram Swarojgar Yojana.
NYKS with financial support from the Ministry of Rural Development, Government of
India, is implementing the Swarna Jayanti Gram Swarojgar Yojana in 800 villages of 8
districts of 4 states in the country.

VISION
6
(ii) Assistance to Disabled Persons for AIDS/ Appliance.
In association with the Ministry of Social Justice and Empowerment, Government of
India, NYKS has successfully implemented a project titled " Assistance to Disabled
Persons for AIDS/ Appliances" in 6 districts of 6 different states in India.
(iii) Village Talk.
NYKS in association with NACO conducted AIDS awareness campaign in the villages
called " Village Talk ".
1.3.3 Programmes conducted by Foreign Agencies
NYKS are closely associated with implementation of programmes funded by UNICEF,
WHO etc. NYKS is working with WHO (World Health Organization) for awareness
generation on " No Tobacco Day" and has jointly introduced " Youth Action Against
Poverty Awards" with UNDP in 1997.
1.4 ORGANIZATIONAL SET-UP OF NYKS
1.4.1 Four tier set up
NYKS has a four tier organizational structure, National level, Zonal level, Regional level and
District level.
1.4.2 National Level
At the National level, as NYKS is an autonomous organization under the Department of Youth
Affairs and Sports, Government of India, the Union Minister of State for Youth Affairs and Sports
is the ex-officio Chairperson of the Sangathan. To assist him there is a Board of Governors who
are looking into the over all functioning of the Sangathan. The Executive Head of NYKS at the
national level is the Director General who is responsible for managing the day to day activities of
the Sangathan.

VISION
7
1.4.3 Zonal level
For the administrative purposes of NYKS, the entire country is divided into 18 zones. Each Zone
is headed by a Zonal Director, who is responsible for ensuring that the policies and programmes
of the Sangathan are properly implemented in the field.
1.4.4 Regional level.
NYKS is having one or more Regional Offices generally in the Sates. Each State is having a
State level coordination Committee with membership from the development organizations and
banks that give feedback to the respective Regional offices on a regular basis. There are 46 such
regional offices. Each of these Regional offices is headed by Regional Co-ordinator who provides
supervisory and managerial support to 10-12 Nehru Yuva Kendra.
1.4.5 District level
Each District level Office, Nehru Yuva Kendra, is headed by a Youth Co-ordinator. At the District
level there is a District Advisory Committee with membership from the development organizations
and banks that give feedback to the respective District level offices on a regular basis. The
Regional Officer is further assisted by an Accountant-cum-typist, a Peon and 3-15 National
Service Volunteers.
1.4.6 Information Development and Resource Agencies (IDARAs)
In addition to the four tier set up described above, there are four IDARAs one each situated in
each of the states of West Bengal, Maharashtra, Uttar Pradesh and Tamil Nadu which provides
professional services for conducting training, for developing resource materials and for
documenting ‘ NYKS activities.
A chart depicting the organizational set up of NYKS is annexed as appendix II.
1.5 MANAGEMENT INFORMATION SYSTEM IN NYKS
The NYKS central office in New Delhi forwards guidelines called “ Annual Action Plan
Guidelines ” to the district headquarters in all the states wherever NYKS has their offices. This
document is in the form of broad guidelines for all the nine programmes in terms of number of
programmes to be conducted in a year, number of participants, budget allocation etc., for each of

VISION
8
the programmes. The district headquarters forwards monthly progress reports, quarterly
reports and annual progress reports to the zonal offices, which in turn submits a report on this
to the central office. The National Service Volunteers also submit report on the field visits
made to the various villages. In addition to this, a monthly meeting of the district youth co-
ordinator and national service volunteers is conducted in the regional headquarters.

VISION
9
2.0 OBJECTIVE & METHODOLOGY FOR THE STUDY 2.1 MAIN OBJECT
The main objective for the study is to make an evaluation as well as to carry out an audit of the Central Schemes of NYKS implemented in Assam. Bihar, Orissa, West Bengal, and Manipur. This inter alia involves.
(i) Assessment of the process of implementation of all the 9 centrally funded
programmes.
(ii) Assess the resultant impact of each of the programmes on the target group.
(iii) Analyze the findings and recommend strategies/ action Plans for improving the
impact and ensuring better productivity of the investment made in case of these
programmes.
2.2 PARAMETERS OF STUDY The parameters of the study is divided into two categories, namely IMPACT & PROCESS
(AUDIT):
2.2.1 IMPACT The study and the analysis on the impact aspect of NYK covers
(i) Level of awareness about NYK in the grass root level and among the target
group
(ii) Image of NYK in the target group
(iii) Image about the NYK among the grass root government agencies like Block
Development Officer, Tehsildar, project Director, Collector etc
(iv) Image of NYK among the beneficiaries and programme participants.
(v) Reach of the schemes and find out the deficiencies of the programmes
(vi) Rating of the Performance/ impact of each individual scheme
2.2.2 Process (Audit)
The processing or auditing part of the study will cover among other things
(i) Process of need assessment for each schemes
(ii) Process of planning for each of the activities and budgeting
(iii) Process of implementation of each scheme
VISION
10
2.3 METHODOLOGY FOR THE STUDY 2.3.1 Planning and field work An exploratory research study was conducted at Delhi; at the very start to gain an insight into
the earlier studies on the subject and the various Government plans and schemes framed from
time to time. Based upon the secondary information so collected and the insight gained therefrom
a comprehensive questionnaire was prepared, guidelines for the work were prepared and the
plan of action was worked out. Qualified researchers were engaged for the purpose and they
were given proper briefing training on the objectives of the research and the modalities of the
fieldwork. The field workers were divided into three groups and placed under Three Regional
Coordinators to conduct the study simultaneously over the entire geographical area. The entire
work was supervised by a Project supervisor. A diagrammatic representation of the methodology
is presented in Appendix III
2.4 GEOGRAPHICAL COVERAGE
The study covered the states of Assam, Erstwhile Bihar, which includes the present State of
Jharkhand, Orissa, West Bengal and Manipur.
2.5 SAMPLING SCHEME
2.5.1 Universe
In the six states covered, there are about 120 Districts, which are covered by NYK. These
districts where NYKs are functioning formed the universe for the sampling scheme.
2.5.2 Sampling technique and sample size
Basically a multistage sampling is adopted for the purpose. At the first stage out of the 120
Districts in the six states, 16 Districts are selected by purposive sampling, number of districts
to be selected in each state was decided based upon a joint consideration of the size of the State,
scale of operation of NYKS, the other needs in the state with regard to this study. While selecting
the Districts, the geographic, socio economic and cultural characteristics of the Districts,
representation for the Tribal, Hilly areas, economically developed or otherwise – rich and poor,
backwardness etc., have been taken into consideration. In each of the selected Districts two
blocks were selected at random and in each of the selected blocks two villages were selected
at random. In each of the villages 8 beneficiaries and two opinion leaders were interviewed.
Thus a total of 640 informants, 512 beneficiaries and 128 opinion leaders were interviewed

VISION
11
were planned. However taking the field realities into consideration the actual number of
informants totaled up to 744 as against the targeted 640. However we could not get enough
response in one of the Districts, Gumla of Jharkhand. As the fieldwork was started it was decided
to enhance the sample size in the NorthEastern Area and Bihar to 1½ times to round about 60
informants in each District. Thus the total number of informants came to 744 as against the
originally planned 640. The proportion of the sample representing each of State can be seen in
Chart 2.1.The details regarding the name of the Districts selected and the number of informants
in each District are presented in Table 2.1.

VISION
12
Table 2.1 Distribution of informants over the districts selected for the study
Sl.N
o. State Districts
No. of
informants
Percentage of
informants.
1. Assam Nalbari 62 8.3
Kamrup 54 7.3
Silchar 64 8.6
2. Bihar Vaisali 60 8.1
Muzzafarpur 58 7.8
3. Jharkhand Gumla 16 2.2
Hazaribagh 50 6.7
4. Orissa Kalahandi 40 5.4
Jagatsinghpur
(Cuttack)
38 5.1
Kurda 38 5.1
Koraput 40 5.4
5. Manipur Imphal 64 8.6
6 West Bengal Diamond Harbour 40 5.4
Cooch Bihar 40 5.4
Howra 40 5.4
Bankura 40 5.4
Total 744 100.0
2.6 COLLECTION OF INFORMATION
Besides collecting the information from the 744 informants spread over 16 districts in the six
States as said above, Zonal Directors and Youth Coordinators of each District were also
interviewed. Further 64 Focus Group Discussions were also conducted with active
participation of the youth club members and villagers.
2.7 ANALYSIS AND FINDINGS
The primary data collected and the secondary information collected through the investigation
were thoroughly analyzed using appropriate technology and tools and the findings have been
given in the following Chapter.
VISION
13
.
3.0 FINDINGS OF THE STUDY 3.1 PROFILE OF THE RESPONDENTS
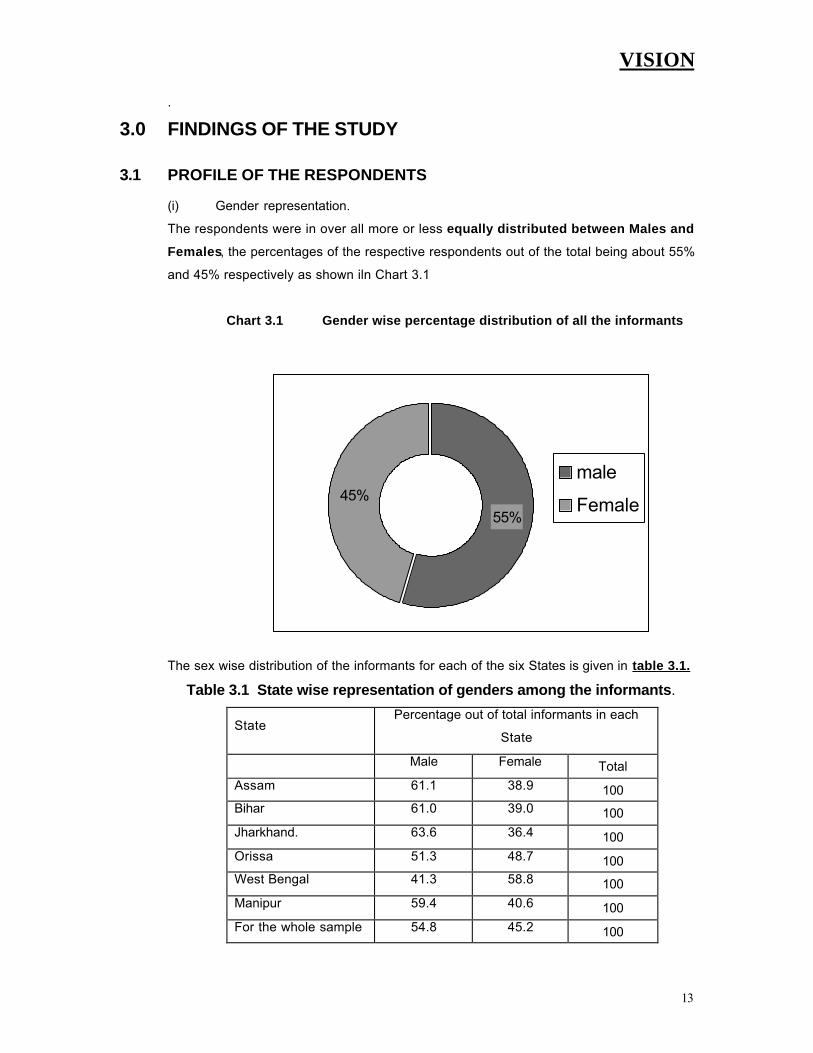
(i) Gender representation.
The respondents were in over all more or less equally distributed between Males and
Females, the percentages of the respective respondents out of the total being about 55%
and 45% respectively as shown iln Chart 3.1
Chart 3.1 Gender wise percentage distribution of all the informants
The sex wise distribution of the informants for each of the six States is given in table 3.1.
Table 3.1 State wise representation of genders among the informants.
State Percentage out of total informants in each
State
Male Female Total
Assam 61.1 38.9 100 Bihar 61.0 39.0 100
Jharkhand. 63.6 36.4 100
Orissa 51.3 48.7 100 West Bengal 41.3 58.8 100
Manipur 59.4 40.6 100
For the whole sample 54.8 45.2 100
55%
45%
male
Female

VISION
14
Except for Orissa and West Bengal the Male, Female ratio among the informants was more or
less the same being round about 3:2. In the case of West Bengal more or less reverse was the
case. Orissa maintained a fair balance between the two sexes the percentages being 51% Males
and 49% Females. This indicates that at State level there had not been much of a differentiation
in terms of gander of the informants. The gender distribution of the informants at District level is
presented in table 3.2
The distribution between the two genders of the informants was equal in the case of Cooch Bihar
and Howrah; the variation was with in 20% in the case of Vaisali, Muzzafarpur, and Hazaribagh.
Koraput, Imphal, Nalbari, Kamrup, Silchar, Diamond Harbour and Bankura; In Orissa all most all
the informants were males in Jagatsinghpur and all most all the informants were Females in
Khurda. In the Tribal predominant Kalahandi the female informant formed only 25%.
Table 3.2 Gender distribution of the informants
in the sixteen selected districts.
Percentage out of informants in each
District District
male Female Total
Vaisali 70.0 30.0 100.0
Muzzafarpur 51.7 48.3 100.0
Gumla 100.0 100.0
Hazaribagh 52.0 48.0 100.0
Kalahandi 75.0 25.0 100.0
Jagatsinghpur 94.7 5.3 100.0
Kurd 5.3 94.7 100.0
Koraput 30.0 70.0 100.0
Imphal 59.4 40.6 100.0
Nalbari 54.8 45.2 100.0
Kamrup 70.4 29.6 100.0
Silchar 59.4 40.6 100.0
Diamod Harbar 30.0 70.0 100.0
Cooch Bihar 50.0 50.0 100.0
Howrah 50.0 50.0 100.0
Bankura 35.0 65.0 100.0

VISION
15
In Gumla of Jharkhand where the number of informant itself was very less not even a single
women informants could be had. This only indicates the field conditions at the lowest
geographical level and not any gender bias as at the state level in all cases the gender ratio is
within acceptable range as has already been shown.
(ii) Social group representation
There had been adequate representation of different social groups, the percentage of
respondents from different social groups are indicated in Chart 3.2
Chart 3.2 Distribution of informants among the different Social
Groups
This indicates that the representation of the various social groups in our sample is not
much at variance with their representation in the total population. The distribution of the
informants with in each State between the Social Groups is presented in Table 3.3
Except in the case of Bihar and Manipur the Representation of the people belonging to
the reserve category in the sample was more than their representation in the total
population of the State concerned. This may be due to the higher emphasis laid on
getting the information on the weaker section of the society. In Bihar and Manipur it is
due to the field difficulties people belonging to the lower strata of the society could not be
caught in the sample to sufficient extent.
11.1 10.2
34.8
43.9
05
1015202530354045
% out of all
informants
SC ST OBC Others
Social Group

VISION
16
Table 3.3 Percentage Distribution of Informants between the Social
Groups in each of the six States
Percentage of informants in the Social Group
State SC ST OBC Others Total
Assam 12.4 14.6 32.6 40.4 100.0
Bihar 5.1 1.7 37.3 55.9 100.0
Jharkhand 6.1 33.3 39.4 21.2 100.0
Orissa 25.6 12.8 28.2 33.3 100.0
W. Bengal 6.3 3.8 41.3 48.8 100.0
Manipur 31.3 68.8 100.0
(iii) Age profile
In a study related to the NYKS prominence has to be given to the youth and hence the
sample should predominantly contain the youth population. The age profile of the 744
informants is shown be in Chart 3.3.
Chart 3.3 Age wise distribution of the informants
It indicates almost the entire sample is between the age group of 16 to 45 and nearly 86
% of them is with in the age group 16 to 35, more or less equally divided between the
43.7%42.3%
13.2%
0.5%0.3%

VISION
17
groups 16 to 25 and 26 to 35. Thus the youth as proper informants have been caught
for the survey.The age wise distribution in each of the state is prsented in table 3.4
Table 3.4 Age Group wise Percentage distribution of the informants within
each State
Age group
State 15 & below 16-25 26-35 36-45 Above 45 Total
Assam 65.6 33.3 1.1 100.0
Bihar 1.7 57.6 33.9 5.1 1.7 100.0
Jharkhand 78.8 21.2 100.0
Orissa 14.1 57.7 26.9 1.3 100.0
W.Bengal 21.9 56.9 21.3 100.0
Manipur 46.9% 31.3 21.9 100.0
Almost the entire population of informants from Assam and Jharkhand belong to the age
group 16-35; 90 percent of the Biharis also belong to the same group. Only one forth of
the informants in Orissa and one fifth in each of the States W. Bengal and Manipur
belong to the age group of 36-45. It is interesting to note that in the Eastern States and
Manipur the more matured youth have also participated
(iv) Association with NYKS
In a survey related to the evaluationof NYKS it becomes necessary tht informants are
associated wilth NYKS. Hence a prbing question had been put to them about the length
of theilr asociation with NYKS. A pictorial representation of the percentageof informants
and theilr association with NYKS is given in chart 3.4

VISION
18
Chart 3.4 Percentage Distribution of informants as per the period of their
contact with NYKS
As may be seen the informants with less than one year contact formed less than 10% of
the total. More than 90% of the informants have more than 3 years contact with NYKS
and thus their information about the activities of NYKS could be relied upon as result of
long term association with NYKS. Persons with more than 10 years association is also
considerably less and this is likely to reduce a positive bias in giving information.
The State wise distribution of informants in different age groups is indicated in table 3.5.
In Assam Manipur and Orissa nearly 75% or more have association with NYKS for a
period of three to five years; In West Bengal they have longer Association with NYKS,
more nearly all the informants there having an association with NYKS for a period not
less than five years. Jharkhand being a newly born State and the number of informants
being very few from the State, we have higher percentage of informant with less
association with NYKS viz., for a period less than one year. In Orissa the entire
informant population is more or less equally distributed among the three main classes of
those having association for one to three years, three to five years and five to ten years,
the peak being in the middle.
9.1
39.5
17.7
29.2
4.4
Less than one year
One year or more butless than 3 years
3 years or more butless than 5 years
5 years or more butlesss than10 years
More than 10 years
Yea
rs o
f co
nta
ct
Percentage of informants

VISION
19
Table 3.5 Percentage distribution of informants with in each state according to
their period of association with NYKS
Percentage of informants having association with NYKS for a period
State Less than
one year
One year or
more but less
than 3 years
3 years or more
but less than 5
years
5 years or more
but less than10
years
More
than 10
years
Total
Assam 3.3 71.1 15.6 6.7 3.3 100.0
Bihar 27.1 54.2 10.2 3.4 5.1 100.0
Jharkhand 45.5 33.3 12.1 9.1 100.0
Orissa 33.3 39.7 26.9 100.0
W.Bengal 1.3 86.9 11.9 100.0
Manipur 43.8 31.3 21.9 3.1 100.0
(v) Enrollment in the Programme.
The youth get enrolled in the various Programmes mainly either as a member of any of
the Youth Clubs or as a youth who is not attending any educational institution – a non-
student youth. There may be a small percentage of others who do not fall in these two
categories. It has been indicated in Chart 3.5 how they get enrolled in the Programmes.
Nearly two third get enrolled as members of the Youth Clubs and the remaining one third
as Non-Student Youth. Any other type of enrollment is insignificant being about 5% only.
Chart 3.5 Type of Enrollment in the Programmes
VISION
20
Table 3.6 State wise enrollment details
Percentage of Enrolled in Programme as
State youth club
member
non Student
youth Others Total
Assam 48.9 42.2 8.9 100.0
Bihar 67.8 28.8 3.4 100.0
Jharkhand 78.8 15.2 6.1 100.0
Orissa 84.6 14.1 1.3 100.0
W. Bengal 41.9 56.3 1.9 100.0
Manipur 53.1 31.3 15.6 100.0
State wise details of enrollment are given in Table 3.6. Youth Clubs are significantly
predominant claiming more than two third of the enrollment in the States of Bihar,
Jharkhand and Orissa. Percentage of enrollment in Youth Club with in a state is the
highest in Orissa and lowest in West Bengal. It is just the reverse in the case of
percentage of enrollment as Non-student Youth. Significantly both the states practically
did not have any members of other kinds their percentage being round about 1% only.
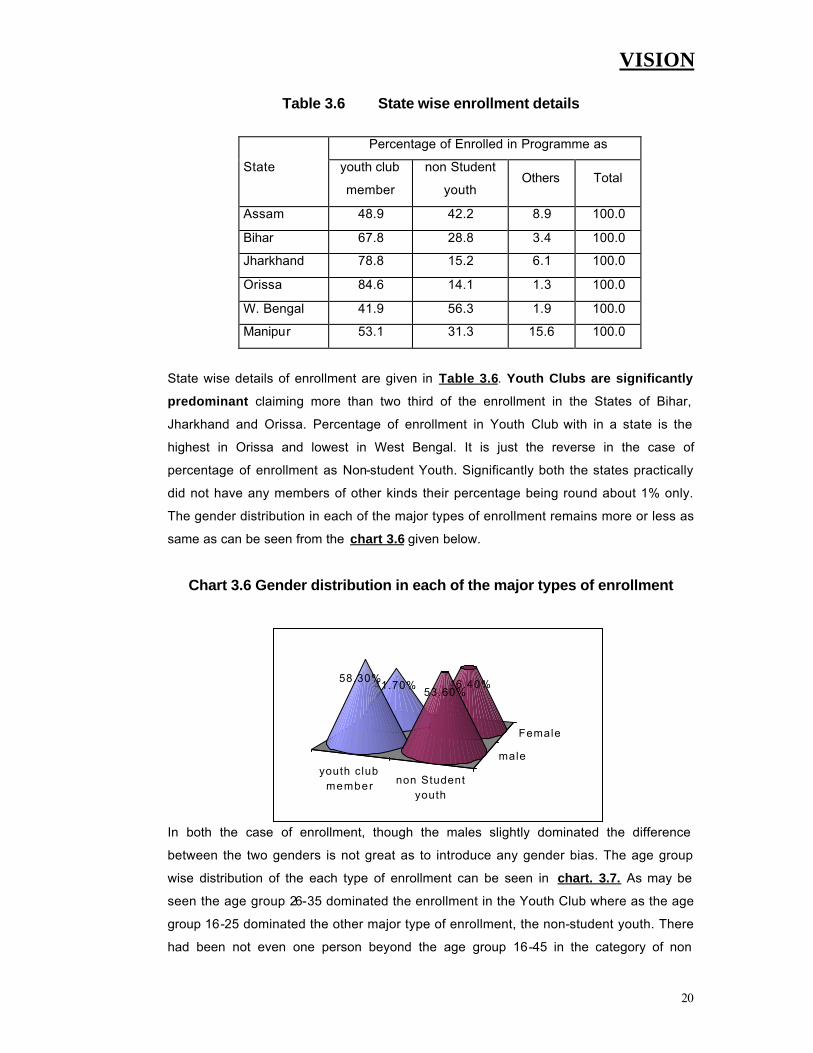
The gender distribution in each of the major types of enrollment remains more or less as
same as can be seen from the chart 3.6 given below.
Chart 3.6 Gender distribution in each of the major types of enrollment
In both the case of enrollment, though the males slightly dominated the difference
between the two genders is not great as to introduce any gender bias. The age group
wise distribution of the each type of enrollment can be seen in chart. 3.7. As may be
seen the age group 26-35 dominated the enrollment in the Youth Club where as the age
group 16-25 dominated the other major type of enrollment, the non-student youth. There
had been not even one person beyond the age group 16-45 in the category of non
male
Female
non Studentyouth
youth clubmember
41.70%58.30% 46.40%
53.60%

VISION
21
student youth enrollment. In both the groups about 85% of the enrollment lie in the age
group of 16-35, the core group of youth. This had been more or less equally distributed
between the two subgroups of 16 to 25 years of age and 26 to 35 years of age.
Chart 3.7 Age group wise percentage distribution of each type of
enrollment
The difference between the two sub groups being less than 10. The profile of association
with the activities of NYKS of youth Club members and non student youth members has
been analysed and the same has been indicated in table 3.7. In both the groups of
enrollment, the level of representation of those associated with NYKS activities for la
period less than three years remains more or less the same. The representation of
people with longer association with NYKS activities for a period of five years or more was
higher in the group of non student youth as compared to that in Youth Club Members, the
former being 42 % and the latter being 31%. But reverse was the case in respect of those
having three to five years of association.
0.4%
40.6%
47.2%
45.3%
38.1%
12.8% 14
.7%
0.9%
0.0
10.0
20.0
30.0
40.0
50.0
youth club member non Student yoth
Type of enrollment
Per
cent
age
of a
ge g
roup
s w
ithin
eac
h en
rollm
ent
Age Group 15and below
Age Group 16-25
Age Group 26-35
Age Group 36-45
Age Groupabove 45

VISION
22
Table 3.7 Distribution of each type of enrollment as per their period of
association with NYKS activities.
Percentage of enrollments having association with NYKS activities for
Type of
enrollment Less than
one year
One year or
more but less
than 3 years
3 years or
more but less
than 5 years
5 years or more
but less than10
years
More
than 10
years
youth club
member 9.7 38.0 21.2 28.5 2.6
non Student
youth 7.9 37.3 12.7 33.7 8.3
(vi) Motivation for association with NYKS
The youth are being motivated through various agents for getting themselves associated
with the NYKS activities. Some of the important sources motivation are
§ Block Coordinators of NYKS
§ National service volunteers
§ Youth leaders
§ Social workers
§ Local NGOs
How far each of these agents had been successful in their efforts of motivating the youth
could be seen from Chart 3.8. The effect of all these motivating agents lie with in a
narrow range the percentage of persons motivated lying between 14% to 28%, the most
active part being played by the Block Coordinators of NYKS and the least part by the
Local NGOs. The other three agents have claimed their expected share in motivating with
a variation of two or three percent only their range being 17% to 22%. But the pattern of
performance of the various motivating agents was not uniform over all the states. Table
3.8 gives the distribution of enrollments in each of the stage according to their motivating
agents and the corresponding percentage contribution within each state, the percentages
being given in parenthesis. It is only in the larger State of Assam Bihar, Orissa and West
Bengal that all the five agents had their dent. The NGOs did not have any contribution
either in Manipur or in the newly born State of Jharkhand. In Jharkhand, social workers
also did not have any contribution in motivating the informants, where as in Manipur it ils
only Block coordinators and Social workers who were motivators and none else, the
former claiming about two third of the result and the latter the remaining about one third.
It is only in the undivided Bihar which also includes Jharkhand

VISION
23
Chart 3.8 The part played by motivators in making youth get
associated with NYKS activities
Table 3.8 Distribution of informants in each State according to their motivation agents
Distribution of informants as per their motivation agent
State Block
coordinator of
NYKS
National
service
volunteers
Youth leadersSocial
workers Local NGOs Others.
Assam 76 (42.2) 44 (24.4) 6 (3.3) 40 (22.2) 14 (7.8)
Bihar 16 (13.6) 34 (28.8) 54 (45.8) 6 (5.1) 6 (5.1) 2 (1.7)
Jharkhand 8 (12.1) 24 (36.4) 32 (48.5) 2 (3.0)
Orissa 50 (32.1) 2 (1.3) 54 (34.6) 20 (12.8) 30 (19.2)
w.Bengal 14 (8.8) 33 (20.6) 21 (13.1) 39 (24.4) 53 (33.1)
Manipur 40 (62.5) 24 (37.5)
Some others have also been recorded as motivators though their percentage contribution
is highly insignificant being less than 5%. The leading roll playes in the different districts
were as follows
§ Block coordinators in Assam and Manipur
§ Youth leaders in Bihar, Jharkhand & Orissa and
§ NGOs in West Bengal
Others.1%
Social workers17%
Local NGOs14%
Block coordinator of
NYKS28%
Youth leaders22%
National servilce
volunteers18%

VISION
24
The poor players in the various States are listed below:
§ Youth leaders in Assam
§ Social workers and local NGOs in Bihar & Jharkhand
§ National Service volunteers in Orissa
§ Block coordinator of NYKS in West Bengal and
§ National Service Volunteers, Youth Leaders and Local NGOs in Manipur.
The Block Coordinators have done fairly well in the state of Orissa too besides topping in
Assam, and Manipur. The performance of Local NGOs in Assam too was not mulch
encouraging beside their nil or dismal results in Bihar, Jharkhand and Manipur. How far
each of the
Chart 3.9 Gender wise distribution of informants motivated by each agent
Motivating agents affected the male and female informants are shown in Chart 3.9. Youth
leaders have predominantly influenced the males, nearly three fourth of he informants
motivated by them being males, Where as local NGOs were successful in bringing in
Females substantially nearly two third of the informants motivated being Females. In the
case of all other motivating agents there had not been substantial difference in the
percentage of Male and Female informants, any one of them (Male or Female) being
round about 46% and the other being round about 53%.The Age Group wise distribution
of the informants motivated by each of the agency is presented in table 3.9
39.8%
53.5%
73.1%
46.7%
53.9%
60.2%
46.5%
26.9%
53.3%
46.1%
0.0 10.0 20.0 30.0 40.0 50.0 60.0 70.0 80.0
Block coordinatorof NYKS
National servilcevolunteers
Youth leaders
Social workers
Local NGOs
Mo
tiva
tin
g A
gen
ts
Percentage of informants motivated by a motivating agent
Female
Male

VISION
25
Table 3.9 Age wise distribution of the informants motivated by each of
the agencies.
No of informants in the age group
Motivation agent 15 and
below 16-25 26-35 36-45 above 45
Block coordinator of NYKS 86
(42.2%)
79
(38.7%)
37
(18.1%)
2
(1.0%)
National service volunteers 73
(53.3%)
51
(37.2%)
13
(9.5%)
Youth leaders 2
(1.2%)
74
(44.3%)
70
(41.9%)
19
(11.4%)
2
(1.2%)
Social workers 66
(51.2%)
59
(45.7%)
4
(3.1%)
Local NGOs 24
(23.3%)
54
(52.4%)
25
(24.3%)
(Figures in brackets indicate % with in each agency)
All most all the agencies (Except Local NGOs) have attracted the youth at their younger
stage in the age group of 16-25 to a greater extent, more than 40 % of the informants
attracted by each of these agencies belonging to this age group. However more than
50% of the informants motivated by the local NGOs belong to the age group 26-35.
3.2 PROGRAMMES AND ACTIVITIES OF NYKS/IMPACT-I
3.2.1 General
NYKS centres are arranging various kinds of programmes and activities for the local youth. For
our study a set of programmes that are generally conducted in the villages have been considered.
They include
§ Employment generation Programmes
§ Programme for the income generation for the rural youth]
§ Awareness generation on relevant social issues
§ Youth Club Development Programmes
§ Work Camps
§ Seminars and Workshops
§ Sports Promotion Promotions Programmes(Including Tournaments)

VISION
26
If any other programme is conducted in the village the same has been taken note of under the
group “Other Programmes”. Inquiries have been made with the informants regarding the
organizing of such programmes in their villages, Whether the informant has participated in such
programmes or not, whether he or she has been benefited from these programmes and if so what
are the benefits, what are the areas of intervention of the awareness programmes if any
conducted in the villages, Whether such programmes made any significant changes in the
community as envisaged by NYKS and if so the details of such programmes and the changes
they had brought about, the areas in which any major achievements or developments that had
taken place as result of the informants association with NYK programmes and activities etc., and
the information so obtained has been analyzed. Some of the important results are presented
below.
3.2.2 Organizing the Programmes
We have already indicated the Major Programmes that are being organized in the villages. The
popularity of the Programmes could be adjudged by the percentage of villages where the
particular programmes being organized. Chart 3.10 indicates the percentages of villages where
various Programmes are being organized or not organized.
Chart 3.10 Percentages of villages where the Programmes of NYKS are organized.
It may be seen that all the six Major Programmes are being organized in more than 505 of the
villages. The three Programmes Awareness generation of Social Issues, Programme for
generation of Income and Youth cultural Development Programmes are more popular being
organized in more than 70% of the villages. Work Camps and Sports Promotion Programmes
form the middle layer in popularity, being organized in about 65% to 66 % of the villages. Seminar
72.6
27.4
75.3
24.7
70.2
29.8
65.2
34.8
52.2
47.8
66.3
33.7
24.7
75.3
0%
20%
40%
60%
80%
100%
Per
cent
age
of v
illag
es
Types of Programmes
Not organised
organised

VISION
27
and workshops ranks at the bottom of popularity as they are organized only in 52% of the
villages. All the other programmes if any other than the above six programmes are organized only
in a meager 25% of the villages. At the district level how far the programmes are organized could
be seen from table 3.10. It indicates that there is not even a single village where all the
programmes are conducted in all the villages. Jagatsinghpur is the only district where all the
programmes other than income generation and awareness have been conducted in all the
villages invariably. The programmes of income generation and awareness also have been
conducted in this district in about 95% of the villages.
Table 3.10 District wise percentage of villages where the programmes where
organized
Type of Programmes
District
Em
plo
yt.
Gen
erat
ion
Inco
me
gene
ratio
n
Aw
are
ne
ss
gene
ratio
n
You
thcl
ub
de
velo
pt.
Wor
k C
amps
Sem
inar
&
Wor
ksho
ps
Spo
rts
Pro
mo
tion
Oth
ers
Vaisali 50.0 80.0 20.0 26.7 53.3 60.0 10.0 90.0
Muzzafarpur 48.3 31.0 20.7 58.6 48.3 75.9 20.7 86.2
Gumla 12.5 12.5 87.5 75.0 100.0 87.5
Hazaribagh 52.0 48.0 16.0 16.0 84.0 52.0 72.0
Kalahandi 100.0 100.0 50.0
Jagatsinghpur 100.0 94.7 94.7 100.0 100.0 100.0 100.0 100.0
Khurda 57.9 94.7 47.4 31.6 26.3 31.6 47.4 94.7
Koraput 100.0 75.0 25.0 25.0 25.0 50.0 50.0 100.0
Imphal 71.9 71.9 25.0 9.4 25.0 25.0 71.9
Nalbari 64.5 87.1 32.3 25.8 100.0 51.6 54.8 32.3
Kamrup 25.9 14.8 40.7 81.5 70.4 77.8 51.9 92.6
Silchar 65.6 96.9 3.1 28.1 12.5 56.3 9.4 3.1
Diamond Harbour 100.0 100.0 20.0 100.0
Cooch Bihar 87.5 90.0 10.0 10.0 17.5 10.0 27.5 100.0
Howrah 100.0 100.0 20.0 85.0
Bankura 70.0 75.0 25.0 25.0 50.0 45.0 50.0 100.0
Thus Jagatsinghpur stand alone high in the performance in this regard. It is only the two
programmes of employment generation and income generation that have been conducted in all
the Districts. In fact, in the Districts of Howrah, Diamond Harbour and Kalahandi only these two

VISION
28
programmes are conducted and that too in all the villages and no other programmes are
conducted. The other cases where any Specified Programme had been conducted in all the
villages of a district are:
§ Seminar and workshops in Gumla and
§ Work Camps in Nalbari.
Other than the specified Programmes some programme or the other had been organized in all
the villages of Jagatsinghpur, Koraput, Diamond Harbour, Cooch Bihar and Bankura. The work
camps are worst affected, as they are not conducted in the maximum number of Districts the
districts being, Gumla, Hazaribagh, Kalahandi, Diamond Harbour and Howrah. These are the
only five districts where casualties of other Programmes also have occurred. In all other districts
all the Programmes have been conducted in varying degrees. Among them the cases where the
performance was highly insignificant, the programme being organized in less than 10% of the
villages in a district are:
§ Work Camps in Muzzafarpur and Imphal
§ Awareness generation Programmes, Sports Promotion Programmes and
Miscellaneous Programmes in Silchar.
The other cases where one could say there had been a good impact, the programmers on the
subject being organized in more than 50% of the villages in a district are
§ Programmes for Income Generationwork Camps, Seminars and Workshops
in Vaisali
§ Youth Club Developments and Work Programmes in Muzzafarpur
§ Awareness generation on relevant social issues and Youth Club
development in Gumla
§ Employment Generation. Seminars and Workshops and Sports Promotion in
Hazaribagh
§ Employment generation, Income Generation for the Rural youth in Khurda
§ Income generation in Koraput
§ Employment generation and income generation in Imphal
§ Employment generation, Income Genration Seminars and Workshops and
sports Promotion in Nalbari
§ Youth Club Development Work Camps Seminars and Workshops and Sports
promotion in Kamrup,
§ Employment Generation, Income Generation and seminars and Workshops
in Silchar and
§ Employment and Income Generation in Cooch Bihar as well as Bankura

VISION
29
Table. 3.11 Percentages of villages in each of the States where NYKS
programmes are organised
Percentages villages where Programmes are
organized related to
State
Em
ploy
men
t
gene
ratio
n
Inco
me
Gen
erat
ion
P
rogr
amm
e fo
r
inco
me
gene
ratio
n
for
the
Rur
al y
outh
You
th C
lub
Dev
elop
men
t
Sem
inar
&
wor
ksho
p
Spo
rt p
rom
otio
n
prog
ram
mes
A
ny o
ther
Pro
gra
mm
es.
Assam 53.3 75.6 68.9 56.7 38.9 62.2 60.0
Bihar 49.2 79.7 47.5 57.6 32.2 84.7 11.9
Jharkhand 42.4 66.7 39.4 69.7 12.1 60.6 24.2
Orissa 89.7 59.0 91.0 61.5 55.1 51.3 14.1
W.Bengal 89.4 91.3 91.3 91.3 86.3 70.6 3.8
Manipur 71.9 75.0 71.9 100.0 75.0 75.0 28.1
The only Programme that had been organized in any of the states in all the villages in that State
is related to Youth Club Development and it had occurred only in the State of Manipur. The
States where each of the major programmes has been organized in more than 50% of its villages
are Orissa, West Bengal and Manipur. In the State of Assam only one programme that is
arranging seminars and workshops that had recorded lower percentage of villages (38%). Both in
Bihar and Jharkhand, the three programmes pertaining to Income Generation, Youth Club
Development and Seminar and Workshops have been organized in more than nearly 60% of the
villages and all other Programmes have not crossed the 50% mark. In fact these of the only three
programmes that have been popular in all the state being organized in about 60% or more
villages in each of the States.
3.2.3 Perceived Benefit out of the NYKS programmes The various programmes are arranged as indicated earlier in order to confer certain benefit on
the rural population specifically the rural youth. In order t gauge whether the programmes were
tending to achieve the object with which they are organized the informants who were
predominantly youth population were asked a specific question about his own perception whether
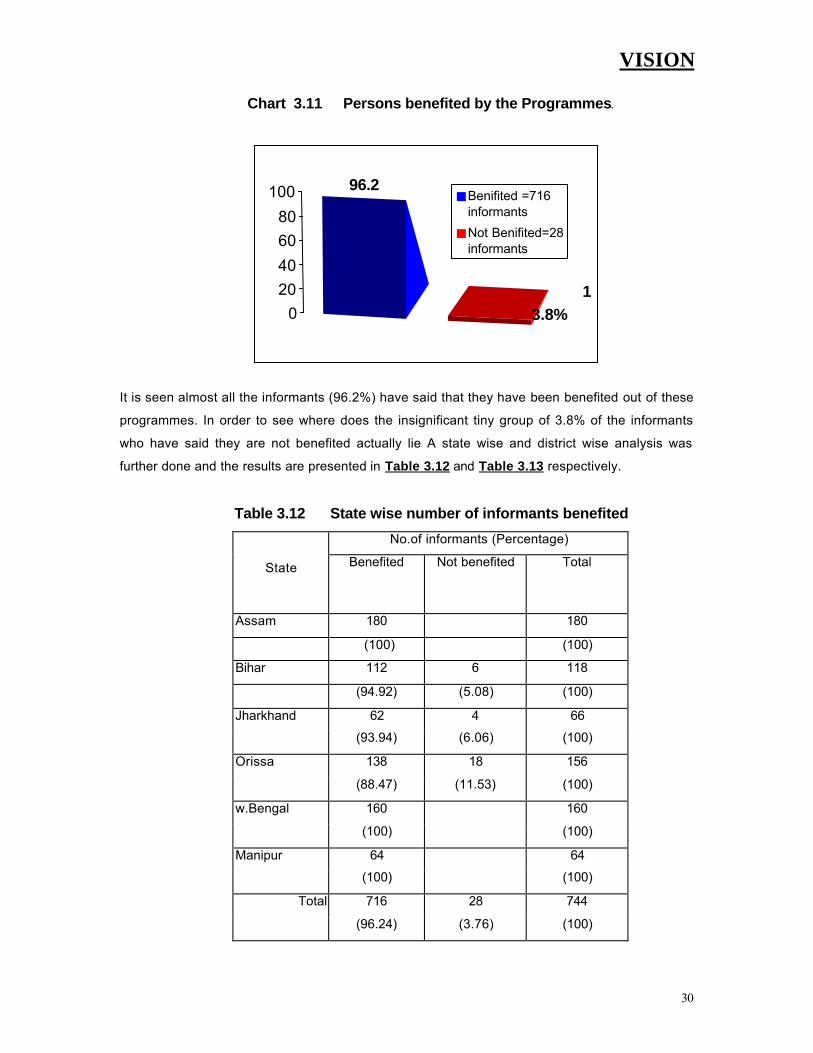
he was benefited out of these programmes. The result is revealed in Chart 3.11.
VISION
30
Chart 3.11 Persons benefited by the Programmes.
It is seen almost all the informants (96.2%) have said that they have been benefited out of these
programmes. In order to see where does the insignificant tiny group of 3.8% of the informants
who have said they are not benefited actually lie A state wise and district wise analysis was
further done and the results are presented in Table 3.12 and Table 3.13 respectively.
Table 3.12 State wise number of informants benefited
No.of informants (Percentage)
State Benefited Not benefited Total
Assam 180 180
(100) (100)
Bihar 112 6 118
(94.92) (5.08) (100)
Jharkhand 62 4 66
(93.94) (6.06) (100)
Orissa 138 18 156
(88.47) (11.53) (100)
w.Bengal 160 160
(100) (100)
Manipur 64 64
(100) (100)
Total 716 28 744
(96.24) (3.76) (100)
1
96.2
3.8%0
20
40
60
80
100 Benifited =716informants
Not Benifited=28informants

VISION
31
From the table it is seen that about 12% of the Oriyan informants, about 6% of the Jharkhand and
5% of the Bihari informants were not satisfied w.r.t the benefits derived from these programmes .
Within these States it was further attempted to identify the Districts where these unsatisfied
informants live and hence a District wise analysis was attempted. As a result it was seen that the
entire Oriyan unsatisfied informants live in a single District viz., Jagatsinghpur. In the undivided
Bihar the only district where every informant is satisfied is Vaisali.
Table 3.13 District wise benefited in the States of Bihar, Jharkhand and Orissa.
District Benefited
Not
benefited Total
Vaisali 60 60
(100) (100)
Muzzafarpur 52 6 58
(89.66) (10.34) (100)
Gumla 14 2 16
(87.50) (12.50) (100)
Hazaribag 48 2 50
(96) (4) (100)
Kalahandi 40 40
(100) (100)
Jagatsinghpur 20 18 38
(52.63) (47.37) (100)
Khurda 38 38
(100) (100)
Koraput 40 40
(100) (100)
3.2.4 Awareness Programmes on various issues
There are a number of social issues on which NYK is interested in bringing in awareness among
the Rural Youth so the concerned issues may be understood in their proper perspective and
various remedial measures for the social illness could be taken. For the purpose of the study
special attention was paid to investigate the situation with regard to some of the important issues
such as
§ Abolition of untouchability
§ Dowry prohibition

VISION
32
§ Communal harmony
§ Literacy campaign
§ Communicable disease prevention
§ Family Planning
§ Awareness Generation on AIDS
§ Environment Protection
The first attempt was made to find out whether at all any programme for awareness generation
was organized in the concerned village. The study has indicated the extent of such organizing
and the result is presented in Chart 3.12. The result is very much encouraging as nearly is 92 %
of al the villages surveyed some awareness programme or the other has been organized. The
villages where no programme was organized amounted to only about 8%,
Chart 3.12 Extent of organizing of any of the awareness programmes in the villages
As a next step the extent or organizing the individual major awareness programmes listed already
had been investigated and information on this aspect is given in Chart 3.13. Out of the 8 different
awareness programmes taken up for study It is only viz., awareness Generation on AIDS and
Environment protection that have been organized in more than 75% of the villages. No other
programme has been organized in more than about two fifth of the total number of villages.
Awareness programmes in communal harmony recorded the lowest response as the same had
been organized only in less than 29% of the villages. Awareness Programmes on Abolition of
untouchability, Dowry Prohibition, Communal harmony and Communicable diseases prevention
take-up individually, in each one of them had been organized in round about one third of the
villages or less than that only.
91.7%
8.3%0
20
40
60
80
100
Oiganisation of awareness progarammes
Per
cnta
ge
of
villa
ges
No

VISION
33
Chart 3.13 Percentages of villages where each of the awareness programmed had
been organized.
A state wise analysis has been attempted to understand the extent performance of with
regard to this particular activity in each of the states under study and the result thus
obtained has been presented in table 3.14 and 3.15 respectively. Manipur is the only
State where at least one of the intervention programmes for creating awareness among
the youth has been organized in all the villages of the State. Bihar is the only State where
all the eight identified programmes have been organised in more than about 60% of the
villages. The only State with a dismal performance showing that as many as five
programmes related to abolition of untouchability, Dowry Prohibition, Communal
Harmony, Literacy Campaign and Family Planning have been organised in less than 10
percent of the villages. Assam is slightly following the footsteps Of Orissa with six of its
programmes including the one related to prevention of communicable diseases in
addition to those mentioned in the case of Orissa being organised in less than 30 % of
the villages. In Jharkhand all the programmes other than those pertaining to abolition of
untouchability and prevention of communicable diseases have been organised in more
than 50% of the villages.
33.1 34.3 28.941.7
30.042.1
77.7 77.7
0 9.9
66.9 65.7 71.158.3
70.057.9
22.3 22.3
90.1
0.0
20.0
40.0
60.0
80.0
100.0
120.0
No
Yes

VISION
34
Table 3.14 Percentage of villages in each State where awareness generation
programmes have been organised as per area of intervention
Percentage of villages within each State where awareness Programmes
are organised as per area of intervention
State
Abo
litio
n of
Un
tou
cha
bili
ty
Dow
ry p
rohi
bitio
n
Co
mm
un
al
harm
ony
lite
racy
ca
mp
aig
n
Com
mun
icab
le
dise
ase
prev
entio
n
Fam
ily P
lan
nin
g
Aw
are
ne
ss
gene
ratio
n A
IDS
Env
iron
men
t
Pro
tect
ion
Any
oth
er
Assam 15.6 3.3 13.3 22.2 21.1 28.9 70.0 46.7 16.7
Bihar 67.8 72.9 57.6 88.1 64.4 72.9 91.5 74.6 20.3
Jharkhand 27.3 66.7 51.5 81.8 24.2 63.6 57.6 57.6 3.0
Orissa 6.4 7.7 5.1 7.7 15.4 6.4 67.9 28.2 2.6
W.Bengal 68.8 64.4 26.9 42.5 23.1 54.4 85.0 21.9 8.8
Manipur 6.3 59.4 50.0 50.0 56.3 100.0 93.8
In west Bengal four of the programmes concerning abolition of untouchability, Dowry Prohibition,
Family Planning and Awareness generation on AIDS has been conducted in more than 50% of
the villages. The Programme related to Awareness Generation of AIDS has the popularity in all
the States under survey the same having been conducted in more than about 70% of the villages
in each of the States. Further analysis at the lower geographical level of districts has also been
attempted in order to understand the localization of the working pattern and the conducted of
awareness programmes. In the districts of Kalahandi, Imphal, Silchar and Bankura the
programmes related to awareness. Generation of AIDS has been conducted in 100% of the
sampled villages. In addition to this Programme of awareness Generation related to Family
Planning have been organised in 100% of the villages in the District of Diamond Harbour. It is
pertinent to note here that all the programmes are not conducted in every District.

VISION
35
Table 3.15 Percentage of villages in each District where awareness
generation programmes have been organised, as per area of intervention
Percentage of villages within each District where awareness Programmes
are organised as per area of intervention
State
Abo
litio
n of
Un
tou
cha
bili
ty
D
owry
pro
hib
itio
n
C
omm
unal
harm
ony
lite
racy
cam
pa
ign
Com
mun
icab
le
dise
ase
prev
entio
n
F
amily
Pla
nnin
g
A
war
enes
s
gene
ratio
n A
IDS
E
nvir
onm
ent
Pro
tect
ion
A
ny o
ther
Vaisali 70.0 80.0 66.7 90.0 66.7 76.7 93.3 66.7 6.7
Muzzafarpur 65.5 65.5 48.3 86.2 62.1 69.0 89.7 82.8 34.5
Gumla 12.5 12.5 75.0 75.0 75.0
Hazaribagh 32.0 84.0 68.0 84.0 32.0 84.0 52.0 52.0 4.0
Kalahandi 15.0 10.0 20.0 50.0 10.0 100.0 45.0
Jagatsinghpur 10.5 5.3
Khurda 10.5 10.5 10.5 10.5 10.5 15.8 84.2 10.5 10.5
Koraput 20.0 75.0 50.0
Imphal 6.3 59.4 50.0 50.0 56.3 100.0 93.8
Nalbari 19.4 9.7 54.8 22.6 6.5
Kamrup 14.8 51.9 14.8 18.5
Silchar 43.8 9.4 37.5 50.0 40.6 71.9 100.0 96.9 25.0
Diamod Harbour 90.0 70.0 55.0 65.0 55.0 100.0 90.0 5.0
Cooch Bihar 75.0 67.5 27.5 45.0 22.5 52.5 85.0 17.5 5.0
Howrah 60.0 45.0 25.0 60.0 10.0 65.0 65.0 10.0 20.0
Bankura 50.0 75.0 5.0 100.0 60.0 5.0
It is only in the seven districts of Vaisali, Muzzafarpur, Hazaribagh, Khurda, Silchar Cooch Bihar
and Howra out of the sixteen districts where the survey was conducted that all the eight identified
programmes have been taken up. Out of them it is only in District Vaisali that each of the eight
programmes has been carried over in more than 60 % of the villages. Muzzafarpur did not touch
the 50% mark in the case of the awareness Programmes on Communal Harmony. In Hazaribagh
they were able to carry over the programmes dealing with Abolition of untouchability and
prevention of communicable diseases in less than one third of the villages only. In Khurda each of
the seven programmes other than the one related to AIDS could be taken up in round about 10%
of the villages only. In Silchar awareness generation on dowry Prohibition could not be brought to
even ten percent of the villages. In Cooch Bihar the turn out of the programmes were higher
being more than 50% in the cases of Abolition of untouchability, dowry Prohibition, Family
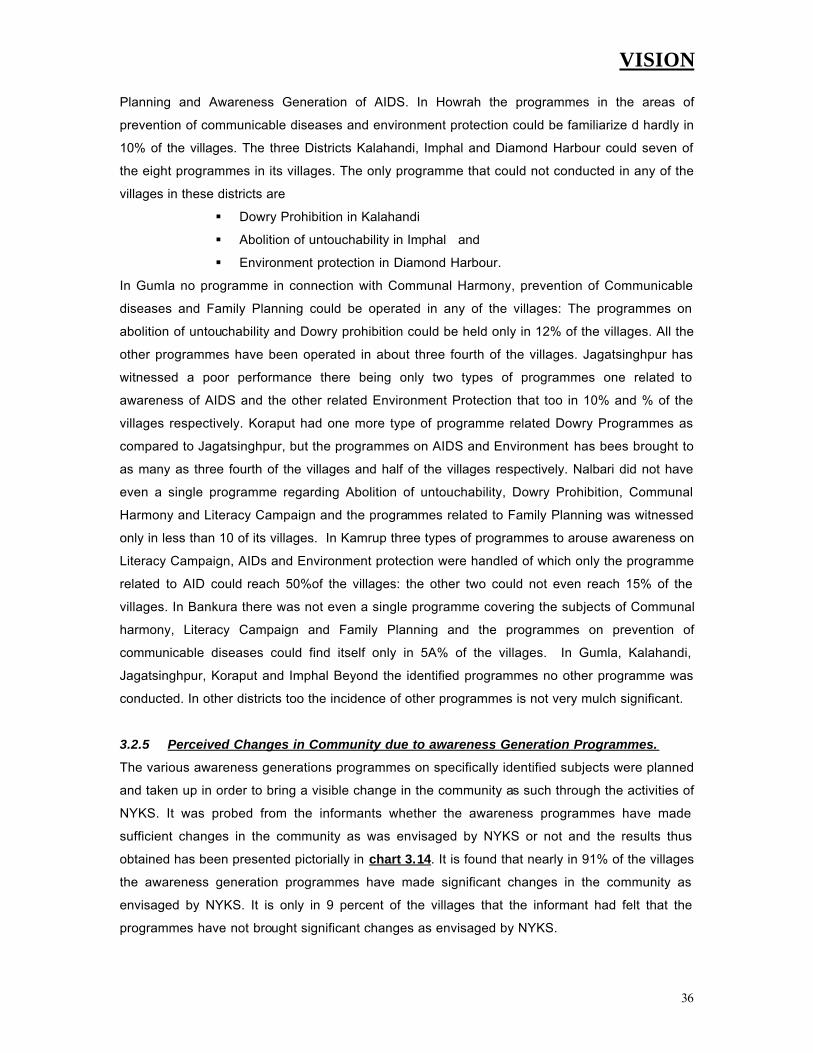
VISION
36
Planning and Awareness Generation of AIDS. In Howrah the programmes in the areas of
prevention of communicable diseases and environment protection could be familiarize d hardly in
10% of the villages. The three Districts Kalahandi, Imphal and Diamond Harbour could seven of
the eight programmes in its villages. The only programme that could not conducted in any of the
villages in these districts are
§ Dowry Prohibition in Kalahandi
§ Abolition of untouchability in Imphal and
§ Environment protection in Diamond Harbour.
In Gumla no programme in connection with Communal Harmony, prevention of Communicable
diseases and Family Planning could be operated in any of the villages: The programmes on
abolition of untouchability and Dowry prohibition could be held only in 12% of the villages. All the
other programmes have been operated in about three fourth of the villages. Jagatsinghpur has
witnessed a poor performance there being only two types of programmes one related to
awareness of AIDS and the other related Environment Protection that too in 10% and % of the
villages respectively. Koraput had one more type of programme related Dowry Programmes as
compared to Jagatsinghpur, but the programmes on AIDS and Environment has bees brought to
as many as three fourth of the villages and half of the villages respectively. Nalbari did not have
even a single programme regarding Abolition of untouchability, Dowry Prohibition, Communal
Harmony and Literacy Campaign and the programmes related to Family Planning was witnessed
only in less than 10 of its villages. In Kamrup three types of programmes to arouse awareness on
Literacy Campaign, AIDs and Environment protection were handled of which only the programme
related to AID could reach 50%of the villages: the other two could not even reach 15% of the
villages. In Bankura there was not even a single programme covering the subjects of Communal
harmony, Literacy Campaign and Family Planning and the programmes on prevention of
communicable diseases could find itself only in 5A% of the villages. In Gumla, Kalahandi,
Jagatsinghpur, Koraput and Imphal Beyond the identified programmes no other programme was
conducted. In other districts too the incidence of other programmes is not very mulch significant.
3.2.5 Perceived Changes in Community due to awareness Generation Programmes.
The various awareness generations programmes on specifically identified subjects were planned
and taken up in order to bring a visible change in the community as such through the activities of
NYKS. It was probed from the informants whether the awareness programmes have made
sufficient changes in the community as was envisaged by NYKS or not and the results thus
obtained has been presented pictorially in chart 3.14. It is found that nearly in 91% of the villages
the awareness generation programmes have made significant changes in the community as
envisaged by NYKS. It is only in 9 percent of the villages that the informant had felt that the
programmes have not brought significant changes as envisaged by NYKS.

VISION
37
Chart 3.14 Extent of significant changes in community due to awareness
programmes of NYKS.
To find out where does the dissatisfaction lies though it is insignificant further analysis over the
different geographical levels such as States and districts were carried out and the results thus
obtained are given in table 3.16 and 3.17.
Table 3.16 Extent of significant changes due to awareness programmes of
NYKS
% Within state
Significant changes in community by Awareness Generation
Programmes state
Yes No Total
Assam 92.2% 7.8% 100.0%
Bihar 94.9% 5.1% 100.0%
Jharkhand 84.8% 15.2% 100.0%
Orissa 74.4% 25.6% 100.0%
W. Bengal 100.0% 100.0%
Manipur 100.0% 100.0%
90.6% 9.4% 100.0%
West Bengal and Manipur are the only two states where every informant has said that the
awareness programmes have brought in significant changes as has been envisaged by NYKS.
90.6%
9.4%
0.0
20.0
40.0
60.0
80.0
100.0
120.0
Extent of significant changes in community
per
cen
tag
e o
f vi
llag
es No
yes

VISION
38
The dissatisfaction was more at Orissa as compared to other States as nearly 25% of Oriyan
informants have replied in negative to the question whether the programmes have made
significant changes. Jharkhand follows this with 15%. In Assam and Bihar only less than 10%
expressed their dissatisfaction. Thus the dissatisfaction though insignificant is not confined to one
or two States. There was only one district Jagatsinghpur where not even one informant has
expressed that the awareness programmes have brought any significant changes as envisaged
by NYKS. This is an area of grave concern and as pect needs the attention of the authorities
concerned. The other districts where some of the informants were not satisfied were
Muzzafarpur, Gumla, Hazaribagh, Kalahandi, Nalbari and Kamrup. But the level of dissatisfaction
was not a matter of concern, as it remained less than about 15% in each of the district.
Table 3.17 Extent of significant changes due to awareness programmes of
NYKS
% Within District
District Significant changes in community
by these programmes
Yes No Total
Vaisali 100.0% 100.0%
Muzzafarpur 89.7% 10.3% 100.0%
Gumla 87.5% 12.5% 100.0%
Hazaribagh 84.0% 16.0% 100.0%
Kalahandi 95.0% 5.0% 100.0%
Jagatsinghpur 100.0% 100.0%
Khurda 100.0% 100.0%
Koraput 100.0% 100.0%
Imphal 100.0% 100.0%
Nalbari 87.1% 12.9% 100.0%
Kamrup 88.9% 11.1% 100.0%
Silchar 100.0% 100.0%
Diamod Harbar 100.0% 100.0%
Cooch Bihar 100.0% 100.0%
Howrah 100.0% 100.0%
Bankura 100.0% 100.0%
Total 90.6% 9.4% 100.0%

VISION
39
3.2.6 Major Achievements/Developments through NYKS
For the purpose of studying the Major Achievements or Developments that had taken place at
various places in identified specific areas such as
§ Job Skills
§ Income
§ Leadership qualities
§ Knowledge base on civil rights and various social issues
§ Skill in sports / cultural activities
§ Civic Sense (Social responsibility and obligation)
Probing questions were put to the informants the level of changes that had taken place on these
aspects were ascertained. The level of change had been classified as
§ Substantial
§ Moderate
§ Slight
§ -No change
The information so obtained has been analyzed and the over all position with regard to the six
identified areas of achievements or Developments is given in Table 3.18.
Table 3.18 Level of achievements in various Major areas.
% With in particular achievement
Area of Achievements /
Developments Extent of change as percentage of
Substantial Moderate Slight Nil
Job Skills 6.6 21.5 49.1 22.8
Income 2.0 29.4 49.7 18.8
Leadership qualities 10.0 28.2 52.4 9.3
Knowledge base on civil rights and
various social issues
17.2 20.5 51.5 10.8
Skill in Sports/Cultural activities 10.2 30.5 43.0 16.3
Civic Sense 8.9 14.7 47.9 28.4
In all most all the areas of achievements or Developments in round about 50% of the cases
there had been a slight positive change. In another 20% to 30% of the cases there had been
moderate change. It is only in about 5% to 15% of the cases that substantial change has been
achieved. In about 10% to 20% of the cases there had been no change at all. In the area of Job

VISION
40
skills in nearly 23% of the cases there had been no change at all and only and in only about 7%
of the cases there had been substantial change. In the area of Income generation in nearly 19%
of the cases there had been no change at all and it is only in 2% of the cases there had been
some substantial change. With regard to Civic sense there had been no change at all in 28% of
the cases and substantial change was observed only in about 9% of the cases. These seems to
be the worst affected areas among al the areas considered for the study that may need the
immediate attention of the authorities managing the programmes. The maximum amount of
substantial change was observed (in 17% of the cases) only in the area of Knowledge base on
civil rights and various social issues. It is only in this area and the area of leadership that
minimum number cases of no change (being about 10%) was observed. In addition to the area of
knowledge base on civil rights the areas of leadership qualities and skills in sports and cultural
activities are the only areas where substantial change has been seen in 10% or more of the
cases.
3.3 PROGRAMME IMPLEMENTATION/PROCESS
3.3.1 Implementing Agencies
Efforts have been taken in this study to see how the programmes of NYKS are implemented, the
main implementing agencies being
§ Registered Youth Clubs
§ NGOs working in the locality
§ Other local bodies
The result of the investigation in this regard is shown in table 3.19
Table 3.19 Details of Implementing Agencies of NYKS programmes
Operating Agency
Percentage of villages where the agency
operated or not operated the NYKS
programmes
Implementing Agency Operated Not operated Total
Registered youth club 84.7 15.3 100.0
NGO in the locality 36.0 64.0 100.0
Through other local bodies 22.7 77.3 100.0
Any other agency 1.1 98.9 100.0

VISION
41
It may be seen that the Registered Youth Clubs are leading in carrying out the programmes of
NYKS as they are functioning in about 85 % of the villages and carrying out the programmes.
The next in rank of implementation comes the NGOs in the locality. The other local bodies are
operating only in about 23% of the villages. This indicates that Youth Clubs are really more
effective in implementation of the programmes.
3.3.2 Number of NYKS activities carried out.
To understand how frequently and how often the NYKS supported activities are carried out in
each of the villages, the Number of times each of the specified nine NYK supported activities
was carried out in the last two years was inquired into.
Table 3.20 Percentage of villages as per number of times an activity was carried
out
Percentage of villages with in each NYKS activity as per no of times the activities carried out.
Activity
No of
times You
th C
lub
Dev
t.
Voc
atio
nal t
rain
ing
prog
ram
me
awar
enes
s ge
nera
tion
wor
k ca
mps
spor
t pro
mot
ion
prog
ram
me
cu
ltura
l pro
gra
mm
e
adv
entu
re p
rom
otio
n
cel
ebra
tion
of n
atio
nal
day
sem
inar
& w
orks
hops
Oth
er A
genc
ies
1 28.1 23.9 23.0 26.0 21.3 21.5 40.6 13.2 41.4 74.2
2 32.4 36.6 40.9 42.8 35.9 36.8 27.8 43.9 26.6 10.4
3 16.3 7.8 15.9 11.3 16.6 10.6 10.3 14.7 19.2 6.1
4 10.3 13.0 2.2 10.5 6.3 3.3 11.1 7.3 5.8 2.5
5 0.3 12.1 2.8 1.3 6.7 3.6 3.0 6.3 3.6 3.6
6 3.9 0.7 9.6 4.3 4.1 11.1 5.3 1.8 0.4 0.7
7 2.5 0.4 0.8 2.0 0.5 0.3 0.6 1.2 0.4 1.1
8 4.5 1.6 1.9 0.5 4.8 0.3 1.3 0.3 0.9 1.4
9 0.3 0.8 0.5 6.9 3.6 0.4
10 1.8 0.3 2.2 0.7
11 1.7 1.8 2.1 0.7 3.6 3.6 7.1 1.4
Total 100.0 100.0 100.0 100.0 100.0 100.0 100.0 100.0 100.0 100.0

VISION
42
The activities that were considered for the purpose are
§ Youth Club Development Programmes
§ Vocational Trailing Project
§ Awareness Generation
§ Work Camps
§ Sports Promotion programme
§ Cultural Programme
§ Adventure Promotion
§ Celebration of national days/other significant days
§ Seminars/workshops
For each of these activities and for all other activities if any put together the percentage of villages
as per number of times the particular activity was organised has been presented in Table 3.20. in
about 40% of the villages the adventure Promotion Programmes and the seminars and
workshops have not been repeated at all. The other specified programmes also have not been
repeated in about one forth of the villages. The unspecified programmes have not been repeated
in three fourth of the villages. Adventure promotion activity is the only one that has not been
conducted more than eight times in the past two years in any of the villages. Each of the specified
nine activities has been conducted at the most 8 times in some village or the other. The only
activity which has been repeated more then 5 times in about one fourth of the villages is Cultural
Programme. Youth Club Development, Awareness Generation, Sports Promotion Programme
and Celebration of important days have been repeated more than five times in about 13 to 15
percent of villages. Vocational Training Project, Work Camps and Adventure promotion activities
have been repeated more than 5 time in 7 to 8 percent of villages. Seminars and workshops and
the unspecified programmes were held for more than 5 times in only 3 to 4 percent of villages.
3.3.3 Incentives provided
While participating in the NYKS programmes the participants are generally provided
certain incentives in the form of cash, food, article etc., an attempt has been made to find out
whether such incentives inanyl of the form has been provided to the participants and the extent of
provision of incentives. The information so obtained is given in table 3.21

VISION
43
Table 3.21 The extent to which incentives were provided to the participants
Informants
Whether any
incentive is
provided
Number Percentage
Yes 665 89.4
No 79 10.6
Total 744 100.0
The incentives have been provided in about 90 percent of the villages and thus the over all
position with regard to provision of incentives could be taken as satisfactory. But a state wise
analysis of the information shown in table 3.22 indicates that it is only in two of the six States viz.,
Assam and Manipur that the incentives have been paid in 100% of the cases. The situation in
these states is excellent. The worst affected State is Bihar where in as many as 31% of the
villages the incentives have not been paid. In other States the incentives are not paid in about 5
to 15 percent of the villages. The district wise analysis localizes the problem area to facilitate the
administrators to concentrate their remedial action so that with minimum effort the situation may
be rectified further and improvement can be brought. The results of our district wise analysis is
presented in table 3.23.
Table 3.22 The State wise position of payment of incentives to the
participants in the programmes
% within state
Provided /not Information on incentives provided
State yes No Total
Assam 100.0% 100.0%
Bihar 69.5% 30.5% 100.0%
Jharkhand 87.9% 12.1% 100.0%
Orissa 83.3% 16.7% 100.0%
W.Bengal 94.4% 5.7% 100.0%
Manipur 100.0% 100.0%
Total 89.4% 10.6% 100.0%

VISION
44
Table 3.23 District wise position regarding payment of Incentives.
% within district Whether Incentives provided or no
(% of villages) District
Yes No Total
vaisali 76.7% 23.3% 100.0%
muzzafarpur 62.1% 37.9% 100.0%
gumla 87.5% 12.5% 100.0%
hazaribag 88.0% 12.0% 100.0%
kalahandi 100.0% 100.0%
jagatsinghpur 42.1% 57.9% 100.0%
khurda 100.0% 100.0%
koraput 90.0% 10.0% 100.0%
imphal 100.0% 100.0%
nalbari 100.0% 100.0%
kamrup 100.0% 100.0%
silchar 100.0% 100.0%
diamond Harbour 85.0% 15.0% 100.0%
cooch bihar 92.5% 7.5% 100.0%
Howrah 100.0% 100.0%
Bankura 100.0% 100.0%
Total 89.4% 10.6% 100.0%
Out of the 16 districts taken up for the study incentives have been paid on 100% basis only in
case of the Eight Districts viz., Kalahandi, Khurda, Imphal, Nalbari, Kamrup, Silchar, Howra and
Bankura. The situation is alarming and may need immediate attention in the case of
Jagatsinghpur since in that district in as many as 58% of the cases the incentives have not been
paid. Both the Districts of Bihar also do need attention as the cases where incentives were not
paid in these districts accounted for 38% in Muzzafarpur and 23% in Vaisali. In both the Districts
Gumla and Hazaribagh of the newly formed State of Jharkhand the defect of non payment of
incentives was observed in about 12% of the cases. In West Bengal there were 15% of unpaid
cases in Diamond Harbour where as there was only 7.5.% such cases in Cooch Bihar. North East
has shown the better result there being no defective cases.
3.3.4 Number of Development Projects undertaken

VISION
45
NYKS programmes are utilized for undertaking development projects especially in the rural areas
with the help of the rural youth for the overall development of rural sector. As it was desired to
find out the number of various development projects undertaken with the support of NYKS, a
specified number of development projects were considered. The four projects that were taken up
are
§ Road Construction
§ Maintenance of Community Assets
§ Social Development camps
§ Development of Playgrounds.
In case of each of the above four programmes the number of projects that were undertaken was
ascertained from the informants. The results obtained has been presented in Table 3.24 in terms
of percentage of villages for each development activity separately according to number of
Projects carried out with the support of NYKS. None of the selected four projects have been
undertaken in all the villages. Maintenance of Community assets was not undertaken in about
one sixth of the villages: No road construction was taken up in about one fifth of the villages:
Social Development Camps were not organized in about one fourth of the villages and
development of play grounds did not happen in about one third of the villages. It is interesting to
note that in 10% of the villages 11 projects of road construction in each village has been taken up
and in about 5% of the villages 11 projects each on maintenance of community assets and Social
Development Camps have been undertaken. In about 50% or more villages at least two projects
of each type has been carried out. In about 85% of the villages there had not been more than 5
projects of any type. Projects on other topics not specified here had not been conducted more
than once in 90% of the villages.

VISION
46
Table. 3.24 The extent of Development Programmes undertaken with the support of NYKS
%with in each project
Percentage of villages for each project as per number of projects
Project
No.
of
Projects
Road
Constn.
Maintenance of
Community assets
Social
Develot.
Camps
Developt.
of play
grounds
Any
other
progms.
Percent Percent Percent Percent Percent
0 19.6 16.4 23.4 32.0 29.6
1 23.0 36.8 21.2 21.4 59.9
2 26.7 6.3 22.2 15.5 3.0
3 12.4 15.9 9.3 10.2 1.6
4 4.7 5.8 7.7 3.8 3.8
5 4.3 5.6 3.4 2.2
6 1.2 4.8 2.3 8.7
7 2.0 1.3 0.8
8 1.7 1.6
9 0.5 0.4 1.7
10 10.1 5.6 5.2 4.3
Total 100.0 100.0 100.0 100.0 100.0
3.3.5 Women participation
The need for giving appropriate opportunity for women folk in the developmental activities needs
no emphasize. To take any further step in ths regard it is necessary to assess the current level of
participation of women in all these programmes. For the purpose of our study the level of
participation was put into four categories as follows
§ High – where participation is 75% and above
§ Moderate – where participation is between 50 to 75%
§ Low – Were participation is between 10 to 50%
§ Insignificant or no participation – Where participation is below 10%
The position regarding the women participation in the programmes were collected from the
informants and the information is tabulated and presented in table 3.25
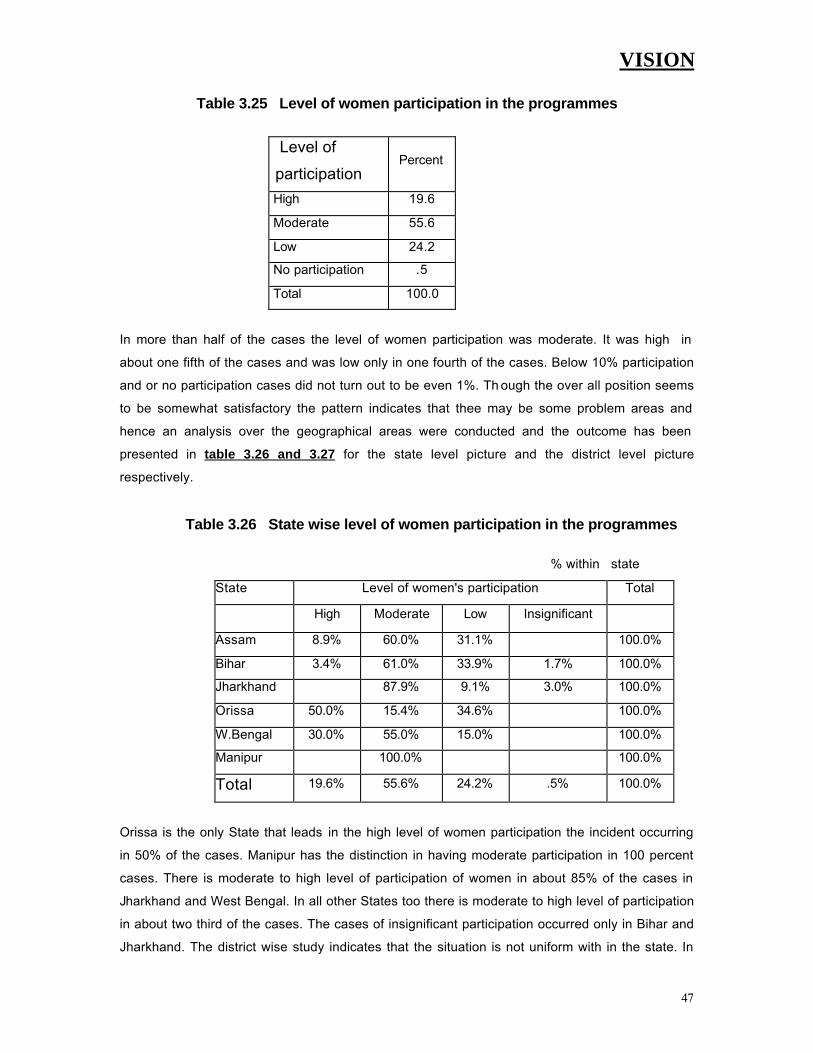
VISION
47
Table 3.25 Level of women participation in the programmes
Level of
participation Percent
High 19.6
Moderate 55.6
Low 24.2
No participation .5
Total 100.0
In more than half of the cases the level of women participation was moderate. It was high in
about one fifth of the cases and was low only in one fourth of the cases. Below 10% participation
and or no participation cases did not turn out to be even 1%. Th ough the over all position seems
to be somewhat satisfactory the pattern indicates that thee may be some problem areas and
hence an analysis over the geographical areas were conducted and the outcome has been
presented in table 3.26 and 3.27 for the state level picture and the district level picture
respectively.
Table 3.26 State wise level of women participation in the programmes
% within state
State Level of women's participation Total
High Moderate Low Insignificant
Assam 8.9% 60.0% 31.1% 100.0%
Bihar 3.4% 61.0% 33.9% 1.7% 100.0%
Jharkhand 87.9% 9.1% 3.0% 100.0%
Orissa 50.0% 15.4% 34.6% 100.0%
W.Bengal 30.0% 55.0% 15.0% 100.0%
Manipur 100.0% 100.0%
Total 19.6% 55.6% 24.2% .5% 100.0%
Orissa is the only State that leads in the high level of women participation the incident occurring
in 50% of the cases. Manipur has the distinction in having moderate participation in 100 percent
cases. There is moderate to high level of participation of women in about 85% of the cases in
Jharkhand and West Bengal. In all other States too there is moderate to high level of participation
in about two third of the cases. The cases of insignificant participation occurred only in Bihar and
Jharkhand. The district wise study indicates that the situation is not uniform with in the state. In

VISION
48
Orissa, Khurda and Koraput have the distinction of being the only districts where high level
participation of women in the programmes have been ensured in 100% of the cases. At the same
time Jagatsinghpur of Orissa has the dubious distinction of being the only district where in all the
100 percent cases the level of participation was found to be low, definitely a cause of concern.
Imphal being the only district from Manipur naturally has the moderate participation in all the 100
percent cases.
Table 3.27. District wise level of participation of women in the programmes
% Within district
Level of women's participation District
High Moderate Low Insignificant Total
Vaisali 90.0% 10.0% 100.0%
Muzzafarpur 6.9% 31.0% 58.6% 3.4% 100.0%
Gumla 75.0% 25.0% 100.0%
Hazaribagh 92.0% 4.0% 4.0% 100.0%
Kalahandi 60.0% 40.0% 100.0%
Jagatsinghpur 100.0% 100.0%
Khurda 100.0% 100.0%
Koraput 100.0% 100.0%
Imphal 100.0% 100.0%
Nalbari 77.4% 22.6% 100.0%
Kamrup 22.2% 77.8% 100.0%
Silchar 25.0% 75.0% 100.0%
Diamod Harbar 65.0% 30.0% 5.0% 100.0%
Cooch Bihar 25.0% 65.0% 10.0% 100.0%
Howrah 5.0% 50.0% 45.0% 100.0%
Bankura 25.0% 75.0% 100.0%
19.6% 55.6% 24.2% .5% 100.0%
In Bihar Vaisali has recorded moderate participation in 90% of the cases where as Muzzafarpur
has recorded low participation in about 58% of the cases showing disparity between the districts
within the State, whereas in the newly born state of Jharkhand the moderate participation has
been observed in 75% or more cases in both the districts of Gumla and Hazaribagh. Incidentally it
is only in Muzzafarpur and Hazaribagh that the cases of insignificant participation has occurred in
about 3 to 4% of the cases. In the case of Assam, in Silchar District the moderate and high levels
of participation together had accounted for all the 100% of the cases, where as in the case of

VISION
49
Nalbari moderate participation has been recorded in 77 % of the cases and contrary to it in the
district of Kamrup low participation has been recorded in about 75% of the cases causing concern
and exhibiting the high level of disparity with in the state. In the case of West Bengal the high
level of participation was found in 65% of the cases in Diamond Harbour where it was the
moderate level of participation that was found in 65% of the cases in Cooch Bihar. In Howrah the
cases were more or less equally distributed between moderate and low level of participation.
Bankura had high level of participation in one fourth of the cases and moderate level of
participation in the other three fourth of the cases. There is a greater level of disparity between
the Districts.
3.4 PROGRAMME EFFECTIVENESS/IMPACT-II
3.4.1 Visit of NYKS officials to the districts
The effectiveness of the programmes of NYKS mostly depends upon the frequency of visits of the
officials to the districts. The visit of the officals for the purpose of the study has been categorized
into five groups depending upon the periodicity of heir visit and they are
§ Once in a week
§ Once in a month
§ Once in three months
§ Once in more than 3 months
§ Rarely
The information obtained in this regard have been tabulated and presented in Table 3.28. In
nearly 80% of the cases at least once in a month a visit by the NYKS officials is made to the
Districts. The cases of no visit at least once in three months comes to less than 10% of the cases.
Where do the cases of no visits lie could be understood by an analysis over geographical area so
that remedial actions can be concentrated in those limited pockets. The state wise position is
indicated in table 3.29

VISION
50
Table 3.28 Frequency of visits of officials of NYKS to the districts.
Frequency of visits by any of the
NYKS officials to Districts.
Percent
Once in a week 21.0
Once in a month 58.1
Once in three months 12.1
Once in more than three months 1.9
Rarely 7.0
Total 100.0
West Bengal and Manipur are the only State where in at least once in a month the visit has been
paid by the NYKS officers in 100 % cases. Of the two district West Bengal stands ahead ion this
matter as in nearly half of the cases in West Bengal visits have been made once in a week where
as not even in one case a weekly visit has been made anywhere Manipur.
Table 3.29 State wise position of visits by NYKS officials to the districts.
% Within state
Percentage with in state of number of visits made by NYKS
officials to the Districts. Total
State Once in a
week
Once or in
a month
once in
three
months
once in more
than
3 months
Rarely
Assam 13.3% 56.7% 30.0% 100.0%
Bihar 1.7% 62.7% 13.6% 1.7% 20.3% 100.0%
Jharkhand 3.0% 78.8% 18.2% 100.0%
Orissa 35.9% 33.3% 12.8% 7.7% 10.3% 100.0%
W. Bengal 45.0% 55.0% 100.0%
Manipur 100.0% 100.0%
21.0% 58.1% 12.1% 1.9% 7.0% 100.0%
In Bihar, Jharkhand and Orissa thee had not been even one visit in three months in about one
fifth of the cases. The district wise analysis is given in table 3.30 Koraput stands to be the best
District of all as it has recorded weekly visits by the NYKS officials in 100% cases. In West
Bengal the pattern of visit is uniform over all the four Districts, Diamond Harbour, Cooch Bihar,
Howrah and Bankura in 40 to 50% cases there being weekly visits and in the rest their being

VISION
51
monthly visits. Khurda district of Orissa also falls in the same category. In contrary to West
Bengal in the case Bihar, in 96 % of the cases there had been at least one visit in a month in
Vaisali district where as in Muzzafarpur there had rarely been any visit in 45% of the cases
exhibiting a grate disparity between the two districts. In Jharkhand again the situation was more
or less uniform over the two districts there being at least one visit in a month in about 75 to 85%
of the cases and in the rest there being no visit with in three months.
Table 3.30 District wise details of visit by NYKS officials
% within district
Percentage with in state of number of visits made by
NYKS officials to the Districts. Total
District Once
in a
week
Once
In a
month
once in
three
months
once in more
than 3
months
Rarely
Vaisali 3.3% 93.3% 3.3% 100.0%
Muzzafarpur 31.0% 24.1% 3.4% 41.4% 100.0%
Gumla 75.0% 25.0% 100.0%
Hazaribag 4.0% 80.0% 16.0% 100.0%
Kalahandi 75.0% 25.0% 100.0%
Jagatsinghpur 52.6% 5.3% 42.1% 100.0%
Khurda 42.1% 57.9% 100.0%
Koraput 100.0% 100.0%
Imphal 100.0% 100.0%
Nalbari 38.7% 61.3% 100.0%
Kamrup 66.7% 33.3% 100.0%
Silchar 43.8% 56.3% 100.0%
Diamond harbour 45.0% 55.0% 100.0%
Cooch bihar 45.0% 55.0% 100.0%
Howrah 50.0% 50.0% 100.0%
Bankura 40.0% 60.0% 100.0%
21.0% 58.1% 12.1% 1.9% 7.0% 100.0%
In all the three districts, Nalbari, Kamrup and Silchar there had been at least one visit with
in three months though in the case of Silchar there had not been any visit with in a month

VISION
52
in about 56% of the cases. Among the three Nalbari has fared better with at lest one visit in
a month all the 100% cases. In Kamrup thee had been one visit in a month in about two
third of the case and a visit in three months in about one third of the cases. . In Orissa we
have talked about Koraput and Khurda already. In Kalahandi thee had been one visit in a
month in about three fourth of the cases and in the remaining one fourth the gap between
the visits has remained as more than three months. Jagatsinghpur has been observed to
be the worst performing district as there had not even a single case where in there had
been at least one visit in a month and in more than 40% of the cases rarely any visit has
been made. Jagatsinghpur needs the immediate attention of the authorities.
3.4.2 Perceived Effect of visits on the programme.
Whether the visits made by the NYKS officials are mer perfunctory vilsits or fruitful visit producing
any effect on the programmes or activities of NYKS. This aspect has been separately
investigated and the result is presented in the chart 3.15
Chart 3.15 Percentage of cases where the visit produced some effect
The over all picture reveals that in more than three fourth of the cases the visits of the NYKS
officials were fruitful and effective having an impact on the programmes / activities of NYKS.
Though it is only in 22% of the cases that the informants have reported that the visits did not
make any effect on the programmes, the deilseere to bring further improvement makes one to
look at the state level and at the district level. The results of the state level analysis is presented
in table 3.31 and that of the district level analysis in table 3.32
78.0
22.0
yes
No
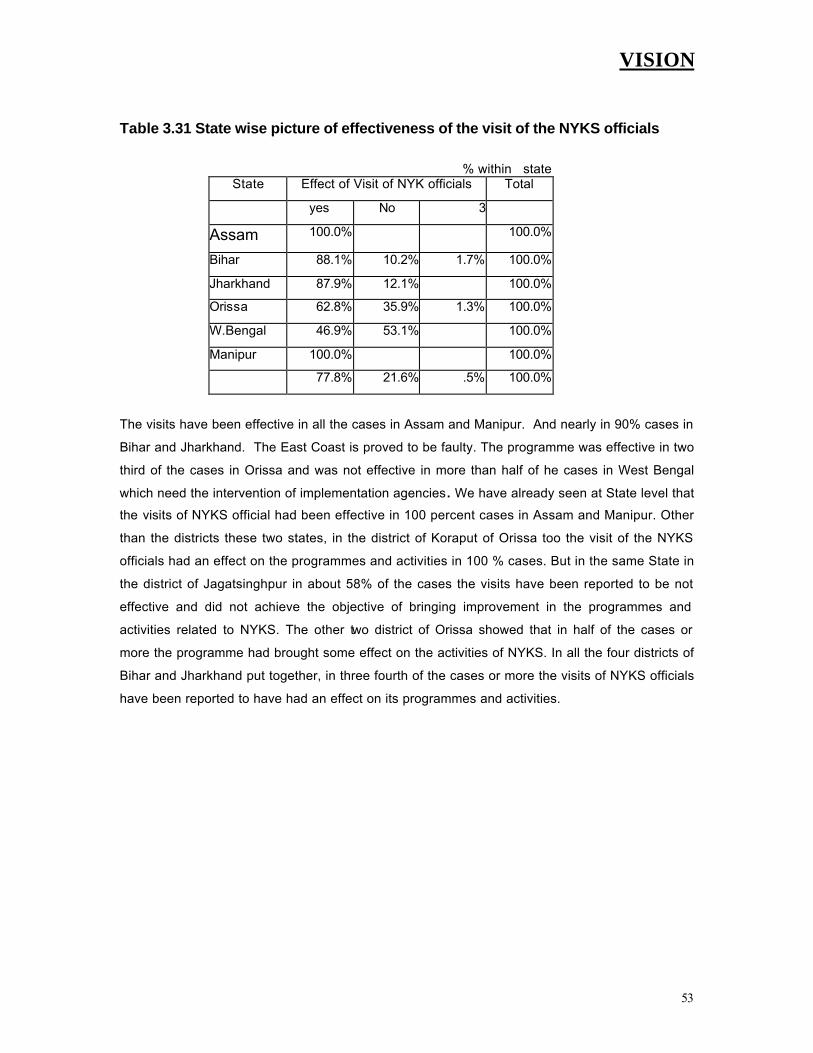
VISION
53
Table 3.31 State wise picture of effectiveness of the visit of the NYKS officials
% within state
State Effect of Visit of NYK officials Total
yes No 3
Assam 100.0% 100.0%
Bihar 88.1% 10.2% 1.7% 100.0%
Jharkhand 87.9% 12.1% 100.0%
Orissa 62.8% 35.9% 1.3% 100.0%
W.Bengal 46.9% 53.1% 100.0%
Manipur 100.0% 100.0%
77.8% 21.6% .5% 100.0%
The visits have been effective in all the cases in Assam and Manipur. And nearly in 90% cases in
Bihar and Jharkhand. The East Coast is proved to be faulty. The programme was effective in two
third of the cases in Orissa and was not effective in more than half of he cases in West Bengal
which need the intervention of implementation agencies . We have already seen at State level that
the visits of NYKS official had been effective in 100 percent cases in Assam and Manipur. Other
than the districts these two states, in the district of Koraput of Orissa too the visit of the NYKS
officials had an effect on the programmes and activities in 100 % cases. But in the same State in
the district of Jagatsinghpur in about 58% of the cases the visits have been reported to be not
effective and did not achieve the objective of bringing improvement in the programmes and
activities related to NYKS. The other two district of Orissa showed that in half of the cases or
more the programme had brought some effect on the activities of NYKS. In all the four districts of
Bihar and Jharkhand put together, in three fourth of the cases or more the visits of NYKS officials
have been reported to have had an effect on its programmes and activities.

VISION
54
Table 3.32 District effectiveness of the visits of NYKS officials.
% within district
District Effect of Visit of NYK officials Total
yes No N.R.
Vaisali 96.7% 3.3% 100.0%
Muzzafarpur 79.3% 17.2% 3.4% 100.0%
Gumla 75.0% 25.0% 100.0%
Hazaribag 92.0% 8.0% 100.0%
Kalahandi 50.0% 50.0% 100.0%
Jagatsinghpur 36.8% 57.9% 5.3% 100.0%
Khurda 63.2% 36.8% 100.0%
Koraput 100.0% 100.0%
Imphal 100.0% 100.0%
Nalbari 100.0% 100.0%
Kamrup 100.0% 100.0%
Silchar 100.0% 100.0%
Diamod harbour 50.0% 50.0% 100.0%
Cooch bihar 47.5% 52.5% 100.0%
Howrah 50.0% 50.0% 100.0%
Bankura 40.0% 60.0% 100.0%
77.8% 21.6% .5% 100.0%
In the case of West Bengal, in the district Bankura in 60% of the cases it has been said that the
visits of the official had not brought any change in the situation with regard to the programmes
and activities of NYKS, whereas in all the other three districts in about 50% of the cases the visits
have been reported to have brought some change with regard to the programmes and activities.
3.4.3 Public participation
We have already discussed the participation of women in the programmes of NYKS. Now we
would see the participation of public in general in the programmes of NYKS. For the purpose as
in the earlier case the level of participation has been classified into four groups depending upon
the percentage level of participation as indicated below
§ High – 75% and above
§ Moderate – 50 to 75%

VISION
55
§ Low – 10 to 50%
§ Insignificant - Below 10%
Ascertaining the level of participation and classifying the same as above it has been found that in
nearly half of the cases the
Chart 3.16 Level of public participation in the programmes of NYKS
Participation of the public had been moderate and High level participation as well as low level
participation were recorded in about one fourth of the cases each. The overall situation has been
presented in chart 3.16. The cases where public participation was insignificant did not account
even for 1% of the total. As had been done in all other cases analysis over the geographical
jurisdictions were also made and the situations at State level and district level are drawn up in
tables 3.33.and 3.34 respectively.
Table 3.33 State wise level of public participation in the programmes of NYKS.
% within state Level of Public Participation in the Programmes of
NYKS State
High Moderate Low Insignificant
Total
Assam 25.6% 54.4% 20.0% 100.0%
Bihar 16.9% 64.4% 18.6% 100.0%
Jharkhand 6.1% 84.8% 9.1% 100.0%
Orissa 33.3% 10.3% 53.8% 2.6% 100.0%
W.Bengal 36.9% 33.1% 30.0% 100.0%
Manipur 6.3% 93.8% 100.0%
24.9% 48.3% 26.3% .5% 100.0%
24.9
48.3
26.3
0.50.0
10.0
20.0
30.0
40.0
50.0
60.0
High
Moder
ate
Low
Insig
nific
ant
level of participation
per
cen
tag
e o
f ca
ses

VISION
56
The level of public participation was high in more than one third of the cases in Orissa and West
Bengal,in about one fourth of the cases in Assam and one sixth of the cases in Bihar. In both
Jharkhand and Orissa it is just in 6% of the cases that the informants have reported about high
level of participation by the public . However in the case of both these States in about 85 to 94%
of the cases the level of participation was found to be moderate. In addition to these two states in
the states of Assam and Bihar too in about 80% of the cases the level of public participation was
either moderate or high. It is again only in Orissa that the level of participation was low in about
53% of the cases and insignificant n about 3% of the cases where one has to intensify the
remedial actions.
Table 3.34 District wise level of public participation in the programmes of NYKS
% within district
District Level of Public Participation in the Programmes of
NYKS Total
High Moderate Low Insignificant
Vaisali 16.7% 76.7% 6.7% 100.0%
Muzzafarpur 17.2% 51.7% 31.0% 100.0%
Gumla 87.5% 12.5% 100.0%
Hazaribag 8.0% 84.0% 8.0% 100.0%
Kalahandi 100.0% 100.0%
Jagatsinghpur 100.0% 100.0%
Khurda 31.6% 42.1% 15.8% 10.5% 100.0%
Koraput 100.0% 100.0%
Imphal 6.3% 93.8% 100.0%
Nalbari 22.6% 29.0% 48.4% 100.0%
Kamrup 48.1% 40.7% 11.1% 100.0%
Silchar 9.4% 90.6% 100.0%
Diamod harbour 75.0% 20.0% 5.0% 100.0%
cooch bihar 37.5% 32.5% 30.0% 100.0%
Howrah 25.0% 25.0% 50.0% 100.0%
Bankura 10.0% 55.0% 35.0% 100.0%
24.9% 48.3% 26.3% .5% 100.0%
Koraput in Orissa is the only district having the distinction where in high level of public
participation has been observed in 100% cases. But the performance over the various districts of

VISION
57
Orissa is erratic. In both Jagatsinghpur and Kalahandi districts the level of public participation was
low in all the cases exhibiting that they are the worst districts that may need. Immediate attention.
In another district Khurda of Orissa the level of participation was either moderate or high in about
three fourth of the cases and low or insignificant in about one fourth of the cases. Incidentally this
is the only district which has recorded insignificant participation that too to the level of 11 % of the
cases. Other than Koraput the only other district where the level of public participation was found
to be high in more than half in fact in three fourth of the cases was Diamond Harbour of West
Bengal. Though in the two districts Cooch Bihar and Bankura of the same state the level of
participation was either moderate or high in about two third of the cases, the participation level
was found to be low in50% of the cases in Howrah. In the neighbouring state Assam, the level of
participation was either moderate or high in 100 of the cases in Silchar and about 90% of the
cases in Kamrup where as the participation was low in as high as a48% of the cases. In Bihar,
Vaisali had about 95% of moderate or high level public participation where as the participation
was found to be low in about one third of the cases in Muzzafarpur. In the newly born state of
Jharkhand there was not much of disparity between the two districts Gumla and Hazaribagh, the
level of moderate or high level participation in each of them being round about 90%.
3.4.4 Relationship between NYKS officials and the beneficiaries & community.
The relationship between NYKS officials and the beneficiaries and the community being a vital
factor or the implementation the programmes successfully, it was attempted to measure the same
in a graded decimal scale of 10 points where 10 stands for excellent and 1 stands for poor. The
informants were require to give the grading or rating according to their perception and the
information so obtain has been analyzed and the results are thrown in table 3.35
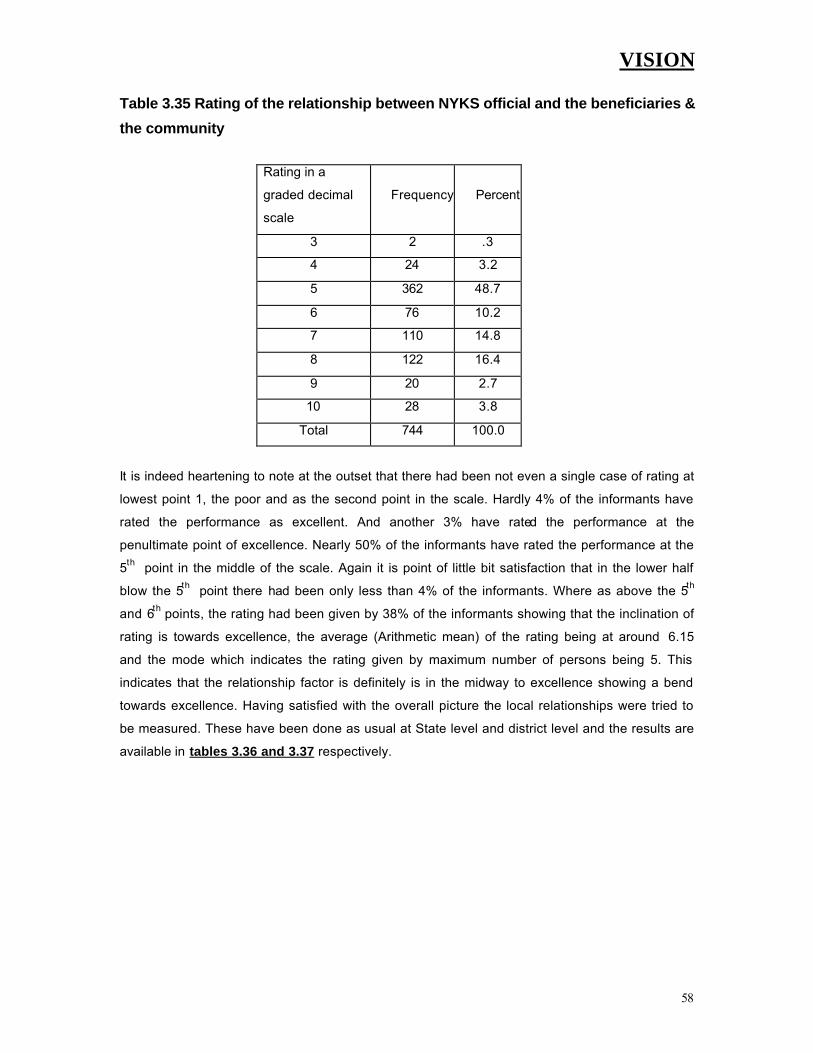
VISION
58
Table 3.35 Rating of the relationship between NYKS official and the beneficiaries &
the community
Rating in a
graded decimal
scale
Frequency Percent
3 2 .3
4 24 3.2
5 362 48.7
6 76 10.2
7 110 14.8
8 122 16.4
9 20 2.7
10 28 3.8
Total 744 100.0
It is indeed heartening to note at the outset that there had been not even a single case of rating at
lowest point 1, the poor and as the second point in the scale. Hardly 4% of the informants have
rated the performance as excellent. And another 3% have rated the performance at the
penultimate point of excellence. Nearly 50% of the informants have rated the performance at the
5th point in the middle of the scale. Again it is point of little bit satisfaction that in the lower half
blow the 5th point there had been only less than 4% of the informants. Where as above the 5th
and 6th points, the rating had been given by 38% of the informants showing that the inclination of
rating is towards excellence, the average (Arithmetic mean) of the rating being at around 6.15
and the mode which indicates the rating given by maximum number of persons being 5. This
indicates that the relationship factor is definitely is in the midway to excellence showing a bend
towards excellence. Having satisfied with the overall picture the local relationships were tried to
be measured. These have been done as usual at State level and district level and the results are
available in tables 3.36 and 3.37 respectively.
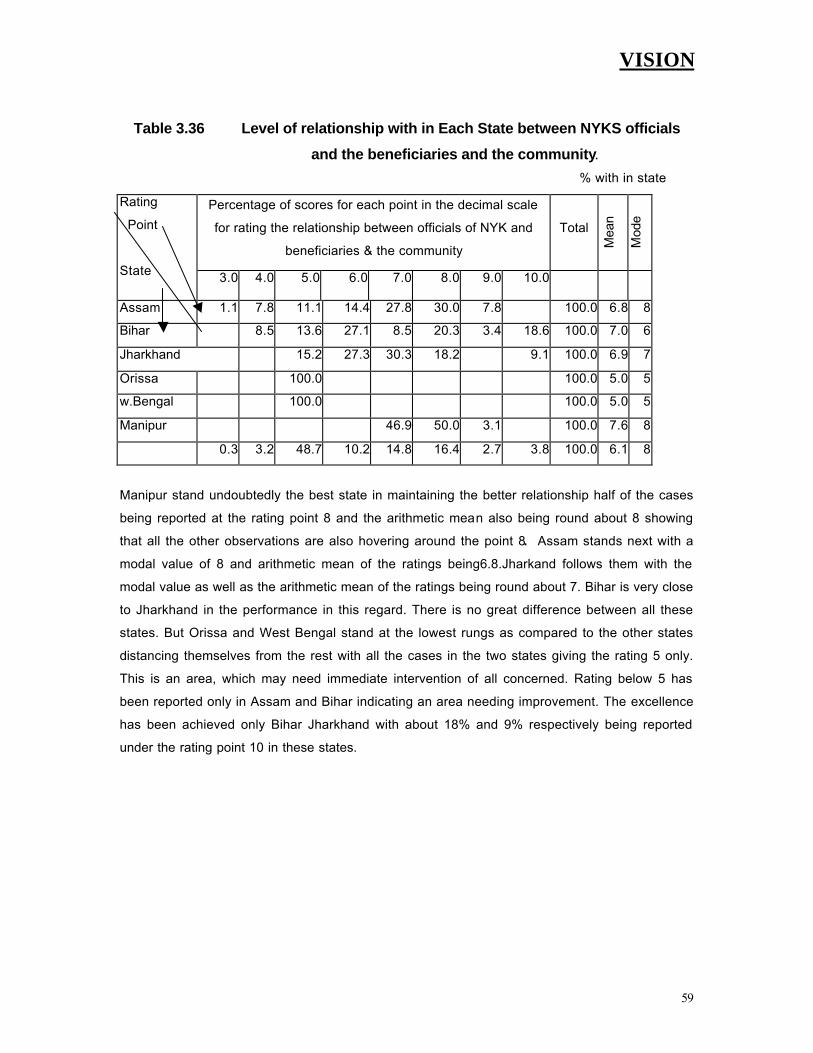
VISION
59
Table 3.36 Level of relationship with in Each State between NYKS officials
and the beneficiaries and the community.
% with in state
Percentage of scores for each point in the decimal scale
for rating the relationship between officials of NYK and
beneficiaries & the community
Total
Mea
n
Mod
e
Rating
Point
State 3.0 4.0 5.0 6.0 7.0 8.0 9.0 10.0
Assam 1.1 7.8 11.1 14.4 27.8 30.0 7.8 100.0 6.8 8
Bihar 8.5 13.6 27.1 8.5 20.3 3.4 18.6 100.0 7.0 6
Jharkhand 15.2 27.3 30.3 18.2 9.1 100.0 6.9 7
Orissa 100.0 100.0 5.0 5
w.Bengal 100.0 100.0 5.0 5
Manipur 46.9 50.0 3.1 100.0 7.6 8
0.3 3.2 48.7 10.2 14.8 16.4 2.7 3.8 100.0 6.1 8
Manipur stand undoubtedly the best state in maintaining the better relationship half of the cases
being reported at the rating point 8 and the arithmetic mean also being round about 8 showing
that all the other observations are also hovering around the point 8. Assam stands next with a
modal value of 8 and arithmetic mean of the ratings being6.8.Jharkand follows them with the
modal value as well as the arithmetic mean of the ratings being round about 7. Bihar is very close
to Jharkhand in the performance in this regard. There is no great difference between all these
states. But Orissa and West Bengal stand at the lowest rungs as compared to the other states
distancing themselves from the rest with all the cases in the two states giving the rating 5 only.
This is an area, which may need immediate intervention of all concerned. Rating below 5 has
been reported only in Assam and Bihar indicating an area needing improvement. The excellence
has been achieved only Bihar Jharkhand with about 18% and 9% respectively being reported
under the rating point 10 in these states.

VISION
60
Table 3.37 Level of relationship with in each district between NYKS officials
and the beneficiaries and the community
% within district
Percentage of scores for each point in the decimal scale for
rating the relationship between officials of NYK and
beneficiaries & the community
Rating pt
District. 3.0 4.0 5.0 6.0 7.0 8.0 9.0 10.0
Tot
al
Mea
n
Mod
e
Vaisali 3.3 16.7 13.3 13.3 36.7 6.7 10.0 100 7.2 8
muzzafarpur 13.8 10.3 41.4 3.4 3.4 27.6 100 6.8 6
Gumla 25.0 50.0 25.0 100 6.0 6
Hazaribag 12.0 20.0 32.0 24.0 12.0 100 7.2 7
Kalahandi 100.0 100 5.0 5
Jagatsinghpur 100.0 100 5.0 5
Khurda 100.0 100 5.0 5
Koraput 100.0 100 5.0 5
Imphal 46.9 50.0 3.1 100 7.6 8
Nalbari 3.2 12.9 32.3 48.4 3.2 100 7.4 8
Kamrup 3.7 25.9 29.6 22.2 11.1 3.7 3.7 100 5.4 5
Silchar 3.1 9.4 37.5 34.4 15.6 100 7.5 7
Diamodharbour 100.0 100 5.0 5
Cooch bihar 100.0 100 5.0 5
Howrah 100.0 100 5.0 5
Bankura 100.0 100 5.0 5
0.3 3.2 48.7 10.2 14.8 16.4 2.7 3.8 100 6.1 8
As Manipur is the best State natuaralyl Imphal the only district studies from that State is the best
district the statistics being the same as that for Maipur. . In Assam out of the three districts
studied it is only in Kamrup where the informants rated the relationship as below 5. Where as in
Bihar in both the districts the rating below 5 had occurred. It has already been seen that all the
cases (and hence in all the districts) in Orissa and West Bengal the rating has remained as 5. Out
of the two districts in Bihar Vaisali has fared better with a modal value of rating being 8 and the
arithmetic mean of the ratings being 6.8. However the range of the ratings in both the districts
remained the same as 4 to 10. In the case of Jharkhand, Hazaribagh has done better with its
modal value as well as arithmetic mean of the ratings being round about 7 where the same value
for Gumla is 6. Further the range of the ratings in the case of the former is 5 to 10 as against 5 to
7 in the case of the latter. In Assam Silchar and Nalbari have behaved more or less alike their

VISION
61
averages being round about 7 to 8 and their ranges being the same, where as Kamrup in addition
to longer range with a lower tail had the averages round about 5 only.
3.4.5 Ratings of implementation of the Programmes of NYKS .
The informants were asked to give their ratings in 10-point scale to measure the performance
with regard to implementation of the programmes of NYKS. For the purpose 9 important
programmes were identified and the informants were asked to rate each one of them individually.
The various programmes that were considered for the purpose such a rating were
§ Youth Club Development programmes
§ Vocational Training Projects
§ Awareness Generation
§ Work Camps
§ Sports Promotion Programmes
§ Cultural programmes
§ Adventure Promotion
§ Celebration of National Days
§ Seminar and workshops.
The perceptions of the informants so obtained have been quantified and the results are presented
in Table 3.38.

VISION
62
Table 3.38 Ratings of important programmes of NYKS.
% of cases for each programme
Percentage of cases with in each programme according to ratings made by
the informants.
Ra
ting
Pro
gra
mm
e
Pro
gms
yout
h cl
ub
de
velo
pt.
Voc
atio
nal
tra
inin
g
Aw
are
ness
gene
ratio
n w
ork
cam
ps
spor
ts
prom
otio
n
cultu
ral
prog
m.
adve
ntur
e
prom
otio
n
Cel
ebra
tion
of n
atio
nal
days
Sm
inar
s
&w
orks
hops
1 12.7 12.8 8.4 17.3 13.2 19.9 44.4 25.9 30.1
2 3.1 5.9 6.4 7.8 7.5 4.8 8.5 8.3 15.3
3 5.7 3.6 6.1 8.4 5.3 9.0 5.7 10.6 8.8
4 6.4 4.7 8.2 9.6 10.1 6.2 10.6 9.7 12.8
5 17.6 8.4 13.4 9.2 14.9 9.4 8.2 7.3 12.5
6 7.0 12.3 12.0 7.3 11.9 15.8 3.4 3.8 7.4
7 10.8 17.2 10.6 13.2 8.1 6.8 3.4 5.4 5.3
8 20.3 15.2 16.2 11.4 11.8 10.3 1.6 11.9 5.0
9 8.8 6.3 7.8 4.8 4.0 4.1 8.7 1.4 1.0
10 7.7 13.6 10.9 11.2 13.2 13.8 5.4 16.1 1.8
Total 100.0 100.0 100 100 100.0 100.0 100.0 100.0 100.0
Mean 5.89 6.09 5.94 5.24 5.54 5.35 3.52 4.83 3.55
Mode 8 7 8 1 5 1 1 `1 1
Range 1-10 1-10 1-10 1-10 1-10 1-10 1-10 1-10 1-10
Youth Club Development Programmes, Vocational Training Projects and Awareness Generation
have been rated comparatively high, the modal value of the ratings made by the informants being
round about 7 to 8 and the arithmetic mean of the observations being about 6. The only other
programme that had made a little better marking seems to be sports promotion programmes with
both the averages being near about 5 or 6. All the other programmes have unfortunately have a
modal value 1 meaning Large number of informants have rated them to be poor. Of these,
Adventure promotion seems to have fared worst with 44% of the informants rating the same as
poor In the case of seminar and workshops; too nearly one third of the people have rated the
same as poor.
(ii) Position over the States
(a) Youth Development Programmes.

VISION
63
This programme has been rated very high in Manipur with the mode being near excellence, Nine
in the ten-point scale and the arithmetic mean also being near 8. This is the only state where thee
had been no scoring in the lower part of the scale below 5. The three States Assam, Jharkhand
and Orissa had been just round about the middle of the scale and the rating can be called just
average. Bihar had the modal value one with large number of persons rating the implementation
as poor. In the NorthEast both in Assam and Manipur not even one person has rated the
implementation as excellent. The complete picture of the postion in different states is given in
table 3.39
Table 3.39 Percentage of ratings of implementation of Youth Club Development
programmes in each of the states.
Figures indicate % of cases as per rating within state
youth club development programme State
1.0 2.0 3.0 4.0 5.0 6.0 7.0 8.0 9.0 10.0 Mean Mode
Assam 18.6 1.2 8.1 9.3 22.1 16.3 16.3 8.1 4.7 5
Bihar 27.8 11.1 1.9 16.7 14.8 9.3 1.9 5.6 1.9 9.3 4.2 1
Jharkhand 10.7 7.1 7.1 39.3 3.6 17.9 14.3 5.6 5
Orissa 12.8 2.6 14.1 5.1 19.2 1.3 12.8 17.9 1.3 12.8 5.6 5
W.Bengal 2.2 6.6 17.2 45.9 17.2 10.9 7.9 8
Manipur 15.6 12.5 21.9 50.0 7.8 9
Total 12.7 3.1 5.7 6.4 17.6 7.0 10.8 20.3 8.8 7.7 5.8 8
(b) Vocational Training
This programme had a better rating for implementation almost all the states the mode being six or
more in all cases and the mean being round about 5 or more. Orissa and West Bengal have
recorded the rating as nearly excellent with mode being 10 and mean being roundabout 7 in both
the cases. Here Manipur has indicated the lowest rating its distribution of rating being bimodal
with one mode at 1 and the arithmetic mean being less than 5. West Bengal is the only State
where not even a single case has been rated as poor. The relevant statistics are presented in
table 3.40
Table 3.40 Percentage of ratings of implementation of Vocational Training
programmes in each of the states.

VISION
64
Figures indicate % of cases as per rating within state
Vocational training programme State
1.0 2.0 3.0 4.0 5.0 6.0 7.0 8.0 9.0 10.0 Mean Mode Assam 23.0 1.1 6.9 2.3 6.9 16.1 25.3 13.8 3.4 1.1 5.2 7 Bihar 15.5 8.6 1.7 1.7 10.3 12.1 3.4 25.9 20.7 6.1 8 Jharkhand 17.9 3.6 3.6 17.9 28.6 21.4 7.1 5.3 6 Orissa 1.3 5.1 5.1 16.7 10.3 9.0 16.7 5.1 9.0 21.8 6.6 10 W.Bengal 12.1 1.5 7.1 5.8 19.7 16.6 12.8 24.6 7.3 10 Manipur 31.3 3.1 3.1 12.5 31.3 15.6 3.1 4.9 1,7 Total 12.8 5.9 3.6 4.7 8.4 12.3 17.2 15.2 6.3 13.6 6.0 7
(c) Awareness generation
Here again West Bengal stands alone as high in the rating of the implementation of this
programme with mode being 10 and the arithmetic mean being 8. The State had not even a
single case of rating as poor. Orissa and Manipur stand next There had not been even a single
state with the arithmetic mean being less than 5. In Manipur the range was 3 to 8 indicating that
their were neither any poor or near cases nor any excellent cases or cases nearing excellence. In
the case of Assam and Jharkhand too there had been no case of excellence. Off all the States
the rating had been lowest in Bihar. This is the only state having a modal value at ‘1’. The
complete information with reference to all the states has been indicated in Table 3.41
Table 3.41 Percentage of ratings of implementation of Awareness Generation
programmes in each of the states.
Figures indicate % of cases as per rating within state Awareness generation
State 1.0 2.0 3.0 4.0 5.0 6.0 7.0 8.0 9.0 10.0 Mean Mode
Assam 10.1 3.4 6.7 18.0 12.4 14.6 18.0 14.6 2.2 5.2 4,7
Bihar 20.3 1.7 3.4 10.2 20.3 13.6 5.1 11.9 1.7 11.9 5.2 1,5
Jharkhand 13.8 3.4 3.4 31.0 3.4 6.9 31.0 6.9 5.7 5,8
Orissa 7.7 21.8 12.8 3.8 9.0 5.1 3.8 20.5 6.4 9.0 5.2 8
W.Bengal 1.9 3.1 1.3 11.3 8.8 1.3 16.9 23.1 32.5 8.0 10
Manipur 6.3 9.4 3.1 34.4 43.8 3.1 6.1 7
Total 8.4 6.4 6.1 8.2 13.4 12.0 10.6 16.2 7.8 10.9 5.9 5
(d) Work Camps

VISION
65
The ranting of implementation of this programme had not been satisfactory in many of the states.
Here again West Bengal stands alone with a modal value of 10 and arithmetic mean 7.6. Orissa
stands next with mode ‘8’ and mean 5.3. Jharkhand was just on the average. The state is the
only one that has not reported even a single case as Poor. The rating of the performance of this
scheme is at its worst in Assam the modal value being at ‘1’ with nearly 40% of the informants
rating the implementation as poor and the arithmetic mean being as low as 3.3. Bihar and
Manipur have also turned out the modal value as ‘1’ with about 25 5 of the informants in each of
these two states rating the implementation as poor. In addition to Assam and Manipur,
Jharkhand also has not recorded even a single case with a rating ‘10’. Figures for each state for
each rating point can be seen in table 3.42
Table 3.42 Percentage of ratings of implementation of Work Camps in each of the
states.
Figures indicate % of cases as per rating within state
Work camps State
1.0 2.0 3.0 4.0 5.0 6.0 7.0 8.0 9.0 10.0 Me Mo
Assam 40.7 7.0 17.4 5.8 2.3 10.5 3.5 11.6 1.2 3.3 1
Bihar 28.6 7.1 1.8 16.1 10.7 3.6 3.6 5.4 23.2 4.9 1
Jharkhand 3.0 6.1 3.0 15.2 42.4 9.1 15.2 6.1 5.1 5
Orissa 3.8 17.9 14.1 10.3 5.1 1.3 17.9 19.2 3.8 6.4 5.3 8
W.Bengal 1.9 3.1 7.5 1.9 11.9 23.8 5.6 15.6 28.8 7.6 10
Manipur 25.0 3.1 6.3 18.8 6.3 15.6 21.9 3.1 5.0 1
Total 17.3 7.8 8.4 9.6 9.2 7.3 13.2 11.4 4.8 11.2 5.2 1
(e) Sports Promotion Programme
Here again West Bengal has the distinction of standing high alone with modal value of 120 and
the arithmetic mean of 7.6 and having no records near about poor rating. Assam has the lowest
mode ‘1’ and Jharkhand has the lowest arithmetic mean 3.3 with its modal values also on the
lower side of the rating scale, the distribution of ratings in the state being bimodal with modal
values 2 and 4. Besides Manipur this is the only state not having any entry again the highest
point of the rating scale. Manipur though not having any entry against the rating 10. Stands next
only to West Bengal with a modal value 8 arithmetic mean 6.6. Table 3.43 will show the figures
for each of the points in the rating scale for each of the six districts where the study had been
undertaken.

VISION
66
Table 3.43 Percentage of ratings of implementation of Sports Promotion
Programmes in each of the states.
Figures indicate % of cases as per rating within state
sports promotion programme State
1.0 2.0 3.0 4.0 5.0 6.0 7.0 8.0 9.0 10.0 Me Mo
Assam 31.4 1.2 4.7 7.0 17.4 25.6 5.8 3.5 2.3 1.2 4.2 1
Bihar 15.3 8.5 3.4 11.9 15.3 6.8 8.5 16.9 13.6 5.4 8
Jharkhand 19.4 25.8 25.8 9.7 6.5 3.2 3.2 3.3 2,4
Orissa 2.8 16.7 12.5 11.1 8.3 5.6 20.8 6.9 5.6 9.7 5.4 7
W.Bengal 1.4 5.8 23.3 11.5 14.6 3.3 39.6 7.6 10
Manipur 6.3 3.1 3.1 9.4 6.3 6.3 9.4 37.5 18.8 6.6 8
Total 13.2 7.5 5.3 10.1 14.9 11.9 8.1 11.8 4.0 13.2 5.5 5
(f) Cultural Programme
Once again it is West Bengal which stands separately on a high pedestal with the modal value of
the ratings of implementation of this programmed being 10 and the arithmetic mean being 7.2.
Again there had been no ratings on the lowest two points of the measuring scale. Manipur though
is the only state not having any single entry against score ‘10’ stands next only to West Bengal in
its performance with a mode ‘8’ and mean ‘6’. All other states are having their modal value on the
lower part of the scale, Assam, Bihar and Jharkhand reporting nearly a40%, 30% and 25% of the
cases as poor. All these three states have their modal value at ‘1’. The percentages of informants
with in each state according to the ratings they have given for the implementation of this
programme has been worked out and shown along with the mean value and the modal value in
table 3.44
Table 3.44 Percentage of ratings of implementation of Cultural Programmes in
each of the states.
Figures indicate % of cases as per rating within state
Cultural programme State
1.0 2.0 3.0 4.0 5.0 6.0 7.0 8.0 9.0 10.0Me Mo
Assam 39.5 1.2 7.0 5.8 12.8 16.3 9.3 5.8 1.2 1.2 3.8 1
Bihar 29.3 8.6 3.4 6.9 8.6 12.1 8.6 5.2 1.7 15.5 4.7 1
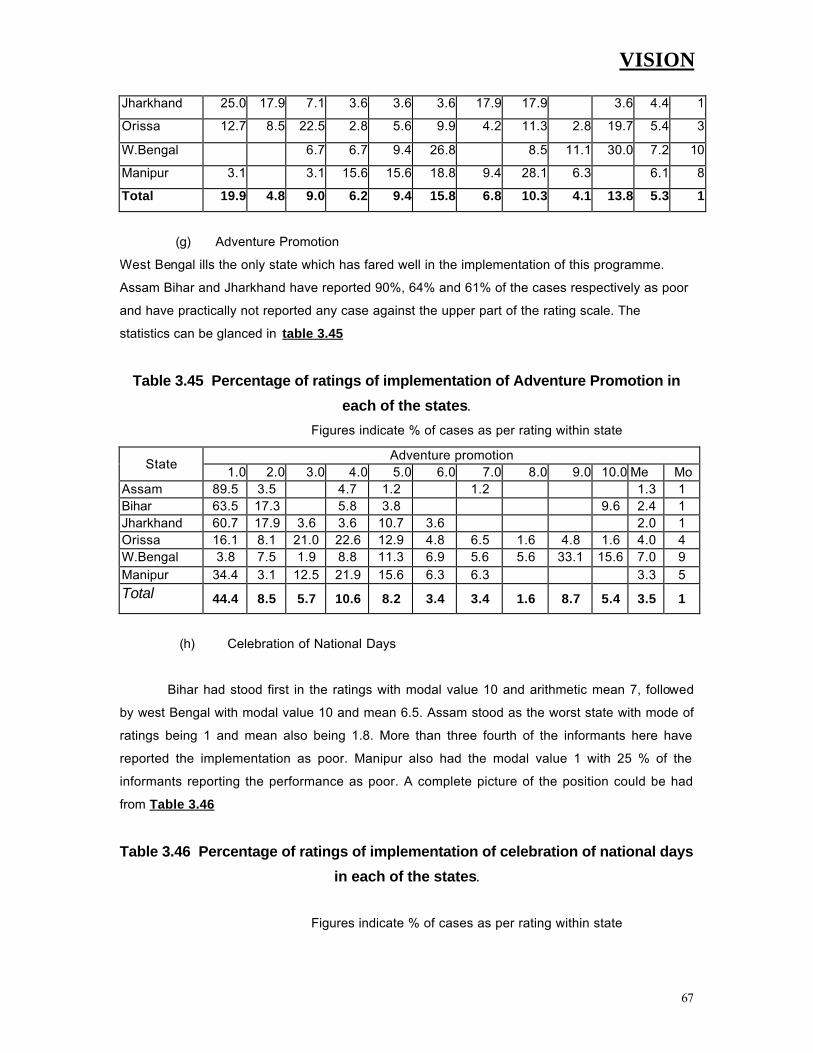
VISION
67
Jharkhand 25.0 17.9 7.1 3.6 3.6 3.6 17.9 17.9 3.6 4.4 1
Orissa 12.7 8.5 22.5 2.8 5.6 9.9 4.2 11.3 2.8 19.7 5.4 3
W.Bengal 6.7 6.7 9.4 26.8 8.5 11.1 30.0 7.2 10
Manipur 3.1 3.1 15.6 15.6 18.8 9.4 28.1 6.3 6.1 8
Total 19.9 4.8 9.0 6.2 9.4 15.8 6.8 10.3 4.1 13.8 5.3 1
(g) Adventure Promotion
West Bengal ills the only state which has fared well in the implementation of this programme.
Assam Bihar and Jharkhand have reported 90%, 64% and 61% of the cases respectively as poor
and have practically not reported any case against the upper part of the rating scale. The
statistics can be glanced in table 3.45
Table 3.45 Percentage of ratings of implementation of Adventure Promotion in
each of the states.
Figures indicate % of cases as per rating within state
Adventure promotion State
1.0 2.0 3.0 4.0 5.0 6.0 7.0 8.0 9.0 10.0 Me Mo Assam 89.5 3.5 4.7 1.2 1.2 1.3 1 Bihar 63.5 17.3 5.8 3.8 9.6 2.4 1 Jharkhand 60.7 17.9 3.6 3.6 10.7 3.6 2.0 1 Orissa 16.1 8.1 21.0 22.6 12.9 4.8 6.5 1.6 4.8 1.6 4.0 4 W.Bengal 3.8 7.5 1.9 8.8 11.3 6.9 5.6 5.6 33.1 15.6 7.0 9 Manipur 34.4 3.1 12.5 21.9 15.6 6.3 6.3 3.3 5
Total 44.4 8.5 5.7 10.6 8.2 3.4 3.4 1.6 8.7 5.4 3.5 1
(h) Celebration of National Days
Bihar had stood first in the ratings with modal value 10 and arithmetic mean 7, followed
by west Bengal with modal value 10 and mean 6.5. Assam stood as the worst state with mode of
ratings being 1 and mean also being 1.8. More than three fourth of the informants here have
reported the implementation as poor. Manipur also had the modal value 1 with 25 % of the
informants reporting the performance as poor. A complete picture of the position could be had
from Table 3.46
Table 3.46 Percentage of ratings of implementation of celebration of national days
in each of the states.
Figures indicate % of cases as per rating within state
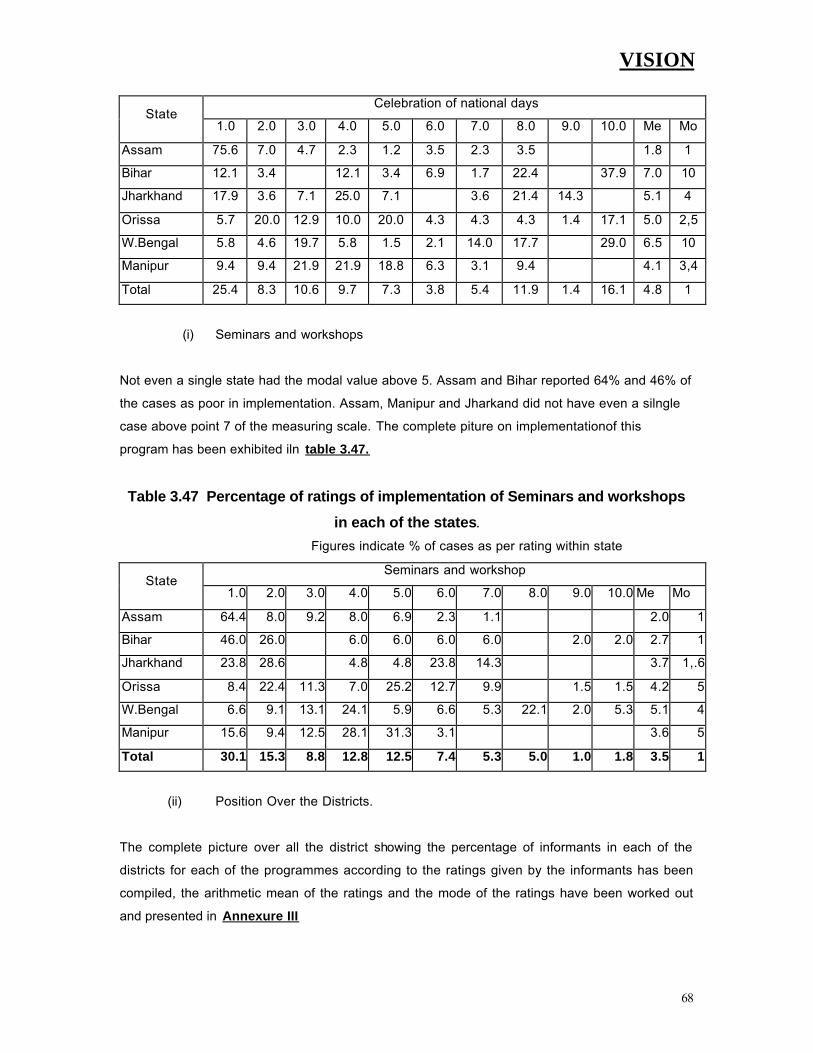
VISION
68
Celebration of national days State
1.0 2.0 3.0 4.0 5.0 6.0 7.0 8.0 9.0 10.0 Me Mo
Assam 75.6 7.0 4.7 2.3 1.2 3.5 2.3 3.5 1.8 1
Bihar 12.1 3.4 12.1 3.4 6.9 1.7 22.4 37.9 7.0 10
Jharkhand 17.9 3.6 7.1 25.0 7.1 3.6 21.4 14.3 5.1 4
Orissa 5.7 20.0 12.9 10.0 20.0 4.3 4.3 4.3 1.4 17.1 5.0 2,5
W.Bengal 5.8 4.6 19.7 5.8 1.5 2.1 14.0 17.7 29.0 6.5 10
Manipur 9.4 9.4 21.9 21.9 18.8 6.3 3.1 9.4 4.1 3,4
Total 25.4 8.3 10.6 9.7 7.3 3.8 5.4 11.9 1.4 16.1 4.8 1
(i) Seminars and workshops
Not even a single state had the modal value above 5. Assam and Bihar reported 64% and 46% of
the cases as poor in implementation. Assam, Manipur and Jharkand did not have even a silngle
case above point 7 of the measuring scale. The complete piture on implementationof this
program has been exhibited iln table 3.47.
Table 3.47 Percentage of ratings of implementation of Seminars and workshops
in each of the states.
Figures indicate % of cases as per rating within state
Seminars and workshop State
1.0 2.0 3.0 4.0 5.0 6.0 7.0 8.0 9.0 10.0 Me Mo
Assam 64.4 8.0 9.2 8.0 6.9 2.3 1.1 2.0 1
Bihar 46.0 26.0 6.0 6.0 6.0 6.0 2.0 2.0 2.7 1
Jharkhand 23.8 28.6 4.8 4.8 23.8 14.3 3.7 1,.6
Orissa 8.4 22.4 11.3 7.0 25.2 12.7 9.9 1.5 1.5 4.2 5
W.Bengal 6.6 9.1 13.1 24.1 5.9 6.6 5.3 22.1 2.0 5.3 5.1 4
Manipur 15.6 9.4 12.5 28.1 31.3 3.1 3.6 5
Total 30.1 15.3 8.8 12.8 12.5 7.4 5.3 5.0 1.0 1.8 3.5 1
(ii) Position Over the Districts.
The complete picture over all the district showing the percentage of informants in each of the
districts for each of the programmes according to the ratings given by the informants has been
compiled, the arithmetic mean of the ratings and the mode of the ratings have been worked out
and presented in Annexure III

VISION
69
(a) Youth Development Programmes.
Kalahandi is the only district, which has been rated high by the informants for implementing this
programme the modal value of the rating being 10 and arithmetic mean being more than 8.
Khurda have fared just the average where as the performance in Jagatsinghpur is just below
average. The performance at Koraput was not satisfactory, as nearly 50% of the informants have
reported the implementation as poor. 40% of the informants here have rated the implementation
as excellent. No person has rated the performance as poor here and the number of cases below
the rating point is only 5%. All the Districts in West Bengal have been rated fairly high more or
less uniformly. In Bihar Vaisali fared better than Muzzafarpur, 50 % of the informants in the latter
district reporting the implementation as poor. In Jharkhand the performance was just the average,
whereas Gumla was the worst district of all with the modal value of the rating being 1 and the
arithmetic mean also being just below 2. In Assam, Nalbari and Silchar were just on the average
level in performance where as Kamrup district was going in the lines of Gumla with its modal
value being 1 and arithmetic mean being round about 2.
(b) Vocational Training Programme
Kalahandi and Koraput in Orissa as well as Cooch Bihar and Bankura in West Bengal have all got
the reputation of having the best implementation with the modal value of their rating being 10 and
the arithmetic mean in all the cases being g about 8. Muzzafarpur also has a modal value of 10
but with a slightly lower arithmetic mean of about 7. The implementation was fairly good in all
other districts except Gumla wherein 60% of the informants reported the implementation to be
poor and the rest also have not rated the performance above 3.
(c) Awareness Generation
The three Districts Diamond Harbour, Cooch Bihar and Bankura of West Bengal and Khurda of
Orissa stood the best districts with modal value of the ratings of implementation as 10 and
arithmetic mean being about 8. Muzzafarpur follows the same with mode 10 and mean 6.
Howrah, Silchar, Imphal, Kalahandi and Hazaribagh have fared fairly well with fairly high ranking.
The performance of all other districts can be called average except in the case of Jagatsinghpur
where newly 32% have reported the performance as poor and another about 58% have not
ranked the performance above 3.
(c) Work Camps.
VISION
70
Only two districts Cooch Bihar and Howrah in West Bengal ranked the best with the modal value
of the ratings of the implementation as 10 and arithmetic mean about 8. The other two districts of
West Bengal, two districts Kalahandi and Khurda and Silchar in Assam had received fairly high
ratings of implementation by the informants. The performance can be said to be of average
quality of implementation in both the districts of Jharkhand and Jagatsinghpur of Orissa. In all
other districts the performance is below average, the worst hit districts being Nalbari and Kamrup
of Assam, where more than 50% of the informants in each of these districts have rated the
implementation of the programme as poor.
(e) Sports Promotion Programmes.
It is only the districts of West Bengal, all the four that had shown a better record of performance
of implementation with modal value of the ratings of performance by the informants being at 10
and the arithmetic mean ranging from 7.2 to 8.5. Vaisali in Bihar, Kalahandi in Orissa and Imphal
are the only districts where the implementation of the programme had been rated as fairly high. In
Silchar the performance could be said to be of average with ratings hovering round the mid point
of the measuring scale. In all other cases the implementation could not be said to be satisfactory.
The districts where the implementation was found to be worst comparatively are Nalbari and
Kamrup in Assam as about 50% of the informants in the former district and about 40% of the
informants in the latter district have rated the performance as poor. In both the districts the
arithmetic mean of the ratings of implementation had been near about 3 only.
(f) Cultural Programme
The three districts of West Bengal other than Howrah have stood the best among all the districts
in implementation of the Programme as the informants have rated them on the upper side of the
scale resulting in a modal value of the ratings as 10 and arithmetic mean about 7. Khurda in
Orissa follows them, which is the only other district where the mode of ratings of implementation
is 10 though the arithmetic mean is slightly lower being 6. IN Hazaribagh, Kalahandi and Imphal
the implementation had been rated fairly high. In Vaisali and Silchar districts the ratings were
centered around the mid point of the scale and hence the performance could be said to be
average. In all other districts the performance is below average. The districts where the
implementation had been comparatively found to be of the lowest order were Gumla and Kamrup
with 80% of the informants in the former district and 74% in the latter district rating the
implementation as poor.
(g) Adventure promotion

VISION
71
Diamond Harbour is the only district where the highest ratings for implementation had been
accorded by the maximum number of informants resulting in modal value of the ratings 10 and
the arithmetic mean of the ratings above 8. In two more districts of West Bengal viz., Cooch
Bihar and Howrah also the performance had been rated fairly high. IN the fourth district of West
Bengal viz., Bankura and Kalahandi of Orissa the ratings by the informants are huddled together
at the Centre of the measure scale and hence the performance could be said to be of average
standard. In as many as nine districts, all the districts of Bihar, Jharkhand, Assam and
Jagatsinghpur of Orissa maximum number of informants have reported the implementation of this
programme as poor. In Gumla, Kamrup and Nalbari 100% of the informants have rated the
implementation as poor indicating that these are the areas which need immediate attention of all
concerned.
(h) Celebration of National Holidays. Both the districts Vaisali and Muzzafarpur of Bihar, Kalahandi of Koraput and two districts Cooch
Bihar and Howrah of West Bengal stand comparatively on a higher pedestal with regard to
implementation of the programme with the modal value of the ratings by informant at 10 and the
arithmetic mean of the same being near about 7. In Bankura district of West Bengal the
implementation could be said to be of fairly high order. In Khurda and Hazaribagh maximum
number of informants have rated the implementation as just of average standard. In as many as
four districts, all the three of Assam and Gumla of Jharkhand more than 50% of the informants in
each of the districts have rated the implementation as poor. It had to be noted with concern that
only in the case of Nalbari all the informants had rated the implementation as poor.
(i) Seminars and workshops. Not even a single district had shown modal value 10 indicating the excellence. However in the
two districts Cooch Bihar and Howrah of West Bengal and Khurda of Orissa the implementation
could be said to be fairly good as the ratings had a modal value 8 in case of West Bengal and 7 in
case of Orissa with the mean being 5 or 6 in all these cases. In as many as five districts, the three
of Assam, Gumla and Muzzafarpur more than 50% of the informants have rated the
implementation as poor with rating ‘1’. Gumla and Kamrup could be said to be the worst districts
comparatively as in both the cases 80% of the informants have reported the implementation as
poor.

VISION
72
4.0 CONCLUSIONS 4.1 SUMMARY OF FINDINGS The major points of the analysis and the conclusions are summed up below. 4.1.1 Youth Club played a major Role in enrolling the youth for the various programmes. 4.1.2 Youth Club's role in enrolling the members was best in Orissa and worst in Assam. 4.1.3 The Block Coordinators of NYKS played the best roll in motivating the youth to get
associated with NYKS and the local NGOs played the least role. The leading roll players in the different States were as follows
♦ Block coordinators in Assam and Manipur ♦ Youth leaders in Bihar, Jharkhand & Orissa and ♦ NGOs in West Bengal
The poor players in the various States are listed below:
♦ Youth leaders in Assam ♦ Social workers and local NGOs in Bihar & Jharkhand ♦ National Service Volunteers in Orissa ♦ Block coordinator of NYKS in West Bengal and ♦ National Service Volunteers, Youth Leaders and Local NGOs in
Manipur.
4.1.4 The programmes on awareness of social issues was arranged in maximum number of villages where as Seminars and workshops were arranged in minimum number of villages.
4.1.5 The programmes that were arranged in at least 50% of the villages in a district are
♦ Programmes for Income Generation work Camps, Seminars and Workshops in Vaisali
♦ Youth Club Development and Work Programmes in Muzzafarpur ♦ Awareness Generation on relevant social issues and youth clubs development
in Gumla. ♦ Employment Generation, Seminar Workshops and Sports promotions in
Hazaribagh. ♦ Employment Generation/Income Generation for the Rural Youth in Khurda. ♦ Income Generation in Koraput. ♦ Employment Generation and Income Generation in Imphal. ♦ Employment Generataion, Income Generation Seminars and Workshops and
Sports promotion in Nalbari. ♦ Youth Club Development Work Camps Seminars and Workshops and Sports
promotion in Kamrup. ♦ Employment Generation, Income Generation and Seminars and Workshops in
Silchar. ♦ Employment and Income Generation in Cooch Bihar as well as Bankura.
4.1.6 The programmes that were organized in less than 10% of the villages in a district are: ♦ Work Camps in Muzzafarpur and Imphal ♦ Awareness generation Programmes, Sports Promotion Programmes and
Miscellaneous Programmes in Silchar

VISION
73
In all the selected villages of Manipur the Youth Development Programme had been organised.
4.1.7 Programmes related to Income generation, Youth Development and Sports promotion were more popular in all the states.
4.1.8 96% of the informants have reported that they have been benefited by NYKS
programmes. The unsatisfied informants belonged to Muzzafarpur, Hazaribagh, Gumla and Jagatsinghpur districts.
4.1.9 Awareness programmes in general had been organized in 92% of the selected
villages. Awareness Generation on AIDS and Environment protection that have been organized in more than 75% of the villages. Awareness Programmes on Abolition of untouchability, Dowry Prohibition, Communal harmony and Communicable diseases prevention take-up individually, in each one of them had been organized in round about one third of the villages or less than that only. Awareness programmes in communal harmony recorded the lowest response.
4.1.10 Awareness Generation on AIDS had been organised in all the selected villages in
Manipur. In Bihar all the eight intervention programmes had been conducted in more than 60% of the villages. In Orissa five programmes related to abolition of untouchability, Dowry Prohibition, Communal Harmony, Literacy Campaign and Family Planning have been organised in less than 10 percent of the villages.
4.1.11 In the districts of Kalahandi, Imphal, Silchar and Bankura the programmes related to
awareness Generation of AIDS had been conducted in 100% of the sampled villages. Awareness Generation Programmes related to Family Planning had been organised in 100% of the villages in the District of Diamond Harbour.
4.1.12 In Khurda each of the seven programmes other than the one related to AIDS could be
taken up in about 10% of the villages only. In Silchar awareness generation on dowry Prohibition could not be brought to even ten percent of the villages. In Howrah the programmes on prevention of communicable diseases and environment protection could be organised hardly in 10% of the villages. Nalbari could not organize programmes on Abolition of untouchability, Dowry Prohibition, Communal Harmony and Literacy Campaign and the programmes related to Family Planning was witnessed only in less than 10 of its villages. In Bankura Programmes on Communal harmony, Literacy Campaign and Family Planning could not be organised and the programmes on prevention of communicable diseases could be organised only in 5% of the villages. Jagatsinghpur had been the worst only two types of programmes related to awareness of AIDS and Environment Protection could be organised that too in 10% and 5% of the villages respectively.
4.1.13 Nearly in 91% of the villages the awareness generation programmes have made
significant changes in the community as envisaged by NYKS. West Bengal and Manipur are the only two states where every informant has said that the awareness programmes have brought in significant changes as has been envisaged by NYKS.
4.1.14 Jagatsinghpur is the only district where not even one informant has expressed that the
awareness programmes have brought any significant changes as envisaged by NYKS. This is an area of grave concern and aspect needs the attention of the authorities concerned.
4.1.15 Substantial change in the level of achievements / developments in any of the
development programmes of NYKS had been observed in less than 17% of the cases.
VISION
74
4.1.16 Registered Youth Clubs had played a major role as an implementing agency. Local bodies other than the Youth Club and NGOs have operated in less than one fourth of the selected villages.
4.1.17 The only activity which has been repeated more then 5 times in about one fourth of
the villages is Cultural Programme. In about 40% of the villages the adventure Promotion Programmes and the seminars and workshops have not been repeated at all.
4.1.18 In 90% of the selected villages the incentives have been provided. In Assam and
Manipur, and in the districts of Kalahandi, Khurda, Nalbari, Kamrup, Silchar, Howra and Bankura the incentives have been paid in 100% of the cases. In Bihar in as many as 31% of the villages the incentives have not been paid. The situation is alarming and may need immediate attention in the case of Jagatisinghpur since in that district in as many as 58% of the cases the incentives have not been paid.
4.1.19 Maintenance of Community assets was not undertaken in about one sixth of the
villages: No road construction was taken up in about one fifth of the villages: Social Development Camps were not organized in about one fourth of the villages and development of play grounds did not happen in about one third of the villages.
4.1.20 Participation of women was low in about one fourth of the selected villages. In
Manipur the participation of women was moderate in 100% of the cases. Insignificant participation was recorded in some of the cases only in Bihar and Jharkhand. In Orissa the participation was High in 100% of the cases in Jagatsinghpur.
4.1.21 In nearly 80% of the cases at least once in a month a visit by the NYKS officials is
made to the Districts. No visit had been made at least once in three months in less than 10% of the cases Koraput is the only district where at least once in a week visit had been paid in all the cases. In Jagatsinghpur not even a single visit had been made in any of the places with in a month. In Muzzafarpur rarely any visit had been made in more than 40% of the cases.
4.1.22 In more than 80% of the cases it had been reported that the visits of the NYKS official
had a positive impact on the programmes and activities of NYKS. In Assam and Manipur 100 effectiveness had been reported. In West Bengal 53% of the informants have reported that the visits did not make any material change in the situation with regard to the programmes of NYKS. In Kalahandi and Jagatsinghpur districts too in more than 50% of the cases it had been reported that the visits had been effective.
4.1.23 Public participation in the programmes of NYKS over all the villages over the three
levels high, moderate and low followed the pattern of a normal distribution. Orissa is the only State where the participation was low more than 50% of the cases, though Koraput district has the distinction of being the only district where the participation was high in 100% of the cases. Kalahandi and Jagatsinghpur are the only district where the participation was low in 100% of the cases and Khurda is the only district where the participation was found to be insignificant.
4.1.24 Relationship between NYKS official and the beneficiaries and the community has
been rated around below 5 in a 10 point scale in only in 3.5% of the case only. But 49% of the cases have been reported at the point 5 alone. Manipur had stood the best in relationship whereas Orissa and West Bengal had remained at the bottom of the comparative scale, with all the cases in these two states getting reported against point 5 only.
4.1.25 Youth Club Development programmes, Vocational Training Projects, Awareness
Generation stood as the best rated programmes with regard to implementation

VISION
75
whereas adventure promotion and Seminars & Workshops stood as the worst rated programmes comparatively. 44% of the informants rated the implementation of adventure promotion as the poorest and 30% rated the Seminars and Workshops as such.
4.1.26 In case of implementation of Youth Development Programme Manipur stands the best
and Bihar the worst among the states considered. In the case of Vocational Training, West Bengal and Orissa were the best and Manipur was the worst. West Bengal and Orissa were also the best in arranging Seminars & Workshops. West Bengal also stood the best in implementing awareness programmes, organizing work camp, sports promotion, Organizing Cultural Programmes and Adventure promotion. Bihar stood the best in celebrating the national days followed by West Bengal. But Bihar stood the worst in the case of awareness programmes. Assam remained at the bottom in organizing Workshops, Sports promotion organizing cultural programmes, Adventure promotion Celebration of National Days and arranging Seminars & Workshops. Jharkhand showed the poor performance in promotion of sports.
4.1.27 At District level Kalahandi was the best in implementation youth Development
programmes and Gumla the worst . Kalahandi, Koraput, Cooch, Bihar and Bankura scored excellent rating for implementation of vocational training and Gumla the poorest. Diamond Harbour, Cooch Bihar and Bankura and Khurda stood the best districts in executing awareness programmes and Jagatisinghpur stood the worst. Cooch Bihar and Howarh were on top in arranging the work Camps. All the districts of West Bengal were rated high in sports promotion. Nalbari and Kamrup were at the bottom in arranging work camps as well as in sports promotion. All the districts other than Howarh of West Bengal were the best in arranging cultural programmes whereas Gumla and Kamrup shoed the poorest performance. Diamond Harbour is the only district, which has been rated as excellent in adventure promotion where as in Gumla Kamrup and Nalbari all the informants have rated the performance as at the lowest point of the measuring scale. Vaisali, Muzzafarpur, Kalahandi, Cooch Bihar and Howarh stood comparatively on a higher pedestal with regarding celebration of National holidays whereas Kamrup is the only District where all the informants ranked the performance at the lowest point of the scale. Cooch Bihar and Howarh and Khurda were the best in arranging Seminars & Workshops and Gumla and Kamrup were the worst.
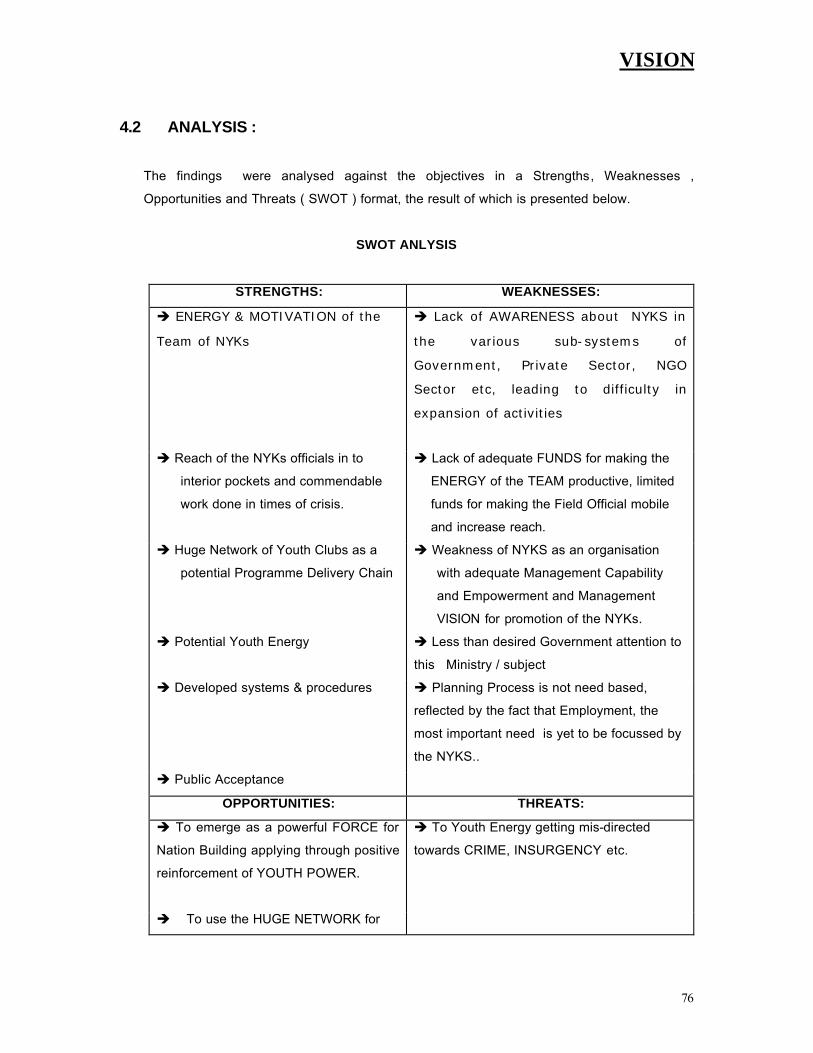
VISION
76
4.2 ANALYSIS :
The findings were analysed against the objectives in a Strengths, Weaknesses ,
Opportunities and Threats ( SWOT ) format, the result of which is presented below.
SWOT ANLYSIS
STRENGTHS: WEAKNESSES:
è ENERGY & MOTIVATION of the
Team of NYKs
è Lack of AWARENESS about NYKS in
the various sub-systems of
Government, Private Sector, NGO
Sector etc, leading to difficulty in
expansion of activities
è Reach of the NYKs officials in to
interior pockets and commendable
work done in times of crisis.
è Lack of adequate FUNDS for making the
ENERGY of the TEAM productive, limited
funds for making the Field Official mobile
and increase reach.
è Huge Network of Youth Clubs as a
potential Programme Delivery Chain
è Weakness of NYKS as an organisation
with adequate Management Capability
and Empowerment and Management
VISION for promotion of the NYKs.
è Potential Youth Energy è Less than desired Government attention to
this Ministry / subject
è Developed systems & procedures è Planning Process is not need based,
reflected by the fact that Employment, the
most important need is yet to be focussed by
the NYKS..
è Public Acceptance
OPPORTUNITIES: THREATS:
è To emerge as a powerful FORCE for
Nation Building applying through positive
reinforcement of YOUTH POWER.
è To Youth Energy getting mis-directed
towards CRIME, INSURGENCY etc.
è To use the HUGE NETWORK for
delivery of Programmes of other

VISION
77
delivery of Programmes of other
Ministries like HRD, Health etc,
where NYKs can act as an APEX
NGO.
MANAGING CHANGE though difficult in a Government environment, it is perceived to be less
difficult outside the Ministries, when led by able leaders with a VISION. Based on the above
findings, it is clear that NYKS has a national call, to answer in the form of playing a meaningful
role in the process of EMPOWERMENT of YOUTH.
This is possible only when NYKS as an organisation is empowered to play that role. This process
of empowerment of NYKS involves,
a) Support of the Government of India and
b) Dramatic improvement of the functioning of NYKS through reengineering of the process
of the NYKS * adopting the principles of BPR (Business Process Reengineering)
successfully adopted by large number of organisations in the world.
* ( Reengineering is defined by Michael Hammer & James Champy, the founding fathers
of the concept of Process Reengineering, as, “ the fundamental rethinking and radical
redesign of business processes to achieve dramatic improvements in critical
contemporary measures of performance , such as cost, , quality, service and speed .”
Based on the above, our recommendations are as under.
4.3 RECOMMENDATIONS:
BROAD RECOMMENDATIONS:
NYKS to reengineer itself as an organisation to cope with the emerging challenges of
YOUTH EMPOWERMENT PROCESS and bargain for more support from the GOI,
justifiable in the present conditions with a massive 8 million Non-Student Rural Youth
population.

VISION
78
Specific Recommendations :
a) NYKS to formulate pragmatic, need based VISION FOR YOUTH of INDIA , which the
NYKs can carry out as a MISSION.
b) The Top Management of NYKs to invest time, energy and funds in CREATING
AWARENESS about NYKs as an ORGANISATION with its MISSION , which will help
generate support from various quarters for NYKs, including increasing the BUDGET
ALLOCATION for an important subject like YOUTH.
c) NYKS need to focus on sustainable EMPLOYMENT GENERATION for the Rural Youth, the
primary NEED of Rural Youth and a mission, which NYKS can concentrate on based on its
organisational capability, if supported by adequate expertise.

ANNEXURE-I REGULAR PROGRAMMES UNDERTAKEN IN NYKS
Programme Name
Objective Content Duration Budget Additional Inputs
1.Y
ou
th C
lub
s
⇐ Mobilize rural youths to establish Youth Club movement in the district, hence the country ⇐ Bring awareness and determination to change rural lives ⇐ Fight against poverty and social evils ⇐ Develop leadership qualities among rural youths ⇐ Develop self-respect and pride and feeling of nationalism, solidarity and unity ⇐ Become self-reliant through co-operation and spirit of services
a. Importance of a Youth Club
b. How to form a Youth Club
c. Activities of a Youth Club
d. Managing a Youth Club which also includes checklist for a well managed Youth Club
e. Youth needs and problems, role of youth as agents of change
f. Dynamics of village social structure
g. Leadership qualities and role of Youth Leaders
h. Role of Youth in eradication of local and national problems
i. Acquainting them with various developmental and community Programme
j. Mobilization of Youth for community action and developmental activities
a. 5ys training Programme
b. Participants: 25 persons
a. Boarding & Lodging @ Rs. 50/- per day
(25persons * Rs. 50 * 5 days): Rs. 6,250 b. Organizational
expenses @ 25% of Boarding and lodging : Rs. 1,560
Total : Rs. 7,810
a. One NSV exclusively earmarked for this Programme
b. Each NYK establishes 50 new Youth Clubs
c. Each NYK activates 50 passive Youth Clubs
d. Each NYK is responsible to get atleast 25% of the total un-registered Youth Club registered under Societies Registration Act or Corresponding State Act

2. V
oca
tio
nal
Tra
inin
g P
rog
ram
me
(VT
P)
⇐ Improve vocational skills of the rural youth in order to supplement their income for existing income, improve productivity and learn new skills ⇐ Tackle problem of unemployment by equipping youth for income generating projects based on locally available raw materials, resources and markets.
Emphasis on the following areas/ trades: a. Improved agricultural
practices b. Repair and
maintenance of tractor and other agricultural implements.
c. Dairy, Poultry, Sheep and Wool rearing
d. Sericulture and floriculture
e. Cutting and tailoring f. Carpentry and Shoe
making g. Electronic Gadget
repair h. Traditional handicrafts
of the area i. Rural small scale and
agro based skill development
a. Duration of the training depends on the type of trade selected. The duration does not exceed 6 months
b. Participants for the Programme should not exceed 30 members
The total budget provision under VTP is Rs. 30,000/- with the budget not exceeding Rs. 10,000/- for long duration training Programme and expenses for short duration training Programme not exceeding Rs. 5000/ -
a. One NSV is identified for activities under each block
b. Saving under VTP is utilized for another VTP in the Kendra
c. Additional requirement are met with through co-ordination with other departments / agencies

3. A
war
enes
s C
ampa
ign
⇐ To address immediate problems or issues at the local and social importance affecting the life of rural youth and village communities
The theme for the campaign are on the following areas a. Literacy and scientific
temper b. Lifestyle education c. Gender Issues,
Women Empowerment d. Sanitation e. Disaster Mitigation f. Child Rights with
special emphasis on Girl Child
g. Sustainable Development
h. Environment Promotion
i. Current Socio-economic issues
j. Historical and cultural heritage of the particular area
k. Promotion of Non-conventional and renewable energy sources
l. Health Awareness and Family Welfare
As well as issues of local importance
Duration: The campaign will be organized for a period of 5 days and will be launched by a 7 member team consisting of the Youth Co-ordinator, NSVs and active Youth Leaders
a. Hiring of Cycles/ Vehicles/ Bus @ Rs. 50/- per day per person (Rs. 50*5days*7 member team = Rs. 1750 b. B&L @ Rs. 50/- per day per person ( Rs. 50*5 days*7 member team) = Rs. 4000/ -
a. Local village youth club members are motivated to organize the Programme
b. NSVs of the campaign block and adjoining blocks take part in the campaign
c. Resources and support is taken from the YDCs, rural sports clubs and youth clubs given FAYC schemes in the campaign block
d. DA/TA expense of Youth Co-ordinator can be charged

4. W
ork
Cam
p
⇐ Provide leadership qualities ⇐ Inculcate management skills ⇐ Experience in Implementation of developmental works in the village communities
a. Youth needs & problems, role of youth as agents of change
b. Dynamics of village social structure
c. Various aspect of Panchayat raj
d. Mobilization of youth for community action
e. Co-ordination with other departments & agencies
f. Project work (Shramdan)
g. Group discussion h. Cultural Programme i. Community Singing
Duration: 5 days Participants: 25
Boarding & Lodging @ rs. 50/- per day per participants (5 days* 25 participants * Rs. 50) = Rs. 6,250 Organizational Expenses 25% of Boarding & Lodging = Rs. 1,560
a. NSVs of the block also participates I the programme
b. Local resources are mobilized for work camp
c. Assets which are durable and of use to the community is created
d. Co-ordination with the District Administration, Panchayat and NGOs are followed
e. Youth Club member from the adjoining villages also takes part but expenses for boarding & lodging are not given
5. S
po
rts
Pro
mo
tio
n
Pro
gra
mm
e
⇐ Establish the culture of sports ad sportsmanship in the rural scenario ⇐ Popularize rural sports, which requires minimum infrastructure, equipments and finances.
a. Identification and preservation of village common lad as playfield
b. Purchase of sports equipments
c. Annual village and block level championships in 34 identified locally popular sports categories, apart from athletics
Generally 3 programmes are organized annually, with participation of youth members and general public
Rs. 15,000 earmarked for organization of sports events and the savings are used for purchase of sports equipments
None
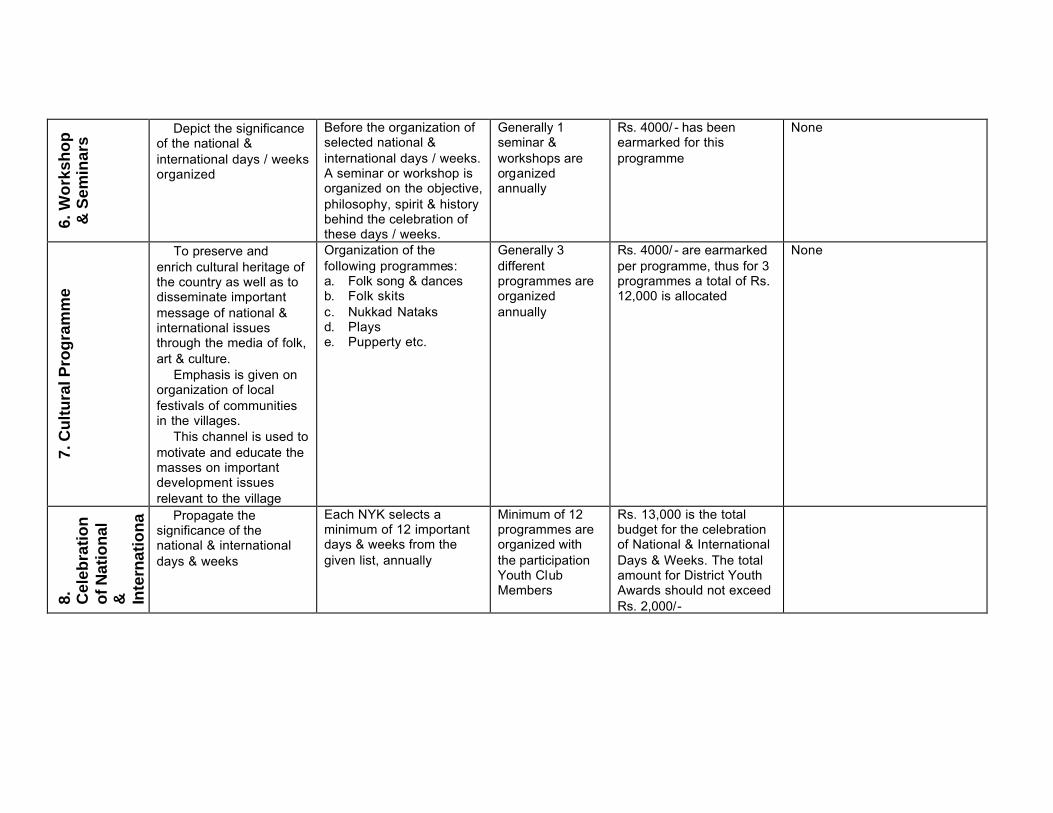
6. W
ork
sho
p
& S
emin
ars
⇐ Depict the significance of the national & international days / weeks organized
Before the organization of selected national & international days / weeks. A seminar or workshop is organized on the objective, philosophy, spirit & history behind the celebration of these days / weeks.
Generally 1 seminar & workshops are organized annually
Rs. 4000/ - has been earmarked for this programme
None
7. C
ult
ura
l Pro
gra
mm
e
⇐ To preserve and enrich cultural heritage of the country as well as to disseminate important message of national & international issues through the media of folk, art & culture. ⇐ Emphasis is given on organization of local festivals of communities in the villages. ⇐ This channel is used to motivate and educate the masses on important development issues relevant to the village
Organization of the following programmes: a. Folk song & dances b. Folk skits c. Nukkad Nataks d. Plays e. Pupperty etc.
Generally 3 different programmes are organized annually
Rs. 4000/ - are earmarked per programme, thus for 3 programmes a total of Rs. 12,000 is allocated
None
8.
Cel
ebra
tio
n
of N
atio
nal
&
In
tern
atio
na
l Day
s &
⇐ Propagate the significance of the national & international days & weeks
Each NYK selects a minimum of 12 important days & weeks from the given list, annually
Minimum of 12 programmes are organized with the participation Youth Club Members
Rs. 13,000 is the total budget for the celebration of National & International Days & Weeks. The total amount for District Youth Awards should not exceed Rs. 2,000/-

9. A
dve
ntu
re P
rom
oti
on
⇐ Encourage a spirit of adventure among youth ⇐ Inculcate nature appreciation with emphasis on ecology and conservation of natural resources ⇐ Providing assistance to youth in undertaking adventure programmes.
a. Youth Co-ordinators explore the possibilities and scope of adventure activities in the district
b. Identify places where adventure activities can be organized
In general, 2 programmes are organized annually.
a. The budget for each programme is Rs. 6000, thus a total of Rs. 12,000 for two programmes.
b. Boarding & lodging follows the same norms as the other programmes
c. No expenses is incurred on TA/ DA of the participants
Activities such as motorcycle, bi-cycle expeditions, local picnics etc is not considered under this programme.

APPENDIX-II
ORGANIZATION CHART
Director(Programme, Evaluation & Field Activities)
Youth Club , Mahila Manda
National Service Volunteers3-15 per district
National Re-construction Corps
Youth Co-ordinatorsNehru Yuva Kendra
District level
Regional Co-ordinators46 all over India
Zonal Directors18 all over India
DirectorFinance & Administration
DirectorResearch, Training & Publication
DirectorNational Re-construction Corp
Director General
Board of Governers Dept. Of Youth Affair & Sports, GOI
State Co-ordination Committee
District Advisory Committee

Annexure III District wise percentage of ratings by informants as per rating points. % within district (1) Youth club development
programme
1.0 2.0 3.0 4.0 5.0 6.0 7.0 8.0 9.0 10.0 Mean Mode Vaisali 7.1 14.3 32.1 17.9 10.7 3.6 3.6 10.7 4.9 4 Muzzafarpur
50.0 7.7 3.8 11.5 7.7 3.8 7.7 7.7 3.5 1
Gumla 60.0 20.0 20.0 1.8 1 Hazaribag 4.3 4.3 47.8 4.3 21.7 17.4 6.4 5 Kalahandi 5.0 5.0 15.0 30.0 5.0 40.0 8.3 10 Jagatsinghpur 5.3 47.4 10.5 15.8 15.8 5.3 4.3 3 Khurda 5.3 5.3 36.8 5.3 36.8 10.5 6.4 5,8 Koraput 50.0 10.0 20.0 20.0 3.3 1 Imphal 15.6 12.5 21.9 50.0 7.8 9 Nalbari 12.9 3.2 3.2 45.2 9.7 25.8 5.0 5 Kamrup 52.2 26.1 17.4 4.3 2.2 1 Silchar 3.1 9.4 12.5 34.4 18.8 21.9 6.2 6 Diamod harbar 6.0 11.0 6.0 50.0 16.0 11.0 7.7 8 Cooch bihar 3.0 5.0 13.0 48.0 18.0 13.0 8.0 8 Howrah 5.0 10.0 75.0 5.0 5.0 7.9 8 Bankura 5.0 40.0 10.0 30.0 15.0 8.1 7
% within district

(2) Vocational training programme 1.0 2.0 3.0 4.0 5.0 6.0 7.0 8.0 9.0 10.0 Mean Mod
e Vaisali 13.3 13.3 3.3 10.0 16.7 3.3 30.0 10.0 5.7 8 Muzzafarpur
17.9 3.6 3.6 10.7 7.1 3.6 21.4 32.1 6.5 10
Gumla 60.0 20.0 20.0 1.6 1 Hazaribag 8.7 21.7 34.8 26.1 8.7 6.1 6 Kalahandi 10.0 15.0 15.0 10.0 20.0 30.0 8.1 10 Jagatsinghpur
5.3 15.8 10.5 52.6 10.5 5.3 3.6 4
Khurda 5.3 5.3 15.8 5.3 36.8 10.5 15.8 5.3 6.5 7 Koraput 5.0 15.0 15.0 15.0 50.0 7.9 10 Imphal 31.3 3.1 3.1 12.5 31.3 15.6 3.1 4.9 7 Nalbari 12.9 3.2 9.7 29.0 38.7 3.2 3.2 5.7 7 Kamrup 66.7 4.2 20.8 4.2 4.2 1.8 1 Silchar 3.1 6.3 15.6 31.3 34.4 6.3 3.1 7.2 7 Diamod harbar 6.0 6.0 26.0 20.0 26.0 16.0 7.9 7,9 Cooch bihar 12.5 3.0 3.0 18.0 20.0 15.5 28.0 7.6 10 Howrah 35.0 10.0 35.0 10.0 5.0 5.0 5.5 2,7 Bankura 20.0 10.0 15.0 5.0 50.0 8.3 10
% within district

(3) Awareness generation 1.0 2.0 3.0 4.0 5.0 6.0 7.0 8.0 9.0 10.0 Mean Mod
e Vaisali 20.0 3.3 10.0 33.3 23.3 3.3 6.7 4.5 5 Muzzafarpur
20.7 6.9 10.3 6.9 3.4 6.9 17.2 3.4 24.1 6.0 10
Gumla 33.3 16.7 50.0 3.2 5 Hazaribag 8.7 4.3 26.1 4.3 8.7 39.1 8.7 6.3 8 Kalahandi 5.0 5.0 15.0 10.0 10.0 35.0 15.0 5.0 7.1 8 Jagatsinghpur
31.6 31.6 26.3 5.3 5.3 2.2 1,2
Khurda 5.3 5.3 15.8 10.5 21.1 10.5 31.6 7.6 10 Koraput 55.0 15.0 5.0 25.0 3.9 2 Imphal 6.3 9.4 3.1 34.4 43.8 3.1 6.1 7 Nalbari 25.8 16.1 32.3 12.9 9.7 3.2 3.7 4 Kamrup 3.8 11.5 3.8 23.1 34.6 15.4 7.7 4.5 5 silchar 6.3 15.6 34.4 37.5 6.3 7.2 8 diamod harbar 5.0 20.0 10.0 5.0 5.0 55.0 8.1 10 cooch bihar 2.5 2.5 5.0 10.0 12.5 27.5 40.0 8.5 10 howrah 5.0 5.0 5.0 10.0 5.0 5.0 20.0 40.0 5.0 7.3 9 bankura 10.0 10.0 30.0 20.0 30.0 8.3 8,10
% within district

(4)Work
camps
1.0 2.0 3.0 4.0 5.0 6.0 7.0 8.0 9.0 10.0 Mean Mode
vaisali 14.3 14.3 3.6 28.6 17.9 3.6 7.1 10.7 4.4 4 Muzzafarpur
42.9 3.6 3.6 3.6 7.1 3.6 35.7 5.3 1
gumla 12.5 12.5 12.5 12.5 50.0 3.8 5 hazaribag 4.0 16.0 40.0 12.0 20.0 8.0 5.5 5 kalahandi 5.0 15.0 10.0 15.0 15.0 30.0 10.0 6.1 8 Jagatsinghpur
15.8 15.8 15.8 10.5 5.3 36.8 4.2 7
khurda 21.1 15.8 5.3 21.1 26.3 10.5 6.2 8 koraput 50.0 5.0 5.0 20.0 5.0 15.0 4.9 2 imphal 25.0 3.1 6.3 18.8 6.3 15.6 21.9 3.1 5.0 1 nalbari 51.6 6.5 35.5 6.5 2.0 1 kamrup 52.2 8.7 8.7 13.0 8.7 8.7 2.4 1 silchar 21.9 6.3 6.3 21.9 9.4 31.3 3.1 5.3 8 diamod harbar 5.0 10.0 15.0 35.0 5.0 20.0 10.0 7.1 7 cooch bihar 2.5 2.5 2.5 12.5 30.0 7.5 12.5 30.0 7.8 7,10 howrah 10.0 5.0 5.0 15.0 65.0 8.7 10 bankura 20.0 15.0 30.0 10.0 15.0 10.0 7.0 7
% within district

(5) Sports promotion programme 1.0 2.0 3.0 4.0 5.0 6.0 7.0 8.0 9.0 10.0 Mean Mod
e vaisali 3.3 10.0 3.3 20.0 13.3 3.3 10.0 26.7 10.0 5.8 8 Muzzafarpur
27.6 6.9 3.4 3.4 17.2 10.3 6.9 6.9 17.2 4.9 1
gumla 12.5 12.5 50.0 12.5 12.5 4.1 4 hazaribag 21.7 34.8 4.3 17.4 13.0 4.3 4.3 3.0 2 kalahandi 5.0 5.0 10.0 15.0 50.0 10.0 5.0 6.2 7 Jagatsinghpur
5.6 44.4 11.1 16.7 16.7 5.6 3.1 2
khurda 21.1 5.3 10.5 21.1 15.8 15.8 10.5 6.4 2 koraput 33.3 20.0 6.7 6.7 6.7 26.7 5.9 3 imphal 6.3 3.1 3.1 9.4 6.3 6.3 9.4 37.5 18.8 6.6 8 nalbari 51.6 6.5 6.5 9.7 19.4 6.5 3.1 1 kamrup 39.1 4.3 4.3 13.0 13.0 26.1 3.3 1 silchar 6.3 3.1 3.1 28.1 31.3 9.4 9.4 6.3 3.1 5.8 6 diamod harbar 16.0 6.0 25.0 11.0 6.0 36.0 7.5 10 cooch bihar 8.0 28.0 15.5 13.0 3.0 32.5 7.2 10 howrah 50.0 15.0 35.0 7.2 10 bankura 5.0 10.0 5.0 20.0 5.0 55.0 8.5 10
% within district
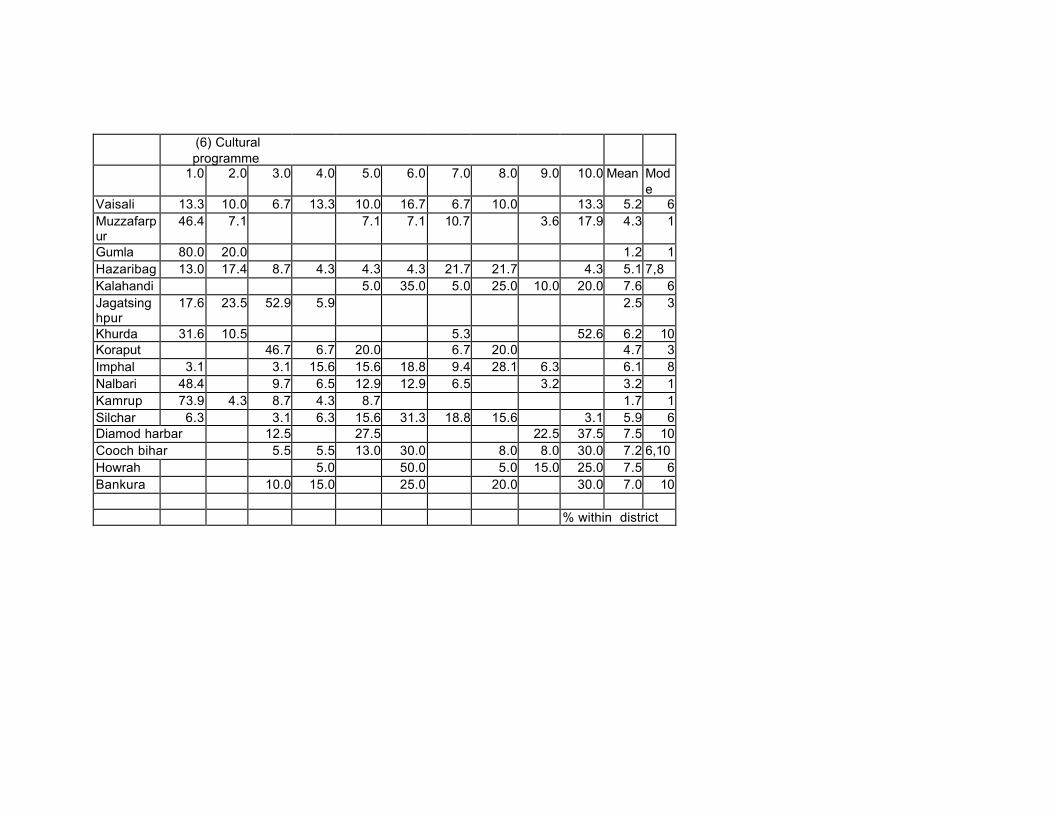
(6) Cultural
programme
1.0 2.0 3.0 4.0 5.0 6.0 7.0 8.0 9.0 10.0 Mean Mode
Vaisali 13.3 10.0 6.7 13.3 10.0 16.7 6.7 10.0 13.3 5.2 6 Muzzafarpur
46.4 7.1 7.1 7.1 10.7 3.6 17.9 4.3 1
Gumla 80.0 20.0 1.2 1 Hazaribag 13.0 17.4 8.7 4.3 4.3 4.3 21.7 21.7 4.3 5.1 7,8 Kalahandi 5.0 35.0 5.0 25.0 10.0 20.0 7.6 6 Jagatsinghpur
17.6 23.5 52.9 5.9 2.5 3
Khurda 31.6 10.5 5.3 52.6 6.2 10 Koraput 46.7 6.7 20.0 6.7 20.0 4.7 3 Imphal 3.1 3.1 15.6 15.6 18.8 9.4 28.1 6.3 6.1 8 Nalbari 48.4 9.7 6.5 12.9 12.9 6.5 3.2 3.2 1 Kamrup 73.9 4.3 8.7 4.3 8.7 1.7 1 Silchar 6.3 3.1 6.3 15.6 31.3 18.8 15.6 3.1 5.9 6 Diamod harbar 12.5 27.5 22.5 37.5 7.5 10 Cooch bihar 5.5 5.5 13.0 30.0 8.0 8.0 30.0 7.2 6,10 Howrah 5.0 50.0 5.0 15.0 25.0 7.5 6 Bankura 10.0 15.0 25.0 20.0 30.0 7.0 10
% within district
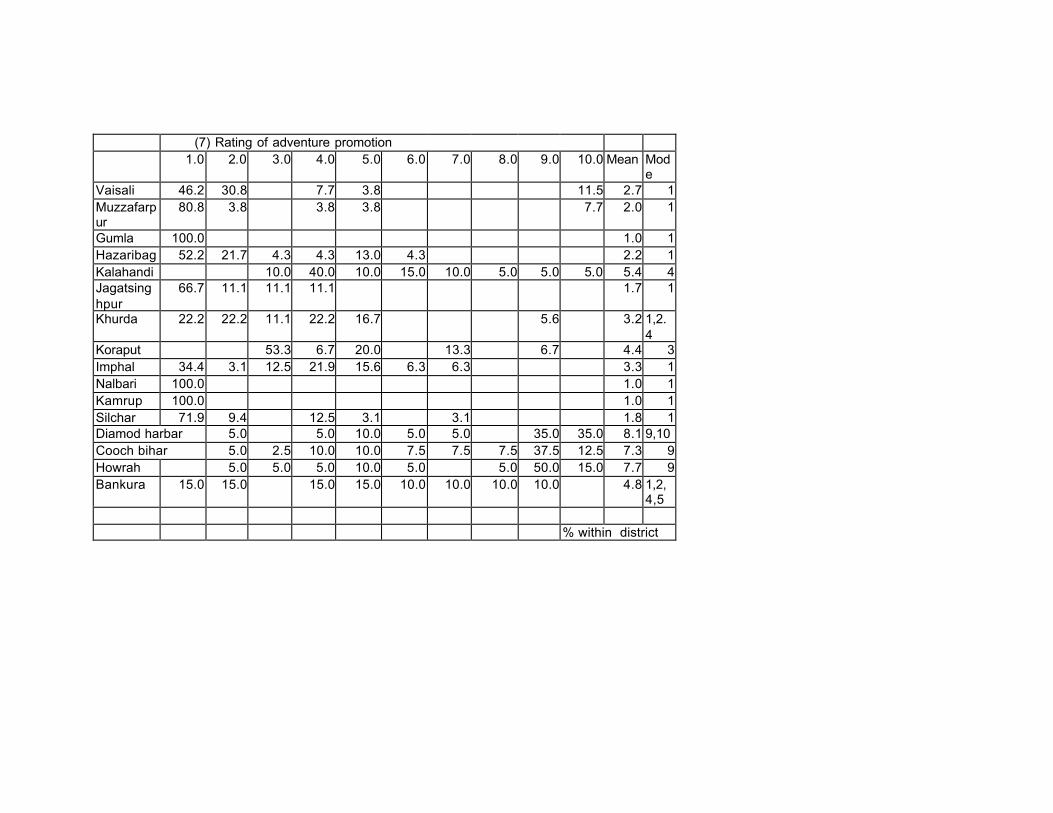
(7) Rating of adventure promotion 1.0 2.0 3.0 4.0 5.0 6.0 7.0 8.0 9.0 10.0 Mean Mod
e Vaisali 46.2 30.8 7.7 3.8 11.5 2.7 1 Muzzafarpur
80.8 3.8 3.8 3.8 7.7 2.0 1
Gumla 100.0 1.0 1 Hazaribag 52.2 21.7 4.3 4.3 13.0 4.3 2.2 1 Kalahandi 10.0 40.0 10.0 15.0 10.0 5.0 5.0 5.0 5.4 4 Jagatsinghpur
66.7 11.1 11.1 11.1 1.7 1
Khurda 22.2 22.2 11.1 22.2 16.7 5.6 3.2 1,2.4
Koraput 53.3 6.7 20.0 13.3 6.7 4.4 3 Imphal 34.4 3.1 12.5 21.9 15.6 6.3 6.3 3.3 1 Nalbari 100.0 1.0 1 Kamrup 100.0 1.0 1 Silchar 71.9 9.4 12.5 3.1 3.1 1.8 1 Diamod harbar 5.0 5.0 10.0 5.0 5.0 35.0 35.0 8.1 9,10 Cooch bihar 5.0 2.5 10.0 10.0 7.5 7.5 7.5 37.5 12.5 7.3 9 Howrah 5.0 5.0 5.0 10.0 5.0 5.0 50.0 15.0 7.7 9 Bankura 15.0 15.0 15.0 15.0 10.0 10.0 10.0 10.0 4.8 1,2,
4,5 % within district
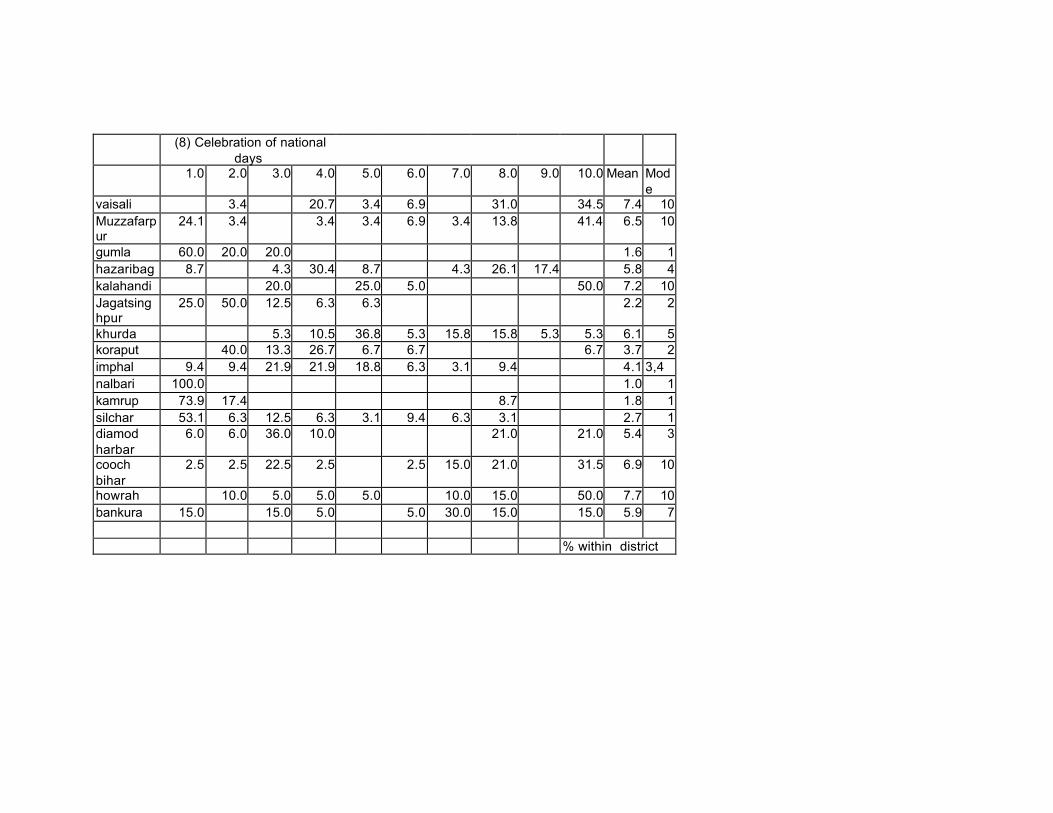
(8) Celebration of national
days
1.0 2.0 3.0 4.0 5.0 6.0 7.0 8.0 9.0 10.0 Mean Mode
vaisali 3.4 20.7 3.4 6.9 31.0 34.5 7.4 10 Muzzafarpur
24.1 3.4 3.4 3.4 6.9 3.4 13.8 41.4 6.5 10
gumla 60.0 20.0 20.0 1.6 1 hazaribag 8.7 4.3 30.4 8.7 4.3 26.1 17.4 5.8 4 kalahandi 20.0 25.0 5.0 50.0 7.2 10 Jagatsinghpur
25.0 50.0 12.5 6.3 6.3 2.2 2
khurda 5.3 10.5 36.8 5.3 15.8 15.8 5.3 5.3 6.1 5 koraput 40.0 13.3 26.7 6.7 6.7 6.7 3.7 2 imphal 9.4 9.4 21.9 21.9 18.8 6.3 3.1 9.4 4.1 3,4 nalbari 100.0 1.0 1 kamrup 73.9 17.4 8.7 1.8 1 silchar 53.1 6.3 12.5 6.3 3.1 9.4 6.3 3.1 2.7 1 diamod harbar
6.0 6.0 36.0 10.0 21.0 21.0 5.4 3
cooch bihar
2.5 2.5 22.5 2.5 2.5 15.0 21.0 31.5 6.9 10
howrah 10.0 5.0 5.0 5.0 10.0 15.0 50.0 7.7 10 bankura 15.0 15.0 5.0 5.0 30.0 15.0 15.0 5.9 7
% within district

(9) Seminars and workshop 1.0 2.0 3.0 4.0 5.0 6.0 7.0 8.0 9.0 10.0 Mean Mod
e vaisali 17.4 47.8 13.0 4.3 4.3 13.0 3.0 2 Muzzafarpur
70.4 7.4 7.4 7.4 3.7 3.7 2.4 1
gumla 80.0 20.0 1.2 1 hazaribag 6.3 31.3 6.3 6.3 31.3 18.8 4.4 6 kalahandi 35.0 15.0 15.0 5.0 25.0 5.0 4.0 2 Jagatsinghpur
7.1 21.4 14.3 57.1 3.8 5
khurda 11.1 11.1 22.2 22.2 33.3 5.6 7 koraput 26.0 31.0 6.0 26.0 6.0 5.0 3.3 2 imphal 15.6 9.4 12.5 28.1 31.3 3.1 3.6 5 nalbari 51.6 12.9 9.7 19.4 3.2 3.2 2.7 1 kamrup 79.2 4.2 4.2 8.3 4.2 1.6 1 silchar 65.6 18.8 9.4 6.3 1.6 1 diamod harbar
15.0 15.0 25.0 35.0 5.0 5.0 3.2 4
cooch bihar
5.1 10.3 10.3 23.1 7.7 5.1 5.1 25.6 2.6 5.1 5.3 8
howrah 5.6 5.6 5.6 5.6 5.6 5.6 11.1 55.6 6.4 8 bankura 6.0 10.0 30.0 6.0 10.0 6.0 10.0 6.0 16.0 5.9 4

![Central-Upwind Schemes for Two-Layer Shallow Water Equationsgpetrova/KP_2l.pdf · Central-Upwind Schemes for Two-Layer Shallow Water ... we refer the reader to [2], ... Central-Upwind](https://static.fdocuments.in/doc/165x107/5abcf7377f8b9a24028e74bf/central-upwind-schemes-for-two-layer-shallow-water-gpetrovakp2lpdfcentral-upwind.jpg)