CENTRAL NERVOUS SYSTEM INJURY IN KENTUCKYCENTRAL NERVOUS SYSTEM INJURY IN KENTUCKY Emergency...
85
1 CENTRAL NERVOUS SYSTEM INJURY IN KENTUCKY Emergency Department Visits and Hospitalizations 2016 Prepared by: the Kentucky Injury Prevention and Research Center, University of Kentucky Funded by the Kentucky Traumatic Brain Injury Trust Fund under the Cabinet for Health and Family Services, Department of Aging and Independent Living.
Transcript of CENTRAL NERVOUS SYSTEM INJURY IN KENTUCKYCENTRAL NERVOUS SYSTEM INJURY IN KENTUCKY Emergency...

1
CENTRAL NERVOUS SYSTEM INJURY IN KENTUCKY
Emergency Department Visits and Hospitalizations 2016
Prepared by: the Kentucky Injury Prevention and Research Center, University of Kentucky
Funded by the Kentucky Traumatic Brain Injury Trust Fund under the Cabinet for Health and Family Services,
Department of Aging and Independent Living.
2
FOR MORE INFORMATION This report was prepared by Shannon Beaven of the Kentucky Injury Prevention and Research Center (Director: Dr. Terry Bunn), with funding from the Kentucky Traumatic Brain Injury Trust Fund Board. Data requests, questions, or other correspondence should be directed to the address/phone numbers below. Address: 333 Waller Avenue, Suite 206 Lexington, KY 40504 Telephone: (859) 323-4750 Fax: (859) 257-3909 E-mail: [email protected]

3
Table of Contents Introduction 7 Overview of TBI in Kentucky 9 Number of Traumatic Brain Injury-related ED Visits, Hospitalizations, and Estimated Deaths 9 TBI in Kentucky 10 TBI --by Age Groups 11-12 --by Gender 13-14 --by External Cause 15-17 --by External Cause, Children and Seniors 18-19 --by Length of Stay 20 --by Pay Source and Charges 21 --by County 22-26 ABI --by Gender 27 --by Age Groups 28-30 --by Length of Stay 31 --by Pay Source and Charges 32 --by County 33-37 SCI --by Gender 38 --by Age Group 39 --by External Cause 40 --by Pay Source and Charges 41 Stroke --by Gender 42 --by Age Group 43 --by Length of Stay 44 --by Pay Source and Charges 45 --by County 46-50 Conclusion 51
4
Table of Contents Appendix A: Tables 1. Non-fatal TBI by age group 52 2. Non-fatal TBI by gender 52 3. Leading external causes of non-fatal TBI, all ages 53 4. Leading external causes of non-fatal TBI for ages 0-4 53 5. Leading external causes of non-fatal TBI for ages 5-14 54 6. Leading external causes of non-fatal TBI for ages 15-24 54 7. Leading external causes of non-fatal TBI for ages 25-44 55 8. Leading external causes of non-fatal TBI for ages 45-64 55 9. Leading external causes of non-fatal TBI for ages 65+ 56 10. Non-fatal discharges by disposition 56 11. Incidence of all inpatient TBI by county, sorted by county name 57 12. Incidence of all ED TBI by county, sorted by county name 58 13. Incidence of all inpatient TBI by county, sorted by frequency 59 14. Incidence of all ED TBI by county, sorted by frequency 60 15. Incidence of all inpatient TBI by county, sorted by age-adjusted rate 61 16. Incidence of all ED TBI by county, sorted by age-adjusted rate 62 17. Length of stay for non-fatal inpatient TBI 63 18. Work related non-fatal TBI 63 19. Primary payer and charges for non-fatal inpatient TBI 63 20. Primary payer and charges for non-fatal ED TBI 64 21. Non-fatal ABI by age group 64 22. Non-fatal ABI by gender 64 23. Incidence of all inpatient ABI by county, sorted by county name 65 24. Incidence of all ED ABI by county, sorted by county name 66 25. Incidence of all inpatient ABI by county, sorted by frequency 67 26. Incidence of all ED ABI by county, sorted by frequency 68

5
Table of Contents Appendix A: Tables (continued) 27. Incidence of all inpatient ABI by county, sorted by age-adjusted rate 69 28. Incidence of all ED ABI by county, sorted by age-adjusted rate 70 29. Causes of non-fatal ABI 71 30. Anoxia by age group for non-fatal ABI 71 31. Diagnosis for anoxic non-fatal ABI 71 32. Exposure to toxic substances by age group for non-fatal ABI 72 33. Diagnosis for ETS for non-fatal ABI 72 34. Length of stay for non-fatal inpatient ABI 73 35. Hospital discharge disposition for non-fatal ABI 73 36. Primary payer and charges for non-fatal inpatient ABI 74 37. Primary payer and charges for non-fatal ED ABI 74 38. Non-fatal SCI by age group 74 39. Non-fatal SCI by gender 75 40. Leading causes of non-fatal SCI, all ages 75 41. Length of stay for non-fatal inpatient SCI 75 42. Discharge disposition for non-fatal SCI 76 43. Primary payer and charges for non-fatal inpatient SCI 76 44. Primary payer and charges for non-fatal ED SCI 76 45. Non-fatal Stroke by age group 77 46. Non-fatal Stroke by gender 77 47. Length of stay for non-fatal inpatient stroke 77 48. Discharge disposition for non-fatal stroke 78 49. Primary payer and charges for non-fatal inpatient stroke 78 50. Primary payer and charges for non-fatal ED stroke 78 51. Incidence of all inpatient stroke by county, sorted by county name 79 52. Incidence of all ED stroke by county, sorted by county name 80 53. Incidence of all inpatient stroke by county, sorted by frequency 81 54. Incidence of all ED stroke by county, sorted by frequency 82 Appendix B: Methods, Abbreviations, Definitions and Data 83-85
6
This report presents basic data about emergency department (ED) visits, hospitalizations, and hospital deaths for the calendar year 2016 for central nervous system injuries (CNSI) that include traumatic brain injuries (TBI), acquired brain injuries (ABI), spinal cord injuries (SCI) and cerebrovascular disease (stroke). The numbers found in this report should not be used in comparison with previous years of this report due to the transition from the International Classification of Diseases, Ninth Revision, Clinical Modification (ICD-9-CM) to the most recent Tenth Revision (ICD-10-CM). ED visits represent approximately three out of four of all TBIs. This report will illustrate the leading causes of central nervous system injuries in Kentucky, what age groups are affected, and who pays for care received. The report is intended as a reference for policy makers, service providers, educators, researchers, advocates, and others interested in knowing more about the impact of central nervous system injuries with a focus on TBI.
7
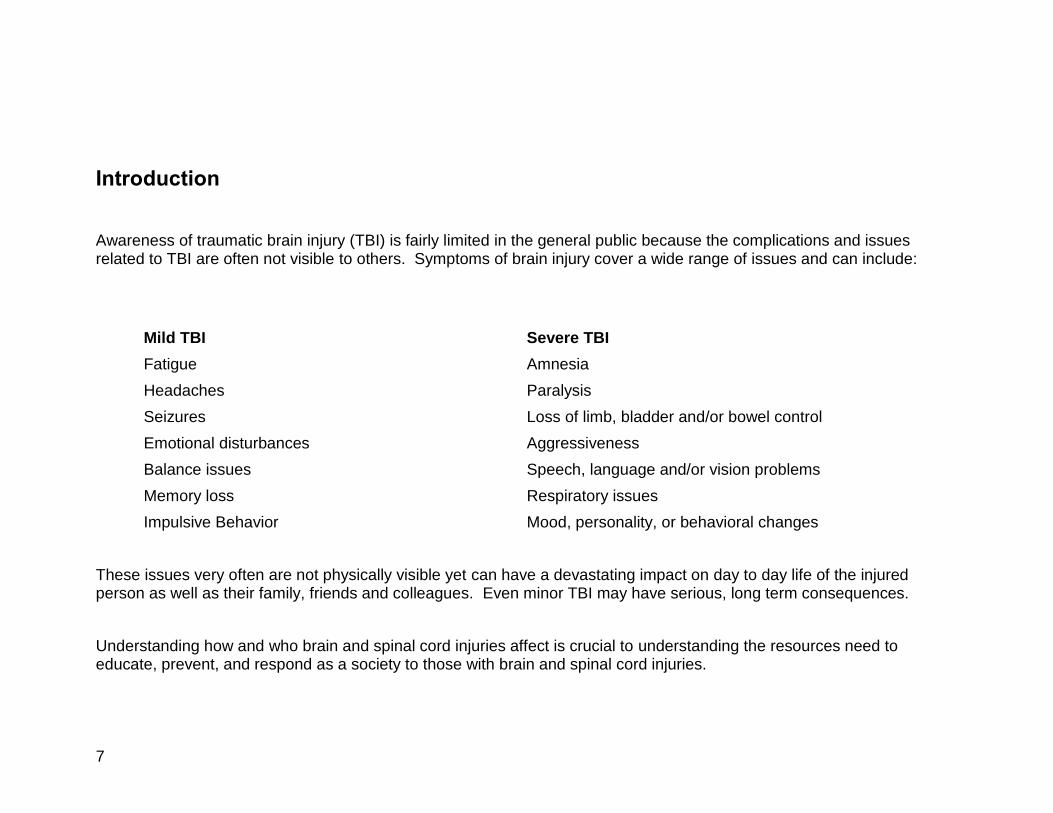
Introduction Awareness of traumatic brain injury (TBI) is fairly limited in the general public because the complications and issues related to TBI are often not visible to others. Symptoms of brain injury cover a wide range of issues and can include:
Mild TBI Severe TBI
Fatigue Amnesia
Headaches Paralysis
Seizures Loss of limb, bladder and/or bowel control
Emotional disturbances Aggressiveness
Balance issues Speech, language and/or vision problems
Memory loss Respiratory issues
Impulsive Behavior Mood, personality, or behavioral changes
These issues very often are not physically visible yet can have a devastating impact on day to day life of the injured person as well as their family, friends and colleagues. Even minor TBI may have serious, long term consequences.
Understanding how and who brain and spinal cord injuries affect is crucial to understanding the resources need to educate, prevent, and respond as a society to those with brain and spinal cord injuries.

8
Major sections of this report include:
Non-Fatal TBI, ABI, SCI and stroke case demographics, causes and outcomes
TBI, ABI and stroke case frequencies and rates at the county level
SCI demographics, causes and outcomes Later reports will include trends. Also, this report does not include TBIs from federal, military, or Veterans’ Administration hospitals. Data regarding deaths due to TBI, ABI, SCI and stroke only include deaths treated or seen in an ED or admitted as an inpatient to an acute care hospital. Deaths that occur due to BI, SCI or stroke outside of the hospital environment are not included in this analysis due to unavailable data. Deaths that occur in the hospital setting will be noted when included in analysis in this report.
Purpose of the Report
This report answers a wide range of important questions about how many CNSIs occur each year in the Commonwealth, who is affected, and how these CNSIs occur. This report is intended as a reference for policy makers, service providers, educators, researchers, advocates, and others interested in knowing more about the impact of CNSI in Kentucky. This information can be used to document the need for prevention, to identify priorities for research, and to support the need for services among those living with CNSI-related impairment and disability.
Contents and Organization
This report describes CNSI-related ED visits and hospitalizations in Kentucky for the calendar year 2016. The numbers show the magnitude of the problem, but the rates are also important. Rates show how a certain group is affected by CNSI by relating the number of CNSIs to the size of the population. For example, a relatively small number of TBIs occurring in a small population (e.g., persons ages 65 years or older) would result in a higher TBI rate than if the same number of TBIs occurred in a larger population (e.g., persons ages 25 to 44 years). The report findings are organized into two main sections. The Overview summarizes and interprets some key findings. The Appendices present more detailed data tables, along with a description of the methods and limitations.
9
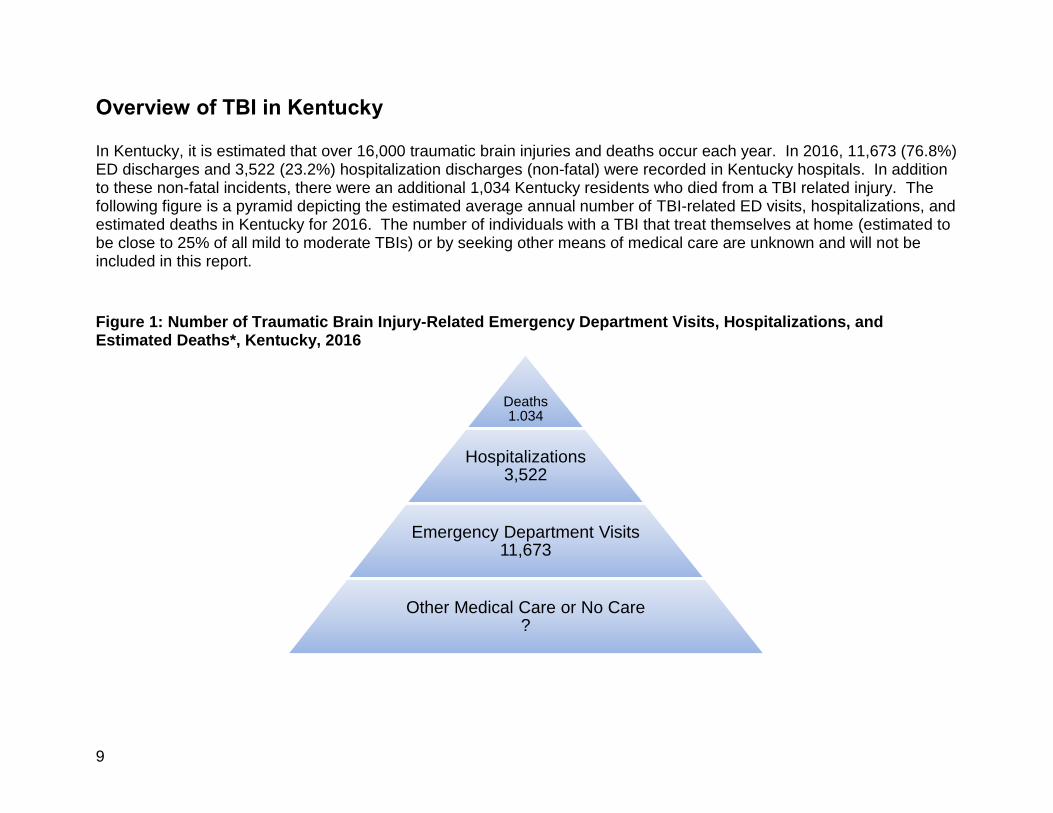
Overview of TBI in Kentucky In Kentucky, it is estimated that over 16,000 traumatic brain injuries and deaths occur each year. In 2016, 11,673 (76.8%) ED discharges and 3,522 (23.2%) hospitalization discharges (non-fatal) were recorded in Kentucky hospitals. In addition to these non-fatal incidents, there were an additional 1,034 Kentucky residents who died from a TBI related injury. The following figure is a pyramid depicting the estimated average annual number of TBI-related ED visits, hospitalizations, and estimated deaths in Kentucky for 2016. The number of individuals with a TBI that treat themselves at home (estimated to be close to 25% of all mild to moderate TBIs) or by seeking other means of medical care are unknown and will not be included in this report.
Figure 1: Number of Traumatic Brain Injury-Related Emergency Department Visits, Hospitalizations, and Estimated Deaths*, Kentucky, 2016
Deaths1.034
Hospitalizations3,522
Emergency Department Visits11,673
Other Medical Care or No Care?

10
TBI in Kentucky, 2016:
Over 15,000 people visited Kentucky hospitals with a TBI related injury. Of those, 11,673 were treated and released from an ED, 3,522 were hospitalized, and 1,034 died.
2,346 TBIs occurred among children ages 0 to 14 years; ED visits accounted for more than 90% of the TBIs in this age group.
Falls were the leading cause of TBI for both ED visits as well as hospitalizations. Rates were highest for children ages 0 to 4 years (ED visits) and for adults 65 years or older.
Falls resulted in the greatest number of TBI-related hospitalizations with a rate almost 2 times motor vehicle traffic crashes.
Adults ages 65 years or older had the highest rates of TBI-related hospitalization with a rate almost equal to all other ages combined.
Falls accounted for almost twice as many TBI injuries as motor vehicle traffic crashes (MVTC).
Data indicates that TBIs led to over 41 state residents per day being treated in Kentucky hospitals (ED and hospitalization).
Our results indicate a need to focus prevention efforts on the following causes and target populations:
Motor vehicle traffic crashes (TBI and SCI), especially among ages 15-24
Falls (TBI and SCI), especially among ages 0-14 and 65 and older
Anoxia (ABI), especially among ages 45 and older
Exposure to toxic substances (ABI), especially among ages 45 and older

11
TBI by Age: Comparing the Numbers
Figure 2: Numbers of Non-Fatal Traumatic Brain Injury-Related Emergency Department Visits, and Hospitalizations, by Age Group, Kentucky, 2016 A non-fatal TBI related injury treated at a Kentucky hospital results in an inpatient admission for almost half of older adults (65 and older) TBI related injuries while over 9 out of 10 TBI related injuries in children (under the age of 15) are treated and released in the ED.
0
500
1000
1500
2000
2500
3000
0-4 5-14 15-24 25-44 45-64 65+
Cas
es
Age Group
Inpatient
ED
0.0
5.0
10.0
15.0
20.0
25.0
30.0
35.0
40.0
45.0
50.0
0-4 5-14 15-24 25-44 45-64 65+
% o
f C
ase
sAge Group

12
TBI by Age: Comparing the Rates
The following figure, Figure 3, is a graph depicting the annual rate of TBI-related ED visits and hospitalizations by age groups in Kentucky for 2016. The y axis represents the rate per 100,000 population. During 2016, young adults, ages 15 to 24 years had the highest rate of non-fatal TBI-related ED visits, 455 per 100,000 population. From age 25 to age 64 the rates for ED visits decline, then begin to rise again for those ages 65 and over. The highest rates of non-fatal TBI-related hospitalization occurred among adults age 65 years or older (229 per 100,000).
Figure 3: Rates of Traumatic Brain Injury-Related Emergency Department Visits and Hospitalizations, by Age Group, Kentucky, 2016
0.0
50.0
100.0
150.0
200.0
250.0
300.0
350.0
400.0
450.0
500.0
0-4 5-14 15-24 25-44 45-64 65+
Rat
e p
er
10
0,0
00
Age Group
Inpatient
Outpatient

13
TBI by Gender: Comparing the Numbers
The following figure represents the estimated average annual numbers of TBI-related ED visits and hospitalizations, by gender and age, in the Commonwealth for 2016. Overall 8,445 non-fatal TBIs occurred among males compared with 6,747 among females.
Figure 4: Traumatic Brain Injury-Related Emergency Department Visits and Hospitalizations, by Age Group and Gender, Kentucky, 2016
Over half of female, non-fatal TBI related inpatient admissions were over the age of 64 while men over 64 made up just over one third of non-fatal inpatient admissions for males.
0%
10%
20%
30%
40%
50%
60%
70%
80%
90%
100%
Female Male
Inpatient, Non-Fatal TBI
65+
45-64
25-44
15-24
0-14
0%
10%
20%
30%
40%
50%
60%
70%
80%
90%
100%
Female Male
ED, Non-Fatal TBI
14
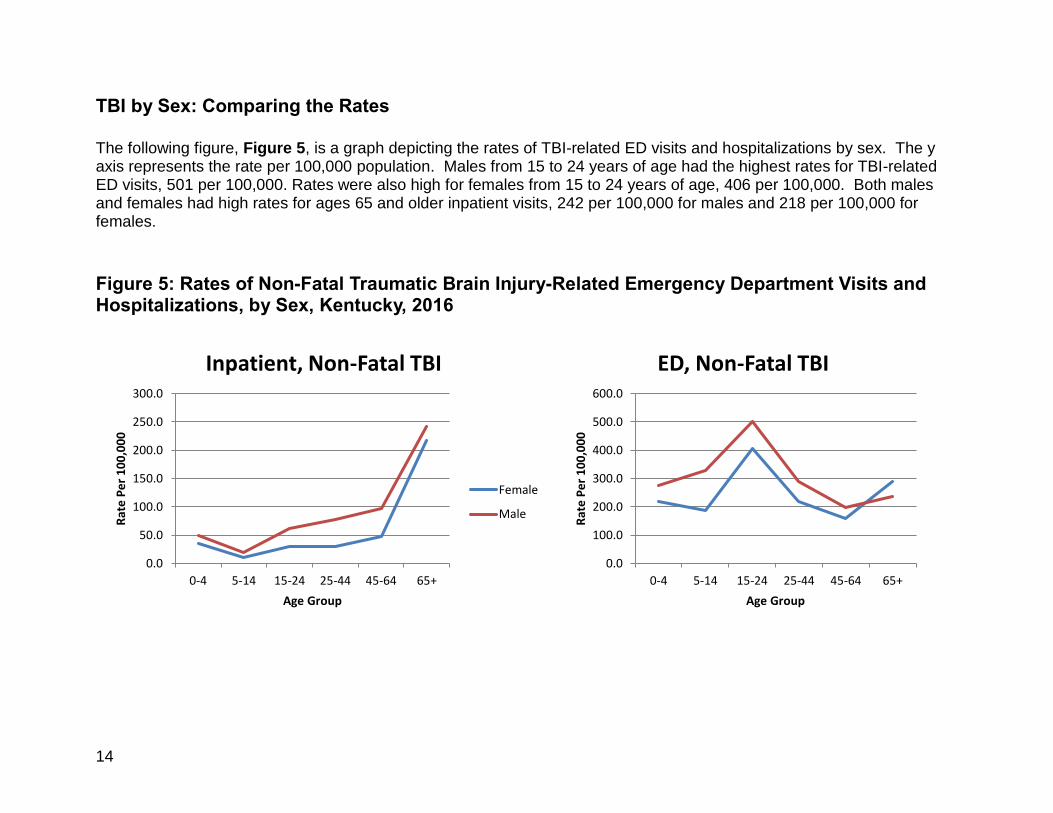
TBI by Sex: Comparing the Rates
The following figure, Figure 5, is a graph depicting the rates of TBI-related ED visits and hospitalizations by sex. The y axis represents the rate per 100,000 population. Males from 15 to 24 years of age had the highest rates for TBI-related ED visits, 501 per 100,000. Rates were also high for females from 15 to 24 years of age, 406 per 100,000. Both males and females had high rates for ages 65 and older inpatient visits, 242 per 100,000 for males and 218 per 100,000 for females.
Figure 5: Rates of Non-Fatal Traumatic Brain Injury-Related Emergency Department Visits and Hospitalizations, by Sex, Kentucky, 2016
0.0
50.0
100.0
150.0
200.0
250.0
300.0
0-4 5-14 15-24 25-44 45-64 65+
Rat
e P
er
10
0,0
00
Age Group
Inpatient, Non-Fatal TBI
Female
Male
0.0
100.0
200.0
300.0
400.0
500.0
600.0
0-4 5-14 15-24 25-44 45-64 65+R
ate
Pe
r 1
00
,00
0
Age Group
ED, Non-Fatal TBI
15
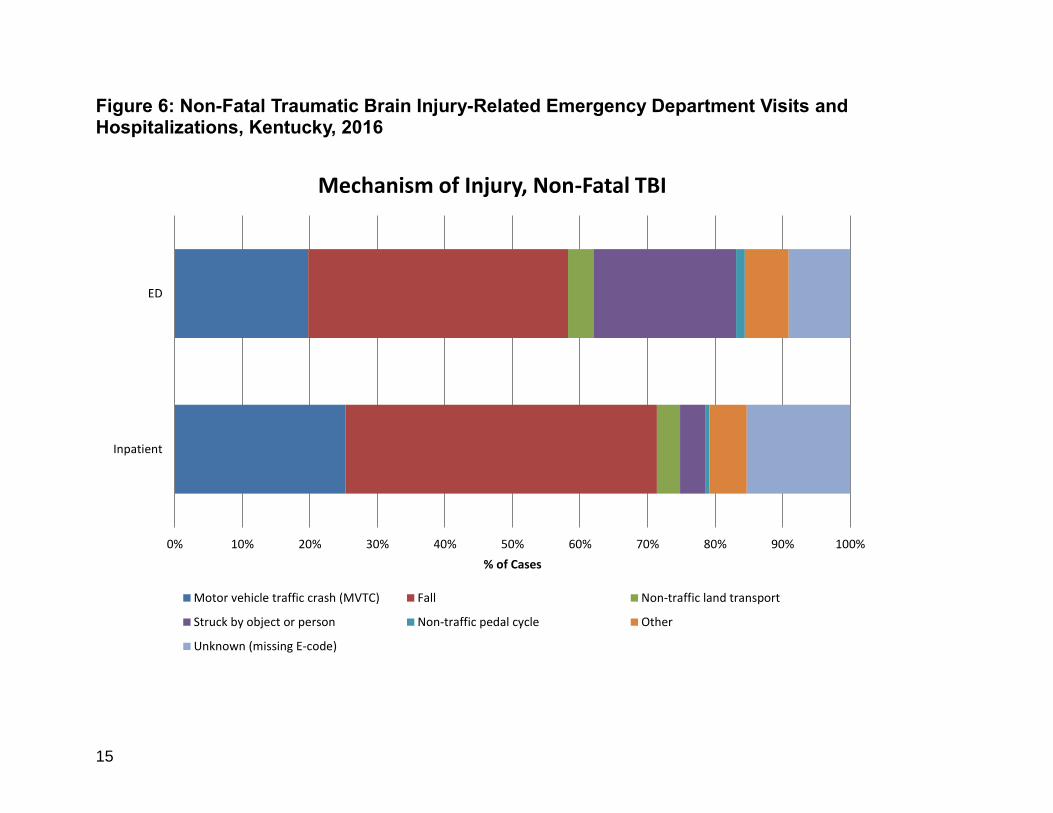
Figure 6: Non-Fatal Traumatic Brain Injury-Related Emergency Department Visits and Hospitalizations, Kentucky, 2016
0% 10% 20% 30% 40% 50% 60% 70% 80% 90% 100%
Inpatient
ED
% of Cases
Mechanism of Injury, Non-Fatal TBI
Motor vehicle traffic crash (MVTC) Fall Non-traffic land transport
Struck by object or person Non-traffic pedal cycle Other
Unknown (missing E-code)
16
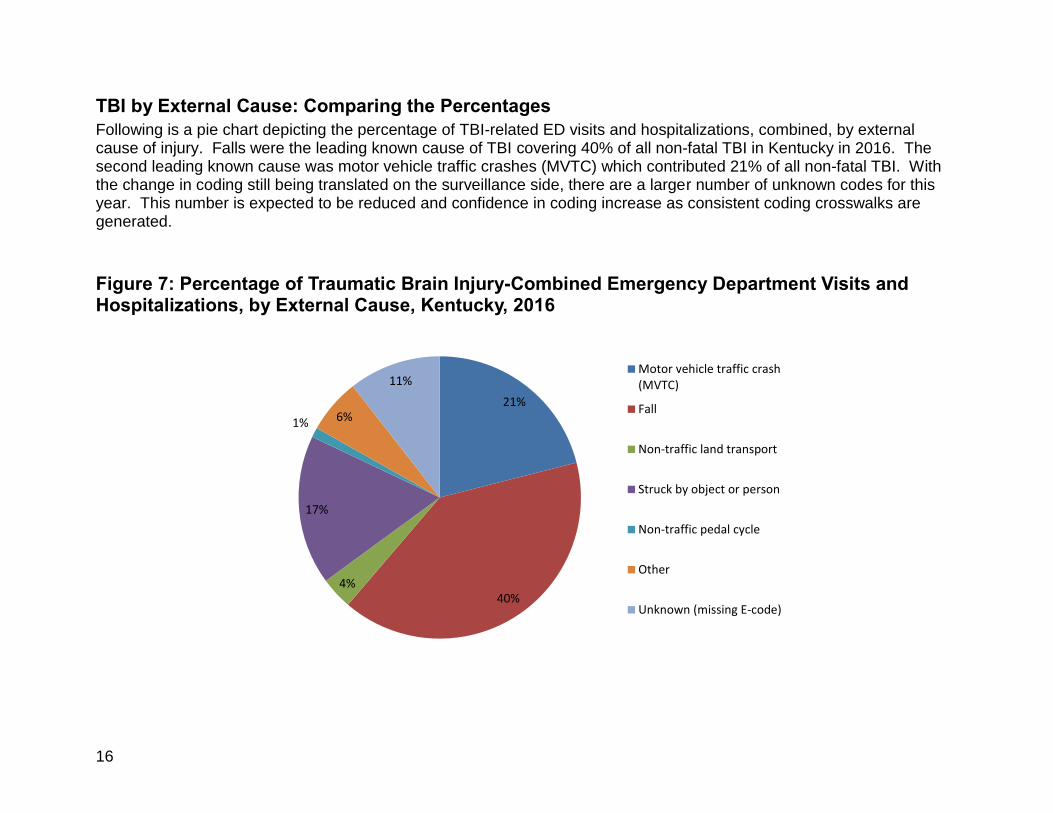
TBI by External Cause: Comparing the Percentages
Following is a pie chart depicting the percentage of TBI-related ED visits and hospitalizations, combined, by external cause of injury. Falls were the leading known cause of TBI covering 40% of all non-fatal TBI in Kentucky in 2016. The second leading known cause was motor vehicle traffic crashes (MVTC) which contributed 21% of all non-fatal TBI. With the change in coding still being translated on the surveillance side, there are a larger number of unknown codes for this year. This number is expected to be reduced and confidence in coding increase as consistent coding crosswalks are generated.
Figure 7: Percentage of Traumatic Brain Injury-Combined Emergency Department Visits and Hospitalizations, by External Cause, Kentucky, 2016
21%
40%4%
17%
1% 6%
11%Motor vehicle traffic crash(MVTC)
Fall
Non-traffic land transport
Struck by object or person
Non-traffic pedal cycle
Other
Unknown (missing E-code)
17
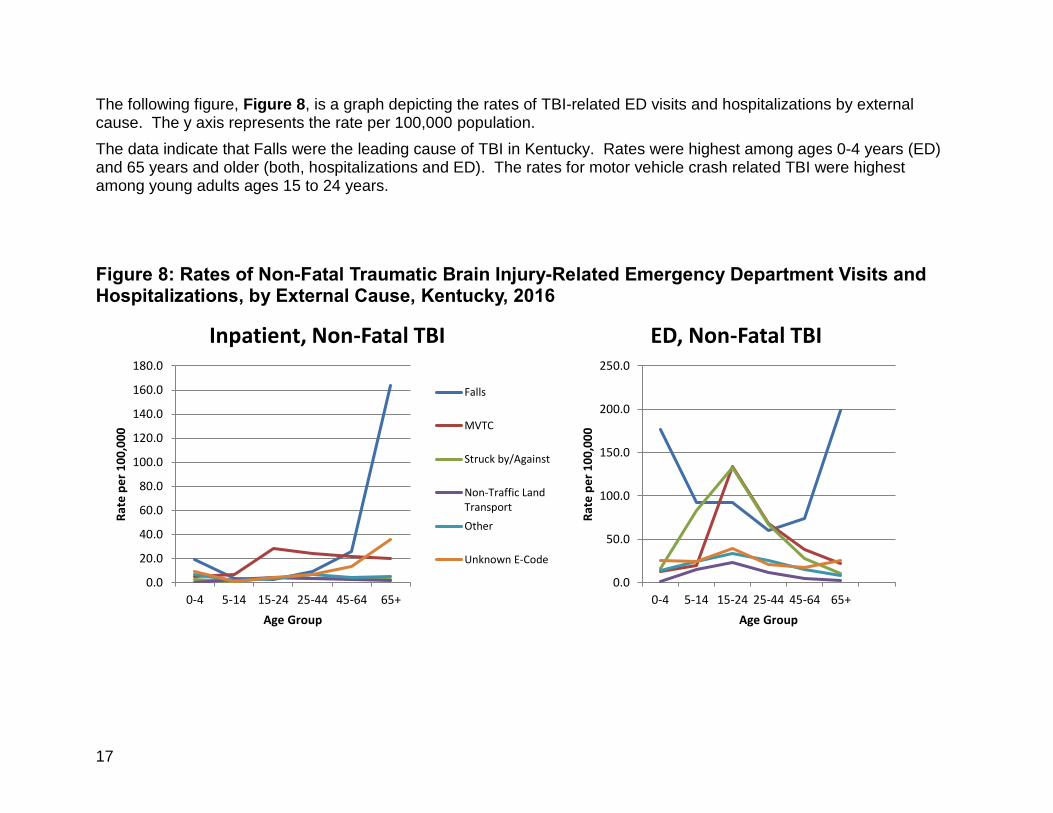
The following figure, Figure 8, is a graph depicting the rates of TBI-related ED visits and hospitalizations by external cause. The y axis represents the rate per 100,000 population.
The data indicate that Falls were the leading cause of TBI in Kentucky. Rates were highest among ages 0-4 years (ED) and 65 years and older (both, hospitalizations and ED). The rates for motor vehicle crash related TBI were highest among young adults ages 15 to 24 years.
Figure 8: Rates of Non-Fatal Traumatic Brain Injury-Related Emergency Department Visits and Hospitalizations, by External Cause, Kentucky, 2016
0.0
20.0
40.0
60.0
80.0
100.0
120.0
140.0
160.0
180.0
0-4 5-14 15-24 25-44 45-64 65+
Rat
e p
er
10
0,0
00
Age Group
Inpatient, Non-Fatal TBI
Falls
MVTC
Struck by/Against
Non-Traffic LandTransport
Other
Unknown E-Code
0.0
50.0
100.0
150.0
200.0
250.0
0-4 5-14 15-24 25-44 45-64 65+R
ate
pe
r 1
00
,00
0
Age Group
ED, Non-Fatal TBI

18
TBI by External Cause: Comparing the Percentages by Age Groups The following two figures depict the percentage of non-fatal TBI-related ED visits and hospitalizations by external cause for specific age groups. Figure 9 presents data for children ages 0 to 14 years. Figure 10 presents data for adults age 65 or older.
Figure 9: Percentage of Traumatic Brain Injury-Combined Emergency Department Visits and Hospitalizations Among Children 0 to 14 Years, by External Cause, Kentucky, 2016
For children ages 0 to 14 years, falls were the leading known external cause of non-fatal TBI, contributing to almost half of all TBIs in this age group. The second leading known external cause was struck by or against events which accounted for nearly a quarter of injuries.
47%
9%
23%
5%
6%
10% Falls
MVTC
Struck by/Against
Non-Traffic LandTransport
Other
Unknown E-Code

19
Figure 10: Percentage of Non-Fatal Traumatic Brain Injury-Combined Emergency Department Visits and Hospitalizations Among Older Adults 65 Years or Older, by External Cause, Kentucky, 2016
Falls were also the leading cause of non-fatal TBI for adults age 65 years or older and contributed to almost three quarters of non-fatal TBI injuries.
73%
9%
3%
1% 2%12%
Falls
MVTC
Struck by/Against
Non-Traffic LandTransport
Other
Unknown E-Code

20
The length of stay (LOS) for hospitalized, non-fatal TBI (n=3,522) ranged from 1 day to 303 days. The mean LOS was 7.4 days with a median LOS of 4 days. Figure 11 shows the distribution of stays for those hospitalized with a TBI. Two thirds of admitted TBI injuries stayed for less than 1 week.
Figure 11: Non-Fatal Traumatic Brain Injury-Hospitalization Length of Stay, Kentucky, 2016
For non-fatal inpatient TBIs, 1,714 (48.7%) had a disposition other than “routine”. The three most frequent non-routine discharges were “skilled nursing facility”, “home health”, and “rehabilitation”. A total of 1,371 inpatient discharges had one of these three dispositions. ED discharges were nearly always (84.1%) to home or self care (routine) with “inpatient – other short term hospital” being the most frequent non-routine discharge.
16%
51%
20%
7%3% 3% 1 day
More than one day butless than 1 week1 week to less than 2weeks2 weeks to less than 3weeks3 weeks to less than 4weeks4 weeks or more

21
Government sources were the primary payers billed for inpatient care charges in almost three quarters (72.4%) of non-fatal TBI as well asover half ED care charges (53.0%). Please note that the amount billed by the hospital will generally be larger than the amount actually paid after adjudication of the claim.
Figure 12: Non-Fatal Traumatic Brain Injury-Emergency Department and Hospitalizations, Payer Source and Charges, Kentucky, 2016
72%
18%
2%
2%
6%
Inpatient, Non-Fatal TBI
Government
Commercial Ins
Self Pay
Workers Compensation
Other
53%
28%
6%
4%9%
ED, Non-Fatal TBI
$- $30,000,000 $60,000,000 $90,000,000 $120,000,000 $150,000,000 $180,000,000
Government
Commercial Ins
Self Pay
Workers Compensation
Other
Charges to Pay Sources, Non-Fatal TBI, 2016
Outpatient Inpatient

22
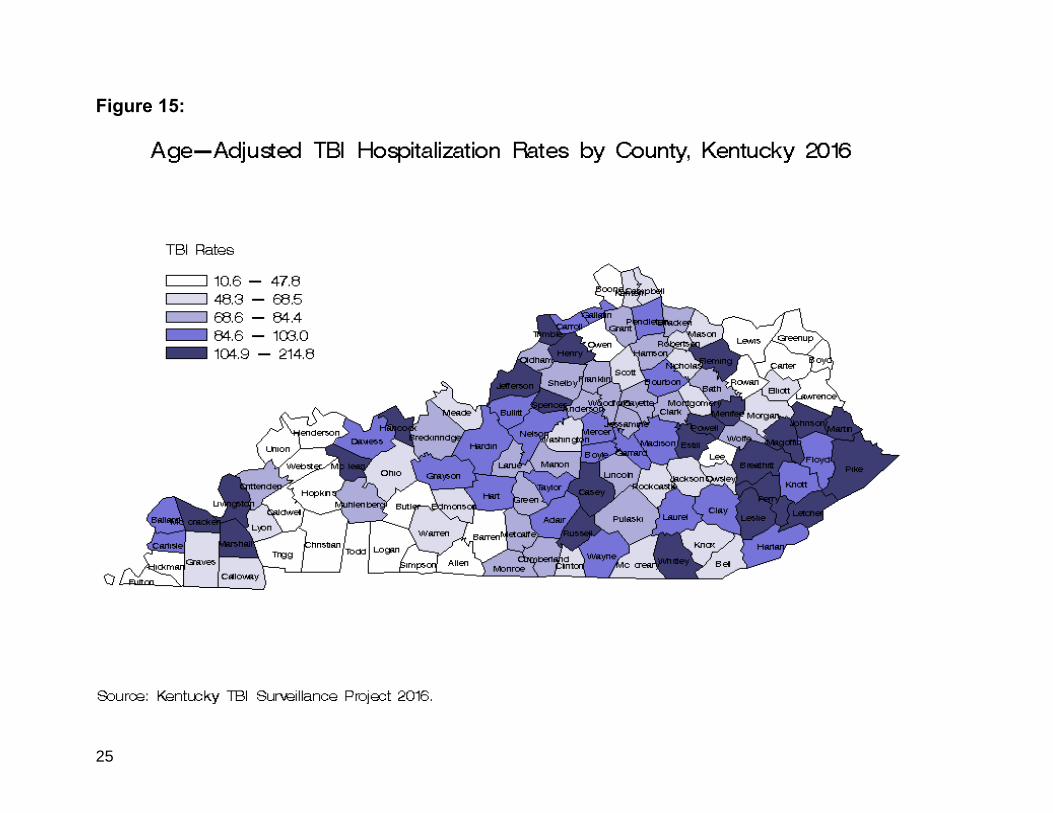
As one would expect, the incidence of TBI was highest in the larger counties. The top three in overall (inpatient and ED combined) TBI incidence (Jefferson, Fayette, and Hardin) are among the top most populous counties in Kentucky. McCracken County makes the top five in incidence while only being 13th in population rank in the state. Another notable exception was Whitley County, which was 12th in TBI incidence but 29th in population. Clay, Menifee, Fleming and Owsley also stood out by being the top 4 age-adjusted rate while ranking 54th, 115th, 76th and 119th in population size. Clay has consistently been one of the highest rated counties in Kentucky since 2001. In the past when data was available, it was noted that several southern border counties have significant numbers of residents treated in Tennessee hospitals. Prominent examples include Christian, Whitley, Warren, Bell, Harlan, Graves, Logan, and McCracken. This illustrates an important point: if this report shows a county to have a high rate of TBI, we can be confident that this is a county in need. Conversely, however, if a county is shown to have a low rate we cannot conclude that there is not a significant problem in that county, particularly if it is located on or near the state border. The following illustrations map both the frequency of TBI in Kentucky counties (Figures 13 and 14) as well as the age adjusted rate of TBI in each county (Figures 15 and 16) for inpatient and outpatient TBIs. It should be noted that these mappings include ALL inpatient TBI cases (Figures 13 and 15) as well as ALL ED TBI cases (Figures 14 and 16) – including those that died at the hospital. Fatalities are not included in other analysis in this report unless noted but are included here to capture a visual representation of the magnitude of the problem of TBI in each county. These numbers DO NOT include those that died before admission to an acute care hospital. Multiple tables can be found in the Appendix detailing specific rates and frequencies by county, frequency, and age adjusted rates for both inpatient and ED TBIs.

23
Figure 13:

24
Figure 14:
25
Figure 15:

26
Figure 16:

27
Acquired Brain Injury in Kentucky
In addition to CDC-defined TBI, there are many brain injuries that have non-traumatic etiologies. These we have classified as ABI. (See Appendix for diagnosis codes.) Because these diagnoses are not included in the CDC definition of TBI, they have been analyzed separately. There were 13,846 non-fatal ABI cases for Kentucky residents identified in 2016. This includes both inpatient (7,264) and ED (6,582) cases. The crude incidence rate for 2016 was 312 per 100,000 population.
ABI by Sex: Comparing the Rates
The following figure, Figure 17, is a graph depicting the rates of non-fatal ABI-related ED visits and hospitalizations by sex. The y axis represents the rate per 100,000 population. Rates were slightly higher for females in both ED and inpatient ABI cases.
Figure 17: Rates of Non-Fatal Acquired Brain Injury-Related Emergency Department Visits and Hospitalizations, by Gender, Kentucky, 2016
0.0
20.0
40.0
60.0
80.0
100.0
120.0
140.0
160.0
180.0
200.0
Male Female
Rat
e p
er
10
0,0
00
Gender
Inpatient
ED

28
ABI by Age: Comparing the Numbers
Figure 18: Numbers of Non-Fatal Acquired Brain Injury-Related Emergency Department Visits, and Hospitalizations, by Age Group, Kentucky, 2016
0
500
1,000
1,500
2,000
2,500
3,000
0-4 5-14 15-24 25-44 45-64 65+
Cas
es
Age Group
Inpatient
ED
0.0
5.0
10.0
15.0
20.0
25.0
30.0
35.0
40.0
0-4 5-14 15-24 25-44 45-64 65+
% o
f C
ase
s
Age Group

29
ABI by Age: Comparing the Rates
The following figure, Figure 19, is a graph depicting the annual rate of ABI-related ED visits and hospitalizations by age groups in Kentucky for 2016. The y axis represents the rate per 100,000 population. During 2016, the highest rate of non-fatal ABI-related ED visits at 192 per 100,000 population were those in the 25-44. The highest rates of non-fatal ABI-related hospitalization occurred among adults age 65 years or older (395 per 100,000).
Figure 19: Rates of Acquired Brain Injury-Related Emergency Department Visits and Hospitalizations, by Age Group, Kentucky, 2016
0.0
50.0
100.0
150.0
200.0
250.0
300.0
350.0
400.0
450.0
0-4 5-14 15-24 25-44 45-64 65+
Rat
e p
er
10
0,0
00
Age Group
Inpatient
ED
30
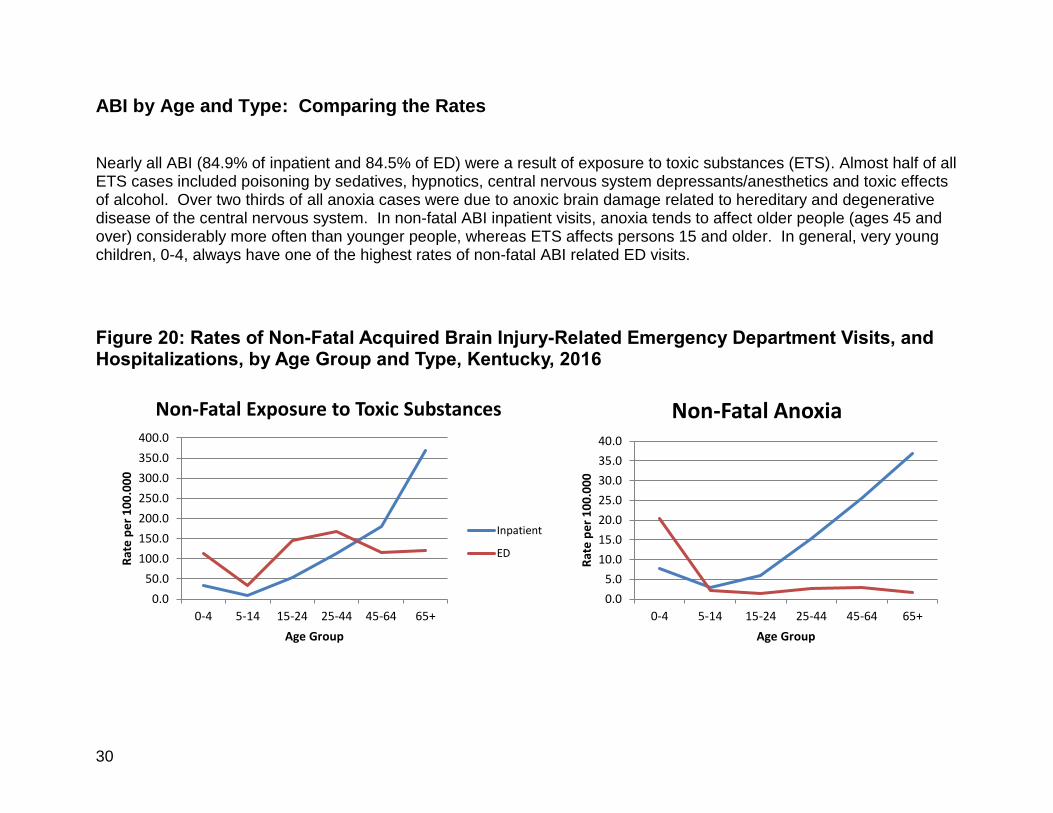
ABI by Age and Type: Comparing the Rates
Nearly all ABI (84.9% of inpatient and 84.5% of ED) were a result of exposure to toxic substances (ETS). Almost half of all ETS cases included poisoning by sedatives, hypnotics, central nervous system depressants/anesthetics and toxic effects of alcohol. Over two thirds of all anoxia cases were due to anoxic brain damage related to hereditary and degenerative disease of the central nervous system. In non-fatal ABI inpatient visits, anoxia tends to affect older people (ages 45 and over) considerably more often than younger people, whereas ETS affects persons 15 and older. In general, very young children, 0-4, always have one of the highest rates of non-fatal ABI related ED visits.
Figure 20: Rates of Non-Fatal Acquired Brain Injury-Related Emergency Department Visits, and Hospitalizations, by Age Group and Type, Kentucky, 2016
0.0
50.0
100.0
150.0
200.0
250.0
300.0
350.0
400.0
0-4 5-14 15-24 25-44 45-64 65+
Rat
e p
er
10
0.0
00
Age Group
Non-Fatal Exposure to Toxic Substances
Inpatient
ED
0.0
5.0
10.0
15.0
20.0
25.0
30.0
35.0
40.0
0-4 5-14 15-24 25-44 45-64 65+
Rat
e p
er
10
0.0
00
Age Group
Non-Fatal Anoxia
31
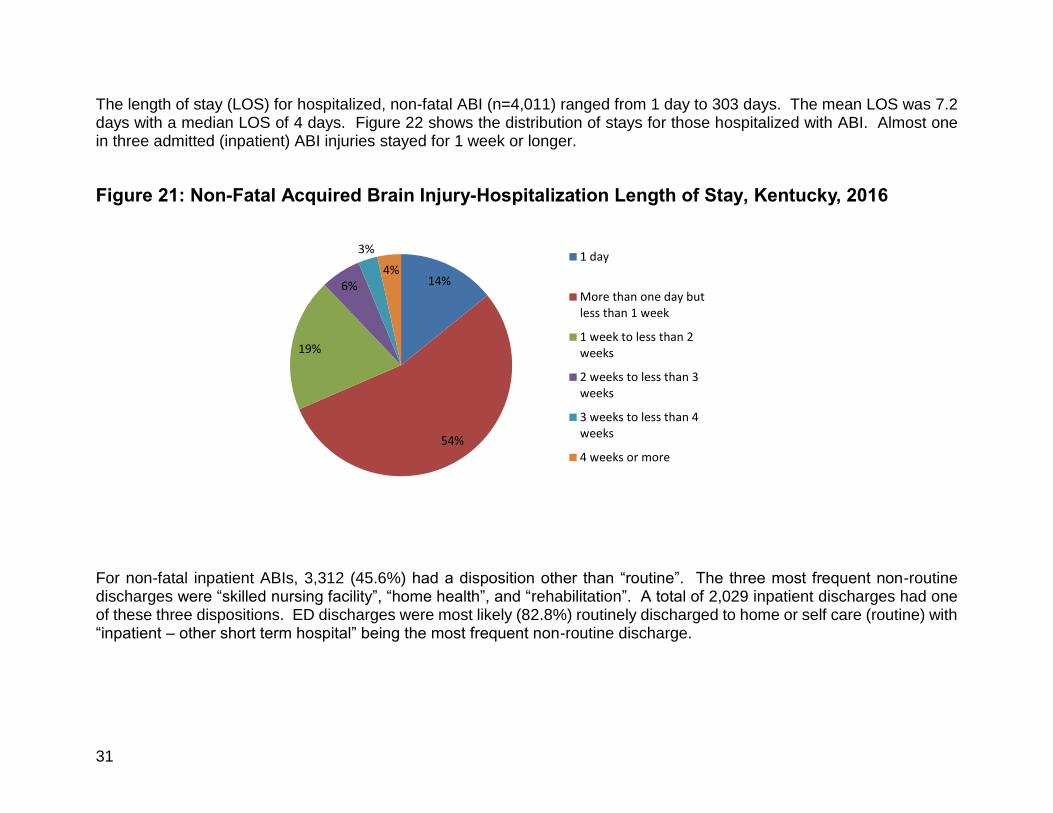
The length of stay (LOS) for hospitalized, non-fatal ABI (n=4,011) ranged from 1 day to 303 days. The mean LOS was 7.2 days with a median LOS of 4 days. Figure 22 shows the distribution of stays for those hospitalized with ABI. Almost one in three admitted (inpatient) ABI injuries stayed for 1 week or longer.
Figure 21: Non-Fatal Acquired Brain Injury-Hospitalization Length of Stay, Kentucky, 2016
For non-fatal inpatient ABIs, 3,312 (45.6%) had a disposition other than “routine”. The three most frequent non-routine discharges were “skilled nursing facility”, “home health”, and “rehabilitation”. A total of 2,029 inpatient discharges had one of these three dispositions. ED discharges were most likely (82.8%) routinely discharged to home or self care (routine) with “inpatient – other short term hospital” being the most frequent non-routine discharge.
14%
54%
19%
6%
3%
4%1 day
More than one day butless than 1 week
1 week to less than 2weeks
2 weeks to less than 3weeks
3 weeks to less than 4weeks
4 weeks or more
32
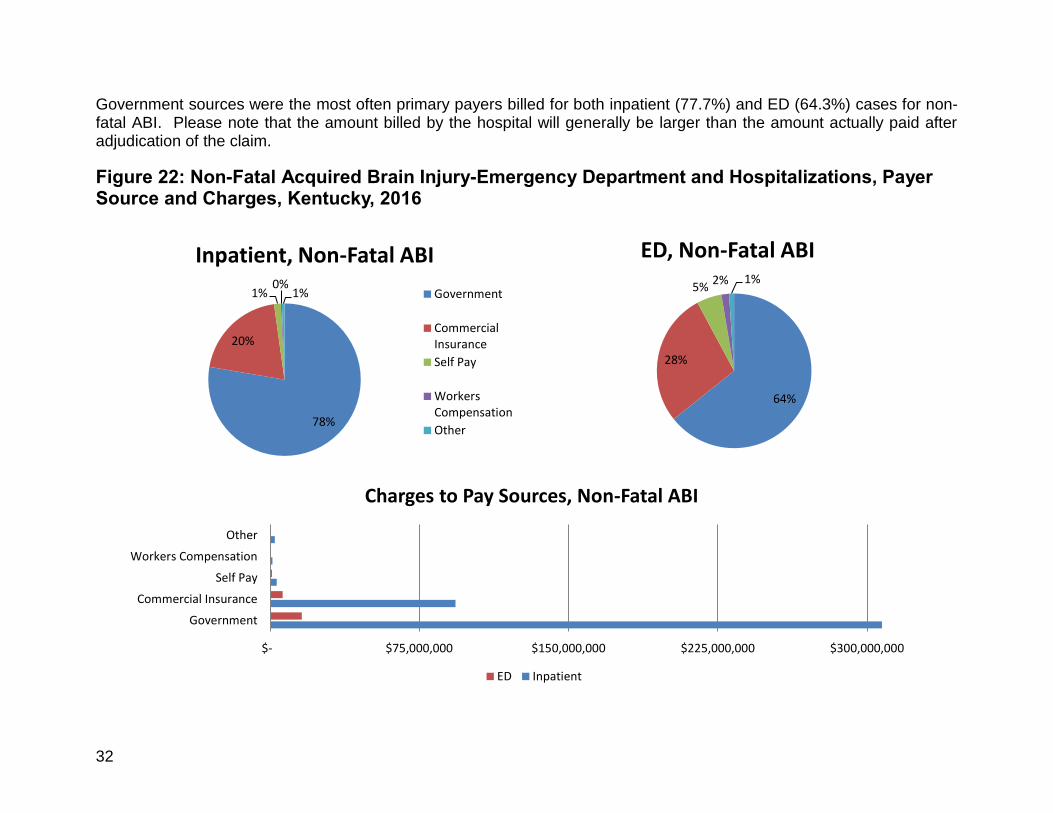
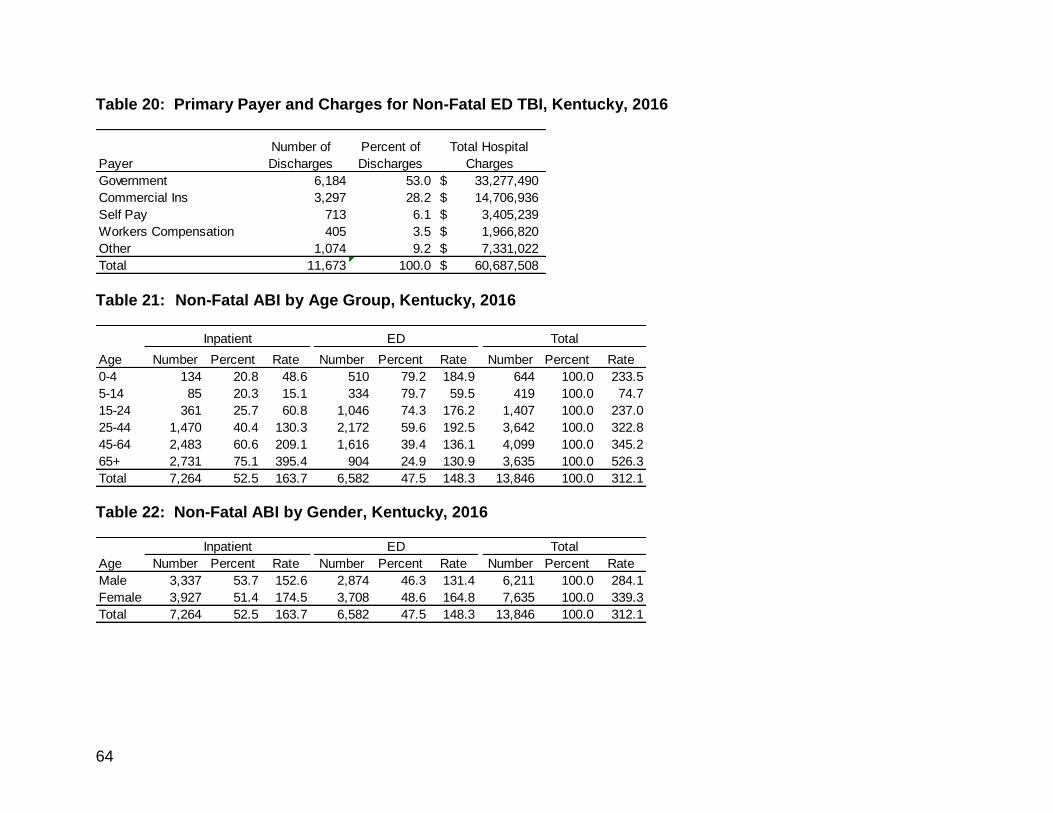
Government sources were the most often primary payers billed for both inpatient (77.7%) and ED (64.3%) cases for non-fatal ABI. Please note that the amount billed by the hospital will generally be larger than the amount actually paid after adjudication of the claim.
Figure 22: Non-Fatal Acquired Brain Injury-Emergency Department and Hospitalizations, Payer Source and Charges, Kentucky, 2016
78%
20%
1%0%
1%
Inpatient, Non-Fatal ABI
Government
CommercialInsurance
Self Pay
WorkersCompensation
Other
64%
28%
5%2% 1%
ED, Non-Fatal ABI
$- $75,000,000 $150,000,000 $225,000,000 $300,000,000
Government
Commercial Insurance
Self Pay
Workers Compensation
Other
Charges to Pay Sources, Non-Fatal ABI
ED Inpatient

33
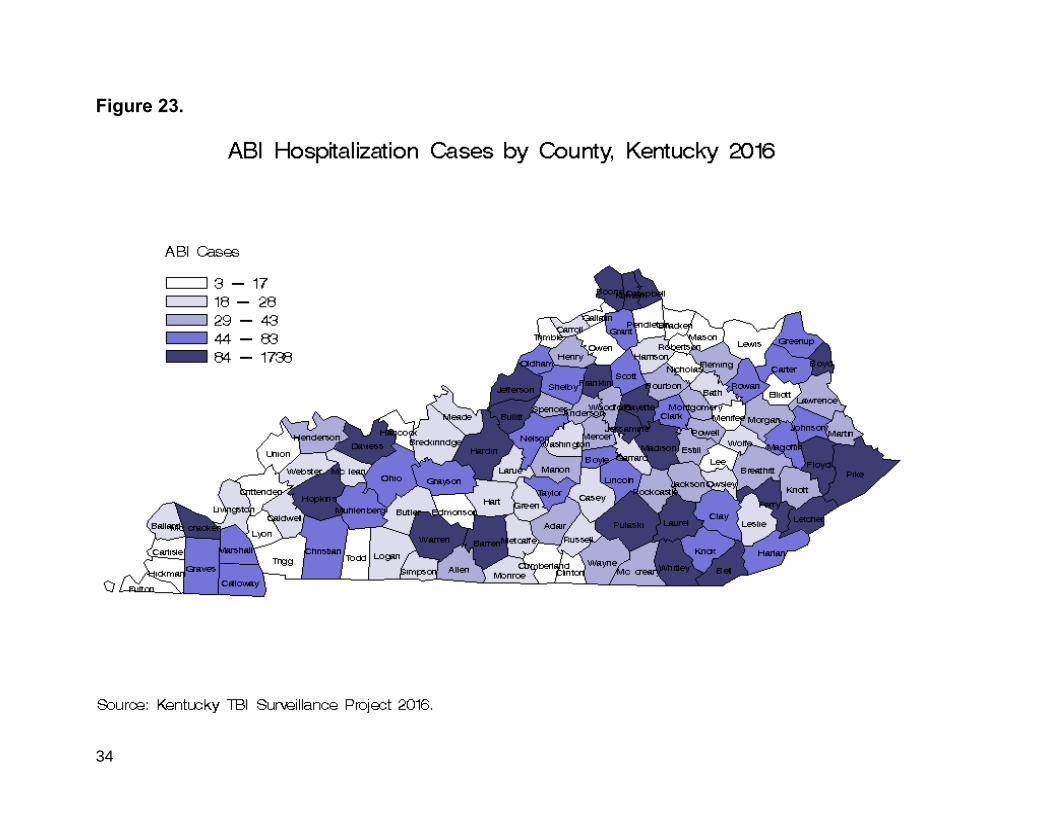
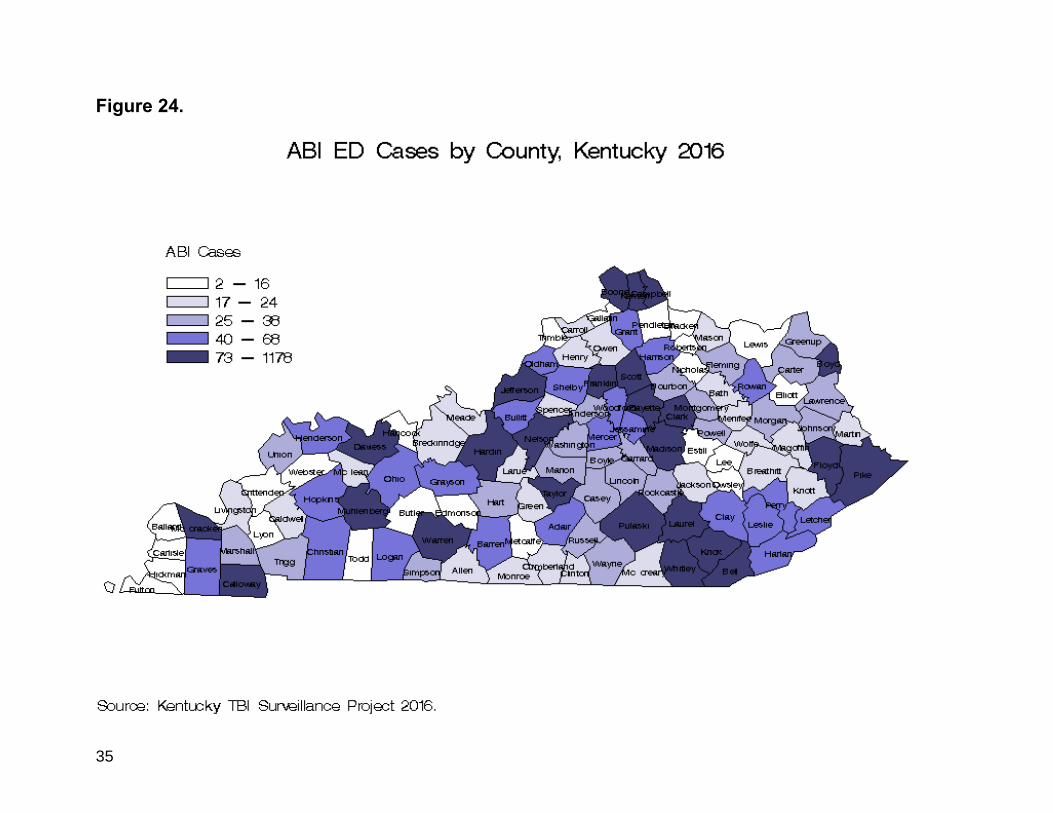
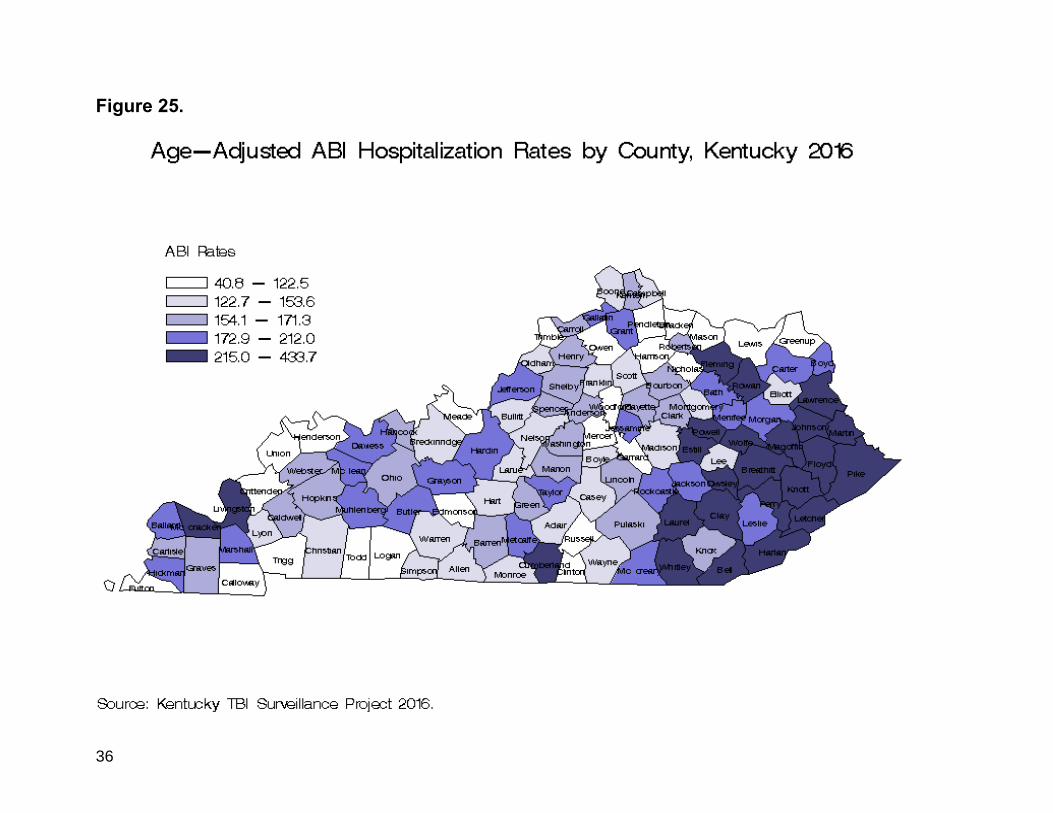
In general, as with TBI, the more populous counties had high numbers of ABI. However, only one of the ten most populous counties appeared in the top 25 counties when ranked by age-adjusted rate for hospitalized cases (Jefferson County, ranked 1st in population and 24th in age adjusted rate). Perry, which ranks 38th with respect to county population, had the highest age adjusted rate of inpatient ABI in the state. Leading the state for age adjusted rate for ED cases was Clay County, the 54th (most populated) county when ranked by population size, followed by Owsley which is ranked 119th in population. The counties with the highest inpatient rates were concentrated in eastern Kentucky with another cluster showing in the western region (Figure 26).
The following figures map both the frequency of ABI in Kentucky counties (Figures 24 and 25) as well as the age adjusted rate of ABI in each county (Figures 26 and 27) for inpatient and outpatient ABIs. It should be noted that these mappings include ALL inpatient ABI cases (Figures 24 and 26) as well as ALL ED ABI cases (Figures 25 and 27) – including those that died at the hospital. Fatalities are not included in other analysis in this report unless noted but are included here to capture a visual representation of the magnitude of the problem of ABI in each county. These numbers DO NOT include those that died before admission to an acute care hospital. Multiple tables can be found in the Appendix detailing specific rates and frequencies by county, frequency, and age adjusted rates for both inpatient and ED ABIs.
34
Figure 23.
35
Figure 24.
36
Figure 25.

37
Figure 26.

38
Spinal Cord Injury in Kentucky
SCI patients often are readmitted for problems stemming from the original injury. In an effort to avoid double counting in such cases, for SCI we looked only at the first three listed diagnosis codes. There were 154 non-fatal inpatient SCI cases for Kentucky residents identified in 2016 as well as 87 non-fatal ED cases. The crude incidence rate of any non-fatal SCI was 5.4 per 100,000 population.
SCI by Sex: Comparing the Rates
Figure 27: Rates of Non-Fatal Spinal Cord Injury-Related Emergency Department Visits and Hospitalizations, by Gender, Kentucky, 2016
0.0
1.0
2.0
3.0
4.0
5.0
6.0
Male Female
Rat
e p
er
10
0,0
00
Gender
Inpatient
ED

39
Figure 28: Rates of Spinal Cord Injury-Related Emergency Department Visits and Hospitalizations, by Age Group, Kentucky, 2016
The highest age-specific rates were found in the 45-64 age group for both non-fatal inpatient and ED SCI.
0.0
1.0
2.0
3.0
4.0
5.0
6.0
0-4 5-14 15-24 25-44 45-64 65+
Rat
e p
er
10
0,0
00
Age Group
Inpatient
ED

40
Figure 29: Non-Fatal Spinal Cord Injury-Related Emergency Department Visits and Hospitalizations by External Cause, Kentucky, 2016
Among non-fatal SCI’s for which an E-code was reported, falls were the leading mechanisms of injury for both inpatient and ED SCI visits. Unfortunately, almost one out of five of the inpatient SCI discharges had no E-code reported. Hospitalized SCI patients had a length of stay (LOS) varying from 1 day to 83 days. The mean LOS was 10.5 days with a median of 7.5 days. Almost 3 out of 4 (70.8%) of the non-fatal inpatient SCI discharges had dispositions other than “routine”, while 335.6% of ED discharges were non-routine. In total, almost 6 out of 10 of all SCI non-fatal discharges went on to receive further care. In comparison, non-fatal TBI inpatient visits were routinely discharged almost 50% of the time and TBI visits to the ED were routinely discharged over 84% of the time. Overall, 3 out of 4 non-fatal TBI discharges were discharged to home or self care (routine).
0% 10% 20% 30% 40% 50% 60% 70% 80% 90% 100%
Inpatient
EDMVTC
Fall
Struck by or against object orperson
Firearm
Other
Unknown (missing E-code)
41
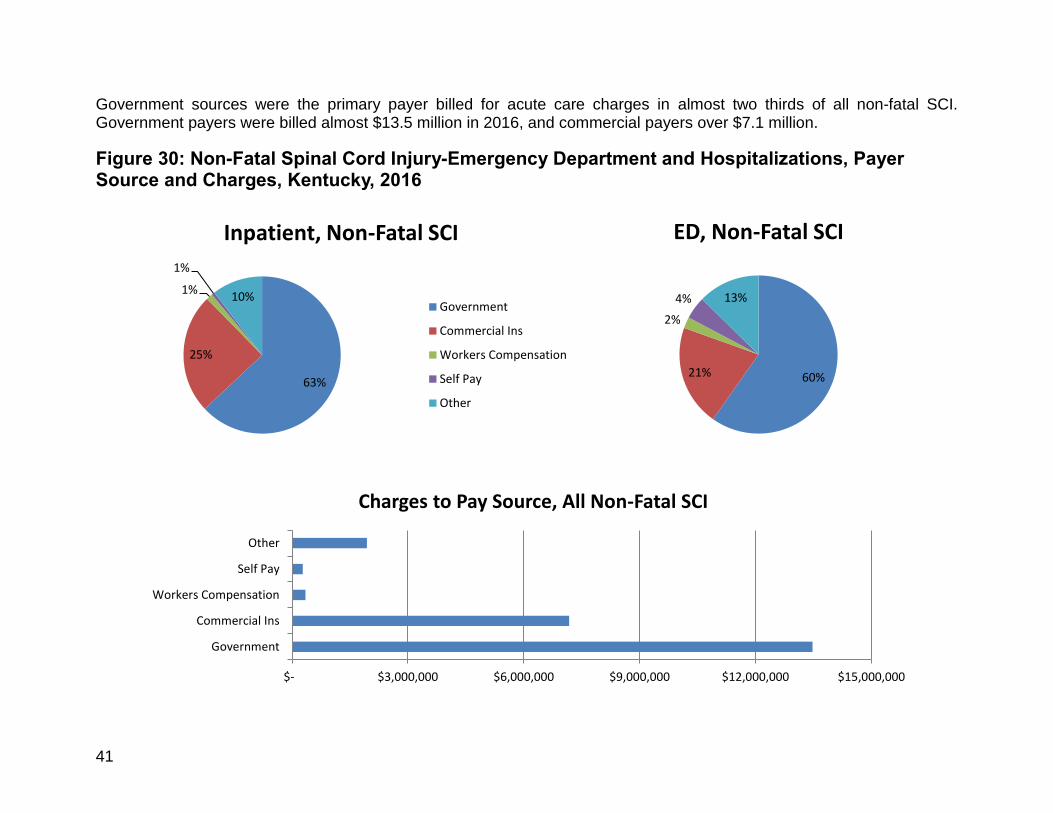
Government sources were the primary payer billed for acute care charges in almost two thirds of all non-fatal SCI. Government payers were billed almost $13.5 million in 2016, and commercial payers over $7.1 million.
Figure 30: Non-Fatal Spinal Cord Injury-Emergency Department and Hospitalizations, Payer Source and Charges, Kentucky, 2016
63%
25%
1%
1%
10%
Inpatient, Non-Fatal SCI
Government
Commercial Ins
Workers Compensation
Self Pay
Other
60%21%
2%
4% 13%
ED, Non-Fatal SCI
$- $3,000,000 $6,000,000 $9,000,000 $12,000,000 $15,000,000
Government
Commercial Ins
Workers Compensation
Self Pay
Other
Charges to Pay Source, All Non-Fatal SCI

42
Cerebrovascular Disease in Kentucky
The highest death rates for cerebrovascular disease (stroke) occur in the southeastern US which has been dubbed the “stroke belt”. This region consists of a group of 11 southeastern states that have an age-adjusted stroke mortality rate more than 10% above the national average. Kentucky is included in this region. In 2016, over 20,000 non-fatal hospital visits by Kentucky residents were coded with stroke related ICD-10 codes in one or more diagnosis fields. Of these, 78.8% listed stroke as the principal diagnosis. There were 13,132 non-fatal inpatient stroke cases for Kentucky residents identified in 2016 as well as 7,747 non-fatal ED cases. The crude incidence rate was 471 per 100,000 population.
Stroke by Sex: Comparing the Rates
Figure 31: Rates of Non-Fatal Stroke Related Emergency Department Visits and Hospitalizations, by Gender, Kentucky, 2016
0.0
50.0
100.0
150.0
200.0
250.0
300.0
350.0
Male Female
Rat
e p
er
10
0,0
00
Gender
Inpatient
ED

43
Figure 32: Rates of Stroke Related Emergency Department Visits and Hospitalizations, by Age Group, Kentucky, 2016
The highest age-specific rates were found in the 65 or older age group for both non-fatal inpatient and ED stroke cases.
0.0
200.0
400.0
600.0
800.0
1000.0
1200.0
1400.0
0-4 5-14 15-24 25-44 45-64 65+
Rat
e p
er
10
0,0
00
Age Group
Inpatient
ED

44
The length of stay (LOS) for non-fatal stroke related hospitalizations (n=13,132) ranged from 1 day to 315 days. The mean LOS was 5.9 days with a median LOS of 4 days. Figure 34 shows the distribution of stays for those hospitalized with a stroke diagnosis. Over one in four admitted (inpatient) stroke related hospitalizations stayed for 1 week or longer.
Figure 33: Non-Fatal Stroke Related Hospitalization Length of Stay, Kentucky, 2016
For non-fatal stroke related hospitalizations, 7,378 (56.2%) had a disposition other than “routine”. The three most frequent non-routine discharges were “skilled nursing facility”, “home health”, and “rehabilitation”. A total of 5,806 inpatient discharges had one of these three dispositions. ED discharges were most likely (52.2%) routinely discharged to home or self care (routine) with “inpatient – other” being the most frequent non-routine discharge.
14%
59%
18%
5%
2% 2%1 day
More than one day butless than 1 week
1 week to less than 2weeks
2 weeks to less than 3weeks
3 weeks to less than 4weeks
4 weeks or more

45
Government sources were the primary payer billed for acute care charges in almost 8 out of 10 of all non-fatal stroke related hospital visits. Government payers were billed over $600 million in 2016, and commercial payers almost $170 million.
Figure 34: Non-Fatal Stroke Related Emergency Department Visits and Hospitalizations, Payer Source and Charges, Kentucky, 2016
81%
18%
0%1% 0%
Inpatient, Non-Fatal Stroke
Government
Commercial Ins
Workers Compensation
Self Pay
Other 77%
21%
0% 2% 0%
ED, Non-Fatal Stroke
$- $150,000,000 $300,000,000 $450,000,000 $600,000,000
Government
Commercial Ins
Workers Compensation
Self Pay
Other
Charges to Pay Source, All Non-Fatal Stroke

46
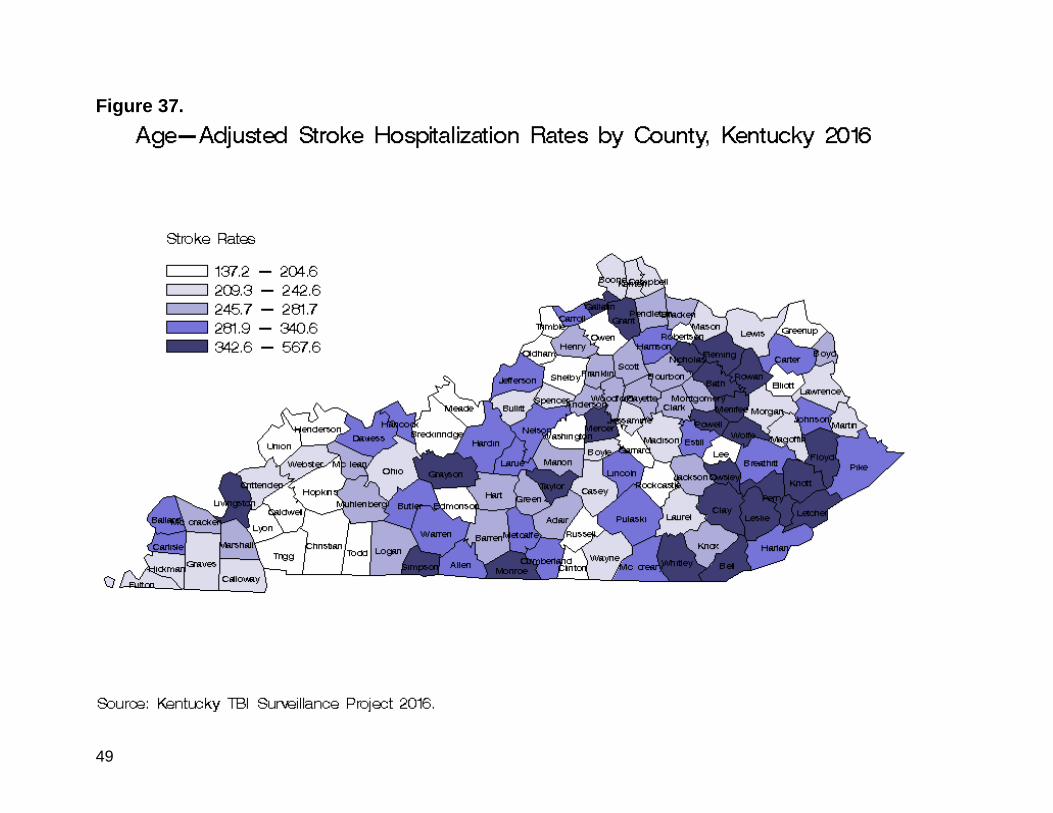
As one would expect, the incidence of stroke was highest in the larger counties. The top four in overall (inpatient and ED combined) stroke incidence (Jefferson, Fayette, Warren and Hardin) are the four of the six most populous counties in Kentucky. Notable exceptions include Leslie and Wolfe Counties, which were ranked 2nd and 3rd in age adjusted rate for stroke but were 98th and 111th in population (respectively). Metcalfe (100th in population) and Menifee (115th) are also in the top fifteen counties with highest age adjusted rates despite their smaller populations. Several southern border counties may have significant numbers of residents treated in Tennessee hospitals. Prominent examples include Christian, Whitley, Warren, Bell, Harlan, Graves, Logan, and McCracken. This illustrates an important point: if this report shows a county to have a high rate of stroke, we can be confident that this is a county in need. Conversely, however, if a county is shown to have a low rate we cannot conclude that there is not a significant problem in that county, particularly if it is located on or near the state border. The following illustrations map both the frequency of stroke hospital visits in Kentucky counties (Figures 36 and 37) as well as the age adjusted rate of stroke in each county (Figures 38 and 39) for inpatient and outpatient stroke records. It should be noted that these mappings include ALL inpatient stroke cases (Figures 36 and 38) as well as ALL ED stroke cases (Figures 37 and 39) – including those that died at the hospital. Fatalities are not included in other analysis in this report unless noted but are included here to capture a visual representation of the magnitude of the problem of stroke in each county. These numbers DO NOT include those that died before admission to an acute care hospital. Multiple tables can be found in the Appendix detailing specific rates and frequencies by county, frequency, and age adjusted rates for both inpatient and ED stroke records .

47
Figure 35.

48
Figure 36.
49
Figure 37.

50
Figure 38.
51
Conclusion
Almost 50,000 non-fatal central nervous system injury-related ED visits and hospitalizations occurred in Kentucky in 2016. The findings show the importance of including ED visits because of the large number of TBIs seen only in that setting, especially among children. Although this report provides data on a wide range of CNSI occurring in Kentucky, it still does not capture all of them. It does not include those treated by emergency medical services that refused transport to a hospital, or those hospitalized outside of Kentucky nor does it include those seen by non-hospital medical services or who sought no care at all. While the 2016 data is not recommended for use in comparisons with years past due to coding changes made in the third quarter of 2015, the data is still important when discussing the larger issue of brain injury in Kentucky. Many people recover from their injuries, but in 2016 alone, over 143 Kentuckians per day received either inpatient or ED care for a CNSI, many of which will result in some long term disability. Thus, brain and spinal cord injury prevention, improved acute care and rehabilitation to reduce the likelihood of injury-related disability, and also increased access to services for those who do not fully recover are critical to improving quality of life of persons following a CNSI.
52
Appendix A: Tables and Figures
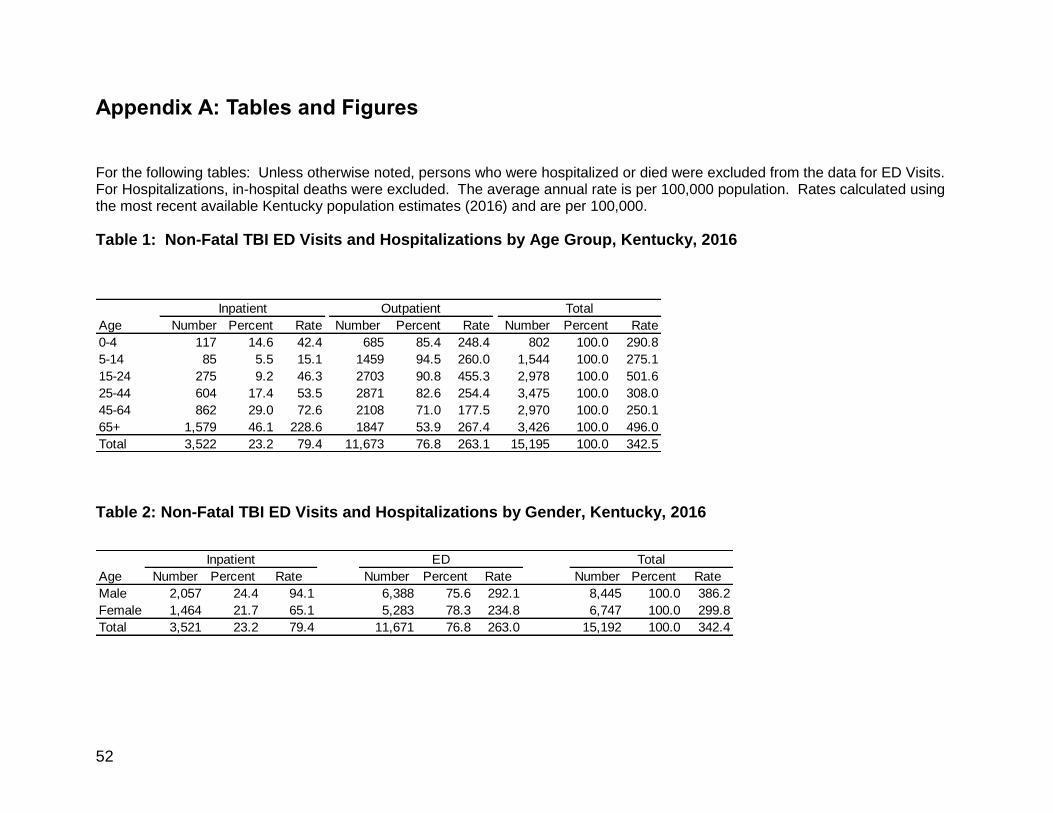
For the following tables: Unless otherwise noted, persons who were hospitalized or died were excluded from the data for ED Visits. For Hospitalizations, in-hospital deaths were excluded. The average annual rate is per 100,000 population. Rates calculated using the most recent available Kentucky population estimates (2016) and are per 100,000.
Table 1: Non-Fatal TBI ED Visits and Hospitalizations by Age Group, Kentucky, 2016
Table 2: Non-Fatal TBI ED Visits and Hospitalizations by Gender, Kentucky, 2016
Age Number Percent Rate Number Percent Rate Number Percent Rate
0-4 117 14.6 42.4 685 85.4 248.4 802 100.0 290.8
5-14 85 5.5 15.1 1459 94.5 260.0 1,544 100.0 275.1
15-24 275 9.2 46.3 2703 90.8 455.3 2,978 100.0 501.6
25-44 604 17.4 53.5 2871 82.6 254.4 3,475 100.0 308.0
45-64 862 29.0 72.6 2108 71.0 177.5 2,970 100.0 250.1
65+ 1,579 46.1 228.6 1847 53.9 267.4 3,426 100.0 496.0
Total 3,522 23.2 79.4 11,673 76.8 263.1 15,195 100.0 342.5
TotalInpatient Outpatient
Age Number Percent Rate Number Percent Rate Number Percent Rate
Male 2,057 24.4 94.1 6,388 75.6 292.1 8,445 100.0 386.2
Female 1,464 21.7 65.1 5,283 78.3 234.8 6,747 100.0 299.8
Total 3,521 23.2 79.4 11,671 76.8 263.0 15,192 100.0 342.4
TotalInpatient ED

53
Table 3: Non-Fatal TBI ED Visits and Hospitalizations by External Cause of Injury, Kentucky, 2016
Table 4: Leading Causes of Non-Fatal TBI ED Visits and Hospitalizations for Ages 00-04, Kentucky, 2016
Mechanism of Injury Number Pct. Rate Number Pct. Rate Number Pct. Rate
Motor vehicle traffic crash 891 27.9 20.1 2,304 72.1 52.1 3,195 100.0 72.2
Fall 1,623 26.5 36.7 4,491 73.5 101.5 6,114 100.0 138.2
Firearm 39 73.6 0.9 14 26.4 0.3 53 100.0 1.2
Non-traffic land transport 121 21.6 2.7 438 78.4 9.9 559 100.0 12.6
Struck by object or person 134 5.2 3.0 2,467 94.8 55.8 2,601 100.0 58.8
Non-traffic pedal cycle 19 11.1 0.4 152 88.9 3.4 171 100.0 3.9
Machinery 10 37.0 0.2 17 63.0 0.4 27 100.0 0.6
Other 146 16.7 3.3 727 83.3 16.4 873 100.0 19.7
Unknown (missing E-code) 539 33.6 12.2 1,063 66.4 24.0 1,602 100.0 36.2
Total 3,522 23.2 79.6 11,673 76.8 263.8 15,195 100.0 343.4
TotalInpatient ED
Mechanism of Injury Number Percent Number Percent Number Percent
Fall 52 44.4 489 71.4 541 67.5
Motor vehicle traffic crash 14 12.0 36 5.3 50 6.2
Struck by or against object or person 7 6.0 44 6.4 51 6.4
Non-traffic land transportation 1 0.9 5 0.7 6 0.7
Other (including non-specific codes) 18 15.4 39 5.7 57 7.1
Unknown (missing E-code) 25 21.4 72 10.5 97 12.1
Total 117 100.0 685 100.0 802 100.0
Inpatient ED Total

54
Table 5: Leading Causes of Non-Fatal TBI ED Visits and Hospitalizations for Ages 05-14, Kentucky, 2016
Table 6: Leading Causes of Non-Fatal TBI ED Visits and Hospitalizations for Ages 15-24, Kentucky, 2016
Mechanism of Injury Number Percent Number Percent Number Percent
Motor vehicle traffic crash 38 44.7 108 7.4 146 9.5
Fall 18 21.2 520 35.6 538 34.8
Non-traffic land transportation 12 14.1 87 6.0 99 6.4
Other pedal cycle 7 8.2 67 4.6 74 4.8
Struck by or against object or person 4 4.7 467 32.0 471 30.5
Other (including non-specific codes) 3 3.5 72 4.9 75 4.9
Unknown (missing E-code) 3 3.5 138 9.5 141 9.1
Total 85 100.0 1,459 100.0 1,544 100.0
Inpatient ED Total
Mechanism of Injury Number Percent Number Percent Number Percent
Motor vehicle traffic crash 168 61.1 792 29.3 960 32.2
Firearm 9 3.3 1 0.0 10 0.3
Non-traffic land transportation 23 8.4 136 5.0 159 5.3
Fall 14 5.1 552 20.4 566 19.0
Struck by or against object or person 23 8.4 786 29.1 809 27.2
Other (including non-specific codes) 11 4.0 200 7.4 211 7.1
Unknown (missing E-code) 27 9.8 236 8.7 263 8.8
Total 275 100.0 2,703 100.0 2,978 100.0
Inpatient ED Total

55
Table 7: Leading Causes of Non-Fatal TBI ED Visits and Hospitalizations for Ages 25-44, Kentucky, 2016
Table 8: Leading Causes of Non-Fatal TBI ED Visits and Hospitalizations for Ages 45-64, Kentucky, 2016
Mechanism of Injury Number Percent Number Percent Number Percent
Motor vehicle traffic crash 271 44.9 763 26.6 1,034 29.8
Firearm 19 3.1 4 0.1 23 0.7
Fall 101 16.7 683 23.8 784 22.6
Struck by or against object or person 41 6.8 762 26.5 803 23.1
Non-traffic land transportation 36 6.0 131 4.6 167 4.8
Machinery 5 0.8 2 0.1 7 0.2
Other (including non-specific codes) 54 8.9 286 10.0 340 9.8
Unknown (missing E-code) 77 12.7 240 8.4 317 9.1
Total 604 100.0 2,871 100.0 3,475 100.0
Inpatient ED Total
Mechanism of Injury Number Percent Number Percent Number Percent
Fall 309 35.8 877 41.6 1,186 39.9
Motor vehicle traffic crash 259 30.0 453 21.5 712 24.0
Firearm 4 0.5 4 0.2 8 0.3
Struck by or against object or person 44 5.1 333 15.8 377 12.7
Non-traffic land transportation 35 4.1 61 2.9 96 3.2
Other (including non-specific codes) 50 5.8 175 8.3 225 7.6
Unknown (missing E-code) 161 18.7 205 9.7 366 12.3
Total 862 100.0 2,108 100.0 2,970 100.0
Inpatient ED Total

56
Table 9: Leading Causes of Non-Fatal TBI ED Visits and Hospitalizations for Ages 65 or Over, Kentucky, 2016
Table 10: Hospital Discharges by Disposition for Non-Fatal TBI ED Visits and Hospitalizations, Kentucky, 2016
Mechanism of Injury Number Percent Number Percent Number Percent
Fall 1,129 71.5 1,370 74.2 2,499 72.9
Motor vehicle traffic crash 141 8.9 152 8.2 293 8.6
Firearm 7 0.4 3 0.2 10 0.3
Struck by or against object or person 15 0.9 75 4.1 90 2.6
Non-traffic land transportation 14 0.9 18 1.0 32 0.9
Other (including non-specific codes) 28 1.8 57 3.1 85 2.5
Unknown (missing E-code) 245 15.5 172 9.3 417 12.2
Total 1,579 100.0 1,847 100.0 3,426 100.0
Inpatient ED Total
Inpatient ED
Discharge Disposition Number Percent Number Percent
Routine discharge (home/self care) 1,808 51.3 9,818 84.1
Skilled nursing facility (SNF) 554 15.7 86 0.7
Home health 253 7.2 20 0.2
Inpatient-other short-term hospital 68 1.9 1,290 11.1
Intermediate care facility (ICF) 14 0.4 7 0.1
Rehab 564 16.0 7 0.1
Other 261 7.4 445 3.8
Total 3,522 100.0 11,673 100.0

57
Table 11: Incidence of All Inpatient TBI* by County, Sorted by County, Kentucky, 2016 *Includes inpatient deaths as well as non-fatal inpatient cases
County Freq Percent
Age-
Adjusted
Rate
Crude
Rate County Freq Percent
Age-
Adjusted
Rate
Crude
Rate County Freq Percent
Age-
Adjusted
Rate
Crude
Rate
Adair 20 0.5 95.5 103.7 Grant 20 0.5 80.9 80.2 McLean 14 0.4 127.5 147.8
Allen 9 0.2 37.3 43.6 Graves 28 0.7 60.3 75.3 Meade 18 0.5 62.0 64.0
Anderson 19 0.5 76.6 85.7 Grayson 26 0.7 87.7 99.3 Menifee 10 0.3 166.8 156.1
Ballard 10 0.3 103.0 124.2 Green 8 0.2 68.6 72.3 Mercer 22 0.6 97.9 102.4
Barren 19 0.5 37.3 43.2 Greenup 14 0.4 27.3 39.0 Metcalfe 7 0.2 68.6 69.9
Bath 11 0.3 71.9 89.2 Hancock 11 0.3 129.5 124.9 Monroe 8 0.2 68.8 75.6
Bell 16 0.4 54.9 59.0 Hardin 107 2.8 100.1 99.7 Montgomery 15 0.4 52.5 54.0
Boone 55 1.4 46.3 42.8 Harlan 25 0.7 86.6 92.0 Morgan 7 0.2 52.3 52.6
Bourbon 22 0.6 97.3 109.8 Harrison 14 0.4 76.5 75.1 Muhlenberg 27 0.7 71.9 87.0
Boyd 21 0.5 36.5 43.6 Hart 17 0.4 91.7 91.3 Nelson 42 1.1 91.7 92.2
Boyle 32 0.8 101.4 106.6 Henderson 13 0.3 25.6 28.1 Nicholas * - - -
Bracken 6 0.2 79.1 71.4 Henry 25 0.7 145.5 158.0 Ohio 20 0.5 66.7 82.0
Breathitt 15 0.4 120.0 112.9 Hickman * - - - Oldham 48 1.3 83.9 73.2
Breckinridge 18 0.5 83.7 90.2 Hopkins 21 0.5 46.6 45.7 Ow en 5 0.1 40.7 47.0
Bullitt 73 1.9 92.6 92.2 Jackson 10 0.3 65.1 74.8 Ow sley * - - -
Butler * - - - Jefferson 889 23.2 106.8 116.2 Pendleton 13 0.3 91.8 89.3
Caldw ell * - - - Jessamine 46 1.2 81.4 87.9 Perry 61 1.6 214.8 223.1
Callow ay 24 0.6 57.6 62.4 Johnson 29 0.8 109.9 126.2 Pike 90 2.3 140.7 148.6
Campbell 57 1.5 54.3 61.8 Kenton 97 2.5 54.0 58.8 Pow ell 14 0.4 120.1 113.7
Carlisle 6 0.2 100.7 123.6 Knott 14 0.4 99.1 90.1 Pulaski 59 1.5 84.4 92.3
Carroll 11 0.3 102.9 103.0 Knox 23 0.6 64.7 72.6 Robertson * - - -
Carter 12 0.3 44.4 44.4 Larue 12 0.3 76.6 85.1 Rockcastle 9 0.2 48.3 53.4
Casey 24 0.6 146.4 151.8 Laurel 60 1.6 92.1 99.6 Row an 11 0.3 47.8 45.0
Christian 7 0.2 10.6 9.7 Law rence * - - - Russell 24 0.6 134.1 135.4
Clark 31 0.8 76.7 86.5 Lee * - - - Scott 33 0.9 66.0 61.1
Clay 21 0.5 98.5 101.1 Leslie 18 0.5 151.2 170.8 Shelby 33 0.9 71.3 71.1
Clinton 7 0.2 68.0 68.8 Letcher 36 0.9 159.5 158.1 Simpson 5 0.1 23.8 27.7
Crittenden 9 0.2 77.4 98.0 Lew is 5 0.1 32.1 37.2 Spencer 19 0.5 115.0 104.0
Cumberland 6 0.2 80.7 89.0 Lincoln 21 0.5 82.6 86.2 Taylor 29 0.8 99.3 114.2
Daviess 115 3.0 102.4 115.4 Livingston 19 0.5 159.0 205.0 Todd 0 0.0 0.0 0.0
Edmonson 8 0.2 52.6 66.0 Logan 11 0.3 32.0 41.4 Trigg 6 0.2 26.7 42.1
Elliott * - - - Lyon 6 0.2 63.2 74.4 Trimble 11 0.3 131.2 127.6
Estill 19 0.5 143.3 132.8 Madison 71 1.8 85.7 79.3 Union * - - -
Fayette 239 6.2 76.2 75.1 Magoffin 22 0.6 168.2 173.4 Warren 66 1.7 54.5 52.6
Fleming 23 0.6 146.8 158.5 Marion 14 0.4 70.1 72.9 Washington 8 0.2 68.5 65.6
Floyd 44 1.1 103.0 118.6 Marshall 44 1.1 104.9 140.3 Wayne 19 0.5 87.1 92.9
Franklin 41 1.1 77.5 81.1 Martin 17 0.4 133.3 141.6 Webster * - - -
Fulton 0 0.0 0.0 0.0 Mason 13 0.3 61.0 75.6 Whitley 45 1.2 121.2 124.7
Gallatin 7 0.2 94.3 81.3 McCracken 88 2.3 109.6 135.0 Wolfe 5 0.1 75.6 69.8
Garrard 16 0.4 84.6 92.5 McCreary 11 0.3 55.5 62.8 Woodford 25 0.7 82.1 95.7
* At least one but few er than five
- Percentage or rate suppressed to prevent disclosure of the value on w hich it w as based

58
Table 12: Incidence of All ED TBI* by County, Sorted by County, Kentucky, 2016 *Includes ED deaths as well as non-fatal ED cases
County Freq Percent
Age-
Adjusted
Rate
Crude
Rate County Freq Percent
Age-
Adjusted
Rate
Crude
Rate County Freq Percent
Age-
Adjusted
Rate
Crude
Rate
Adair 58 0.5 311.7 300.8 Grant 66 0.6 271.3 264.8 McLean 37 0.3 409.8 390.5
Allen 64 0.5 341.0 310.2 Graves 102 0.9 277.2 274.3 Meade 54 0.5 199.1 192.0
Anderson 69 0.6 324.8 311.4 Grayson 91 0.8 366.1 347.5 Menifee 32 0.3 535.7 499.4
Ballard 14 0.1 191.8 173.8 Green 43 0.4 425.4 388.8 Mercer 71 0.6 358.5 330.6
Barren 162 1.4 379.7 368.2 Greenup 76 0.6 219.0 211.7 Metcalfe 27 0.2 281.3 269.5
Bath 41 0.3 318.3 332.6 Hancock 25 0.2 313.1 283.8 Monroe 32 0.3 328.4 302.2
Bell 101 0.9 369.9 372.5 Hardin 526 4.5 497.1 490.1 Montgomery 78 0.7 289.9 280.9
Boone 156 1.3 125.1 121.4 Harlan 33 0.3 127.5 121.5 Morgan 37 0.3 289.4 278.2
Bourbon 53 0.5 279.3 264.6 Harrison 96 0.8 545.6 514.9 Muhlenberg 106 0.9 343.3 341.6
Boyd 166 1.4 360.3 344.9 Hart 80 0.7 435.9 429.5 Nelson 160 1.4 369.7 351.2
Boyle 82 0.7 264.3 273.2 Henderson 92 0.8 207.1 198.9 Nicholas 30 0.3 453.5 423.5
Bracken 22 0.2 288.8 261.9 Henry 48 0.4 322.8 303.5 Ohio 122 1.0 525.4 500.5
Breathitt 31 0.3 245.1 233.4 Hickman * - - - Oldham 108 0.9 169.1 164.7
Breckinridge 50 0.4 272.0 250.5 Hopkins 149 1.3 336.9 324.6 Ow en 22 0.2 241.1 206.7
Bullitt 83 0.7 110.6 104.9 Jackson 36 0.3 292.5 269.3 Ow sley 24 0.2 583.4 534.4
Butler 35 0.3 288.8 272.5 Jefferson 1526 13.0 202.2 199.4 Pendleton 22 0.2 161.4 151.1
Caldw ell 32 0.3 278.5 254.6 Jessamine 85 0.7 164.9 162.3 Perry 92 0.8 357.4 336.5
Callow ay 179 1.5 486.5 465.7 Johnson 73 0.6 335.6 317.7 Pike 141 1.2 247.9 232.8
Campbell 105 0.9 117.7 113.9 Kenton 197 1.7 124.1 119.4 Pow ell 30 0.3 259.4 243.7
Carlisle 12 0.1 278.2 247.2 Knott 38 0.3 243.1 244.5 Pulaski 131 1.1 228.4 204.8
Carroll 23 0.2 227.3 215.4 Knox 92 0.8 310.6 290.3 Robertson * - - -
Carter 70 0.6 270.1 258.8 Larue 77 0.7 550.3 546.3 Rockcastle 47 0.4 285.8 278.9
Casey 63 0.5 406.3 398.4 Laurel 185 1.6 308.2 307.1 Row an 80 0.7 328.1 327.2
Christian 185 1.6 259.4 255.7 Law rence 39 0.3 264.4 245.9 Russell 55 0.5 316.4 310.3
Clark 112 1.0 326.3 312.7 Lee 20 0.2 274.5 304.0 Scott 146 1.2 277.5 270.5
Clay 138 1.2 682.3 664.5 Leslie 31 0.3 328.2 294.2 Shelby 92 0.8 203.0 198.2
Clinton 21 0.2 226.2 206.3 Letcher 69 0.6 343.0 303.0 Simpson 82 0.7 452.0 453.5
Crittenden 21 0.2 244.3 228.6 Lew is 28 0.2 226.1 208.3 Spencer 38 0.3 215.1 207.9
Cumberland 19 0.2 260.8 282.0 Lincoln 83 0.7 345.7 340.6 Taylor 99 0.8 380.1 389.8
Daviess 421 3.6 438.8 422.4 Livingston 31 0.3 406.4 334.4 Todd 29 0.2 226.0 235.9
Edmonson 22 0.2 186.6 181.6 Logan 85 0.7 339.2 319.6 Trigg 57 0.5 432.7 399.6
Elliott 16 0.1 196.2 210.9 Lyon 20 0.2 257.5 247.9 Trimble 17 0.1 201.5 197.2
Estill 47 0.4 360.7 328.5 Madison 217 1.9 242.8 242.3 Union 29 0.2 197.6 194.9
Fayette 839 7.2 265.7 263.5 Magoffin 44 0.4 371.0 346.9 Warren 289 2.5 222.9 230.2
Fleming 71 0.6 511.4 489.4 Marion 57 0.5 319.2 296.8 Washington 26 0.2 212.0 213.3
Floyd 81 0.7 232.9 218.3 Marshall 98 0.8 327.9 312.5 Wayne 83 0.7 453.1 405.8
Franklin 211 1.8 443.9 417.3 Martin 33 0.3 280.9 275.0 Webster 42 0.4 324.7 315.4
Fulton * - - - Mason 40 0.3 224.8 232.7 Whitley 185 1.6 508.2 512.5
Gallatin 13 0.1 160.9 151.0 McCracken 271 2.3 441.2 415.9 Wolfe 32 0.3 437.2 447.0
Garrard 50 0.4 309.2 289.2 McCreary 24 0.2 140.8 137.1 Woodford 75 0.6 316.1 287.1
* At least one but few er than five
- Percentage or rate suppressed to prevent disclosure of the value on w hich it w as based

59
Table 13: Incidence of All Inpatient TBI* by County, Sorted by Frequency, Kentucky, 2016 *Includes inpatient deaths as well as non-fatal inpatient cases
County Freq Percent
Age-
Adjusted
Rate
Crude
Rate County Freq Percent
Age-
Adjusted
Rate
Crude
Rate County Freq Percent
Age-
Adjusted
Rate
Crude
Rate
Jefferson 889 23.2 106.8 116.2 Bourbon 22 0.6 97.3 109.8 McCreary 11 0.3 55.5 62.8
Fayette 239 6.2 76.2 75.1 Magoffin 22 0.6 168.2 173.4 Row an 11 0.3 47.8 45.0
Daviess 115 3.0 102.4 115.4 Mercer 22 0.6 97.9 102.4 Trimble 11 0.3 131.2 127.6
Hardin 107 2.8 100.1 99.7 Boyd 21 0.5 36.5 43.6 Ballard 10 0.3 103.0 124.2
Kenton 97 2.5 54.0 58.8 Clay 21 0.5 98.5 101.1 Jackson 10 0.3 65.1 74.8
Pike 90 2.3 140.7 148.6 Hopkins 21 0.5 46.6 45.7 Menifee 10 0.3 166.8 156.1
McCracken 88 2.3 109.6 135.0 Lincoln 21 0.5 82.6 86.2 Allen 9 0.2 37.3 43.6
Bullitt 73 1.9 92.6 92.2 Adair 20 0.5 95.5 103.7 Crittenden 9 0.2 77.4 98.0
Madison 71 1.8 85.7 79.3 Grant 20 0.5 80.9 80.2 Rockcastle 9 0.2 48.3 53.4
Warren 66 1.7 54.5 52.6 Ohio 20 0.5 66.7 82.0 Edmonson 8 0.2 52.6 66.0
Perry 61 1.6 214.8 223.1 Anderson 19 0.5 76.6 85.7 Green 8 0.2 68.6 72.3
Laurel 60 1.6 92.1 99.6 Barren 19 0.5 37.3 43.2 Monroe 8 0.2 68.8 75.6
Pulaski 59 1.5 84.4 92.3 Estill 19 0.5 143.3 132.8 Washington 8 0.2 68.5 65.6
Campbell 57 1.5 54.3 61.8 Livingston 19 0.5 159.0 205.0 Christian 7 0.2 10.6 9.7
Boone 55 1.4 46.3 42.8 Spencer 19 0.5 115.0 104.0 Clinton 7 0.2 68.0 68.8
Oldham 48 1.3 83.9 73.2 Wayne 19 0.5 87.1 92.9 Gallatin 7 0.2 94.3 81.3
Jessamine 46 1.2 81.4 87.9 Breckinridge 18 0.5 83.7 90.2 Metcalfe 7 0.2 68.6 69.9
Whitley 45 1.2 121.2 124.7 Leslie 18 0.5 151.2 170.8 Morgan 7 0.2 52.3 52.6
Floyd 44 1.1 103.0 118.6 Meade 18 0.5 62.0 64.0 Bracken 6 0.2 79.1 71.4
Marshall 44 1.1 104.9 140.3 Hart 17 0.4 91.7 91.3 Carlisle 6 0.2 100.7 123.6
Nelson 42 1.1 91.7 92.2 Martin 17 0.4 133.3 141.6 Cumberland 6 0.2 80.7 89.0
Franklin 41 1.1 77.5 81.1 Bell 16 0.4 54.9 59.0 Lyon 6 0.2 63.2 74.4
Letcher 36 0.9 159.5 158.1 Garrard 16 0.4 84.6 92.5 Trigg 6 0.2 26.7 42.1
Scott 33 0.9 66.0 61.1 Breathitt 15 0.4 120.0 112.9 Lew is 5 0.1 32.1 37.2
Shelby 33 0.9 71.3 71.1 Montgomery 15 0.4 52.5 54.0 Ow en 5 0.1 40.7 47.0
Boyle 32 0.8 101.4 106.6 Greenup 14 0.4 27.3 39.0 Simpson 5 0.1 23.8 27.7
Clark 31 0.8 76.7 86.5 Harrison 14 0.4 76.5 75.1 Wolfe 5 0.1 75.6 69.8
Johnson 29 0.8 109.9 126.2 Knott 14 0.4 99.1 90.1 Elliott * - - -
Taylor 29 0.8 99.3 114.2 Marion 14 0.4 70.1 72.9 Law rence * - - -
Graves 28 0.7 60.3 75.3 McLean 14 0.4 127.5 147.8 Nicholas * - - -
Muhlenberg 27 0.7 71.9 87.0 Pow ell 14 0.4 120.1 113.7 Union * - - -
Grayson 26 0.7 87.7 99.3 Henderson 13 0.3 25.6 28.1 Butler * - - -
Harlan 25 0.7 86.6 92.0 Mason 13 0.3 61.0 75.6 Caldw ell * - - -
Henry 25 0.7 145.5 158.0 Pendleton 13 0.3 91.8 89.3 Lee * - - -
Woodford 25 0.7 82.1 95.7 Carter 12 0.3 44.4 44.4 Ow sley * - - -
Callow ay 24 0.6 57.6 62.4 Larue 12 0.3 76.6 85.1 Hickman * - - -
Casey 24 0.6 146.4 151.8 Bath 11 0.3 71.9 89.2 Robertson * - - -
Russell 24 0.6 134.1 135.4 Carroll 11 0.3 102.9 103.0 Webster * - - -
Fleming 23 0.6 146.8 158.5 Hancock 11 0.3 129.5 124.9 Fulton 0 0.0 0.0 0.0
Knox 23 0.6 64.7 72.6 Logan 11 0.3 32.0 41.4 Todd 0 0.0 0.0 0.0
* At least one but few er than five
- Percentage or rate suppressed to prevent disclosure of the value on w hich it w as based

60
Table 14: Incidence of All ED TBI* by County, Sorted by Frequency, Kentucky, 2016 *Includes ED deaths as well as non-fatal ED cases
County Freq Percent
Age-
Adjusted
Rate
Crude
Rate County Freq Percent
Age-
Adjusted
Rate
Crude
Rate County Freq Percent
Age-
Adjusted
Rate
Crude
Rate
Jefferson 1526 13.0 202.2 199.4 Lincoln 83 0.7 345.7 340.6 Morgan 37 0.3 289.4 278.2
Fayette 839 7.2 265.7 263.5 Wayne 83 0.7 453.1 405.8 Jackson 36 0.3 292.5 269.3
Hardin 526 4.5 497.1 490.1 Boyle 82 0.7 264.3 273.2 Butler 35 0.3 288.8 272.5
Daviess 421 3.6 438.8 422.4 Simpson 82 0.7 452.0 453.5 Harlan 33 0.3 127.5 121.5
Warren 289 2.5 222.9 230.2 Floyd 81 0.7 232.9 218.3 Martin 33 0.3 280.9 275.0
McCracken 271 2.3 441.2 415.9 Hart 80 0.7 435.9 429.5 Caldw ell 32 0.3 278.5 254.6
Madison 217 1.9 242.8 242.3 Row an 80 0.7 328.1 327.2 Menifee 32 0.3 535.7 499.4
Franklin 211 1.8 443.9 417.3 Montgomery 78 0.7 289.9 280.9 Monroe 32 0.3 328.4 302.2
Kenton 197 1.7 124.1 119.4 Larue 77 0.7 550.3 546.3 Wolfe 32 0.3 437.2 447.0
Christian 185 1.6 259.4 255.7 Greenup 76 0.6 219.0 211.7 Breathitt 31 0.3 245.1 233.4
Laurel 185 1.6 308.2 307.1 Woodford 75 0.6 316.1 287.1 Leslie 31 0.3 328.2 294.2
Whitley 185 1.6 508.2 512.5 Johnson 73 0.6 335.6 317.7 Livingston 31 0.3 406.4 334.4
Callow ay 179 1.5 486.5 465.7 Fleming 71 0.6 511.4 489.4 Nicholas 30 0.3 453.5 423.5
Boyd 166 1.4 360.3 344.9 Mercer 71 0.6 358.5 330.6 Pow ell 30 0.3 259.4 243.7
Barren 162 1.4 379.7 368.2 Carter 70 0.6 270.1 258.8 Todd 29 0.2 226.0 235.9
Nelson 160 1.4 369.7 351.2 Anderson 69 0.6 324.8 311.4 Union 29 0.2 197.6 194.9
Boone 156 1.3 125.1 121.4 Letcher 69 0.6 343.0 303.0 Lew is 28 0.2 226.1 208.3
Hopkins 149 1.3 336.9 324.6 Grant 66 0.6 271.3 264.8 Metcalfe 27 0.2 281.3 269.5
Scott 146 1.2 277.5 270.5 Allen 64 0.5 341.0 310.2 Washington 26 0.2 212.0 213.3
Pike 141 1.2 247.9 232.8 Casey 63 0.5 406.3 398.4 Hancock 25 0.2 313.1 283.8
Clay 138 1.2 682.3 664.5 Adair 58 0.5 311.7 300.8 McCreary 24 0.2 140.8 137.1
Pulaski 131 1.1 228.4 204.8 Marion 57 0.5 319.2 296.8 Ow sley 24 0.2 583.4 534.4
Ohio 122 1.0 525.4 500.5 Trigg 57 0.5 432.7 399.6 Carroll 23 0.2 227.3 215.4
Clark 112 1.0 326.3 312.7 Russell 55 0.5 316.4 310.3 Bracken 22 0.2 288.8 261.9
Oldham 108 0.9 169.1 164.7 Meade 54 0.5 199.1 192.0 Edmonson 22 0.2 186.6 181.6
Muhlenberg 106 0.9 343.3 341.6 Bourbon 53 0.5 279.3 264.6 Ow en 22 0.2 241.1 206.7
Campbell 105 0.9 117.7 113.9 Breckinridge 50 0.4 272.0 250.5 Pendleton 22 0.2 161.4 151.1
Graves 102 0.9 277.2 274.3 Garrard 50 0.4 309.2 289.2 Clinton 21 0.2 226.2 206.3
Bell 101 0.9 369.9 372.5 Henry 48 0.4 322.8 303.5 Crittenden 21 0.2 244.3 228.6
Taylor 99 0.8 380.1 389.8 Estill 47 0.4 360.7 328.5 Lee 20 0.2 274.5 304.0
Marshall 98 0.8 327.9 312.5 Rockcastle 47 0.4 285.8 278.9 Lyon 20 0.2 257.5 247.9
Harrison 96 0.8 545.6 514.9 Magoffin 44 0.4 371.0 346.9 Cumberland 19 0.2 260.8 282.0
Henderson 92 0.8 207.1 198.9 Green 43 0.4 425.4 388.8 Trimble 17 0.1 201.5 197.2
Knox 92 0.8 310.6 290.3 Webster 42 0.4 324.7 315.4 Elliott 16 0.1 196.2 210.9
Perry 92 0.8 357.4 336.5 Bath 41 0.3 318.3 332.6 Ballard 14 0.1 191.8 173.8
Shelby 92 0.8 203.0 198.2 Mason 40 0.3 224.8 232.7 Gallatin 13 0.1 160.9 151.0
Grayson 91 0.8 366.1 347.5 Law rence 39 0.3 264.4 245.9 Carlisle 12 0.1 278.2 247.2
Jessamine 85 0.7 164.9 162.3 Knott 38 0.3 243.1 244.5 Fulton * - - -
Logan 85 0.7 339.2 319.6 Spencer 38 0.3 215.1 207.9 Hickman * - - -
Bullitt 83 0.7 110.6 104.9 McLean 37 0.3 409.8 390.5 Robertson * - - -
* At least one but few er than five
- Percentage or rate suppressed to prevent disclosure of the value on w hich it w as based

61
Table 15: Incidence of All Inpatient TBI* by County, Sorted by Age Adjusted Rate, Kentucky, 2016 *Includes inpatient deaths as well as non-fatal inpatient cases
County Freq Percent
Age-
Adjusted
Rate
Crude
Rate County Freq Percent
Age-
Adjusted
Rate
Crude
Rate County Freq Percent
Age-
Adjusted
Rate
Crude
Rate
Perry 61 1.6 214.8 223.1 Pendleton 13 0.3 91.8 89.3 Mason 13 0.3 61.0 75.6
Magoffin 22 0.6 168.2 173.4 Nelson 42 1.1 91.7 92.2 Graves 28 0.7 60.3 75.3
Menifee 10 0.3 166.8 156.1 Hart 17 0.4 91.7 91.3 Ow sley 3 0.1 58.3 66.8
Letcher 36 0.9 159.5 158.1 Grayson 26 0.7 87.7 99.3 Callow ay 24 0.6 57.6 62.4
Livingston 19 0.5 159.0 205.0 Wayne 19 0.5 87.1 92.9 Robertson 2 0.1 56.6 92.8
Leslie 18 0.5 151.2 170.8 Harlan 25 0.7 86.6 92.0 McCreary 11 0.3 55.5 62.8
Fleming 23 0.6 146.8 158.5 Madison 71 1.8 85.7 79.3 Bell 16 0.4 54.9 59.0
Casey 24 0.6 146.4 151.8 Garrard 16 0.4 84.6 92.5 Warren 66 1.7 54.5 52.6
Henry 25 0.7 145.5 158.0 Pulaski 59 1.5 84.4 92.3 Elliott * - - -
Estill 19 0.5 143.3 132.8 Oldham 48 1.3 83.9 73.2 Campbell 57 1.5 54.3 61.8
Pike 90 2.3 140.7 148.6 Breckinridge 18 0.5 83.7 90.2 Kenton 97 2.5 54.0 58.8
Russell 24 0.6 134.1 135.4 Lincoln 21 0.5 82.6 86.2 Edmonson 8 0.2 52.6 66.0
Martin 17 0.4 133.3 141.6 Woodford 25 0.7 82.1 95.7 Montgomery 15 0.4 52.5 54.0
Trimble 11 0.3 131.2 127.6 Jessamine 46 1.2 81.4 87.9 Morgan 7 0.2 52.3 52.6
Hancock 11 0.3 129.5 124.9 Grant 20 0.5 80.9 80.2 Nicholas * - - -
McLean 14 0.4 127.5 147.8 Cumberland 6 0.2 80.7 89.0 Rockcastle 9 0.2 48.3 53.4
Whitley 45 1.2 121.2 124.7 Bracken 6 0.2 79.1 71.4 Row an 11 0.3 47.8 45.0
Pow ell 14 0.4 120.1 113.7 Franklin 41 1.1 77.5 81.1 Hopkins 21 0.5 46.6 45.7
Breathitt 15 0.4 120.0 112.9 Crittenden 9 0.2 77.4 98.0 Boone 55 1.4 46.3 42.8
Spencer 19 0.5 115.0 104.0 Clark 31 0.8 76.7 86.5 Lee * - - -
Johnson 29 0.8 109.9 126.2 Larue 12 0.3 76.6 85.1 Carter 12 0.3 44.4 44.4
McCracken 88 2.3 109.6 135.0 Anderson 19 0.5 76.6 85.7 Ow en 5 0.1 40.7 47.0
Jefferson 889 23.2 106.8 116.2 Harrison 14 0.4 76.5 75.1 Allen 9 0.2 37.3 43.6
Marshall 44 1.1 104.9 140.3 Fayette 239 6.2 76.2 75.1 Barren 19 0.5 37.3 43.2
Floyd 44 1.1 103.0 118.6 Wolfe 5 0.1 75.6 69.8 Boyd 21 0.5 36.5 43.6
Ballard 10 0.3 103.0 124.2 Muhlenberg 27 0.7 71.9 87.0 Lew is 5 0.1 32.1 37.2
Carroll 11 0.3 102.9 103.0 Bath 11 0.3 71.9 89.2 Logan 11 0.3 32.0 41.4
Daviess 115 3.0 102.4 115.4 Shelby 33 0.9 71.3 71.1 Union * - - -
Boyle 32 0.8 101.4 106.6 Marion 14 0.4 70.1 72.9 Greenup 14 0.4 27.3 39.0
Carlisle 6 0.2 100.7 123.6 Monroe 8 0.2 68.8 75.6 Trigg 6 0.2 26.7 42.1
Hardin 107 2.8 100.1 99.7 Metcalfe 7 0.2 68.6 69.9 Henderson 13 0.3 25.6 28.1
Taylor 29 0.8 99.3 114.2 Green 8 0.2 68.6 72.3 Simpson 5 0.1 23.8 27.7
Knott 14 0.4 99.1 90.1 Washington 8 0.2 68.5 65.6 Caldw ell * - - -
Clay 21 0.5 98.5 101.1 Clinton 7 0.2 68.0 68.8 Hickman * - - -
Mercer 22 0.6 97.9 102.4 Ohio 20 0.5 66.7 82.0 Law rence * - - -
Bourbon 22 0.6 97.3 109.8 Scott 33 0.9 66.0 61.1 Butler * - - -
Adair 20 0.5 95.5 103.7 Jackson 10 0.3 65.1 74.8 Webster * - - -
Gallatin 7 0.2 94.3 81.3 Knox 23 0.6 64.7 72.6 Christian 7 0.2 10.6 9.7
Bullitt 73 1.9 92.6 92.2 Lyon 6 0.2 63.2 74.4 Fulton 0 0.0 0.0 0.0
Laurel 60 1.6 92.1 99.6 Meade 18 0.5 62.0 64.0 Todd 0 0.0 0.0 0.0
* At least one but few er than five
- Percentage or rate suppressed to prevent disclosure of the value on w hich it w as based

62
Table 16: Incidence of All ED TBI* by County, Sorted by Age Adjusted Rate, Kentucky, 2016 *Includes ED deaths as well as non-fatal ED cases
County Freq Percent
Age-
Adjusted
Rate
Crude
Rate County Freq Percent
Age-
Adjusted
Rate
Crude
Rate County Freq Percent
Age-
Adjusted
Rate
Crude
Rate
Clay 138 1.2 682.3 664.5 Monroe 32 0.3 328.4 302.2 Lyon 20 0.2 257.5 247.9
Ow sley 24 0.2 583.4 534.4 Leslie 31 0.3 328.2 294.2 Pike 141 1.2 247.9 232.8
Larue 77 0.7 550.3 546.3 Row an 80 0.7 328.1 327.2 Breathitt 31 0.3 245.1 233.4
Harrison 96 0.8 545.6 514.9 Marshall 98 0.8 327.9 312.5 Crittenden 21 0.2 244.3 228.6
Menifee 32 0.3 535.7 499.4 Clark 112 1.0 326.3 312.7 Knott 38 0.3 243.1 244.5
Ohio 122 1.0 525.4 500.5 Anderson 69 0.6 324.8 311.4 Madison 217 1.9 242.8 242.3
Fleming 71 0.6 511.4 489.4 Webster 42 0.4 324.7 315.4 Ow en 22 0.2 241.1 206.7
Whitley 185 1.6 508.2 512.5 Henry 48 0.4 322.8 303.5 Floyd 81 0.7 232.9 218.3
Hardin 526 4.5 497.1 490.1 Marion 57 0.5 319.2 296.8 Pulaski 131 1.1 228.4 204.8
Callow ay 179 1.5 486.5 465.7 Bath 41 0.3 318.3 332.6 Carroll 23 0.2 227.3 215.4
Nicholas 30 0.3 453.5 423.5 Russell 55 0.5 316.4 310.3 Clinton 21 0.2 226.2 206.3
Wayne 83 0.7 453.1 405.8 Woodford 75 0.6 316.1 287.1 Lew is 28 0.2 226.1 208.3
Simpson 82 0.7 452.0 453.5 Hancock 25 0.2 313.1 283.8 Todd 29 0.2 226.0 235.9
Franklin 211 1.8 443.9 417.3 Adair 58 0.5 311.7 300.8 Mason 40 0.3 224.8 232.7
McCracken 271 2.3 441.2 415.9 Knox 92 0.8 310.6 290.3 Warren 289 2.5 222.9 230.2
Daviess 421 3.6 438.8 422.4 Garrard 50 0.4 309.2 289.2 Greenup 76 0.6 219.0 211.7
Wolfe 32 0.3 437.2 447.0 Laurel 185 1.6 308.2 307.1 Spencer 38 0.3 215.1 207.9
Hart 80 0.7 435.9 429.5 Jackson 36 0.3 292.5 269.3 Washington 26 0.2 212.0 213.3
Trigg 57 0.5 432.7 399.6 Montgomery 78 0.7 289.9 280.9 Henderson 92 0.8 207.1 198.9
Green 43 0.4 425.4 388.8 Morgan 37 0.3 289.4 278.2 Shelby 92 0.8 203.0 198.2
McLean 37 0.3 409.8 390.5 Bracken 22 0.2 288.8 261.9 Jefferson 1526 13.0 202.2 199.4
Livingston 31 0.3 406.4 334.4 Butler 35 0.3 288.8 272.5 Trimble 17 0.1 201.5 197.2
Casey 63 0.5 406.3 398.4 Rockcastle 47 0.4 285.8 278.9 Meade 54 0.5 199.1 192.0
Taylor 99 0.8 380.1 389.8 Metcalfe 27 0.2 281.3 269.5 Union 29 0.2 197.6 194.9
Barren 162 1.4 379.7 368.2 Martin 33 0.3 280.9 275.0 Elliott 16 0.1 196.2 210.9
Magoffin 44 0.4 371.0 346.9 Bourbon 53 0.5 279.3 264.6 Ballard 14 0.1 191.8 173.8
Bell 101 0.9 369.9 372.5 Caldw ell 32 0.3 278.5 254.6 Edmonson 22 0.2 186.6 181.6
Nelson 160 1.4 369.7 351.2 Carlisle 12 0.1 278.2 247.2 Oldham 108 0.9 169.1 164.7
Grayson 91 0.8 366.1 347.5 Scott 146 1.2 277.5 270.5 Jessamine 85 0.7 164.9 162.3
Estill 47 0.4 360.7 328.5 Graves 102 0.9 277.2 274.3 Pendleton 22 0.2 161.4 151.1
Boyd 166 1.4 360.3 344.9 Lee 20 0.2 274.5 304.0 Gallatin 13 0.1 160.9 151.0
Mercer 71 0.6 358.5 330.6 Breckinridge 50 0.4 272.0 250.5 McCreary 24 0.2 140.8 137.1
Perry 92 0.8 357.4 336.5 Grant 66 0.6 271.3 264.8 Harlan 33 0.3 127.5 121.5
Lincoln 83 0.7 345.7 340.6 Carter 70 0.6 270.1 258.8 Boone 156 1.3 125.1 121.4
Muhlenberg 106 0.9 343.3 341.6 Fayette 839 7.2 265.7 263.5 Kenton 197 1.7 124.1 119.4
Letcher 69 0.6 343.0 303.0 Law rence 39 0.3 264.4 245.9 Campbell 105 0.9 117.7 113.9
Allen 64 0.5 341.0 310.2 Boyle 82 0.7 264.3 273.2 Bullitt 83 0.7 110.6 104.9
Logan 85 0.7 339.2 319.6 Cumberland 19 0.2 260.8 282.0 Robertson * - - -
Hopkins 149 1.3 336.9 324.6 Christian 185 1.6 259.4 255.7 Fulton * - - -
Johnson 73 0.6 335.6 317.7 Pow ell 30 0.3 259.4 243.7 Hickman * - - -
* At least one but few er than five
- Percentage or rate suppressed to prevent disclosure of the value on w hich it w as based

63
Table 17: Length of Stay for Non-Fatal Inpatient TBI, Kentucky, 2016
Table 18: Work Related Non-Fatal TBI, Kentucky 2016
Table 19: Primary Payer and Charges for Non-Fatal Inpatient TBI, Kentucky, 2016
Length of Stay Number Percent*
1 day 567 16.1
More than one day but less than 1 week 1788 50.8
1 week to less than 2 weeks 688 19.5
2 weeks to less than 3 weeks 243 6.9
3 weeks to less than 4 weeks 118 3.4
4 weeks or more 118 3.4
Total 3522 100.0
*Percent of hospitalized TBI
Inpatient Work TBI (n=63) LOS Days Cost
Mean 6.1 $89,557
Median 4 $46,114
Min, Max 1, 32 $296, $401,106
Sum of Charges $5,263,390
ED Work TBI (n=405) Cost
Mean $4,856
Median $3,178
Min, Max $2, $46,426
Sum of Charges $1,966,820
Payer
Number of
Discharges
Percent of
Discharges
Total Hospital
Charges
Government 2,551 72.4 194,766,640$
Commercial Ins 625 17.7 55,892,907$
Self Pay 55 1.6 2,869,733$
Workers Compensation 63 1.8 5,263,390$
Other 228 6.5 23,958,218$
Total 3,522 100.0 282,750,887$
64
Table 20: Primary Payer and Charges for Non-Fatal ED TBI, Kentucky, 2016
Table 21: Non-Fatal ABI by Age Group, Kentucky, 2016
Table 22: Non-Fatal ABI by Gender, Kentucky, 2016
Payer
Number of
Discharges
Percent of
Discharges
Total Hospital
Charges
Government 6,184 53.0 33,277,490$
Commercial Ins 3,297 28.2 14,706,936$
Self Pay 713 6.1 3,405,239$
Workers Compensation 405 3.5 1,966,820$
Other 1,074 9.2 7,331,022$
Total 11,673 100.0 60,687,508$
Age Number Percent Rate Number Percent Rate Number Percent Rate
0-4 134 20.8 48.6 510 79.2 184.9 644 100.0 233.5
5-14 85 20.3 15.1 334 79.7 59.5 419 100.0 74.7
15-24 361 25.7 60.8 1,046 74.3 176.2 1,407 100.0 237.0
25-44 1,470 40.4 130.3 2,172 59.6 192.5 3,642 100.0 322.8
45-64 2,483 60.6 209.1 1,616 39.4 136.1 4,099 100.0 345.2
65+ 2,731 75.1 395.4 904 24.9 130.9 3,635 100.0 526.3
Total 7,264 52.5 163.7 6,582 47.5 148.3 13,846 100.0 312.1
Inpatient ED Total
Age Number Percent Rate Number Percent Rate Number Percent Rate
Male 3,337 53.7 152.6 2,874 46.3 131.4 6,211 100.0 284.1
Female 3,927 51.4 174.5 3,708 48.6 164.8 7,635 100.0 339.3
Total 7,264 52.5 163.7 6,582 47.5 148.3 13,846 100.0 312.1
TotalInpatient ED

65
Table 23: Incidence of All Inpatient ABI* by County, Sorted by County, Kentucky, 2016 *Includes inpatient deaths as well as non-fatal inpatient cases
County Freq Percent
Age-
Adjusted
Rate
Crude
Rate County Freq Percent
Age-
Adjusted
Rate
Crude
Rate County Freq Percent
Age-
Adjusted
Rate
Crude
Rate
Adair 30 0.4 147.3 155.6 Grant 52 0.6 206.6 208.6 McLean 18 0.2 173.8 190.0
Allen 31 0.4 139.4 150.3 Graves 72 0.8 164.8 193.6 Meade 25 0.3 85.5 88.9
Anderson 38 0.4 158.3 171.5 Grayson 56 0.7 195.6 213.9 Menifee 15 0.2 176.8 234.1
Ballard 21 0.2 206.9 260.7 Green 25 0.3 158.0 226.0 Mercer 33 0.4 119.5 153.7
Barren 84 1.0 163.8 190.9 Greenup 46 0.5 102.1 128.2 Metcalfe 23 0.3 199.8 229.6
Bath 26 0.3 195.7 210.9 Hancock 17 0.2 163.2 193.0 Monroe 21 0.2 153.6 198.3
Bell 88 1.0 297.9 324.5 Hardin 217 2.6 195.5 202.2 Montgomery 42 0.5 134.5 151.2
Boone 162 1.9 129.4 126.0 Harlan 83 1.0 275.2 305.5 Morgan 32 0.4 209.4 240.6
Bourbon 39 0.5 169.3 194.7 Harrison 18 0.2 81.8 96.5 Muhlenberg 71 0.8 183.2 228.8
Boyd 114 1.3 204.1 236.8 Hart 27 0.3 131.5 145.0 Nelson 70 0.8 150.1 153.6
Boyle 44 0.5 134.9 146.6 Henderson 43 0.5 76.1 93.0 Nicholas 8 0.1 109.0 112.9
Bracken 10 0.1 98.7 119.0 Henry 32 0.4 165.5 202.3 Ohio 45 0.5 171.3 184.6
Breathitt 36 0.4 218.5 271.0 Hickman 11 0.1 178.2 237.7 Oldham 83 1.0 131.8 126.6
Breckinridge 28 0.3 124.6 140.3 Hopkins 87 1.0 163.7 189.5 Ow en 11 0.1 77.8 103.4
Bullitt 118 1.4 143.6 149.1 Jackson 30 0.4 205.3 224.4 Ow sley 19 0.2 360.9 423.1
Butler 27 0.3 191.2 210.2 Jefferson 1738 20.5 206.3 227.1 Pendleton 16 0.2 95.7 109.9
Caldw ell 25 0.3 168.5 198.9 Jessamine 107 1.3 194.7 204.4 Perry 105 1.2 363.1 384.0
Callow ay 46 0.5 122.5 119.7 Johnson 67 0.8 262.4 291.6 Pike 151 1.8 230.7 249.4
Campbell 135 1.6 133.7 146.4 Kenton 278 3.3 162.8 168.5 Pow ell 37 0.4 276.9 300.6
Carlisle 10 0.1 170.1 206.0 Knott 35 0.4 223.5 225.2 Pulaski 119 1.4 167.9 186.1
Carroll 18 0.2 157.1 168.6 Knox 57 0.7 170.3 179.9 Robertson * - - -
Carter 54 0.6 172.9 199.7 Larue 23 0.3 129.5 163.2 Rockcastle 38 0.4 201.5 225.5
Casey 27 0.3 141.0 170.7 Laurel 168 2.0 244.8 278.8 Row an 73 0.9 316.4 298.6
Christian 82 1.0 126.4 113.3 Law rence 42 0.5 249.8 264.8 Russell 21 0.2 99.0 118.5
Clark 67 0.8 161.5 187.1 Lee 9 0.1 130.3 136.8 Scott 67 0.8 130.5 124.1
Clay 73 0.9 327.4 351.5 Leslie 26 0.3 197.2 246.7 Shelby 74 0.9 154.2 159.5
Clinton 8 0.1 62.2 78.6 Letcher 84 1.0 329.8 368.9 Simpson 28 0.3 143.6 154.8
Crittenden 8 0.1 65.0 87.1 Lew is 8 0.1 40.8 59.5 Spencer 30 0.4 154.1 164.2
Cumberland 16 0.2 222.1 237.5 Lincoln 45 0.5 162.7 184.6 Taylor 54 0.6 173.3 212.6
Daviess 226 2.7 212.0 226.7 Livingston 24 0.3 249.3 258.9 Todd 11 0.1 81.9 89.5
Edmonson 16 0.2 86.4 132.1 Logan 28 0.3 94.5 105.3 Trigg 12 0.1 66.6 84.1
Elliott 12 0.1 135.4 158.1 Lyon 14 0.2 122.7 173.5 Trimble 9 0.1 94.2 104.4
Estill 36 0.4 215.0 251.6 Madison 129 1.5 146.2 144.1 Union 17 0.2 108.4 114.2
Fayette 501 5.9 156.6 157.3 Magoffin 62 0.7 433.7 488.8 Warren 186 2.2 150.7 148.2
Fleming 40 0.5 242.2 275.7 Marion 33 0.4 158.0 171.8 Washington 22 0.3 165.4 180.5
Floyd 110 1.3 270.0 296.4 Marshall 76 0.9 200.5 242.3 Wayne 29 0.3 134.0 141.8
Franklin 91 1.1 152.9 180.0 Martin 32 0.4 228.5 266.6 Webster 24 0.3 170.1 180.2
Fulton 9 0.1 105.9 145.7 Mason 15 0.2 76.5 87.3 Whitley 100 1.2 262.3 277.0
Gallatin 16 0.2 187.0 185.9 McCracken 183 2.2 245.5 280.8 Wolfe 23 0.3 277.1 321.3
Garrard 22 0.3 115.9 127.2 McCreary 37 0.4 197.2 211.3 Woodford 29 0.3 106.5 111.0
* At least one but few er than five
- Percentage or rate suppressed to prevent disclosure of the value on w hich it w as based

66
Table 24: Incidence of All ED ABI* by County, Sorted by County, Kentucky, 2016 *Includes ED deaths as well as non-fatal ED cases
County Freq Percent
Age-
Adjusted
Rate
Crude
Rate County Freq Percent
Age-
Adjusted
Rate
Crude
Rate County Freq Percent
Age-
Adjusted
Rate
Crude
Rate
Adair 40 0.6 206.8 207.5 Grant 44 0.7 180.8 176.5 McLean 18 0.3 216.4 190.0
Allen 22 0.3 102.7 106.6 Graves 63 1.0 175.9 169.4 Meade 20 0.3 70.4 71.1
Anderson 25 0.4 119.3 112.8 Grayson 57 0.9 227.1 217.7 Menifee 18 0.3 266.7 280.9
Ballard 12 0.2 165.5 149.0 Green 24 0.4 198.5 217.0 Mercer 46 0.7 210.6 214.2
Barren 68 1.0 160.3 154.6 Greenup 35 0.5 110.5 97.5 Metcalfe 13 0.2 142.3 129.8
Bath 17 0.3 141.6 137.9 Hancock 5 0.1 59.1 56.8 Monroe 19 0.3 192.6 179.4
Bell 75 1.1 306.0 276.6 Hardin 154 2.3 143.4 143.5 Montgomery 35 0.5 131.2 126.0
Boone 102 1.5 78.7 79.4 Harlan 51 0.8 195.4 187.7 Morgan 33 0.5 236.1 248.2
Bourbon 27 0.4 148.6 134.8 Harrison 41 0.6 222.4 219.9 Muhlenberg 73 1.1 234.0 235.3
Boyd 83 1.3 176.2 172.4 Hart 31 0.5 178.2 166.4 Nelson 81 1.2 189.8 177.8
Boyle 38 0.6 134.8 126.6 Henderson 68 1.0 153.2 147.0 Nicholas 8 0.1 121.0 112.9
Bracken 12 0.2 159.7 142.9 Henry 24 0.4 158.6 151.7 Ohio 61 0.9 260.5 250.2
Breathitt 19 0.3 148.3 143.0 Hickman 3 0.0 43.0 64.8 Oldham 55 0.8 89.4 83.9
Breckinridge 23 0.3 127.0 115.2 Hopkins 58 0.9 128.9 126.4 Ow en 21 0.3 228.5 197.3
Bullitt 62 0.9 81.4 78.3 Jackson 21 0.3 163.8 157.1 Ow sley 9 0.1 225.9 200.4
Butler 15 0.2 130.6 116.8 Jefferson 1178 17.8 157.6 153.9 Pendleton 16 0.2 111.9 109.9
Caldw ell 22 0.3 187.1 175.0 Jessamine 40 0.6 79.5 76.4 Perry 48 0.7 175.7 175.5
Callow ay 73 1.1 192.8 189.9 Johnson 37 0.6 151.7 161.0 Pike 79 1.2 136.5 130.5
Campbell 80 1.2 85.8 86.8 Kenton 108 1.6 63.0 65.5 Pow ell 26 0.4 221.6 211.2
Carlisle 4 0.1 89.0 82.4 Knott 24 0.4 183.0 154.4 Pulaski 87 1.3 144.7 136.0
Carroll 22 0.3 209.0 206.0 Knox 83 1.3 270.7 261.9 Robertson 2 0.0 84.0 92.8
Carter 36 0.5 128.6 133.1 Larue 23 0.3 161.4 163.2 Rockcastle 34 0.5 205.0 201.8
Casey 33 0.5 209.5 208.7 Laurel 89 1.3 149.0 147.7 Row an 67 1.0 263.0 274.0
Christian 66 1.0 91.3 91.2 Law rence 31 0.5 207.3 195.4 Russell 32 0.5 182.6 180.6
Clark 78 1.2 226.3 217.8 Lee 10 0.2 162.3 152.0 Scott 82 1.2 154.5 151.9
Clay 53 0.8 251.5 255.2 Leslie 41 0.6 383.0 389.1 Shelby 63 1.0 139.7 135.8
Clinton 20 0.3 155.4 196.5 Letcher 56 0.8 282.7 245.9 Simpson 35 0.5 203.9 193.6
Crittenden 12 0.2 147.9 130.6 Lew is 15 0.2 121.6 111.6 Spencer 21 0.3 125.3 114.9
Cumberland 19 0.3 293.0 282.0 Lincoln 35 0.5 148.9 143.6 Taylor 89 1.3 336.3 350.4
Daviess 169 2.6 172.6 169.6 Livingston 17 0.3 204.9 183.4 Todd 14 0.2 127.2 113.9
Edmonson 12 0.2 104.9 99.1 Logan 59 0.9 214.9 221.9 Trigg 31 0.5 219.8 217.3
Elliott 10 0.2 123.3 131.8 Lyon 16 0.2 256.0 198.3 Trimble 6 0.1 64.9 69.6
Estill 10 0.2 74.3 69.9 Madison 137 2.1 155.8 153.0 Union 27 0.4 190.2 181.5
Fayette 376 5.7 117.4 118.1 Magoffin 23 0.3 179.1 181.3 Warren 165 2.5 137.9 131.4
Fleming 27 0.4 179.7 186.1 Marion 31 0.5 175.0 161.4 Washington 25 0.4 214.5 205.1
Floyd 90 1.4 261.6 242.5 Marshall 35 0.5 115.9 111.6 Wayne 28 0.4 157.4 136.9
Franklin 87 1.3 180.0 172.1 Martin 21 0.3 172.6 175.0 Webster 13 0.2 94.8 97.6
Fulton 4 0.1 69.6 64.7 Mason 24 0.4 160.1 139.6 Whitley 87 1.3 250.5 241.0
Gallatin 16 0.2 181.3 185.9 McCracken 151 2.3 256.7 231.7 Wolfe 22 0.3 296.1 307.3
Garrard 30 0.5 173.7 173.5 McCreary 19 0.3 107.8 108.5 Woodford 41 0.6 167.5 156.9
* At least one but few er than five
- Percentage or rate suppressed to prevent disclosure of the value on w hich it w as based

67
Table 25: Incidence of All Inpatient ABI* by County, Sorted by Frequency, Kentucky, 2016 *Includes inpatient deaths as well as non-fatal inpatient cases
County Freq Percent
Age-
Adjusted
Rate
Crude
Rate County Freq Percent
Age-
Adjusted
Rate
Crude
Rate County Freq Percent
Age-
Adjusted
Rate
Crude
Rate
Jefferson 1738 20.5 206.3 227.1 Carter 54 0.6 172.9 199.7 Green 25 0.3 158.0 226.0
Fayette 501 5.9 156.6 157.3 Taylor 54 0.6 173.3 212.6 Meade 25 0.3 85.5 88.9
Kenton 278 3.3 162.8 168.5 Grant 52 0.6 206.6 208.6 Livingston 24 0.3 249.3 258.9
Daviess 226 2.7 212.0 226.7 Callow ay 46 0.5 122.5 119.7 Webster 24 0.3 170.1 180.2
Hardin 217 2.6 195.5 202.2 Greenup 46 0.5 102.1 128.2 Larue 23 0.3 129.5 163.2
Warren 186 2.2 150.7 148.2 Lincoln 45 0.5 162.7 184.6 Metcalfe 23 0.3 199.8 229.6
McCracken 183 2.2 245.5 280.8 Ohio 45 0.5 171.3 184.6 Wolfe 23 0.3 277.1 321.3
Laurel 168 2.0 244.8 278.8 Boyle 44 0.5 134.9 146.6 Garrard 22 0.3 115.9 127.2
Boone 162 1.9 129.4 126.0 Henderson 43 0.5 76.1 93.0 Washington 22 0.3 165.4 180.5
Pike 151 1.8 230.7 249.4 Law rence 42 0.5 249.8 264.8 Ballard 21 0.2 206.9 260.7
Campbell 135 1.6 133.7 146.4 Montgomery 42 0.5 134.5 151.2 Monroe 21 0.2 153.6 198.3
Madison 129 1.5 146.2 144.1 Fleming 40 0.5 242.2 275.7 Russell 21 0.2 99.0 118.5
Pulaski 119 1.4 167.9 186.1 Bourbon 39 0.5 169.3 194.7 Ow sley 19 0.2 360.9 423.1
Bullitt 118 1.4 143.6 149.1 Anderson 38 0.4 158.3 171.5 Carroll 18 0.2 157.1 168.6
Boyd 114 1.3 204.1 236.8 Rockcastle 38 0.4 201.5 225.5 Harrison 18 0.2 81.8 96.5
Floyd 110 1.3 270.0 296.4 McCreary 37 0.4 197.2 211.3 McLean 18 0.2 173.8 190.0
Jessamine 107 1.3 194.7 204.4 Pow ell 37 0.4 276.9 300.6 Hancock 17 0.2 163.2 193.0
Perry 105 1.2 363.1 384.0 Breathitt 36 0.4 218.5 271.0 Union 17 0.2 108.4 114.2
Whitley 100 1.2 262.3 277.0 Estill 36 0.4 215.0 251.6 Cumberland 16 0.2 222.1 237.5
Franklin 91 1.1 152.9 180.0 Knott 35 0.4 223.5 225.2 Edmonson 16 0.2 86.4 132.1
Bell 88 1.0 297.9 324.5 Marion 33 0.4 158.0 171.8 Gallatin 16 0.2 187.0 185.9
Hopkins 87 1.0 163.7 189.5 Mercer 33 0.4 119.5 153.7 Pendleton 16 0.2 95.7 109.9
Barren 84 1.0 163.8 190.9 Henry 32 0.4 165.5 202.3 Mason 15 0.2 76.5 87.3
Letcher 84 1.0 329.8 368.9 Martin 32 0.4 228.5 266.6 Menifee 15 0.2 176.8 234.1
Harlan 83 1.0 275.2 305.5 Morgan 32 0.4 209.4 240.6 Lyon 14 0.2 122.7 173.5
Oldham 83 1.0 131.8 126.6 Allen 31 0.4 139.4 150.3 Elliott 12 0.1 135.4 158.1
Christian 82 1.0 126.4 113.3 Adair 30 0.4 147.3 155.6 Trigg 12 0.1 66.6 84.1
Marshall 76 0.9 200.5 242.3 Jackson 30 0.4 205.3 224.4 Hickman 11 0.1 178.2 237.7
Shelby 74 0.9 154.2 159.5 Spencer 30 0.4 154.1 164.2 Ow en 11 0.1 77.8 103.4
Clay 73 0.9 327.4 351.5 Wayne 29 0.3 134.0 141.8 Todd 11 0.1 81.9 89.5
Row an 73 0.9 316.4 298.6 Woodford 29 0.3 106.5 111.0 Bracken 10 0.1 98.7 119.0
Graves 72 0.8 164.8 193.6 Breckinridge 28 0.3 124.6 140.3 Carlisle 10 0.1 170.1 206.0
Muhlenberg 71 0.8 183.2 228.8 Logan 28 0.3 94.5 105.3 Fulton 9 0.1 105.9 145.7
Nelson 70 0.8 150.1 153.6 Simpson 28 0.3 143.6 154.8 Lee 9 0.1 130.3 136.8
Clark 67 0.8 161.5 187.1 Butler 27 0.3 191.2 210.2 Trimble 9 0.1 94.2 104.4
Johnson 67 0.8 262.4 291.6 Casey 27 0.3 141.0 170.7 Clinton 8 0.1 62.2 78.6
Scott 67 0.8 130.5 124.1 Hart 27 0.3 131.5 145.0 Crittenden 8 0.1 65.0 87.1
Magoffin 62 0.7 433.7 488.8 Bath 26 0.3 195.7 210.9 Lew is 8 0.1 40.8 59.5
Knox 57 0.7 170.3 179.9 Leslie 26 0.3 197.2 246.7 Nicholas 8 0.1 109.0 112.9
Grayson 56 0.7 195.6 213.9 Caldw ell 25 0.3 168.5 198.9 Robertson * - - -
* At least one but few er than five
- Percentage or rate suppressed to prevent disclosure of the value on w hich it w as based

68
Table 26: Incidence of All ED ABI* by County, Sorted by Frequency, Kentucky, 2016 *Includes ED deaths as well as non-fatal ED cases
County Freq Percent
Age-
Adjusted
Rate
Crude
Rate County Freq Percent
Age-
Adjusted
Rate
Crude
Rate County Freq Percent
Age-
Adjusted
Rate
Crude
Rate
Jefferson 1178 17.8 157.6 153.9 Perry 48 0.7 175.7 175.5 Caldw ell 22 0.3 187.1 175.0
Fayette 376 5.7 117.4 118.1 Mercer 46 0.7 210.6 214.2 Carroll 22 0.3 209.0 206.0
Daviess 169 2.6 172.6 169.6 Grant 44 0.7 180.8 176.5 Wolfe 22 0.3 296.1 307.3
Warren 165 2.5 137.9 131.4 Harrison 41 0.6 222.4 219.9 Jackson 21 0.3 163.8 157.1
Hardin 154 2.3 143.4 143.5 Leslie 41 0.6 383.0 389.1 Martin 21 0.3 172.6 175.0
McCracken 151 2.3 256.7 231.7 Woodford 41 0.6 167.5 156.9 Ow en 21 0.3 228.5 197.3
Madison 137 2.1 155.8 153.0 Adair 40 0.6 206.8 207.5 Spencer 21 0.3 125.3 114.9
Kenton 108 1.6 63.0 65.5 Jessamine 40 0.6 79.5 76.4 Clinton 20 0.3 155.4 196.5
Boone 102 1.5 78.7 79.4 Boyle 38 0.6 134.8 126.6 Meade 20 0.3 70.4 71.1
Floyd 90 1.4 261.6 242.5 Johnson 37 0.6 151.7 161.0 Breathitt 19 0.3 148.3 143.0
Laurel 89 1.3 149.0 147.7 Carter 36 0.5 128.6 133.1 Cumberland 19 0.3 293.0 282.0
Taylor 89 1.3 336.3 350.4 Greenup 35 0.5 110.5 97.5 McCreary 19 0.3 107.8 108.5
Franklin 87 1.3 180.0 172.1 Lincoln 35 0.5 148.9 143.6 Monroe 19 0.3 192.6 179.4
Pulaski 87 1.3 144.7 136.0 Marshall 35 0.5 115.9 111.6 McLean 18 0.3 216.4 190.0
Whitley 87 1.3 250.5 241.0 Montgomery 35 0.5 131.2 126.0 Menifee 18 0.3 266.7 280.9
Boyd 83 1.3 176.2 172.4 Simpson 35 0.5 203.9 193.6 Bath 17 0.3 141.6 137.9
Knox 83 1.3 270.7 261.9 Rockcastle 34 0.5 205.0 201.8 Livingston 17 0.3 204.9 183.4
Scott 82 1.2 154.5 151.9 Casey 33 0.5 209.5 208.7 Gallatin 16 0.2 181.3 185.9
Nelson 81 1.2 189.8 177.8 Morgan 33 0.5 236.1 248.2 Lyon 16 0.2 256.0 198.3
Campbell 80 1.2 85.8 86.8 Russell 32 0.5 182.6 180.6 Pendleton 16 0.2 111.9 109.9
Pike 79 1.2 136.5 130.5 Hart 31 0.5 178.2 166.4 Butler 15 0.2 130.6 116.8
Clark 78 1.2 226.3 217.8 Law rence 31 0.5 207.3 195.4 Lew is 15 0.2 121.6 111.6
Bell 75 1.1 306.0 276.6 Marion 31 0.5 175.0 161.4 Todd 14 0.2 127.2 113.9
Callow ay 73 1.1 192.8 189.9 Trigg 31 0.5 219.8 217.3 Metcalfe 13 0.2 142.3 129.8
Muhlenberg 73 1.1 234.0 235.3 Garrard 30 0.5 173.7 173.5 Webster 13 0.2 94.8 97.6
Barren 68 1.0 160.3 154.6 Wayne 28 0.4 157.4 136.9 Ballard 12 0.2 165.5 149.0
Henderson 68 1.0 153.2 147.0 Bourbon 27 0.4 148.6 134.8 Bracken 12 0.2 159.7 142.9
Row an 67 1.0 263.0 274.0 Fleming 27 0.4 179.7 186.1 Crittenden 12 0.2 147.9 130.6
Christian 66 1.0 91.3 91.2 Union 27 0.4 190.2 181.5 Edmonson 12 0.2 104.9 99.1
Graves 63 1.0 175.9 169.4 Pow ell 26 0.4 221.6 211.2 Elliott 10 0.2 123.3 131.8
Shelby 63 1.0 139.7 135.8 Anderson 25 0.4 119.3 112.8 Estill 10 0.2 74.3 69.9
Bullitt 62 0.9 81.4 78.3 Washington 25 0.4 214.5 205.1 Lee 10 0.2 162.3 152.0
Ohio 61 0.9 260.5 250.2 Green 24 0.4 198.5 217.0 Ow sley 9 0.1 225.9 200.4
Logan 59 0.9 214.9 221.9 Henry 24 0.4 158.6 151.7 Nicholas 8 0.1 121.0 112.9
Hopkins 58 0.9 128.9 126.4 Knott 24 0.4 183.0 154.4 Trimble 6 0.1 64.9 69.6
Grayson 57 0.9 227.1 217.7 Mason 24 0.4 160.1 139.6 Hancock 5 0.1 59.1 56.8
Letcher 56 0.8 282.7 245.9 Breckinridge 23 0.3 127.0 115.2 Carlisle * - - -
Oldham 55 0.8 89.4 83.9 Larue 23 0.3 161.4 163.2 Fulton * - - -
Clay 53 0.8 251.5 255.2 Magoffin 23 0.3 179.1 181.3 Hickman * - - -
Harlan 51 0.8 195.4 187.7 Allen 22 0.3 102.7 106.6 Robertson * - - -
* At least one but few er than five
- Percentage or rate suppressed to prevent disclosure of the value on w hich it w as based

69
Table 27: Incidence of All Inpatient ABI* by County, Sorted by Age Adjusted Rate, Kentucky, 2016 *Includes inpatient deaths as well as non-fatal inpatient cases
County Freq Percent
Age-
Adjusted
Rate
Crude
Rate County Freq Percent
Age-
Adjusted
Rate
Crude
Rate County Freq Percent
Age-
Adjusted
Rate
Crude
Rate
Magoffin 62 0.7 433.7 488.8 Butler 27 0.3 191.2 210.2 Casey 27 0.3 141.0 170.7
Perry 105 1.2 363.1 384.0 Gallatin 16 0.2 187.0 185.9 Allen 31 0.4 139.4 150.3
Ow sley 19 0.2 360.9 423.1 Muhlenberg 71 0.8 183.2 228.8 Elliott 12 0.1 135.4 158.1
Letcher 84 1.0 329.8 368.9 Hickman 11 0.1 178.2 237.7 Boyle 44 0.5 134.9 146.6
Clay 73 0.9 327.4 351.5 Menifee 15 0.2 176.8 234.1 Montgomery 42 0.5 134.5 151.2
Row an 73 0.9 316.4 298.6 McLean 18 0.2 173.8 190.0 Wayne 29 0.3 134.0 141.8
Bell 88 1.0 297.9 324.5 Taylor 54 0.6 173.3 212.6 Campbell 135 1.6 133.7 146.4
Wolfe 23 0.3 277.1 321.3 Carter 54 0.6 172.9 199.7 Oldham 83 1.0 131.8 126.6
Pow ell 37 0.4 276.9 300.6 Ohio 45 0.5 171.3 184.6 Hart 27 0.3 131.5 145.0
Harlan 83 1.0 275.2 305.5 Knox 57 0.7 170.3 179.9 Scott 67 0.8 130.5 124.1
Floyd 110 1.3 270.0 296.4 Webster 24 0.3 170.1 180.2 Lee 9 0.1 130.3 136.8
Johnson 67 0.8 262.4 291.6 Carlisle 10 0.1 170.1 206.0 Larue 23 0.3 129.5 163.2
Whitley 100 1.2 262.3 277.0 Bourbon 39 0.5 169.3 194.7 Boone 162 1.9 129.4 126.0
Law rence 42 0.5 249.8 264.8 Caldw ell 25 0.3 168.5 198.9 Christian 82 1.0 126.4 113.3
Livingston 24 0.3 249.3 258.9 Pulaski 119 1.4 167.9 186.1 Breckinridge 28 0.3 124.6 140.3
McCracken 183 2.2 245.5 280.8 Henry 32 0.4 165.5 202.3 Lyon 14 0.2 122.7 173.5
Laurel 168 2.0 244.8 278.8 Washington 22 0.3 165.4 180.5 Callow ay 46 0.5 122.5 119.7
Fleming 40 0.5 242.2 275.7 Graves 72 0.8 164.8 193.6 Mercer 33 0.4 119.5 153.7
Pike 151 1.8 230.7 249.4 Barren 84 1.0 163.8 190.9 Garrard 22 0.3 115.9 127.2
Martin 32 0.4 228.5 266.6 Hopkins 87 1.0 163.7 189.5 Nicholas 8 0.1 109.0 112.9
Knott 35 0.4 223.5 225.2 Hancock 17 0.2 163.2 193.0 Union 17 0.2 108.4 114.2
Cumberland 16 0.2 222.1 237.5 Kenton 278 3.3 162.8 168.5 Woodford 29 0.3 106.5 111.0
Breathitt 36 0.4 218.5 271.0 Lincoln 45 0.5 162.7 184.6 Fulton 9 0.1 105.9 145.7
Estill 36 0.4 215.0 251.6 Clark 67 0.8 161.5 187.1 Greenup 46 0.5 102.1 128.2
Daviess 226 2.7 212.0 226.7 Robertson * - - - Russell 21 0.2 99.0 118.5
Morgan 32 0.4 209.4 240.6 Anderson 38 0.4 158.3 171.5 Bracken 10 0.1 98.7 119.0
Ballard 21 0.2 206.9 260.7 Green 25 0.3 158.0 226.0 Pendleton 16 0.2 95.7 109.9
Grant 52 0.6 206.6 208.6 Marion 33 0.4 158.0 171.8 Logan 28 0.3 94.5 105.3
Jefferson 1738 20.5 206.3 227.1 Carroll 18 0.2 157.1 168.6 Trimble 9 0.1 94.2 104.4
Jackson 30 0.4 205.3 224.4 Fayette 501 5.9 156.6 157.3 Edmonson 16 0.2 86.4 132.1
Boyd 114 1.3 204.1 236.8 Shelby 74 0.9 154.2 159.5 Meade 25 0.3 85.5 88.9
Rockcastle 38 0.4 201.5 225.5 Spencer 30 0.4 154.1 164.2 Todd 11 0.1 81.9 89.5
Marshall 76 0.9 200.5 242.3 Monroe 21 0.2 153.6 198.3 Harrison 18 0.2 81.8 96.5
Metcalfe 23 0.3 199.8 229.6 Franklin 91 1.1 152.9 180.0 Ow en 11 0.1 77.8 103.4
Leslie 26 0.3 197.2 246.7 Warren 186 2.2 150.7 148.2 Mason 15 0.2 76.5 87.3
McCreary 37 0.4 197.2 211.3 Nelson 70 0.8 150.1 153.6 Henderson 43 0.5 76.1 93.0
Bath 26 0.3 195.7 210.9 Adair 30 0.4 147.3 155.6 Trigg 12 0.1 66.6 84.1
Grayson 56 0.7 195.6 213.9 Madison 129 1.5 146.2 144.1 Crittenden 8 0.1 65.0 87.1
Hardin 217 2.6 195.5 202.2 Bullitt 118 1.4 143.6 149.1 Clinton 8 0.1 62.2 78.6
Jessamine 107 1.3 194.7 204.4 Simpson 28 0.3 143.6 154.8 Lew is 8 0.1 40.8 59.5
* At least one but few er than five
- Percentage or rate suppressed to prevent disclosure of the value on w hich it w as based
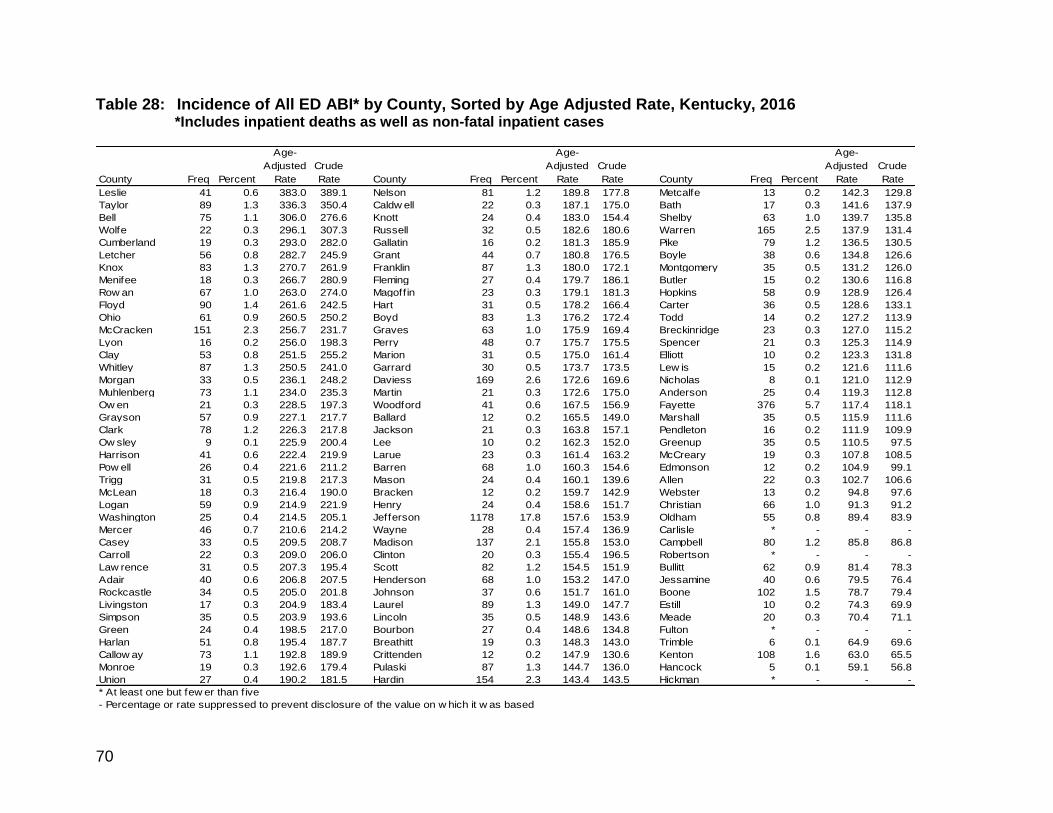
70
Table 28: Incidence of All ED ABI* by County, Sorted by Age Adjusted Rate, Kentucky, 2016 *Includes inpatient deaths as well as non-fatal inpatient cases
County Freq Percent
Age-
Adjusted
Rate
Crude
Rate County Freq Percent
Age-
Adjusted
Rate
Crude
Rate County Freq Percent
Age-
Adjusted
Rate
Crude
Rate
Leslie 41 0.6 383.0 389.1 Nelson 81 1.2 189.8 177.8 Metcalfe 13 0.2 142.3 129.8
Taylor 89 1.3 336.3 350.4 Caldw ell 22 0.3 187.1 175.0 Bath 17 0.3 141.6 137.9
Bell 75 1.1 306.0 276.6 Knott 24 0.4 183.0 154.4 Shelby 63 1.0 139.7 135.8
Wolfe 22 0.3 296.1 307.3 Russell 32 0.5 182.6 180.6 Warren 165 2.5 137.9 131.4
Cumberland 19 0.3 293.0 282.0 Gallatin 16 0.2 181.3 185.9 Pike 79 1.2 136.5 130.5
Letcher 56 0.8 282.7 245.9 Grant 44 0.7 180.8 176.5 Boyle 38 0.6 134.8 126.6
Knox 83 1.3 270.7 261.9 Franklin 87 1.3 180.0 172.1 Montgomery 35 0.5 131.2 126.0
Menifee 18 0.3 266.7 280.9 Fleming 27 0.4 179.7 186.1 Butler 15 0.2 130.6 116.8
Row an 67 1.0 263.0 274.0 Magoffin 23 0.3 179.1 181.3 Hopkins 58 0.9 128.9 126.4
Floyd 90 1.4 261.6 242.5 Hart 31 0.5 178.2 166.4 Carter 36 0.5 128.6 133.1
Ohio 61 0.9 260.5 250.2 Boyd 83 1.3 176.2 172.4 Todd 14 0.2 127.2 113.9
McCracken 151 2.3 256.7 231.7 Graves 63 1.0 175.9 169.4 Breckinridge 23 0.3 127.0 115.2
Lyon 16 0.2 256.0 198.3 Perry 48 0.7 175.7 175.5 Spencer 21 0.3 125.3 114.9
Clay 53 0.8 251.5 255.2 Marion 31 0.5 175.0 161.4 Elliott 10 0.2 123.3 131.8
Whitley 87 1.3 250.5 241.0 Garrard 30 0.5 173.7 173.5 Lew is 15 0.2 121.6 111.6
Morgan 33 0.5 236.1 248.2 Daviess 169 2.6 172.6 169.6 Nicholas 8 0.1 121.0 112.9
Muhlenberg 73 1.1 234.0 235.3 Martin 21 0.3 172.6 175.0 Anderson 25 0.4 119.3 112.8
Ow en 21 0.3 228.5 197.3 Woodford 41 0.6 167.5 156.9 Fayette 376 5.7 117.4 118.1
Grayson 57 0.9 227.1 217.7 Ballard 12 0.2 165.5 149.0 Marshall 35 0.5 115.9 111.6
Clark 78 1.2 226.3 217.8 Jackson 21 0.3 163.8 157.1 Pendleton 16 0.2 111.9 109.9
Ow sley 9 0.1 225.9 200.4 Lee 10 0.2 162.3 152.0 Greenup 35 0.5 110.5 97.5
Harrison 41 0.6 222.4 219.9 Larue 23 0.3 161.4 163.2 McCreary 19 0.3 107.8 108.5
Pow ell 26 0.4 221.6 211.2 Barren 68 1.0 160.3 154.6 Edmonson 12 0.2 104.9 99.1
Trigg 31 0.5 219.8 217.3 Mason 24 0.4 160.1 139.6 Allen 22 0.3 102.7 106.6
McLean 18 0.3 216.4 190.0 Bracken 12 0.2 159.7 142.9 Webster 13 0.2 94.8 97.6
Logan 59 0.9 214.9 221.9 Henry 24 0.4 158.6 151.7 Christian 66 1.0 91.3 91.2
Washington 25 0.4 214.5 205.1 Jefferson 1178 17.8 157.6 153.9 Oldham 55 0.8 89.4 83.9
Mercer 46 0.7 210.6 214.2 Wayne 28 0.4 157.4 136.9 Carlisle * - - -
Casey 33 0.5 209.5 208.7 Madison 137 2.1 155.8 153.0 Campbell 80 1.2 85.8 86.8
Carroll 22 0.3 209.0 206.0 Clinton 20 0.3 155.4 196.5 Robertson * - - -
Law rence 31 0.5 207.3 195.4 Scott 82 1.2 154.5 151.9 Bullitt 62 0.9 81.4 78.3
Adair 40 0.6 206.8 207.5 Henderson 68 1.0 153.2 147.0 Jessamine 40 0.6 79.5 76.4
Rockcastle 34 0.5 205.0 201.8 Johnson 37 0.6 151.7 161.0 Boone 102 1.5 78.7 79.4
Livingston 17 0.3 204.9 183.4 Laurel 89 1.3 149.0 147.7 Estill 10 0.2 74.3 69.9
Simpson 35 0.5 203.9 193.6 Lincoln 35 0.5 148.9 143.6 Meade 20 0.3 70.4 71.1
Green 24 0.4 198.5 217.0 Bourbon 27 0.4 148.6 134.8 Fulton * - - -
Harlan 51 0.8 195.4 187.7 Breathitt 19 0.3 148.3 143.0 Trimble 6 0.1 64.9 69.6
Callow ay 73 1.1 192.8 189.9 Crittenden 12 0.2 147.9 130.6 Kenton 108 1.6 63.0 65.5
Monroe 19 0.3 192.6 179.4 Pulaski 87 1.3 144.7 136.0 Hancock 5 0.1 59.1 56.8
Union 27 0.4 190.2 181.5 Hardin 154 2.3 143.4 143.5 Hickman * - - -
* At least one but few er than five
- Percentage or rate suppressed to prevent disclosure of the value on w hich it w as based

71
Table 29: Causes of Non-Fatal ABI, Kentucky, 2016
Table 30: Non-Fatal Anoxia by Age Group, Kentucky, 2016
Table 31: Diagnosis Distribution for Non-Fatal Anoxia, Kentucky, 2016
ABI Category Number Percent Number Percent
Anoxia 803 10.6 151 2.3
Exposure to toxic substances 6406 84.9 5465 84.5
Allergy/anaphylaxis 206 2.7 842 13.0
Acute medical clinical incidents 129 1.7 7 0.1
Inpatient ED
* Because there are multiple diagnoses and/or causes of death listed for each individual, it
is possible for the same case to fall into more than one ABI category. Therefore, the
column sums in this table are slightly higher than the total number of ABI cases show n in
previous tables.
Age Number Percent Rate Number Percent Rate Number Percent Rate
0-4 21 27.3 7.6 56 72.7 20.3 77 100.0 27.9
5-14 17 58.6 3.0 12 41.4 2.1 29 100.0 5.2
15-24 36 81.8 6.1 8 18.2 1.3 44 100.0 7.4
25-44 172 85.6 15.2 29 14.4 2.6 201 100.0 17.8
45-64 303 89.6 25.5 35 10.4 2.9 338 100.0 28.5
65+ 254 95.8 36.8 11 4.2 1.6 265 100.0 38.4
Total 803 84.2 18.1 151 15.8 3.4 954 100.0 21.5
Inpatient ED Total
Inpatient ED
Diagnosis Description Number Percent Number Percent
G931 Anoxic brain damage (related to hereditary and
degenerative diseases of the central nervous system) 749 93.3 68 45.0
O754 Cerebral anoxia following cesarean 49 6.1 7 4.6
T751 Drowning and nonfatal submersion 5 0.6 76 50.3
Total 803 100.0 151 100.0

72
Table 32: Non-Fatal Exposure to Toxic Substances by Age Group, Kentucky, 2016
Table 33: Diagnosis Distribution for Non-Fatal Exposure to Toxic Substances, Kentucky, 2016
Age Number Percent Rate Number Percent Rate Number Percent Rate
0-4 91 22.5 33.0 313 77.5 113.5 404 100.0 146.5
5-14 48 19.8 8.6 194 80.2 34.6 242 100.0 43.1
15-24 313 26.6 52.7 864 73.4 145.5 1,177 100.0 198.3
25-44 1,270 40.3 112.6 1,885 59.7 167.1 3,155 100.0 279.6
45-64 2,142 60.8 180.4 1,382 39.2 116.4 3,524 100.0 296.8
65+ 2,542 75.5 368.0 827 24.5 119.7 3,369 100.0 487.8
Total 6,406 54.0 144.4 5,465 46.0 123.2 11,871 100.0 267.5
Inpatient ED Total
Inpatient ED
Diagnosis Description Number Percent Number Percent
967, T42 Poisoning by sedatives and hypnotics 2461 38.4 2023 28.8
980, T51 Toxic effect of alcohol 277 4.3 250 13.3
968, T41 Poisoning by other central nervous system depressants and
anesthetics 222 3.5 59 8.9
964.2, T455 Poisoning by anticoagulants 2157 33.7 682 5.0
998, T81.1 Post-operative shock 275 4.3 7 0.2
986, T58 Toxic effect of carbon monoxide 34 0.5 202 14.6
985, T56, T57 Toxic effect of other metals 42 0.7 23 1.0
988.0-988.2, T62 Toxic effect of noxious substances eaten as food 25 0.4 280 3.0
995.4, T88.2 Shock due to anesthesia 2 0.0 1 0.1
Other*
Includes meningitis, reaction to lumbar puncture, poisoning by
cocaine, other substances 911 14.2 1938 0.1
Total 6406 100.0 5465 100.0

73
Table 34: Length of Stay for Non-Fatal Inpatient ABI, Kentucky, 2016
Table 35: Discharge Disposition for Non-Fatal ABI, Kentucky, 2016
Length of Stay Number Percent*
1 day 1031 14.2
More than one day but less than 1 week 3945 54.3
1 week to less than 2 weeks 1408 19.4
2 weeks to less than 3 weeks 426 5.9
3 weeks to less than 4 weeks 205 2.8
4 weeks or more 249 3.4
Total 7264 100.0
*Percent of hospitalized ABI
Inpatient ED
Discharge Disposition Number Percent Number Percent
Routine discharge (home/self care) 3,952 54.4 5,453 82.8
Skilled nursing facility (SNF) 927 12.8 47 0.7
Home health 780 10.7 27 0.4
Inpatient-other type facility 30 0.4 42 0.6
Inpatient-other short-term hospital 230 3.2 399 6.1
Intermediate care facility (ICF) 36 0.5 8 0.1
Rehab 322 4.4 8 0.1
Other 987 13.6 598 9.1
Total 7,264 100.0 6,582 100.0

74
Table 36: Primary Payer and Charges for Non-Fatal Inpatient ABI, Kentucky, 2016
Table 37: Primary Payer and Charges for Non-Fatal ED ABI, Kentucky, 2016
Table 38: Non-Fatal SCI by Age Group, Kentucky, 2016
Payer
Number of
Discharges
Percent of
Discharges
Total Hospital
Charges
Government 5,643 77.7 307,488,707$
Commercial Insurance 1,461 20.1 93,227,416$
Self Pay 103 1.4 3,358,349$
Workers Compensation 17 0.2 1,252,043$
Other 40 0.6 2,444,637$
Total 7,264 100.0 407,771,152$
Payer
Number of
Discharges
Percent of
Discharges
Total Hospital
Charges
Government 4,230 64.3 15,972,457$
Commercial Insurance 1,835 27.9 6,343,025$
Self Pay 343 5.2 975,284$
Workers Compensation 105 1.6 160,183$
Other 69 1.0 256,397$
Total 6,582 100.0 23,707,346$
Age Number Percent Rate Number Percent Rate Number Percent Rate
0-4 0 0.0 0.0 2 0.0 0.7 2 100.0 0.7
5-14 3 37.5 0.5 8 72.7 1.4 11 100.0 2.0
15-24 17 77.3 2.9 5 22.7 0.8 22 100.0 3.7
25-44 31 59.6 2.7 21 40.4 1.9 52 100.0 4.6
45-64 66 64.7 5.6 36 35.3 3.0 102 100.0 8.6
65+ 37 71.2 5.4 15 28.8 2.2 52 100.0 7.5
Total 154 63.9 3.5 87 36.1 2.0 241 100.0 5.4
Inpatient ED Total

75
Table 39: Non-Fatal SCI by Gender, Kentucky, 2016
Table 40: Leading Causes of Non-Fatal SCI, Kentucky, 2016
Table 41: Length of Stay for Non-Fatal Inpatient SCI, Kentucky, 2016
Age Number Percent Rate Number Percent Rate Number Percent Rate
Male 111 71.2 5.1 45 28.8 2.1 156 100.0 7.1
Female 43 50.6 1.9 42 49.4 1.9 85 100.0 3.8
Total 154 63.9 3.5 87 36.1 2.0 241 100.0 5.4
Inpatient ED Total
Mechanism of Injury Number Percent Rate Number Percent Rate Number Percent Rate
Motor vehicle traffic crash 40 64.5 0.9 22 35.5 0.5 62 100.0 1.4
Fall 69 67.6 1.6 33 32.4 0.7 102 100.0 2.3
Non-traffic land transportation 5 50.0 0.1 5 50.0 0.1 10 100.0 0.2
Struck by or against object or person 2 66.7 0.0 1 33.3 0.0 3 100.0 0.1
Firearm 9 75.0 0.2 3 25.0 0.1 12 100.0 0.3
Other 5 38.5 0.1 8 61.5 0.2 13 100.0 0.3
Unknown (missing E-code) 24 61.5 0.5 15 38.5 0.3 39 100.0 0.9
Total 154 63.9 3.5 87 36.1 2.0 241 100.0 5.4
Inpatient ED Total
Length of Stay Number Percent*
1 day 11 7.1
More than one day but less than 1 week 57 37.0
1 week to less than 2 weeks 53 34.4
2 weeks to less than 3 weeks 15 9.7
3 weeks to less than 4 weeks 7 4.5
4 weeks or more 11 7.1
Total 154 100.0
*Percent of hospitalized SCI

76
Table 42: Discharge Disposition for Non-Fatal SCI, Kentucky, 2016
Table 43: Primary Payer and Charges for Non-Fatal Inpatient SCI, Kentucky, 2016
Table 44: Primary Payer and Charges for Non-Fatal ED SCI, Kentucky, 2016
Inpatient ED
Discharge Disposition Number Percent Number Percent
Routine discharge (home/self care) 45 29.2 56 64.4
Home health 11 7.1 1 1.1
Skilled nursing facility (SNF) 16 10.4 0 0.0
Inpatient-other 9 5.8 23 26.4
Rehab 64 41.6 0 0.0
Other 9 5.8 7 8.0
Total 154 100.0 87 100.0
Payer
Number of
Discharges
Percent of
Discharges
Total Hospital
Discharges
Government 97 63.0 13,136,372$
Commercial Ins 38 24.7 7,076,035$
Workers Compensation 2 1.3 347,022$
Self Pay 1 0.6 264,054$
Other 16 10.4 1,879,905$
Total 154 100.0 $22,703,389
Payer
Number of
Discharges
Percent of
Discharges
Total Hospital
Discharges
Government 52 59.8 339,518$
Commercial Ins 18 20.7 100,116$
Workers Compensation 2 2.3 1,794$
Self Pay 4 4.6 12,227$
Other 11 12.6 59,081$
Total 87 100.0 $512,735

77
Table 45: Non-Fatal Stroke by Age Group, Kentucky, 2016
Table 46: Non-Fatal Stroke by Gender, Kentucky, 2016
Table 47: Length of Stay for Non-Fatal Inpatient Stroke, Kentucky, 2016
Age Number Percent Rate Number Percent Rate Number Percent Rate
0-4 23 0.0 8.3 7 0.0 2.5 30 100.0 10.9
5-14 8 88.9 1.4 9 52.9 1.6 17 100.0 3.0
15-24 50 42.7 8.4 67 57.3 11.3 117 100.0 19.7
25-44 695 55.4 61.6 559 44.6 49.5 1,254 100.0 111.1
45-64 4,064 59.9 342.3 2,717 40.1 228.8 6,781 100.0 571.1
65+ 8,292 65.4 1200.5 4,388 34.6 635.3 12,680 100.0 1835.8
Total 13,132 62.9 296.0 7,747 37.1 174.6 20,879 100.0 470.6
Inpatient ED Total
Age Number Percent Rate Number Percent Rate Number Percent Rate
Male 6,129 62.8 280.3 3,633 37.2 166.2 9,762 100.0 446.5
Female 7,003 63.0 311.2 4,114 37.0 182.8 11,117 100.0 494.0
Total 13,132 62.9 296.0 7,747 37.1 174.6 20,879 100.0 470.6
Inpatient ED Total
Length of Stay Number Percent*
1 day 1901 14.5
More than one day but less than 1 week 7708 58.7
1 week to less than 2 weeks 2388 18.2
2 weeks to less than 3 weeks 636 4.8
3 weeks to less than 4 weeks 255 1.9
4 weeks or more 244 1.9
Total 13132 100.0
*Percent of hospitalized Stroke
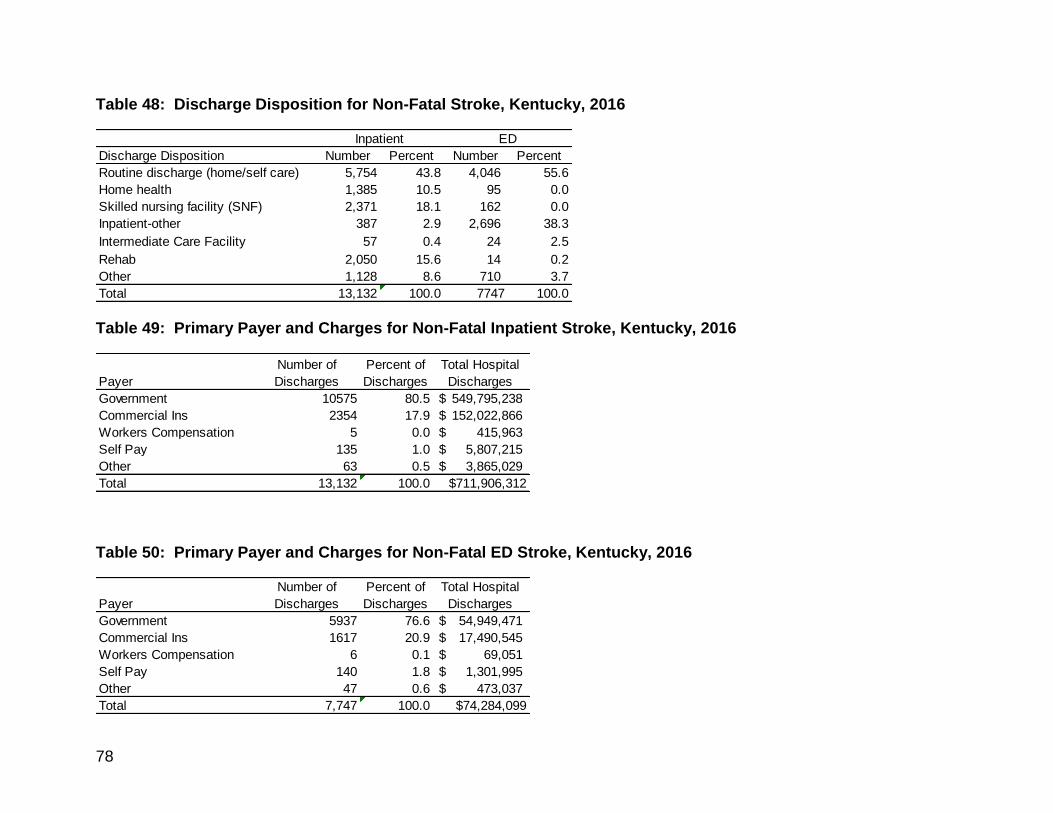
78
Table 48: Discharge Disposition for Non-Fatal Stroke, Kentucky, 2016
Table 49: Primary Payer and Charges for Non-Fatal Inpatient Stroke, Kentucky, 2016
Table 50: Primary Payer and Charges for Non-Fatal ED Stroke, Kentucky, 2016
Inpatient ED
Discharge Disposition Number Percent Number Percent
Routine discharge (home/self care) 5,754 43.8 4,046 55.6
Home health 1,385 10.5 95 0.0
Skilled nursing facility (SNF) 2,371 18.1 162 0.0
Inpatient-other 387 2.9 2,696 38.3
Intermediate Care Facility 57 0.4 24 2.5
Rehab 2,050 15.6 14 0.2
Other 1,128 8.6 710 3.7
Total 13,132 100.0 7747 100.0
Payer
Number of
Discharges
Percent of
Discharges
Total Hospital
Discharges
Government 10575 80.5 549,795,238$
Commercial Ins 2354 17.9 152,022,866$
Workers Compensation 5 0.0 415,963$
Self Pay 135 1.0 5,807,215$
Other 63 0.5 3,865,029$
Total 13,132 100.0 $711,906,312
Payer
Number of
Discharges
Percent of
Discharges
Total Hospital
Discharges
Government 5937 76.6 54,949,471$
Commercial Ins 1617 20.9 17,490,545$
Workers Compensation 6 0.1 69,051$
Self Pay 140 1.8 1,301,995$
Other 47 0.6 473,037$
Total 7,747 100.0 $74,284,099

79
Table 51: Incidence of All Inpatient Stroke* by County, Sorted by County, Kentucky, 2016 *Includes inpatient deaths as well as non-fatal inpatient cases
County Freq Percent
Age-
Adjusted
Rate
Crude
Rate County Freq Percent
Age-
Adjusted
Rate
Crude
Rate County Freq Percent
Age-
Adjusted
Rate
Crude
Rate
Adair 68 0.5 277.7 352.7 Grant 102 0.7 410.3 409.3 McLean 36 0.3 281.7 379.9
Allen 82 0.6 316.3 397.5 Graves 117 0.8 241.4 314.7 Meade 56 0.4 185.3 199.1
Anderson 68 0.5 249.9 306.9 Grayson 125 0.9 383.0 477.4 Menifee 33 0.2 402.8 515.0
Ballard 32 0.2 288.1 397.3 Green 41 0.3 245.7 370.7 Mercer 100 0.7 344.2 465.6
Barren 145 1.0 256.2 329.6 Greenup 95 0.7 193.4 264.7 Metcalfe 39 0.3 294.2 389.3
Bath 64 0.4 429.1 519.2 Hancock 31 0.2 298.3 351.9 Monroe 72 0.5 493.6 680.0
Bell 120 0.8 350.9 442.5 Hardin 324 2.3 283.2 301.9 Montgomery 79 0.6 246.1 284.5
Boone 276 1.9 227.4 214.7 Harlan 112 0.8 323.9 412.3 Morgan 33 0.2 209.3 248.2
Bourbon 68 0.5 267.9 339.5 Harrison 74 0.5 304.1 396.9 Muhlenberg 103 0.7 252.6 332.0
Boyd 174 1.2 270.5 361.5 Hart 59 0.4 268.0 316.7 Nelson 150 1.1 309.4 329.2
Boyle 98 0.7 240.5 326.5 Henderson 84 0.6 141.3 181.6 Nicholas 35 0.2 382.5 494.1
Bracken 27 0.2 281.6 321.4 Henry 55 0.4 270.1 347.7 Ohio 68 0.5 220.6 278.9
Breathitt 57 0.4 336.8 429.1 Hickman 15 0.1 217.1 324.2 Oldham 123 0.9 203.8 187.6
Breckinridge 52 0.4 195.1 260.5 Hopkins 98 0.7 154.4 213.5 Ow en 27 0.2 189.4 253.7
Bullitt 189 1.3 213.0 238.8 Jackson 41 0.3 258.5 306.7 Ow sley 19 0.1 342.6 423.1
Butler 51 0.4 307.0 397.0 Jefferson 2846 19.9 317.1 371.9 Pendleton 46 0.3 249.9 315.9
Caldw ell 35 0.2 196.3 278.5 Jessamine 131 0.9 231.1 250.2 Perry 191 1.3 567.6 698.5
Callow ay 98 0.7 214.8 255.0 Johnson 81 0.6 294.0 352.5 Pike 254 1.8 329.3 419.5
Campbell 242 1.7 224.3 262.4 Kenton 389 2.7 222.5 235.8 Pow ell 58 0.4 399.7 471.2
Carlisle 24 0.2 316.5 494.3 Knott 86 0.6 428.1 553.3 Pulaski 233 1.6 287.7 364.3
Carroll 44 0.3 340.6 412.0 Knox 104 0.7 265.4 328.2 Robertson 6 0.0 174.0 278.4
Carter 107 0.7 327.7 395.6 Larue 60 0.4 294.8 425.7 Rockcastle 41 0.3 190.0 243.3
Casey 51 0.4 235.5 322.5 Laurel 172 1.2 242.2 285.5 Row an 104 0.7 408.2 425.3
Christian 123 0.9 188.5 170.0 Law rence 45 0.3 221.8 283.7 Russell 47 0.3 199.2 265.2
Clark 120 0.8 263.6 335.0 Lee 17 0.1 203.3 258.4 Scott 125 0.9 257.3 231.6
Clay 84 0.6 366.4 404.5 Leslie 72 0.5 545.5 683.2 Shelby 103 0.7 204.6 221.9
Clinton 31 0.2 203.5 304.6 Letcher 122 0.9 408.1 535.7 Simpson 78 0.5 362.2 431.3
Crittenden 29 0.2 209.7 315.6 Lew is 37 0.3 224.7 275.3 Spencer 42 0.3 226.4 229.8
Cumberland 33 0.2 300.3 489.8 Lincoln 101 0.7 330.0 414.4 Taylor 109 0.8 349.7 429.2
Daviess 346 2.4 281.9 347.1 Livingston 63 0.4 466.6 679.7 Todd 27 0.2 187.1 219.6
Edmonson 31 0.2 183.3 255.9 Logan 87 0.6 258.4 327.2 Trigg 38 0.3 174.2 266.4
Elliott 19 0.1 181.3 250.4 Lyon 26 0.2 200.0 322.2 Trimble 16 0.1 147.4 185.6
Estill 56 0.4 319.7 391.4 Madison 220 1.5 242.6 245.7 Union 24 0.2 137.2 161.3
Fayette 778 5.4 248.1 244.3 Magoffin 35 0.2 239.8 275.9 Warren 368 2.6 300.0 293.2
Fleming 69 0.5 372.9 475.6 Marion 59 0.4 254.9 307.2 Washington 31 0.2 197.5 254.3
Floyd 172 1.2 366.4 463.5 Marshall 122 0.9 256.9 389.0 Wayne 57 0.4 214.1 278.7
Franklin 168 1.2 260.1 332.3 Martin 33 0.2 233.1 275.0 Webster 33 0.2 217.7 247.8
Fulton 20 0.1 213.4 323.7 Mason 47 0.3 218.1 273.4 Whitley 177 1.2 427.7 490.4
Gallatin 40 0.3 521.8 464.6 McCracken 249 1.7 269.0 382.1 Wolfe 44 0.3 512.5 614.6
Garrard 45 0.3 198.2 260.2 McCreary 56 0.4 303.5 319.8 Woodford 82 0.6 245.9 313.9
* At least one but few er than five
- Percentage or rate suppressed to prevent disclosure of the value on w hich it w as based

80
Table 52: Incidence of All ED Stroke* by County, Sorted by County, Kentucky, 2016 *Includes ED deaths as well as non-fatal ED cases
County Freq Percent
Age-
Adjusted
Rate
Crude
Rate County Freq Percent
Age-
Adjusted
Rate
Crude
Rate County Freq Percent
Age-
Adjusted
Rate
Crude
Rate
Adair 85 1.1 357.2 440.9 Grant 46 0.6 159.7 184.6 McLean 11 0.1 92.3 116.1
Allen 63 0.8 252.1 305.4 Graves 70 0.9 142.8 188.3 Meade 14 0.2 44.8 49.8
Anderson 30 0.4 111.0 135.4 Grayson 79 1.0 241.7 301.7 Menifee 20 0.3 252.5 312.1
Ballard 12 0.2 132.1 149.0 Green 44 0.6 285.6 397.8 Mercer 69 0.9 253.5 321.3
Barren 112 1.4 206.3 254.6 Greenup 74 0.9 154.2 206.2 Metcalfe 48 0.6 370.4 479.1
Bath 47 0.6 305.7 381.3 Hancock 3 0.0 30.9 34.1 Monroe 41 0.5 273.3 387.2
Bell 116 1.5 331.5 427.8 Hardin 138 1.8 115.7 128.6 Montgomery 72 0.9 226.4 259.3
Boone 75 1.0 59.0 58.3 Harlan 106 1.4 322.5 390.2 Morgan 46 0.6 294.5 345.9
Bourbon 54 0.7 213.9 269.6 Harrison 82 1.1 336.5 439.8 Muhlenberg 85 1.1 205.1 273.9
Boyd 101 1.3 158.0 209.8 Hart 57 0.7 245.2 306.0 Nelson 114 1.5 240.6 250.2
Boyle 60 0.8 156.4 199.9 Henderson 95 1.2 164.0 205.4 Nicholas 21 0.3 218.1 296.4
Bracken 23 0.3 241.4 273.8 Henry 37 0.5 193.3 233.9 Ohio 42 0.5 138.1 172.3
Breathitt 47 0.6 284.2 353.8 Hickman 5 0.1 73.2 108.1 Oldham 51 0.7 82.0 77.8
Breckinridge 38 0.5 149.5 190.4 Hopkins 157 2.0 273.9 342.0 Ow en 8 0.1 63.0 75.2
Bullitt 49 0.6 54.0 61.9 Jackson 38 0.5 258.3 284.3 Ow sley 13 0.2 235.6 289.5
Butler 22 0.3 141.3 171.3 Jefferson 805 10.3 89.7 105.2 Pendleton 18 0.2 100.9 123.6
Caldw ell 44 0.6 274.3 350.1 Jessamine 43 0.6 74.4 82.1 Perry 115 1.5 365.1 420.6
Callow ay 106 1.4 232.8 275.8 Johnson 76 1.0 278.1 330.8 Pike 109 1.4 141.2 180.0
Campbell 56 0.7 57.0 60.7 Kenton 72 0.9 41.5 43.7 Pow ell 57 0.7 414.6 463.1
Carlisle 5 0.1 71.6 103.0 Knott 39 0.5 198.7 250.9 Pulaski 123 1.6 151.8 192.3
Carroll 25 0.3 187.0 234.1 Knox 108 1.4 269.6 340.8 Robertson 7 0.1 209.7 324.8
Carter 60 0.8 181.1 221.8 Larue 11 0.1 61.7 78.0 Rockcastle 53 0.7 241.9 314.5
Casey 35 0.4 173.3 221.3 Laurel 130 1.7 185.3 215.8 Row an 80 1.0 317.9 327.2
Christian 120 1.5 187.5 165.9 Law rence 60 0.8 326.4 378.2 Russell 49 0.6 223.9 276.5
Clark 85 1.1 186.8 237.3 Lee 12 0.2 152.2 182.4 Scott 74 0.9 144.8 137.1
Clay 81 1.0 346.3 390.1 Leslie 49 0.6 385.8 465.0 Shelby 64 0.8 132.0 137.9
Clinton 27 0.3 204.9 265.3 Letcher 67 0.9 241.6 294.2 Simpson 53 0.7 251.1 293.1
Crittenden 11 0.1 81.9 119.7 Lew is 26 0.3 164.3 193.4 Spencer 14 0.2 68.0 76.6
Cumberland 25 0.3 243.6 371.0 Lincoln 85 1.1 298.3 348.8 Taylor 94 1.2 308.8 370.1
Daviess 88 1.1 72.8 88.3 Livingston 19 0.2 143.9 205.0 Todd 19 0.2 135.6 154.5
Edmonson 18 0.2 103.5 148.6 Logan 64 0.8 193.7 240.7 Trigg 69 0.9 356.2 483.7
Elliott 12 0.2 119.6 158.1 Lyon 14 0.2 110.4 173.5 Trimble 9 0.1 90.1 104.4
Estill 40 0.5 214.9 279.6 Madison 141 1.8 155.7 157.5 Union 42 0.5 231.7 282.3
Fayette 225 2.9 72.1 70.7 Magoffin 27 0.3 170.1 212.9 Warren 162 2.1 129.9 129.1
Fleming 81 1.0 465.5 558.4 Marion 69 0.9 287.2 359.3 Washington 30 0.4 203.3 246.1
Floyd 141 1.8 312.7 380.0 Marshall 82 1.1 187.4 261.4 Wayne 51 0.7 199.1 249.4
Franklin 102 1.3 154.5 201.7 Martin 34 0.4 240.5 283.3 Webster 30 0.4 171.2 225.3
Fulton 2 0.0 20.3 32.4 Mason 46 0.6 211.6 267.6 Whitley 172 2.2 412.4 476.5
Gallatin 5 0.1 59.9 58.1 McCracken 101 1.3 114.1 155.0 Wolfe 31 0.4 376.8 433.0
Garrard 26 0.3 118.1 150.4 McCreary 25 0.3 125.8 142.8 Woodford 23 0.3 68.1 88.0
* At least one but few er than five
- Percentage or rate suppressed to prevent disclosure of the value on w hich it w as based

81
Table 53: Incidence of All Inpatient Stroke* by County, Sorted by Frequency, Kentucky, 2016 *Includes inpatient deaths as well as non-fatal inpatient cases
County Freq Percent
Age-
Adjusted
Rate
Crude
Rate County Freq Percent
Age-
Adjusted
Rate
Crude
Rate County Freq Percent
Age-
Adjusted
Rate
Crude
Rate
Jefferson 2846 19.9 317.1 371.9 Mercer 100 0.7 344.2 465.6 Garrard 45 0.3 198.2 260.2
Fayette 778 5.4 248.1 244.3 Boyle 98 0.7 240.5 326.5 Law rence 45 0.3 221.8 283.7
Kenton 389 2.7 222.5 235.8 Callow ay 98 0.7 214.8 255.0 Carroll 44 0.3 340.6 412.0
Warren 368 2.6 300.0 293.2 Hopkins 98 0.7 154.4 213.5 Wolfe 44 0.3 512.5 614.6
Daviess 346 2.4 281.9 347.1 Greenup 95 0.7 193.4 264.7 Spencer 42 0.3 226.4 229.8
Hardin 324 2.3 283.2 301.9 Logan 87 0.6 258.4 327.2 Green 41 0.3 245.7 370.7
Boone 276 1.9 227.4 214.7 Knott 86 0.6 428.1 553.3 Jackson 41 0.3 258.5 306.7
Pike 254 1.8 329.3 419.5 Clay 84 0.6 366.4 404.5 Rockcastle 41 0.3 190.0 243.3
McCracken 249 1.7 269.0 382.1 Henderson 84 0.6 141.3 181.6 Gallatin 40 0.3 521.8 464.6
Campbell 242 1.7 224.3 262.4 Allen 82 0.6 316.3 397.5 Metcalfe 39 0.3 294.2 389.3
Pulaski 233 1.6 287.7 364.3 Woodford 82 0.6 245.9 313.9 Trigg 38 0.3 174.2 266.4
Madison 220 1.5 242.6 245.7 Johnson 81 0.6 294.0 352.5 Lew is 37 0.3 224.7 275.3
Perry 191 1.3 567.6 698.5 Montgomery 79 0.6 246.1 284.5 McLean 36 0.3 281.7 379.9
Bullitt 189 1.3 213.0 238.8 Simpson 78 0.5 362.2 431.3 Caldw ell 35 0.2 196.3 278.5
Whitley 177 1.2 427.7 490.4 Harrison 74 0.5 304.1 396.9 Magoffin 35 0.2 239.8 275.9
Boyd 174 1.2 270.5 361.5 Leslie 72 0.5 545.5 683.2 Nicholas 35 0.2 382.5 494.1
Floyd 172 1.2 366.4 463.5 Monroe 72 0.5 493.6 680.0 Cumberland 33 0.2 300.3 489.8
Laurel 172 1.2 242.2 285.5 Fleming 69 0.5 372.9 475.6 Martin 33 0.2 233.1 275.0
Franklin 168 1.2 260.1 332.3 Adair 68 0.5 277.7 352.7 Menifee 33 0.2 402.8 515.0
Nelson 150 1.1 309.4 329.2 Anderson 68 0.5 249.9 306.9 Morgan 33 0.2 209.3 248.2
Barren 145 1.0 256.2 329.6 Bourbon 68 0.5 267.9 339.5 Webster 33 0.2 217.7 247.8
Jessamine 131 0.9 231.1 250.2 Ohio 68 0.5 220.6 278.9 Ballard 32 0.2 288.1 397.3
Grayson 125 0.9 383.0 477.4 Bath 64 0.4 429.1 519.2 Clinton 31 0.2 203.5 304.6
Scott 125 0.9 257.3 231.6 Livingston 63 0.4 466.6 679.7 Edmonson 31 0.2 183.3 255.9
Christian 123 0.9 188.5 170.0 Larue 60 0.4 294.8 425.7 Hancock 31 0.2 298.3 351.9
Oldham 123 0.9 203.8 187.6 Hart 59 0.4 268.0 316.7 Washington 31 0.2 197.5 254.3
Letcher 122 0.9 408.1 535.7 Marion 59 0.4 254.9 307.2 Crittenden 29 0.2 209.7 315.6
Marshall 122 0.9 256.9 389.0 Pow ell 58 0.4 399.7 471.2 Bracken 27 0.2 281.6 321.4
Bell 120 0.8 350.9 442.5 Breathitt 57 0.4 336.8 429.1 Ow en 27 0.2 189.4 253.7
Clark 120 0.8 263.6 335.0 Wayne 57 0.4 214.1 278.7 Todd 27 0.2 187.1 219.6
Graves 117 0.8 241.4 314.7 Estill 56 0.4 319.7 391.4 Lyon 26 0.2 200.0 322.2
Harlan 112 0.8 323.9 412.3 McCreary 56 0.4 303.5 319.8 Carlisle 24 0.2 316.5 494.3
Taylor 109 0.8 349.7 429.2 Meade 56 0.4 185.3 199.1 Union 24 0.2 137.2 161.3
Carter 107 0.7 327.7 395.6 Henry 55 0.4 270.1 347.7 Fulton 20 0.1 213.4 323.7
Knox 104 0.7 265.4 328.2 Breckinridge 52 0.4 195.1 260.5 Elliott 19 0.1 181.3 250.4
Row an 104 0.7 408.2 425.3 Butler 51 0.4 307.0 397.0 Ow sley 19 0.1 342.6 423.1
Muhlenberg 103 0.7 252.6 332.0 Casey 51 0.4 235.5 322.5 Lee 17 0.1 203.3 258.4
Shelby 103 0.7 204.6 221.9 Mason 47 0.3 218.1 273.4 Trimble 16 0.1 147.4 185.6
Grant 102 0.7 410.3 409.3 Russell 47 0.3 199.2 265.2 Hickman 15 0.1 217.1 324.2
Lincoln 101 0.7 330.0 414.4 Pendleton 46 0.3 249.9 315.9 Robertson 6 0.0 174.0 278.4
* At least one but few er than five
- Percentage or rate suppressed to prevent disclosure of the value on w hich it w as based

82
Table 54: Incidence of All ED Stroke* by County, Sorted by Frequency, Kentucky, 2016 *Includes ED deaths as well as non-fatal ED cases
County Freq Percent
Age-
Adjusted
Rate
Crude
Rate County Freq Percent
Age-
Adjusted
Rate
Crude
Rate County Freq Percent
Age-
Adjusted
Rate
Crude
Rate
Jefferson 805 10.3 89.7 105.2 Montgomery 72 0.9 226.4 259.3 Casey 35 0.4 173.3 221.3
Fayette 225 2.9 72.1 70.7 Graves 70 0.9 142.8 188.3 Martin 34 0.4 240.5 283.3
Whitley 172 2.2 412.4 476.5 Marion 69 0.9 287.2 359.3 Wolfe 31 0.4 376.8 433.0
Warren 162 2.1 129.9 129.1 Mercer 69 0.9 253.5 321.3 Anderson 30 0.4 111.0 135.4
Hopkins 157 2.0 273.9 342.0 Trigg 69 0.9 356.2 483.7 Washington 30 0.4 203.3 246.1
Floyd 141 1.8 312.7 380.0 Letcher 67 0.9 241.6 294.2 Webster 30 0.4 171.2 225.3
Madison 141 1.8 155.7 157.5 Logan 64 0.8 193.7 240.7 Clinton 27 0.3 204.9 265.3
Hardin 138 1.8 115.7 128.6 Shelby 64 0.8 132.0 137.9 Magoffin 27 0.3 170.1 212.9
Laurel 130 1.7 185.3 215.8 Allen 63 0.8 252.1 305.4 Garrard 26 0.3 118.1 150.4
Pulaski 123 1.6 151.8 192.3 Boyle 60 0.8 156.4 199.9 Lew is 26 0.3 164.3 193.4
Christian 120 1.5 187.5 165.9 Carter 60 0.8 181.1 221.8 Carroll 25 0.3 187.0 234.1
Bell 116 1.5 331.5 427.8 Law rence 60 0.8 326.4 378.2 Cumberland 25 0.3 243.6 371.0
Perry 115 1.5 365.1 420.6 Hart 57 0.7 245.2 306.0 McCreary 25 0.3 125.8 142.8
Nelson 114 1.5 240.6 250.2 Pow ell 57 0.7 414.6 463.1 Bracken 23 0.3 241.4 273.8
Barren 112 1.4 206.3 254.6 Campbell 56 0.7 57.0 60.7 Woodford 23 0.3 68.1 88.0
Pike 109 1.4 141.2 180.0 Bourbon 54 0.7 213.9 269.6 Butler 22 0.3 141.3 171.3
Knox 108 1.4 269.6 340.8 Rockcastle 53 0.7 241.9 314.5 Nicholas 21 0.3 218.1 296.4
Callow ay 106 1.4 232.8 275.8 Simpson 53 0.7 251.1 293.1 Menifee 20 0.3 252.5 312.1
Harlan 106 1.4 322.5 390.2 Oldham 51 0.7 82.0 77.8 Livingston 19 0.2 143.9 205.0
Franklin 102 1.3 154.5 201.7 Wayne 51 0.7 199.1 249.4 Todd 19 0.2 135.6 154.5
Boyd 101 1.3 158.0 209.8 Bullitt 49 0.6 54.0 61.9 Edmonson 18 0.2 103.5 148.6
McCracken 101 1.3 114.1 155.0 Leslie 49 0.6 385.8 465.0 Pendleton 18 0.2 100.9 123.6
Henderson 95 1.2 164.0 205.4 Russell 49 0.6 223.9 276.5 Lyon 14 0.2 110.4 173.5
Taylor 94 1.2 308.8 370.1 Metcalfe 48 0.6 370.4 479.1 Meade 14 0.2 44.8 49.8
Daviess 88 1.1 72.8 88.3 Bath 47 0.6 305.7 381.3 Spencer 14 0.2 68.0 76.6
Adair 85 1.1 357.2 440.9 Breathitt 47 0.6 284.2 353.8 Ow sley 13 0.2 235.6 289.5
Clark 85 1.1 186.8 237.3 Grant 46 0.6 159.7 184.6 Ballard 12 0.2 132.1 149.0
Lincoln 85 1.1 298.3 348.8 Mason 46 0.6 211.6 267.6 Elliott 12 0.2 119.6 158.1
Muhlenberg 85 1.1 205.1 273.9 Morgan 46 0.6 294.5 345.9 Lee 12 0.2 152.2 182.4
Harrison 82 1.1 336.5 439.8 Caldw ell 44 0.6 274.3 350.1 Crittenden 11 0.1 81.9 119.7
Marshall 82 1.1 187.4 261.4 Green 44 0.6 285.6 397.8 Larue 11 0.1 61.7 78.0
Clay 81 1.0 346.3 390.1 Jessamine 43 0.6 74.4 82.1 McLean 11 0.1 92.3 116.1
Fleming 81 1.0 465.5 558.4 Ohio 42 0.5 138.1 172.3 Trimble 9 0.1 90.1 104.4
Row an 80 1.0 317.9 327.2 Union 42 0.5 231.7 282.3 Ow en 8 0.1 63.0 75.2
Grayson 79 1.0 241.7 301.7 Monroe 41 0.5 273.3 387.2 Robertson 7 0.1 209.7 324.8
Johnson 76 1.0 278.1 330.8 Estill 40 0.5 214.9 279.6 Carlisle 5 0.1 71.6 103.0
Boone 75 1.0 59.0 58.3 Knott 39 0.5 198.7 250.9 Gallatin 5 0.1 59.9 58.1
Greenup 74 0.9 154.2 206.2 Breckinridge 38 0.5 149.5 190.4 Hickman 5 0.1 73.2 108.1
Scott 74 0.9 144.8 137.1 Jackson 38 0.5 258.3 284.3 Hancock * - - -
Kenton 72 0.9 41.5 43.7 Henry 37 0.5 193.3 233.9 Fulton * - - -
* At least one but few er than five
- Percentage or rate suppressed to prevent disclosure of the value on w hich it w as based

83
Appendix B: Methods, Abbreviations, Definitions and Data
Methods
Data used for surveillance were received electronically. Hospital Discharge Data (HDD) files from the Kentucky Office of Health Policy are routinely received by the Kentucky Injury Prevention and Research Center (KIPRC) for surveillance purposes. These files now include both emergency department billing data as well as inpatient hospitalization billing data. The calendar year of 2015 marks the initial use of new ICD-10-CM coding on hospital medical records. This new coding began 10/2015, leaving the year with three quarters of the old coding and a final quarter with the new coding. General equivalency mappings (GEMs) have been used to translate ICD-9 coding to ICD-10 coding but further discussion and exploration is needed to ascertain the coding going forward.
Crude incidence rates were calculated for each injury type by dividing the number of injuries by 4,425,092, the most recent estimated population of Kentucky according to the Kentucky State Data Center, and then multiplying by 100,000. This figure represents the number of TBI, ABI, SCI or stroke that occurred per 100,000 residents of Kentucky. Age-adjusted rates were calculated using the Year 2000 Standard Population. Data analysis, including mapping, was performed using SAS Version 9.2.
Abbreviations
TBI – Traumatic Brain Injury
ABI – Acquired Brain Injury
SCI – Spinal Cord Injury
CNSI – Central Nervous System Injury
MVTC – Motor Vehicle Traffic Crash
ETS – Exposure to Toxic Substances
KIPRC – Kentucky Injury Prevention and Research Center

84
Identification of Cases
Traumatic brain injury case definition
The Centers for Disease Control and Prevention (CDC) have established standards for TBI case identification (CDC, 1995). Hospitals are currently using ICD-10 codes for injury coding. Definitions are being developed using the new ICD-10 coding. The following ICD-10 codes were used to identify TBI records:
Fracture of vault or base of skull: S02.0 - S02.1
Fractures of other specified skull and facial bones or unspecified fracture of skull: S02.8, S02.91
Intracranial injury, including concussion, cerebral edema, diffuse and focal traumatic brain injury, epidural/subdural/subarachnoid hemorrhage and unspecified intracranial injury: S06.0-S06.9
Crushing injury of skull: S07.1
Shaken infant syndrome: T74.4 If one or more of these codes was found in any of the diagnosis code fields in the HDD, the record was determined to be a TBI.
Acquired brain injury case definition
In addition to CDC-defined TBI, there are many brain injuries that have non-traumatic etiologies. These we have classified as ABI. Because these diagnoses are not included in the CDC definition of TBI, they have been linked and analyzed separately. These conditions were also identified by ICD-10 diagnosis codes, as follows:
Anoxia: G93, O29.1, O74.3, O75.4, O89.2, P21.0, P21.1, P21.9, T71, T751
Allergy/Anaphylaxis: T78.0, T78.2, T80.5, T80.6, T88.1, T88.6
Acute Medical Clinical Incidents: G00.0-G00.3, G00.8, G01, G07, G02.0, G02.1, G02.8, G04.2, G04.8, G05.0, G05.1, G06.2
Toxic Substances: G03.8, G03.9, G97.1, G97.2, G97.8, G97.9, N14.3, R29.1, T40.5, T41.0-T41.4, T42.3, T42.4, T42.6, T42.7, T45.5, T49.0, T51.0-T51.3, T51.8, T51.9, T56.1-T56.8, T57.0, T57.2, T57.3, T57.8, T58, T60.4, T61.9, T62.0-T62.2, T62.8, T62.9, T64, T65.0, T65.8, T65.9, T81.1, T88.2, T88.5

85
Anoxia includes but is not limited to:
brain damage related to hereditary and degenerative diseases of the central nervous system
nervous system complications (related to medical care)
drowning and nonfatal submersion
asphyxia
If one or more of these codes was found in any of the diagnosis code fields in the HDD, the record was classified as an ABI.
Spinal cord injury case definition
SCI was defined by the following ICD-10 diagnosis codes:
Concussion and edema of cervical/thoracic/lumbar and sacral spinal cord or other and unspecified injuries: S14.0, S14.1, S24.0, S24.1, S34.0, S34.1
Injury of cauda equina: S34.3
For this report, SCI records had to contain one of these codes in one of the first three diagnosis code fields in the HDD.
Stroke case definition
The following ICD-10 diagnosis codes (n-codes) were used for identifying stroke cases in HDD:
Hemorrhages (subarachnoid, intracerebral): I60, I61
Cerebral infarction: I63
Occlusion and stenosis of precerebral arteries (not resulting in cerebral infarction): I65
Transient cerebral ischemic attacks: G45 If one or more of these codes was found in any of the diagnosis code fields in the HDD, the record was determined to be a stroke related hospital visit. It is anticipated that this definition will be fine tuned in future reports.