CENTRAL MARKET/ TENDERLOIN Strategy
93
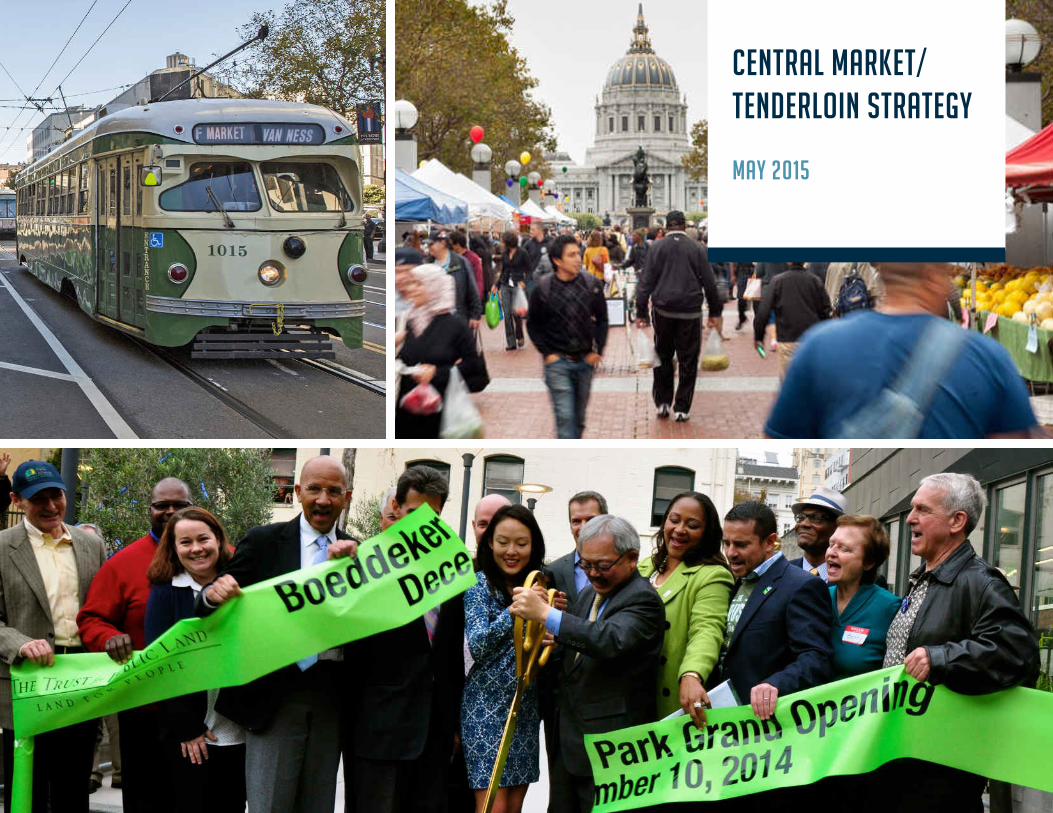
CENTRAL MARKET/ TENDERLOIN Strategy MAY 2015
Transcript of CENTRAL MARKET/ TENDERLOIN Strategy
CENTRAL MARKET/
TENDERLOIN Strategy
MAY 2015

Authors: Juan Carlos Cancino
Paul Chasan
Amy Cohen
Ellyn Parker
Alexander Quinn
Sarah Ritter
Kelly Rytel
Marlo Sandler
Joaquin Torres
Thank you to the Central Market Community Benefit District and the Tenderloin
Health Improvement Partnership for being key partners in the Strategy update
process.

ContentsExecutive Summary 4
Section 1. Introduction and Background 8
Section 2. Strategy Framework 12
Section 3. Strategy Approach - Action Zones, Game Changers andNeighborhood-Wide Objectives 16
Section 4.Neighborhood Public Realm Projects 28
Section 5.Strategy Implementation 32
Appendices 37

Executive Summary

SECTION 1: INTRODUCTION AND
BACKGROUND
In late 2011, under the leadership of Mayor
Ed Lee, the City and County of San Francisco
launched the Central Market Economic Strategy
(CMES). An anchor of the Mayor’s Invest in Neigh-
borhoods initiative, an interagency partnership
managed by the Office of Economic and Workforce
Development (OEWD) to strengthen and revitalize
neighborhood commercial districts, the goal of the
CMES was to coordinate public and private efforts
and investment to revitalize the long-neglected
stretch of Market Street between Fifth and Van
Ness.
Since the original CMES was launched, it has
effectively helped coordinate public and private
investment along Central Market, initiating a trans-
formation that has surpassed all expectations.
In 2014, OEWD, the Planning Department, and
the Office of the City Administrator began a robust,
year-long process to update the CMES in order to
deepen and sustain the revitalization on Market
Street, and expand its focus to the Tenderloin and
Sixth Street. Towards the Mayor’s goal of shared
prosperity, the update process set out to solve
three very different but concurrent urban planning
questions: 1) What interventions are needed to
create a healthy, mixed-income neighborhood
that offers safety and well-being to all people
who live, work and visit – especially a fragile
low-income population that calls this area home?
2) How can San Francisco improve quality of life in
a large area with such deeply ingrained challenges
in a matter of years, not decades? and 3) How can
the updated strategy be implemented in a way that
promotes coordination and alignment among an
ever-expanding list of public and private stakehold-
ers looking to contribute?
The first section of this document details the
progress along with the challenges still present in
the neighborhood. It draws from the community
feedback collected by the City in 2013 and data
analysis, stakeholder feedback and other planning
completed in 2014 to better understand the current
neighborhood conditions. These community
feedback and data collection efforts then informed
the update process and development of this new
Central Market/Tenderloin Strategy (Strategy).
Executive Summary
WHO SHOULD READ THE STRATEGYThe Strategy was written for anyone who lives, works, or is interested in getting involved in Central Market and the Tenderloin. With an increasing amount of energy and resources focused on the neighborhood, the Strategy is meant to help a multitude of public and private stakeholders work together towards a common goal.
STRATEGY COMPONENTSIn order to incorporate a growing number of public and private stakeholders with diverse skill sets, resources, and needs the Strategy contains multiple layers and entry points for participation. The Executive Summary provides a high-level overview of the Strategy in order to breakdown the various Strategy components and to help everyone identify how they can join this collective neighborhood effort. Full analysis, explanation of the development process, and description of the specific proposed actions may be found in the full Strategy document and appendices.
HOW TO USE THE STRATEGYMost importantly, this Strategy is meant for action. For instance: it can be used by an employer seeking employee volunteer projects; a small business looking to expand in the neighborhood; a non-profit undertaking placemaking activities; or philanthropic entities seeking to make an impactful investment. It will also be used by the City to ensure coordination among agencies and with outside partners. Section Three provides a list of specific activities and opportunities for involvement, which are divided into two types:
» Place-specific activities in nine “Action Zones.” If you are interested in activities that improve specific places, these are the items to focus on.
» Neighborhood-Wide activities address issues that affect the neighborhood as a whole. If you are interested in issues such as housing, safety, small businesses, or arts, these are the items to focus on.
Once you determine which activities you are interested in, each item is assigned to a City Subcommittee responsible for overseeing its implementation. City Subcom mittee contact information is available at investsf.org/neighborhoods/central-market.
5Central Market / Tenderloin Strategy

SECTION 3: STRATEGY APPROACH -
ACTION ZONES, GAME CHANGERS AND
NEIGHBORHOOD-WIDE OBJECTIVES
Once the Strategy Framework was solidified,
an approach was required to translate its three
priorities into on-the-ground actions. Following the
work of community partners such as the Tenderloin
Health Improvement Partnership (TLHIP) and
based on significant community feedback, the
resulting approach identifies nine Action Zones
with place-specific Game Changers that will yield
visible, near-term improvements:
» Action Zone A (Eddy and Leavenworth)
» Action Zone B (Eddy and Jones)
» Action Zone C (Golden Gate and Leavenworth)
» Action Zone D (Turk and Taylor)
» Action Zone E (Market between 5th and 7th)
» Action Zone G (UN Plaza and Civic
Center Plaza)
» Action Zone G (Sixth Street)
» Action Zone H (Larkin Street)
» Action Zone I (Market and Van Ness)
The Strategy also proposes a number of Neighbor-
hood-Wide Objectives, interventions that are not
zone-specific but will support success in the Action
Zones. These proposed interventions are organized
by the following issue areas:
» Affordable housing
» Arts organization support
» Cleanliness
» Job opportunities
» Mental health
» Nonprofit retention
» Safety
» Small business support
» Streetscape improvements
Action Zone Map
Community Impact Framework
SECTION 2: STRATEGY FRAMEWORK
This Strategy proposes a new framework of
activities that together will help achieve the goal
of a healthy, mixed-income neighborhood. This
includes: a) activities that provide resources to
take care of low-income people; b) activities that
bring in new economic investment to the area;
and c) activities that ensure clean and safe shared
spaces. The Strategy combines and coordinates
these activities, prioritizing those that fall within
more than one category and that are intentionally
inclusive of the low-income community.
This Strategy further holds that the economic and
cleanliness/safety interventions must be crafted
intentionally to benefit and include low-income
residents. Jobs for low-income residents will not
simply materialize because new tech companies
locate in the area. Unless deliberately inclusive,
programming that makes a park or a plaza cleaner
and safer may also exclude low-income residents.
I
H
G
F
E
D
C
B
A
GEARY STREET
GO
UG
H S
T.
PO
WE
LL
ST
RE
ET
HO
WA
RD
STR
EET
5TH
STREET
VA
N N
ES
S A
VE
NU
E
MA
RK
ET S
TR
EET
MIN
T P
LZ
MIN
T S
T
MARY S
T
06TH S
T
CY
RIL
MA
GN
IN S
T
LE
AV
EN
WO
RT
H S
T
JO
NE
S S
T
SH
AN
NO
N S
T
TA
YLO
R S
T
LA
RK
IN S
T
MA
SO
N S
T
PO
LK
ST
HY
DE
ST
REDWOOD ST
ELM ST
ALICE B TOKLAS PL
12TH ST
UNITED NATIONS PLZ
FULTON ST
MYRTLE ST OFARRELL ST
OLIVE ST
HAYES ST
MCALLISTER ST
EDDY ST
WILLOW ST
TURK ST
GROVE ST
GOLDEN GATE AVE
FELL ST
JESSIE
ST
GRACE S
T
WASHBURN S
T
11TH S
T
DR
CA
RLT
ON
B G
OO
DLE
TT
PL
SO
UT
H V
AN
NE
SS
AV
E
NATO
MA S
T
STEVENSO
N S
T
0 400 800
6 CENTRAL MARKET / TENDERLOIN STRATEGY Executive Summary

SECTION 4: NEIGHBORHOOD PUBLIC
REALM PROJECTS
A key element to updating the Strategy is a survey
of the physical conditions of public spaces.
Information collected from numerous City agencies
and community stakeholders has led to further
exploration of a more comprehensive, longer-term
approach to streetscape and public realm improve-
ments that will enhance quality of life and increase
inclusiveness in the neighborhood. The full extent
of these activities is described in the supplemental
Neighborhood Public Realm Vision provided in
Appendix G.
SECTION 5: STRATEGY IMPLEMENTATION
The previous sections describe what should be
done to make Central Market and the Tenderloin
a diverse, healthy, and sustainable mixed-income
neighborhood. But to be successful, this Strategy
must also delineate how those actions will be
implemented. This final section outlines four tools
for implementation.
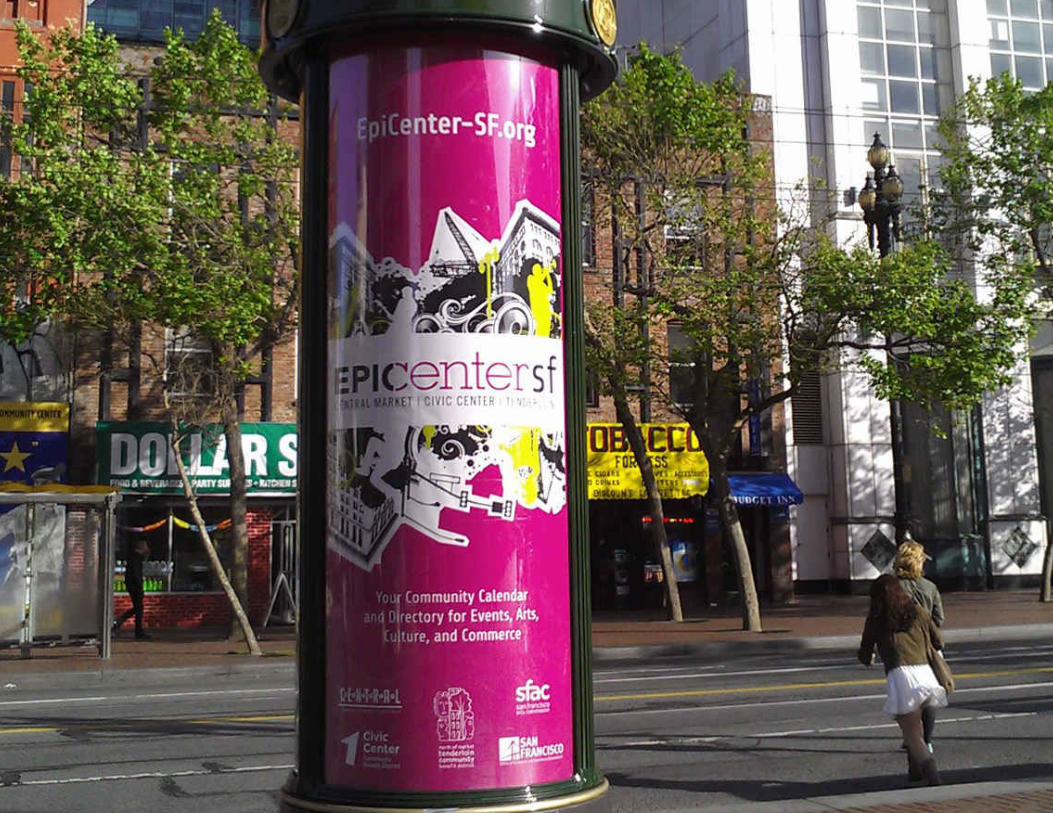
» Epicenter SF: An online clearinghouse for
neighborhood information can be found at
epicenter-sf.org.
» City Subcommittees: Designated City repre-
sentatives responsible for the implementation,
evaluation, and external coordination of specific
components of this Strategy.
» Inclusive Programming Organization: The
proposed organization would partner with
neighborhood organizations and businesses to
host indoor and outdoor programs that engage a
wide range of residents, employees and visitors,
and that prioritize the inclusion of low-income
community members.
» Data Collection and Publication: Regularly
published Report Cards will document
progress made in implementing the Strategy’s
proposed actions. The City subcommittees
will be responsible for setting and reporting
on programmatic progress. OEWD and the
Planning Department, with assistance from the
Department of Public Health, will also collect
secondary data to track social and economic
change in the neighborhood and in the Action
Zones over time.
APPENDICES
Supplemental information has been included in the
appendices. The appendices include more detailed
analysis (e.g. Appendix F: Baseline Neighbor-
hood Conditions) and description of the Strategy
development process (e.g. Appendix C: Community
Engagement and Outreach). They also include
materials that will be useful to reference during the
implementation of the Strategy (e.g. Appendix A:
Examples of Inclusive Programming and Appendix
G: Neighborhood Public Realm Vision).
» Appendix A: Examples of Inclusive
Programming, Activities and Business Types
» Appendix B: Tenderloin Health Improvement
Partnership Overview
» Appendix C: Community Engagement and
Outreach
» Appendix D: Implementation Tools and Sub-
committee Assignments
» Appendix E: Neighborhood Report Card
Template
» Appendix F: Baseline Neighborhood Conditions
» Employment
» Housing
» Demographics
» Real Estate
» Quality of Life
» Appendix G: Neighborhood Public Realm Vision
Tools for Implementation
7Central Market / Tenderloin Strategy

section 1. INTRODUCTION AND BACKGROUND

In late 2011, under the leadership of Mayor
Ed Lee, the City and County of San Francisco
launched the Central Market Economic Strategy
(CMES). An anchor of the Mayor’s Invest in Neigh-
borhoods program, an interagency partnership to
strengthen and revitalize neighborhood commercial
districts, the goal of the CMES was to coordinate
public and private efforts and investment to revital-
ize the long-neglected stretch of Market Street
between Fifth and Van Ness. City agencies then
proceeded to engage private stakeholders – includ-
ing community-based nonprofit organizations, arts
groups, property owners, and small businesses – to
direct attention to the corridor which had been
neglected in the last economic boom despite its
central location, beautiful historic buildings, and
long-established arts venues. These stakeholders,
soon joined by new tech companies and real
estate developers, implemented programs focused
on cleaning, safety, sidewalk activation, business
attraction, and arts development. Most notable
was the payroll expense tax exclusion offered to
growing companies locating along Central Market
and in the Tenderloin. This program led to the
arrival of Twitter headquarters – and the subse-
quent emergence of the area as one of the region’s
major innovation hubs – and helped generate
considerable momentum and new resources for
neighborhood revitalization.
INTRODUCTION AND BACKGROUNDCentral Market / Tenderloin Strategy Focus Area
MAR
KET
STREE
T
9

By all accounts, the transformation along Central
Market has been faster and more successful than
most imagined possible. Since 2011, over twelve
thousand new employees have come to work
in the Central Market neighborhood at 17 newly
located technology companies, two co-working
facilities, and two venture capital firms. More than
5,600 housing units are now under construction or
approved for the area, 20% of these permanently
affordable, and another 4,000 units are proposed.
Commercial office vacancy has decreased more
than fourfold from 25% to 4%, there are more
than 30 new storefront businesses and 13 new
arts venues have opened in the neighborhood. The
City and its partners helped relocate ten of these
new venues from outside or elsewhere within the
neighborhood in order to help them acquire stable,
long-term real estate.
2013 COMMUNITY FEEDBACK
In 2013, the City conducted an evaluation to
assess the Central Market Economic Strategy’s
impact on the area. Residents, small businesses,
social service and housing organizations, and arts
groups were surveyed about the changes occurring.
These stakeholders reported enthusiasm for the
progress along Central Market, the focus of political
leadership on the area, and the new resources and
noteworthy projects underway.
However, the evaluation also indicated ongoing
frustration with the lack of safety, cleanliness, and
positive activity on sidewalks and in plazas, as
well as a desire for greater support in caring for
the mentally ill. Neighborhood residents thought
that the arrival of tech companies and real estate
investment to Market Street should also lead to a
cleaner, safer neighborhood for the primarily low-
income population living north in the Tenderloin
and south on Sixth Street (throughout the rest of
the document these two areas adjacent to Market
Street are referred to interchangeably). They hoped
for better parks and infrastructure, and for new
businesses that would increase the availability of
healthy food, jobs, and affordable quality goods.
While the initial CMES approached Market Street
very much as a core downtown thoroughfare, it
became increasingly clear that making meaningful,
sustainable improvements benefiting neighborhood
residents would require a different approach.
2014 CONDITIONS
Based on this feedback, and aligned with the
Mayor’s focus on shared prosperity, in 2014 the
Office of Economic and Workforce Development’s
(OEWD) Invest in Neighborhoods team, the Plan-
ning Department and the Office of the City Admin-
istrator began a robust, year-long process to update
the CMES. The 2014 update process began by
gathering a variety of data to better understand
the current economic, demographic, and physical
make-up of the neighborhood and to establish a
baseline for tracking future progress. The data
confirmed the many challenges that Central Market
and Tenderloin residents continue to face.
Central Market forms the spine of a very unique
and challenged residential neighborhood that has
long served people in need. A high concentration
of residential hotels and social service facilities pop-
ulate both sides of Market Street. According to the
most recent data, detailed in Appendix F, nearly a
third of households in the neighborhood make less
than $15,000 a year; crime rates are three times
higher than the city average; and almost half of all
the City’s homeless population lives in District 6,
which includes Central Market and the Tenderloin.
Many of the area’s residents suffer from addiction
and severe mental health issues and the streets in
the neighborhood are some of the most dangerous
for pedestrians citywide.
But despite its challenges, the neighborhood
possesses many unique assets. There are approxi-
mately 4,600 families living in the area and twice
as many children per square mile than the city
as a whole; the density of seniors is even higher.
A large cohort of Asian and Latino immigrants
own small businesses that create an economic
backbone for the neighborhood. The area also
boasts strong coalitions of cultural institutions,
health and social service organizations, and afford-
able housing providers. Many of these community
organizations have roots dating back more than
thirty years, and they succeeded in creating policies
that have preserved much of the building stock in
this part of the City for low-income housing and
social services. Three-quarters of the Study Area’s
housing units are permanently affordable (24%
compared with 4% citywide) or rent stabilized
(54%) – substantially higher than other neighbor-
hoods in San Francisco. Due to this fact, and
because the area’s large multi-family buildings
are generally less prone to speculative real estate
activity, this neighborhood has seen no increase in
no-fault evictions between 2011 and 2013, while
10 CENTRAL MARKET / TENDERLOIN STRATEGY Section 1. INTRODUCTION AND BACKGROUND

the rest of the City saw the number increase by
more than two and a half times. These conditions
create a unique foundation on which a diverse and
healthy low-income community can grow, and
community-driven efforts to improve safety, access
to healthy food, and parks continue to emerge from
this neighborhood.
In 2014, new developers, tech companies, small
businesses and arts groups continued to move in,
eager to contribute to and invest in the neighbor-
hood. An increasing number of improvement proj-
ects were also planned for the physical landscape.
This confluence of energy, creativity and resources
presented an opportunity to coordinate and lever-
age the efforts of public and private actors to better
serve the neighborhood.
STRATEGY UPDATE
The 2014 update process documented the many
public realm improvements planned or proposed
for the area; engaged additional City agencies
through the convening of a Central Market/Tender-
loin Interagency Working Group; and conducted
extensive community engagement including
participation in numerous community planning
processes, hosting or presenting at dozens of
meetings, and conducting new focus groups and
surveys. Appendix C further details these com-
munity engagement efforts.
This update process led to the inescapable
conclusion that Central Market and the Tenderloin
should be treated as a neighborhood, not a
thruway. These areas are interdependent, face
similar challenges, and have long deserved a
better quality of life for their residents. They have
also become both a literal and symbolic center of
a city struggling with a growing economic divide.
Residents and stakeholders have voiced a resound-
ing commitment to ensuring that the area remains
affordable and supportive of San Franciscans with
substantial needs. There is optimism that the
area’s unique assets discussed above provide the
opportunity to revitalize the neighborhood while
ensuring low-income residents, including children,
families, and immigrant business owners, can
benefit from cleaner and safer streets, quality
businesses, recreation, and other opportunities
alongside newcomers.
The update process has culminated in the creation
of this new Central Market/Tenderloin Strategy
(Strategy) in 2015. To deepen and sustain the
revitalization on Market Street, this Strategy is
expanded to include priority areas along Sixth
Street and in the heart of the Tenderloin. The new
Strategy captures important work underway as well
as identifies new interventions that are planned or
needed, as determined during the update process.
It also creates a much-needed structure for imple-
mentation that allows for increased coordination
among the growing number of diverse public and
private stakeholders, now and into the future. The
goal is to harness new investment in the area to
create a diverse, healthy, mixed-income neighbor-
hood that offers safety and well-being to all who
live, work and visit the area.
Tú Lan Updated Storefront
11

section 2. STRATEGY FRAMEWORK

STRATEGY FRAMEWORK
This Strategy introduces a new framework to take
on this ambitious goal. The framework proposes
that to create a diverse, healthy mixed-income
neighborhood, it is necessary to select, combine
and coordinate activities and interventions that fall
within three categories:
(1) Providing resources to take care of the low-
income community;
(2) Creating new economic opportunities; and
(3) Promoting clean and safe shared spaces.
Goal: A diverse, healthy, mixed-
income neighborhood that offers
safety and well-being to all who live,
work and visit Central Market and the
Tenderloin.
Community Impact Framework
13
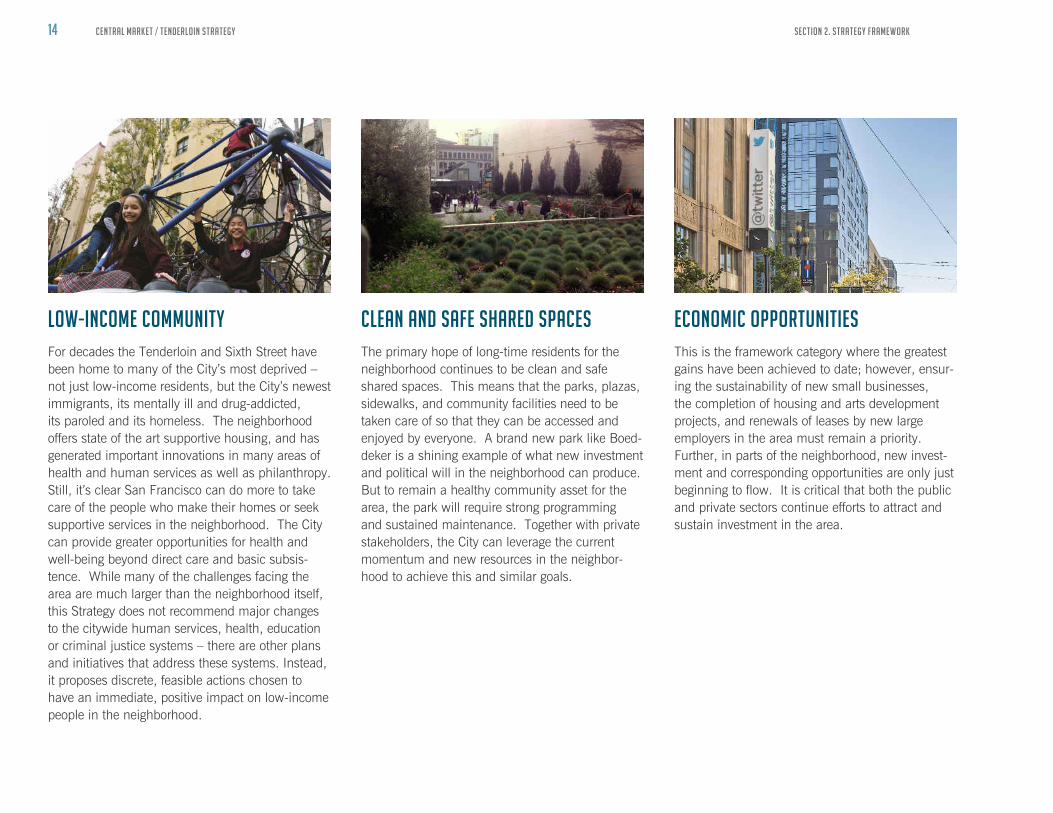
LOW-INCOME COMMUNITY
For decades the Tenderloin and Sixth Street have
been home to many of the City’s most deprived –
not just low-income residents, but the City’s newest
immigrants, its mentally ill and drug-addicted,
its paroled and its homeless. The neighborhood
offers state of the art supportive housing, and has
generated important innovations in many areas of
health and human services as well as philanthropy.
Still, it’s clear San Francisco can do more to take
care of the people who make their homes or seek
supportive services in the neighborhood. The City
can provide greater opportunities for health and
well-being beyond direct care and basic subsis-
tence. While many of the challenges facing the
area are much larger than the neighborhood itself,
this Strategy does not recommend major changes
to the citywide human services, health, education
or criminal justice systems – there are other plans
and initiatives that address these systems. Instead,
it proposes discrete, feasible actions chosen to
have an immediate, positive impact on low-income
people in the neighborhood.
CLEAN AND SAFE SHARED SPACES
The primary hope of long-time residents for the
neighborhood continues to be clean and safe
shared spaces. This means that the parks, plazas,
sidewalks, and community facilities need to be
taken care of so that they can be accessed and
enjoyed by everyone. A brand new park like Boed-
deker is a shining example of what new investment
and political will in the neighborhood can produce.
But to remain a healthy community asset for the
area, the park will require strong programming
and sustained maintenance. Together with private
stakeholders, the City can leverage the current
momentum and new resources in the neighbor-
hood to achieve this and similar goals.
ECONOMIC OPPORTUNITIES
This is the framework category where the greatest
gains have been achieved to date; however, ensur-
ing the sustainability of new small businesses,
the completion of housing and arts development
projects, and renewals of leases by new large
employers in the area must remain a priority.
Further, in parts of the neighborhood, new invest-
ment and corresponding opportunities are only just
beginning to flow. It is critical that both the public
and private sectors continue efforts to attract and
sustain investment in the area.
14 CENTRAL MARKET / TENDERLOIN STRATEGY Section 2. STRATEGY FRAMEWORK
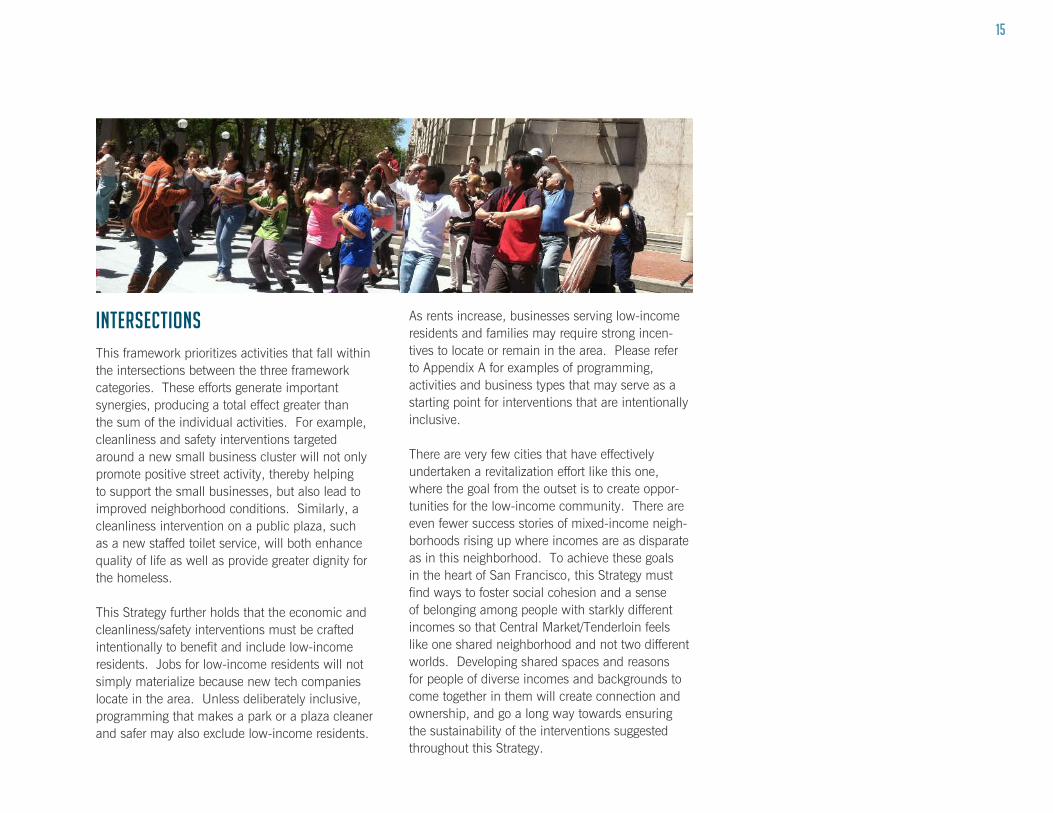
INTERSECTIONS
This framework prioritizes activities that fall within
the intersections between the three framework
categories. These efforts generate important
synergies, producing a total effect greater than
the sum of the individual activities. For example,
cleanliness and safety interventions targeted
around a new small business cluster will not only
promote positive street activity, thereby helping
to support the small businesses, but also lead to
improved neighborhood conditions. Similarly, a
cleanliness intervention on a public plaza, such
as a new staffed toilet service, will both enhance
quality of life as well as provide greater dignity for
the homeless.
This Strategy further holds that the economic and
cleanliness/safety interventions must be crafted
intentionally to benefit and include low-income
residents. Jobs for low-income residents will not
simply materialize because new tech companies
locate in the area. Unless deliberately inclusive,
programming that makes a park or a plaza cleaner
and safer may also exclude low-income residents.
As rents increase, businesses serving low-income
residents and families may require strong incen-
tives to locate or remain in the area. Please refer
to Appendix A for examples of programming,
activities and business types that may serve as a
starting point for interventions that are intentionally
inclusive.
There are very few cities that have effectively
undertaken a revitalization effort like this one,
where the goal from the outset is to create oppor-
tunities for the low-income community. There are
even fewer success stories of mixed-income neigh-
borhoods rising up where incomes are as disparate
as in this neighborhood. To achieve these goals
in the heart of San Francisco, this Strategy must
find ways to foster social cohesion and a sense
of belonging among people with starkly different
incomes so that Central Market/Tenderloin feels
like one shared neighborhood and not two different
worlds. Developing shared spaces and reasons
for people of diverse incomes and backgrounds to
come together in them will create connection and
ownership, and go a long way towards ensuring
the sustainability of the interventions suggested
throughout this Strategy.
15

Section 3. STRATEGY APPROACH - ACTION
ZONES, GAME CHANGERS, AND
NEIGHBORHOOD-WIDE OBJECTIVES
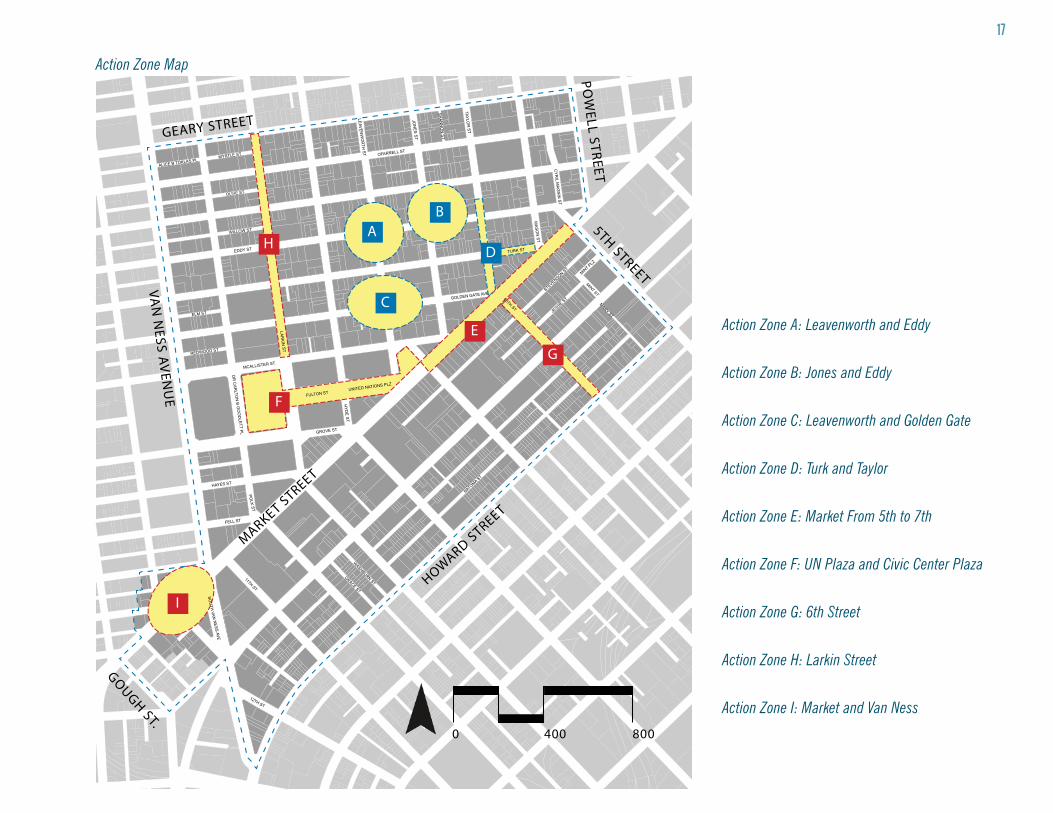
Action Zone A: Leavenworth and Eddy
Action Zone B: Jones and Eddy
Action Zone C: Leavenworth and Golden Gate
Action Zone D: Turk and Taylor
Action Zone E: Market From 5th to 7th
Action Zone F: UN Plaza and Civic Center Plaza
Action Zone G: 6th Street
Action Zone H: Larkin Street
Action Zone I: Market and Van Ness
Action Zone Map
I
H
G
F
E
D
C
B
A
GEARY STREET
GO
UG
H S
T.
PO
WE
LL
ST
RE
ET
HO
WA
RD
STR
EET
5TH
STREET
VA
N N
ES
S A
VE
NU
E
MA
RK
ET S
TR
EET
MIN
T P
LZ
MIN
T S
T
MARY S
T
06TH S
T
CY
RIL
MA
GN
IN S
T
LE
AV
EN
WO
RT
H S
T
JO
NE
S S
T
SH
AN
NO
N S
T
TA
YLO
R S
T
LA
RK
IN S
T
MA
SO
N S
T
PO
LK
ST
HY
DE
ST
REDWOOD ST
ELM ST
ALICE B TOKLAS PL
12TH ST
UNITED NATIONS PLZ
FULTON ST
MYRTLE ST OFARRELL ST
OLIVE ST
HAYES ST
MCALLISTER ST
EDDY ST
WILLOW ST
TURK ST
GROVE ST
GOLDEN GATE AVE
FELL ST
JESSIE
ST
GRACE S
T
WASHBURN S
T
11TH S
T
DR
CA
RLT
ON
B G
OO
DLE
TT
PL
SO
UT
H V
AN
NE
SS
AV
E
NATO
MA S
T
STEVENSO
N S
T
0 400 800
17

STRATEGY APPROACH - ACTION ZONEs, GAME CHANGERS, AND
NEIGHBORHOOD-WIDE OBJECTIVES
Once the Strategy Framework was solidified, the
next step was to translate its three priorities into on-
the-ground actions. The resulting approach was
informed, in part, by the Invest in Neighborhoods
initiative, which has effectively used customized,
place-based techniques to support commercial
corridors across the City. The Strategy’s approach
was also informed by significant community
feedback and the work of community partners such
as the Tenderloin Health Improvement Partnership
(TLHIP) – a cross-sector initiative led by the Saint
Francis Hospital Foundation, aimed at improving
community health, safety and well-being in the
Tenderloin. Appendix B includes more information
about TLHIP and Appendix C describes the com-
munity engagement process.
The resulting strategy approach identifies nine
Action Zones, prioritizing areas with both continued
challenges and near-term opportunities. The
approach then proposes place-specific Game
Changers for each of the nine Action Zones. These
place-specific, tangible interventions have the
potential to align, leverage and coordinate activity
to create a sense of action and momentum within
a relatively short (two to three year) period. Some
of the Game Changers represent activities already
underway; others are newly proposed. As the
selected zones improve, additional Actions Zones
may be designated.
This approach also proposes a number of
Neighborhood-Wide Objectives that are not zone-
specific but necessary to support success within
the Action Zones. These objectives include a set of
near-, mid- and long-term physical improvements
for the entire neighborhood, as well as Action Items
that address neighborhood-wide issues around
affordable housing, nonprofit and small business
retention, cleanliness and safety. For example,
while cleanliness and safety might ordinarily be
considered very place-specific, a coordinated
cleaning and safety team should be developed
that can serve the entire neighborhood and move
from Action Zone to Action Zone, or elsewhere, as
needed.
Each proposed activity, whether Game Changer or
Neighborhood-Wide Objective, fits into one or more
of the three framework categories: Low-Income
Community, Clean and Safe Shared Spaces,
and Economic Opportunities. Many fall within
more than one category, fostering the important
synergies described above. The remainder of
this section contains the Game Changers and the
Neighborhood-Wide Objectives in matrix form. The
matrix includes a column with icons denoting the
framework category. It also includes a column
with the heading City Subcommittee. These City
Subcommittees are an integral part of this Strat-
egy’s implementation toolkit that is described below
in Section 5.
18 CENTRAL MARKET / TENDERLOIN STRATEGY Section 3. STRATEGY APPROACH - ACTION ZONE GAME CHANGERS AND NEIGHBORHOOD-WIDE OBJECTIVES

Action Zones and Game Changers
Game Changers Action Items City Subcommittee Framework Categories
Action Zone A (Leavenworth and Eddy)
Tenderloin Museum becomes a visitor destination and a hub for community activity.
Ensure Museum completes construction, develops engaging programs for a variety of participants, and is marketed as both a tourist destination and a centerpiece of community activity in the Tenderloin.
Arts and Culture
A cluster of neighborhood-serving businesses develops around the Tenderloin Museum.
Engage landlords and attract targeted small businesses to fill vacancies and provide assistance to existing neighborhood-serving retailers to retain them.
Affordable and Healthy Goods and Services
Action Zone B (Jones and Eddy)
Boeddeker reopens as a clean and safe space.
Reopen Boeddeker Park.
Maintain Park’s scheduled hours.
Implement initial cleaning and safety services in and around the park perimeter through partnerships with Rec and Park, SFPD and Office of Civic Engagement & Immigrant Affairs (OCEIA).
Identify future safety and cleaning resources.
Boeddeker Park
Boeddeker offers regular and special event programming.
Populate events calendar with diverse neighborhood events and activities daily.
Identify future programming resources if needed.
Boeddeker Park
Action Zone C (Leavenworth and Golden Gate)
A zone of well-maintained storefronts of community-serving nonprofits is accompanied by efforts to promote positive, healthy activity on the sidewalk.
Align/modify existing programs (SF Shines, Mayor’s Office of Housing and Community Development (MOHCD) resources and technical assistance) to incentivize physical improvements for nonprofit storefronts/buildings and increased stewardship of surrounding sidewalks. This includes improvements, tenanting, co-location or programming that encourages sidewalk activation.
Affordable and Healthy Goods and Services
Economic
Opportunities
Low Income
Community
Clean + Safe
Shared Spaces
Action Zone A: Tenderloin Museum
Action Zone B: Boeddeker Park
Action Zone C: St. Anthony’s Kitchen
19

Game Changers (cont’d)
Game Changers Action Items City Subcommittee Framework Categories
Action Zone D (Turk and Taylor)
A cluster of neighborhood-serving as well as entertainment-oriented businesses develops around the arts venues at Turk/Taylor.
Engage landlords and attract targeted small businesses to fill vacancies and provide assistance to existing neighborhood-serving retailers to retain them.
Affordable and Healthy Goods and Services
New arts venues join existing venues to create a vibrant hub of cultural activity both during the day and nighttime at Turk/Taylor.
Support openings of PianoFight and Counterpulse and provide continued support to nearby venues. Leverage outside resources to create programming.
Arts and Culture
New mixed-use development and existing buildings implement design strategies that contribute to a safe and active Turk and Taylor Streets.
Planning Department and Public Works continue to work closely with developers to ensure ground floor transparency and sidewalk improvements that contribute to safe, active and inviting pedestrian experience.
Convert first blocks of Turk and Mason to 2-way, as part of the Better Market Street project.
Public Realm
Action Zone E (Market from 5th-7th)
Sustained sidewalk activation projects along Market from 5th-7th that promote positive day and nighttime activity are implemented while longer-term development progresses.
Continue to support and promote Make Your Market program, which offers streamlined permitting for vendors, musicians and artists on the sidewalks of Central Market.
Continue to pursue design and installation of Living Innovation Zones in partnership with CBD’s, local non-profits, companies, and other property owners.
Engage local stakeholders in Market Street Prototyping festival to identify which installations and activation ideas best serve the residents, businesses and local organizations along this stretch of Central Market.
City agencies offer support to Central Market CBD around temporary projects such as the arts barricade and evening arts walks.
Public Realm
Action Zone D: Center for New Music
Action Zone E: The Hall
20 CENTRAL MARKET / TENDERLOIN STRATEGY Section 3. STRATEGY APPROACH - ACTION ZONE GAME CHANGERS AND NEIGHBORHOOD-WIDE OBJECTIVES

Game Changers (cont’d)
Game Changers Action Items City Subcommittee Framework Categories
Action Zone F (UN Plaza and Civic Center Plaza)
Civic Center Playground renovation is a catalyst for additional investment in the programming and stewardship of Civic Center Plaza.
Complete playground renovation project and reopen it to the community.
Planning assigns a Civic Center public realm planner to coordinate medium- and long-term improvements to both plazas and the larger area.
Hire at minimum 1 Full Time Employee to head up programming/stewardship/safety coordina-tion among the plazas and on Fulton Street. Recommend Full Time Employee be housed at Rec and Park.
Increase programming/stewardship/safety capacity of Civic Center CBD and develop a partnership between the CBD and Rec and Park that augments programming at Civic Center Plaza initially and explores partnerships that also augment stewardship of UN Plaza and Fulton Street.
UN Plaza and Civic Center Plaza
UN Plaza is activated with programming and art installations so it can become a cleaner, safer and inclusive community asset every day.
Initial steps are taken towards linking the two plazas and activating/programming them as one vibrant civic space.
Action Zone G (6th Street)
A cluster of neighborhood-and employee-serving businesses develops around the Sixth Street Safety Hub.
Engage landlords and attract targeted small businesses to fill vacancies and provide assistance to existing neighborhood-serving retailers to retain them.
Affordable and Healthy Goods and Services
Sixth Street Safety Hub becomes a visible hub of community-serving activity.
Maintain and augment public safety coordination and services, and other complimentary programming such as cleaning coordination out of the Safety Hub in order to maximize the site as a community asset.
Sidewalk Safety and Cleaning
Action Zone F: UN Plaza Night Market
Action Zone G: Sixth Street Safety Hub
21

Game Changers (cont’d)
Game Changers Action Items City Subcommittee Framework Categories
Action Zone H (Larkin Street)
Enhance visibility of Little Saigon as a Vietnamese-oriented cultural district.
Establish and support development of Little Saigon merchants association and the projects it pursues to promote the corridor, and provide focused business retention services to Larkin St. businesses.
Affordable and Healthy Goods and Services
Create physical improvements that enhance the physical conditions of Larkin St. and also facilitate the connection to Market St.
Convene partnerships among City agencies, cultural institutions (Asian Art Museum) and local merchants to explore improvements to the pedestrian experience such as lighting, wayfinding and other low-cost place making opportunities.
Identify new design opportunities through the Civic Center public realm planning process.
Public Realm
Action Zone I (Market and Van Ness)
A cluster of new resident and employee-serving businesses develops around new residential projects.
Engage landlords and attract targeted small businesses to fill vacancies and provide assistance to existing neighborhood-serving retailers to retain them.
Affordable and Healthy Goods and Services
New residential developments at 12th and Market progress with designs that will contribute to an improved sidewalk experience.
Planning Department and Public Works continue to work closely with various developers and design teams to ensure ground floor transparency and sidewalk improvements that contribute to active and inviting pedestrian experience.
Planning Department begins urban design work on Brady Block open space.
Public Realm Action Zone H: Larkin Street Storefronts
Action Zone I: 100 Van Ness
22 CENTRAL MARKET / TENDERLOIN STRATEGY Section 3. STRATEGY APPROACH - ACTION ZONE GAME CHANGERS AND NEIGHBORHOOD-WIDE OBJECTIVES

Neighborhood-Wide Objectives
Action Items City Subcommittees Framework Categories
Affordable Housing
Ensure completion of pipeline (proposed and approved) affordable, public and market rate with on-site Below Market Rate (BMR) units projects in the neighborhood.
Housing Quality and Access
Develop a pipeline for future acquisition opportunities that aligns with new City resources for new affordable, workforce, small site, or mixed-income housing development by identifying empty lots, vacant/underutilized buildings, poorly maintained private Single Room Occupany units (SRO), apartment buildings, or tourist hotels in the Tenderloin.
Housing Quality and Access
Pursue additional daytime services for the homeless - in any part of the City - to help mitigate the negative sidewalk impacts of free food programs, personal sanitation, personal storage, etc. in the neighborhood.
Sidewalk Safety and Cleaning
Conduct proactive outreach in the neighborhood by the Homeless Outreach Team in coordination with Office of Civic Engagement & Immigrant Affairs, Department of Public Works, San Francisco Police Department and other City on-the-ground resources as well as with Project Homeless Connect and private resources for homeless individuals and families.
Housing Quality and Access
Develop a new transitional housing site that will serve more homeless APD clients and improve their transition into permanent housing placements.
Housing Quality and Access
Augment /streamline and incentivize voluntary programs to provide training and technical assistance to SRO operators on health, housing, fire codes, and operations best practices.
Housing Quality and Access
Continue efforts to expand baseline coordinated assessment infrastructure in order to place all homeless individuals (not just chronic) in appropriate housing depending on supportive service needs and to free up units for new clients, if possible. This includes maintaining an up to date list of SRO buildings for use by different City programs.
Housing Quality and Access
Designate a psychiatric social worker to be available on call to health inspectors inspecting private SRO buildings.
Housing Quality and Access
Explore additional recommendations supported by the Department of Public Health (DPH) Health Impact Assessment including: synthesizing enforcement efforts and data coordination among Department of Public Works (DPH), Department of Building Inspection (DBI), Planning, City Attorney, Human Services Agency (HSA) and Fire; dedicated fund for physical improvements to SROs; other incentives to enhance SRO operations; mandate a minimum standard of care for SRO operations.
Housing Quality and Access
Economic
Opportunities
Low Income
Community
Clean + Safe
Shared Spaces
23

Neighborhood Wide Objectives (cont’d)
Action Items Subcommittee Framework Categories
Arts Organization Support
Support neighborhood arts programming that attracts more residents, workers and visitors to existing and new arts venues. Arts and Culture
Continue providing real estate development and retention services to arts organizations in the neighborhood or those wanting to move to the neighborhood.
Arts and Culture
Provide ongoing technical assistance around operations to ensure sustainability of neighborhood arts organizations. Arts and Culture
Cleanliness
Continue Pit Stop toilet and make it available in other neighborhood locations as needed, and align Pit Stop with other public toilet facilities and resources.
Sidewalk Safety and Cleaning
Pursue funding to staff around JC Decaux toilets 8 hours/day and lock them when they aren’t staffed. Include UN Plaza, Civic Center Plaza, McAuley Park, and Boeddeker Park locations.
Sidewalk Safety and Cleaning
Deploy new Outreach and Enforcement (OnE) Team to Mid-Market Corridor.
Sidewalk Safety and Cleaning
Institutionalize the new Department of Public Works (DPW) position whose job is to align and coordinate cleaning, safety, homeless, and mental illness-related services together with community partners throughout the neighborhood, geographically deploying coordinated services or referrals as needed. Solidify partnerships with homeless services and mental health agencies.
Sidewalk Safety and Cleaning
Increase the City’s and community partners’ capacity around sidewalk steam cleaning by providing direct assistance to neighborhood property owners around cleaning practices and by building CBD capacity for rapid response steam cleaning in the Tenderloin.
Sidewalk Safety and Cleaning
Complete assessment and short-term plan to mitigate the number of discarded needles on the sidewalks and in public areas. Options could include increased educational resources, better signage for existing boxes, and additional needle dispensary boxes in strategic locations. Implement appropriate intervention with a focus on the Action Zones and in coordination with cleaning and safety interventions.
Sidewalk Safety and Cleaning
24 CENTRAL MARKET / TENDERLOIN STRATEGY Section 3. STRATEGY APPROACH - ACTION ZONE GAME CHANGERS AND NEIGHBORHOOD-WIDE OBJECTIVES

Neighborhood Wide Objectives (cont’d)
Action Items Subcommittee Framework Categories
Cleanliness
Continue OCEIA Community Safety Ambassadors’ presence on Central Market, Sixth Street and the Tenderloin and ensure coordination with other City agencies and Community Benefit Districts.
Sidewalk Safety and Cleaning
Support community-based efforts to clean and initiate positive activation on sidewalks (e.g. Four Corner Fridays, Take Back the Block) with equipment/supplies, pro bono assistance, volunteers, and funding.
Sidewalk Safety and Cleaning
Job Opportunities
Pursue opportunities to develop or expand a sidewalk cleaning, safety ambassador, or similar program that hires formerly homeless or low income Tenderloin residents to participate in activities and programs aimed at improving the neighborhood.
Jobs and Training
Assist new businesses, including retail and non-tech large employers, in hiring locally by providing coordinated recruiting and screening services through the JobsNow infrastructure and community partners, as well as assisting with First Source as appropriate.
Jobs and Training
Explore establishment/expansion of a neighborhood lead organization, such as the Homeless Employment Collaborative, to better coordinate among service providers and to provide a go-to for recruiting and training candidates for primarily hospitality and retail positions in conjunction with City staff business representatives.
Jobs and Training
Support and promote TechSF and other job readiness, training, and internship programs/partnerships that help tech companies hire local or low-income and diverse entry-level workers.
Jobs and Training
Continue to administer Central Market/Tenderloin Payroll Tax Exclusion to help promote job growth in the area, and support implementation of Community Benefit Agreements.
Jobs and Training
Mental Health
Create a Tenderloin mental health resource team comprising a mental health clinician and a peer specialist. The team would be a resource on call for street outreach teams and other City or nonprofit social service providers in the neighborhood. The team would also provide training for OCEIA community safety ambassadors, Community Benefits District (CBD) ambassadors and crew, and Street Violence Prevention workers.
Sidewalk Safety and Cleaning
Create a social day program for severely mentally ill individuals or those with dual mental illness and substance abuse diagnoses. Such a program would provide opportunities for socialization, recreation, life skills building, and vocational rehabilitation.
Sidewalk Safety and Cleaning
25

Neighborhood Wide Objectives (cont’d)
Action Items Subcommittee Framework Categories
Nonprofit Retention
Continue nonprofit facilities technical assistance services in the neighborhood, including accessing Nonprofit Stabilization Fund, Community Building Block Grant (CDBG), Complete Neighborhoods and other dollars/models in order to stabilize and upgrade nonprofit real estate in the neighborhood. Leverage opportunities for nonprofit co-location (i.e. multi-tenant building) and enhanced sidewalk activation.
Affordable and Healthy Goods and Services
Safety
Enhance Tenderloin Safe Passage program and pursue capital improvements marking the path; prioritize establishing safe passage for children, youth and seniors along routes to and from Boeddeker and to the Tenderloin Community School and connect to other public realm improvements.
Sidewalk Safety and Cleaning
Facilitate coordination between SFPD and the Street Violence Prevention Program as needed.
Sidewalk Safety and Cleaning
Continue proactive adult probation compliance checks in the Tenderloin while undertaking outreach to enroll probationers into Community Services and Assessment Center (CSAC) services. Pursue joint strategy with SFPD and Parole.
Sidewalk Safety and Cleaning
Maintain the Mid Market Foot Beat; continue to increase the number of beat cops at Tenderloin station and ensure the police district redistricting will maintain or increase responsiveness in the Central Market/Tenderloin, including in the action zones.
Sidewalk Safety and Cleaning
Pursue enforcement and policy options for “bad actor” properties that negatively affect sidewalk conditions.
Sidewalk Safety and Cleaning
Embed Crime Prevention Through Environmental Design (CPTED) concepts into bricks and mortar enhancements and new construction.
Sidewalk Safety and Cleaning
Small Business Support
Assist affordable housing and nonprofit building owners in activating/maintaining affordable commercial space.
Affordable and Healthy Goods and Services
26 CENTRAL MARKET / TENDERLOIN STRATEGY Section 3. STRATEGY APPROACH - ACTION ZONE GAME CHANGERS AND NEIGHBORHOOD-WIDE OBJECTIVES

Neighborhood Wide Objectives (cont’d)
Action Items Subcommittee Framework Categories
Small Business Support
Continue to implement multi-lingual small business retention program – including lease/legal assistance, other technical assistance, financing, marketing assistance, and local purchasing partnerships with nearby companies – to ensure availability of quality affordable goods and services in the community. Also explore additional tools to assist with small business stabilization, including a fund for relocation and tenant improvements, master leasing to ensure long-term, affordable commercial space, and policy solutions to enable existing neighborhood businesses to stay and grow.
Affordable and Healthy Goods and Services
Continue implementing and expand Healthy Retail SF corner store program and coordinate with adjunct healthy food resources such as EatSF pilot and Healthy Shopping Guide.
Affordable and Healthy Goods and Services
Continue small business attraction and vacancy-filling activities with a focus primarily on Action Zones. Identify additional approaches – such as expedited permitting, piloting enforcement of the new DBI ordinance, and ensuring SF Shines has adequate capacity/resources – to attract a diverse, neighborhood-serving business mix.
Affordable and Healthy Goods and Services
Streetscape Improvements
Complete near-term (0-2 years) public realm projects that are currently funded and address issues of pedestrian safety, activation and place-making. See Section 4 for maps and project descriptions.
Public Realm
Continue to support and coordinate among City agencies and community stakeholders to implement mid-term (3-5 years) public realm projects, which include larger scale urban design efforts, pedestrian lighting installation, and traffic calming measures. Pursue additional funding as needed to ensure completion of these projects. See Section 4 for maps and project descriptions.
Public Realm
Pursue longer term streetscape and public realm improvements (5+ years) that will explore broader changes to the street system in support of Vision Zero as well as anticipated improvement of conditions on the sidewalks as new businesses and housing are integrated into the neighborhood. See Appendix for Public Realm strategy document.
Public Realm
27

Section 4. NEIGHBORHOOD PUBLIC REALM
PROJECTS

NEIGHBORHOOD PUBLIC REALM PROJECTSAnother important dimension of this Strategy,
working in parallel with the Neighborhood-Wide
Objectives, is a survey of all of the neighborhood’s
public spaces and current physical conditions,
and an accompanying exploration of opportunities
to improve livability and inclusiveness within the
public realm. This is a neighborhood that has not
benefited from conventional urban design attention
in the way that many other neighborhoods have in
San Francisco.
A starting point for this exercise was to catalogue
all of the public realm projects that are currently
underway and planned for in the Tenderloin,
Central Market, and Sixth Street (see Figures on
pages 30 and 31). Collecting information from
numerous City agencies and community stakehold-
ers revealed the following:
• More than 20 near-term (within the next two
years) public realm projects are currently
underway in the neighborhood. These
improvements address issues of pedestrian
safety, sidewalk activation and place-making.
• Over the next three to five years, numerous
additional public realm projects are proposed
for the neighborhood, including larger
urban design initiatives, pedestrian lighting
installation and traffic calming measures.
• Some of these mid-term efforts will require
additional funding and greater coordination
to ensure they are completed in a way that
supports and leverages Game Changers.
After mapping and analysis of these near- and
mid-term projects, City agencies are beginning
to explore a more comprehensive, longer-term
approach to streetscape and public realm improve-
ments in the neighborhood. This approach
addresses broader changes to the street system in
support of the City’s Vision Zero pedestrian safety
policy, which aims to eliminate all traffic deaths in
the City by 2024. There will also likely be greater
opportunities over time to implement urban design
and place-making strategies in continued support
of Game Changers and Neighborhood-Wide Objec-
tives. When implemented, these strategies will
lead to on-the-ground improvements in pedestrian
safety, positive activation of public spaces, and an
overall higher quality of life for residents. Please
refer to Appendix G for the complete Neighborhood
Public Realm Vision.
29

Near-Term Projects [0-2 years]
Action Zones
Golden Gate Ave Pedestrian Safety Improvements
Living Innovation Zones
+ Propsed
+ Planned
Market Street/UN Plaza Activization
Safer Market Street
Sixth Street Improvements
Vision Zero (Walk First) Pedestrian Safety Measures
Tenderloin Signal Retiming
Tenderloin Safe Passage
Tenderloin Safe Routes to School
UC Hastings McAllister Streetscape Plan
A
SIGNAL RETIMING
[Neighborhood-wide]
Near-Term Projects [0-2 Years]
ELLIS ST
EDDY ST
TURK ST
MIS
SION S
T
HOWARD ST
9TH ST
8TH ST
7TH ST
OFARRELL ST
HYD
E S
T
6TH ST
5TH ST
LAR
KIN
ST
10TH ST
11TH ST
GROVE ST
JON
ES
ST
MARKET
ST
MCALLISTER ST
HAYES ST
FELL ST
GOLDEN GATE AVE
GEARY ST
TAYLO
R S
T
LEA
VEN
WO
RTH
ST
VAN
NE
SS
AVE
MA
SO
N S
T
OTIS S
T
PO
WE
LL ST
BRADY ST
GOUGH ST
CYR
IL MA
GN
IN S
T
FULTON ST
SO
UTH
VAN
NES
S A
VE
MINT ST
PO
LK S
T
12TH ST
MINT PLA
ZA
UN PLAZA
CIVIC CENTER
PLAZA
BOEDDEKER
PARK
Central Market/Tender
I
H
G
F
E
D
C
B
A
30 CENTRAL MARKET / TENDERLOIN STRATEGY Section 4. NEIGHBORHOOD PUBLIC REALM PROJECTS

ELLIS ST
EDDY ST
TURK ST
MIS
SION S
T
HOWARD ST
9TH ST
8TH ST
7TH ST
OFARRELL ST
HYD
E S
T
6TH ST
5TH ST
LAR
KIN
ST
10TH ST
11TH ST
GROVE ST
JON
ES
ST
MARKET
ST
MARKET
ST
MCALLISTER ST
HAYES ST
FELL ST
GOLDEN GATE AVE
GEARY ST
TAYLO
R S
T
LEA
VEN
WO
RTH
ST
VAN
NE
SS
AVE
MA
SO
N S
T
OTIS S
T
PO
WE
LL ST
BRADY ST
GOUGH ST
CYR
IL MA
GN
IN S
T
FULTON ST
SO
UTH
VAN
NES
S A
VE
MINT ST
PO
LK S
T
12TH ST
MINT PLA
ZA
UN PLAZA
CIVIC CENTER
PLAZA
BOEDDEKER
PARK
I
H
G
F
E
D
C
B
A
Mid-Term Projects [3-5 Years]
Action Zones
Privately Sponored Streetscape Projects
+ 950 Market Street Streetscape Improvements
+ Stevenson Alley Improvements
Streetscape Projects
+ Better Market Street Project
+ Van Ness Bus Rapid Transit & Complete Street
+ Polk Streetscape
+ 6th Street Traffic Calming
+ SoMa Alleys
+ 2-Way Eddy and Ellis Streets [Phase 2]
Tenderloin Pedestrian Lighting
Green Connections
Open Space Planning and Design Efforts
+ UN Plaza Redesign
+ Bradey Block Open Space Planning
Civic Center Public Realm Plan
A
31
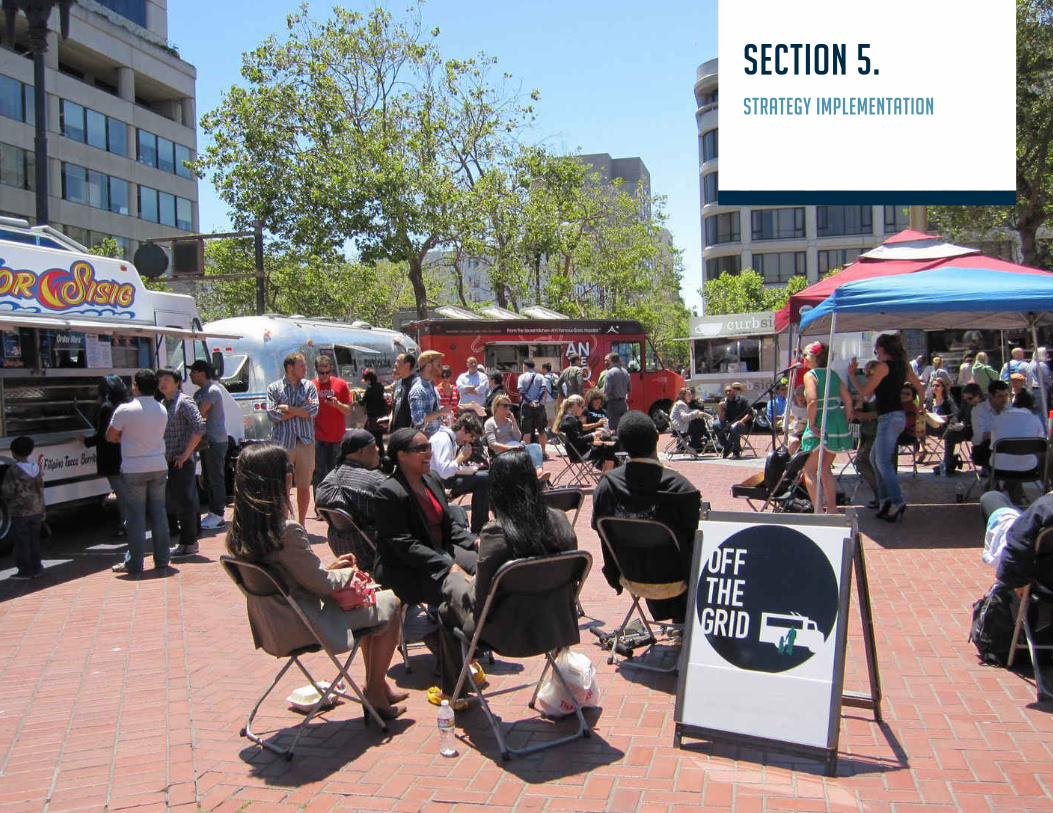
Section 5. STRATEGY IMPLEMENTATION

STRATEGY IMPLEMENTATIONThe previous sections describe what should be
done to make Central Market, Sixth Street and
the Tenderloin a diverse, healthy, and sustainable
mixed-income neighborhood. But to be successful,
this Strategy must also delineate how those actions
will be implemented. This section outlines tools for
implementation.
To be effective, the four implementation tools
described below are multi-dimensional and foster
connection and coordination among the diverse
stakeholders in the neighborhood. They also
include feedback mechanisms so that everyone
involved in neighborhood projects can adjust or
correct course when needed.
1. Epicenter-SF: The City and its partners
are helping to plan and fund significant
improvements to the Epicenter-SF website, an
online tool that will enable information sharing
among neighborhood stakeholders and visitors.
The enhanced site will be a resource for
anyone interested in getting involved or looking
for information about the neighborhood. This
could include tech companies that have
signed Community Benefits Agreements
and would like to take on volunteer projects
that are part of this Strategy; businesses or
residents new to the neighborhood looking
for safety and cleaning resources; or nonprofit
organizations looking to coordinate and
publicize their neighborhood projects and
programs. By serving as a clearinghouse for
neighborhood information, Epicenter-SF will
promote strategic investment and coordination
of activities vital to the success of this Strategy.
A beta version of the site (epicenter-sf.org) will
be launched in Spring 2015.
2. City Subcommittees: In 2014, OEWD and
the Planning Department formed an
Interagency Working Group and organized
City Subcommittees to provide a structure
through which City agencies could
work together on Game Changers and
Neighborhood-Wide Objectives in an efficient,
collaborative manner. Designated City
agency liaisons will participate in regularly
convened Subcommittees responsible for the
implementation and evaluation of specific
Strategy Action Items. These Subcommittees
will coordinate with external partners
regularly and will be accessible to the public
via Epicenter, where they may post project
information and a contact for public inquiry.
They will report back to the larger Interagency
Working Group at regular intervals. More
detail on these subcommittees can be found in
Appendix D.
3. Inclusive Programming Organization: The creation
of truly shared spaces is no small feat. It
will require new resources to develop and
implement innovative events and programs
that promote social cohesion among diverse
users of the neighborhood. Recognizing that
this capacity is key to the ultimate success of
this Strategy, the City along with community
partners will pursue additional funding to
create an organization to help implement such
activities. The organization will partner with
neighborhood organizations and businesses
to host programs that engage a wide range
of residents, employees and visitors, and
that prioritize the inclusion of low-income
community members. It is important to
note that the City itself does not intend to
provide these services, but intends to foster
the development of this unique skillset within
the community. For examples of programs
and activities that could be supported by this
organization, see Appendix A.
4. Data Collection and Publication: Institutionalizing
data collection systems and surveys will
allow for ongoing, regular publications of
Neighborhood Report Cards. The Report
Cards will include data on conditions for the
neighborhood as a whole and by zone, and
will document progress made in implementing
Game Changers and Neighborhood-Wide
Objectives. See Appendix E for a template of
the Neighborhood Report Card and Appendix F
for a presentation of the baseline neighborhood
conditions collected during development of this
Strategy.
33

Tools for Implementation
34 CENTRAL MARKET / TENDERLOIN STRATEGY Section 5. STRATEGY IMPLEMENTATION

APPENDICES

APPENDICESAppendix A.Examples of Inclusive Programming and Business Types 38
Appendix B. Tenderloin Health Improvement Partnership Overview 39
Appendix C.Community Engagement and Outreach 42
Appendix D.Implementation Tools and Subcommittee Assignments 44
Appendix E.Neighborhood Report Card Template 46
Appendix F.Baseline Neighborhood Conditions 55
Appendix G.Neighborhood Public Realm Vision 86
Appendices can be found at: http://investsf.org/CMTLstrategy
37

Central Market/Tenderloin Strategy: Appendix A 38
Appendix A: Examples of Inclusive Programming, Activities, and Business Types
Indoor and Outdoor Programming and Activities As described in the Community Impact Framework, all interventions must be crafted toward very specific needs in order to truly benefit low-income communities. Listed below are proposed ideas for indoor and outdoor activities that are inclusive of the low-income population, but also intended to promote cohesion in a neighborhood that is becoming increasingly diverse. A partial list, these are intended as a starting point for potential interventions. Activities for Families
• Playgrounds
• Parks and gardens
• Interactive public art
• Free recreational and arts events (e.g. roller-skating)
• Chess
• Basketball
• Library
Activities for Adults
• Farmers Markets
• Sports games on the big TV in the plaza
• Movies
• Tai Chi
• Mah Jong
• Pianos
Activities for Adults, continued
• Dog Park
• Basketball
• Church events
• Freespace
• Neighborhood meetings/lectures
Business Types Many of the Strategy’s Game Changers and Action Items rely on attracting and retaining neighborhood-serving businesses. Below is a partial list of the kinds of affordable, neighborhood-serving businesses the City and its partners could prioritize:
• Taquerias
• Vietnamese sandwiches
• Pizza
• Bagels
• Donuts
• Ice cream
• Diners
• Dollar stores/discount stores
• Consignment stores
• Nail salons
• All purpose/general merchandise stores
• Banks or credit unions
• Healthy corner stores and grocery
Central Market/Tenderloin Strategy: Appendix B 39
Appendix B:
Tenderloin
Health
Improvement
Partnership
Overview
Tenderloin Health Improvement Partnership Embracing Collective Impact to Improve Community Health, Safety and Well-being
The Tenderloin Health Improvement
Partnership (Tenderloin HIP) is
committed to significantly improving
community health, safety, and well-
being for the more than 33,000
individuals and families who live in the
Tenderloin, one of San Francisco’s most
densely populated and challenged
neighborhoods. Tenderloin HIP
stakeholders have created a long-term
vision of the Tenderloin as an inclusive,
vibrant, and diverse community where
health and safety are within the reach of
all. Tenderloin HIP is working to align
and leverage the efforts of more than
150 public, private, and nonprofit
organizations to address the social,
economic, and environmental
determinants that contribute to poor
health and chronic illness, while
mitigating the underlying health
disparities and inequities that persist in
this neighborhood. Pursuing a place-
based strategy that reflects the
importance of these determinants in
improving population health, Tenderloin
HIP stakeholders recognize that the
issues facing the Tenderloin are bigger
than any one organization can solve on
its own.
Spearheaded by Saint Francis
Foundation and Saint Francis Memorial
Hospital, Tenderloin HIP challenges its
multi-sector partners to work better
together within a collective impact
framework - to proactively collaborate,
expand and strengthen their network of
cross-sector relationships and align to a
common agenda. Positively disrupting
organizational silos and operating
modalities has been a hallmark of the
work of Tenderloin HIP. Convening
stakeholders and building consensus
around community needs and priorities
and making strategic investments has

Central Market/Tenderloin Strategy: Appendix B 40
fueled momentum and catalyzed
change. Based on the model of the
citywide San Francisco Health
Improvement Partnership (SFHIP),
Tenderloin HIP is the first neighborhood-
specific coalition to pilot the vision and
priorities of SFHIP.
A robust community stakeholder process
initiated by Tenderloin HIP in late 2013
identified early on the priorities of safety,
community connectedness and
opportunities to make healthy choices as
instrumental to realizing the residents’
own vision of a safe and healthy
Tenderloin neighborhood. These
priorities resonated deeply across all
stakeholder groups, enabling broad
cross-sector commitment to the
collaborative work of Tenderloin HIP.
Engaged community-based partners
represent the spectrum of agencies
providing services vital to the Tenderloin
community, including: Glide Foundation,
St Anthony’s Foundation, Bay Area
Women’s and Children’s Center,
Tenderloin Neighborhood Development
Corporation, amongst many others. In
the public sector, key Tenderloin HIP
partners include the San Francisco
Department of Public Health (DPH);
Mayor’s Office of Economic and
Workforce Development (OEWD);
Recreation and Parks; and the University
of California, San Francisco. At the
same time, Tenderloin HIP has
challenged the funding community to
invest in a pooled community fund to
support Tenderloin HIP initiatives.
PG&E; Citi Community Development;
Wells Fargo; Twitter; the San Francisco
Foundation; and Dignity Health have
joined Saint Francis Foundation, Saint
Francis Memorial Hospital and others as
founding funders in this pool, which now
totals over $1 million.
Core community priorities drove
Tenderloin HIP’s place-based strategy to
identify four block areas, or “Action
Zones” that provide a focal point from
which healthy community activation can
radiate throughout the neighborhood.
The Action Zones have also been
incorporated in the City’s Central
Market/Tenderloin Strategy, which looks
to build upon the ongoing work of TLHIP
and its partners.
Each Zone contains a community game-
changer initiative, which Tenderloin HIP
believes will have far reaching impacts
on the overall health, safety, and well-
being of Tenderloin residents.
Addressing the core conditions of safety,
community activation, and stabilization
in the Action Zones helps pave the way
for Tenderloin HIP to dig deeper and
confront the more complex community-
wide challenges of mental health, crime
and drugs, housing and gentrification,
substance abuse and recovery, business
and economy, resident leadership, and
workforce development in the
Tenderloin.
Tenderloin residents - individuals,
families and those without shelter – are
direct neighbors of Saint Francis
Memorial Hospital and comprise the
highest users of hospital services. Saint
Francis Foundation and Saint Francis
Memorial Hospital’s commitment to the
Tenderloin, through hospital and
emergency care and community grants,
has continued for over a century
(currently $1 million per month in
ongoing support); Tenderloin HIP is a
natural extension of that commitment.
Community investment will continue in
2015, including direct support to
Tenderloin HIP and significant

Central Market/Tenderloin Strategy: Appendix B 41
investment in the backbone
infrastructure needed to support this
collective effort and facilitate continued
community collaboration.
As momentum builds both locally and at
the national level, 2015 brings new
opportunities for funding and
alignment. Tenderloin HIP’s work
continues – supporting community
activation of the neighborhood, gathering
street level data, developing healthy
Action Zone pilots, convening working
groups, advocating for health in all
policies, evaluating impact, fundraising
and more.

Central Market/Tenderloin Strategy: Appendix C 42
42
Appendix C:
Community
Engagement and
Outreach
Community engagement and outreach has
been essential to every phase of the Central
Market/Tenderloin Strategy, from inception
to enquiry to drafting and finalizing this
document. Over the course of two years,
substantive community feedback has been
solicited and incorporated from the diverse
stakeholders representing both the “existing”
and the “newcomer” fabric of the
neighborhood, including people who live,
work, own businesses, and visit the area.
Phase 1- Inception
The City began developing this Strategy in
response to community feedback gathered
during an extensive 10-month evaluation of
the 2011 Central Market Economic Strategy.
This public evaluation in late 2012 to mid-
2013 utilized a “360 degree approach,”
designed to capture concerns and priorities
for the Central Market area from a wide
range of community stakeholders, including:
an intercept survey of 220 pedestrians; a
survey of 20 merchants; a survey of 169
Central Market residents living across the full
spectrum of area housing types, including
Tenderloin SROs; in-depth interviews with
key stakeholder organizations and
individuals; and four focus groups with arts
organizations, social service providers,
nonprofit housing organizations, and
community benefit districts. The evaluation
findings emphasized the need to expand
upon current efforts in the neighborhood to
more directly serve Sixth Street and the
Tenderloin, and spurred the City to begin
work on the Strategy.
Phase 2- Enquiry
Community engagement ramped up further
as the City began shaping the new Strategy
in 2014. To maximize stakeholder feedback
and minimize the burden to the growing
number of organizations and stakeholders
now active in the neighborhood, the City
sought to build upon and partner in existing
community planning processes, by:
• Incorporating priorities and
strategies from the Tenderloin
Health Improvement Partnership
(TLHIP), an effort led by the St.
Francis Hospital Foundation that is
bringing together Tenderloin
community stakeholders to find new
ways of working together to increase
health and well-being. In 2013,
TLHIP facilitated a community
planning process that identified four
“Action Zones” in the Tenderloin
and prioritized safety and
cleanliness as an initial focus for
their funding as well as additional
funding leveraged from outside
sources. (For more information
about TLHIP, see Appendix B.)

Central Market/Tenderloin Strategy: Appendix C 43
4
Through additional community
engagement, this Strategy ultimately
added five more zones to the four
already identified by TLHIP.
• Partnering with San Francisco
Beautiful and Neighborland to
convene community partners, City
agencies, and the public in early
2014 to prioritize interventions to
improve conditions at UN Plaza.
This process included a broad range
of events, including two large
community meetings and an
intercept survey administered both
in person and on-line to 200
respondents, many of whom were
Tenderloin residents. Additionally, a
Neighborland on-line voting process
received more than 800 responses.
• Working with the City
Administrator’s Office on the 2014
Central Market Community Benefit
Agreements planning process,
including providing the nine
Action Zones as a foundation to
discuss neighborhood desires before
drafting Community Benefit
Agreements (CBAs). This process
included an interactive community
planning meeting with a diverse
group of neighborhood stakeholders,
as well as a large public meeting to
gather input, all of which informed
both the development of the CBAs
and the content of this Strategy.
OEWD also held one-on-one or small group
meetings with dozens of community-based
organizations, including social service,
nonprofit housing, and small business
assistance organizations. Additionally,
OEWD organized focus groups with small
business assistance groups and CBDs
(September 2014), tech companies (July
2014), and nonprofit arts organizations
(November 2014). OEWD presented at the
Central Market/Tenderloin Payroll Tax
Exclusion Community Advisory Committee
(September 2014) and at the Tenderloin
Health Improvement Project (TLHIP)
Community Advisory Committee (August and
January 2014). OEWD and Planning also
participated in more than 20 other public
meetings, including the neighborhood’s three
Community Benefit District boards, the
Tenderloin SRO Collaborative, Market Street
for the Masses, Sixth Street Neighbors, and
the Golden Gate Safety Group. The agencies
convened a large multi-stakeholder
community meeting with the Mayor’s senior
staff in October 2014 to preview and solicit
feedback on initial elements of the emerging
Strategy.
Phase 3- Drafting and Finalizing
Strategy Document
After gathering community feedback for more than a year, in late 2014 and early 2015, OEWD and Planning synthesized the issues and ideas collected in to a Draft Strategy document. The Draft Strategy was presented at a large community meeting in January 2015 to solicit final feedback on its key elements. At the meeting, a survey was made available in multiple languages and was subsequently posted on-line at the Invest in Neighborhoods web site, investsf.org. Surveys were collected over the following month and reviewed in advance of finalizing this document.

Central Market/Tenderloin Strategy: Appendix D 44
Appendix D: Implementation Tools and Subcommittee Assignments
City Subcommittees
Each subcommittee listed below is tasked with the implementation and evaluation of the Action Items assigned to them in Section Three. Subcommittees will convene on a regular basis and will report on their progress via the Neighborhood Report Cards. Subcommittees will also be responsible for interacting with community stakeholders. OEWD and the Planning Department will be responsible for the overarching coordination of the City subcommittees; however this implementation tool also requires the participation of many city agencies already working in Central Market and the Tenderloin. Some subcommittees are focused on a specific place (e.g. Boeddeker Park), while others focus on broader issues and objectives (e.g. Housing Quality and Access). In both cases, the subcommittee structure has identified where and how various City agencies overlap in order to create venues for efficient and effective coordination.
Affordable and Healthy Goods and Services
• Department of Public Health • Mayor’s Office of Housing and
Community Development • Office of Economic and Workforce
Development • Planning Department
Arts and Culture • Arts Commission • Asian Art Museum • Grants for the Arts • Office of Economic and Workforce
Development Boeddeker Park
• City Administrator • Department of Children, Youth, and
their Families • Mayor’s Safety Advisor • Office of Civic Engagement &
Immigrant Affairs • Public Works • Recreation and Park • SF Police Department
Civic Center/UN Plazas
• Asian Art Museum • City Administrator • Department of Public Health • Housing Opportunity, Partnerships &
Engagement (HOPE) • Office of Economic and Workforce
Development • Planning Department • Public Library • Public Utilities Commission • Public Works • Real Estate • Recreation and Park • SF Municipal Transportation Agency • SF Police Department

Central Market/Tenderloin Strategy: Appendix D 45
Housing Quality and Access • Adult Probation • Department of Building Inspection • Department of Public Health • Housing Opportunity, Partnerships &
Engagement (HOPE) • Human Services Agency • Mayor’s Housing Advisor • Mayor’s Office of Housing • Office of Economic and Workforce
Development • Planning Department
Jobs and Training
• Housing Opportunity, Partnerships & Engagement (HOPE)
• Human Services Agency • Office of Economic Development • Office of Workforce Development
Public Realm
• Mayor’s Office of Civic Innovation • Mayor’s Vision Zero advisor • Planning Department • Public Utilities Commission • Public Works • SF County Transit Authority • SF Municipal Transportation Agency
Sidewalk Safety and Cleaning • Adult Probation • City Attorney • Department of Public Health • District Attorney • Housing Opportunity, Partnerships &
Engagement (HOPE) • Mayor’s Safety Advisor • Office of Civic Engagement &
Immigrant Affairs • Office of Economic and Workforce
Development • Public Works • Public Utilities Commission • Parole • SF Police Department • Street Violence Prevention
Additional Implementation Tools
The additional implementation tools, which are discussed in Section Five, will be overseen by the following agencies along with external funding partners:
• Inclusive Programming Organization: Office of Economic and Workforce Development
• Report Card Publication: Department of Public Health, Office of Economic and Workforce Development, and Planning Department
• Epicenter-SF: Office of Economic and Workforce Development

46
Appendix E: Central Market/Tenderloin Strategy Report Card
2015 Neighborhood Highlights
Framework and Evaluation Process
[Key takeaways from the secondary data analysis included on the following three pages will be discussed here (e.g. a decrease in crime or vacancy or changes in the housing pipeline). This section will create an entry point for readers as they digest the various graphs and charts that follow. It can also help to tie together the secondary data analysis with the programmatic reports that follow (e.g. there may be a decrease in pedestrian collisions due improvements to the public realm).]
To track and evaluate the impact of the Central Market/Tenderloin Strategy, key indicators are paired with each of the Strategy Framework components depicted to the right. The first part of the Report Card – the Neighborhood Update – includes an analysis of these key economic and social indicators over time and compared to the City as a whole. This analysis is followed by a programmatic report on the work of City Subcommittees and external partners to implement the Neighborhood Wide Objectives set out in the Strategy.
The second section of the report card – the Action Zone Update – analyzes similar indicators at the Action Zone level, identifying important developments in the specific areas prioritized by the Strategy. This analysis is also followed by a programmatic report on the work of City Subcommittees and external partners to implement the Game Changers identified by the Strategy in each Action Zone.
Map of the Study Area
Strategy Framework
Taken together, the components of this Report Card will help to evaluate progress, course-correct and identify future actions towards achieving the Strategy’s goal: a diverse, healthy, mixed-income neighborhood that offers safety and well-being to all who live, work and visit Central Market and The Tenderloin.
Neighborhood Update 2015

47
Appendix E: Central Market/Tenderloin Strategy Report Card
Employment Real Estate: Property Values
$4.02
$4.50
$3.75
$4.00
$4.25
$4.50
$4.75
2011 2013B
illio
ns
Real Estate: Office and Retail Market Conditions
Source: Employment Development Department Source: San Francisco Assessors
Source: CoStar Source: CoStar
Proposed Charts/Graphs • Growth in Employment • Growth in Payroll
Time period: 2011, 2013, 2015 Geography: Study Area and City
Proposed Charts/Graphs • Assessed Commercial and Residential
Property Values
Time period: 2011, 2013, 2015 Geography: Study Area and City
Proposed Charts/Graphs • Office Lease Rates & Availability
Time period: 2011, 2013, 2015 Geography: Study Area and City
Proposed Charts/Graphs • Retail Vacancy Rate
Time period: 2011, 2013, 2015 Geography: Study Area and City
Economic Opportunities

48
Appendix E: Central Market/Tenderloin Strategy Report Card
Demographics Housing: No Fault Evictions
Housing: Affordability
Source: City of San Francisco Planning Department
Source: 2010 Census, ESRI, San Francisco Point-in-Time Homeless Survey
(2011, 2013) Source: Department of Public Health
Proposed Graphs/Charts • No Fault Evictions per 1,000 housing
units
Time period: 2011, 2013, 2015 Geography: Study Area and City
Proposed Chart • Population • Race/Ethnicity • Number of Children • Concentration of families per square mile • Households with income below $15,000/year • Homeless Population
Time period: 2010 Geography: Study Area and City
Proposed Charts and Graphs • Current Housing Stock: Market Rate, Rent Stabilized, and Permanently Affordable • Future Housing Stock: Under Construction, Approved, Proposed; Percent BMR
Time period: 2011, 2013, 2015 Geography: Study Area and City
Low-Income Community
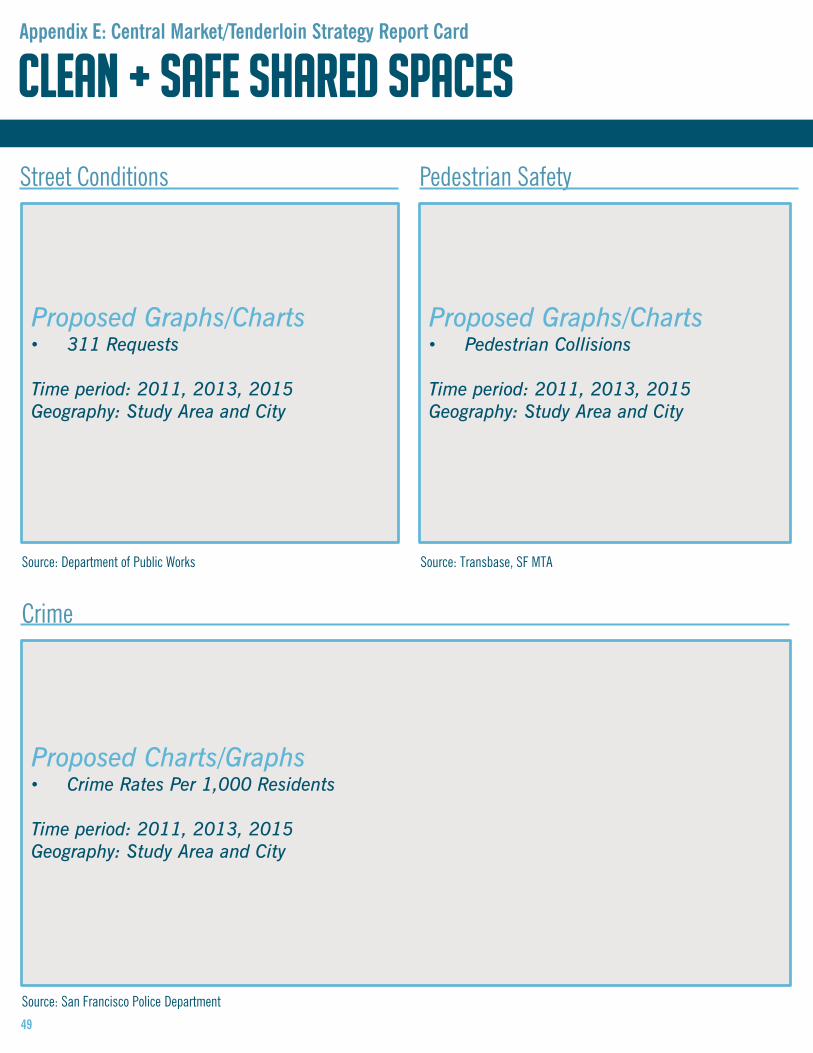
49
Appendix E: Central Market/Tenderloin Strategy Report Card
Street Conditions Pedestrian Safety
Crime
0.00
0.03
0.06
0.09
0.12
2011 2013
Req
ues
ts p
er 1
,00
0 s
ervi
ce
pop
ula
tion
Street & Sidewalk Cleaning
Abandonded Property Removal
0
0.5
1
1.5
2
Study Area
Source: Department of Public Works Source: Transbase, SF MTA
Source: San Francisco Police Department
Proposed Graphs/Charts • 311 Requests Time period: 2011, 2013, 2015 Geography: Study Area and City
Proposed Graphs/Charts • Pedestrian Collisions
Time period: 2011, 2013, 2015 Geography: Study Area and City
Proposed Charts/Graphs • Crime Rates Per 1,000 Residents
Time period: 2011, 2013, 2015 Geography: Study Area and City
Clean + Safe Shared Spaces

50
Appendix E: Central Market/Tenderloin Strategy Report Card
2015 Highlights: Complete Projects
2016 Priorities: Ongoing Projects
Neighborhood-Wide Objective Programmatic Report
Neighborhood-Wide Objective Programmatic Report
Neighborhood Wide Objectives

51
Appendix E: Central Market/Tenderloin Strategy Report Card
2015 Action Zone Highlights
Map of the Study Area and Action Zones
Action Zone A: Leavenworth and Eddy
Action Zone B: Jones and Eddy
Action Zone C: Leavenworth and Golden Gate
Action Zone D: Turk and Taylor
Action Zone E: Market From 5th to 7th
Action Zone F: UN Plaza and Civic Center Plaza
Action Zone G: 6th Street
Action Zone H: Larkin Street
Action Zone I: Market and Van Ness
[Key takeaways from the secondary data analysis at the Action Zone level, included on the following page, will be discussed here (e.g. a decrease in crime or vacancy). This section will create an entry point for readers as they digest the various graphs and charts that follow. It can also help to tie together the secondary data analysis with the programmatic reports that follow (e.g. there may be a decrease in vacancies in a certain zone due to business attraction efforts by a City Subcommittee and its partners).]
Action Zone Update 2015

52
Appendix E: Central Market/Tenderloin Strategy Report Card
Economic Opportunities
Employment: 2011 and 2013
0
2,500
5,000
7,500
A B C D E F G H I
Jobs
Low-Income Community
250
500
750
A B C D E F G H I Study Area
Req
ues
ts p
er 1
00
0 S
ervi
ce
Pop
ula
tion
Source: DPH
Source: Department of Public Works
Source: Employment Development Department
Proposed Charts and Graphs • Storefront Vacancy • Employment
Time period: 2011, 2013, 2015 Geography: Action Zones A-I
Proposed Charts and Graphs • SRO Housing Violations • All Housing Violation Time period: 2011, 2013, 2015 Geography: Action Zones A-I
Proposed Charts and Graphs • Crime • 311 Requests
Time period: 2011, 2013, 2015 Geography: Action Zones A-I
Clean and Safe Shared Spaces
Source: San Francisco Police Department, Public Works
Action Zone Update 2015

53
Appendix E: Central Market/Tenderloin Strategy Report Card
2015 Progress to Date
Zone Game Changer Programmatic Report
A A cluster of neighborhood-serving businesses develops around the Tenderloin Museum.
A The Tenderloin Museum becomes a visitor destination and a hub for community activity.
B Boeddeker reopens as a clean and safe space.
B Boeddeker offers regular and special event programming.
C A zone of well-maintained storefronts of community-serving nonprofits is accompanied by efforts to promote positive, healthy activity on the sidewalk.
D New arts venues join existing venues to create a vibrant hub of cultural activity both during the day and nighttime at Turk/Taylor.
D A cluster of neighborhood-serving as well as entertainment-oriented businesses develops around the arts venues at Turk/Taylor.
D New mixed-use development and existing buildings implement design strategies that contribute to a safe and active Turk and Taylor Streets.
E
Sustained sidewalk activation projects along Market from 5th-7th that promote positive day and nighttime activity are implemented while longer-term development progresses.
Game Changers

54
Appendix E: Central Market/Tenderloin Strategy Report Card
2015 Progress to Date
Zone Game Changer Programmatic Report
F UN Plaza is activated with programming and art installations so it can become a cleaner, safer and inclusive community asset every day.
F Civic Center playground renovation is a catalyst for additional investment in the programming and stewardship of Civic Center Plaza.
F Initial steps are taken towards linking the two plazas and activating/ programming them as one vibrant civic space.
G Sixth Street Safety Hub becomes a visible hub of community-serving activity.
G A cluster of neighborhood-and employee-serving businesses develops around the Safety Hub.
H Enhance visibility of Little Saigon as a Vietnamese-oriented cultural district.
H Create physical improvements that enhance the physical conditions of Larkin St. and also facilitate the connection to Market St.
I New residential developments at 12th and Market progress with designs that will contribute to an improved sidewalk experience.
I A cluster of new resident and employee-serving businesses develops around the new residential projects.
Game Changers

55 Central Market /Tenderloin Strategy 2015 | Appendix F: Baseline Neighborhood Conditions
Appendix F: Baseline Neighborhood Conditions May 2015

56 Central Market /Tenderloin Strategy 2015 | Appendix F: Baseline Neighborhood Conditions
Appendix Purpose & Overview
The findings presented in this document are the result of significant analysis of on-the-ground conditions. In order to achieve a better understanding of the current state of Central Market and the Tenderloin, quantitative data across various categories were compiled and analyzed. The year 2013 serves as a baseline year to assess progress over time. Collecting the same data points in the future will help to understand the impact of the actions proposed in the Strategy. Comparisons are made between 2011 and 2013 in an effort to characterize the changes in the neighborhood since the publication of the original Central Market Economic Strategy.
The purpose of this appendix is show the most pertinent data points gathered during the analysis, including:
1. Employment and employment change, which are a proxy for the overall economic health of the neighborhood compared to the City overall.
2. Housing and housing affordability in the neighborhood was extensively examined to begin tracking potential displacement and loss of affordable housing in this historically low-income neighborhood.
3. Demographics were used to identify low-income populations, family characteristics, and the distributions and densities of homeless individuals living in the neighborhood.
4. Real estate trends for office, retail, and housing conditions were included to understand changes in investment in the neighborhood and the extent to which employment and housing growth is boosting local retail sales and property values, and the fiscal impact of that growth.
5. Quality of Life Metrics were gathered to understand the day-to-day conditions in the neighborhood for residents and workers. While no measure fully encapsulates quality of life, the analysis uses crime reports, street cleaning data, and pedestrian accidents to understand how on the ground conditions are changing over time. The indicators evaluated are public realm issues that have the potential to impact quality of life for all residents and workers in the neighborhood.

57 Central Market /Tenderloin Strategy 2015 | Appendix F: Baseline Neighborhood Conditions
Geographies
Three scales of analysis were developed to understand the baseline neighborhood conditions:
- The City
- The Study Area (blue dotted line)
- The Action Zones (yellow areas)
The majority of this baseline analysis uses the City as a comparison point to the Study Area. The Study Area was informed by the focus area of the 2011 Strategy and slightly recalibrated to account for changes in the neighborhood.
The Action Zones were used in the development of the actions proposed in the Strategy and will be used in ongoing evaluation efforts published via the report card template described in Appendix E. In many cases, data evaluated at the Action Zone level will only look at a couple of community indicators because the actions proposed in a given zone are focused on specific impacts (e.g. sustained programming at Boeddeker Park leads to a reduction in crime in Action Zone B). See section 3 of the main report body for further information on selection of Action Zones.

Employment
“Twitter Headquarters, San Francisco, California” / Ken Lund / CC BY 2.0 / cropped
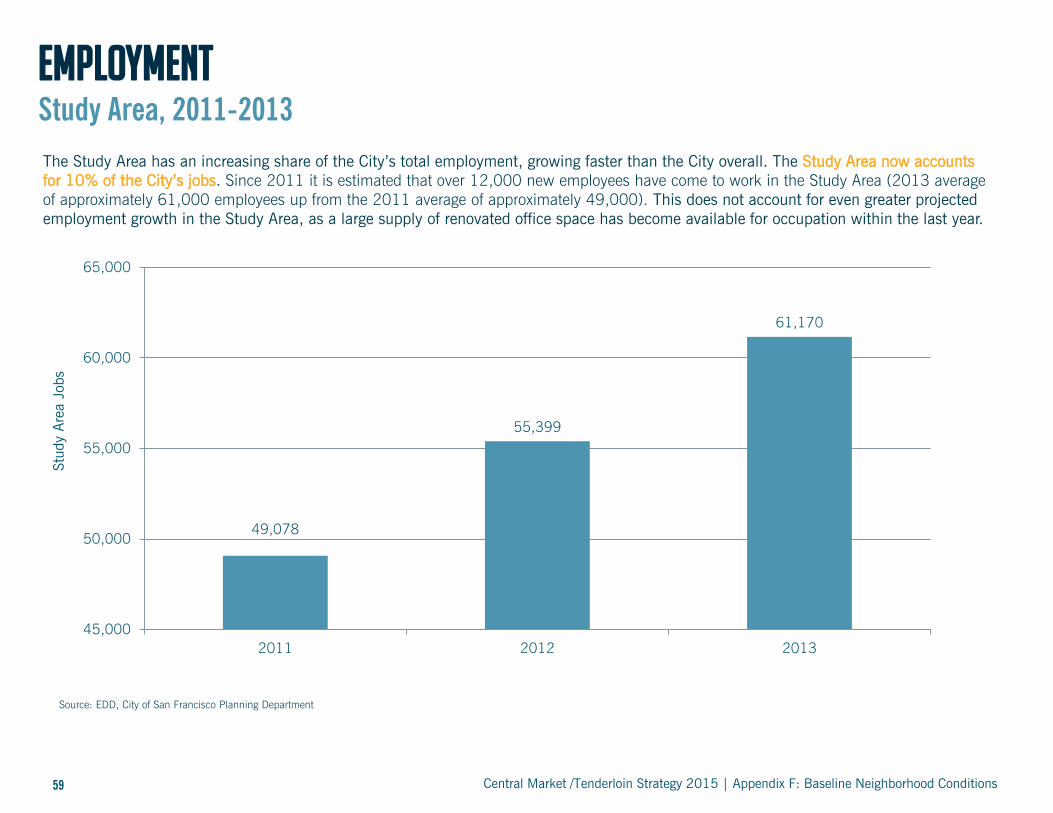
59 Central Market /Tenderloin Strategy 2015 | Appendix F: Baseline Neighborhood Conditions
Employment Study Area, 2011-2013
The Study Area has an increasing share of the City’s total employment, growing faster than the City overall. The Study Area now accounts for 10% of the City’s jobs. Since 2011 it is estimated that over 12,000 new employees have come to work in the Study Area (2013 average of approximately 61,000 employees up from the 2011 average of approximately 49,000). This does not account for even greater projected employment growth in the Study Area, as a large supply of renovated office space has become available for occupation within the last year.
Source: EDD, City of San Francisco Planning Department
49,078
55,399
61,170
45,000
50,000
55,000
60,000
65,000
2011 2012 2013
Stu
dy
Are
a Jo
bs

60 Central Market /Tenderloin Strategy 2015 | Appendix F: Baseline Neighborhood Conditions
Employment Growth Rates
From 2011 to 2013, employment growth rates have accelerated considerably in the Study Area and are well over the City’s already robust employment growth. While the 12.9 percent growth rate between 2011 and 2012 was astonishing, this high level of employment growth was unsustainable. The Study Area was physically able to grow at such a rate due to high volumes of available office space, however as the commercial real estate market tightened between 2012 and 2013, this growth rate decreased slightly.
While the Study Area’s growth rate dropped between 2012-2013, employment growth in the Study Area remains more than double the City growth rates. While data is not yet available, this trend is expected to have continued in 2014 as more renovated space became available.
Source: EDD, City of San Francisco Planning Department
-8.8%
12.9%
10.4%
2.2%
4.9% 4.6%
-10%
-5%
0%
5%
10%
15%
2010-2011 2011-2012 2012-2013
Gro
wth
Rat
e
Study Area City

61 Central Market /Tenderloin Strategy 2015 | Appendix F: Baseline Neighborhood Conditions
Employment Quarterly Employment and Payroll
Source: EDD, City of San Francisco Planning Department
In addition to accelerating employment growth in the Study Area, there has been significant rise in payroll. From 2011 to 2013, payroll doubled in the Study Area. The growth rate of total payroll in the area (an increase of 48 percent) has also outpaced the growth rate of total employment in the area (an increase of 25 percent) over the two-year period. This indicates that the average income of employees in the area has increased as well as purchasing power among workers in the Study Area.
$0
$300
$600
$900
$1,200
30,000
45,000
60,000
75,000
90,000
1Q2011 2 3 4 1Q2012 2 3 4 1Q2013 2 3
Mill
ions
in P
ayro
ll
Em
plo
ymen
t
Employment Payroll

Housing

63 Central Market /Tenderloin Strategy 2015 | Appendix F: Baseline Neighborhood Conditions
Housing Purpose & Methodology
Analyzing housing stock in the Study Area allows us to begin tracking changes in the availability of affordable housing in the Study Area, as well as potential displacement from the changes in the housing market. Important metrics examined in this subsection include:
– Housing Affordability metrics. This study utilizes the following typology, created by OEWD and Planning:
• Market Rate Units. These units are considered the least affordable.
• Rent Stabilized Units. Rent Stabilized units are units that are potentially affordable based on projections from market rate rent increases by the San Francisco Rent Ordinance. This covers all apartment buildings built before June 13, 1979. Categories include:
– Rent-controlled units
– Private Single Room Occupancy (SRO) units. These types of units: • Typically include a single room with shared bathroom and sometimes a common kitchen • Are a form of affordable housing, often occupied by formerly homeless individuals • Are owned by for-profit entities
• Permanently Affordable units are units that have rents that are permanently set at rates intended to be affordable to low and middle income individuals and families. Categories include:
– Non-Profit SROs • Includes SRO buildings owned by non-profit entities and those owned privately but under a nonprofit master lease as part of a
City subsidy
– Below Market-Rate Units (BMR) • Inclusionary housing requirements; includes both for-rent and for-sale units that are priced at rates intended to be affordable
to lower and middle income households
– Other Affordable Housing • Includes non-profit owned (non-SRO) buildings and San Francisco Housing Authority (SFHA) public housing units. Does not
include Section 8 units, for which the data was not available at our Study Area level.
– No-fault evictions – including demolition, owner move-in, Ellis Act withdrawal, capital improvements, conversion to condominiums, and substantial renovation – which provides an approximation of displacement in the area. (Note that the other types of evictions, for fault and nonpayment, are largely a function of the fragile population in the neighborhood and are a focal point for interventions, i.e. supportive services).

64 Central Market /Tenderloin Strategy 2015 | Appendix F: Baseline Neighborhood Conditions
Housing Unit Classification Type
Tota
l H
ousi
ng
Inve
nto
ry
Market-Rate
Housing
Rent Stabilized
Housing
Permanently
Affordable Housing
Market-Rate Units
Private SRO Units
Rent-Controlled
Units
Non-Profit SRO
Units
Below Market
Rate Units
Other Affordable/Public
Housing Units

65 Central Market /Tenderloin Strategy 2015 | Appendix F: Baseline Neighborhood Conditions
Housing Stock by Type and Affordability
This analysis compared the housing stock in the Study Area versus the City and determined that the Study Area has a significantly higher percentage of affordable housing. This means that the Study Area has a higher percent of housing stock that is protected from future rent increases. Approximately 78 percent of the Study Area housing units are permanently affordable or rent stabilized, compared to 55 percent for the City of San Francisco.
Source: SF Planning, Mayor’s Office of Housing and Community Development, San Francisco Housing Element (2011). Note: These figures do not include tenant- and project-based Section 8 housing. Citywide, these units number 7,144. The Study Area includes 2 partial zip codes. Together, both zip codes account for 586 units (8% of City). Zip code 94102 contains 341 units (5% of the City) and zip code 94103 contains 245 units (3% of the City).
4%
45% 51%
24%
22%
54%
Rent Stabilized Permanently Affordable
Market Rate
Study Area
City
Types of Housing in Study Area and City (2013) Study Area City
Permanently Affordable 4,970 15,180
Non-Profit SRO units 3,500 5,255
BMR units 340 1,525
Affordable Housing units 820 2,800
SF Housing Authority units 310 5,630
Market Rate 4,755 161,241
Rent Stabilized 11,325 186,200
Rent-controlled units 7,825 172,400
Private SRO units 3,500 13,800
All Housing Units 21,050 362,621

66 Central Market /Tenderloin Strategy 2015 | Appendix F: Baseline Neighborhood Conditions
Housing Pipeline
The area is projected to add approximately 9,700 housing units within the next ten years with more than 5,600 units likely to come online within the next five years. Of the 5,600 units in the Study Area near-term pipeline (under construction or approved), almost one in five are BMR units. This will add approximately 1,100 low and moderate-income units to the Study Area. The result of the pipeline volume will be an increase in the share of market rate housing in the neighborhood, as well as additional permanently affordable housing options for low- and moderate-income households.
Additionally, 4,000 more units are proposed in the next 10 years. The higher proportion of City pipeline in the Study Area (20 percent) indicates intense demand for housing in the area. This increase in market-rate units in the neighborhood and in the City may help to take pressure off of the existing stock.
Source: City of San Francisco
Study Area, All
Study Area, BMR
City, All
Planned 5,625 1,124 38,300
Under Construction
3,724 666 4,600
Approved 1,901 458 33,700
Proposed 4,069 477 10,900
Total Pipeline (Planned & Proposed)
9,694 1,601 49,200
25%
12%
0
2,500
5,000
7,500
Planned Proposed
Hou
sing
Units
in t
he
Pip
elin
e
Non-BMR Units BMR Units

67 Central Market /Tenderloin Strategy 2015 | Appendix F: Baseline Neighborhood Conditions
Housing No-Fault Evictions
No-fault evictions are instances where a tenant is displaced due to no fault of their own. No-fault evictions in the City in 2013 increased by over 2.6 times the rate of no-fault evictions in 2011, while rates in the Study Area did not rise at all. Rates in the Study Area are a fraction of what is taking place in the City, this is possibly due in part to the substantial amount of permanently-affordable housing managed by nonprofit or public landlords and to the fact that the larger size of apartment buildings in the Study Area tend to not lend themselves to speculation. No-fault evictions include: demolition, owner move-in, Ellis Act withdrawal, capital improvements, conversion to condominiums, and substantial renovation.
0.15
0.74
0.14
1.72
0.0
0.5
1.0
1.5
2.0
Study Area City
No F
ault E
vict
ions
per
1,0
00 h
ousi
ng
units
2011 2013
Source: Department of Public Health
2011 2013

Demographics

69 Central Market /Tenderloin Strategy 2015 | Appendix F: Baseline Neighborhood Conditions
Demographics Residents and Households
The Study Area accounts for approximately 5 percent of the City’s total population but is poised to become a larger share due to the significant housing construction in the area. In general, households are smaller than the City overall which already has a small average household size compared to the nation. This is likely a result of the significant proportion of single room occupancy units in the area. Still, there are approximately 4,600 family households in the Study Area. When considering population density, the Study Area has more than double the families per square mile than the City overall, meaning the intensity of families and families with children exceeds many other neighborhoods in San Francisco.
Source: Census 2010
Study Area City Share of City
Population 38,800 815,000 5%
Average Household Size 1.81 2.35 NA
Families in Households 4,559 151,029 3%
Percent of Families in Households
23% 30% n/a
Concentration of families, per square mile
6,704 3,220 n/a

70 Central Market /Tenderloin Strategy 2015 | Appendix F: Baseline Neighborhood Conditions
Demographics Age and Race
Source: Census 2010
The Study Area has a higher population of minority residents than the City. While proportionally the Study Area has similar amounts of children and seniors as the City, when accounting for population density, the density of children under the age of 19 is more than double the Citywide average density. In addition, the density of seniors in the Study Area is three times higher than the City. This means quality of life improvements can have a considerable positive impact on vulnerable low-income populations, especially those low-income households with children or seniors.
Study Area City
Age
Population Under 19 4,000 128,000
Percent of Population Under 19 11% 15%
Population over 65 4,600 112,000
Percent of Population over 65 13% 14%
Children and Senior Density
Population Under 19 / Square Mile 6,600 2,600
Population over 65 / Square Mile 7,600 2,400
Race/Ethnicity
Black Alone 12% 6%
Asian or Pacific Islander Alone 30% 32%
Other Race Alone 11% 7%
Percent Minority (Non-white alone) 60% 50%
Two or more races 5% 4%
Hispanic/Latino/Spanish Origin (Any Race)
22% 14%

71 Central Market /Tenderloin Strategy 2015 | Appendix F: Baseline Neighborhood Conditions
Demographics Recent Population
Source: Census 2010, AECOM
The population of the area is rapidly changing through addition of housing units either recently delivered or under construction. It is estimated that over 1 in 7 new residents in the City now live in the Study Area.
The Study Area accounts for 15 percent of Citywide population growth, compared to the 5 percent of San Francisco residents residing in the Study Area in 2010. Note that approximately 20 percent of the population moving into the recently constructed housing units will be low- and moderate-income persons taking advantage of available below market rate (BMR) units delivered with new housing developments.
Study Area City Share of City
Estimated New Residents, 2010-2014
1,070 7,090 15%

72 Central Market /Tenderloin Strategy 2015 | Appendix F: Baseline Neighborhood Conditions
Demographics Income and Poverty
Source: Census 2010, ESRI
While some of the socio-economic data for the Study Area does not reflect new tenants that moved in since 2010, the Study Area will continue housing extremely low- and very low-income populations. The preponderance of housing units remains rent stabilized with a sizeable share directly subsidized. As a result, the population contains some of the highest concentration of low-income residents in the City.
– Median Household Income. The median household income is one-third that of the city as a whole. At $24,600, more than half of the households would qualify as extremely low- or very low-income defined as 30% and 50% below median household income. In other words, more than half of the households in the Study Area would qualify for subsidized housing, be it through a tax credit project, Section 8, BMR, or other program.
– Households with incomes below $15,000 per year. This population is considered extremely low-income and is vulnerable to homelessness and economic isolation. The Federal Poverty Level for a two person household is approximately $15,900. Three times as many households in the area live below the poverty level. It is likely that a larger share are living in subsidized units available through the City and its non-profit housing providers.
– Labor Force Participation. This rate indicates the percentage of the population that is older than 16 and younger than 66 that are working or looking for work. A lower percentage of people in the area participate in the labor force. A higher population of “discouraged workers”, defined as those that are not actively seeking employment or those that are unable to find employment after long-term unemployment, could contribute to a lower labor force participation rate in the Study Area.
Study Area City
Median Household Income $24,600 $76,100
Households with income below $15,000/year 31% 10%
Labor Force Participation Rate 54% 66%

73 Central Market /Tenderloin Strategy 2015 | Appendix F: Baseline Neighborhood Conditions
Demographics Homeless Population
Source: City and County of San Francisco, Homeless Count Reports 2011 & 2013. http://sfgov.org/lhcb/reports. Map from sfgov2.org
The Study Area is located within Supervisor District 6 (which also includes SOMA). As of 2013, almost half of the City’s counted homeless population lived in District 6. The chart shows homeless counts for District 6 and the City overall.
Based on homeless counts in 2011 and 2013, the homeless population has experienced a slight increase in District 6 despite a small decrease in homelessness for the City overall.
40%
47%
60%
53%
2013
2011
District 6 Remaining City
6
Location of Homeless Individuals Map of Supervisorial Districts

Real Estate

75 Central Market /Tenderloin Strategy 2015 | Appendix F: Baseline Neighborhood Conditions
Real Estate Office Market
Source: CoStar
Availability of office space in the Study Area has dropped considerably from a high of 25 percent to a low of 4 percent. The upward rise in office lease rates aligns with the City but the drastic decrease in availability has led to continued investment in the Study Area, especially along Market Street. Additional properties are under renovation and will provide additional availability, but leasing activity remains robust with less than 7 months of supply available before all space is completely occupied.
$28
$37
$29
$46
21%
4%
16%
8%
0%
6%
12%
18%
24%
30%
$-
$10
$20
$30
$40
$50
2011 1Q 2012 1Q 2013 1Q 2014 1Q
Offic
e Ava
ilabili
ty
Ave
rage
Offic
e R
ent
Study Area: Rent City: Rent Study Area: Availability City: Availability

76 Central Market /Tenderloin Strategy 2015 | Appendix F: Baseline Neighborhood Conditions
Real Estate Office Market
Source: CoStar
Significant price escalation has occurred in the Study Area for office space. Office sales prices in the Study Area have increased in response to decreased availability (now at 4 percent) and increased lease rates (of $9 PSF).
Transaction prices in the Study Area have increased by 122 percent from 2011 to 2014 compared to a 100 percent increase for San Francisco overall, but they still remain lower than the City average despite that increase.
Year Volume
Transacted (SF)
Study Area Avg. Sales PSF
City of SF Avg Sales PSF
2011 1,272,000 $240 $275
2012 1,143,000 $296 $475
2013 245,000 $398 $400
2014 336,000 $532 $550

77 Central Market /Tenderloin Strategy 2015 | Appendix F: Baseline Neighborhood Conditions
Real Estate Retail Market
Source: CoStar
In addition to the drastic improvement in office conditions, retail vacancies have dropped in the Study Area in line with the City decrease in retail vacancies. The Study Area realized $40 million in additional taxable sales during the same period but much of those gains were from non-retail outlets (i.e. sales realized from businesses that do not have a physical storefront in the traditional sense). Thus, storefront retail activity has lagged behind the exponential growth in office activity within the Study Area.
6%
4%
3%
2%
0%
2%
4%
6%
8%
Study Area City
Ret
ail Vac
ancy
Rat
e
2011 2011 2013 2013
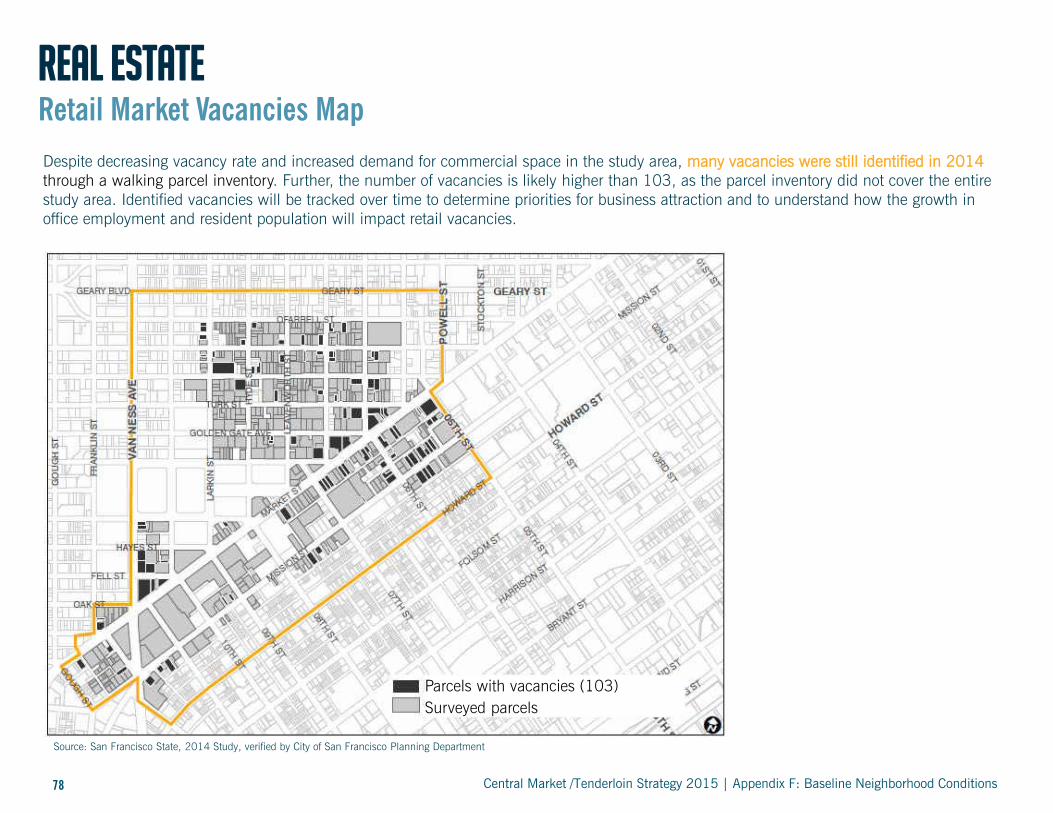
78 Central Market /Tenderloin Strategy 2015 | Appendix F: Baseline Neighborhood Conditions
Real Estate Retail Market Vacancies Map
Parcels with vacancies (103)
Surveyed parcels
Source: San Francisco State, 2014 Study, verified by City of San Francisco Planning Department
Despite decreasing vacancy rate and increased demand for commercial space in the study area, many vacancies were still identified in 2014 through a walking parcel inventory. Further, the number of vacancies is likely higher than 103, as the parcel inventory did not cover the entire study area. Identified vacancies will be tracked over time to determine priorities for business attraction and to understand how the growth in office employment and resident population will impact retail vacancies.
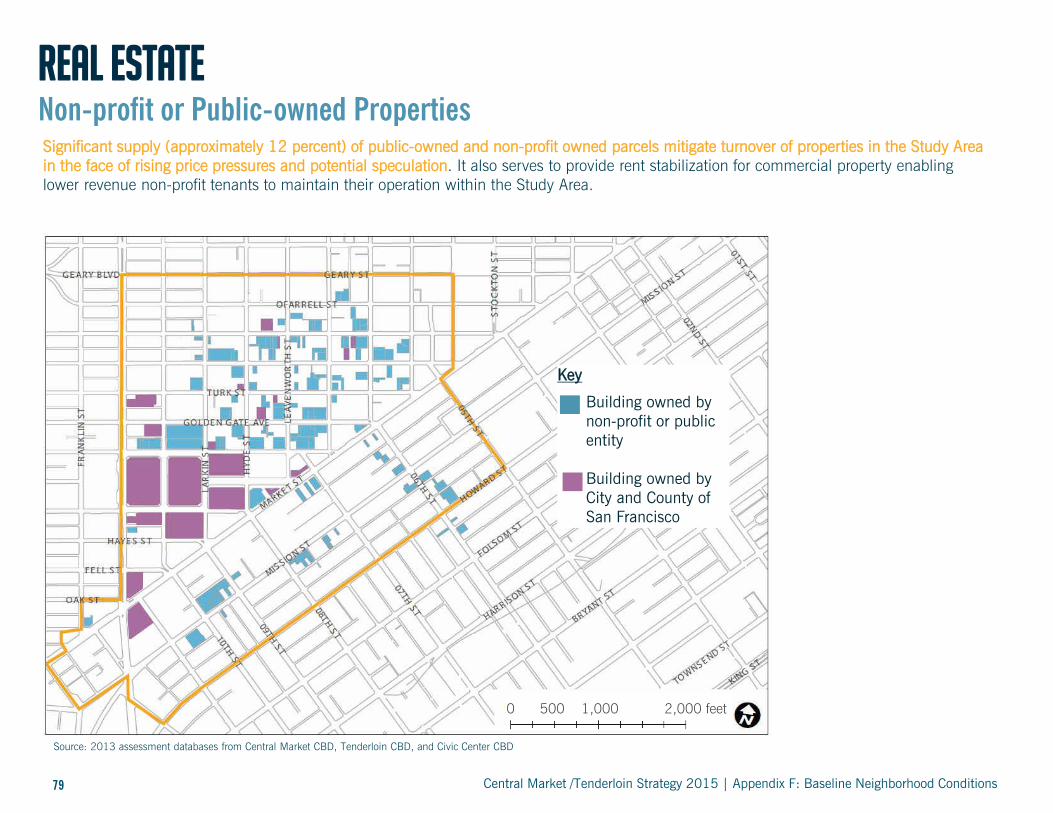
79 Central Market /Tenderloin Strategy 2015 | Appendix F: Baseline Neighborhood Conditions
Real Estate Non-profit or Public-owned Properties Significant supply (approximately 12 percent) of public-owned and non-profit owned parcels mitigate turnover of properties in the Study Area in the face of rising price pressures and potential speculation. It also serves to provide rent stabilization for commercial property enabling lower revenue non-profit tenants to maintain their operation within the Study Area.
0 500 1,000 2,000 feet
Key
Building owned by non-profit or public entity Building owned by City and County of San Francisco
Source: 2013 assessment databases from Central Market CBD, Tenderloin CBD, and Civic Center CBD

80 Central Market /Tenderloin Strategy 2015 | Appendix F: Baseline Neighborhood Conditions
Real Estate Assessed Property Value Increases
Study Area City of San Francisco
$4.0B
$4.5B
$2.50
$3.25
$4.00
$4.75
2011 2013
Ass
esse
d V
alue
of R
eal Pro
per
ty,
in B
illio
ns
of D
olla
rs
$151B
$165B
$100
$125
$150
$175
2011 2013
Ass
esse
d V
alue
of R
eal Pro
per
ty,
in B
illio
ns
of D
olla
rs
As values of assessed real estate increase, taxes collected for the General Fund increase as well. With a number of new housing units in the pipeline and space renovations under way, the Study Area is likely to experience even more growth in property values in 2015 and 2016. Just within the two year period, property tax contributions have increased by 13 percent compared to 9 percent for the City overall. This does not account for additional gains in property transfer tax, transient occupancy tax, or sales tax which also contribute to the City’s discretionary municipal revenue. In short additional City investments in the area will only further boost the Study Area’s fiscal contribution to the City.
Source: City of San Francisco Comptroller and Assessors Property Roll

Quality of Life
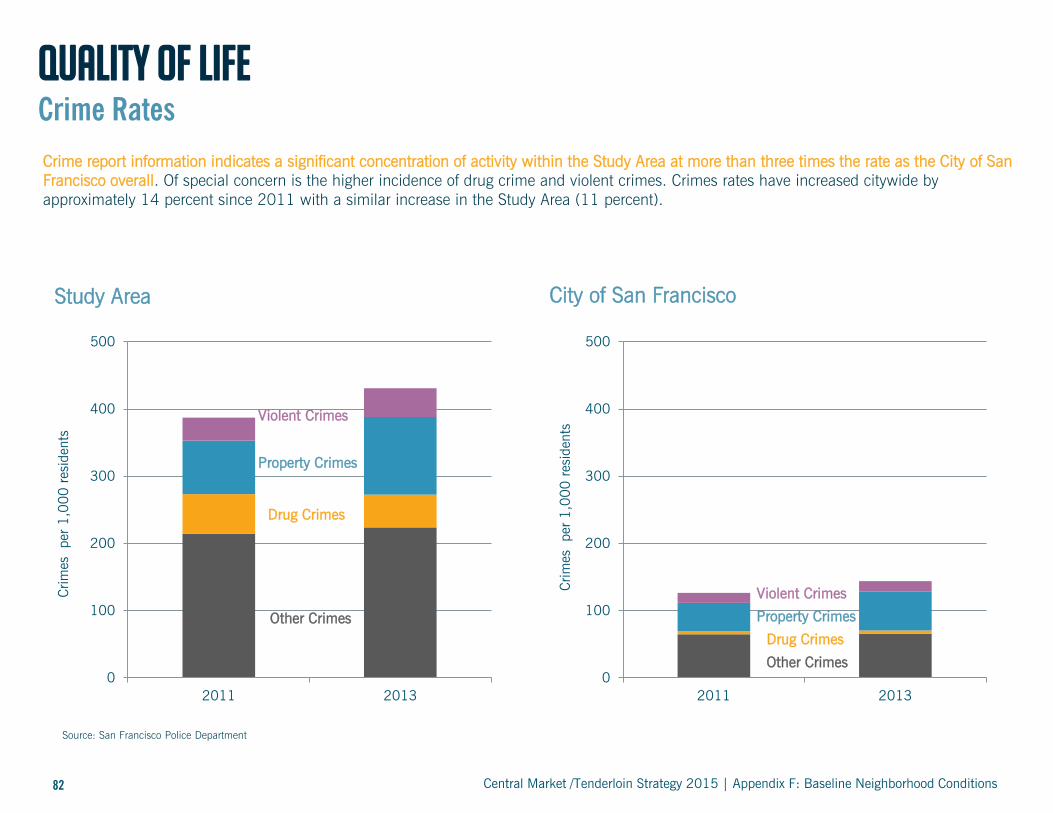
82 Central Market /Tenderloin Strategy 2015 | Appendix F: Baseline Neighborhood Conditions
Quality of Life Crime Rates
Study Area City of San Francisco
0
100
200
300
400
500
2011 2013
Crim
es
per
1,0
00 r
esid
ents
0
100
200
300
400
500
2011 2013
Crim
es
per
1,0
00 r
esid
ents
Source: San Francisco Police Department
Other Crimes
Drug Crimes
Property Crimes
Violent Crimes
Violent Crimes
Other Crimes
Drug Crimes
Property Crimes
Crime report information indicates a significant concentration of activity within the Study Area at more than three times the rate as the City of San Francisco overall. Of special concern is the higher incidence of drug crime and violent crimes. Crimes rates have increased citywide by approximately 14 percent since 2011 with a similar increase in the Study Area (11 percent).

83 Central Market /Tenderloin Strategy 2015 | Appendix F: Baseline Neighborhood Conditions
Quality of Life Street Cleaning Requests
Source: San Francisco DPW
The volume of 311 requests for street and sidewalk cleaning indicates that the streets and sidewalks in the Study Area are much dirtier than elsewhere in the City. The volume of requests that require steamers to clean sidewalks of debris, feces, and urine is by far the highest in the City – the Study Area accounts for 22 percent of all 311 requests for sidewalk and street cleaning. Recent observations and data not yet available for 2014 indicates the portable monitored toilets are having a measurable impact on the cleaning requests.
0.00
0.04
0.08
0.12
Study Area,2011
Study Area,2013
City, 2011 City, 2013
Req
ues
ts P
er S
ervi
ce P
opula
tion
Total Sidewalk and Street Cleaning Requests
Study Area
City Share of
City
2011 7,014 43,528 16%
2013 8,788 39,312 22%
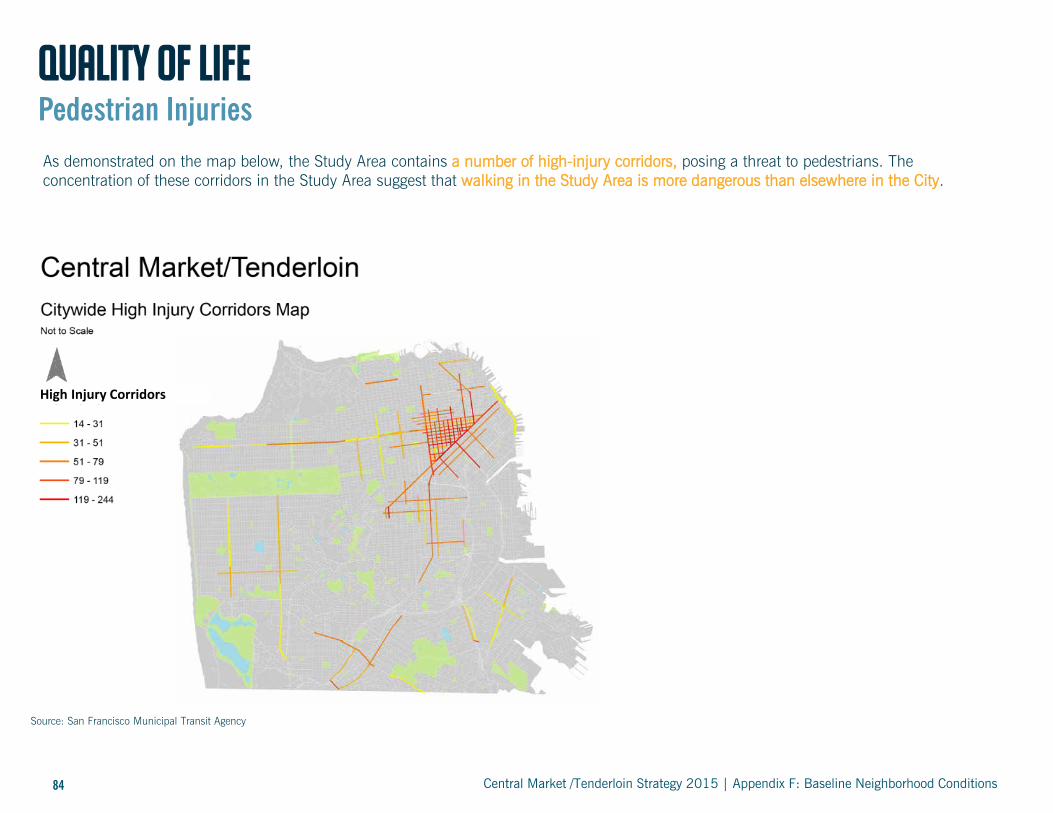
84 Central Market /Tenderloin Strategy 2015 | Appendix F: Baseline Neighborhood Conditions
Quality of Life Pedestrian Injuries
As demonstrated on the map below, the Study Area contains a number of high-injury corridors, posing a threat to pedestrians. The concentration of these corridors in the Study Area suggest that walking in the Study Area is more dangerous than elsewhere in the City.
Source: San Francisco Municipal Transit Agency
High Injury Corridors

85 Central Market /Tenderloin Strategy 2015 | Appendix F: Baseline Neighborhood Conditions
Quality of Life Age-adjusted Preventable Hospitalizations, 2010-2012
Study Area versus City
Source: San Francisco Department of Public Health. Note map depicts preventable hospitalizations from 2009-2011 and should be used for illustrative purposes only. Source: http://www.sfindicatorproject.org/indicators/view/285
The Study Area is located within the zip codes 94102 and 94103 where the incidence of preventable hospitalizations is more than double the City rate. Preventable hospitalizations are admissions to hospitals for certain acute illnesses (e.g. dehydration) or worsening chronic conditions (e.g. diabetes) that might otherwise have been managed successfully through basic primary care. In this case, the incidence of preventable hospitalizations indicates a higher proportion of vulnerable populations within the Study Area that are not being effectively treated in an appropriate outpatient setting.
0
400
800
1,200
1,600
94102 94103 SF
Adult P
reve
nta
ble
Hos
pital
izat
ions
per
100,0
00
resi
den
ts –
a
PQ
I In
dex
(Pre
vention
Qual
ity
Index
)
Adult Preventable Hospitalizations per 100,000 residents
Map by Zip Code

Central Market/Tenderloin Strategy: Appendix G 86
APPENDIX G:
Neighborhood
Public Realm
Vision
Introduction
The Central Market/Tenderloin Strategy
began with exploring the current built
environment and physical conditions in the
neighborhood. A starting point for this
exercise was to catalogue all of the public
realm projects that are currently underway
and planned for in Central Market and the
Tenderloin. Collecting information from
numerous City agencies and community
stakeholders revealed the following:
• More than 20 near-term (within the
next two years) public realm
projects are currently underway in
the neighborhood. These
improvements address issues of
pedestrian safety, sidewalk
activation and place making.
• Over the next three to five years,
numerous additional public realm
projects are proposed for the
neighborhood, including larger
urban design initiatives, a pedestrian
lighting installation and traffic
calming measures.
• Some of these mid-term efforts will
require additional funding and
greater coordination to ensure that
they are completed and leverage the
Action Items called out in the
Strategy.
After mapping and analysis of these near-
and mid-term projects, the Planning
Department, the Municipal Transportation
Agency and the Department of Public Works
are now beginning to pursue a more holistic,
longer-term approach to public realm
improvements in support of the Strategy’s
goal – to create a diverse, healthy, mixed-
income neighborhood where safety and well-
being are within reach of all who live and
work in Central Market and the Tenderloin.
In particular, a long-term vision for public
realm projects will be instrumental in
creating streets and public spaces that are
safer, more comfortable and feel welcoming
to all.
Opportunity for Change
The opportunity to re-envision the Central
Market/Tenderloin public realm is borne out
of a confluence of economic and policy
conditions, presenting an opportune moment
for action:
• Tremendous economic growth in
Central Market. The influx of
thousands of new jobs and housing
units, along with new arts venues
and retailers over the past several
years, brings new resources and

Central Market/Tenderloin Strategy: Appendix G 87
energy to the neighborhood, along
with a call for City leadership to
address community needs that have
yet to be met.
• Adoption of the Vision Zero Policy.
In 2014, the SFMTA Board joined
the San Francisco Board of
Supervisors, SF Planning, SFDPH
and multiple other city agencies in
adopting a policy to eliminate all
traffic deaths in the City by 2024.
The Tenderloin’s high volume and
multi-lane streets put its seniors,
low-income residents, people of
color, people with disabilities and
other vulnerable populations reliant
on walking and public transit at
especially high risk for traffic-related
injury and death. (See:
http://visionzerosf.org/about/support-
for-vision-zero/, links to all agency
resolutions are at the bottom of the
page.)
• Better Market Street (BMS). This
major capital project involves a
comprehensive rethinking of how
Market Street functions. It will
reconstruct Market Street from
Octavia to the Embarcadero starting
in 2019. BMS will address
circulation (how people can
comfortably efficiently and safely
move through and across Market
Street), the physical design of
Market Street’s sidewalks and
plazas spaces. The project will
influence circulation patterns in
adjacent neighborhoods like the
Tenderloin, and has the potential to
improve connectivity between the
Tenderloin and nearby
neighborhoods.
• Excess capacity within the
Tenderloin street network. Most
streets in the Tenderloin seem
overbuilt, designed to accommodate
more cars than can actually use
them. While further research is
needed to verify this observation,
there may be opportunities to make
pedestrian safety improvements that
reduce traffic capacity without
significantly impacting mobility in
the neighborhood. The San
Francisco County Transportation
Agency’s (SFCTA) Tenderloin-Little
Saigon Neighborhood Transportation
Plan published in 2007 outlined
numerous opportunities for
transportation improvements in the
neighborhood like converting 1-way
streets to 2-way streets, installing
pedestrian bulb-outs and simplifying
the Muni routes in the
neighborhood. The Eddy and Ellis
Street 2-way conversions and
recently completed intersection
daylighting projects were the first
projects to come out of this planning
effort.
• California Environmental Quality Act
(CEQA) reform. The Governor’s
Office of Planning and Research is
currently developing a new standard
for evaluating proposed
transportation projects, which is
expected to significantly reduce the
time and cost for implementing
sustainable and safe transportation
projects.
• The City’s recent pioneering of
innovative and low-cost design and
place making tools. San Francisco is
a laboratory for innovation, and the
City is constantly testing and
adapting new urban design
initiatives to improve the quality of
our streets for everyone.

Central Market/Tenderloin Strategy: Appendix G 88
Public Realm Vision for
Central Market/Tenderloin
Crafting a long-term vision for the
neighborhood’s public realm will require
engineering solutions that reduce the
likelihood of people being hit by cars. It will
also require interventions that increase
people’s comfort and safety the
neighborhood. Both approaches are essential
to achieving the vision established in the
Central Market/Tenderloin Strategy – a
neighborhood of safe, clean spaces where
everyone feels welcome. Over time, these
complimentary strategies will to contribute to
the Tenderloin’s identity and sense of pride,
fostering social cohesion among the diverse
residents and denizens who call the
Tenderloin home.
Pedestrian Safety
The streets in the Tenderloin and
surrounding neighborhoods have among the
highest concentrations of pedestrian injury in
San Francisco. The reason for the high
collision rate stems from the design of the
streets themselves. Unlike other San
Francisco neighborhoods where slower two-
way residential streets prevail, most streets
in the Tenderloin are three-lane, one-way
streets. This pattern results in wider streets
High Injury Corridors
Tenderloin streets have a higher number of pedestrian injuries when compared to streets in other San
Francisco neighborhoods.

Central Market/Tenderloin Strategy: Appendix G 89
with faster moving traffic creating longer
crossing distances for pedestrians, and
increasing their exposure to moving vehicles.
These conditions in a community where
there are high numbers of residents who are
seniors, people with disabilities, and low
income residents reliant on walking and
transit contribute to high numbers of
preventable injuries and deaths on our
streets.
The Tenderloin’s current street system was
designed to shuttle cars between downtown
San Francisco and neighborhoods to the
west. Ironically, due to its dense housing
stock, relatively low supply of off-street
parking and neighborhood demographics,
the Tenderloin has the lowest rate of car
ownership in the city. In other words, the
streets in the Tenderloin are designed to
move traffic through the neighborhood at the
expense of the people who live there.
The High Injury Corridors shown on the map
above represent 6 percent of San Francisco’s
street miles, but 60 percent of severe and
fatal injuries. These Corridors were analyzed
and mapped through the City’s Walk First
project and highlight those streets where
high numbers of pedestrian injuries occur.
The Tenderloin is unique among San
Francisco neighborhoods in that, with the
exception of alleyways, every street in the
neighborhood has been identified as High
Injury Corridor. To learn more, see:
walkfirst.sfplanning.org and visionzerosf.org.
The scale of the pedestrian-safety problem in
the Tenderloin dwarfs that of other San
Francisco neighborhoods, both in terms of
the volume of people injured annually, as
well as the number of street segments that
will need to be modified in order to improve
current conditions. There are approximately
40 blocks in the Tenderloin and (depending
how one counts) roughly 100 street
segments. In an era when streetscape
improvement projects can easily cost
millions of dollars per block and take years
to complete, how can we address this
problem without breaking the City’s capital
budget?
With Vision Zero, the City of San Francisco
has embraced a policy framework that
prioritizes human safety in transportation
decision making processes. And because the
Tenderloin streets have among the highest
concentrations of pedestrian injuries, the
neighborhood is starting to receive a
heightened level of attention. Recent SFMTA
projects, such as daylighting intersections
(removing street parking at the corner to
improve pedestrian visibility) and installing
pedestrian count-down signals and crosswalk
enhancements, are welcome improvements
that will help cultivate a safer pedestrian-
friendly environment.
However, these near-term projects represent
only the first wave of pedestrian safety
improvements that will be necessary to
achieve the City’s goal by 2024. The
Tenderloin’s streets system was designed
half a century ago and no longer meets the
neighborhood’s needs, nor reflects the City’s
values (e.g. Better Streets Policy, Complete
Streets Policy, Transit First Policy or the
NACTO Urban Street Design Guidelines).
Reducing the pattern of traffic collisions in
the Tenderloin will ultimately necessitate a
more holistic and systematic restructuring of
the neighborhood’s transportation system.
The opportunity now exists to reimagine a
streets system for the Tenderloin that reflects
current City policies and transportation
needs, while acknowledging the dynamics
and character of the Tenderloin as its own
distinct neighborhood.
Let Them Use Paint
While the challenge seems daunting, it is not
insurmountable. Improving the pedestrian
environment in the Tenderloin in a timely
and cost-effective way will require a new
approach to street design in San Francisco.
It will necessitate a rethinking of the City’s
internal processes for delivering streetscape
improvements, as well as a willingness to
experiment and innovate with the methods
and materials of the improvements
themselves.

Central Market/Tenderloin Strategy: Appendix G 90
Fortunately, over the past few years San
Francisco has begun to experiment with new
low-cost/low-risk models for designing
streets through programs such as the City’s
Pavement to Parks program, SFMTA’s
temporary painted bulb-out program, and
OEWD’s Plaza Program. Through these
initiatives, the City has gained a much more
sophisticated understanding of, and
approach to, the technical, regulatory and
maintenance issues inherent to this new
generation of lighter infrastructure.
To date, the execution of these programs in
San Francisco has been largely
opportunistic. Scaling this approach to the
neighborhood level offers a path toward
addressing the transportation system in the
Tenderloin within a more reasonable budget
and timeline. Using paint as a place making
tool has several advantages over
conventional methods in that it is fast, cheap
and adaptable.
A planning process of this scale will
necessitate a coordinated effort across
several City departments to execute. For
traffic changes, Planning, SFMTA, and
Public Works will work together to perform
analysis, craft a vision, draft a plan, and
conduct community outreach. Reconfiguring
the streets will also require engineering and
design work to ensure the ideas generated in
the plan are feasible. To date, through the
Central Market/Tenderloin Strategy Public
Realm Subcommittee, City agencies have
initiated discussions around developing
formal work plans, scope and budgets for
this effort
Decorative sidewalk and painted crosswalk
at Persia Triangle Pavement to Parks Plaza.
September 2014.
Although further scoping and additional
study is required, the following steps outline
a rapid, action-oriented approach for the
Tenderloin
• Research travel patterns. The City
needs accurate traffic count, bike
count and pedestrian volume data in
order to make informed decisions
about the Tenderloin, yet much the
existing data is out of date. The City
should start by measuring traffic
volumes in the neighborhood.
• Convert three-lane, one-way streets
to two-lane, one-way streets. As an
interim step to improving pedestrian
safety, reducing the number of lanes
pedestrians must cross limits
exposure to moving vehicles and
reduces traffic speed. This step
would not require expensive signal
work and can be deployed relatively
quickly cheaply using paint. In cases
where the change in Level of Service
(a measurement of vehicle delay) is
minimal, a full Environmental
Impact Report would not be
required, enabling some streets to
be converted relatively quickly.
Other streets with higher traffic
volumes will necessitate further
study. Over time, as funding
becomes available, the City may

Central Market/Tenderloin Strategy: Appendix G 91
explore more expensive treatments
like 2-way operations and sidewalk
widening along these corridors.
• Focus on signals. Instead of
spending limited funds for a few
blocks of sidewalk widening, the
City should spend strategically to
build the signal infrastructure to
convert one-way streets to two-way
streets on key streets identified in
the SFCTA’s 2007 Tenderloin-Little
Saigon Neighborhood Transportation
Plan. Two-way traffic operations on
key streets would enable significant
improvements to the Muni and bike
networks in the neighborhood, as
well as calm traffic and improve
pedestrian conditions.
• Repurpose space to encourage
walking and biking. Once car lanes
are removed, the space will need to
be reprogrammed. Despite its street
pattern which prioritizes car traffic,
the Tenderloin has a high walking
and biking rate relative to other San
Francisco neighborhoods. Painted
sidewalks, bulb-outs, bike lanes,
and plazas are low cost treatments
that can improve pedestrian safety
by visually narrowing the right-of-
way, while adding amenities for
people walking and biking.
• Improve Muni legibility. The pattern
of one-way streets in the Tenderloin
forces bus routes to be split on
parallel streets. This makes the bus
system more complex, and difficult
to navigate. For this reason, transit
planners typically prefer routing bus
lines on two-way streets where
buses can travel each direction on
the same street. The Tenderloin-
Little Saigon Neighborhood
Transportation Plan also identified
several opportunities for two-way
conversions as a means to simplify
Muni routes. Some of these changes
will require relocation of the
overhead contact system wires.
• Incrementally widen sidewalks over
time. While the City will likely start
with paint and signals, reclaimed
pedestrian space ultimately should
be replaced with more durable
materials that are easier to
maintain. This outline should be
considered a stepping stone to a
more permanent landscape. City
leadership should commit to
allocating a dedicated funding
stream to sidewalk widening in the
Tenderloin with a goal of replacing
painted sidewalks in the
neighborhood with curbed sidewalk
extensions over the next 10-15
years.
Enhance the Public Spaces and
the Built Environment
The Tenderloin’s public life and
character are heavily impacted by the
transportation system, but other factors
in the built environment influence
people’s experience of safety as well.
Changes to public spaces can promote
positive sidewalk activity and create
attractive and welcoming spaces for all.
One advantage of including public realm
planning within the broader Central
Market/Tenderloin Strategy is the
opportunity to integrate these place-
based initiatives with other
programmatic efforts highlighted in the
Strategy.
When choosing place-based activities to
pursue as part of the larger Strategy, the
City should focus its efforts on
interventions that enhance the built
environment, especially public spaces.
The integration of arts and culture in
these projects—such as partnering with
neighborhood arts organizations and
commissioning artists to paint
crosswalks, murals, or street furniture—
is an opportunity. Cumulatively, the
following interventions can foster

Central Market/Tenderloin Strategy: Appendix G 92
community pride and neighborhood
identity
Enhance Public Spaces
• Installation of Living Innovation
Zones, Parklets, Bus Bulbs and
Temporary Art. The City has
pioneered various place-making
tools that, when well designed, can
act as magnets for positive activity.
Neighborhood public realm projects
might include parklets, public art
and similar interventions. These
types of investments typically work
best when there is an active
adjacent land use, such as a coffee
shop or museum, to help program
and watch over the space, while
encouraging pedestrian activity.
• Attention to street trees. Trees are
one of the most important elements
of the street environment. Planning
and urban design efforts should
include infill tree planting and
improved tree maintenance. Some
trees in the Tenderloin, for example,
are overgrown, darkening the
sidewalk at night.
• Implementation of Green
Connections. The density of children
living in the area is more than
double the citywide average, while
the density of seniors is three times
higher. The Planning Department’s
Green Connections Plan recently
developed a concept design for the
Tenderloin Safe Passages walking
path linking Boeddeker Park, the
Tenderloin Children’s Playground,
the Tenderloin National Forest, and
UN Plaza with an improved
pedestrian plaza at Market and
Jones Street. Now is an ideal time
to implement and develop a strategy
for maintaining and programming
the space.
Enhance the Built Environment
• Promotion of historic resources. The
Tenderloin is home to some of the
city’s oldest buildings and
architectural treasures, but many
have faded into the landscape and
are in need of maintenance.
Restoring and showcasing these
buildings can provide a stronger
sense of place and neighborhood
identity, while protecting our city’s
architectural heritage. For example,
a City-sponsored initiative for
uplighting historic building facades
could highlight the Tenderloin’s
architectural treasures while also
increasing pedestrian comfort and
safety at night.
• Activation of Building Storefronts.
Zoning can be a powerful tool for
shaping the built environment, and
in some instances is the only means
to achieve certain outcomes. While
a comprehensive rezone of the
Tenderloin is not currently under
consideration, the neighborhood’s
zoning has not been updated in
decades and may require targeted
refinements to meet current
neighborhood needs. For example,
many building facades and
storefronts lack transparency to the
street, particularly in the case of
ground-floor medical uses and social
service providers. Strategic tweaks
to the zoning code are one way to
encourage more active, public-facing
storefronts. This strategy wouldn’t
necessarily impact existing tenants
but would influence future
development in the neighborhood,
and, over time, these kinds of
strategic zoning changes can have a
significant impact on the
neighborhood character and may
reduce crime by increasing eyes on
the street.

Central Market/Tenderloin Strategy: Appendix G 89
Conclusion
The public realm vision articulated in this
document is ambitious – the spatial scale of
the proposed plan area is large and some of
the methods being considered are
unconventional. The Central
Market/Tenderloin neighborhood is a diverse
community facing new demographic
pressures, compounded by old socio-
economic challenges. Yet maintaining the
status quo is unrealistic; this city can, and
should, do better.
Challenges aside, the time is ripe for a bold
planning agenda. The Central
Market/Tenderloin neighborhood has a dense
mix of community-based organizations,
including both social service providers and
arts organizations that are mobilized and
inspired to better the quality of life for
residents and workers. The community is
experiencing an influx of private sector
investment with new employees and
residents who are eager to contribute.
The City recognizes this building momentum.
The Central Market/Tenderloin Strategy
provides an organizational framework for
harnessing this energy and coordinating it for
the betterment of the community. Strong City
leadership will be required to realize this
public realm vision and the subsequent
projects outlined in this document. The City
is ready to collaborate with the Central
Market/Tenderloin community to realize this
new public realm vison that prioritizes and
values the health, safety and well-being of
the people who live, work and visit the
neighborhood.