Central LHIN Population-based planning CATARACTS · insertion of intraocular lens prosthesis with...
29
1 1 Central LHIN Population-based planning CATARACTS January 9, 2006
Transcript of Central LHIN Population-based planning CATARACTS · insertion of intraocular lens prosthesis with...

11
Central LHIN
Population-based planning
CATARACTS
January 9, 2006

22
Notice
• The purpose of this slide deck is for information only
• Data contained in this slide deck is not intended for planning purposes, and is only to provide insight into historical volumes of cataract procedures in the Central LHIN
• All projections contained in this slide deck are for discussion purposes only

33
Major Issues with Cataract Wait Times
• WT affects other procedures– Glaucoma and macular degeneration incidence linked to aging, will
increase with demographic trends
– Other “sub-specialty” procedures not significantly affected
– Paediatrics billed at same rate, but requires more time with patient
– Both institutions and physicians have incentive to focus on cataracts only
• What is need? What is a reasonable wait time?– Provincial expert panel deemed 19 weeks appropriate for “Class 3”
priority patients
– There is no clear level of impairment that distinguishes “need” among the Wait Times Office’s Priority IV cases
– Surgery referrals can get unreasonable for patients with low levels of functional impairment (e.g. 20/25 vision), but it is the physician/patient’s choice to proceed
44
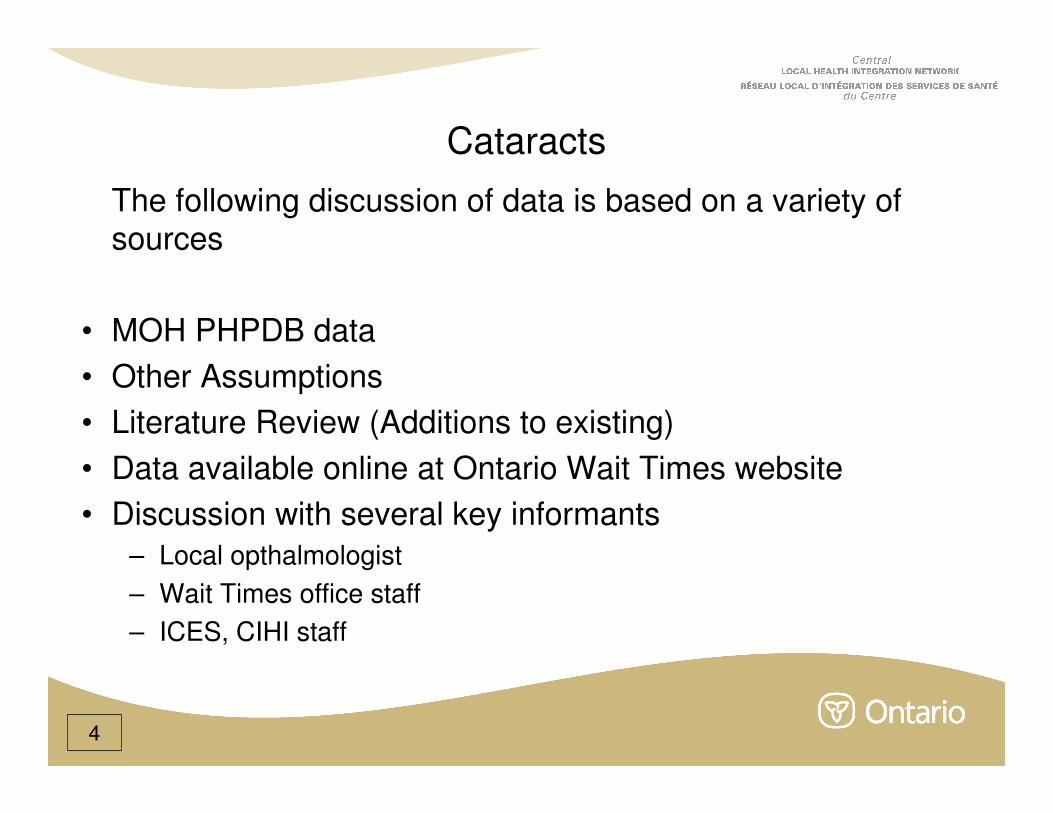
Cataracts
The following discussion of data is based on a variety of sources
• MOH PHPDB data
• Other Assumptions
• Literature Review (Additions to existing)
• Data available online at Ontario Wait Times website
• Discussion with several key informants
– Local opthalmologist
– Wait Times office staff
– ICES, CIHI staff
55
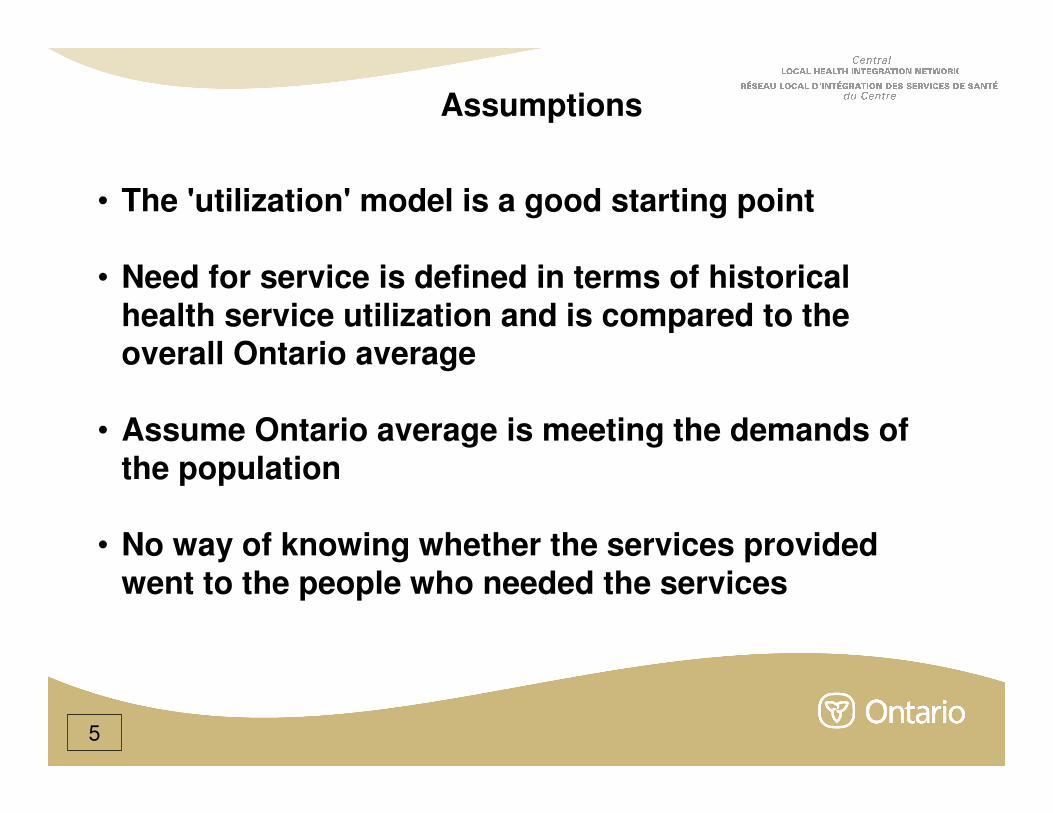
Assumptions
• The 'utilization' model is a good starting point
• Need for service is defined in terms of historical health service utilization and is compared to the overall Ontario average
• Assume Ontario average is meeting the demands of the population
• No way of knowing whether the services provided went to the people who needed the services

66
Assumptions
• Historical patterns of care can not distinguish inappropriate use by patients / inappropriate demand by providers
• Historical patterns of utilization may not reflect the current reality, i.e.
• Emergence of new treatments
• Technology
• Changes in clinical practice guidelines
• Finally, this model is not population-based, so independent variables such as prevalence, population health, and socio-economic risk factors are not included
• All population projections are based on Central LHIN population (MOF) Projections

77
Literature ReviewSource Title Source Author Info captured Use in model
Ontario's Wait Time Strategy Nadia Surani (Lalani), Ontario
Wait Times Office
Hospital-specific wait times
Wait Times benchmarks
WTO plans
Case costs
Description of allocation criteria
General Strategy info
Wait times benchmarks
ICES Atlas, 1st and 2nd ed. -
Cataract Surgery (Chapter 4)
Chaim Bell et al., ICES Age-sex prevalence per 100,000
Age-sex adjusted rate of surgery
Other characteristics of prevalence
Parameters for model
Data validation
Reference documents
Report of the Cataract Surgery
Expert Panel
Provincial Expert Panel, Joann
Trypuc
Provincial panel recommendations
Priority/"need" classification criteria
Caveats to Wait Time Strategy
Recommended Median Wait
Time (RMWT)
Limitations/Assumptions
Cataracts in the 21st Century:
lessons from previous
epidemiologic research
McCarty, C.A., et al., Clinical
and Experimental Optometry
Cataract risk factors Parameters for model
• Includes analysis of embedded references in above sources

88
Central LHIN Historical review

99
Volume Report for Cataract Procedures Central LHIN
Sum of COUNT Patient ID#
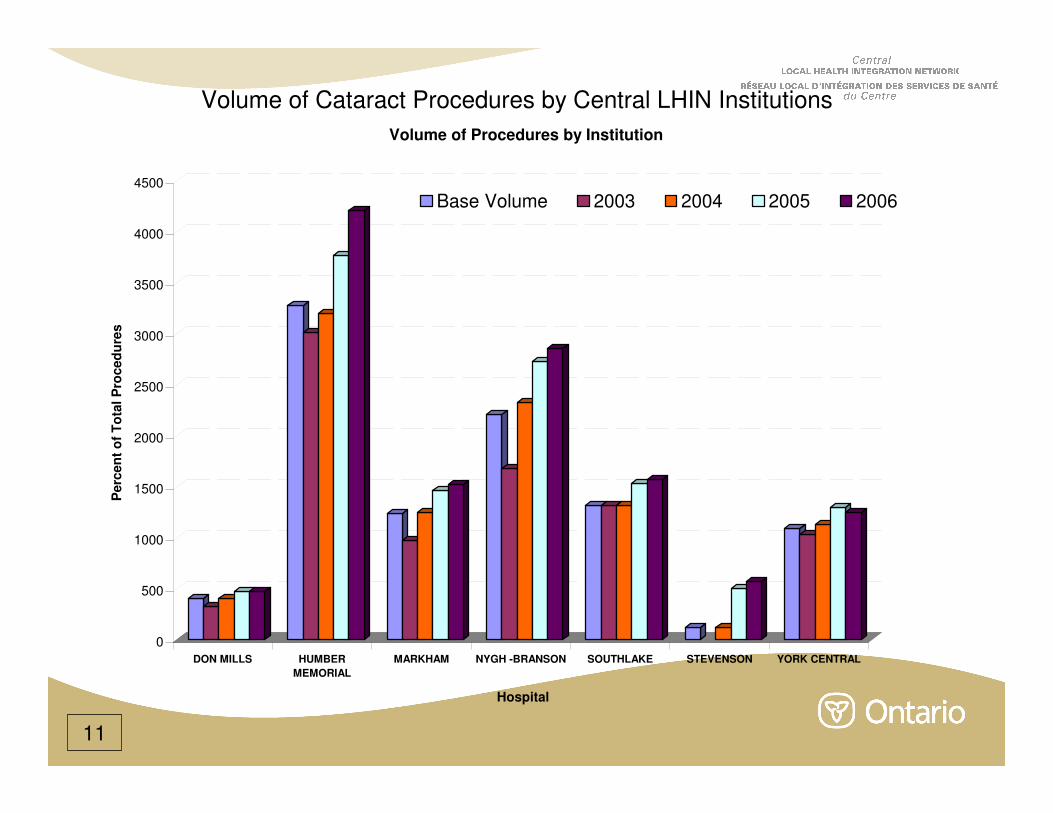
Institution Name Base Vol. 2003 2004 2005 2006 2006 wt Grand Total
DON MILLS 400 326 401 464 468 68 1,659
HUMBER MEMORIAL 3272 3,011 3,196 3,767 4,200 928 14,174
MARKHAM 1231 972 1,244 1,456 1,521 290 5,193
NYGH -BRANSON 2200 1,675 2,320 2,725 2,850 650 9,570
SOUTHLAKE 1308 1,314 1,309 1,531 1,562 254 5,716
STEVENSON 117 113 494 563 446 1,170
YORK CENTRAL 1086 1,028 1,122 1,291 1,246 160 4,687
LHIN 8 Total 9614 8,326 9,705 11,728 12,410 2,796 42,169
Institution Name Base Vol. 2003 2004 2005 2006 2006 wt Grand Total
DON MILLS 4% 4% 4% 4% 4% 2% 4%
HUMBER MEMORIAL 34% 36% 33% 32% 34% 33% 34%
MARKHAM 13% 12% 13% 12% 12% 10% 12%
NYGH -BRANSON 23% 20% 24% 23% 23% 23% 23%
SOUTHLAKE 14% 16% 13% 13% 13% 9% 14%
STEVENSON 1% 0% 1% 4% 5% 16% 3%
YORK CENTRAL 11% 12% 12% 11% 10% 6% 11%
LHIN 8 Total 100% 100% 100% 100% 100% 100% 100%
CCP: Procedure
Code
2761
2762
2772
* Data Based on CCI Codes for Cataract Procedures (from Wait Times Group) is correlated R = .998
with the CCP Data (Extraction = 1.CL.89)
** Cataract Volumes are based on out patient procedures only.
Fiscal Year
Fiscal Year
INSERTION OF INTRAOCULAR LENS PROSTHESIS WITH CATARACT
EXTRACTION, ONE-STAGE
PHAKOFRAGMENTATION AND ASPIRATION OF CATARACT
REMOVAL OF SECONDARY MEMBRANOUS CATARACT
Intervention/Procedure Description

1010
Proportion of Cataract Procedures by Central LHIN Institutions
0%
5%
10%
15%
20%
25%
30%
35%
40%
Perc
en
t o
f T
ota
l P
roced
ure
s
DON MILLS HUMBER
MEMORIAL
MARKHAM NYGH -BRANSON SOUTHLAKE STEVENSON YORK CENTRAL
Hospital
Proportion of Procedures by Institution
2003 2004 2005 2006
1111
Volume of Cataract Procedures by Central LHIN Institutions
0
500
1000
1500
2000
2500
3000
3500
4000
4500
Perc
en
t o
f T
ota
l P
roced
ure
s
DON MILLS HUMBER
MEMORIAL
MARKHAM NYGH -BRANSON SOUTHLAKE STEVENSON YORK CENTRAL
Hospital
Volume of Procedures by Institution
Base Volume 2003 2004 2005 2006

1212
Ontario Utilization Model
1313
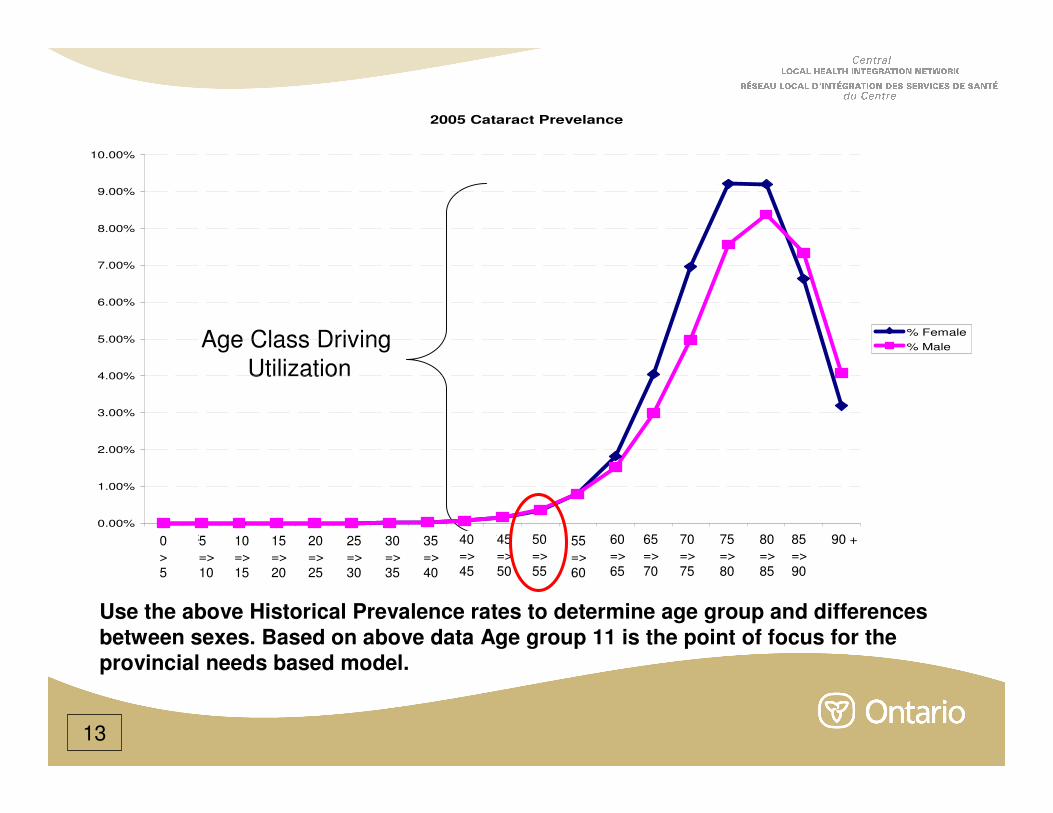
Use the above Historical Prevalence rates to determine age group and differences
between sexes. Based on above data Age group 11 is the point of focus for the
provincial needs based model.
Age Class Driving
Utilization
2005 Cataract Prevelance
0.00%
1.00%
2.00%
3.00%
4.00%
5.00%
6.00%
7.00%
8.00%
9.00%
10.00%
1 2 3 4 5 6 7 8 9 10 11 12 13 14 15 16 17 18 19
% Female
% Male
45
=>
50
50
=>
55
55
=>
60
60
=>
65
65
=>
70
70
=>
75
75
=>
80
80
=>
85
85
=>
90
90 +0
>
5
5
=>
10
10
=>
15
15
=>
20
20
=>
25
25
=>
30
30
=>
35
35
=>
40
40
=>
45

1414
Total Cataract Population - Central LHIN (Estimate)
Data 2003 2004 2005 2006 2007 2008 2009 2010 2011 2012 2013 2014 2015 2016
Sum of 50 => 55 286 296 307 319 332 345 358 371 385 398 412 424 432 435
Sum of 55 => 60 525 562 599 629 641 656 675 699 724 753 782 810 839 869
Sum of 60 => 65 837 870 909 963 1,059 1,145 1,223 1,300 1,363 1,387 1,419 1,461 1,511 1,566
Sum of 65 => 70 1,568 1,616 1,655 1,692 1,742 1,805 1,875 1,955 2,067 2,264 2,441 2,602 2,761 2,892
Sum of 70 => 75 2,425 2,486 2,512 2,546 2,583 2,626 2,688 2,749 2,808 2,890 2,996 3,113 3,246 3,430
Sum of 75 => 80 2,615 2,685 2,770 2,860 2,929 2,991 3,041 3,070 3,108 3,152 3,204 3,282 3,360 3,437
Sum of 80 => 85 1,845 2,011 2,109 2,182 2,255 2,326 2,380 2,456 2,535 2,597 2,654 2,700 2,729 2,769
Sum of 85 => 90 677 702 764 850 932 1,016 1,094 1,148 1,190 1,232 1,273 1,307 1,354 1,403
Sum of 90 => 95 159 172 180 185 189 193 201 221 243 263 283 303 322 339
Total 10,938 11,401 11,805 12,227 12,660 13,103 13,536 13,969 14,425 14,936 15,464 16,003 16,555 17,140
Based on historical provincial rates, provincial rates were
applied to the above age groups to create a estimate for the
Central LHIN
Above data was used to determine the Provincial model based
on historical provincial procedural volumes. With the
assumption that everyone in the province (Large sample size)
who needed the procedure received it, can apply this rate to
Central LHIN to determine approximate need.
1515
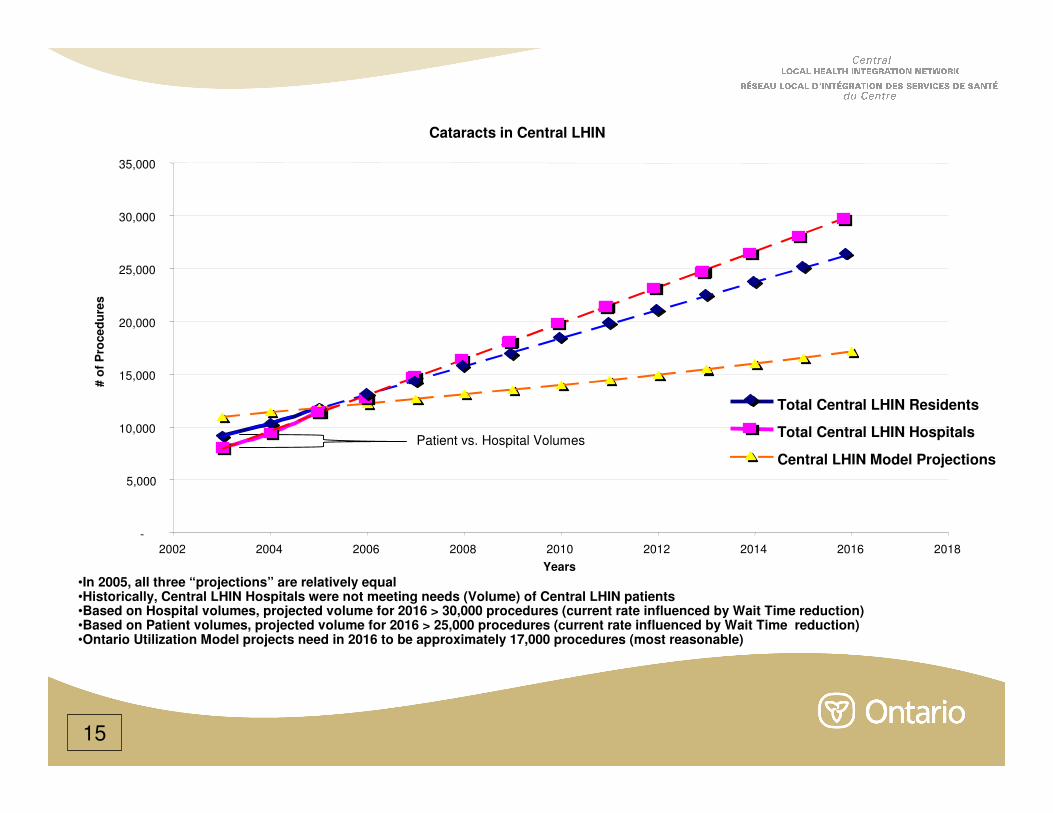
•In 2005, all three “projections” are relatively equal•Historically, Central LHIN Hospitals were not meeting needs (Volume) of Central LHIN patients•Based on Hospital volumes, projected volume for 2016 > 30,000 procedures (current rate influenced by Wait Time reduction)•Based on Patient volumes, projected volume for 2016 > 25,000 procedures (current rate influenced by Wait Time reduction)•Ontario Utilization Model projects need in 2016 to be approximately 17,000 procedures (most reasonable)
Patient vs. Hospital Volumes
Cataracts in Central LHIN
-
5,000
10,000
15,000
20,000
25,000
30,000
35,000
2002 2004 2006 2008 2010 2012 2014 2016 2018
Years
# o
f P
roce
du
res
Total Central LHIN Residents
Total Central LHIN Hospitals
Central LHIN Model Projections

1616*Distance is calculated using a standard spherical trigonometry formula for calculating distance between Longitude and Latitude of two points.
Geographic Distance* Report for Central LHIN “Northern Hospitals”
Average weighted distance,
highlighted by the oval, is
calculated using the average
weighted distance of communities where people
traveled from to the institution
that preformed the cataract
procedure.
This distance is then multiplied
by the number of procedures
performed for residents from this community, and a weighted
average for each institution is the
result.
Community of origin is assigned
based on the community and the
postal code according to the
PCCF 2004 produced by Canada Post
-79.4492 44.06112 Distance (km) 12.02
Total 1531
NEWMARKET 419 27.4% -79.45965 44.05414 1.1 477.46
HOLLAND LANDING 257 16.8% -79.48967 44.10593 5.9 1,525.09
AURORA 159 10.4% -79.46918 43.99704 7.3 1,160.25
KESWICK 141 9.2% -79.4592 44.23829 20.1 2,828.30
BRADFORD 130 8.5% -79.57564 44.11199 11.6 1,503.62
BALDWIN 129 8.4% -79.32809 44.26658 30.1 3,886.03
RICHMOND HILL 45 2.9% -79.42968 43.88659 20.1 906.13
KING CITY 25 1.6% -79.54826 43.93708 15.9 397.36
MINESING 23 1.5% -79.82981 44.44911 52.7 1,211.80
UXBRIDGE 23 1.5% -79.12103 44.10835 30.7 706.39
ALLISTON 21 1.4% -79.85862 44.1493 34.1 716.17
NORTH YORK 17 1.1% -79.41823 43.75128 34.5 586.76
BARRIE 13 0.8% -79.69022 44.38236 40.5 526.84
INNISFIL 13 0.8% -79.57217 44.33014 31.5 408.92
BEAVERTON 10 0.7% -79.14009 44.43512 48.3 482.92
BRAMPTON 10 0.7% -79.75512 43.71086 46.0 459.86
STOUFFVILLE 8 0.5% -79.25119 43.98417 18.0 143.86
THORNHILL 8 0.5% -79.42425 43.82033 26.8 214.63
ANGUS 6 0.4% -79.87988 44.31814 44.6 267.85
-79.86902 44.15736 Distance (km) 26.33
Total 494 X Y
ALLISTON 113 22.9% -79.85862 44.1493 1.2 137.90
BRAMPTON 62 12.6% -79.75512 43.71086 50.4 3,127.35
SHELBURNE 51 10.3% -80.19886 44.10612 30.2 1,537.98
HOLLAND LANDING 46 9.3% -79.48967 44.10593 30.8 1,416.25
ANGUS 25 5.1% -79.87988 44.31814 17.9 447.13
ORANGEVILLE 25 5.1% -80.10391 43.9227 32.1 803.05
KESWICK 20 4.0% -79.4592 44.23829 33.9 677.24
GEORGETOWN 18 3.6% -79.91894 43.64857 56.7 1,020.11
NEWMARKET 16 3.2% -79.45965 44.05414 34.6 553.86
BOLTON 14 2.8% -79.77353 43.88185 31.5 441.68
AURORA 13 2.6% -79.46918 43.99704 36.6 475.16
BRADFORD 9 1.8% -79.57564 44.11199 23.9 215.39
INNISFIL 8 1.6% -79.57217 44.33014 30.4 243.55
MINESING 8 1.6% -79.82981 44.44911 32.6 260.53
NORTH YORK 8 1.6% -79.41823 43.75128 57.8 462.06
KING CITY 7 1.4% -79.54826 43.93708 35.4 248.01
RICHMOND HILL 7 1.4% -79.42968 43.88659 46.2 323.61
BALDWIN 6 1.2% -79.32809 44.26658 44.8 268.54
HUTTONVILLE 6 1.2% -79.80756 43.64105 57.6 345.47
SOUTHLAKE REGIONAL HEALTH CENTRE
STEVENSON MEMORIAL HOSPITAL 2005

1717
Geographic Distance* Report for Central LHIN “Southern Hospitals”
*Distance is calculated using a standard spherical trigonometry formula for calculating distance between Longitude and Latitude of two points.
Average weighted distance,
highlighted by the oval, is
calculated using the average
weighted distance of communities where people
traveled from to the institution
that preformed the cataract
procedure.
This distance is then multiplied
by the number of procedures
performed for residents from this community, and a weighted
average for each institution is the
result.
Community of origin is assigned
based on the community and the
postal code according to the
PCCF 2004 produced by Canada Post
DON MILLS SURGICAL UNIT 2005 -79.33804 43.72337 Distance (km) 6.17
Total 464
NORTH YORK 168 36.2% -79.41823 43.75128 7.1 1,200.49
SCARBOROUGH 105 22.6% -79.26207 43.7637 7.6 794.56
TORONTO 61 13.1% -79.36636 43.69882 3.6 216.65
EAST YORK 46 9.9% -79.33454 43.70247 2.3 107.62
THORNHILL 11 2.4% -79.42425 43.82033 12.8 140.83
MISSISSAUGA 8 1.7% -79.66968 43.59349 30.3 242.51
PICKERING 7 1.5% -79.10284 43.83602 22.6 158.50
-79.2599 43.87798 Distance (km) 10.86
Total 1456
MARKHAM 651 44.7% -79.29741 43.86502 3.3 2,169.22
STOUFFVILLE 148 10.2% -79.25119 43.98417 11.8 1,749.35
SCARBOROUGH 143 9.8% -79.26207 43.7637 12.7 1,816.01
RICHMOND HILL 82 5.6% -79.42968 43.88659 13.6 1,117.71
NORTH YORK 81 5.6% -79.41823 43.75128 20.0 1,620.08
THORNHILL 50 3.4% -79.42425 43.82033 14.6 732.24
UXBRIDGE 35 2.4% -79.12103 44.10835 30.9 1,081.51
PICKERING 24 1.6% -79.10284 43.83602 13.4 322.06
WHITBY 18 1.2% -78.94132 43.90183 25.6 461.65
GOODWOOD 17 1.2% -79.1782 44.04988 20.2 343.17
AURORA 14 1.0% -79.46918 43.99704 21.3 298.75
BALDWIN 14 1.0% -79.32809 44.26658 43.5 609.27
NEWMARKET 14 1.0% -79.45965 44.05414 25.3 353.70
EAST YORK 13 0.9% -79.33454 43.70247 20.4 265.19
ETOBICOKE 9 0.6% -79.53484 43.67007 31.9 287.47
TORONTO 9 0.6% -79.36636 43.69882 21.7 194.95
AJAX 8 0.5% -79.03199 43.85609 18.4 147.35
OSHAWA 8 0.5% -78.86367 43.90663 31.9 255.08
PORT PERRY 8 0.5% -78.95007 44.10483 35.3 282.70
HOLLAND LANDING 7 0.5% -79.48967 44.10593 31.3 219.00
MAPLE 7 0.5% -79.52296 43.85604 21.2 148.49
MISSISSAUGA 7 0.5% -79.66968 43.59349 45.6 319.36
BRAMPTON 6 0.4% -79.75512 43.71086 43.8 263.07
WELLAND 6 0.4% -79.24908 42.99305 98.3 589.98
WOODBRIDGE 6 0.4% -79.58217 43.8008 27.2 163.28
MARKHAM STOUFFVILLE HOSPITAL 2005

1818
Geographic Distance Report for a Central LHIN “Southern Hospital”
*Distance is calculated using a standard spherical trigonometry formula for calculating distance between Longitude and Latitude of two points.
Average weighted distance,
highlighted by the oval, is
calculated using the average
weighted distance of communities where people
traveled from to the institution
that preformed the cataract
procedure.
This distance is then multiplied
by the number of procedures
performed for residents from this community, and a weighted
average for each institution is the
result.
Community of origin is assigned
based on the community and the
postal code according to the
PCCF 2004 produced by Canada Post
-79.44947 43.77253 Distance (km) 10.39
Total 2725
NORTH YORK 1140 41.8% -79.41823 43.75128 3.4 3,925.61
SCARBOROUGH 488 17.9% -79.26207 43.7637 20.1 9,808.80
TORONTO 280 10.3% -79.36636 43.69882 10.6 2,957.84
THORNHILL 178 6.5% -79.42425 43.82033 5.7 1,011.57
MARKHAM 146 5.4% -79.29741 43.86502 15.9 2,327.82
RICHMOND HILL 89 3.3% -79.42968 43.88659 12.8 1,136.71
YORK 70 2.6% -79.44923 43.67502 10.8 758.38
ETOBICOKE 51 1.9% -79.53484 43.67007 13.3 677.73
EAST YORK 37 1.4% -79.33454 43.70247 12.1 446.66
MISSISSAUGA 37 1.4% -79.66968 43.59349 30.6 1,132.20
WOODBRIDGE 31 1.1% -79.58217 43.8008 11.1 344.05
BRAMPTON 20 0.7% -79.75512 43.71086 25.5 509.50
PICKERING 16 0.6% -79.10284 43.83602 28.7 458.84
CONCORD 14 0.5% -79.51115 43.81326 6.7 93.86
AJAX 10 0.4% -79.03199 43.85609 34.7 347.36
MAPLE 9 0.3% -79.52296 43.85604 11.0 98.93
NEWMARKET 9 0.3% -79.45965 44.05414 31.3 281.70
WHITBY 7 0.3% -78.94132 43.90183 43.2 302.30
NORTH BAY 6 0.2% -79.44816 46.31644 282.7 1,695.93
-79.44992 43.87098 Distance (km) 11.57
Total 1291
RICHMOND HILL 540 41.8% -79.42968 43.88659 12.8 6,896.89
THORNHILL 207 16.0% -79.42425 43.82033 5.7 1,176.37
NORTH YORK 102 7.9% -79.41823 43.75128 3.4 351.24
MAPLE 94 7.3% -79.52296 43.85604 11.0 1,033.25
MARKHAM 67 5.2% -79.29741 43.86502 15.9 1,068.25
SCARBOROUGH 42 3.3% -79.26207 43.7637 15.1 632.88
CONCORD 28 2.2% -79.51115 43.81326 6.7 187.73
WOODBRIDGE 26 2.0% -79.58217 43.8008 11.1 288.55
AURORA 25 1.9% -79.46918 43.99704 25.0 624.87
TORONTO 16 1.2% -79.36636 43.69882 10.6 169.02
HUTTONVILLE 15 1.2% -79.80756 43.64105 32.3 483.89
NEWMARKET 13 1.0% -79.45965 44.05414 31.3 406.90
YORK 13 1.0% -79.44923 43.67502 10.8 140.84
BRAMPTON 12 0.9% -79.75512 43.71086 25.5 305.70
ETOBICOKE 11 0.9% -79.53484 43.67007 13.3 146.18
HOLLAND LANDING 11 0.9% -79.48967 44.10593 37.2 409.01
KING CITY 10 0.8% -79.54826 43.93708 19.9 199.23
MISSISSAUGA 9 0.7% -79.66968 43.59349 26.6 239.61
STOUFFVILLE 6 0.5% -79.25119 43.98417 28.4 170.25
YORK CENTRAL HOSPITAL 2005
NORTH YORK GENERAL HOSPITAL-

1919
Geographic Distance* Report for Central LHIN “Southern Hospitals”
*Distance is calculated using a standard spherical trigonometry formula for calculating distance between Longitude and Latitude of two points.
Average weighted distance,
highlighted by the oval, is
calculated using the average
weighted distance of communities where people
traveled from to the institution
that preformed the cataract
procedure.
This distance is then multiplied
by the number of procedures
performed for residents from this community, and a weighted
average for each institution is the
result.
Community of origin is assigned
based on the community and the
postal code according to the
PCCF 2004 produced by Canada Post
HUMBER RIVER REGIONAL HOSP-HUMBER MEM 2005 -79.5097 43.70845 Distance (km) 8.63
Total 1964
NORTH YORK 696 35.4% -79.41823 43.75128 8.8 6,090.76
ETOBICOKE 404 20.6% -79.53484 43.67007 4.7 1,906.25
YORK 381 19.4% -79.44923 43.67502 6.1 2,329.84
WOODBRIDGE 116 5.9% -79.58217 43.8008 11.8 1,368.23
TORONTO 99 5.0% -79.36636 43.69882 11.6 1,144.76
MISSISSAUGA 42 2.1% -79.66968 43.59349 20.1 842.46
SCARBOROUGH 40 2.0% -79.26207 43.7637 20.8 832.24
MAPLE 33 1.7% -79.52296 43.85604 16.4 542.32
BRAMPTON 27 1.4% -79.75512 43.71086 19.7 532.26
THORNHILL 27 1.4% -79.42425 43.82033 14.2 383.30
CONCORD 14 0.7% -79.51115 43.81326 11.6 163.04
EAST YORK 14 0.7% -79.33454 43.70247 14.1 197.19
RICHMOND HILL 9 0.5% -79.42968 43.88659 20.8 187.27
BOLTON 6 0.3% -79.77353 43.88185 28.6 171.70
HOLLAND LANDING 6 0.3% -79.48967 44.10593 44.2 265.16
HUMBER RIVER REGIONAL HOSP-YORK-FINCH 2005 -79.52736 43.75513 Distance (km) 10.69
Total 1803
NORTH YORK 783 43.4% -79.41823 43.75128 10.1 7,871.86
WOODBRIDGE 223 12.4% -79.58217 43.8008 6.7 1,497.39
ETOBICOKE 176 9.8% -79.53484 43.67007 10.1 1,781.65
THORNHILL 114 6.3% -79.42425 43.82033 11.0 1,253.37
YORK 97 5.4% -79.44923 43.67502 10.9 1,056.32
TORONTO 51 2.8% -79.36636 43.69882 14.4 732.44
MAPLE 46 2.6% -79.52296 43.85604 11.2 516.04
BRAMPTON 42 2.3% -79.75512 43.71086 20.1 842.46
CONCORD 40 2.2% -79.51115 43.81326 6.6 263.52
SCARBOROUGH 35 1.9% -79.26207 43.7637 21.3 745.87
MISSISSAUGA 31 1.7% -79.66968 43.59349 21.3 660.06
RICHMOND HILL 31 1.7% -79.42968 43.88659 16.6 513.77
MARKHAM 13 0.7% -79.29741 43.86502 22.1 287.48
HOLLAND LANDING 9 0.5% -79.48967 44.10593 39.1 351.84
EAST YORK 8 0.4% -79.33454 43.70247 16.6 132.41
NEWMARKET 7 0.4% -79.45965 44.05414 33.7 235.63
SHELBURNE 6 0.3% -80.19886 44.10612 66.4 398.36
HUTTONVILLE 5 0.3% -79.80756 43.64105 25.8 129.16

2020
Distance Patients Travel in Central LHIN for Cataract Surgery
Current Multiple Hospital Sites (FY 2005 / 2006)
10 - 20 km30%
20 - 30 km 6%
30 - 40 km 9%
40 - 50 km 1%
50 - 60 km 4%
60+ km 2%
< 10 km48%
•78% Travel 20 km or less
•22% Travel 20 km or more

2121
10 - 20 km45%
20 - 30 km 7%
30 - 40 km 9%
40 - 50 km 1%
50 - 60 km 4%
60+ km 2% < 10 km32%
Distance Patients Travel in Central LHIN for Cataract Surgery if All at
Single Southern Site (FY 2005 / 2006)
•77% Travel 20 km or less
•23% Travel 20 km or more

2222
20 - 30 km 4%
30 - 40 km 1%
40 - 50 km 1%
50 - 60 km 0%
60+ km 0%
20 - 30 km 10%
30 - 40 km 7%
40 - 50 km 4%
50 - 60 km 3%
60+ km 5%
10 - 20 km61%
< 10 km33%
10 - 20 km24%
< 10 km47%
Distance Patients Travel in Central LHIN for Cataract Surgery if at a NorthernAND Southern Location (FY 2005 / 2006)
South
North
•94% Travel 20 km or less
•6% Travel 20 km or more
•71% Travel 20 km or less
•29% Travel 20 km or more

2323
10 - 20 km54%
20 - 30 km 6%
30 - 40 km 2%
40 - 50 km 1%
50 - 60 km 1%
60+ km 1%
< 10 km35%
•89% Travel 20 km or less
•11% Travel 20 km or more
Distance Patients Travel in Central LHIN for Cataract Surgery
Northern and Southern Site Combination (FY 2005 / 2006)
2424
CommunityDON MILLS
HUMBER
MEMORIAL
YORK-
FINCHMARKHAM
NYGH -
BRANSONSOUTHLAKE
STEVENSO
NYORK CENTRAL
Grand Total
2005
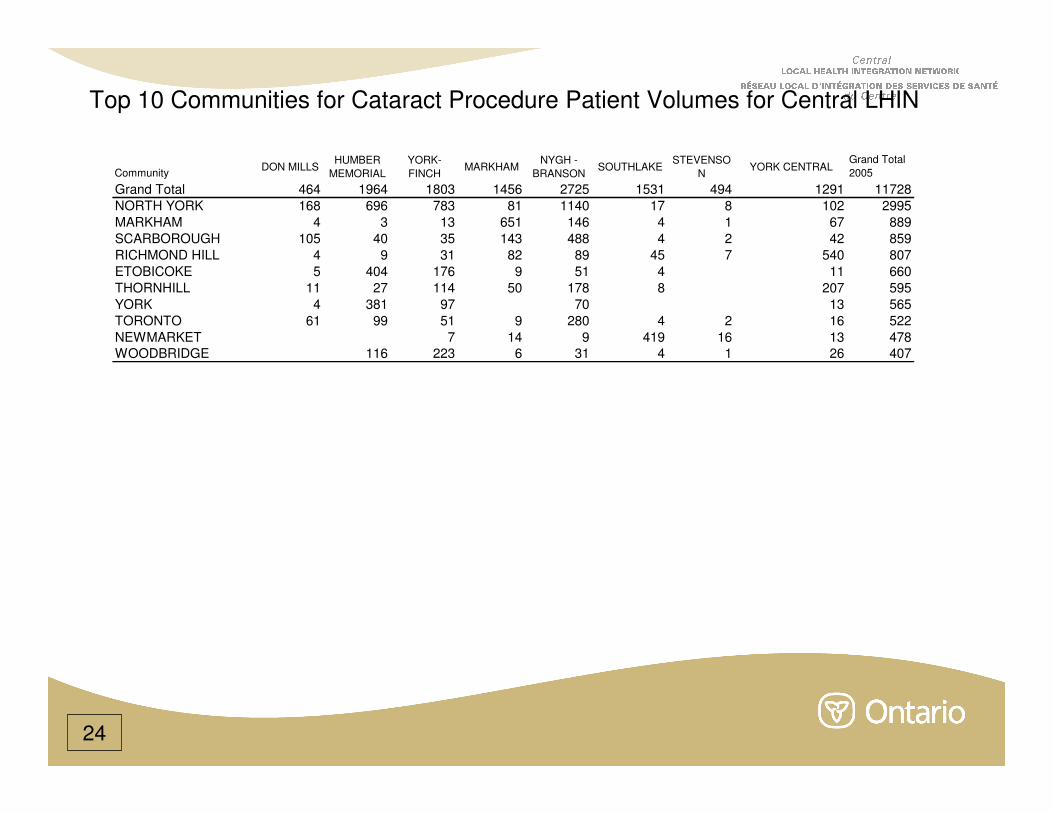
Grand Total 464 1964 1803 1456 2725 1531 494 1291 11728
NORTH YORK 168 696 783 81 1140 17 8 102 2995
MARKHAM 4 3 13 651 146 4 1 67 889
SCARBOROUGH 105 40 35 143 488 4 2 42 859
RICHMOND HILL 4 9 31 82 89 45 7 540 807
ETOBICOKE 5 404 176 9 51 4 11 660
THORNHILL 11 27 114 50 178 8 207 595
YORK 4 381 97 70 13 565
TORONTO 61 99 51 9 280 4 2 16 522
NEWMARKET 7 14 9 419 16 13 478
WOODBRIDGE 116 223 6 31 4 1 26 407
Top 10 Communities for Cataract Procedure Patient Volumes for Central LHIN
2525
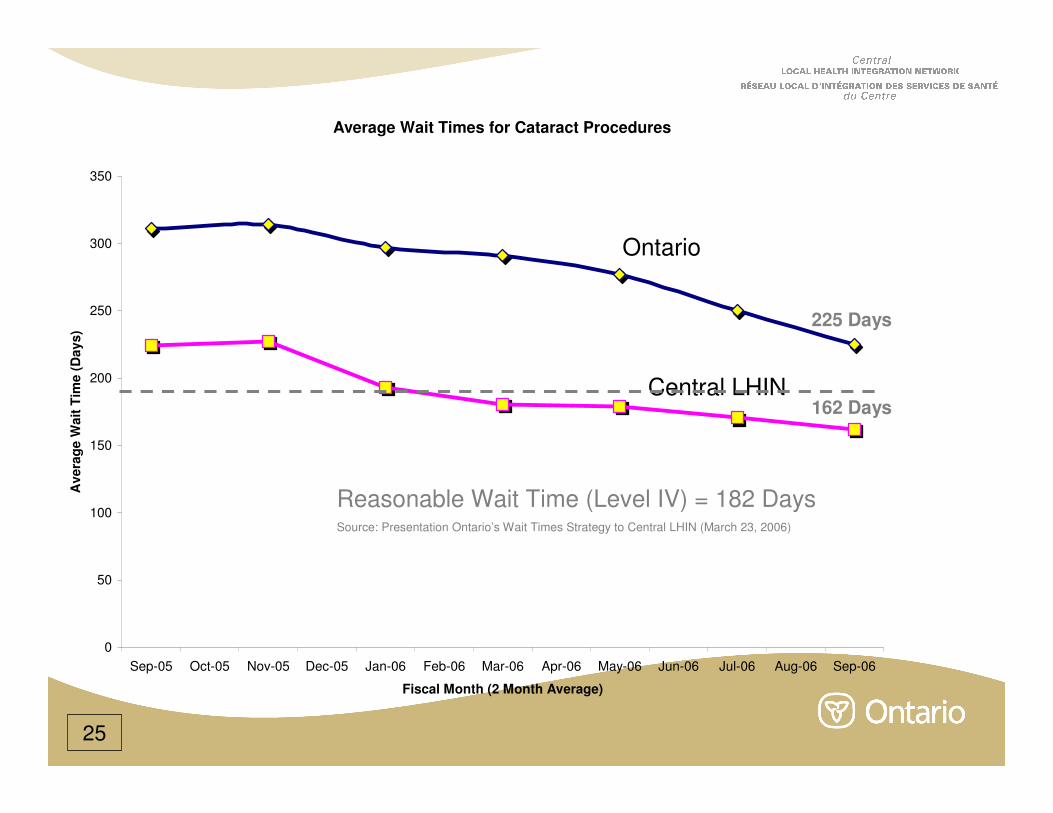
Average Wait Times for Cataract Procedures
0
50
100
150
200
250
300
350
Sep-05 Oct-05 Nov-05 Dec-05 Jan-06 Feb-06 Mar-06 Apr-06 May-06 Jun-06 Jul-06 Aug-06 Sep-06
Fiscal Month (2 Month Average)
Avera
ge W
ait
Tim
e (
Days)
Ontario
Central LHIN
Reasonable Wait Time (Level IV) = 182 DaysSource: Presentation Ontario’s Wait Times Strategy to Central LHIN (March 23, 2006)
162 Days
225 Days

2626
Area Name Year
Total Central
LHIN (Male)
Total Central
LHIN (Female) Total ICES Rates
Central 2001 4,524 6,439 10,962
Central 2002 4,733 6,700 11,433
Central 2003 4,939 6,966 11,904
Central 2004 5,139 7,216 12,355
Central 2005 5,330 7,443 12,773
Central 2006 5,536 7,619 13,155
Central 2007 5,719 7,807 13,526
Central 2008 5,907 8,004 13,911
Central 2009 6,097 8,192 14,289
Central 2010 6,285 8,389 14,674
Central 2011 6,490 8,615 15,106
Central 2012 6,734 8,900 15,634
Central 2013 6,972 9,189 16,161
Central 2014 7,206 9,477 16,683
Central 2015 7,441 9,768 17,209
Central 2016 7,681 10,060 17,741
Age Sex Rates from ICES
Report
Excluded Income Data
from ICES as it had little
correlation with actual
rates.
As indicated by LHIN
Model, highly correlated
with age sex
ICES did not publish rates
for age less than 20 years
ICES
Rates Age 0 - 20 Age 20 - 64 Age 65-74 Age 75-84 Age 85+
Male - 284 3,540 7,428 6,028
Female - 262 4,824 8,500 5,047
Age and Sex specific rates of cataract surgery per 100,000 population in Ontario (2004 / 2005)

2727
6,000
8,000
10,000
12,000
14,000
16,000
18,000
20,000
2003 2004 2005 2006 2007 2008 2009 2010 2011 2012 2013 2014 2015 2016
Fiscal Year
Vo
lum
e o
f C
ata
ract
Pro
ced
ure
s
ICES Needs Projections
Base Volume
Cataracts 9,614
Additional Funding Volume (WT)
Volume of Cataracts - Central LHIN Hospitals
Volume of Cataracts - Central LHIN Patients
Central LHIN Model Projections
Proposed Volume Cataracts (Dual Site 80 : 20 )
Central LHIN Strategy
So
uth
So
uth
So
uth
No
rth
No
rth
No
rth
Southern Collaborative
Northern Collaborative
Ontario Utilization Projections
2828
• ICES model and Original CLHIN model differ by 8.8% in 2003, and 3.5% in 2016
• There was a shortage of supply (12%) for CLHIN hospitals in 2003, have reduced % difference to 3% (almost at equilibrium) in 2005
• The additional funded volumes (through WT) are approximately equal to projected demand in 2006 / 2007 (12,410 ~ 12,227)
• Base Funded volumes (9,614) are significantly below the projected values from 2007 on
Observations

2929
Trends in Ophthalmological Procedures (2003 - 2005)
0
2000
4000
6000
8000
10000
12000
14000
2003 2004 2005
Fiscal Year
Vo
lum
e o
f P
roced
ure
s
2772
2730
2653
2250
2211
2854
2320
2399
2634
2531
2239
2269
2991
2209
2243
2422
Cataracts
Other Eye Procedures
Central LHIN