CENTRAL HIGHLANDS REGIONAL COUNCIL FLOOD MANAGEMENT REPORT
90
CENTRAL HIGHLANDS REGIONAL COUNCIL FLOOD MANAGEMENT REPORT Section A: Upper Nogoa – Fairbairn Dam Catchment Assessment and Evaluation REPORT PREPARED FOR: Central Highlands Regional Council Date: 12 th December 2011
Transcript of CENTRAL HIGHLANDS REGIONAL COUNCIL FLOOD MANAGEMENT REPORT

CENTRAL HIGHLANDS REGIONAL COUNCIL FLOOD MANAGEMENT REPORT
Section A: Upper Nogoa – Fairbairn Dam Catchment Assessment and Evaluation
REPORT PREPARED FOR:
Central Highlands Regional Council
Date: 12th December 2011

CLIENT: Central Highlands Regional Council PROJECT: Flood Management REPORT: Part A DATE: December 2010
2
IMPORTANT NOTE No part of this document may be reproduced without written permission from the Clients and C&R Consulting Pty Ltd. If this report is to form part of a larger study, or is a response to a “Request for Additional Information” from a Compliance Agency, this report must be included as an Appendix within the full report without any additions, deletions or amendments. C&R Consulting Pty Ltd do not accept any responsibility in relation to any financial and/or business decisions made for any other property or development other than that for which this information has been provided.
Dr Chris Cuff Director C&R Consulting Geochemical and Hydrobiological Solutions Pty Ltd Date:
Dr Cecily Rasmussen Director C&R Consulting Geochemical and Hydrobiological Solutions Pty Ltd Date:
CLIENT: Central Highlands Regional Council PROJECT: Flood Management REPORT: Part A DATE: December 2010
3
SUMMARY OF RELEVANT INFORMATION Project Title Nogoa Catchment Flood Study
Section A: Upper Nogoa – Fairbairn Dam Catchment Assessment and Evaluation
Property Location Catchments of the Upper Nogoa to Fairbairn Dam, Central Queensland
Project Purpose Investigate the 2010 Emerald flood event
Applicants Details Central Highlands Regional Council
Nominated Representative Peter Maguire
Title/Position Mayor
Company Central Highlands Regional Council
Postal Address PO Box 21 Emerald Q 4720
Telephone 1300 242 686
Fax: 1300 242 687
Email [email protected]
Survey Undertaken by: Mr G Kavanagh Ms K Alexander

CLIENT: Central Highlands Regional Council PROJECT: Flood Management REPORT: Part A DATE: December 2010
4
EXECUTIVE SUMMARY
A detailed Flood Management Analysis and evaluation study has been undertaken of the upper Nogoa Catchment above the Fairbairn Dam to downstream of the Urban Flood Plain at Emerald with specific focus on streams and rivers directly impacting on the town of Emerald. The main intention of these investigations was to provide Council with sufficient information to develop new strategies with respect to flood management including criteria for early notification of evacuation procedures. The investigations have involved assessment of the formation, magnitude, periodicity, flow patterns and history of event comparable to the 2008 and 2010/11 flood events. The assessment has been made involving the use of both hard and soft data including, geomorphological and hydrological techniques, site assessments and evaluation of material attained by interviews of local residents and groups. The Fairbairn dam is not specifically considered but the investigation does include an analysis of the dam in its current design and the effect it may have had on the 2008 and 2010/11 flood events. The Nogoa Catchment is a complex mix of streams and high unmonitored ranges. Rainfall over these areas may occur as discrete high intensity rainfall cells which may sit over the ranges and distribute the rainfall downstream. Flows in these streams may be synchronous which may magnify downstream effects. An additional factor that may exacerbate the degree of runoff is pre-saturation of the catchment. This occurrence, prior to the 2010 event, served to increase runoff and reduce lag times. For the 2010/11 event this reduction in lag time, resulted in synchroneity of flows thus increasing flow heights as recorded by the gauges at Craigmore and Raymond. Craigmore and Raymond are the only two gauges to measure flows above the Fairbairn Dam and consequently, considerable gaps exist in the knowledge of flows incoming into the Dam. Filling of these gaps will permit improve determination of the size of the event and thus ensure greater preparation time for the town of Emerald. It is consequently recommended that manual gauge boards be installed in the upper and sub catchments of the Nogoa River. Sites identified for these installations are close to homesteads that have demonstrated an ability to read and report rainfall and flooding events. These gauge boards should be marked with the height of the 2010/2011 flood as a reference datum. The installation of these gauge boards will assist the town of Emerald and the landholders to obtain improved assessment of risks. The installation of these manual boards should also be accompanied by diligent upkeep (i.e. annual servicing) of all existing and future gauges and rainfall stations. It is also recommended that at least two different types of flood modelling are required. The first involving rapid, predictive, risk assessment so that reasoned decision with respect to community based emergency procedures can be made at an early stage. The second type of modelling involves prediction of flood levels for defined rainfall events (e.g. AEP of 0.01) in specific portions of the catchment on individual and cumulative bases. This will permit significantly improved evaluation of risk and the potential for improved design for the protection of infrastructure.

CLIENT: Central Highlands Regional Council PROJECT: Flood Management REPORT: Part A DATE: December 2010
5
TABLE OF CONTENTS
1. INTRODUCTION .......................................................................................................... 7 1.1 SCOPE OF THE PROJECT ........................................................................... 7
2. BACKGROUND ............................................................................................................ 8 2.1 TOPOGRAPHY ............................................................................................. 8 2.2 GAUGING STATIONS AND WEATHER MONITORING ................................................ 10 2.3 LAND USE IN THE CATCHMENT ....................................................................... 11 2.4 CHANGES TO WATERWAYS ............................................................................ 11 2.5 CLIMATE ................................................................................................ 11
3. METHODOLOGY ....................................................................................................... 13 3.1 RESEARCH .............................................................................................. 13 3.2 FIELD STUDIES ........................................................................................ 13 3.3 DATA COLLECTED AND ANALYSED .................................................................... 13
4. RESULTS ................................................................................................................... 15 4.1 INTERIM REPORT ...................................................................................... 15 4.2 FINAL REPORT ......................................................................................... 15
4.2.1 Historical Society Meeting ........................................................................................ 16 4.3 UNDERSTANDING THE 2008 AND 2010/11 EVENTS ............................................. 16
4.3.1 Rainfall ...................................................................................................................... 16 4.3.2 Model ........................................................................................................................ 22 4.3.3 Mapped Flood Line ................................................................................................... 22 4.3.4 Event Triggers........................................................................................................... 23 4.3.5 Stream Flow .............................................................................................................. 25 4.3.6 Vandyke Creek ......................................................................................................... 40 4.3.7 Medway Creek .......................................................................................................... 42
5. DISCUSSION & RECOMMENDATIONS .................................................................... 44
6. REFERENCES ........................................................................................................... 46

CLIENT: Central Highlands Regional Council PROJECT: Flood Management REPORT: Part A DATE: December 2010
6
LIST OF FIGURES
Figure 1: Nogoa Catchment Elevation Model ..................................................................................... 9 Figure 2: Rainfall Cell Track for 2008 and 2010. .............................................................................. 17 Figure 3: Nogoa Catchment Zones ................................................................................................... 19 Figure 4: 26/12/2010 Rainfall Distribution ......................................................................................... 21 Figure 5: Upper Nogoa 2010 Flood Line .......................................................................................... 23 Figure 6: Wharton Creek Historical Flood Marker ............................................................................ 28 Figure 7: Buckland Creek from Kia-Ora homestead ......................................................................... 30 Figure 8: Mantuan Downs Homestead on the 27/12/2010. .............................................................. 32 Figure 9: Destruction through Barra Hole Pinch Point ...................................................................... 33 Figure 10: Pinch Point at base level (flush with top of river banks) showing height of water up
the trees. ............................................................................................................................ 35 Figure 11: Pinch Point looking from southern elevation ...................................................................... 36 Figure 12: Hill scoured out at Tresswell School .................................................................................. 36 Figure 13: Nogoa River at Raymond Yards looking towards Raymond TM ........................................ 37 Figure 14: Nogoa River and Vandyke Creek at Eumara ..................................................................... 38 Figure 15: Nogoa River at Connemara House .................................................................................... 38 Figure 16: Nogoa River at Broken Dray Sign with Glenlee on the western side of the River ............. 39 Figure 17: Nogoa River at Nandowrie................................................................................................. 39 Figure 18: Vandyke Creek looking east towards Vandyke Feedlot .................................................... 41 Figure 19: Rutland Station. Tank in bottom yards in (A) 2008, and (B) 2010. ............................ 43 Figure 20: Recommended Manual Gauge Boards .............................................................................. 45
LIST OF TABLES
Table 1: River Gauges and Rainfall Stations of the Nogoa Catchment .......................................... 10 Table 2: Rainfall Station Totals from the Carnarvon Range, 26 December 2010. .......................... 20 Table 3: Triggers for Upper Nogoa Catchment ............................................................................... 23 Table 4: Timing of flood peaks ......................................................................................................... 25 Table 5: Wharton Creek Catchment ................................................................................................ 26 Table 6: Buckland Creek Catchment. .............................................................................................. 28
LIST OF APPENDICES
Appendix 1 ........................................................................................................................................... 47 Appendix 2 ........................................................................................................................................... 51

CLIENT: Central Highlands Regional Council PROJECT: Flood Management REPORT: Part A DATE: December 2010
7
1. INTRODUCTION
C&R Consulting were commissioned by the Central Highland Regional Council (CHRC) to undertake a detailed Flood Management Analysis and Evaluation study of the Upper Nogoa River catchment above the Fairbairn Dam and including the Fairbairn Dam Spillway to downstream of the Emerald: Urban Flood Plain. The commission was in response to the re-occurrence of flooding in the Emerald area (i.e. January 2008 and December/June 2010).
The tasks required for the two studies were developed in response to discussions with the Central Highlands Regional Council and specifically focus on the streams and rivers directly impacting on the town of Emerald. The first part of this report, Section A, considers the Nogoa River catchment extending from the top of the system shown on official maps as the Nogoa River down to the Fairbairn Dam.
The studies have been undertaken to increase the range of knowledge of the area and ultimately to understand how the catchment functions. It is the intention of these combined reports to provide Council with sufficient information to assist in the development of new approaches towards flood management. It is the ultimate aim of these reports to provide the first steps in developing early notification & evacuation procedures that will assist with the prevention of damage in the Central Highlands region.
1.1 SCOPE OF THE PROJECT
The studies investigate the formation, magnitude, periodicity, and history of events similar to the 2008 and 2010/2011 flood events. The project has utilised a range of different investigative techniques including site assessments, information sessions with local residents and historical groups, and a climatological evaluation of the region. Other techniques such as analyses of fluvial characteristics of the catchment and the river systems, forensic geomorphic and hydrological analyses, and a gaps analysis of current and historical information regarding the Upper Nogoa Catchment, were also utilised. Compilation of these soft data has allowed many gaps to be filled and a clearer understanding of the size of the event in all sections of the catchment to be made.
This report does not consider the Fairbairn Dam itself, and any analysis of this facility and its function or any possible changes to it, is not covered in this report.. This report does, however, include an analysis of the dam in its current design capacity and the effects that this has had on the flood events described above.

CLIENT: Central Highlands Regional Council PROJECT: Flood Management REPORT: Part A DATE: December 2010
8
2. BACKGROUND
2.1 TOPOGRAPHY
The total size of the Nogoa catchment is 27,880km2. This report focuses only on the 16,173km2 area from the foothills of the Carnarvon Ranges in the south through to the Fairbairn Dam inlet. The catchment is bordered by two main highways, and includes all areas to the south of the Capricorn Highway from Emerald to Bogantungan, to the Carnarvon Ranges and to the west of the Gregory Development Highway from Emerald to Springsure, and to the Carnarvon Ranges/ Minerva Ranges. It should be noted that Springsure resides in the Comet Catchment.

CLIENT: Central Highlands Regional Council PROJECT: Flood Management REPORT: Part A DATE: December 2010
9
Figure 1: Nogoa Catchment Elevation Model (darker areas being higher elevation)

CLIENT: Central Highlands Regional Council PROJECT: Flood Management REPORT: Part A DATE: December 2010
10
The topography in the south (Carnarvon Ranges) is renowned for the steep escarpments and rugged ridges, with a height that reaches above 1000m above sea level (ASL) in some places. The highest areas are:
The Buckland Tableland: Above 1000m ASL on the southern edge.
Drummond Range: 900m on the western edge.
Minerva Ranges: 400-500m on the south eastern edge.
The ranges are largely sandstone and mudstone with some basalt in the southern and western reaches of the catchment. These ranges move down on to flood plains that can reach 3 - 5 km wide from the adjoining streams of the Nogoa River. Further north the ranges continue to enclose undulating open downs with a height ranging from 150 to 300m, ASL. Through the Vandyke and Buckland area in the south, there are a number of small tablelands and scarps. These rises play a large role in the flow of water through the area.
2.2 GAUGING STATIONS AND WEATHER MONITORING
The Australian Bureau of Meteorology (BOM) use ALERT (AL) and Telemetry (TM) systems to track the weather conditions over Australia. The ALERT system is a network of rainfall and river height field stations located in the catchments reporting via VHF radio to base station computers located in Council offices at Emerald and the Bureau of Meteorology in Brisbane. TM stations are stations involved in a larger network for stream flow tracking and alerting purposes.
Over the area of the defined catchment there are a total of 16 rainfall stations/river gauges. The majority of these are rainfall stations with only three being a combination of automatic rainfall and river gauging technologies. Of these three river gauges -
Three (3) are located above Emerald (the Fairbairn Dam Spillway, Craigmore and Raymond) and;
Two (2) automatic river height gauges are located upstream of Fairbairn Dam (Craigmore and Raymond. Refer Table 1).
Table 1: River Gauges and Rainfall Stations of the Nogoa Catchment
River Gauges
Gauge Number
Location Geographical Location
Records Travel time of water (peak flow) Latitude Longitude
Fairbairn Spillway
535019 -23.6525 148.0744 19km upstream of Emerald
All water that passes the spillway
4-5hrs from Spillway to Vince Lester Bridge
Craigmore 535029 | 035251
-23.8903 147.7553 70km upstream of Fairbairn Spillway along the Nogoa River
86% of dam catchment (13880km3)
2 days from Craigmore to Vince Lester Bridge
Raymond 035150 | 535039
-24.2317 147.645 130km upstream of Fairbairn Dam gauge on the Nogoa River and
80km upstream of Craigmore gauge
52% of dam catchment (8380km2)
Raymond to Craigmore 1 day (24hrs)

CLIENT: Central Highlands Regional Council PROJECT: Flood Management REPORT: Part A DATE: December 2010
11
on the Nogoa River.
A new rainfall/river gauge has been funded for the defined catchment that is to be located on the Vandyke River system upstream of the Springsure/Tambo Road Bridge.
Following the 2008 floods, a Weather Radar Station worth $3.2 million was installed just east of Emerald at the Foley Road turn off, 10km out of town. A high level of detail on storms up to 512km in circumference and in real time rainfall is available.
2.3 LAND USE IN THE CATCHMENT
In the foothills of the surrounding ranges, a large proportion of the land has been utilised for farming and grazing purposes since the late 1800‟s. The soils are fertile from the silt deposits dropped during flood events. Buffel grass (pasture grass) and cropping are common. The Emerald District was predominantly a sheep and cattle area until the 1940s, with only small pockets of land under irrigation. With the increased availability of irrigation waters, irrigated land for cropping use has increased dramatically. The Central Highland‟s weather and predators forced the hand of the graziers with cattle now dominating the livestock sector.
2.4 CHANGES TO WATERWAYS
Numerous overland flow dams and diversion streams have been constructed to supply farms with sustainable water sources. These constructions have had little effect on the normal flow of water through this area. The actual number of diversion dams and overland flow dams along the Nogoa River and its tributaries is unknown.
2.5 CLIMATE
The climate of the Central Highlands is typical of the Seasonally Arid Tropics, where rainfall is strongly seasonal, highly erratic both in duration, intensity, and periodicity, and where the majority of the summer rain falls within a very short period (occasionally within a few days) followed by extended periods of relatively little rainfall. Storm rains at the beginning of the summer wet season are sudden and intense and often restricted to isolated falls within individual catchments. Sunlight hours are high with sunny days usually in excess of 300 days per year. Evaporation is high, exceeding precipitation for approximately 80% of most years.
The combination of strongly seasonal rainfall, high sunlight days, and extreme evaporation creates an environment where the soils dry out rapidly. Under these conditions the landscape is dry and parched by the beginning of the first storm rains of the season. Runoff is rapid across the unprotected landscape. Dependent on where the rains fall, flow through the river channels is equally rapid.
Summer rainfall in the Central Highlands Region is driven by the location of the Inter Tropical Front, the North East Australian Monsoon trough and/or cyclonic activity. The pathway of the rainfall from development to the Central Highlands is dependent on the source of the event. In general, while the rainfall pathway is relatively well defined, the location of the rainfall within the band of activity is volatile, falling as isolated cells that may locate over one area for days.
The area is a zone of regular interactions between the seasonal summer rainfall associated with the Inter Tropical Front, the North East Australian Monsoon, and seasonal cyclonic activity, with the zone which receives appreciable winter rainfall associated with the tracks

CLIENT: Central Highlands Regional Council PROJECT: Flood Management REPORT: Part A DATE: December 2010
12
of low pressure systems sweeping across from the west and south west of Australia. Typically the balance between summer and winter rainfall is approximately 70 30. Intense rainfall events frequently occur when the warm tropical air intersects the cold frontal area coming up from the south. Thus, intense rainfall events are more likely to occur early in the wet season (December / January, e.g. 2008 and 2010), or late in the wet season (e.g. April 1990).
The topography of the Central Highlands region is such that it tends to guide weather events from both north and south so that the interaction points between warm air from the north and cold air from the south fall within the area. A number of areas have been identified as “hot spots” for intense activity in the Central Highlands Region. Two of these areas feed tributaries of the Nogoa River, both of which are relevant to the Emerald district.
Therefore, understanding the climate and the movements of the rain events is critical to develop probability of river flows and the adjoining flows which make for the large events if/when synchronous. If the rainfall was more regular (e.g. temperate climates where the rain falls fairly evenly throughout the year) the magnitude of the flooding event would be considerably less. This, in part, is due to the nature of the soils whereby under arid conditions impermeable soil crusts may develop which, in extreme rainfall events, lead to a runoff coefficient close to one (1).
In the Central Highlands region, rainfall and river discharge data are sparse and of short duration (often less than 50 years). Certainties in modelling data are weakened by the lack of data and modellers have resorted to the inclusion of data from overseas to extend the periodicity of the records. In temperate climates this fusion of data has a reasonable chance of prediction with a reasonable degree of certainty. In the seasonally arid tropics, the climatic conditions bear no similarity to temperate climates. Rainfall intensity, duration, and periodicity are erratic, often restricted to a few short months of the year, with rain falling as a series of intermingling cells across, or within, a catchment. Evaporation exceeds precipitation for approximately 90% of the year, often including days recording periods of heavy rainfall. Sunny days usually average a minimum of 300 days per year. Summer rains begin suddenly and runoff over the parched earth can be as high as 100% in the initial stages. Heaviest rains are associated with cyclonic and/or monsoonal activity and each event may last for weeks, with the intensity and duration of the rainfall varying continuously. Flood Prediction Models derived from temperate climatic data cannot adequately resolve the disparities in the tropical climatic data.
Thus the impacts of flooding are not only socially disruptive, but have a huge cost on the overall economy. It is therefore essential that infrastructure associated with communities and private enterprise is realistically aligned to the levels of risk associated with these events.

CLIENT: Central Highlands Regional Council PROJECT: Flood Management REPORT: Part A DATE: December 2010
13
3. METHODOLOGY
3.1 RESEARCH
There are a number of coinciding stages involved in this data collection, ranging from general research (local and State Libraries), to field work, and to the gathering of local knowledge (Historical Societies and landholder meetings).
Local and State Libraries and Historical Societies have supplied photos, stories and general data and information from all previously recorded floods within the area and surrounding catchments. Landholders have contributed significant information that have been stored in family records for decades, providing a huge untapped resource of the area.
The landholder information has been similar to the data collected from the Libraries and Historical Societies, but has focussed on flow characteristics, historical weather events and flows, rainfall data, stream characteristics, re-enactment of their experiences and the changes in flow in their time. This information allows for comparison between historical events and modern events as well as identification of patterns. This invaluable information has indicated significant differences in rainfall intensity and flow patterns during flood events.
3.2 FIELD STUDIES
Flood heights within the upper catchment have been identified through a process that included photographic evidence and the use of surveying techniques and equipment. C&R surveyed the corresponding levels (post flood heights visible via remaining debris or silt) to attain three (3) points of correspondence to determine accurate elevations and water limitations. Rubbish left in the trees, fences, and on road signage, silt marks where visible, as well as resident markings when applicable, provided significant, previously untapped, information. If three coinciding points of elevation did not jointly agree, the mark was noted, but recorded as unverified. The use of photos gathered from local residents were utilised to aid in mapping the width of the flows. A number of cross sections were also carried out in the area to establish self-regulating ability of the streams as well as flows throughout sections of the catchment.
General travel along the route of the flood waters from source (upper catchment) to end (flood plain), and the visual assessment of the terrain (such as pinch points and regulated areas), further identified flow characteristics of the streams under investigation.
A pinch point is identified as a naturally occurring or manmade restriction in the topography along any stream flow. The width of the area is small, generally less than 0.5km in width at its minimum. Pinch points can be gorges, a sharp escarpment coupled with a rise in land etc. Regulated areas are brought about by pinch points, allowing water to be pooled upstream and regulating the output downstream.
3.3 DATA COLLECTED AND ANALYSED
Data were collected and analysed to provide the following information:
Determination of gaps in present and historical information in regards to stream flow and rainfall data (i.e. gaining a better understanding of the size of the event in all sections of the catchment).

CLIENT: Central Highlands Regional Council PROJECT: Flood Management REPORT: Part A DATE: December 2010
14
Compilation, analysis and mapping of rainfall data during the months of September, October, November and December 2010 prior to, and during the event ending January 20 2011.
Definition of catchment boundaries.
Defined four (4) zones of the catchment and the relevance to prediction.
Detailed geological, geomorphological, soil, vegetation and surface hydrological mapping of the upper, middle, and lower catchments, including all sub-catchments.
Identification of stream flows in all sections of the catchments with a focus on volumes, velocities and timing.
Identification and validation of flow transport processes through the catchments.
In-field assessment of soil permeability, runoff coefficients, and infiltration capacities. Need to do this on a wet and dry season basis.
Discussions with Landholders to ascertain anecdotal information and possibly further define gaps in current knowledge. - Aided in gap identification and stream flow information and timing.
Model calibration using all data collected from the 2008 and the 2010/2011 flood events.
Forensic geomorphic and hydrological analysis to establish historical evidence of extreme flow events within sections of the catchment to better understand the occurrence probability of this event.
Analysis of climate and weather patterns throughout the catchment using all available data. - Compiled and analysed rainfall during the month of December, October and
November. - Detailed mapping of the rainfall over the catchment during the lead up to the event,
October, November and December.
Model runs and recalibrations using all data collected from the 20 and 2010/11 events.

CLIENT: Central Highlands Regional Council PROJECT: Flood Management REPORT: Part A DATE: December 2010
15
4. RESULTS
4.1 INTERIM REPORT
The interim report was conducted in the first half of 2011. From the preliminary study of the Upper Nogoa River – Fairbairn Dam Catchment an understanding of the characteristics of the sub-catchment‟s flows into Fairbairn dam was obtained. Results from the interim study include:
The topography of the land has assisted in the recognition of (a) numerous pinch points and (b) self-regulating areas (flood plains) along the streams. These identified features account for the backup waters reported, and stream flow characteristics respectively.
The identification of areas within the river where the flows are restricted and have backed up for considerable distances (i.e. ~10km). The main areas are; - Below the adjoining streams of the Nogoa and Claude Rivers. - Zone 3: Above the Raymond River gauge at Tresswell School. - Zone 2: Below the junction of Medway Creek and Nogoa River. - Zone 1: The Fairbairn Dam spillway.
The restriction areas have considerably lifted the height of upstream river waters over a distance of approximately 6-8km. This will lead to the storage of large volumes of water and a decrease in the height of the flow downstream.
High velocities and volumes of flows within the sub-catchments can now be depicted accurately from a deeper understanding of the area.
The timing of the flows indicates that most streams met at junctions at the same time, dropping silt and increasing volumes.
Rain events can be tracked across the upper catchment giving a better understanding of coinciding flows downstream.
The intensity of the rain within the upper-catchment can be used to detect the timing of adjoining flows within sub-catchments providing the topography, geomorphology and hydrodynamics of the river channel are well understood.
A data base of recorded historical events (i.e. rainfall and streamflows within the sub catchments) has been compiled.
Comparisons to historical recorded heights and flows within sub-catchments can now be made with a higher degree of reliability in the accuracy of the data bases.
Processes have been identified that will allow landholder information to be more accurately incorporated into a data set suitable for – catchment modelling, and; flow and height predictions downstream (i.e. manual gauge boards).
4.2 FINAL REPORT Since the Interim Report was submitted, further investigations have been undertaken. The information gathered is as follows;
A more complete understanding of events during the 2008 and 2010/11 events.
Cross sections in relevant areas of high flows and information gap filling.

CLIENT: Central Highlands Regional Council PROJECT: Flood Management REPORT: Part A DATE: December 2010
16
A recalibration of current models to gain a better understanding of the average occurrence interval. This has increased the; Ability to assess the probability of any future events and; Allow formulation of the prediction of flows downstream.
A flood line of the upper catchment was constructed to aid in; Infrastructure Assessment;
◦ Replacement of existing infrastructure ◦ Modification of new and existing infrastructure to better reflect what happens in
the catchment. ◦ Placement of future infrastructure downstream of the upper catchment. ◦ Assist in sustainable planned rebuilds or expansion of infrastructure. ◦ Reduced impact of downtime costs for redundant infrastructure.
Knowledge of the event triggers to allow a plan to be put in place if these triggers arise again. This was done by assessing an area greater than the catchment itself as the trigger may originate will away from the region (i.e. storm cells from the coast) but be drawn to the area along preferential climatic highways (i.e. NE, N, SW and SSW). The triggers that also had to be considered were those that may be an inherent feature of the Nogoa Warrego Triangle with its unique topographic alignments, as there are specific regional features that lead to a skewing of normal weather/climatic patterns.
The data collected has been compiled in a mapping database which incorporates GPS positions of flood heights and significant locations, photos of these areas inundated and illustrating differences in the recent 2008 and 2010 flooding events as well as notes about the area in each severe flow. C&R view this database as an opportunity for future interpretation and reference to the catchment in events such as the renowned 2008 and 2010 floods.
4.2.1 HISTORICAL SOCIETY MEETING
Information that came out of the Historical Society meeting held at the Springsure Library on the 18/05/11 was invaluable to the study. The group of people who attended the luncheon were able to recall flooding characteristics that occurred on most streams of the catchment west of Springsure. Photos and rainfall were obtained, some extending back to 1948. In their memory none had seen or heard of a flow as large as the 2010/11.
4.3 UNDERSTANDING THE 2008 AND 2010/11 EVENTS
4.3.1 RAINFALL
In 2010/11 the source of the flooding differed from the 2008 event where flows came from the Theresa Creek System to the North West of the town of Emerald and to the west from the Medway system, with adjoining flows from the Nogoa River.
The 2010/2011 flood waters came from the Medway system in conjunction with the Nogoa River and Claude River Catchments. The climatic processes that produced this rain are similar to those that pass through the region often. A rain cell tracked along the ridges and ranges above Rutland Station, through to the Carnarvon Range, and continued to move south east.

17
Figure 2: Rainfall Cell Track for 2008 and 2010.

CLIENT: Central Highlands Regional Council PROJECT: Flood Management REPORT: Part A DATE: December 2010
18
Leading up to December 2010, a large amount of localised rain went through the lower part of the catchment, saturating the northern region and causing minor stream flow. The rain continued sporadically through December until a major downpour on the 26th (averaging 145mm in 12hours across the lower region of the catchment, as per zone one identified in Figure 2). The field capacity of the catchment was filled by this early downpour.

CLIENT: Central Highlands Regional Council PROJECT: Flood Management REPORT: Part A DATE: December 2010
19
Figure 3: Nogoa Catchment Zones
CLIENT: Central Highlands Regional Council PROJECT: Flood Management REPORT: Part A DATE: December 2010
20
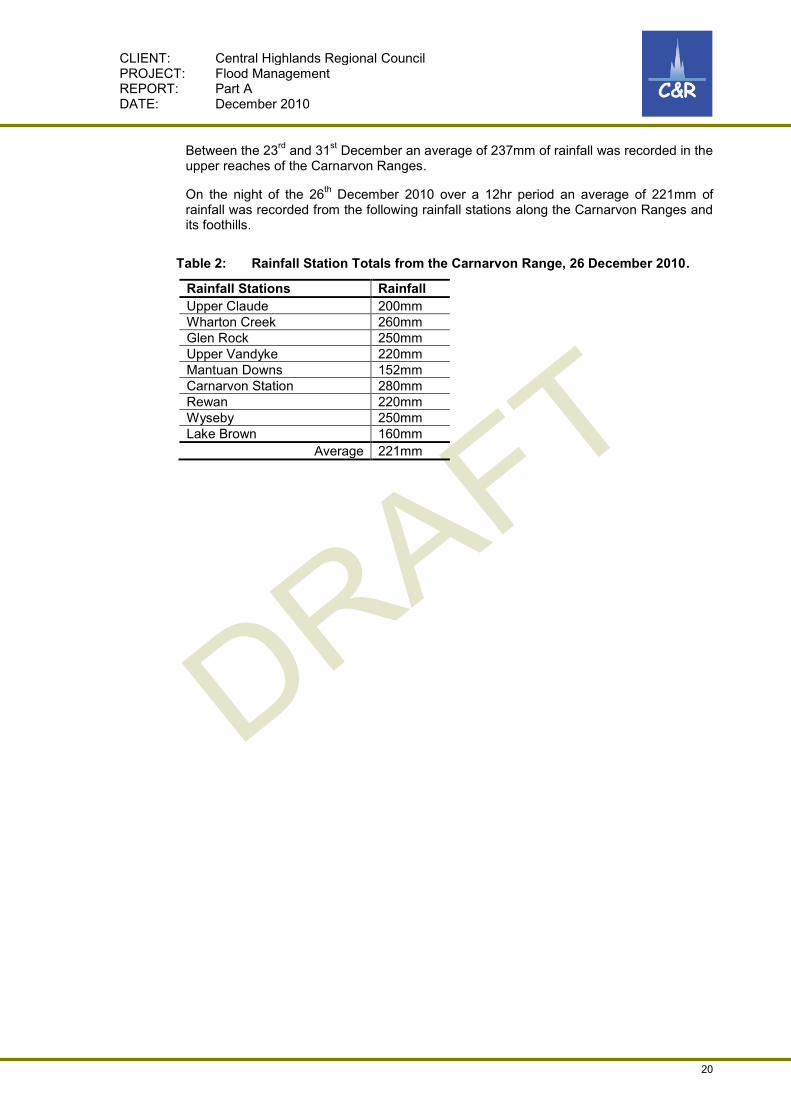
Between the 23rd and 31st December an average of 237mm of rainfall was recorded in the upper reaches of the Carnarvon Ranges.
On the night of the 26th December 2010 over a 12hr period an average of 221mm of rainfall was recorded from the following rainfall stations along the Carnarvon Ranges and its foothills.
Table 2: Rainfall Station Totals from the Carnarvon Range, 26 December 2010.
Rainfall Stations Rainfall Upper Claude 200mm Wharton Creek 260mm Glen Rock 250mm Upper Vandyke 220mm Mantuan Downs 152mm Carnarvon Station 280mm Rewan 220mm Wyseby 250mm Lake Brown 160mm
Average 221mm

CLIENT: Central Highlands Regional Council PROJECT: Flood Management REPORT: Part A DATE: December 2010
21
Figure 4: 26/12/2010 Rainfall Distribution

CLIENT: Central Highlands Regional Council PROJECT: Flood Management REPORT: Part A DATE: December 2010
22
4.3.2 MODEL
A recalibration of current models was undertaken to gain a better understanding of the average occurrence interval which has increased the;
o Ability to assess the probability of any future events and; o Allow formulation of the prediction of flows downstream.
It should be noted that for recalibration of the model, an understanding of AEP‟s and ARI‟s is essential. More details of ARI‟s and AEP‟s and their shortcomings is given in Appendix 2, AEP‟s and ARI‟s.
4.3.3 MAPPED FLOOD LINE
The flood line for the upper catchment was constructed using topographic information and data collected from the Reconstruction Authority website, in conjunction with extremity points (points which have been GPS referenced in the field and indicate the water line) and cross section data collected by C&R Consulting over the duration of the year.
A flood line of the upper catchment was constructed to assist in the identification of the reliability and efficiency of existing flood and rainfall stations for the following reasons:
Replacement of existing infrastructure
Modification of new and existing infrastructure to better reflect actual events within the catchment.
Placement of future infrastructure downstream of the upper catchment.
Assist in sustainable planned rebuilds or expansion of infrastructure.
Reduced impact of downtime costs for redundant infrastructure.
Another advantage of a mapped flood line for the upper catchment is for business purposes. For example, identification of:
Cropping areas,
Stock storage areas during the wet season,
Fencing direction to reduce maximum damage and repair costs after large out of bank flows.
It should be noted that the mapped flood line for the 2010/11 flood event is approximately 1.5 – 2m above the „normal‟ flood line and highest recorded for the area.
Figure 4 below illustrates the 2010 flood line of the upper Nogoa Catchment. The dark purple fill is the Fairbairn Dam, light purple solid fill is the flood line as posed by the Reconstruction Authority (attained off the Reconstruction Authority website) and the green line indicates the C&R proposed flood line. The flood line is based on field data such as mapped extremities from the recent flood and geographical evidence.

CLIENT: Central Highlands Regional Council PROJECT: Flood Management REPORT: Part A DATE: December 2010
23
Figure 5: Upper Nogoa 2010 Flood Line
4.3.4 EVENT TRIGGERS
From local knowledge and site visits, event triggers were established to allow a plan to be put in place if these triggers arise again. This was done by assessing the appropriate greater catchment area. Triggers may originate well away from the region (e.g. storm cells from coastal areas), but be drawn to the area along preferential climatic pathways (i.e. NE, N, SW and SSW).
Additional triggers to be considered included those that may be an inherent feature of the Nogoa Warrego Triangle with its unique topographic alignments and specific regional features leading to a skewed distribution of normal weather/climatic patterns. The established event triggers are as follows;
Table 3: Triggers for Upper Nogoa Catchment
Flow time for large to very large rain events from top of catchment to the downstream side of Emerald.
5 days
Very large rain events that produce large out of bank flows: Over 150mm.
12 hours across 65% of the catchment

CLIENT: Central Highlands Regional Council PROJECT: Flood Management REPORT: Part A DATE: December 2010
24
Over 130mm. 12 hours across 95% of the catchment Large rain events that produce small out of bank flows. Over 75mm. Over 50mm. 40mm
12hours across over 65% of catchment 12 hours across 80% of catchment 12 hours over 100% of wet catchment
Large rain events producing large out of bank flows movement through zones. Area 1: From Craigmore River Gauge to
Emerald. Area 2 is from Raymond river gauge to
Craigmore river gauge. Area 3 is from Mantuan homestead to
Raymond river gauge. Area 4 is from top of catchment to Mantuan
Homestead
48 hours 24 hours 24 hours 24 hours
Medium rain events with ¾ to full in bank flows. Area 1 is from Craigmore river gauge to
Emerald. Area 2 is from Raymond river gauge to
Craigmore river gauge. Area 3 is from Mantuan homestead to
Raymond river gauge. Area 4 is from top of catchment to Mantuan
Homestead.
60 hours 36 hours 36 hours 36 hours
Small rain events with base to mid-bank flows. Area 1 is from Craigmore river gauge to
Emerald. Area 2 is from Raymond river gauge to
Craigmore river gauge. Area 3 is from Mantuan homestead to
Raymond river gauge. Area 4 is from top of catchment to Mantuan
Homestead.
72 hours 48 hours 48 hours 48 hours
The flow times of these events will vary with catchment conditions. Dry catchment and river bed with large coverage of vegetation will slow movement of flows by
25% in small to medium events. Wet catchments and river beds will increase movement of flows by 25% in small to medium
events. Dry catchments and river beds with good vegetation coverage in large to very large events will
slow the flows through the catchment by as little as 10%. Wet catchments and river beds will reduce the time taken for the flows to move through to catchment by 10%.
.

CLIENT: Central Highlands Regional Council PROJECT: Flood Management REPORT: Part A DATE: December 2010
25
4.3.5 STREAM FLOW
The flows were tracked by the local rainfall stations and flow gauges. The monitoring systems begin at the rainfall stations in the upper reaches of the catchment. Further down the catchment, and closer to the more highly populated areas, a combination of rainfall stations and flow gauges continue to monitor the event. These are outlined above in Table 1. To ground truth the records, site visits to residents in the upper catchment were conducted over the year. Over the catchment there was a consistency from landholders with the rainfall and flow characteristics (see appendix 1 Landholder Comments). It appears in the case of 2010/11 flood, the amount of water at any one time was large, from the joining of the Buckland Creek and Nogoa River (including Wharton Creek water) which coincided at the same point in time at peak flows. Downstream when the Claude and the now Nogoa River (Buckland Creek and Wharton Creek water) joined again at peak flow there was no room for the water through the Barra hole pinch point. This pinch point in the water path is measured to be at minimum 400m wide; created by natural rises in the land with a set of small ridges on the south side and a slope on the north side. Through this area the water was measured by locating three (3) confident silt or debris marks and measured to reach 12-15m (3/4) up the established trees. With such a slowing point and ultimately three intersecting streams at peak flows caused the water from the Claude to back up and over the Mantuan Downs property. Once out of this narrowing point the water picked up velocity once again and left trees lying flat in its wake, cutting across a small hill along the access road to the Barra holes From speaking with the landholders, it appears that backing up of water in large stream flows, is not uncommon in the area dependent on the rain event and stream characteristics during the event, as mentioned by the Raymond and Mantuan residents. As the water progressed down the system other smaller tributaries aligned with the flow. The Vandyke Creek system is a system that begins in the foothills of Carnarvon Gorge south west of Springsure which carries a lot of undocumented flows, up to 14% of the total catchment above the dam. After the Raymond reading, the only other monitoring system is Craigmore, some 63km downstream of Raymond and approximately 35.5km upstream of Emerald, a two day warning window. The water through the Vandyke system was again the highest it has been, with houses being closest to inundation since being built as the waters reached approximately 2m above the „normal‟ flood line and 1m over the highest recorded flood heights. Between Vandyke and Craigmore the flow continued to stream towards the Fairbairn Dam out of its banks. It took out many fences, inundating large proportions of land along the banks of the river. Table 2 shows the timings of the peak flow through the catchment.
The data collected from each creek/river catchment has been compiled in to table 3 below. The information includes the timing of the flow, the height of the flows and accounts from the landholders. Figure 3 below illustrates the catchment in its zones, with river and creek systems as well as the telemetry devices indicated.
Table 4: Timing of flood peaks
Location Date Time (hours)
Flow Height
Water at Spillway
C&R Comments
Wharton Creek at Wharton Creek Homestead
27/12/10 0300 3.6m above flood plain
1.97m Peaked 1 hour after rain ceased. 2010 height = 3.6m 1956 height = 2.2m 1950 height = 1.4m

CLIENT: Central Highlands Regional Council PROJECT: Flood Management REPORT: Part A DATE: December 2010
26
Buckland at Kia-Ora
27/12/10 0330 1m above usual flood height
1.97m Above highest recorded flood plain
Claude at Mantuan Downs
27/12/10 0900 2.00m Over 1m higher than the highest recorded
Nogoa at Barra Holes
27/12/10 Approx. 0900
Approx. 15m
2.00m 15m from out of stream flat.
Nogoa at Nandowrie
28/12/10 0700 2.27m 92cm difference in 2008 (78cm) and 2010 (170cm) measurements
Nogoa at Raymond
28/12/10 0930 12.3m 2.35m Inundated house. 2008 = 10.85m 2010 = 12.3m 1.45m above 2008 height.
Nogoa and Vandyke at Eumara
28/12/10 Approx. 2030
2.77m Highest ever recorded
Nogoa at Craigmore
29/12/10 0900 18.16m 3.72m Highest ever recorded 2008 height = 16.25m
4.3.5.1 WHARTON CREEK
Table 5: Wharton Creek Catchment
WHARTON CREEK
Location: Wharton creek Homestead approximately 125km from Springsure
Latitude: 24°38'18.48"S | Longitude: 147°24'24.80"E
Catchment Name: Wharton Creek Catchment
Wharton Creek TM | 535038 rain fall only Catchment Size: Want to put in? Catchment Characteristics:
4.5 days to Vince Lester Bridge, or half a day to the Claude/Nogoa/Buckland intersection.
Rain Event Characteristics:
Heavy Rainfall began around 10.00pm on the 27/12/2010 and continued until approximately 2.00am on the 28/12/2010, recording 257.0mm (approximately 10 inches) in 4 hours.
Recorded Rainfall: Date Time Rainfall Total
26/12/2010 to 27/12/2010
~10.00pm to ~2.00am 257mm (~10inches) in four (4) hours
Soil Conditions Prior to Event
Moisture Content Previous Rainfall Time Period
Saturated 452mm ~18inches
136mm from 7 days of rain between 1-20th
Month of December 2010
CLIENT: Central Highlands Regional Council PROJECT: Flood Management REPORT: Part A DATE: December 2010
27
Dec ~ 5 Inches
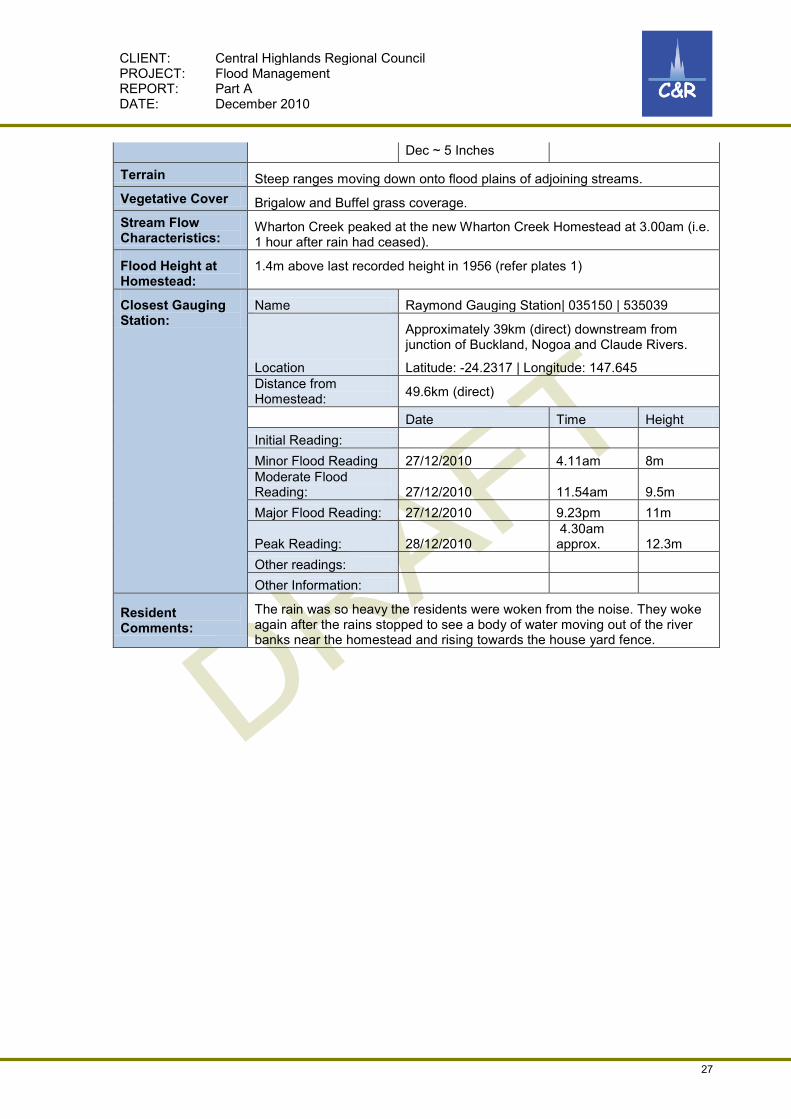
Terrain Steep ranges moving down onto flood plains of adjoining streams. Vegetative Cover Brigalow and Buffel grass coverage. Stream Flow Characteristics:
Wharton Creek peaked at the new Wharton Creek Homestead at 3.00am (i.e. 1 hour after rain had ceased).
Flood Height at Homestead:
1.4m above last recorded height in 1956 (refer plates 1)
Closest Gauging Station:
Name Raymond Gauging Station| 035150 | 535039
Location
Approximately 39km (direct) downstream from junction of Buckland, Nogoa and Claude Rivers.
Latitude: -24.2317 | Longitude: 147.645 Distance from Homestead: 49.6km (direct)
Date Time Height Initial Reading: Minor Flood Reading 27/12/2010 4.11am 8m Moderate Flood Reading: 27/12/2010 11.54am 9.5m Major Flood Reading: 27/12/2010 9.23pm 11m
Peak Reading: 28/12/2010 4.30am approx. 12.3m
Other readings: Other Information:
Resident Comments:
The rain was so heavy the residents were woken from the noise. They woke again after the rains stopped to see a body of water moving out of the river banks near the homestead and rising towards the house yard fence.

CLIENT: Central Highlands Regional Council PROJECT: Flood Management REPORT: Part A DATE: December 2010
28
Figure 6: Wharton Creek Historical Flood Marker
4.3.5.2 BUCKLAND CREEK
Table 6: Buckland Creek Catchment.
BUCKLAND CREEK
Location: Buckland Creek
Catchment Name: Buckland Creek Catchment
Catchment Size:
Catchment Characteristics:
4.5 days to Vince Lester bridge of 12hours to Buckland/Nogoa/Claude junction.
Rain Event Characteristics:
Rainfall data for the upper Buckland Creek was averaged across the catchment from all of rainfall data collected in the area.
Recorded Rainfall: Date Time Rainfall Total
Soil Conditions Prior to Event
Moisture Content Previous Rainfall Time Period
Saturated 469.2mm ~ 18.47inches between 1-31st Dec
89.1mm ~ 3.5inches
Month of December 2010

CLIENT: Central Highlands Regional Council PROJECT: Flood Management REPORT: Part A DATE: December 2010
29
between 1-20th Dec
Terrain Steep ranges moving down on to flood plains of adjoining streams.
Vegetative Cover Brigalow to open downs, mainly buffel grass coverage.
Stream Flow Characteristics:
Out of bank flows, out of control very fast moving past Kia-Ora house.
Flood Height at Homestead:
The Buckland Creek peaked at Kia-Ora between 3 and 4am, measuring 1m above the last recorded flood height in 1956.
Closest Gauging Station:
Name Raymond Gauging Station| 035150 | 535039
Location
Approximately 39km (direct) downstream from junction of Buckland, Nogoa and Claude Rivers.
Latitude: -24.2317 | Longitude: 147.645
Distance from Homestead:
Kia-Ora > 35.45km (direct)
Date Time Height
Minor Flood Reading 27/12/2010 4.11am 8m
Moderate Flood Reading: 27/12/2010 11.54am 9.5m
Major Flood Reading: 27/12/2010 9.23pm 11m
Peak Reading: 28/12/2010 4.30am approx. 12.3m
Other readings:
Other Information:
Resident Comments:
Saw silent black body of water across the paddock.
Buckland and Nogoa Junction 11.5ft (3.45m) higher than 2008

CLIENT: Central Highlands Regional Council PROJECT: Flood Management REPORT: Part A DATE: December 2010
30
Figure 7: Buckland Creek from Kia-Ora homestead
4.3.5.3 CLAUDE RIVER
CLAUDE RIVER
Location: Claude River 120km West (direct) from Springsure
Catchment Name: Claude River Catchment
Catchment Size: 1498km2
Catchment Characteristics:
4 days in high flow to reach the Vince Lester Bridge in Town.
Rain Event Characteristics:
The homestead (Mantuan) recorded 152.4mm (6 inches) in a 24hr period, with 50.8mm (2 inches) falling in the afternoon of the 26/12/2010 and 101.6mm (4 inches) overnight through to the 27/12/2010.
Recorded Rainfall: Date Time Rainfall Total
26/12/2010 24 hours 176mm ~ 6.9inches
Soil Conditions Prior to Event
Moisture Content Previous Rainfall Time Period
Saturated 341mm ~ 13.4 inches
Month of December
Terrain Steep ranges moving down on to flood plains of adjoining streams and buffel plains.
Vegetative Cover Good vegetative cover with a mix of native and buffel grassed on open downs and Brigalow country.

CLIENT: Central Highlands Regional Council PROJECT: Flood Management REPORT: Part A DATE: December 2010
31
Stream Flow Characteristics:
The flow was restricted downstream at the intersection causing water to be blocked from continuing on its path downstream. Stream heights rose very quickly on the morning of the 27th.
Flood Height at Homestead:
Mantuan Homestead ~ 9am on the 27/12/2010 at a level 1m above recorded flood line.
Closest Rainfall Station:
Name Upper Claude River Alert Station | 535086 Rain fall
Location
Approximately 34.3km (direct) upstream from junction of Buckland, Nogoa and Claude Rivers
Distance from Homestead:
Mantuan Homestead >29.3km (direct)
Date Time Reading
December 1-31/12/2010 31 days 341mm ~ 13.4 inches
1st half December 1-20/12/2010 20 days 101mm ~ 3.9 inches
2nd Half December 21-31/12/2010 10 days 240mm ~ 9.4 inches
Other readings:
Mantuan Homestead
26/12/2010 Afternoon of 26th 50.8mm
27/12/2010 Overnight 26-27 101.6mm
Other Information: Mantuan Rainfall Gauge went under water, automatic readings failed.
Closest Gauging Station:
Name Raymond Gauging Station| 035150 | 535039
Location Approximately 39km (direct) downstream from junction of Buckland, Nogoa and Claude Rivers
Latitude: -24.2317 | Longitude: 147.645
Distance from Homestead:
Mantuan Homestead >44.5km (direct)
Date Time Height
Minor Flood Reading 27/12/2010 4.11am 8m
Moderate Flood Reading:
27/12/2010 11.54am 9.5m
Major Flood Reading: 27/12/2010 9.23pm 11m
Peak Reading: 28/12/2010 4.30am approx. 12.3m
Other readings:
Other Information:
Resident Comments:
The owners considered the rain to produce a "normal" flood which it did until 9am the next morning, 27/12/2010, when the waters height increased very quickly and reached its highest ever recorded height. Mantuan Downs Managers went on to state that the flood waters rose more quickly than other floods.
No water has made it in to the Mantuan Homestead since being built until 2008

CLIENT: Central Highlands Regional Council PROJECT: Flood Management REPORT: Part A DATE: December 2010
32
and again 2010.
Historic rainfall records were lost in the flood but have been collected by BoM for its data base. A rainfall station is also located near the home and was rendered out of order.
C&R Comments It was easy to see the extent of the waters as the buffel grass had died and native grasses were growing in its place.
Figure 8: Mantuan Downs Homestead on the 27/12/2010.

CLIENT: Central Highlands Regional Council PROJECT: Flood Management REPORT: Part A DATE: December 2010
33
Figure 9: Destruction through Barra Hole Pinch Point
4.3.5.4 NOGOA RIVER
NOGOA RIVER
Location: Nogoa River starts in the foothills west of Springsure and travels for over 140km in to Fairbairn Dam.
Catchment Name: Nogoa Creek Catchment
Catchment Size: Nogoa above „Raymond” > 8,380km2
Nogoa above „Craigmore‟ > 13,900km2
Nogoa above „Fairbairn‟ > 16,173km2
Catchment Characteristics:
From foothills of Carnarvon range to the Fairbairn Dam is 4 days in large events.
Rain Event Characteristics:
Nogoa River Begins up between Wharton Creek and Claude River. There is limited rainfall information collected in the area. It is assumed to be similar to the rainfall records of both Claude Alert and Wharton Creek. All the water collected in the upper catchments eventually flows in to the Nogoa River and down to the Fairbairn Dam.
Recorded Rainfall: Date Time Total Rainfall Average
1-31/12/2010 Month of December 358.1mm (whole catchment)

CLIENT: Central Highlands Regional Council PROJECT: Flood Management REPORT: Part A DATE: December 2010
34
Zone 2 1-31/12/2010 Month of December 403.7mm
Zone 3 1-31/12/2010 Month of December 372.9mm
Zone 4 1-31/12/2010 Month of December 374.3mm
Soil Conditions Prior to Event
Moisture Content Previous Rainfall Time Period
Saturated
Terrain Steep ranges moving on to flood plains of adjoining streams.
Vegetative Cover Variety of vegetative cover from Brigalow country to buffel plains to cropping and sandy ridges.
Stream Flow Characteristics:
Out of bank flows for the length of the river.
Flood Height at Homestead:
Nogoa River Peaked at the Treswell School 92cm higher than the previous recorded flood in 2008.
Closest Gauging Station:
Name Raymond Gauging Station | 035150 | 535039
Location Approximately 39km (direct) downstream from junction of Buckland, Nogoa and Claude Rivers.
Latitude: -24.2317 | Longitude: 147.645
Distance from Homestead:
Nandowrie Homestead > 3km (direct)
Date Time Height
Minor Flood Reading 27/12/2010 4.11am 8m
Moderate Flood Reading: 27/12/2010 11.54am 9.5m
Major Flood Reading: 27/12/2010 9.23pm 11m
Peak Reading: 28/12/2010 4.30am approx. 12.3m
Other readings:
Other Information:
Additional Relevant Gauging Station:
Name Craigmore TM River Gauge | 535029 | 035251
Location Approximately 100km (direct) downstream from junction of Buckland, Nogoa and Claude Rivers.
Latitude: -23.8903 | Longitude: 147.7553
Date Time Height
Minor Flood Reading: 27/12/2010 3.16am 9.01m
Moderate Flood Reading: 27/12/2010 9.36pm 12.01m
Major Flood Reading: 28/12/2010 3.21pm 14.01m
Peak Reading: 29/12/2010 8.30am 17.76m

CLIENT: Central Highlands Regional Council PROJECT: Flood Management REPORT: Part A DATE: December 2010
35
Other readings:
Other Information:
Resident Comments:
The water had backed up so much on the west side of the school that the water surged over a small hill and scoured away revealing a stream bed. Nandowrie owners described the water passing through to have waves 6m high pulsing over the hill.
C&R Comments: Downstream at the Treswell school, surveying equipment measurements from 2008 (78cm) and 2010 (170cm) indicated a 92cm difference between the two events.
Figure 10: Pinch Point at base level (flush with top of river banks) showing height of water up the trees.

CLIENT: Central Highlands Regional Council PROJECT: Flood Management REPORT: Part A DATE: December 2010
36
Figure 11: Pinch Point looking from southern elevation
Figure 12: Hill scoured out at Tresswell School

CLIENT: Central Highlands Regional Council PROJECT: Flood Management REPORT: Part A DATE: December 2010
37
Figure 13: Nogoa River at Raymond Yards looking towards Raymond TM

CLIENT: Central Highlands Regional Council PROJECT: Flood Management REPORT: Part A DATE: December 2010
38
Figure 14: Nogoa River and Vandyke Creek at Eumara
Figure 15: Nogoa River at Connemara House
Vandyke Creek
Nogoa River

CLIENT: Central Highlands Regional Council PROJECT: Flood Management REPORT: Part A DATE: December 2010
39
Figure 16: Nogoa River at Broken Dray Sign with Glenlee on the western side of the
River
Figure 17: Nogoa River at Nandowrie

CLIENT: Central Highlands Regional Council PROJECT: Flood Management REPORT: Part A DATE: December 2010
40
4.3.6 VANDYKE CREEK
VANDYKE CREEK Location: Vandyke Creek starts km south west of Springsure Catchment Name: Vandyke Creek Catchment
Catchment Size: 2300km2 Catchment Characteristics: 3.5 days from the top of the catchment to the Fairbairn dam in large flows. Rain Event Characteristics:
Recorded Rainfall: Date Time Rainfall Total 26 – 31/12/2010 5 days 255mm ~ 10 inches
Soil Conditions Prior to Event
Moisture Content Previous Rainfall Time Period Saturated 499mm ~
19.6inches Month of December
Terrain Steep ranges on to open flood plains from adjoining streams.
Vegetative Cover Mainly buffel grass coverage and Brigalow country with rocky outcrops. Stream Flow Characteristics:
Out of bank flows with high velocity in areas. Rose and receded quickly.
Flood Height at Homestead:
Vandyke Creek peaked 1m above the „ordinary‟ flood plain at the Tambo Road crossing near Vandyke Feedlot turn off, a couple of km‟s away from the Vandyke House.
Closest Gauging Station:
Name Craigmore TM River Gauge | 535029 Location Approximately 100km (direct) downstream from
junction of Buckland, Nogoa and Claude Rivers. Latitude: -23.8903 | Longitude: 147.7553
Distance from Homestead:
Vandyke Homestead > 52km approx. (direct)
Date Time Height Minor Flood Reading 27/12/2010 3.16am 9.01m Moderate Flood Reading: 27/12/2010 9.36pm 12.01m Major Flood Reading: 28/12/2010 3.21pm 14.01m Peak Reading: 29/12/2010 8.30am 17.76m Other readings: Other Information:
Resident Comments:
C&R Comments: Cross section information findings.
Vandyke channels a large volume of water, which is missed in early readings as the water is not gauged until it reaches Craigmore Gauging Stations some 52km downstream of the Vandyke Homestead. This increases chances of being unprepared or expectant of higher flooding situations.

CLIENT: Central Highlands Regional Council PROJECT: Flood Management REPORT: Part A DATE: December 2010
41
Figure 18: Vandyke Creek looking east towards Vandyke Feedlot

CLIENT: Central Highlands Regional Council PROJECT: Flood Management REPORT: Part A DATE: December 2010
42
4.3.7 MEDWAY CREEK
Property on the outskirts of Bogantungan recorded 180mm of rain overnight, starting at 4pm in the afternoon of the 26th of December 2010. This water flows through the Medway system and generally leaves a base flow in the river during the month of December.
The Medway system had its highest recorded flood during the 2008 event. The flows during the 2010 event were much lower until the peak of the Nogoa water saw the Medway back up for some 8km exceeding the 2008 flood height at Rutland homestead on the banks of the Medway. The pinch point below the junction of the Medway and Nogoa pooled a large volume of water upstream.
MEDWAY CREEK Location: Medway Creek is found between Willows and Bogantungan. Catchment Name: Medway Creek Catchment Catchment Size: 1120km2
Catchment Characteristics:
From the top of the Medway and Borilla catchments at peak flow is 3 days to Vince Lester Bridge.
Stream Description:
The Medway had out of bank flows from water blocking up for 10km from the Kulumur Range.
Rain Event Characteristics:
Recorded Rainfall: Date Time Rainfall Total
Soil Conditions Prior to Event
Moisture Content Previous Rainfall Time Period Saturated 359.0mm ~ 14.13inches
from 1-31st Dec 221.0mm ~ 8.7inches from 1-20th Dec
Month of December 2010 (Kulumur Ranges Data base BoM)
Terrain Steep ranges moving down on to flood plains of adjoining streams with small rises and ridges through to the Fairbairn Dam Catchment.
Vegetative Cover Brigalow and breakaway country, with dispersed vegetative cover in areas, duplex soils and buffel /native plains in others.
Stream Flow Characteristics:
Water passing through wasn‟t considered a large event. Water backed up for 8km from the Kulumur Ranges is what raised the water level to 2m above the „ordinary‟ flood line in the lower parts of the Medway.
Flood Height at Homestead:
Medway Creek peaked at the Rutland House just below the side step on the Northern side of the house on the 29/12/2010.
Closest Gauging Station:
Name Craigmore TM River Gauge | 535029 Location Approximately 36km (direct) downstream from
junction of Buckland, Nogoa and Claude Rivers. Latitude: -23.8903 | Longitude: 147.7553
Distance from Homestead:
Rutland Homestead > 33km approx. (direct)
Date Time Height Minor Flood Reading 27/12/2010 3.16am 9.01m Moderate Flood Reading:
27/12/2010 9.36pm 12.01m
Major Flood Reading: 28/12/2010 3.21pm 14.01m Peak Reading: 29/12/2010 8.30am 17.76m

CLIENT: Central Highlands Regional Council PROJECT: Flood Management REPORT: Part A DATE: December 2010
43
Other readings: Other Information:
Resident Comments:
In 2008 there was a large silt deposit left after the waters resided, with air bubbles coming out of the ground on the clay pan for a day after. Whereas the 2010 waters were much cleaner but backed up 8km from the Nogoa. The coolabah trees that stood within the pinch point area looked as though a hail or wind storm had passed through as the trees had no leaves or bark left on them.
C&R Comments: Pinch point in the Nogoa River at Kulumur Range downstream from the Rutland house limited the height of the flood further downstream.
Figure 19: Rutland Station. Tank in bottom yards in (A) 2008, and (B) 2010.
A B

CLIENT: Central Highlands Regional Council PROJECT Flood Management REPORT Part A DATE: December 2010
44
5. DISCUSSION & RECOMMENDATIONS
The study indicates that the Nogoa Catchment is a complex mix of braided streams and high, untouched and unmonitored ranges. The tracking of trough movement over the ranges and the intensity of rainfall within the upper-catchment along these ranges signifies the kind of event that is likely to occur. The Nogoa floods have the ability to be damaging, as the heavy rainfall in individual cells (dependent on direction) sits over the ranges to the west and south (catchment source) and then distributes the runoff through a series of streams and rivers that eventually come together downstream. Various travel distances down each of the related streams and the timing of their flows (adjoin at same time or one after another) in relation to adjoining flows downstream also plays a part in the intensity of the flooding characteristics once the township is reached.
During the site visits it was found that the reason for such large out of bank flows was from the already saturated state of the catchment from earlier rainfall with an average of 358.1mm between the 1st and the 20th of December 2010 over all four zones. The soils had a low field capacity, reducing the amount of absorption, increasing the runoff and reducing the delay between rainfall and runoff. From the reduction in lag time, all streams were running simultaneously and at peak flows when they met at their various intersections.
These flows were recorded by the two river gauges, Raymond and Craigmore. Raymond records 33% of the catchment whereas Craigmore records 87%. At present there are gaps in data collection and monitoring leading up to and during events in the region, such as the water from Vandyke (14%) is missed by Raymond and isn‟t documented until Craigmore. The Medway catchment of 1120km2 is ungauged until it reaches the Craigmore gauge and similarly the Borilla catchment of 1000km2 is not gauged until it adjoins flows leaving the Fairbairn dam. By filling these gaps through more extensive monitoring of streams during events will aid in the timeliness of preparation. It will also allow better determination of the sizes of the event.
To do this, installation of manual gauge boards within the upper and sub catchments of the Nogoa is recommended. The identification of the position of these sites is based on the proximity of homesteads to the streams to enable safe reading and reporting during events. It is recommended that the gauges on the gauge boards be marked with the 2010/11 flood height as zero (0) with + and - marking from there with the exception of Mowbray homestead for the Medway creek. The 0 mark for this gauge should start at the 2008 flood height as this is the highest level recorded. Visual verification of the heights will also allow the data to be quantified.
Location of these gauge boards should include;
Nogoa River at the bridge crossing to Telemon homestead.
Wharton Creek at the new Wharton Creek homestead.
Claude River at Mantuan Downs homestead.
The Medway at Rutland homestead.
The Medway at Mowbray homestead.
Cona creek at Cona Creek homestead.
Vandyke Creek at Euneeke homestead.
Nogoa River and Vandyke Creek junction at the Eumara homestead.
Nogoa River at Raymond homestead.
Nogoa River at Nandowrie homestead.

CLIENT: Central Highlands Regional Council PROJECT Flood Management REPORT Part A DATE: December 2010
45
Figure 20: Recommended Manual Gauge Boards
These gauge boards will not only assist the town of Emerald during a flooding event but the land holders and new residence or owners in the area to understand the risks.
Along with these implementations, it is highly recommended that the already existing and future gauges and rainfall stations need to be serviced annually, to hold a constant knowledge base for the area and the safety of its residents.
To improve the level of risk assessment, at least two different types of predictive flood modelling are required. Initially, rapid predictive risk assessment is necessary so that stakeholders may make reasoned decisions as to whether community and movable equipment evacuation is required. The second type of modelling involves prediction of flood levels that a defined rainfall event (e.g. 1:100 ARI) in an individual section of the catchment may have on different parts of individual catchments. This will permit better evaluation of risk and improved designs for the protection of infrastructure.

CLIENT: Central Highlands Regional Council PROJECT Flood Management REPORT Part A DATE: December 2010
46
6. REFERENCES
The State of Queensland (Queensland Reconstruction Authority) 2011 <http://www.qldreconstruction.org.au/maps>

CLIENT: Central Highlands Regional Council PROJECT Flood Management REPORT Part A DATE: December 2010
47
APPENDIX 1
Landholder Comments
6.1 WHARTON CREEK
Visited: 12/05/2011
Wharton Creek residents (the Squire‟s) took C&R staff to a tree about 5km upstream of the new house, where they showed staff a tree with a series of notches in it. This tree had been used as flood height guide since the early 1950‟s floods. Since 1950 there have been two significant flood heights, 1956 and 2010.
The area around the marked tree was a large flood plain of 3km width approximately and will be inundated by about 1m of water in high out of bank peak flows. The river rose quickly but receded slower. They woke at 2am (heavy rain) and again at 3am (1hr after the rain had ceased) and were able to make out the black outline of the body of water passing just below the house fence on the river side of the structure.
The old main house is located a couple of km downstream from the where the „new‟ house resides now. They move was because of the 1950 flood which wet the feet of the structure and the 1956 flood which inundated the house.
In living memory the Squire‟s hadn‟t seen flows through this part of the river at such intensity.
Information gathered:
heights of past floods (1950, 1956, 2010)
Rainfall for years 1988 – 2011
Photographs
Reference points
6.2 KIA-ORA
Buckland peaked at Kia-Ora on the 27/12/2010 at about 0300hrs. Heavy rainfall on the night of the 26/12/2010 to the 27/12/2010. Woke up and saw black body of water moving past the house in the distance. Crops on the lower plains abutting the creek bed were wiped out. Information Gathered:
photos of Kia-Ora and some from Wharton Creek and surrounding area
6.3 RUTLAND
Visited: 14/04/2011
Peter Loch took C&R Consulting for a tour around the property and the main crossings of the Medway Creek through Rutland. It was stated that in 2008 the river rain forwards and was murky and full of silt and rubbish, from the water coming off the Bogantungan Range.

CLIENT: Central Highlands Regional Council PROJECT Flood Management REPORT Part A DATE: December 2010
48
In late December of 2010 limited water came through from the Bogantungan Ranges, instead the height was achieved from the blockage which occur 10km downstream at the Kulumur Ranges, where the Nogoa River was at such a height that no more water was capable of fitting through the area.
2008 the water left in its wake a silt bed that gurgled and made noise when air escaped from it. 2010 there was limited debris and silt so flood line was difficult to find. Coolibah trees in a wide braided part of the stream were demolished, no bark or leaves left on the (appeared a hail storm had passed) and some knocked over and carried downstream, fully grown trees.
Medway is made up of braided streams. Usually gets a flow in it every so many years. Holds flows for about 2-3 days.
Water peaked at the house just below the bottom back step.
Noticed that where the flooded waters sat in 2008 Coolibah trees had bloomed and begun to grow.
Information Gathered:
Photos from 2008 and 2010
tour of flooded areas
6.4 MANTUAN DOWNS
Visited: 17/05/2010
First time Mantuan Downs homestead has been so inundated, second time in its history; first being 2008. The waters rose like any other „normal‟ flood that had passed through. Thought the rise of the water was going to stead early on the 27/12/2011 but it didn‟t. The water passing slowed but the rate of rise increased, was at peak height about 9am on 27/12/2010 1m above last recorded height.
Troughs had to be recovered from downstream as some were picked up by the flows and carried away by the torrent.
Rainfall station was out after 2010 flood as was flooded.
Said that Fairview closer to the gorge received approx. 8 inches ~ 203.2mm on the night of the 26-27/12/2010.
6.5 RAYMOND
Raymond old house would have been flooded in 2008, but new house was fine. In 2010 the flood went through the new house and covered the floor boards. Lifted things from the shed and carried them away. Got some cattle back in the New Year that had been caught in the rising waters and taken downstream to neighbouring properties.
Mentioned that the river does sometime back up and get blocked.
Gauge was flooded and stopped recording on the 28/12/2010.
Information Gathered:
Photos around the house

CLIENT: Central Highlands Regional Council PROJECT Flood Management REPORT Part A DATE: December 2010
49
6.6 EUMARA
Visited: 19/07/2011
2008 Eumara peaked at 0100hrs in 2008.
2010 Eumara peaked on the cement at the front of the house facing the car shed between 0430 and 0500hrs on the 28/12/2010.
Eumara house is where the Vandyke and the Nogoa join. Water rose quickly, thought was going to go in to the house and then its stopped and sat at peak for little while before it receded.
Information Gathered:
Photos from 2008 and 2010 from surrounding properties; - Vandyke - Broken Dray - Raymond - Rutland - Connemara - Buckland - Eumara
6.7 SELMA ROAD
Visited: 25/03/2011
Were told by C&R that water was coming on the afternoon of the 28/12/2010 and should start thinking about leaving. They were told that the land they built their house on would have been high enough to withstand the 2008 flood, it wasn‟t. In 2010 the house was inundated again up to the roof beams, leaving only the roof visible. Water rose very quickly.
Information Gathered:
Reference points from around the Iddles‟ place and along Selma Road.
Photos of post flood marks in the area 2PH
Water through the packing sheds was about 250mm
At Craig Presler‟s House; - 2010 mark 1.3m - 2008 to 2010 difference = 615mm
Located point along the Selma Road between 2PH packing shed and Presler home as high point.
The Pine trees planted to reduce effects of wind acted as a slowing mechanism of the water, reducing damage to the citrus crops.

CLIENT: Central Highlands Regional Council PROJECT Flood Management REPORT Part A DATE: December 2010
50
6.8 EASTERN SIDE OF NOGOA RIVER ON CODENWARRA ROAD
Visited: 23/03/2011
Doug Phelps had the 2008 and 2010 heights marked out on a number of indicators in his backyard. He said that he was worried about the water not stopping as it passed the 2008 indicators.
2008 read 227cm
2010 read 171cm
= 56cm difference between 2008 and 2010 flood at Doug Phelps place < 2010 being higher.
Doug also join C&R staff when assessing further down the Codenwarra road in predicting heights and relaying where water rose to.
The cotton crops roots out the back were under water and so was much of the road.

CLIENT: Central Highlands Regional Council PROJECT Flood Management REPORT Part A DATE: December 2010
51
APPENDIX 2
AEP’s and ARI’s ANNUAL EXCEEDANCE PROBABILITY (AEP)
Annual Exceedance Probability (AEP) is the probability of rainfall events of particular magnitude occurring within a given period. As such, low probability events are essentially derived from right hand skewed frequency distributions. The matching of particular rainfall events with a temporal probability relies, almost totally, on the right hand tail of the distribution. Some distributions will underestimate the rainfall associated with, for example, an AEP of 0.005 (i.e. a 1:200 year ARI) whereas others will overestimate the rainfall associated with a similar AEP. From the short rainfall records available throughout the area, accuracy in AEP estimations is very difficult. For example, approximately a 300 year record is required to give a 5% uncertainty in an AEP of 0.01 (i.e. a 1:100 ARI).
Records of this length are not available in Australia. Consequently, accuracy in probability estimation is difficult to achieve due to both the length of record and the true underlying frequency distribution pertinent to the area under investigation. For International comparative purposes, a Log Pearson III distribution is used in Australia and some other countries. The Log Pearson III distribution is known to underestimate rainfall magnitudes of low probability events. Underestimation of rainfall associated with low probability events may be interpreted as a greater frequency of actual occurrence.
For the Central Highlands, even with the short duration of records available, it is likely that a Power Frequency Distribution will more accurately reflect the nexus between rainfall magnitudes and probabilities than the Log Pearson III distribution. Use of a Power Frequency Distribution will provide a more conservative answer with respect to AEPs and thus give a greater degree of protection for any given AEP.
AVERAGE RECURRENCE INTERVAL (ARI)
Average Recurrence Interval infers that an event of a designated magnitude will occur within a given period (e.g. a 1:100 event implies that it will occur once every one hundred years). An AEP of 0.01 implies that in any given year there is a 1% chance of its occurrence. Average Recurrence Interval is a misleading term and should be dropped in favour of AEPs in spite of the attendant difficulties associated with AEPs.
The shortness of data records place similar constraints on ARIs to those experienced with AEPs and this influences public perceptions with respect to the precision, accuracy, and uncertainties associated with both measurements.

CENTRAL HIGHLANDS REGIONAL COUNCIL FLOOD MANAGEMENT REPORT
Section B: Fairbairn Dam – Emerald: Urban Flood Plain Analysis
REPORT PREPARED FOR:
Central Highlands Regional Council
Date: 12 December, 2011

CLIENT: Central Highland Regional Council PROJECT: Flood Management Analysis REPORT: Section B – Fairbairn Dam through Emerald DATE: December 2011
2
IMPORTANT NOTE No part of this document may be reproduced without written permission from the Clients and C&R Consulting Pty Ltd. If this report is to form part of a larger study, or is a response to a “Request for Additional Information” from a Compliance Agency, this report must be included as an Appendix within the full report without any additions, deletions or amendments. C&R Consulting Pty Ltd do not accept any responsibility in relation to any financial and/or business decisions made for any other property or development other than that for which this information has been provided.
Dr Chris Cuff Director C&R Consulting Geochemical and Hydrobiological Solutions Pty Ltd Date: : 12th December 2011
Dr Cecily Rasmussen Director C&R Consulting Geochemical and Hydrobiological Solutions Pty Ltd Date: 12th December 2011

CLIENT: Central Highland Regional Council PROJECT: Flood Management Analysis REPORT: Section B – Fairbairn Dam through Emerald DATE: December 2011
3
SUMMARY OF RELEVANT INFORMATION Project Title Nogoa Catchment Flood Study
Section A: Upper Nogoa – Fairbairn Dam Catchment Assessment and Evaluation
Property Location Catchments of the Upper Nogoa to Fairbairn Dam, Central Queensland
Project Purpose Investigate the 2010 Emerald flood event
Applicants Details Central Highlands Regional Council
Nominated Representative Peter Maguire
Title/Position Mayor
Company Central Highlands Regional Council
Postal Address PO Box 21 Emerald Q 4720
Telephone 1300 242 686
Fax: 1300 242 687
Email [email protected]
Survey Undertaken by: Mr G Kavanagh Ms K Alexander

CLIENT: Central Highland Regional Council PROJECT: Flood Management Analysis REPORT: Section B – Fairbairn Dam through Emerald DATE: December 2011
4
TABLE OF CONTENTS
1. INTRODUCTION .......................................................................................................... 6 1.1 SCOPE OF THE PROJECT ........................................................................... 6
2. BACKGROUND ............................................................................................................ 7 2.1 CHANGES TO WATERWAYS .............................................................................. 7 2.2 CLIMATE .................................................................................................. 7
3. METHODOLOGY ......................................................................................................... 9 3.1 HISTORICAL DATA ....................................................................................... 9 3.2 TOPOGRAPHY ............................................................................................. 9 3.3 SURFACE WATER FLOODING ......................................................................... 10
3.3.1 Modelling ................................................................................................................... 10 3.3.2 Model Parameters .................................................................................................... 10
3.4 MODEL SENSITIVITY ANALYSIS ...................................................................... 14
4. RESULTS ................................................................................................................... 15 4.1 UPPER CATCHMENTS RUNOFF INTO FAIRBAIRN DAM.............................................. 15 4.2 FLOWPATHS ............................................................................................ 16
5. DISCUSSION.............................................................................................................. 18 5.1 ARI / AEP ............................................................................................. 18
5.1.1 Annual Exceedance Probability (AEP) ..................................................................... 18 5.1.2 Average Recurrence Interval (ARI)........................................................................... 18
6. RECOMMENDATIONS ............................................................................................... 20 6.1 PREPAREDNESS ........................................................................................ 20
6.1.1 River Gauge Ratings Curves .................................................................................... 20 6.1.2 Landholder Gauge Boards ........................................................................................ 20
6.2 TOWN PLANNING PROTECTION FOR OUT OF RIVER BANK FLOW CORRIDORS ................. 21 6.2.1 Early Warning Rainfall Runoff Model ........................................................................ 21 6.2.2 The alert notices by SunWater to be predicted spillway heights not just recorded .. 22 6.2.3 The placement of a gauging station on Vandyke Creek ........................................... 22
6.3 STRUCTURAL MITIGATION ............................................................................ 22 6.3.1 Increased flow path under Nogoa River rail bridge Emerald .................................... 22 6.3.2 Elevation of New Street ............................................................................................ 24 6.3.3 Increased flow in LN1 under Gregory Highway ........................................................ 25 6.3.4 Widening of LN1 drain from Hogans Road to Gregory Highway .............................. 25 6.3.5 Section removal of elevated banks in LN1 drain along Moffat Road........................ 28 6.3.6 Increased Flow Under Clermont Street .................................................................... 28 6.3.7 Increased Structure under rail line at Old Sheep Yard Place ................................... 29
6.4 RESILIENCE ............................................................................................. 29 6.4.1 Flood height markers ................................................................................................ 29
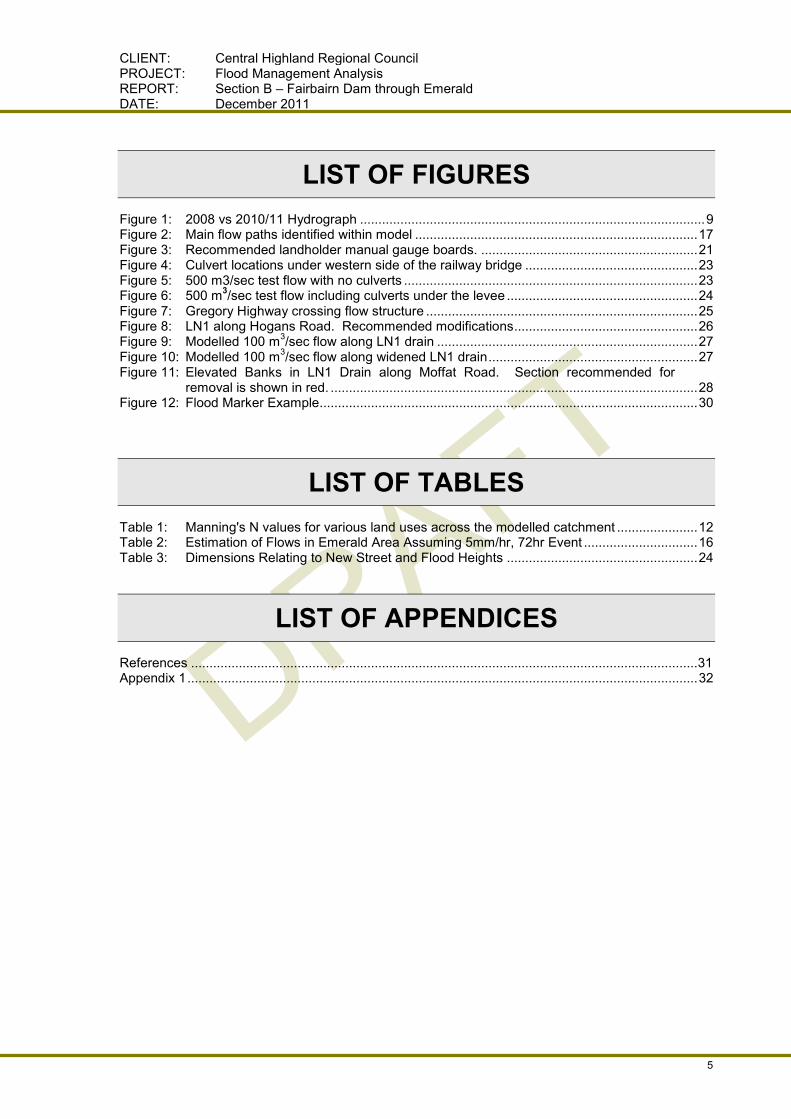
CLIENT: Central Highland Regional Council PROJECT: Flood Management Analysis REPORT: Section B – Fairbairn Dam through Emerald DATE: December 2011
5
LIST OF FIGURES
Figure 1: 2008 vs 2010/11 Hydrograph .............................................................................................. 9 Figure 2: Main flow paths identified within model ............................................................................. 17 Figure 3: Recommended landholder manual gauge boards. ........................................................... 21 Figure 4: Culvert locations under western side of the railway bridge ............................................... 23 Figure 5: 500 m3/sec test flow with no culverts ................................................................................ 23 Figure 6: 500 m3/sec test flow including culverts under the levee .................................................... 24 Figure 7: Gregory Highway crossing flow structure .......................................................................... 25 Figure 8: LN1 along Hogans Road. Recommended modifications .................................................. 26 Figure 9: Modelled 100 m3/sec flow along LN1 drain ....................................................................... 27 Figure 10: Modelled 100 m3/sec flow along widened LN1 drain ......................................................... 27 Figure 11: Elevated Banks in LN1 Drain along Moffat Road. Section recommended for
removal is shown in red. .................................................................................................... 28 Figure 12: Flood Marker Example ....................................................................................................... 30
LIST OF TABLES
Table 1: Manning's N values for various land uses across the modelled catchment ...................... 12 Table 2: Estimation of Flows in Emerald Area Assuming 5mm/hr, 72hr Event ............................... 16 Table 3: Dimensions Relating to New Street and Flood Heights .................................................... 24
LIST OF APPENDICES
References .......................................................................................................................................... 31 Appendix 1 ........................................................................................................................................... 32

CLIENT: Central Highland Regional Council PROJECT: Flood Management Analysis REPORT: Section B – Fairbairn Dam through Emerald DATE: December 2011
6
1. INTRODUCTION
C&R Consulting were commissioned by the Central Highland Regional Council (CHRC) to undertake a detailed Flood Management Analysis and Evaluation study of the Upper Nogoa River catchment above the Fairbairn Dam and including the Fairbairn Dam Spillway to downstream of the Emerald: Urban Flood Plain. The commission was in response to the re-occurrence of flooding in the Emerald area (i.e. January 2008 and December/June 2010).
The tasks required for the two studies have been developed in response to discussions with the Central Highlands Regional Council and is specifically directed towards the streams and rivers directly impacting on the town of Emerald. The section report, Section B, considers the Nogoa River from the Fairbairn Dam spillway to upstream of the junction with Theresa Creek.
The studies have been undertaken to increase the range of knowledge of the area and ultimately to understand how it functions as a catchment. Once an understanding is gained, management approaches in relation to sufficient notification & evacuation, prevention and reduced damages can be developed accordingly.
1.1 SCOPE OF THE PROJECT
The studies investigate the formation, magnitude, periodicity, and history of events similar to the 2008 and 2010/2011 flood events. This project has utilised a range of different investigative techniques including site assessments, information sessions with local residents and historical groups and a climatological assessment of the region. Other techniques such as analyses of fluvial characteristics of the catchment and the river systems, forensic geomorphic and hydrological analyses and a gaps analysis of current and historical information regarding the Upper Nogoa Catchment were also utilised. Compilation of these soft data has allowed many gaps to be filled and a clearer understanding of the size of the event in all sections of the catchment.
This report is not looking at the Fairbairn Dam itself, and any analysis of this facility and its function or any possible changes to it, is not covered in this report and would require a separate investigation before this can be addressed. This report does however include an analysis of the dam in its current design capacity and the effects that this has had on the flood events described above.

CLIENT: Central Highland Regional Council PROJECT: Flood Management Analysis REPORT: Section B – Fairbairn Dam through Emerald DATE: December 2011
7
2. BACKGROUND
2.1 CHANGES TO WATERWAYS
Selma Weir was constructed between April 1950 and February1953 and is situated 3.22km upstream of Emerald, and has a storage capacity of 1180 ML. The spillway elevation is EL 170.39 AHD. The crest of the weir is 7.32 m above foundations and has total length including cut-off walls of 192 m.
Fairbairn Dam also known as Lake Maraboon was constructed between 1968 and 1972. The structure was not designed specifically for flood mitigation purposes but as a water conservation effort for urban and irrigation supply with a capacity of 1.3 million ML, it does however have mitigation qualities. The spillway is situated 19km upstream of Emerald with water from the spillway taking 4-5hrs for the peak flow to reach the Vince Lester Bridge. The spillway was designed for a flood flow of 15600 m3/s, which is more than triple the flow of the 2010/11 event at 4330 m3/s and 5 times the 2008 event (2952 m3/s).
Two constructed open-earthed channels, Selma and Weemah Channels act as delivery systems from the Fairbairn dam for the surrounding Emerald Irrigation Area (EIA Selma has a maximum release of 770ML/day, Weemah with a maximum release of 330ML/day They were built in conjunction with the dam (which has a maximum river release of 1500ML/day). The Selma Channel runs for approximately 47 km on the western side of the Nogoa River and services farms to the north and west. The channel is comprised of one main channel and a number of subsidiary channels, which are fed by gravity providing the dam remains above 68% capacity. The Weemah Channel services the farms to the east with a channel length of approximately 53km. Water is fed in to this channel via a 6m diameter tunnel with an intake tower on the upstream side of the dam wall.
The EIA drains an extensive surface runoff system of approximately 207 km in total length. This system includes two larger channels designed, for a 1:10 event, that affect flood water in and around the township of Emerald; LN1 and LN3. The LN1 channel drains 2330 ha of irrigated cropland before entering Emerald where it acts as an open storm water drain before entering an anabranch of the Nogoa River to the north of the town. The LN3 channel enters the Nogoa River just above the town weir and has a total catchment of 4280 ha. These two drainage channels act as major flow paths in the case of flooding due to their drainage of flow across the flood plain. The EIA also includes other overland flow dams and diversion streams that have been constructed over time however these have less effect on the flow in and around the town.
2.2 CLIMATE
The climate of the Central Highlands is typical of the Seasonally Arid Tropics, where rainfall is strongly seasonal, highly erratic both in duration, intensity, and periodicity, and where the majority of the summer rain falls within a very short period (occasionally within a few days) followed by extended periods of relatively little rainfall. Storm rains at the beginning of the summer wet season are sudden and intense and often restricted to isolated falls within individual catchments. Sunlight hours are high with sunny days usually in excess of 300 days per year. Evaporation is high, exceeding precipitation for approximately 80% of most years.
The combination of strongly seasonal rainfall, high sunlight days, and extreme evaporation creates an environment where the soils dry out rapidly. Under these conditions the landscape is dry and parched by the beginning of the first storm rains of the season.

CLIENT: Central Highland Regional Council PROJECT: Flood Management Analysis REPORT: Section B – Fairbairn Dam through Emerald DATE: December 2011
8
Runoff is rapid across the unprotected landscape. Dependent on where the rains fall, flow through the river channels is equally rapid.
Summer rainfall in the Central Highlands Region is driven by the location of the Inter Tropical Front, the North East Australian Monsoon trough and/or cyclonic activity. The pathway of the rainfall from development to the Central Highlands is dependent on the source of the event. In general, while the rainfall pathway is relatively well defined, the location of the rainfall within the band of activity is volatile, falling as isolated cells that may locate over one area for days.
The area is a zone of regular interactions between the seasonal summer rainfall associated with the Inter Tropical Front, the North East Australian Monsoon, and seasonal cyclonic activity, with the zone which receives appreciable winter rainfall associated with the tracks of low pressure systems sweeping across from the west and south west of Australia. Typically the balance between summer and winter rainfall is approximately 70 30. Intense rainfall events frequently occur when the warm tropical air intersects the cold frontal area coming up from the south. Thus, intense rainfall events are more likely to occur early in the wet season (December / January, e.g. 2008 and 2010), or late in the wet season (e.g. April 1990).
The topography of the Central Highlands region is such that it tends to guide weather events from both north and south so that the interaction points between warm air from the north and cold air from the south fall within the area. Two such areas that both feed tributaries of the Nogoa River, and thus are relevant to the Emerald district, have been identified as “hot spots” for intense activity in the Central Highlands Region.
Therefore, understanding the climate and the movements of the rain events is critical to develop probability of river flows and the adjoining flows which make for the large events if/when synchronous. If the rainfall was more regular (e.g. temperate climates where the rain falls fairly evenly throughout the year) the magnitude of the flooding event would be considerably less. This, in part, is due to the nature of the soils whereby under arid conditions impermeable soil crusts may develop which, in extreme rainfall events, lead to a runoff coefficient close to one (1).
In the Central Highlands region, rainfall and river discharge data are sparse and of short duration (often less than 50 years). Certainties in modelling data are weakened by the lack of data and modellers have resorted to the inclusion of data from overseas to extend the periodicity of the records. In temperate climates this fusion of data has a reasonable chance of prediction with a reasonable degree of certainty. In the seasonally arid tropics, the climatic conditions bear no similarity to temperate climates. Rainfall intensity, duration, and periodicity are erratic, often restricted to a few short months of the year, with rain falling as a series of intermingling cells across, or within, a catchment. Evaporation exceeds precipitation for approximately 90% of the year, often including days recording periods of heavy rainfall. Sunny days usually average a minimum of 300 days per year. Summer rains begin suddenly and runoff over the parched earth can be as high as 100% in the initial stages. Heaviest rains are associated with cyclonic and/or monsoonal activity and each event may last for weeks, with the intensity and duration of the rainfall varying continuously. Flood Prediction Models derived from temperate climatic data cannot adequately resolve the disparities in the tropical climatic data.
Thus the impacts of flooding are not only socially disruptive, but have a huge cost on the overall economy. It is therefore essential that infrastructure associated with communities and private enterprise is realistically aligned to the levels of risk associated with these events.

CLIENT: Central Highland Regional Council PROJECT: Flood Management Analysis REPORT: Section B – Fairbairn Dam through Emerald DATE: December 2011
9
3. METHODOLOGY
3.1 HISTORICAL DATA
The premise of this study is the analysis of the Emerald Urban Floodplain in the wake of flooding events throughout the township and surrounding districts in both 2008 and 20010/11. It is important to identify within this scope the event that is the basis of the analysis. Comparison of the hydrographs of the 2008 and 2010/11 events (Figure 1) shows that the 2010/11 flood height was approximately 0.69 m higher at the peak of the flood through the Vince Lister Bridge than the 2008 event. As the 2010/11 event has the higher record of the two events then this is the event that the modelling is based upon.
During the 2010/11 event the Fairbairn Dam acted as a buffer and reduced the discharge by 26%. In 2008 it reduced the discharge by 30%.
6
7
8
9
10
11
12
13
14
15
16
17
2008 Hydrograph2011 Hydrograph
Figure 1: 2008 vs 2010/11 Hydrograph
3.2 TOPOGRAPHY
A three-dimensional LIDAR dataset of the region surrounding Emerald was provided to C&R Consulting for the purposes of this assessment. The dataset consisted of a series of contours as well as a series of 1 km x 1 km ESRI Digital Elevation Models (DEMs) at a resolution of 1 m x 1 m. This data was used to generate topography for the modelling. The methodology employed is outlined below:

CLIENT: Central Highland Regional Council PROJECT: Flood Management Analysis REPORT: Section B – Fairbairn Dam through Emerald DATE: December 2011
10
The data was imported into ArcGIS 9.3.1 as the series of ESRI DEMs and was merged into one continuous DEM from the Fairbairn Dam down through the township to the junction with Theresa Creek using 3D Analyst.
This 1 m x 1 m DEM was then re-sampled at coarser resolutions to aid in calculation times for the model. The coarser resolutions of the DEMs include 2 m x 2 m, 5 m x 5 m, 10 m x 10 m, 20 m x 20 m, and 50 m x 50 m.
The various resolution DEMs were exported as ASCII‟s text files for importation into the modelling software.
3.3 SURFACE WATER FLOODING
3.3.1 MODELLING
The modelling engine TUFLOW was used to mimic the 2010/11 event in order to make changes to the infrastructure within the model and assess the potential effect these changes have on the water heights and velocities throughout the modelled flow. TUFLOW is a modelling package developed by BMT WBM and the University of Queensland specifically for Australian conditions. The model does not include a Graphical User Interface, however one has been developed by Aquaveo called the Surface Modelling System (SMS) which allows GIS data and CAD topography to be used to construct and analyse the models.
TUFLOW supports the creation of one-dimensional models1, two dimensional models2 and integrated one and two dimensional models. A two dimensional model was chosen to represent conditions on-site as this more reflects reality and for ease of use. Where blockages or obstructions occur in the waterway (such as culverts) these were represented as a one dimensional model within the two-dimensional model‟s extents and conditions.
3.3.2 MODEL PARAMETERS
3.3.2.1 TOPOGRAPHY
The greater Emerald region, from the dam down through the town, was represented by a 2500 m2 grid (50 m x 50 m grid cells) where each cell represented a height in metres AHD. Around the township of Emerald a finer resolution grid was required to successfully model water flow interaction with the built environment and this area was represented by a 100 m2 grid (10 m x 10 m grid cells). Finally, to address restrictions in flood level water flow around the bridges across the Nogoa River, a higher resolution 25 m2 grid (5 m x 5 m grid cells) was used to represent this region. All grid values were generated from topographic datasets as outlined in Section 3.1.
3.3.2.2 STRUCTURES
Culverts in a TUFLOW model are represented as one-dimensional models nested within the two-dimensional model extent. Flows were transported from the two dimensional model into the one dimensional model (in the vicinity of the culvert), routed through the structure and flows were then re-distributed into the two-dimensional model. Culverts were only used within the recommendations for mitigation section of the modelling analysis for the section to the west of the Vince Lester Bridge.
1 One dimensional models use a series of cross-sections to determine water level height and velocity. They are well suited for applications where flows occur in the channel but are not suited for overland flooding as water can not „move‟ laterally in the models. 2 Two dimensional models use a topographic dataset (usually generated by LIDAR with survey information added to the dataset) to model water „movements‟ across a land surface.
CLIENT: Central Highland Regional Council PROJECT: Flood Management Analysis REPORT: Section B – Fairbairn Dam through Emerald DATE: December 2011
11
Bridges are represented in a TUFLOW model by flow restrictions that mimic the disruptions to water flow caused by the pylons and crest of a bridge. Flow restrictions were used within this Emerald model for the bridges at the John Gay Bridge, the Central Railway Bridge and both the Old and New Highway Bridges. The details of the Railway Bridge were obtained from construction designs delivered by the CHRC, whilst the heights and makeup of the other bridges were estimated by using nearmap.com aerial imagery, photographs and the LIDAR topography supplied by the CHRC.
Other drainage infrastructure such as Selma Weir, the SunWater Drainage system, and CHRC drainage structures were not included in the model as these were picked up in the Department of Environment and Resource Management (DERM) LIDAR topography provided by CHRC.
3.3.2.3 UPSTREAM BOUNDARY CONDITIONS
The upstream boundary conditions for the model were set as an input hydrograph (discharge vs time) just below the Fairbairn Dam. After some experimentation with the dynamics of the TUFLOW model, it was decided not to use the Fairbairn Dam hydrograph as the upstream boundary conditions as the rapid fall of the dam slipway made the model unstable. Thus the flow rates of the Emerald Alert hydrograph from the 2010/11 flood event were used.
3.3.2.4 STARTING CONDITION
Flood modelling requires that the worst-case scenario is considered in order to provide adequate mitigation measures against potential flooding. Using this assumption the river system was assumed to be full at the beginning of the model in order to model the event within a full system. To achieve this, 1500 cubic m/sec were allowed to flow from the upstream boundary of the model domain through the system before the 2010/11 event hydrograph was run within the model. The event was then run over a total of 80 hours
3.3.2.5 DOWNSTREAM BOUNDARY CONDITION
The downstream boundary condition was set as a computed ratings curve (HQ curve) which is used to calculate the water depth at any cell based on topography and an anticipated water surface gradient. An assumed water level gradient is required to be input into the model so that it can calculate the expected height and velocity of flow across the boundary condition based on the volume of water reaching it. A gradient of 0.00041m/m was used. This value was the average slope of the channel six transects taken in the area of the downstream boundary condition.
3.3.2.6 ROUGHNESS VALUES
TUFLOW uses Manning‟s Roughness values to calculate the resistance exerted on the flow from vegetation, stream sinuosity and resistance from structures. TUFLOW can use depth-based Manning‟s N values in an attempt to more closely represent reality. This process attempts to mimic the reducing resistance to flow in deeper flow paths. Manning‟s N values can be specified for two depths, and linear interpolation is used to determine the Manning‟s N values between these depths.
Land uses were digitised in ArcView 9.3.1 based on the aerial photograph provided in NearMap (http://www.nearmap.com). These land uses were then used to map Manning‟s N coefficients, which are outlined below in

CLIENT: Central Highland Regional Council PROJECT: Flood Management Analysis REPORT: Section B – Fairbairn Dam through Emerald DATE: December 2011
12
Table 1.

CLIENT: Central Highland Regional Council PROJECT: Flood Management Analysis REPORT: Section B – Fairbairn Dam through Emerald DATE: December 2011
13
Table 1: Manning's N values for various land uses across the modelled catchment
Land Use Manning’s N
Photo Pattern 1m Depth
3m Depth
Bare Ground3
0.03 0.009
Buildings 20 n/a
Croplands 0.05 0.0175
3 This land use is the default setting for areas without a prescribed land use

CLIENT: Central Highland Regional Council PROJECT: Flood Management Analysis REPORT: Section B – Fairbairn Dam through Emerald DATE: December 2011
14
Land Use Manning’s N Photo Pattern
River 0.001 0.0005
Shrubbery 0.09 0.0225
Water Storage
0.001 0.0005

CLIENT: Central Highland Regional Council PROJECT: Flood Management Analysis REPORT: Section B – Fairbairn Dam through Emerald DATE: December 2011
15
3.4 MODEL SENSITIVITY ANALYSIS
Once the model was initially set-up and all flood mitigation scenarios were identified, a number of parameters were varied in the model and each scenario re-run. This was performed to both maximise the accuracy of the model outputs to the mapped extent of the 2010/11 flood event and to evaluate the effect of changing model parameters on these results.
The parameters which were adjusted include: Downstream Boundary Conditions. The slope of the water surface leaving the model was
adjusted between 0.0001 (the lowest gradient found in the floodplain) and 0.001 to evaluate these effects on the model.
Manning‟s N Values. Manning‟s N values were input into the model as a series of roughness vs. depth curves. The values were increased by approximately 20% and the model base-scenario (without mitigation measures) was re-run to determine the effects of variations to Manning‟s N values to water levels and velocities.
The results of the sensitivity analysis revealed limitations in the model including the necessity of including the pedestrian underpass under the railway between Sullivan St and the Capricorn Highway opposite the Car Spa. Culverts and underpasses were not included in the overall model due to model stability constraints, although many of these features were modelled independently of the dam down model.

CLIENT: Central Highland Regional Council PROJECT: Flood Management Analysis REPORT: Section B – Fairbairn Dam through Emerald DATE: December 2011
16
4. RESULTS
4.1 UPPER CATCHMENTS RUNOFF INTO FAIRBAIRN DAM
Runoff amounts were calculated for the Zones 1 to 4 using a range of empirical relationships for soil types, slopes, pre-existing conditions, rainfall and rainfall intensity. These empirical relationships have been derived over the last several years from numerous studies in the Central Queensland region.
A 72hr event of 5mm/hr was modelled, this rate being the C&R estimate of the occurrence of a real event probability 0.01 in any one year. This contrasts with the BOM estimate for a similar probability of 4.22mm/hr over 72hrs. This difference arises from the use of a Power Frequency Distribution rather than the Log Pearson Distribution used by the BOM. From investigations throughout Tropical Queensland, the general relationship between the BOM calculated event values using Log Pearson Distributions and values calculated from the superior fitting Power Frequency Distribution is a multiplier of approximately 1.3. For this investigation, the value of 5mm/hr for 72hrs, although only x1.2 the BOM value, was chosen because of its numerical simplicity. It is considered that if the BOM values are used directly, then there is a certainty of 50% to 55% that the event modelled will be below the flow level calculated.
Three scenarios were modelled:
1. The Event was over the whole area for the entire duration.
2. The Event moved sequentially from Zone 4 to Zone 3 to Zone 2 to Zone 1 at a speed synchronous with the times of concentration for the individual catchments.
3. The Event moved from being stationary over Zones 4 to 2 and then moving to Zone 1 at a rate synchronous with the occurrence of a maximum flow over the Fairbairn Dam spillway.
Three estimates of runoff were made:
1. At a certainty of 68.2%, that the 0.01 probability event modelled would be below this level.
2. At a certainty of 95.4%, that the 0.01 probability event modelled would be below this level.
3. At a certainty of 99.6%, that the 0.01 probability event modelled would be below this level.
It should be noted that these are the conventional one, two and three sigma values that strictly relate only to a standard normal distribution. Since the underlying distributions for large rainfall events are significantly right hand skewed, these certainty levels are themselves somewhat uncertain. The value of 68.2%, lying within the central portion of the distribution is likely to be a reasonable estimate. With the assumption of a Power Distribution Frequency curve, the 95.4% and the 99.6% values are likely to be slightly overestimated and thus are on the conservative side. This conservatism is considered preferable to the underestimation of these values that may occur if a Log Pearson type of distribution is used. Values for these scenarios are tabulated in Table 2.

CLIENT: Central Highland Regional Council PROJECT: Flood Management Analysis REPORT: Section B – Fairbairn Dam through Emerald DATE: December 2011
17
Table 2: Estimation of Flows in Emerald Area Assuming 5mm/hr, 72hr Event
Scenario
Flow Estimate for 68.2% certainty (m3/sec)
Flow Estimate for 95.4% certainty (m3/sec)
Flow Estimate for 99.6% certainty (m3/sec)
Zone 4 Individually 5389 10,015 13019 Zone 3 Individually 5600 10,570 13741 Zone 2 Individually 4375 8260 10739 Zone 1 Individually 2336 4419 5745 Stationary over Zones 1-4 for 72hrs. Total flow at Emerald Downstream Point.
9591 18091 23519
Stationary over Zones 2-4 for 72hrs. Total flow at entry to Fairbairn Dam.
9538 17991 23389
Stationary over Zones 2-4 for 72hrs, then moves synchronously with flow to Zone 1. Total flow at Emerald Downstream Point.
11875 22395 29114
Stationary over Zones 1-4 for 72hrs, then moves synchronous with flow to Zone 1 at same rate as flow maximum. Total area ratio method. Total flow at Emerald Downstream Point.
18011 33960 44148
Event moves synchronously across Zones 4 to 1 at same rate as flow maximum. Individual area method. Total flow at Emerald Downstream Point.
17702 33376 43389
4.2 FLOWPATHS
The modelling of the 2010/11 flood event that moved through Emerald highlighted a series of flow pathways that caused the flooding through the township. Many of these flow pathways are known to local stakeholders and were identified during the flood event in a series of photographs taken leading up to the peak, during the peak of the floods and after the peak however the numerical outputs of the modelling of the flood event outline these outputs definitively.
There are two classifications within the flow paths identified by the modelling, using depth and velocity of the flow; the main flow paths and the secondary flow regions. Areas within the model that have no current development and a flow above 1 m/sec are considered to be a main flow path, with regions that show less than 1 m/sec flow and a water depth of less than 0.5 m are considered secondary flow regions.
The main flow paths through town, identified within the peak flow of the modelled flood at a velocity of over 1 m/sec, are show in
with the blue shading.

CLIENT: Central Highland Regional Council PROJECT: Flood Management Analysis REPORT: Section B – Fairbairn Dam through Emerald DATE: December 2011
18
Figure 2: Main flow paths identified within model
The recommendations in this report are designed to enhance the current flow paths to reduce pooling and afflux but at the same time C&R are recommending the protection of the flow paths that are displayed in figure 2. The dark blue areas are to have total protection moving forward and the lighter blue areas are to be treated as secondary flow path areas that could be developed as long as 50% of the area is left as natural surface with no impediment to flow.

CLIENT: Central Highland Regional Council PROJECT: Flood Management Analysis REPORT: Section B – Fairbairn Dam through Emerald DATE: December 2011
19
5. DISCUSSION
To effectively utilise the results of this study, a better understanding of Annual Exceedance Probability (AEP) and Average Recurrence Interval (ARI) for this area is required to limit any misgivings the terms may have.
5.1 ARI / AEP
5.1.1 ANNUAL EXCEEDANCE PROBABILITY (AEP)
Annual Exceedance Probability (AEP) is the probability of rainfall events of particular magnitude occurring within a given period. As such, low probability events are essentially derived from right hand skewed frequency distributions. The matching of particular rainfall events with a temporal probability relies, almost totally, on the right hand tail of the distribution. Some distributions will underestimate the rainfall associated with, for example, an AEP of 0.005 (i.e. a 1:200 year ARI) whereas others will overestimate the rainfall associated with a similar AEP. From the short rainfall records available throughout the area, accuracy in AEP estimations is very difficult. For example, approximately a 300 year record is required to give a 5% uncertainty in an AEP of 0.01 (i.e. a 1:100 ARI).
Records of this length are not available in Australia. Consequently, accuracy in probability estimation is difficult to achieve due to both the length of record and the true underlying frequency distribution pertinent to the area under investigation. For International comparative purposes, a Log Pearson III distribution is used in Australia and some other countries. The Log Pearson III distribution is known to underestimate rainfall magnitudes of low probability events. Underestimation of rainfall associated with low probability events may be interpreted as a greater frequency of actual occurrence.
For the Central Highlands, even with the short duration of records available, it is likely that a Power Frequency Distribution will more accurately reflect the nexus between rainfall magnitudes and probabilities than the Log Pearson III distribution. Use of a Power Frequency Distribution will provide a more conservative answer with respect to AEPs and thus give a greater degree of protection for any given AEP.
5.1.2 AVERAGE RECURRENCE INTERVAL (ARI)
Average Recurrence Interval infers that an event of a designated magnitude will occur within a given period (e.g. a 1:100 event implies that it will occur once every one hundred years). An AEP of 0.01 implies that in any given year there is a 1% chance of its occurrence. Average Recurrence Interval is a misleading term and should be dropped in favour of AEPs in spite of the attendant difficulties associated with AEPs.
The shortness of data records place similar constraints on ARIs to those experienced with AEPs and this influences public perceptions with respect to the precision, accuracy, and uncertainties associated with both measurements.
It is recommended that CHRC stipulates limitations and ruling that protect all stream flow paths including out of bank flow paths that are left throughout the flood plain within the town area. These flow paths must be clearly identified, mapped, maintained and protected. To achieve the best possible result; other Government organisations including Queensland Rail, Main Roads and SunWater must work with Council to develop, protect and maintain these flow corridors.

CLIENT: Central Highland Regional Council PROJECT: Flood Management Analysis REPORT: Section B – Fairbairn Dam through Emerald DATE: December 2011
20
The move throughout the state at present is for the building heights for towns to be set above the highest recorded flood, which in Emerald is the 2010/11 flood event. The 2008 flood event qualifies as the 1:100 event for Emerald, using the Bureau of Meteorology (BOM) designation. Due to the uncertainties outlined above, there is currently a review being undertaken on using ARIs as official designations. By using statistical methodologies devised by C&R Consulting (C&R Consulting 2010, Appendix 1), the 1:100 ARI event would be equivalent to around 30% above the BOM 1:100 ARI. This is very close to the level of the 2010/11 event which is an additional reason that the 2010/11 event was the event selected to be modelled. It is interesting to note that there could be a policy for building at the highest recorded flood level, but then have critical infrastructure like roads and bridges using the 1:100 height that has the ability to impact the buildings that are built at the highest flood height.

CLIENT: Central Highland Regional Council PROJECT: Flood Management Analysis REPORT: Section B – Fairbairn Dam through Emerald DATE: December 2011
21
6. RECOMMENDATIONS
6.1 PREPAREDNESS
6.1.1 RIVER GAUGE RATINGS CURVES
The development of a policy for reporting and recording gauging stations where there is some concern over their accuracy is urgently required. This is highlighted by the river gauge at Retreat Theresa Creek at Gregory HWY, this gauge was reviewed as unreliable in high flows in 1995/6 by Natural Resources but still continued to be used by Government agencies up until 2008. This river gauge was underestimating flows by over 100%. During the last two floods a large percentage of river heights exceeded the ratings curves for the Gauging stations making it very hard to establish flow volumes. A lot of the river gauges are not accessible during high flows for boat crossings to correct ratings tables but detailed surveys could be established to extend these ratings curves beyond the heights recorded in 2010/11. LIDAR is used by the mining industry throughout this area and would give a very good survey through these river gauges.
The development in and around existing river gauges has to be assessed for the perennial impact on the accuracy of the gauge. If the development is shown to have an impact and cannot be shifted the developer must pay for the relocation of the gauging station and the recalibration of the data required because of the shift.
6.1.2 LANDHOLDER GAUGE BOARDS
At present there are gaps in data collection and monitoring leading up to and during events in the region. By filling these gaps through more extensive monitoring of streams during events will aid in the timeliness of preparation. It will also allow better determination of the sizes of the event.
To do this, installation of manual gauge boards within the upper and sub catchments of the Nogoa is recommended. The identification of the position of these sites is based on the proximity of homesteads to the streams to enable safe reading and reporting during events. It is recommended that the gauges on the gauge boards be marked with the 2010/11 flood height as 0 with + and - marking from there with the exception of Mowbray homestead for the Medway creek. The 0 mark for this gauge should start at the 2008 flood height as this is the highest level recorded. Location of these gauge boards should include; Nogoa River at the bridge crossing to Telemon homestead. Wharton Creek at the new Wharton Creek homestead. Claude River at Mantuan Downs
homestead. The Medway at Rutland homestead. The Medway at Mowbray homestead. Cona creek at Cona Creek homestead. Vandyke Creek at Euneeke homestead? Nogoa River and Vandyke Creek junction at the Eumara homestead. Nogoa River at Raymond homestead. Nogoa River at Nandowrie homestead.
These gauge boards will not only assist the town of Emerald during a flooding event but the land holders and new residence or owners in the area to understand the risks.

CLIENT: Central Highland Regional Council PROJECT: Flood Management Analysis REPORT: Section B – Fairbairn Dam through Emerald DATE: December 2011
22
Figure 3: Recommended landholder manual gauge boards.
6.2 TOWN PLANNING PROTECTION FOR OUT OF RIVER BANK FLOW CORRIDORS
6.2.1 EARLY WARNING RAINFALL RUNOFF MODEL
The development of a Rainfall runoff model for the Catchment above Emerald for medium to large rain events enables a prediction of stream flows, heights and the timing of those flows at points throughout the catchment. This model could be produced as a simple spread sheet form to be run during or at the end of a rain event to give the earliest possible prediction to the community downstream, including the township of Emerald. Used in parallel with the gauge board readings (at the top of the catchment as points of truth), this model will lead to a very accurate prediction of event size. The model uses rainfall runoff coefficients in medium and large events as well as the regulating ability of the streams at different flows to determine the volumes, heights and timings throughout the catchment.
The development of a Rainfall runoff model for the Catchment above Emerald for medium to large rain events enables a prediction of stream flows heights and the timing of those flows at points throughout the catchment. This model could be produced as a simple spread sheet form to be run during or at the end of a rain event to give the earliest possible prediction to the community downstream, including the township of Emerald. Used in parallel with the gauge board readings (at the top of the catchment as points of truth), this model will lead to a very accurate prediction of event size. The model uses rainfall runoff coefficients in medium and large events as well as the regulating ability of the streams at different flows to determine the volumes, heights and timings throughout the catchment.
To do this accurately, a better understanding of Annual Exceedance Probability (AEP) and Average Recurrence Interval (ARI) for this area is required to limit any misgivings the terms may have.

CLIENT: Central Highland Regional Council PROJECT: Flood Management Analysis REPORT: Section B – Fairbairn Dam through Emerald DATE: December 2011
23
6.2.2 THE ALERT NOTICES BY SUNWATER TO BE PREDICTED SPILLWAY HEIGHTS NOT
JUST RECORDED
Currently SunWater sends out notices of dam spills and heights of spill to all land holders immediately downstream of the dam after it has occurred. These notifications must include predictions of maximum height of the event for the notifications to be of any use to the landholders and residents downstream.
6.2.3 THE PLACEMENT OF A GAUGING STATION ON VANDYKE CREEK
The placement of this gauging station will record and monitor stream flows from a large part of the sub- catchment currently not monitored. This will mean another 12% of the catchment will have an actual flow volume recording 3 days out from reaching Emerald.
6.3 STRUCTURAL MITIGATION
The structural recommendations have been based on modelling results, on ground data collected during the last two events, historical data, residence information and a large series of photos leading up to, during and after the events. All relevant flow structures around town were located, evaluated and measured in comparison with flow volumes in each area. Appendix 2 reviews images of each flow structure, their sizes and locations. This will be relevant for the structural mitigation recommendations.
6.3.1 INCREASED FLOW PATH UNDER NOGOA RIVER RAIL BRIDGE EMERALD
Increasing the flow path by placing large box culverts or small bridges on the western side of the main bridge up to Opal Street will add as much as 20% to the capacity of the main channel of the river in this area. This will allow the flow to move through the town much faster and reduce pooling.
C&R Consulting have modelled the effects of an increased flow path under the Rail Bridge by inserting either a small bridge or 8 culverts under the Vince Lester Bridge, increasing the capacity by an additional 20% to the main channel. Each culvert within the model represents five 1.5 m x 1 m rectangular box culverts, located in the positions indicated in Figure 4. The effect that this has on the flow can be seen in Figure 5 and Figure 6. Figure 5 shows the current situation where the ballast of the railway bridge acts as a levee bank holding back the flow, with pooling increasing the depth of the flow (darker blue) until it spills over the bridge. This also has the effect of not allowing the water to clear downstream of the bridge as quickly and creates flow towards the river along the ballast towards the river on the upstream side.

CLIENT: Central Highland Regional Council PROJECT: Flood Management Analysis REPORT: Section B – Fairbairn Dam through Emerald DATE: December 2011
24
Figure 4: Culvert locations under western side of the railway bridge
Figure 5: 500 m3/sec test flow with no culverts
Figure 6 shows exactly the same modelled flow with the culverts included, and shows a shallower depth on the upstream side of the railway bridge as the flow goes through the culverts and clears the downstream area along the golf course. The flow through these

CLIENT: Central Highland Regional Council PROJECT: Flood Management Analysis REPORT: Section B – Fairbairn Dam through Emerald DATE: December 2011
25
culverts also prevents floodwater from going over the highest section of the bridge in this model which has a much higher flow rate than was experienced in the 2010/11 event.
Figure 6: 500 m3/sec test flow including culverts under the levee
6.3.2 ELEVATION OF NEW STREET
The old flow path that comes out of the river across New Street, the QRI sports ground then through the railway pedestrian under pass can be controlled by elevating New Street. This flow path is restricted by the pedestrian walk way at present as well as the sports grounds (previously swamp land) downstream. It is C&R‟s recommendation that New Street be built up to 178.39m AHD which is 1.47m above current height with two 750mm pipes at ground level; reducing impacts of access across town and the possibility of the rail line over topping through the centre of town.
The elevation of 178.39m is important as it allows flows from the west and south of the rail line to make its way back into the river over New Street. This would have seen the road inundated in 2010/11 but not in 2008. This project cannot be done without increasing the capacity of flow under the rail bridge.
Table 3: Dimensions Relating to New Street and Flood Heights
Dimensions relating to New Street and flood heights
Current New Street AHD 176.92m
2008 flood height at New Street AHD 178.04
2010/11 flood height at New Street AHD 178.69

CLIENT: Central Highland Regional Council PROJECT: Flood Management Analysis REPORT: Section B – Fairbairn Dam through Emerald DATE: December 2011
26
6.3.3 INCREASED FLOW IN LN1 UNDER GREGORY HIGHWAY
The current Gregory Highway crossing over LN1 consists of 5 x 2.1 x 2.1 RCBC‟s which have 33% less flow capacity than the crossing up stream on Hogans Road. The recommendation is to double the capacity under the Gregory Highway by adding 3 new 2.1 x 2.1m RCBC‟s as well as 8 new 1.2 x 1m RCBC‟s or their equivalent in pipes. This crossing is currently expected to allow the capacity of flow from the railway pedestrian underpass, LN1 break out flow on the eastern up steam side which moves down through Egan Street as well as the flow in LN1. This was also recommended in a report commissioned by Gordonstone Coal Management PTY LTD and prepared by Blain Johnson PTY LTD in 1991.
Figure 7: Gregory Highway crossing flow structure
6.3.4 WIDENING OF LN1 DRAIN FROM HOGANS ROAD TO GREGORY HIGHWAY
The capacity of this section of LN1 is restricting the flow from Hogans Road through to the Gregory Highway. The developments on both sides of this section of drain have added to the problem by accumulating more water and restricting out of bank flows. The recommendation is to widen the drain on the Munro Road side by 15m. This would require the estimated removal of 30 000 m3 of material and increase the capacity of this section of drain by 33%. It is recommended that the elevation of the northern embankment be set at the elevation of Munro Road. All previously commissioned reports reviewed, did not deal with the flows leaving LN1 upstream at Tyson Road and moving to the east of LN1. This recommendation must be implemented with the Gregory Highway improvement.

CLIENT: Central Highland Regional Council PROJECT: Flood Management Analysis REPORT: Section B – Fairbairn Dam through Emerald DATE: December 2011
27
Figure 8: LN1 along Hogans Road. Recommended modifications
The blue hashed area marked in Figure 88 indicates where the bank would be widened to, and this widening has been modelled to determine the effects on water through-put along this section of the drain. Figure 9 And Figure 1010 show the modelled effects of half an hour‟s flow at a rate of 100 m3/sec, both before channel widening and after channel widening.

CLIENT: Central Highland Regional Council PROJECT: Flood Management Analysis REPORT: Section B – Fairbairn Dam through Emerald DATE: December 2011
28
Figure 9: Modelled 100 m3/sec flow along LN1 drain
Figure 10: Modelled 100 m3/sec flow along widened LN1 drain
These figures show that the amount of flooding is drastically reduced in the Cameron Rd industrial estate to the north of Munro Rd. Similarly the extra water storage and flow within the drainage channel reduces the out-of-bank flow to the south through the parkland leading toward Egan St.

CLIENT: Central Highland Regional Council PROJECT: Flood Management Analysis REPORT: Section B – Fairbairn Dam through Emerald DATE: December 2011
29
6.3.5 SECTION REMOVAL OF ELEVATED BANKS IN LN1 DRAIN ALONG MOFFAT ROAD
The recommendation is for the Drain embankments to be returned to an elevation taken from natural ground surface 50m south of the southern drain bank for each section; one section 200m long in LN1 and two sections 200m long in the LN1/2, all in the northern and southern embankments along Moffat Road. The three sections to be removed are described as follows:
The first section starting 900m east from the Gregory highway in LN1/2
The second section starting 1350 m east from the Gregory Highway in LN1/2
The third section starting 1950m east from the Gregory highway in LN1
The approximate positions of the section recommended for removal are marked in red on figure 11.
Error! Reference source not found.
Figure 11: Elevated Banks in LN1 Drain along Moffat Road. Section recommended for removal is shown in red.
It is recommended that the placement of these openings be worked through with the landholders immediately downstream. Other changes downstream from the openings may be required to allow the flows to return to their natural flow paths. The recommendation for these openings is to allow large flooding events to return to their natural flow paths and reduce the pooling while at the same time allowing low to medium flows to continue within the constructed drains.
6.3.6 INCREASED FLOW UNDER CLERMONT STREET
The current drainage under Clermont Street is 1 x 600mm pipe. It is recommended that it be replacing with 3 x 750mm pipes which will match the flow passing through from New Street. By matching the flow volumes, the ability to move through areas of town during large events will become easier and less restricting.
6.3.7 INCREASED STRUCTURE UNDER RAIL LINE AT OLD SHEEP YARD PLACE
During large out of bank flows, all water from south Emerald tries to make it through the structure under the rail line at Old Sheep Yard Place. Modelling has also indicated that this area is very prone to flooding if any local rain were to fall when the River has the south Emerald drain backed up. It is recommended that two steps be taken to reduce the impact of flooding and allow for drainage of water in this area
1. Increase the current flow under the rail line to 3 x 1200mm x 900mm box culverts. The current structure is (2) x 1200 x 600 and (1) x 900 x 300 box culverts.
2. Open the drain parallel to Powel Street to direct water from Powell and Roberts Street to the increased rail line structure. There is 300mm of fall from the corner of Powel and Roberts to the base of the current flow structures under the rail line.
6.4 RESILIENCE
The long term goal for the town of Emerald is resilience to out of bank flooding of the Nogoa River. Due to the nature of the catchment and climate dynamics of the seasonally arid tropics, the Nogoa River will always be a system that floods; however the township of Emerald can be saved from the worst effects of this flooding by designing and planning for

CLIENT: Central Highland Regional Council PROJECT: Flood Management Analysis REPORT: Section B – Fairbairn Dam through Emerald DATE: December 2011
30
life on a floodplain. To achieve this state of being the following actions would be recommended;
Early warning with the use of accurate landholder information and a rainfall runoff model to minimise impact.
Structural improvements which give access across town during an event and quickly thereafter. - Access will give people more time to protect their property and enable evacuation in
be carry out in a safe manner. The areas of recommended structural changes are New Street. Gregory Highway across LN1. Clermont Street in front of pedestrian rail line underpass. The increased flow path under the rail line at Old Sheep Yard Place and increased drainage from the corner of Powel and Roberts Street. (i) The improvements to New Street would allow access to south west Emerald
during large events that wasn‟t possible in 2008 and 2010/11. (ii) The increase in flow structures in the Gregory Hwy at LM1 drain will increase the
time available for evacuation to the north by 12 hours and greatly reduce the risk of the road being washed out as in 2010/11.
(iii) The flow structures under Clermont Street downstream of the pedestrian rail line underpass will greatly improve access through this area during and after events.
(iv) The increased flow path under the rail line at Old Sheep Yard Place and drainage from the corner of Powel and Roberts Street will reduce the pooling of water in this area and allow more time for protection of property and evacuation.
Structural improvements that maximise the flow of water through the flood plain and limiting the impact on the town. .
The protection of flow path corridors across the town planning and flood plain areas to minimize damage.
6.4.1 FLOOD HEIGHT MARKERS
To assist in another flooding event, flood height markers from the 2010 event are recommended as a reference point for people to understand the possible risk and impact to their property. In consultation with household owners, 8-12 sites are suggested in less sensitive areas around town. It could be extended to the Vince Lester Bridge being home to a number of flood levels from the 1918, 1950, 1956, 2008 and 2010/11 flood heights. They may represent something like the image below of flood markers in South Lismore.
`

CLIENT: Central Highland Regional Council PROJECT: Flood Management Analysis REPORT: Section B – Fairbairn Dam through Emerald DATE: December 2011
31
Figure 12: Flood Marker Example

CLIENT: Central Highland Regional Council PROJECT: Flood Management Analysis REPORT: Section B – Fairbairn Dam through Emerald DATE: December 2011
32
REFERENCES
Blain Johnson Pty Ltd (February (1991): Investigation of Flood Problems in Emerald. Report prepared for Gordonstone Coal Management Pty Ltd..
C&R Consulting (2010): Average Recurrence Intervals – A Statistical Review. Report Presented to the Queensland University of Technology.
Department of Natural Resources (July 1995): Nogoa River Flood Plain Study: Runoff Routing Model Calibration Report. Report prepared for Nogoa River Flood Plain Steering Committee.
Kinhill Pty Ltd (1993): Emerald Stormwater Drainage System (DRAFT). Draft Report prepared for Emerald Shire Council.
Kinhill Pty Ltd (2000): Emerald Town Flood Study - Hydraulic modelling Nogoa River Sensitivity Report. Report prepared for Emerald Shire Council.

CLIENT: Central Highland Regional Council PROJECT: Flood Management Analysis REPORT: Section B – Fairbairn Dam through Emerald DATE: December 2011
33
APPENDIX 1
C&R Consulting Research Paper – ARI Statistical

CLIENT: Central Highland Regional Council PROJECT: Flood Management Analysis REPORT: Section B – Fairbairn Dam through Emerald DATE: December 2011
34
APPENDIX 2
Flow Structures around Town Location Longitude Latitude Structure Measurements Image
Gregory HW LM1 Box culverts
No image
LN1 West Bank (Hogans Rd)
55 K 0617305 UTM 7399473 Box culverts
LN1 Drain Walkway
Gregory Highway 55K 0617305 UTM 7399473
Western Rail line Cap Hwy
55K 0615954 UTM 7397667 Pipes

CLIENT: Central Highland Regional Council PROJECT: Flood Management Analysis REPORT: Section B – Fairbairn Dam through Emerald DATE: December 2011
35
Capricorn Highway west 55K Pipes
Western Rail Line Cap
Hwy 55 K 0615628 UTM 7397630 bridge
Capricorn Highway
(west) far bridge 55K 0534439 UTM 7560738
LN1 Drain on Braeside
Road 55 K 0618540 UTM 7400519

CLIENT: Central Highland Regional Council PROJECT: Flood Management Analysis REPORT: Section B – Fairbairn Dam through Emerald DATE: December 2011
36
Hogans Road Rail Bridge
55K 0617502 UTM 7398929
Tyson Rd LN1 55K 0616110 UTM 7397806 Box culvert
Centre of town rail line walk through
55K 0618087 UTM 7397855 Box culvert
Centre of town HWY
(directly opposite above) 55K 0618089 UTM 7397854 pipe 600 mm

CLIENT: Central Highland Regional Council PROJECT: Flood Management Analysis REPORT: Section B – Fairbairn Dam through Emerald DATE: December 2011
37
Long Street Dip 55K 0618290 UTM 7397255
Rail Line (street Corner) 55K 0617578 UTM 7397798
Rail Line (2) 55K0616938 UTM 7397740
Rail Line (3) 55K 0616668 UTM 7397714

CLIENT: Central Highland Regional Council PROJECT: Flood Management Analysis REPORT: Section B – Fairbairn Dam through Emerald DATE: December 2011
38
Capricorn Highway (TAFE)
55K 0616665 UTM 7397749
Capricorn Highway (Landmark)
55K0616933 UTM 7397784
Capricorn (Rail line crossing)
55K0617785 UTM 7398068
Vince Lester Bridge 55K 0619123 UTM 7397247

CLIENT: Central Highland Regional Council PROJECT: Flood Management Analysis REPORT: Section B – Fairbairn Dam through Emerald DATE: December 2011
39
Nogoa Rail crossing 55K 0619117 UTM 7397247 Refer to attachment
Cross sections in LMI every 4m stating from north bank. 163 0 .45 1.15 1.85 2.9 3.5 3.6 4 4 3.3 3.2 3.2 3.2 2.7 2.25 o.9 0 162 1.35 1.3 1.8 2.8 3.3 3.35 4 4 3.2 2.75 1.88 1.85 1.35 1.08