CENTER FOR URBAN TRANSPORTATION STUDIES · PDF fileFigure 19 : Benefits, Costs vs. Annual...
71
Evaluation of the Benefits of Automated Vehicle Location Systems i CENTER FOR URBAN TRANSPORTATION STUDIES Evaluation of the Benefits of Automated Vehicle Location Systems in Small and Medium Sized Transit Agencies Prepared By: Zhong-Ren Peng Edward A. Beimborn Simi Octania Richard J. Zygowicz Center For Urban Transportation Studies University of Wisconsin - Milwaukee PO Box 784, Milwaukee, WI, 53201-0784 Phone 414.229.4978 http://www.uwm.edu/Dept/cuts January, 1999 Sponsored by the Wisconsin Department of Transportation
Transcript of CENTER FOR URBAN TRANSPORTATION STUDIES · PDF fileFigure 19 : Benefits, Costs vs. Annual...

Evaluation of the Benefits of Automated Vehicle Location Systems
i
CENTER FOR URBAN TRANSPORTATION STUDIES
Evaluation of the Benefits of AutomatedVehicle Location Systems in Small and
Medium Sized Transit Agencies
Prepared By:Zhong-Ren Peng
Edward A. BeimbornSimi Octania
Richard J. Zygowicz
Center For Urban Transportation StudiesUniversity of Wisconsin - Milwaukee
PO Box 784, Milwaukee, WI, 53201-0784Phone 414.229.4978
http://www.uwm.edu/Dept/cuts
January, 1999
Sponsored by the Wisconsin Department of Transportation

Evaluation of the Benefits of Automated Vehicle Location Systems
ii
Executive Summary
This study presents an analysis of the potential benefits and application of AutomaticVehicle Location Systems (AVL) in small and medium sized transit agencies. The studyincludes two major elements: a technology assessment of AVL and a transit agency/transit user assessment. The technology assessment involved an investigation of the stateof the art in AVL and a survey of AVL vendors. The users assessment included a surveyof small to medium transit agencies that have implemented AVL to determine theirexperience with the technology and the benefits it has provided. In addition, a survey wasconducted of transit users in a Wisconsin community to assess the level of importancethat transit users place on features of transit service which AVL can affect. Thisinformation was used to identify the costs and benefits of AVL to the transit riders andservice providers.
The study reached the following conclusions:
• Automatic Vehicle Locator technology has matured to the point where it can beimplemented in a wide variety of agencies. There have been sufficient fieldapplications of the technology to resolve technical features of AVL and make it aviable option for smaller transit agencies.
• Transit users place a high degree of importance on features that minimize waitinguncertainty and increase their feeling of security. Features that AVL may providesuch as: vehicles operating on schedule, knowing when a bus will arrive if late,knowing another bus can be dispatched if there is a breakdown and knowing there isan emergency communications system were rated highly by transit users in the surveydone as part of this study.
• The implementation of AVL technology involves significant human factors andmanagement issues that should not be underestimated. AVL provides more controlof vehicles and may change the way in which transit systems acquire and useinformation. Transit agencies considering the use of AVL need to examine theirentire operating procedure to assure that the maximum potential of AVL is utilized.
• AVL systems for small transit agencies may potentially be shared with othergovernment agencies. Cooperative arrangements with public works departments, lawenforcement agencies and other transit agencies should be explored before an AVLsystem is implemented. AVL systems should be designed to be easily adaptable toother users.
• AVL systems potentially can have large benefits, which easily exceed the costs of thesystems. These benefits largely occur to transit users through reductions in vehiclewaiting time even if only by a small amount. Other effects such as increased sense ofsecurity and reduced response time for incidents cannot be easily quantified but
Evaluation of the Benefits of Automated Vehicle Location Systems
iii
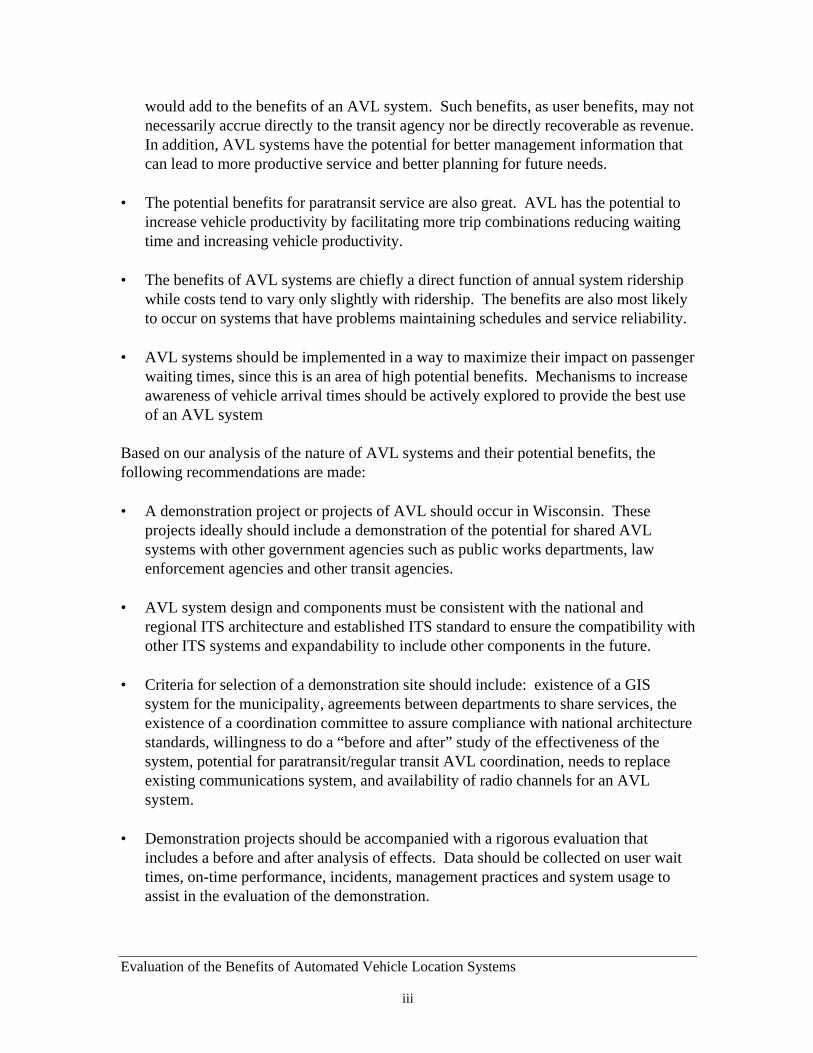
would add to the benefits of an AVL system. Such benefits, as user benefits, may notnecessarily accrue directly to the transit agency nor be directly recoverable as revenue.In addition, AVL systems have the potential for better management information thatcan lead to more productive service and better planning for future needs.
• The potential benefits for paratransit service are also great. AVL has the potential toincrease vehicle productivity by facilitating more trip combinations reducing waitingtime and increasing vehicle productivity.
• The benefits of AVL systems are chiefly a direct function of annual system ridershipwhile costs tend to vary only slightly with ridership. The benefits are also most likelyto occur on systems that have problems maintaining schedules and service reliability.
• AVL systems should be implemented in a way to maximize their impact on passengerwaiting times, since this is an area of high potential benefits. Mechanisms to increaseawareness of vehicle arrival times should be actively explored to provide the best useof an AVL system
Based on our analysis of the nature of AVL systems and their potential benefits, thefollowing recommendations are made:
• A demonstration project or projects of AVL should occur in Wisconsin. Theseprojects ideally should include a demonstration of the potential for shared AVLsystems with other government agencies such as public works departments, lawenforcement agencies and other transit agencies.
• AVL system design and components must be consistent with the national andregional ITS architecture and established ITS standard to ensure the compatibility withother ITS systems and expandability to include other components in the future.
• Criteria for selection of a demonstration site should include: existence of a GISsystem for the municipality, agreements between departments to share services, theexistence of a coordination committee to assure compliance with national architecturestandards, willingness to do a “before and after” study of the effectiveness of thesystem, potential for paratransit/regular transit AVL coordination, needs to replaceexisting communications system, and availability of radio channels for an AVLsystem.
• Demonstration projects should be accompanied with a rigorous evaluation thatincludes a before and after analysis of effects. Data should be collected on user waittimes, on-time performance, incidents, management practices and system usage toassist in the evaluation of the demonstration.

Evaluation of the Benefits of Automated Vehicle Location Systems
iv
• Transit systems equipped with AVL should make an effort to let passengers knowabout the system. These agencies should actively pursue systems that provide realtime bus location and arrival information to users. Such services can lead to fullerrealization of AVL benefits.
Key Words: Public Transportation, Automatic Vehicle Location System (AVL), Advanced PublicTransportation System (APTS), Benefits Costs Analysis, Survey Research

Evaluation of the Benefits of Automated Vehicle Location Systems
v
Table of ContentsEXECUTIVE SUMMARY ....................................................................................................II
TABLE OF CONTENTS .......................................................................................................V
ACKNOWLEDGEMENTS................................................................................................VIII
INTRODUCTION .................................................................................................................. 1
PROJECT OBJECTIVES .............................................................................................................2 REVIEW OF LITERATURE ........................................................................................................2
IDENTIFICATION OF AVL BENEFITS.......................................................................................4PROCEDURE ............................................................................................................................6
PROJECT SUMMARY REPORTS ...................................................................................... 7
AVL STATE OF THE ART REPORT..........................................................................................7TRANSIT AGENCIES' AVL USER REPORT ............................................................................12ON-BOARD RIDER SURVEY REPORT.....................................................................................16VENDOR SURVEY REPORT....................................................................................................28
A FRAMEWORK OF BENEFIT COST ANALYSIS ................................................... 30
BENEFITS ANALYSIS OF AVL...............................................................................................30TRANSIT AGENCY BENEFITS ................................................................................................32COST ANALYSIS OF AVL .....................................................................................................33BENEFIT COST ANALYSIS.....................................................................................................34
IMPLEMENTATION STRATEGIES................................................................................ 41
CONSISTENCY WITH THE NATIONAL ITS ARCHITECTURE....................................................41COLLECTIVE SHARING OF THE AVL SYSTEMS ....................................................................43CONTRACTING DOCUMENTS.................................................................................................45
CONCLUSIONS AND RECOMMENDATIONS ............................................................. 46
CONCLUSIONS.......................................................................................................................46RECOMMENDATIONS ............................................................................................................47
REFERENCES .................................................................................................................... 49
APPENDIX
AVL STATE OF THE ART REPORT........................................................................ APPENDIX A
VENDOR SURVEY REPORT.....................................................................................APPENDIX B
QUESTIONNAIRES...................................................................................................APPENDIX C
REQUEST FOR PROPOSAL DOCUMENT................................................................. ..APPENDIX D
Evaluation of the Benefits of Automated Vehicle Location Systems
vi
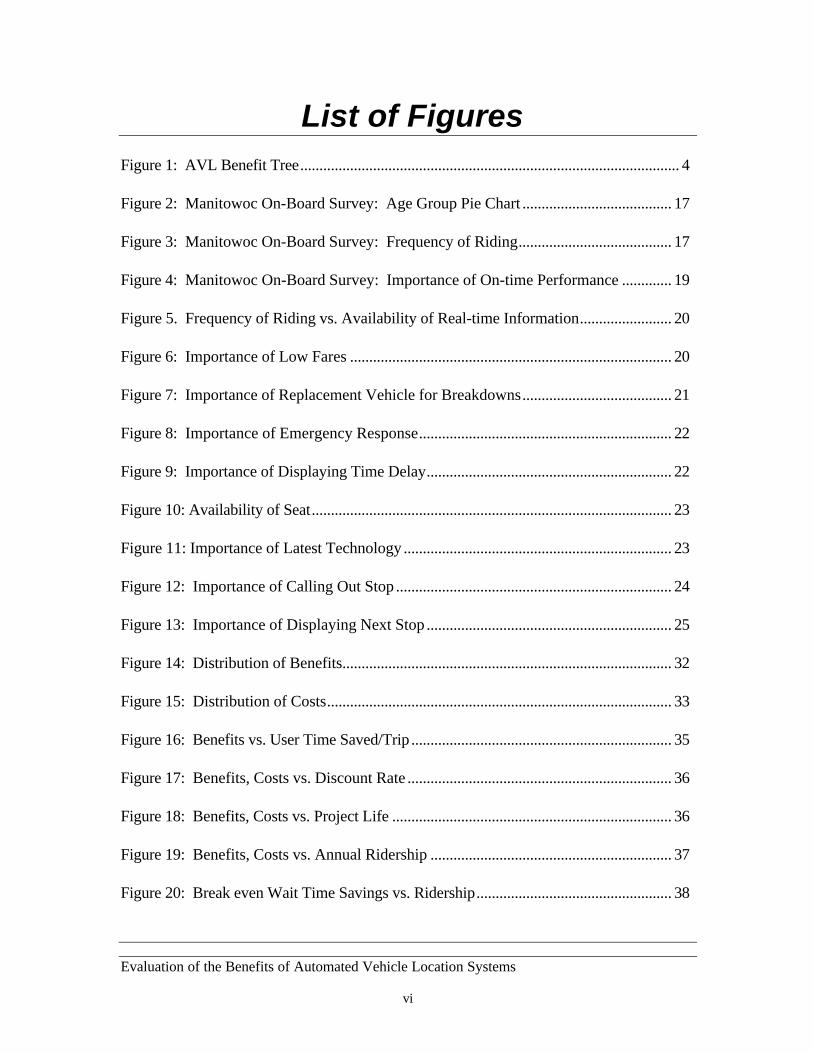
List of FiguresFigure 1: AVL Benefit Tree................................................................................................... 4
Figure 2: Manitowoc On-Board Survey: Age Group Pie Chart ....................................... 17
Figure 3: Manitowoc On-Board Survey: Frequency of Riding........................................ 17
Figure 4: Manitowoc On-Board Survey: Importance of On-time Performance ............. 19
Figure 5. Frequency of Riding vs. Availability of Real-time Information........................ 20
Figure 6: Importance of Low Fares .................................................................................... 20
Figure 7: Importance of Replacement Vehicle for Breakdowns....................................... 21
Figure 8: Importance of Emergency Response.................................................................. 22
Figure 9: Importance of Displaying Time Delay................................................................ 22
Figure 10: Availability of Seat.............................................................................................. 23
Figure 11: Importance of Latest Technology ...................................................................... 23
Figure 12: Importance of Calling Out Stop ........................................................................ 24
Figure 13: Importance of Displaying Next Stop ................................................................ 25
Figure 14: Distribution of Benefits...................................................................................... 32
Figure 15: Distribution of Costs.......................................................................................... 33
Figure 16: Benefits vs. User Time Saved/Trip .................................................................... 35
Figure 17: Benefits, Costs vs. Discount Rate ..................................................................... 36
Figure 18: Benefits, Costs vs. Project Life ......................................................................... 36
Figure 19: Benefits, Costs vs. Annual Ridership ............................................................... 37
Figure 20: Break even Wait Time Savings vs. Ridership................................................... 38

Evaluation of the Benefits of Automated Vehicle Location Systems
vii
List of TablesTable 1: Agencies Contacted and AVL System Highlights .............................................. 12
Table 2: Fleet Size and Related Costs................................................................................. 14
Table 3. Weighted Importance Index ................................................................................. 18
Table 4: Low Fares vs. Aging Group Cross-Tabulation .................................................... 21
Table 5: Frequency of Rides for Riders With or Without an Automobile ....................... 26
Table 6: Rider Potential ....................................................................................................... 27
Table 7: Benefit Analysis Spreadsheet ............................................................................... 38

Evaluation of the Benefits of Automated Vehicle Location Systems
viii
ACKNOWLEDGEMENTS
This report was done under the sponsorship of the Wisconsin Department ofTransportation. We would like to express our appreciation to Hector Gonzalez, DixonNuber, Linda Lovejoy and the project advisory committee for their helpful input on theproject. The research reported here is the product of independent university research andthe opinions expressed are not necessarily those of the project sponsor.
Project Advisory Committee
Pat McGinty, Brown’s Cab Service, Fort Atkinson, WIDoug Gerleman, Federal Transit Administration Region V, Chicago ILThad Kluck , Valley Transit, Appleton, WIKeith Carlson, La Crosse Municipal Transit Utility, La Crosse, WIAnthony Scherer , Manitowoc Transit System, Manitowoc, WIGreg Seubert, Wausau Area Transit System Inc, Wausau, WILinda A Lovejoy, Wisconsin Department of Transportation, Bureau of Transit and LocalRoads, Madison, WIDixon A Nuber, Wisconsin Department of Transportation, Bureau of Transit and LocalRoads, Madison, WIHector J Gonzalez , Wisconsin Department of Transportation, Bureau of Transit andLocal Roads, Madison, WITom Frank, Systems and Program Engineer, Federal Highway Administration -Wisconsin District, Madison, WIJoe McCarthy, Kenosha Department of Transportation, Kenosha, WI
Project Staff
Edward Beimborn, Principal InvestigatorZhong-Ren Peng, Co-Principal InvestigatorSimi Octania, Project AssistantRick Zygowicz, Project Assistant

Evaluation of the Benefits of Automated Vehicle Location Systems
1
IntroductionChapter I
Automatic Vehicle Location Systems (AVL) for Public transit have become readilyavailable in the last several years and have been utilized to track the locations of transitvehicles in real time. They have been promoted as being beneficial to the transit industryby offering transit agencies more flexibility in monitoring and managing their vehicles andby reducing customers’ wait time and increasing riders’ (perceived) security (Gomez,Zhao and Shen, 1998). These systems are being implemented primarily in large transitsystems where the AVL can provide obvious efficiencies in managing a large fleet ofvehicles (Casey, et al. 1996, 1998).
However, there is little prior work that specifically dealt with AVL applications in smalland medium sized transit agencies, i.e., transit agencies with fleet size less than 50vehicles. In addition, there has not been much formal research work with small systems interms of how ITS and AVL could benefit them. It is generally felt that agencies with largefleets and employment can gain efficiencies that are large enough to justify the costs toimplement the technology. However, the question still remains if AVL system canbenefit small and medium size transit agencies as well?
This study specifically addresses the issue of the benefits of AVL applications in smalland medium sized transit agencies. The study includes two major elements: a technologyassessment of AVL and a transit agency/transit user assessment. The technologyassessment involved an investigation of the state of the art in AVL and a survey of AVLvendors. Under the users assessment, small to medium transit agencies who haveimplemented AVL were contacted to determine their experience with AVL and thebenefits it has provided. In addition, a survey was conducted of transit users in aWisconsin community to assess the level of importance that transit users place onfeatures of transit service which AVL can affect. This information was used to identify thecosts and benefits of AVL to the transit riders and service providers. This informationthen provides a framework for conducting benefits costs analysis. The study concludeswith suggestions for transit agencies that are considering the adoption of AVL systems.
This study was conducted under the sponsorship of the Wisconsin Department ofTransportation. We would like to express our appreciation to Linda Lovejoy, HectorGonzalez, and Dixon Nuber of the Wisconsin Department of Transportation and theproject advisory committee for their helpful input on the project. Active members of theadvisory committee included representatives of transit agencies in La Crosse, Manitowoc,Appleton, and Watertown, Wisconsin. During the project, advisory committee membersand project staff visited AVL systems operated by Milwaukee County Transit System andAmerican United Taxicab in Milwaukee to increase their familiarity with AVL. Theassistance of the agencies is gratefully acknowledged. The research reported here is the

Evaluation of the Benefits of Automated Vehicle Location Systems
2
product of independent university research and the opinions expressed are not necessarilythose of the project sponsor.
Project Objectives
The objective of the project was to conduct an analysis of the potential benefits ofAutomatic Vehicle location Systems for small and medium transit systems in thestate of Wisconsin.
Using this statement and comments from the project steering committee thefollowing list of tasks was developed for the project:
1. Identify the state of the art in automated vehicle location systems, howthey are used, and what are their benefits.
2. Identify current transit systems that employ AVL technology andestablish how these systems are used, what benefits have beendemonstrated to date.
3. Identify how on-board riders would respond to AVL technology. Thisincludes not only how beneficial they would view such technology,but also how they would rank it along with other transit services.
4. Identify the major providers of AVL technology to the transit industryfor the acquisition of information on the latest AVL abilities and howmany and type of this systems have been installed.
5. Identify and develop a list of AVL benefits that show its impact to thetransit agency and its riders.
6. Develop a Cost/Benefit analysis that demonstrates the impact of AVLtechnology on an agency.
7. Make recommendations on the deployment of AVL systems forsmaller transit authorities.
Additional work was also done on combined or shared AVL systems. This work,done at the request of the project steering committee, examined and evaluatedjoint use of an AVL system among different departments.
Review of Literature
Many studies in the literature focus on the development of the AVL technology.For example, Cain and Pekilis (1993) in their article on the development history ofAVL give a good description of the shift from Loran C, Signpost and Dead-reckoning to the present global position systems (GPS) with enhanced real timelocation tracking and schedule monitoring. Dana (1997), Okunieff (1997) andKhattak et al. (1993, 1996, 1998) also provide a good overview of the GPStechnology and the role of AVL for bus transit. These studies on AVL systemshighlighted the fact that GPS was the most popular technology available in the
Evaluation of the Benefits of Automated Vehicle Location Systems
3
market at present. A wide variety of features can be added to the basic AVLsystem. Smart cards, electronic billing, passenger counters, maintenancemonitoring system, etc., are some of the examples.
On the other hand, very limited literature is available on the cost-benefit analysisfor the applications of AVL systems in transit agencies. One reason for this couldbe that it is a relatively new technology, and there is little data available for detailedcost-benefit analysis. Gomez, Zhao and Shen (1998) cite the example of six transitagencies in their paper and highlight the different service configurations, fleet,objectives, and other requirements that would determine the cost of an AVLsystem. Their survey of transit agencies using AVL and those in theimplementation stage showed that improving schedule adherence, emergencyresponse and providing real-time travel information were the three most importantfactors in opting for AVL technology.
Some transit agencies have compiled reports on the evaluation of their advancedpublic transportation systems (APTS) technology. Potomac and RappahannockTransportation Commission (PRTC) presented their findings to the TRB in April1996. They were successful in implementing flex-routing and feeder servicesbecause of the AVL system. They estimated annual savings of $869,148 for theFiscal Year 1997. McKeen (1997) from the University of New Mexico citesanother success story in his evaluation report on the Urban Rural IntelligentCorridor Application (URICA) prepared for the city of Albuquerque. The mainfactor influencing implementation of AVL technology in this case study was todetermine the ability of an advanced regional management and response center. Astudy conducted by the University of California, Berkeley, assessed an annualsaving of $488,000 from the installation of AVL at Outreach, Santa Clara Valley,California in the year 1996-97 (Chira-Chavala, 1997). However, the transitmanagement feels that this was not an if-then relationship because the benefits aredifficult to measure. While they could attribute improved efficiency and increasedridership to the new system, the task of measuring it in revenue dollars saved wasperceived as difficult, because there are other factors such as increasing fleetcapacity occurred at the same time.
Outreach has also successfully implemented a Broker Model to serve fifteen citieswithin the valley region as a shared AVL system (Chira-Chavala, 1997). This gaverise to the idea of considering a multi-agency model or AVL system sharedbetween other departments in the city besides the transit agency. Not muchinformation was available on this front and therefore this question was included inthe survey of agencies using AVL to know if they were considering somethingalong these lines.

Evaluation of the Benefits of Automated Vehicle Location Systems
4
Identification of AVL Benefits
AVL systems are expected to have some specific benefits to transit agencies andto transit users. The concept of a “benefit tree” provides a useful framework forthe analysis of benefits. Based on our review of existing AVL systems, theliterature and vendor information, a benefit tree was developed. These areillustrated in the following diagram.
OperationalBenefits
ScheduleEfficiencyRevenue
CostSavings
Morale andImage
Less RiskTimeSavings
AVLBENEFITS
BetterComplaintResponse
UserBenefits
WaitTime
CushionTime
In-VehTime
Safety SecurityGreaterProductivity
MoreRidership
FleetReduction
BreakdownsLess
Breakdowns/Delays
SafetySecurityMore
Certainty
EfficientRadio
System
ReduceStaff
ReduceResponse
Time
ExistingRoutes
FuturePlanning
Figure 1: AVL Benefit Tree
The benefits identified were classified as either an operational benefit to the transitagency or as a user benefit that occurs to transit riders.
Operational Benefits
The advantage of AVL to the operation and management of a transit agency iscentered on its ability to provide a more efficient service and to reduce costs. Thebenefits from an AVL system may include cost reductions by the elimination ofstaff and reducing response time to incidents. Also AVL systems potentially canincrease the efficiency of existing routes and provide greater productivity withoutincreased staff or vehicles. Both of these areas may lead to greater revenuegeneration through cost savings and the increase of potential ridership. Theunmeasurable benefits of AVL to an agency have to do with the ability to useAVL to increase awareness and pride in the existing service.
Cost Savings
AVL may be effective in reducing the cost of managing a transit system inseveral ways. The first is the ability to reduce or reassign existing staff if

Evaluation of the Benefits of Automated Vehicle Location Systems
5
their function can be handled by the AVL. For example, systems may nolonger need field personnel to do on time performance checks. AVLprovides an opportunity to evaluate and reassess existing staff positions.The next area of cost savings comes from the reduction in response time toincidents which may require police, fire, medical, insurance personnel, ormaintenance. In this case the ability to pinpoint a location, takes much ofthe guesswork out of directing these people. The final area of cost savingscan come in a more efficient use of radio systems. In many cases AVLreduces the need for direct communication between the base and thevehicle. Thus it saves airtime and its related expenses.
Additional Revenues
Better efficiency and reliable service may also lead to additional revenue.AVL allows the agency to provide a better service that may attract moreuse. This better service gives it the ability to offer higher standards ofservice and a means to promote the system.
Schedule Efficiency
Shorter headways, better productivity, and possibly fewer vehicles are afew of the ways that AVL improves an agency through improving itsschedule performance. By tracking vehicles as they move, an agency canlocate ways of modifying existing routes and schedules. Relocatingexisting routes may also help attract more riders while modifying transfertimes and headways. It can also help with signal preemption in busyintersections for transit vehicles.
Better Complaint Response
An important part of dealing with the public is having the answers to theirquestions. Many of these questions come in the form of complaints aboutthe service or possible damage to personal property. AVL gives an agencya tool to validate complaints. In this fashion the management canacknowledge or dismiss claims with the documentation that AVL canprovide. For example, complaints such as “the vehicle did not show up”can be verified and handled appropriately.
Morale and Image
There may be perceptions by the general public that waiting and riding onthe bus is not safe, too much time is wasted waiting for the vehicles toarrive (which are never on time), and that it costs too much to ride. AVLcan address many of these perceptions as well as give the agency a modern

Evaluation of the Benefits of Automated Vehicle Location Systems
6
appeal, which helps to improve morale of agency staff and improves theimage of the service offered. For instance, on-time performance can beshown in kiosks, display units in bus shelters or even on the Internet.
User Benefits
Benefits to transit riders are classified as those that reduce their risk and or providetime savings. Risk is reduced because communication is quicker with securitypersonnel. Reduced incident response times as well as reducing the amount oftime one waits for a vehicle are positive benefits. Time saving benefits come froma reduction in the wait-time at a stop. AVL keeps the vehicle on time and reducesuncertainty so users may need less cushion time for waiting.
Time Savings
It has been demonstrated that a rider’s perception of time as they wait for avehicle is longer than the actual time. Thus, many people believe that theyare waiting more time than they really are for the transit vehicle to arrive.This is compounded by the riders arriving at transit locations early to avoidthe chance of missing their ride. By providing better on time performanceand increased reliability, AVL can reduce the time needed by a user toarrive early to a stop and gives them more confidence that a vehicle willarrive at its posted time.
Less Risk
Security can be an issue with many users. AVL can provide a sense ofsecurity on the vehicle when riders are made aware of how the system canpinpoint the vehicle in emergencies. Furthermore, more rapid responsetime with the AVL can lessen the severity of any incidents that may occur.
Procedure
The project had two major elements, a technology assessment and a userassessment. The technology assessment included a state of the art analysis ofAVL technology and a survey of AVL vendors. These were conducted bytelephone and by use of the Internet. The user assessment included on-boardsurveys of transit users in Manitowoc, Wisconsin and a phone survey of TransitAgencies which have adopted AVL technology. The results of these surveys aregiven in the next chapter. Survey questionnaires were tested extensively to refinethe questionnaires and to decrease the response task of the respondents.

Evaluation of the Benefits of Automated Vehicle Location Systems
7
Project Summary ReportsChapter II
Under this project, a series of studies were conducted of the AVL technology, AVLvendors, transit agency use of AVL and transit user attitudes towards AVL attributes.This chapter provides a summary of each of these four efforts. Full reports of the state ofthe art and vendor studies are provided in the appendix.
AVL State of the Art Report
Introduction
AVL provides the ability to locate and track multiple vehicles as they travel in realtime. AVL is used to locate, manage, and plan the movement of a fleet of vehiclesby evaluating their current performance and making adjustments accordingly.Using AVL to locate vehicles in real time is beneficial for everyday operation andfor critical incident response. By knowing the precise location of a vehicle,agencies can better maintain schedules and improve on time performance. AVLcan also help an agency deal with criminal activity, medical emergencies, ormechanical breakdowns. Locating a vehicle while it travels is also helpful whenthere is a need to document its location. This can arise in cases of verifying legalclaims, rider complaints, and driver performance.
AVL when used as a management tool has the ability to monitor and relayinformation back to the office as it occurs. Management can observe relationsbetween bus performance for different times of the day and with different drivers.Using this data is beneficial for adjusting service schedules and managing staff.All of these applications can help management make decisions about operations.
AVL is a tool that allows an agency to evaluate and pursue new ways of adjustingtheir service. This includes examining how a bus performs on a new routethrough trial runs and adjusting the headway of current routes based on the datacollected. Using AVL in planning helps an agency find areas that needimprovement so service is preserved, efficiency is increased, and operating costsare cut.
AVL may also have application in cutting costs. Reducing the personnel neededto manually locate vehicles on the streets along with the ability to monitor how avehicle is performing on a given route may provide cost savings.
Currently there are four different types of AVL technology in use. The use ofthese systems has evolved with the introduction of better products and newersystems. The types of systems that are in use include GPS, Signpost, radionavigation, and Dead-reckoning.

Evaluation of the Benefits of Automated Vehicle Location Systems
8
Locating Systems
In 1996 the Federal Transit Administration (FTA) listed 58 AVL systems ascurrently in operation or planned for installation throughout the United States. Thefour types of AVL systems in use were Global Positioning Systems (GPS),Signpost, Radio Navigation, and Dead-reckoning. These AVL systems can beused as a “stand-alone” or in combinations. For example, the Chicago TransitAuthority utilizes not only GPS but also Dead-reckoning to locate its vehicles.Other systems such as the Milwaukee County Transit System only use deferentialGPS. A description of each type of AVL technology follows.
GPS Technology
Global Position System (GPS) technology is relatively new and is considered to bea leading form of advanced technology. Global Positioning Satellites are theproperty of the US Department of Defense. Although originally created to servethe military’s need to locate vehicles on the battlefield and ships at sea, thistechnology has now moved into use by the private sector. The system utilizes atotal of 24 high earth orbit satellites (11,000 miles), traveling in spherical orbits,that broadcast two signals (L1 and L2) every second. The two signals supplysimilar data except at different frequencies. The data consist of location identifiersand the precise time at which the signal was sent from the satellite. The timevariable is essential to the success and accuracy of the system. Each clock on thesatellite is capable of measuring time to better than a 10-9 seconds. The clock ineach satellite (each satellite has four, of which three are backups) is synchronizedto the clock in a receiver on the earth’s surface. Thus by utilizing the signalsgenerated by at least 4 satellites a receiver on the earth’s surface can calculate thepseudo-range and pseudo-velocity of the satellite by using the difference betweenclocks. This data can then be processed to determine the latitude and longitude ofthe GPS receiver.
GPS has proven to be very accurate, with a few exceptions. As mentioned before,GPS is owned by the United States Department of Defense (DOD) under theNAVSTAR Joint Office, and is currently subject to its shared use policies. TheDOD chooses to degrade the GPS signals. This action is referred to as “selectiveavailability” and accounts for the majority of error in the GPS signal. Besidesselective availability there are other errors that effect the accuracy of GPS. Themost common error has to do with the receivers. The synchronized clocks have tobe precise. Errors in the clocks of more than 10-2 second could result in an errorof almost 1,000 miles off in any direction. Most commercial clocks however aregood to the 10-9 second. Other sources of error can come from the atmosphereand electromagnetic interference.

Evaluation of the Benefits of Automated Vehicle Location Systems
9
Signpost Technology
An early system utilized for vehicle location was signpost. This technology tracksvehicles as they pass specific points utilizing short-range communicationtechnology between the vehicle and the signpost. There are many types ofsignpost systems that are in use by different agencies. Current varieties ofsignpost technology include optical scanners, magnetic strips, short-range radio,and beam emission. Each type of beacon has different power consummation ratesand varying effectiveness under a variety of conditions.
Currently there are two methods for utilizing signpost technology. The firstmethod is referred to as a “traditional signpost” system. This method uses thesignpost as the short-range transmitter. When a vehicle passes by a signpost itacquires the signpost’s ID through a short-range signal broadcast by the device.Along with the signpost’s ID the vehicle also records the odometer readingsimultaneously. Later, when that vehicle is contacted by the agency to gives itsposition, the signpost’s ID, old odometer reading, and current odometer readingwill be needed. The ID will indicate the last location of the vehicle and thedifferences between the odometers will indicate how far the vehicle has traveledfrom that point. A current location of the vehicle can then be determined alongthe route. In the other method, referred to as the “neo-traditional signpost”system, the location device acts as the receiver. At the point a vehicle passes eachsignpost the vehicle’s ID is transmitted to the signpost and then relayed through tothe agency. By knowing the site of each signpost and each vehicle’s ID thelocation of every vehicle can be monitored as they pass by a signpost. Thismethod does not require additional information such as the odometer reading.
Dead-reckoning Technology
Dead-reckoning employs the use of mathematical principles for locating vehiclesas they travel. In theory, if a vehicle’s starting point along with its speed anddirection is known, then the location of the vehicle can be calculated in respect tothat original starting point. Early mariners first used this system of navigation asthey traveled at sea. By using maps that located known land masses as startingpoints along with information on the wind and current speeds they could plotcourses and arrive at a set destination. Today the electronic land navigation ofDead-reckoning is done with wheel rotation monitors (for speed) and internalcompasses (for direction). Although the principles are the same, the paths areelectronically monitored continuously by use of computers and data inputs foraccuracy.
A Dead-reckoning system needs two different types of data, direction anddistance traveled, to locate a vehicle from a given starting point. The first datatype, distance, can be acquired by counting wheel rotations. Wheel rotation data
Evaluation of the Benefits of Automated Vehicle Location Systems
10
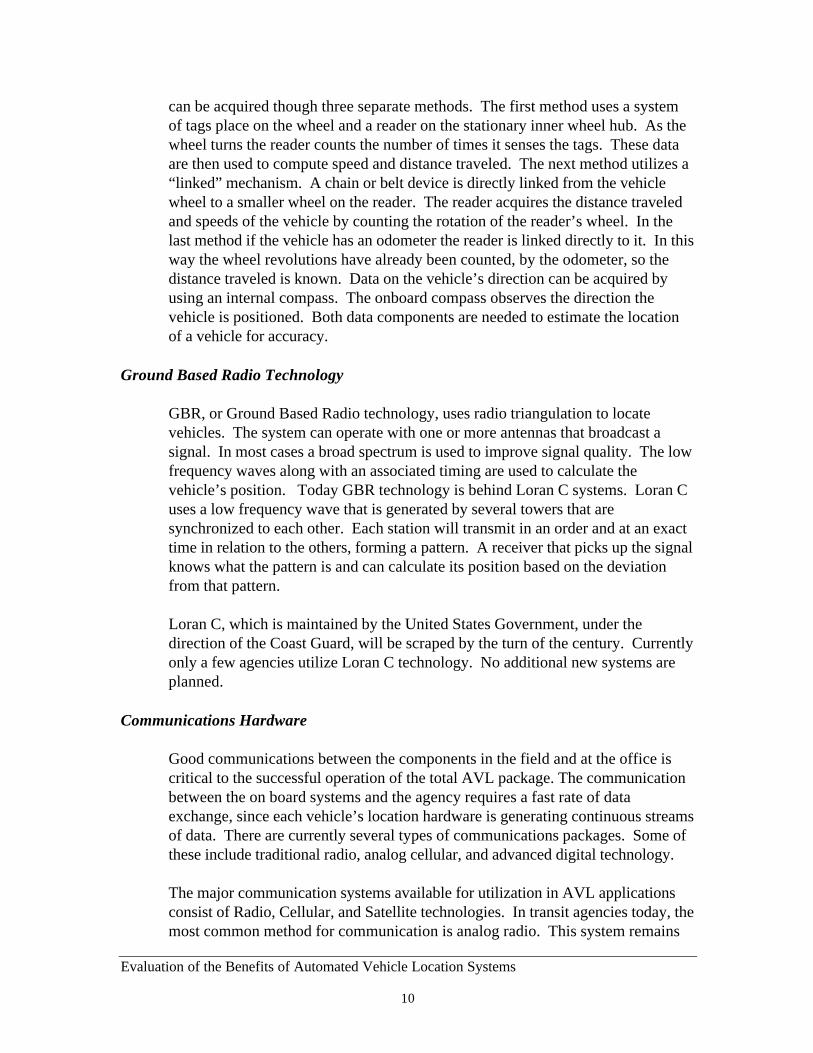
can be acquired though three separate methods. The first method uses a systemof tags place on the wheel and a reader on the stationary inner wheel hub. As thewheel turns the reader counts the number of times it senses the tags. These dataare then used to compute speed and distance traveled. The next method utilizes a“linked” mechanism. A chain or belt device is directly linked from the vehiclewheel to a smaller wheel on the reader. The reader acquires the distance traveledand speeds of the vehicle by counting the rotation of the reader’s wheel. In thelast method if the vehicle has an odometer the reader is linked directly to it. In thisway the wheel revolutions have already been counted, by the odometer, so thedistance traveled is known. Data on the vehicle’s direction can be acquired byusing an internal compass. The onboard compass observes the direction thevehicle is positioned. Both data components are needed to estimate the locationof a vehicle for accuracy.
Ground Based Radio Technology
GBR, or Ground Based Radio technology, uses radio triangulation to locatevehicles. The system can operate with one or more antennas that broadcast asignal. In most cases a broad spectrum is used to improve signal quality. The lowfrequency waves along with an associated timing are used to calculate thevehicle’s position. Today GBR technology is behind Loran C systems. Loran Cuses a low frequency wave that is generated by several towers that aresynchronized to each other. Each station will transmit in an order and at an exacttime in relation to the others, forming a pattern. A receiver that picks up the signalknows what the pattern is and can calculate its position based on the deviationfrom that pattern.
Loran C, which is maintained by the United States Government, under thedirection of the Coast Guard, will be scraped by the turn of the century. Currentlyonly a few agencies utilize Loran C technology. No additional new systems areplanned.
Communications Hardware
Good communications between the components in the field and at the office iscritical to the successful operation of the total AVL package. The communicationbetween the on board systems and the agency requires a fast rate of dataexchange, since each vehicle’s location hardware is generating continuous streamsof data. There are currently several types of communications packages. Some ofthese include traditional radio, analog cellular, and advanced digital technology.
The major communication systems available for utilization in AVL applicationsconsist of Radio, Cellular, and Satellite technologies. In transit agencies today, themost common method for communication is analog radio. This system remains

Evaluation of the Benefits of Automated Vehicle Location Systems
11
one of the cheapest forms of direct communications available. Analog systems,however, have significant drawbacks when used in AVL systems. This is becauseof the need to translate data from digital to sound. This process of translationrequires additional time to process the data and additional airtime to send it. In thefuture it is more likely that digital radios with their ability to take data in its digitalform will eventually replace analog.
Mapping Systems
Another component of AVL is a computer display or mapping system. Once thevehicle has been located using AVL hardware, its position calculated, and thencommunicated to the agency it must be located on a map. Computer maps areresponsible for taking the information being supplied by the vehicle anddisplaying it on a digital roadway database. Many of these digital maps are sold aspart of the total AVL package.
The digital map database, needed to display the vehicle locations, can be obtainedby an agency in through several sources. The easiest method is to purchase themap information. Currently there are several vendors that sell digital mapsthroughout the United States. The maps vary in price depending on whatinformation is required. The coverage of these maps is good but also limited tomost large-scale urban regions. For smaller urban areas ready-made digital mapsmay not exist. Digital maps for these areas will have to be created. This is done bytwo methods. The first is by digitizing current street grids off local maps andcreating the database from scratch. This is a time consuming process that requiresa large investment in time. The other method creates a map database from datasupplied from the Federal Government. The Federal Censuses Bureau compilesdigital map data in “TIGER” files. These files contain roadway information thatcan be used to create a local map database.
Conclusion
The current AVL systems combine positioning hardware, a communicationpackage, and a computer display system to monitor and track a vehicle’smovements in real time. The advantages to the agency that uses AVL is the abilityto observe, collect, and analyze information about a fleet’s performance as ittravels in real time. This data give an agency the ability to make better and moreinformed decisions while also providing quicker response to emergencies. Thebenefits to the rider mean better on time performance and less waiting.AVL applications appear to have focused on GPS technology as the primarymeans of tracking vehicles. This should be sufficient in all locations except inplaces where large buildings, tunnels or mountains block access to satellite signals.AVL also appears to be adaptable to all forms of radio communications fromanalog to digital. AVL can also work with most mapping software.

Evaluation of the Benefits of Automated Vehicle Location Systems
12
Transit Agencies’ AVL User Report
Introduction
In order to get information about the experiences of agencies using AVL systems;a telephone survey was undertaken of transit agencies that are currently usingAVL systems. The list of agencies contacted is shown in Table 1. This surveyconcentrated on small transit agencies rather than large agencies. Prior to thesurvey, a list of probable questions was mailed to these agencies to prepare themfor the questions during the telephone interview. Questions dealt with reasons forseeking AVL, AVL benefits and drawbacks, funding, pitfalls, system sharing, andcost benefit analysis. A copy of the question list is given in the appendix. Mostmanagers were willing to share their experiences in an informal discussionfollowing the questions in the survey.
A few agencies forwarded bid documents and reports that would be useful forother agencies considering an AVL system. The highlights of the survey havebeen summarized below.
City/ System
Automateddispatch &scheduling
On-timeperform-ance
Real-timeinformation
Efficientuse ofresources
Customercommuni-cation
Automatedbilling &payroll
Napa, CA – The Vine X X X
San Jose, CA - Outreach X X X X X X
Santa Monica, CA - SMMBL X X X X X
Cocoa, FL – SCAT X X X
Palatka, FL – Arc Transit X X X
Winston-Salem, NC - WSTA X X X X X
Albuquerque, NM - SunVan X X X X X
Rochester, PA - Beaver CTA X X X X X
Scranton, PA - COLTS X X X
Woodbridge, VA - PRTC X X X X X X
Sheboygan, WI - STS X X X X
TABLE 1: Agencies Contacted and AVL System Highlights

Evaluation of the Benefits of Automated Vehicle Location Systems
13
Summary of Findings
1. Reasons for seeking AVL:
When asked the reasons for implementing an AVL system, the followingresponses were given:• Efficient use of resources. Most small and medium sized agencies are
operating on tight budgets and cannot generate enough revenue to improvethe services. They felt that an AVL system would help utilize resourcesmore efficiently.
• Improve on-time performance through fleet tracking. The GPS outputhelps identify trouble areas and can be used for improving on-timeperformance.
• Get real-time information about the vehicles. The 20 to 30 second feedbackon the location of the vehicles helps track them. It is very useful forparatransit services where the vehicles can be guided to the correct addressin case the vehicle is off-route.
• Improved customer communication. Customers can be given the exactlocation of the vehicle at any given time. Even customer complaintsregarding no-show vehicles can be handled with the GPS data output.
• Automated dispatch and scheduling.• Automated billing and payroll.
2. Benefits of the system:The major benefits of the system cited by the agencies were given. From themanagement point of view the major benefits are:• Improved efficiency of the system: The feed back from the system allows
the agency to re-route vehicles during peak times. Routes that show poorpatronage can be rescheduled to demand-response or flex route. On-timeperformance can be better monitored.
• Improved Customer Communication: Disputes about non-arrival ofvehicles and similar customer complaints can be better handled because ofdocumented evidence of the real-time location of vehicles.
• Interviewees indicated that the most important benefit of the AVL system isfor flex routing services. Because of the AVL technology, flex routing andparatransit can be incorporated into the regular service. This saves thenumber of vehicles needed. Agencies like Woodbridge, VT (PRTC) thatoperate in low density areas could encourage choice riders by offering flexroute services and convenient pick-up points.
• Decreased reservation time. Paratransit services prior to the AVL systemrequired 24 to 48 hour advance reservations. With the AVL this time hasbeen brought down to an hour or half in many cases. Occasionally real-time scheduling can also be done, therefore saving time and resources.

Evaluation of the Benefits of Automated Vehicle Location Systems
14
3. Drawbacks of the system:
The system has proved quite beneficial to most agencies although there havebeen problems at the implementation stage. Integrating the AVL system withautomated scheduling and dispatching, the radio system and other software andhardware components have often proved to be a big hurdle. PRTC have beenstruggling to get their system fully operational for the past three years. Themajor problem zone was the integration of the AVL system with a pre-existinganalog radio system. Digital radio communications fit better with the AVLsystem. Then again some agencies had different vendors supplying differentparts of the AVL system and often the products did not integrate well.Agencies that got in entirely new systems have had no complaints. They couldbring in entirely new technology. This however would hike up the price of theentire project. Agencies like Sheboygan transit have had their system for 10years and never had a major breakdown until recently. Outreach Californiacompares their system to a kitchen appliance in reliance and durability.
4. Funding:
State and local governments along with FTA have been the usual source offunding for these projects. However, in some instances like at Outreach,California, a public-private partnership was formed between the governmentand other corporations in the Silicon Valley to bring in extra money foroperating the service.
The cost of the system varies greatly depending on the capabilities of thesystem. Arc Transit, Palatka, Florida had a relatively inexpensive system wherethe base station cost $46,000 only. This was because they cut back on theirradio time and real-time information and fleet tracking capabilities.

Evaluation of the Benefits of Automated Vehicle Location Systems
15
City/ System System Cost Fleet Size
San Jose, CA - Outreach $750,000 15 buses, 55
vans
Palatka, FL - Arc Transit $50,000 14 buses
Winston-Salem, NC - WSTA $235,000 17 buses
Scranton, PA - COLTS $ 357,935 32 buses
Woodbridge, VA - PRTC $ 245,000 20 buses
TABLE 2: Fleet Size and Their Related Costs
5. Pitfalls:
There are numerous vendors in the market selling AVL products. An agencyhas to first and foremost have a clear idea about their needs and look for aspecific system. It is extremely important to bring in a reliable consultant,familiar with both transit operations and technology issues. It is worth theexpense to do a needs analysis.
Outreach attributes its success to the fact that they hired an engineer fortechnical support from the vendor. This gave them the advantage of gettingcomplete technical support from a person who was directly involved with theinstallation process. If the system is being put together by different vendors, itis essential to get some assurance of the compatibility of different software andhardware being used.
Good radio communication is also essential. Old systems like Sheboygan areupdating their radio system after ten years. The Palatka, Florida, system has itsown radio channel and is therefore thinking of leasing out airtime. PRTC,Virginia, have not been able to get their system working in three years becauseof the problems with the radio channel. High rates of owning radio channels inWashington, DC, area has led to implementation problems.
6. Sharing the system: Broker Model
Outreach, California has developed a Broker model that caters to 15 cities inSanta Clara County. The State of California put out bids for the paratransitdollar allocation in compliance with the ADA regulations. Outreach securedthe contract. They in turn contract with other paratransit companies who ownor lease the wheel-chair accessible vans. Outreach provides the AVL-GPSequipment for these vehicles. Outreach also handles all the scheduling,

Evaluation of the Benefits of Automated Vehicle Location Systems
16
dispatch and contract management. Outreach does not own the vehicles doingthe rides. The other agencies in turn pay Outreach for the services.
There are seven vendors contracting with Outreach for these services. Theyprovide services to fifteen cities in Santa Clara County.
7. Cost Benefit Analysis:
Only one agency amongst those contacted had done a cost benefit analysis forthe system. University of California, Berkeley, assessed an annual saving of$488,000 for Outreach, in the year 1996-97. However, the management feelsthat this is not an if-then relationship because the benefits are difficult tomeasure. All the other agencies shared this view. While they could attributeimproved efficiency and increased rider-ship to the new system, the task ofmeasuring it in revenue dollars saved was perceived as difficult. Often technicalstaff replaced lower and middle level staff, or the fleet capacity was increased;therefore, generating figures was difficult. PRTC, Virginia compiled a cost-benefit report to evaluate the flex route service and its benefits over fixed routeservice. This can indirectly be attributed to the AVL system, which facilitatesorganizing an efficient flex route service in low-density areas to encouragechoice riders.
On-board Rider Survey Report
Introduction
An on-board transit survey was conducted on Friday, January 23, 1998, on theManitowoc, Wisconsin transit system. The purpose of the study was to evaluatethe importance placed on AVL features by the riders in a small sized transitagency. The results would help evaluate the value of implementing an AVLsystem in small sized transit agencies to help improve the services. The survey wasconducted to get feedback about the riders’ concerns and perceptions aboutimprovement in services.
Manitowoc was selected because it is representative of a normal small sizedagency. They operate five full-time dedicated buses and one for flex scheduling.Five surveyors from the University of Wisconsin, Milwaukee administered thesurvey. The survey began at 6:15am with the first trip of the day and continued toapproximately 2:00 p.m. The questionnaires were handed out on board the busand collected back during the ride. The administering team was always at hand tohelp the respondents. The overall response rate was around 80 percent.

Evaluation of the Benefits of Automated Vehicle Location Systems
17
Summary of Findings
1. High proportion of Senior Citizens.
Senior citizens accounted for 27.1 percent of the total ridership on the day ofthe survey. (The survey was conducted on a day when the schools wereclosed.)
Over 65
46-65
26-45
18-25
Under 18
Figure 2. Manitowoc On-Board Survey: Age Group Pie Chart
2. Frequency of using transit.
It was observed that 31 percent of the people riding more than 5 times a weekare Senior Citizens. Therefore, any policy implication must keep in mind theneeds of this Group of riders.
< once a month
1-3 times a month
1-2 times a week
3-5 times a week
>5 times a week
Cou
nt
80
60
40
20
0
Age-group
Over 65
46-65
26-45
18-25
Under 18
Figure 3. Manitowoc On-Board Survey: Frequency of Riding

Evaluation of the Benefits of Automated Vehicle Location Systems
18
3. Rider perceptions.
The responses to questions regarding the riders’ rating of elements of transitservice were weighted and ranked in order to identify the relative importance ofthe major factors that affect riders’ decision to ride a bus. The most importantranking is scored 1 and the least important ranking is scored 5. These scoreswere then weighted using the frequency of respondents who selected thefactors. As shown in table 2, bus arrivals on-time and real-time information arethe two most important factors. However, it should be noted that all the factorsrange between 1.48 and 2.82, implying that all were important in the riders’decision in using transit. Only calling out the stop had an average rating nearthe middle of the scale.
Variable Weighted Importance ScoreBus is on-time 1.48Real-time Information 1.55Low Fares 1.62Replacement on breakdown 1.66Emergency Response 1.68Exact Delay Time 1.78Availability of Seat 1.91Latest technology 2.01Display Next Stop 2.39Calling out Stop 2.82
Table 3. Weighted Importance Index.

Evaluation of the Benefits of Automated Vehicle Location Systems
19
4. On-time performance
The on-time performance of the bus service emerged as the single mostimportant factor for the transit riders. In fact, the occasional riders tended tomark on-time performance as very important in their decision to ride a bus.Overall, 61 percent of the respondents considered the on-time performance asa very important factor.
< once a month
1-3 times a m
onth
1-2 times a week
3-5 times a week
>5 times a week
Cou
nt
80
60
40
20
0
Bus is ontime
Very Unimportant
Somewhat Unimportant
Neutral
Somewhat Important
Very Important
Figure 4. Manitowoc On-Board Survey: Importance of On-Time Performance
5. Real-time information. Having real-time information on the bus service emerged as the secondimportant factor. About half (51 percent) of the respondents felt this was veryimportant in their decision to riding a bus. However, on cross tabulating thisresponse with frequency of riding a bus, it was seen that this was a moreimportant consideration for people who ride the bus frequently. For occasionalriders, the availability of real-time information was not a significant factor.

Evaluation of the Benefits of Automated Vehicle Location Systems
20
< once a month
1-3 times a m
onth
1-2 times a week
3-5 times a week
>5 times a week
Cou
nt
80
60
40
20
0
Real-Time informatio
Very Unimportant
Somewhat Unimportant
Neutral
Somewhat Important
Very important
Figure 5. Frequency of riding vs. availability of real-time information
6. Low fares.
Over fifty-six percent (56.8%) of the respondents marked low fares as veryimportant. Once again the highest proportion was in the frequent riderscategory. This was a surprising observation as they were mostly monthly passholders and could get unlimited rides with their pass. The senior citizens andstudents got further subsidization. Further cross tabulating the response withage of respondent it was seen that age had little effect on the response. Thepercentage of people considering fares as very important in their decision toride a bus was high across all age groups.
< once a month
1-3 times a m
onth
1-2 times a week
3-5 times a week
>5 times a week
Cou
nt
80
60
40
20
0
Low Fares
Very Unimportant
Somewhat Unimportant
Neutral
Somewhat Important
Very Important
Figure 6. Importance of low fares

Evaluation of the Benefits of Automated Vehicle Location Systems
21
Age groups below 18 and above 65 both marked low fares as very important.It should be noted that both these groups had monthly passes available tothem.
1 1 7 2 5 2 0 2 5 8 8
4 5 . 8 % 5 0 . 0 % 6 5 . 8 % 5 7 . 1 % 6 4 . 1 % 5 8 . 7 %
6 3 9 1 0 8 3 6
2 5 . 0 % 2 1 . 4 % 2 3 . 7 % 2 8 . 6 % 2 0 . 5 % 2 4 . 0 %
4 4 2 5 6 2 1
1 6 . 7 % 2 8 . 6 % 5 .3% 1 4 . 3 % 1 5 . 4 % 1 4 . 0 %
3 1 4
1 2 . 5 % 2 .6% 2 .7%
1 1
2 .6% . 7 %
2 4 1 4 3 8 3 5 3 9 150
1 0 0 . 0 % 1 0 0 . 0 % 1 0 0 . 0 % 1 0 0 . 0 % 1 0 0 . 0 % 1 0 0 . 0 %
Coun t
% w i t h i n
Age-g roup
Coun t
% w i t h i n
Age-g roup
Coun t
% w i t h i n
Age-g roup
Coun t
% w i t h i n
Age-g roup
Coun t
% w i t h i n
Age-g roup
Coun t
% w i t h i n
Age-g roup
Very
Impor tan t
S o m e w h a t
Impor tan t
Neut ra l
S o m e w h a t
Un impor tan t
Ve ry
Un impor tan t
L o w
Fa res
Total
U n d e r 1 8 18 -25 26 -45 46 -65 Over 65
Age-g roup
Total
Table 4. Low fares vs. age group cross-tabulation
(Note: Totals in tables may differ because of different response rates to individual questions.)
7. Replacement vehicle. Having a replacement of vehicle available for breakdowns emerged as thefourth most important factor.
< once a month
1-3 times a month
1-2 times a week
3-5 times a week
>5 times a week
Cou
nt
70
60
50
40
30
20
10
0
Replacement on break
Very Unimportant
Somewhat Unimportant
Neutral
Somewhat Important
Very Important
Figure 7. Importance of replacement vehicle for breakdowns

Evaluation of the Benefits of Automated Vehicle Location Systems
22
8. Emergency Response. The idea that a bus could be equipped to contact an emergency responseservice was well appreciated by most riders. It appeared as the third mostimportant factor on the list.
< once a month
1-3 times a m
onth
1-2 times a week
3-5 times a week
>5 times a week
Cou
nt
80
60
40
20
0
Emergency Response
Very Unimportant
Somewhat Unimportant
Neutral
Somewhat Important
Very Important
Figure 8. Importance of emergency response
9. Delay time display. Knowing the exact delay time of a bus was marked as very important to theriders in their decision to ride a bus.
Very Unimportant
Somewhat Unim
portant
Neutral
Somewhat Im
portant
Very Important
Cou
nt
80
60
40
20
0
Figure 9. Importance of displaying delay time

Evaluation of the Benefits of Automated Vehicle Location Systems
23
10. Availability of seat.
Most respondents marked the availability of seats as very important. Duringthe day of the survey the available seats exceeded the number of riders at alltimes. Even the morning rush hour volume of passengers was never more than20 riders at any given time.
< once a month
1-3 times a month
1-2 times a week
3-5 times a week
>5 times a week
Cou
nt
80
60
40
20
0
Availability of Seat
Very Unimportant
Somewhat Unimportant
Neutral
Somewhat Important
Very Important
Figure 10. Importance of availability of seat
11. Latest technology. Knowing whether the transit system used latest technology along with theneed for calling out the bus stops emerged as the least important factorsinfluencing bus ridership.
< once a month
1-3 times a month
1-2 times a week
3-5 times a week
>5 times a week
Cou
nt
80
70
60
50
40
30
20
10
0
Latest technology
very Unimportant
Somewhat Unimportant
Neutral
Somewhat Important
Very Important
Figure 11: Importance of latest technology

Evaluation of the Benefits of Automated Vehicle Location Systems
24
12. Calling out stop.
A cross tabulation of frequency of riding the bus with importance of havingthe driver call out the stop, generated very interesting results. Contrary to thepresumption that the less frequent riders would like to know the names of theapproaching stops, it were the frequent riders who considered this asimportant. One of the possible explanations could be the number of seniorcitizens who might need help in alighting from the bus. However, most riderswere neutral about the importance of this variable.
< once a month
1-3 times a m
onth
1-2 times a week
3-5 times a week
>5 times a week
Cou
nt
80
70
60
50
40
30
20
10
0
Calling out Stop
Very Unimportant
Somewhat Unimportant
Neutral
Somewhat Important
Very Important
Figure 12. Importance of calling out stop

Evaluation of the Benefits of Automated Vehicle Location Systems
25
13. Stop Display.
The response to this query was similar to the one above. Thirty-six percent(36.6%) of the total respondents marked this as neutral in their decision to ridea bus.
Display Next Stop
Very Unimportant
Somewhat Unim
portant
Neutral
Somewhat Im
portant
Very Important
Cou
nt60
50
40
30
20
10
0
Figure 13. Importance of displaying next stop
14. Captive Riders. In understanding the responses it is essential to note that the majority of riderswere what can be termed as “captive” riders (i.e. they did not have an optionto taking the bus). Eighty percent of the respondents did not have a caravailable to make the trip. An interesting observation in this survey was that 57percent of the riders who said they would ride the bus more if betterinformation was available are those who already ride the bus more than fivetimes a week.

Evaluation of the Benefits of Automated Vehicle Location Systems
26
61 10 71
85.9% 14.1% 100.0%
36 14 50
72.0% 28.0% 100.0%
13 1 14
92.9% 7.1% 100.0%
10 3 13
76.9% 23.1% 100.0%
3 3 6
50.0% 50.0% 100.0%
123 31 154
79.9% 20.1% 100.0%
Count
% withinFrequencyof Riding
Count
% withinFrequencyof Riding
Count
% withinFrequencyof Riding
Count
% withinFrequencyof Riding
Count
% withinFrequencyof Riding
Count
% withinFrequencyof Riding
>5 times aweek
3-5 timesa week
1-2 timesa week
1-3 timesa month
< once amonth
Frequencyof Riding
Total
No Yes
Availablity of car
Total
Frequency of Riding * Availablity of car Crosstabulation
Table 5. Frequency of rides for riders with or without an automobile (Note: Totals in tables may differ because of different response rates to individual questions.)
Evaluation of the Benefits of Automated Vehicle Location Systems
27
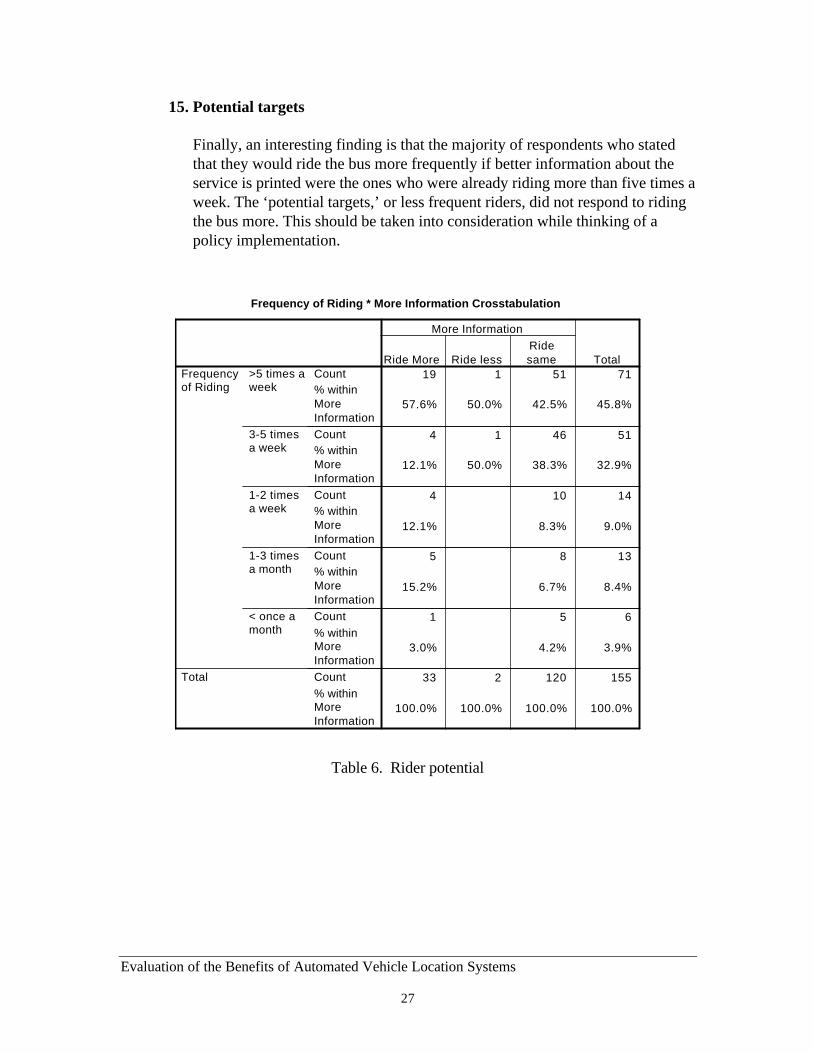
15. Potential targets
Finally, an interesting finding is that the majority of respondents who statedthat they would ride the bus more frequently if better information about theservice is printed were the ones who were already riding more than five times aweek. The ‘potential targets,’ or less frequent riders, did not respond to ridingthe bus more. This should be taken into consideration while thinking of apolicy implementation.
19 1 51 71
57.6% 50.0% 42.5% 45.8%
4 1 46 51
12.1% 50.0% 38.3% 32.9%
4 10 14
12.1% 8.3% 9.0%
5 8 13
15.2% 6.7% 8.4%
1 5 6
3.0% 4.2% 3.9%
33 2 120 155
100.0% 100.0% 100.0% 100.0%
Count% withinMoreInformationCount% withinMoreInformationCount% withinMoreInformationCount% withinMoreInformationCount% withinMoreInformationCount% withinMoreInformation
>5 times aweek
3-5 timesa week
1-2 timesa week
1-3 timesa month
< once amonth
Frequencyof Riding
Total
Ride More Ride lessRidesame
More Information
Total
Frequency of Riding * More Information Crosstabulation
Table 6. Rider potential

Evaluation of the Benefits of Automated Vehicle Location Systems
28
Vendor Survey Report
Introduction
AVL is a rapidly changing technology and it is important to identify companiesand products that have been around and will continue to exist in the future. Thiscontinuity or “here today still here tomorrow” allows investments in AutomaticVehicle Location (AVL) technology to take place with less risk of a companydissolving and a transit agency being left without maintenance and productsupport for their investment. To identify these companies a search and surveywas done to compile a list of AVL vendors and their products. This sectionidentifies companies that have a record of serving the transit market. It alsoprovides information about company profiles, products, service plans, and thetype and size of AVL systems they have installed to date. Detailed information onthe survey results and the companies contacted is in the Appendix.
Summary of Findings
The following is a list of major survey findings:
1. Of all the survey participants, 80% have been offering AVL products and servicesto the transit industry for less than 10 years. In contrast, the average number ofyears that each company has been offering products and services for vehicletracking to the United States military and private sector was 27.
2. Of the survey participants, 20% offered Signpost technology, 40% offered Dead-
reckoning, and 80% offered GPS and/or Differential GPS. This shows that thetrend in vehicle location technology is toward supplying the transit industry withGPS or DGPS. Of those vendors that offer products other than GPS, such as inthe case of Dead-reckoning, it was found that these products are used to addaccuracy to a GPS system rather than used as a stand-alone system.
3. Information varied about the accuracy of the individual AVL products offered.
Even among the GPS products, accuracy ranged from 300 to 100 meters and forDGPS from 100 meters to 1 meter. This information shows that not all systemshave the same performance, regardless if they are in the same category.
4. Conventional radio was the most common communication method utilized inAVL packages. This is due to the prevalence of conventional radio in the transitindustry. However, it was also indicated that most AVL systems could be madeto work using a variety of communication means.
5. In the past, personal computers (PC) used with AVL have been too “under-
powered” to run sophisticated software programs. This meant that specially

Evaluation of the Benefits of Automated Vehicle Location Systems
29
designed workstations were custom built and used in place of the PC. With theincreasing speed and power of the microprocessor this is no longer the case. Allsurvey participants use a PC to display vehicle movements in situations that callfor tracking less than 100 vehicles. The PC operating systems used range fromWindows 95 to NT. At a point between 100 and 500 vehicles the option of using aworkstation or a PC should be considered. If more than 500 vehicles will bedisplayed, then a workstation is still recommended.
6. The maps used to display the location of vehicles as they travel are obtained
through three ways. The first way is to purchase the map information fromoutside vendors. Most major cities have been digitally mapped by vendors.These digitized maps of cities are sold for a variety of reasons. Out of the totalnumber of participants, 80% said that they obtain their maps in this fashion. Thenext possibility is for the AVL vendors to digitize their own map. This is usuallyaccomplished through the Federal Government Census’s TIGER files for less than$100. And the final possibility is to get a digitized map from a municipality thatuses a Geographical Information System (GIS). Many GIS systems require thesame information that an AVL systems uses to track vehicles making it very easyand inexpensive to generate the base map.
7. Service programs are consistent among AVL vendors. Information gathered from
participants showed the average system warranty to be 12 months withmaintenance provided through service contracts arranged between the vendor andthe transit agency.
8. The average number of systems any vendor has installed and is in the process of
installation was eight, with the highest number of installations being 15 and thelowest five. Out of these systems the largest single installation of vehicles in anygiven system was 12,000 (taxi system in Singapore) and the smallest was five(Orlando, FL demo).
Conclusion
When evaluating the results of the AVL vendor survey, one can see that there aresimilarities or emerging trends between different companies. With 80% offeringGPS and DGPS the trend is that this will likely become the preferred way to trackand monitor vehicles. The display units, which only a few years ago would havebeen all workstations due to the under-powered PC, is now using PC’s as theirspeed and processing power, have increased. In addition, it will be more likelythat vendors will also utilize existing digital maps as more municipalities generatecity grids using GIS and as the digital map vendor’s branch out from the largeurban areas. In the coming years the market will continue to converge on similarproducts and methods for producing these systems will likely lead to lower prices.This will allow for further growth and better products.

Evaluation of the Benefits of Automated Vehicle Location Systems
30
A Framework of Benefit Cost AnalysisChapter III
Assessing the costs and benefits for AVL technology in public transportation is achallenging task because a large number of benefits associated with the use ofAVL are not easily quantifiable and therefore it is difficult to assign a dollar value.Moreover, bringing in new technology such as AVL system often acts as acatalyst that sets in motion a whole process of changes, which is not usuallyaccounted for in the final results of the cost-benefit analysis. For example, sinceOutreach, California decided to go in for expansion and brought in an AVLsystem, the ridership has increased significantly. But it would be difficult toattribute the increase in ridership or services to the AVL system alone in a cost-benefit analysis. The ridership and service increase could be the result of thecomplete revamping of the system, in which the new AVL system played a criticalrole. This point has been raised by most of the transit agencies and they stronglyfeel that this is not an ‘if-then’ relationship.
Examining the costs and benefits for technology changes is also best done in acomparative study that has to compare the before and after figures. This impliesthat in order to evaluate the benefits of an AVL system, one needs to haveconducted a similar study before implementing the system, to make a directcomparison. Even there, a direct comparison is difficult because it is hard tomeasure the organizational impact that AVL has brought in. Furthermore, thebefore and after comparison also depends on the operation efficiency of thebefore situations. A more efficient before-operation would make the impact ofnew technology smaller, while a less efficient before-operation would make theimpact of new technology larger.
Nevertheless, there is a need for transit agencies and decision-makers to determineif the new technology is worth the investment. A benefit-cost analysis is usually afrequently used tool.
Benefits Analysis of AVL
AVL has benefits to transit users and transit agencies. AVL can help transitagencies improve on-time performance, which can benefit transit users byreducing wait time. The time saving translates into direct benefits to transit users.AVL can also benefit transit agencies by increasing operating efficiencies, whichtranslates into reduction of operating or administrative expense. It can also reducethe response time to vehicle incidents, thus reducing incident costs.

Evaluation of the Benefits of Automated Vehicle Location Systems
31
User Benefits
The level of user benefits depends on the number of trips made, the value ofwaiting time and the amount of wait-time saving. The more transit trips made, thegreater the wait time saved. The number of trips, or transit ridership, can beobtained directly from transit agencies. The ridership is broken down into differenttrip purposes such as home to work, school, and other non-home based trips. Thevalue of wait time for every trip purpose can be derived from a mode split modelsuch as that developed by the Southeastern Wisconsin Regional PlanningCommission (SEWPRC). The critical question is how much wait time using theAVL technology can save. This requires a detailed study on wait time changesbefore and after AVL is installed. Since there is no published number on wait timesaving, some assumptions have to be made.
An example of a user benefits assessment is shown the spreadsheet given at theend of this section, using data from the City of Racine transit ridership for 1993 asa case study. The annual fixed-route ridership in Racine was 1,771,000 trips andparatransit ridership was estimated to be 17,731 trips. Among those, 29 percentare home-based work trips, 40 percent are school trips, 26 percent are shopping orother trips, and 4 percent are non-home-based trips. Parameters to convert timesavings into dollar benefits were derived from SEWPRC’s mode split model1.These led to a value of travel time for work trips of $2.09 per hour, and $0.41,$0.42 and $2.05 for school, shop/other and non-home based trips respectively.Since people perceive wait time longer than the actual wait time, a weightedadjustment is made to obtain a perceived wait time. The SEWRPC model impliesthat people who make work trips perceive wait time as about 2.62 times longerthan the actual wait time. In another words, wait time is about 2.62 times morevaluable than the in-vehicle time. Parameters for other trip purposes are 1.00 forschool trips, 7.36 for shopping trips and 7.00 for non-home based trips.
The critical question is how much wait time can users save by AVL? Since there isno hard data at this time, 2 minutes per trip are assumed in this analysis.Therefore, for the work trip there is a wait time saving of 1,037,802 minutes(518,901 trips * 2 minutes). Since wait time is 2.62 times more valuable than thein-vehicle travel time, the dollar value of the wait time saving is $94,713 (1,037,802minutes * $2.09 * 2.62). Similar calculations are done for other trip purposes andlead to an annual user benefit of all trip purposes for fixed route service about$187,000 with an AVL system-wide saving of 2 minutes per trip to transit users.
1 Values of time and waiting time were derived from the Southeastern Wisconsin Regional Planning Commission mode split model
(SEWRPC Planning Report #41, A Regional Transportation System Plan for Southeastern Wisconsin: 2010, Chapter VII, p313, Feb,1995). This model was calibrated by SEWRPC based on home interview survey data, to simulate how trave3lers make tradeoffsbetween travel time, travel cost, waiting time and other factors when they choose a means of travel. Parameters were developedfrom the calibrated disutility equations by factoring out the in-vehicle time multiplier and looking at the relative values of othercoefficients in their model
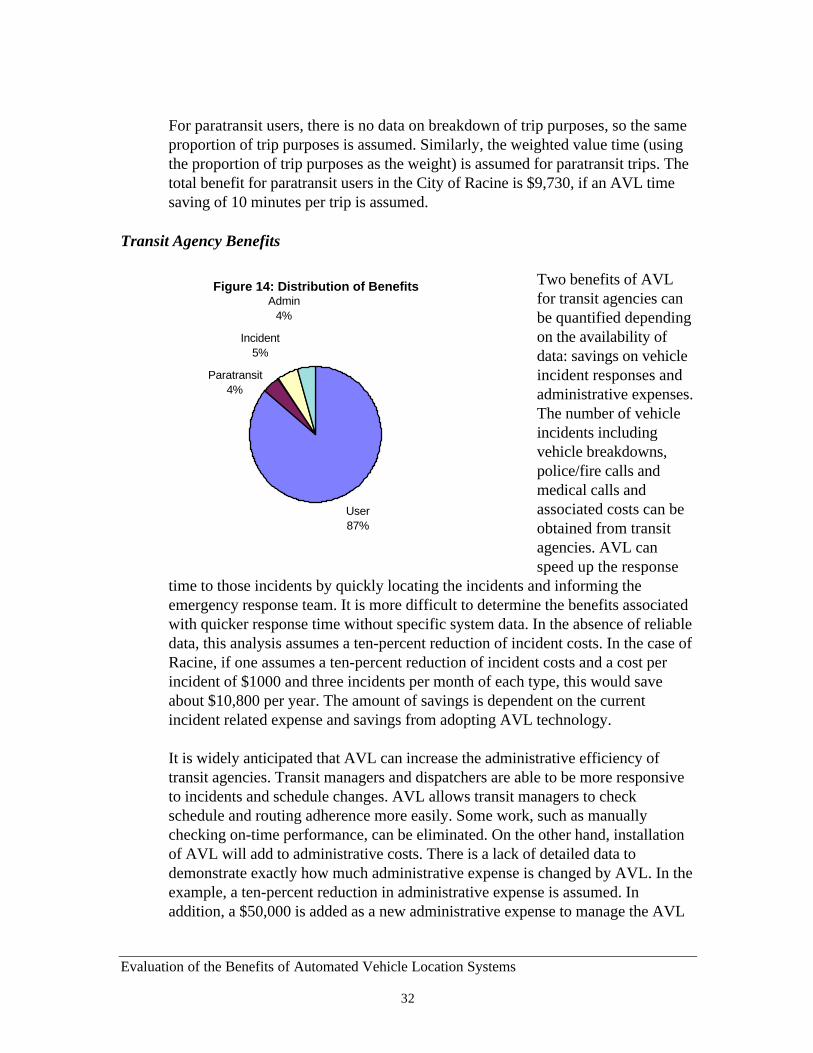
Evaluation of the Benefits of Automated Vehicle Location Systems
32
For paratransit users, there is no data on breakdown of trip purposes, so the sameproportion of trip purposes is assumed. Similarly, the weighted value time (usingthe proportion of trip purposes as the weight) is assumed for paratransit trips. Thetotal benefit for paratransit users in the City of Racine is $9,730, if an AVL timesaving of 10 minutes per trip is assumed.
Transit Agency Benefits
Two benefits of AVLfor transit agencies canbe quantified dependingon the availability ofdata: savings on vehicleincident responses andadministrative expenses.The number of vehicleincidents includingvehicle breakdowns,police/fire calls andmedical calls andassociated costs can beobtained from transitagencies. AVL canspeed up the response
time to those incidents by quickly locating the incidents and informing theemergency response team. It is more difficult to determine the benefits associatedwith quicker response time without specific system data. In the absence of reliabledata, this analysis assumes a ten-percent reduction of incident costs. In the case ofRacine, if one assumes a ten-percent reduction of incident costs and a cost perincident of $1000 and three incidents per month of each type, this would saveabout $10,800 per year. The amount of savings is dependent on the currentincident related expense and savings from adopting AVL technology.
It is widely anticipated that AVL can increase the administrative efficiency oftransit agencies. Transit managers and dispatchers are able to be more responsiveto incidents and schedule changes. AVL allows transit managers to checkschedule and routing adherence more easily. Some work, such as manuallychecking on-time performance, can be eliminated. On the other hand, installationof AVL will add to administrative costs. There is a lack of detailed data todemonstrate exactly how much administrative expense is changed by AVL. In theexample, a ten-percent reduction in administrative expense is assumed. Inaddition, a $50,000 is added as a new administrative expense to manage the AVL
Figure 14: Distribution of Benefits
User87%
Paratransit4%
Incident5%
Admin4%

Evaluation of the Benefits of Automated Vehicle Location Systems
33
Figure 15: Distribution of Costs
capital72%
maint28%
system. These numbers would result in a $9500 net administrative expense in thecase of the City of Racine.
It should be pointed out that these numbers are very approximate. Furthermore,because of the very small administrative staff of most small transit agencies, thereis very little flexibility in modifying administrative costs. Small transit agenciesshould generally expect that administrative savings and extra costs will canceleach other out for no net difference.
Figure 14, Distribution of Benefits, illustrates that the vast majority (87 percent) ofAVL benefits result from time savings from transit users. Only 9 percent ofsavings belong to transit agencies in the form of the reduction of vehicle incidentcosts and administrative expenses.
Cost Analysis of AVL
The costs of AVL include capitalcosts and ongoing maintenancecosts. The system costs include theexpense of installing GPS units onbuses, the expense of equipping thedispatch center, and othermiscellaneous expenses. The GPSunit costs depends on the number ofvehicles; the greater the number ofvehicles, the less the cost per unit.The GPS cost per bus ranges from$2000 to $5000. This analysis uses$4,000 as the assumed base unitcost. The total GPS and associatedother costs to equip all buses inRacine is $184,000 ($4,000 * 46 vehicles).
The cost of equipping the dispatch center also varies, depending on the systemrequirements and complexity. It ranges from $10,000 to $50,000. $30,000 is usedin this analysis. $20,000 is assumed to be other miscellaneous expense. The totalinitial system costs is about $234,000.
AVL maintenance is usually handled through a service agreement with the vendorwho installs the system. The contract usually covers the costs of installing thesystem as well as maintaining the system including system update andtroubleshooting. The annual maintenance expense ranges from $1500 to $20,000.$20,000 is assumed in this analysis.

Evaluation of the Benefits of Automated Vehicle Location Systems
34
To calculate the annual costs of the AVL system, it is assumed that the project willlast for 5 years and that the discount rate is four percent. Therefore, the annualsystem cost is about $52,513 and the maintenance cost is $20,000, for a totalannual cost of $72,563. The cost distribution chart (Figure 15) shows that thesystem cost is about two-thirds (72 percent) of the total cost and the maintenancecost is about one-third (28 percent).
Benefit Cost Analysis
In the above analysis there are total annual benefits of $217,077 and annual costsof $72,563. The net benefits are about $144,515, with a benefit/cost ratio of about3.0 for the City of Racine Transit System.

Evaluation of the Benefits of Automated Vehicle Location Systems
35
Sensitivity Analysis
Because of the lack of reliable before and after data, many of the numbers used tocalculate costs and benefits are assumed. Therefore, it is important to have asensitivity analysis to test how sensitive the analysis is to the underlyingassumptions. The sensitivity analysis has been conducted for the followingfactors: the wait-time savings, discount rate, projected project life, and transitridership. Sensitivity analysis helps to indicate how important the differentassumptions are and how different assumptions might affect the benefits andcosts of the system
As shown in Figure 16, Benefit vs. User Time Saved/Trip, user benefits are verysensitive to the wait-time savings. As the wait-time savings increase, the userbenefits increase dramatically. In the example given, the break-even point is whenthe wait-time saving is about 0.45 minute or 27 seconds per trip. Given that this isa very small number, it indicates that the potential for AVL wait time savings toexceed its cost is high. It is not difficult to imagine an AVL system to increase theon-time performance to reduce the wait time by less than a half minute.
Figure 16: Benefits vs. user time saved/trip
$0
$100,000
$200,000
$300,000
$400,000
$500,000
$600,000
$700,000
$800,000
1 2 3 4 5 6 7 8 9 10 11 12 13 14 15
Minutes saved per trip
benefits cost

Evaluation of the Benefits of Automated Vehicle Location Systems
36
As shown in Figure 17, the discount rate has a very small impact on the annualcost estimation. The projected system life, Figure 18, has a larger impact on theannual costs. Systems that last for very short time periods will have much higherannual costs. In the example shown, if the project life is over 1 year, the benefitsof AVL exceed the costs.
F i g u r e 1 7 : B e n e f i t s , C o s t s v s D i s c o u n t R a t e
$ 0
$ 5 0 , 0 0 0
$ 1 0 0 , 0 0 0
$ 1 5 0 , 0 0 0
$ 2 0 0 , 0 0 0
$ 2 5 0 , 0 0 0
0 % 3 % 6 % 9 % 1 2 %
D i s c o u n t R a t e
b e n e f i t s c o s t
F i g u r e 1 8 : B e n e f i t s , C o s t s v s P r o j e c t L i f e
$ 0
$ 5 0 , 0 0 0
$ 1 0 0 , 0 0 0
$ 1 5 0 , 0 0 0
$ 2 0 0 , 0 0 0
$ 2 5 0 , 0 0 0
1 3 5 7 9 1 1 1 3 1 5
P r o j e c t L i f e i n Y e a r s
b e n e f i t s c o s t

Evaluation of the Benefits of Automated Vehicle Location Systems
37
Figure 19 shows that the increases of transit ridership will increase both benefitsand costs, but the increase of benefits occurs faster than the increase in costs.These calculations were made assuming that user benefits, incident benefits andfleet size will vary directly with annual trips. With the assumptions made in theexample, the break-even point is at about 220,000 trips per year, or 4200 trips perweek. Smaller transit systems should take careful consideration of potentialthresholds of usage when considering adoption of AVL technology.
Additional insight to the effects of waiting time and ridership can be seen in Figure20. In this analysis, we determined the breakeven wait time savings at differentlevels of ridership in Racine and with different estimates of costs. Ridership wasvaried within plus or minus 15 percent range of the current ridership, with anassumption that the number of buses will remain the same. To estimate thebreakeven points of the time saving under different ridership scenarios, we set thebenefits equal to the low and high ends of the costs and solved for thecorresponding wait time savings.
With ridership changes from -15 percent to +15 percent, the time saving needed tobreak even with the low estimate of costs ranges from 35 to 47 seconds, and from
F i g u r e 1 9 : B e n e f i t s , C o s t s v s A n n u a l R i d e r s h i p
$ 0
$ 2 0 , 0 0 0
$ 4 0 , 0 0 0
$ 6 0 , 0 0 0
$ 8 0 , 0 0 0
$ 1 0 0 , 0 0 0
$ 1 2 0 , 0 0 0
1 0 0 2 0 0 3 0 0 4 0 0 5 0 0 6 0 0 7 0 0 8 0 0
A n n u a l R i d e r s h i p i n 1 0 0 0 s
b e n e f i t s a n n u a l c o s t

Evaluation of the Benefits of Automated Vehicle Location Systems
38
67 to 90 seconds with the high estimates of costs. Naturally, as ridership goes up,the breakeven point goes down.
Breakeven Analysis of Administrative Costs
Many of the benefits AVL provides are difficult to quantify. Two benefits of AVLfor transit agencies, which may quantified are savings on vehicle incidentresponses costs and administrative expenses. The number of vehicle incidentsincluding vehicle breakdowns, police/fire calls and medical calls and associatedcosts would have to be obtained from transit agencies. AVL can speed up theresponse time to those incidents by quickly locating the incidents and by reducingthe time to inform the emergency response team. The amount of savings isdependent on the current incident related expense and the potential reduction incosts from adopting the AVL technology.
It is anticipated that AVL can increase the administrative efficiency of transitagencies. AVL allows transit managers check schedule and routing adherencemore easily, and thus allow them to be more responsive to incidents and schedulechanges. Some routine work, such as checking on-time performance manually canbe eliminated by the information generated from the AVL. On the other hand, theinstallation of AVL will add expense to administrate AVL equipment.
Figure 20: Breakeven Wait Time Savings vs Ridership
0
10
20
30
40
50
60
70
80
90
100
-15% -10% -5% 0% 5% 10% 15%
Ridership change
Sec
onds
/trip
low cost estimate high cost estimate

Evaluation of the Benefits of Automated Vehicle Location Systems
39
If we don’t consider user benefit and only consider savings from administrativeexpense and reductions of incidents responses, to break even, the savings fromthese two items must equal to the annual total AVL system costs. The currenttotal administrative budget for Racine Transit System is about $703,000. To breakeven from administrative cost savings alone, the savings need to be between 9.3 to17.8 percent of the current total administrative budget. This is clearly an ambitiouscost reduction goal to achieve.
Some Caveats
This analysis is based on limited data and assumptions. It is intended as ananalysis framework only. More rigorous analysis needs more detailed and reliabledata. One shortcoming of the sensitivity analysis is that only one variable ischanged at a time. For example, when we analyze the sensitivity of ridership, weassume the wait-time savings are constant. It is more difficult to vary ridership andtimesaving at the same time to see their impacts on benefits and costs.
Furthermore, many potential benefits have not been taken into account in thisanalysis because of the lack of data or because of the difficulty of quantification.For example, the installation of a silent alarm system can increase the sense ofsecurity for both passengers and drivers. This psychological effect is difficult toput a dollar value on. The introduction of AVL may provide a basis for other newtechnologies, which may further help the transit agency realize further efficiencies.This effect is also difficult to quantify. Other non-quantifiable benefits includeimproved agency image, employee satisfaction, better handling of customercomplaints and reduction in their number.

Evaluation of the Benefits of Automated Vehicle Location Systems
40
System Information Fixed Paratransit Total Annual ridership 1,770,993 17,731 1,788,724 Fleet size 38 8 46
SEWRPC mode split #'s AVL effect AVL savings peryear
User Benefits Pct Trips Value Time Wait wt wait min/trip min wait min dollars Work trips 29% 518,901 $2.09 2.62 2.00 1,037,802 2,719,041 $94,713 School Trips 40% 715,481 $0.41 1.00 2.00 1,430,962 1,430,962 $9,778 Shop/other 26% 464,000 $0.42 7.36 2.00 928,000 6,830,082 $47,811 Non-Home based 4% 72,611 $2.05 7.00 2.00 145,221 1,016,550 $34,732
100% 1,770,993 Totals 3,541,986 11,996,636 $187,034 86.16% Paratransit Users $0.97 3.39 10 177,310 600,545 $9,730
AVL effectVehicle incidents/yr before AVL Cost /incident Annual cost pct reduced Breakdowns 36 $1,000 $36,000 10% $3,600 Police/fire calls 36 $1,000 $36,000 10% $3,600 Medical calls 36 $1,000 $36,000 10% $3,600
108 $108,000 $10,800 4.98%
AVL effectAdministrativeExpense
pct reduced
Fixed route $495,134 10% $49,513 Paratransit $100,000 10% $10,000 AVL admin $0 ($50,000) $9,513 4.38%
AVL system costs Total benefits $217,077Capital total Cost /vehicle $4,000 $184,000 Annual cost Equipment $30,000 $30,000 capital $52,563 Other $20,000 $20,000 maint $20,000
$234,000 total $72,563Annual Maintenance $20,000 net $144,515
Project life-yrs 5 Benefit/cost 2.99Discount rate 4.00% Break even min/trip 0.45
Refs: Bellebus spreadsheet derived from Racine transit data, SEWRPC Planning Assistance Report #79, table 20, Parameters derived from SEWRPCmode Split model Parameters are derived from SEWRPC mode split models
Grey cells are estimates used as input to calculations

Evaluation of the Benefits of Automated Vehicle Location Systems
41
Implementation StrategiesChapter IV
Consistency with the National ITS Architecture
The National ITS Architecture provides a common framework for the design andimplementation of ITS. It defines the functions that are performed in implementing ITS,where these functions reside, and the interfaces and information flows that are exchangedbetween ITS subsystems. Based on the requirements from the National ITS Architecture aset of ITS standards has been designed to ensure that ITS subsystems in different areaswith different components from different vendors can communicate with each other.
To ensure that everything "plays together" the way it should, a regional ITS architecturetailored to regional characteristics and transportation needs is desirable. A regionalarchitecture maps out how the various ITS components are ultimately tied together andintegrated -- both physically and institutionally. The National ITS Architecture provides acommon framework on which to build. It becomes a resource and a tool to help agenciesidentify and plan for the many functions and information sharing possibilities which maybe desired within a particular region.
An AVL system can be a part or subsystem of a regional ITS architecture. Its consistencywith the national ITS architecture will facilitate the integration of individual agencysystems to enable information from one agency to be shared with others acrossjurisdictional and agency boundaries. This is especially important if the AVL system is tobe shared with other agencies. The system consistency allows individual components ofAVL and other ITS programs to work together.
In addition to facilitating integration and future national compatibility, using theinformation and tools made available by the National ITS Architecture can also save timeand money (by cutting design time and costs) in the development of a regional ITSarchitecture and individual project designs. The National ITS Architecture supports a widerange of functionality and can be tailored to meet local transportation needs andproblems. Since the National ITS Architecture is also serving as the common foundationfor ongoing ITS standards development work, factoring it into current systemenhancements will facilitate the transition to a standard interface definition in the future.
Employing the National ITS Architecture and ITS standards in local AVL system designis the best means of spurring increased competition, thus lowering costs and reducingreliance on single vendors, ensuring future expandability (by using open standards), andpromoting the efficient use of resources. If the components of AVL are compliant withthe National ITS Architecture and ITS standards, they can be easily updated, expandedand exchanged with other vendors. When the time comes for update, there may not be anecessity to replace the whole system. Rather, individual components can be purchasedand replaced. Similarly, the system could be expanded to include other components andconnected with other systems because those ITS-standard-compliant components candirectly communicate with each other.

Evaluation of the Benefits of Automated Vehicle Location Systems
42
To ensure consistency with the National ITS Architecture and ITS standard, systemcompliance in AVL design should be addressed at both the planning and project levels.
At the planning level – the deployment of the AVL system should take into account thefollowing:
1. Participation by a broad range of governmental agencies that have interest in usingAVL technology and other ITS technologies.
2. Description of existing & planned AVL and other ITS enhancements, including both:• Physical inventory (e.g., automatic passenger counter, on-board display);• Sharing of information (e.g., sharing information with traffic control center andwith police stations and emergency dispatch center)
3. Definition of a regional ITS architecture, defined at the level of:• Subsystems (e.g., AVL system, Traffic Management, Transit Management)• Architecture flows (information exchanges between subsystems)
Additionally, the ITS element may include:
1. Roles and responsibilities for different agencies in sharing AVL technology,2. Linkages with capital improvement projects,3. Phasing considerations, both geographic and functional,4. Regional technology agreements.
At the project level – All projects should ensure that they are consistent with the nationaland regional ITS architecture. In addition, at the end of the design phase, the responsibleagency or their contractor should provide architecture consistency documentation. Thisconsistency documentation should provide a "mapping" of the project terminology to therelevant portions of the National ITS Architecture, at the subsystem and architecture flowlevel of detail, and should ensure that "what went into the design process also came out".Rationale should be documented for any architecture flows and subsystems omitted inthe project design but provided for in the regional ITS architecture. Additionally, the statecould require that approved ITS standards be specified in the design of the project if theyare applicable. The federal government may require that the contracting agency beresponsible for ensuring that Federal-aid requirements, including ensuring consistencywith the National ITS Architecture, are met. For transit-related projects using federalfunds, FTA will have the same role as that already employed based on the category offunding (e.g., whether it comes from a discretionary or formula-based funding line) andthe agreements with contracting agencies.
To ensure consistency at the project level, the state should verify that project scope isconsistent with the ITS element of the local transportation plans prior to authorization forprocurement and review the project's consistency documentation as part of the plans,specifications, and estimates (PS&E) package prior to purchase authorization

Evaluation of the Benefits of Automated Vehicle Location Systems
43
Collective Sharing of the AVL Systems
Over the past decade the majority of the AVL systems installed have been on large fleetsof vehicles. In these instances the cost of implementation for systems that were at thetime “state of the art” were only affordable and justifiable for larger fleets. In many casesthese fleets served major metropolitan areas where the need to manage resourcesefficiently made installing AVL systems practical. In agencies with smaller fleets thecomplexity of control is not so great and installation and operation of early AVL systemswas limited.
As technology has improved the overall costs of installing and maintaining AVL systemshas decreased but continues to favor the economy of scale in larger transit agencies. Largetransit agencies were some of the earliest adopters of AVL technology, although a fewsmaller agencies also adopted the technology.
To increase the economy of scale and to reduce the cost of installing AVL, efforts areunder way and have been carried out in smaller transit agencies to share AVL systemswith other fleets or departments outside the transit agency. This collective sharing ofAVL systems can reduce the expense of installation, operation and maintenance of anysingle agency. It not only provides a means to justify the cost of a system but alsopromotes better utilization of the AVL system’s capacity.
Current Examples of Combining and Collective Sharing
The following example demonstrates the different ways that can be used to share AVLtechnology and their benefits.
ARTIC: Advanced Rural Transportation Information and CoordinationMinnesota Department of Transportation ITS District 8
Number of vehicles: 34Number of agencies involved:5
The ARTIC project combines the Minnesota Department of Transportation, State Patrol,Minnesota Public Safety, Arrowhead Transit, and City of Virginia/Dial a ride into onemultifunctional multipurpose system. The project utilizes computerized mapping andAVL to assist in locating and collecting information on public vehicles. Public servicevehicles during the winter months are monitored to observe and track the placement ofsalt, for the purpose of better planning and coordination. The state patrol can moreefficiently respond to and locate incidents reported to the ARTIC center. The fixed routetransit vehicles work with the dial-a-ride system to form a network of reliable publicservice. In the future fixed wing aircraft and/or helicopters are to be added to assist in
Evaluation of the Benefits of Automated Vehicle Location Systems
44
responding to and identifying incidents. The project has been functioning sinceDecember of 1996, with a budget of $1.8 Million.
Sweetwater County Transit Authority, Wyoming
Number of vehicles: 12Number of agencies involved: 20
The Sweetwater County Transit Authority serves a vast rural area that is roughly the sizeof Vermont. Its major services focus on providing transit access to youth and seniorcitizen homes, child development centers and various other agencies. The AVL project’sgoals were to establish a dispatching center that could coordinate the efforts of severaldifferent departments into a regional network. This regional network provides access toany point in the county. The system has been in place for the past seven years andridership has since increased by five times. To control the cost, the system was notassembled with customized components. Rather many of the system hardware andsoftware products are “over the counter” and readily available. Several differentcomponents have been pieced together to form the overall vehicle tracking anddispatching system. The workstations used to monitor and manage the vehicles are PC-486’s with expanded memory. The dispatching software is “Rides Unlimited” with 10out of the twelve vehicles utilizing AVL. Sweetwater County demonstrates that even withlimited resources AVL and vehicle dispatching are possible.
To implement AVL technology at the small and medium-sized transit agencies in a cost-efficient manner, sharing the AVL system with other transit agencies and othergovernmental agencies such as public works and emergency response system haspotentially great benefits. While all vehicles still need to install GPS receivers, it needsonly one central data processor that receives, processes and disseminates vehicle locationdata. This centralized information processing and dissemination is cost-efficient ininstallation, system management and maintenance. This is especially important for smalltransit agencies where computer-skilled workers are in short supply.
AVL/ITS Service Provider
One way to implement an AVL system for a variety of agencies would be to create anAVL service provider. Such a provider could be modeled after Internet service providers(ISP). An ISP provides access to the Internet at a fixed monthly rate that usually includesunlimited access and the ability to store files on the ISP’s computer systems. Equipmentmust be purchased by individual users to provide terminals and connections to the ISP.An AVL service provider would be similar in that they would provide AVL services for amonthly fee per vehicle to individual agencies that have their own on-board and dispatchequipment. The AVL service provider would present an opportunity to concentrate

Evaluation of the Benefits of Automated Vehicle Location Systems
45
technical and maintenance expertise at one location. Dispatch stations could be located atindividual agency locations according to their needs.
The AVL service provider could also provide more general ITS services such as travelerinformation, if appropriate in an area. The service provider could be initiated by a transitagency or by a different agency, depending on the availability of expertise and willingnessto initiate such a program. Creation of an AVL service provider or having an agency takeon that role may be a useful way to implement a coordinated AVL system for a numberof agencies.
Contracting Documents
The Request for Proposal documents used by different Transit agencies has had a similarformat. Each document outlines the concept, method, equipment capabilities, training,warranty and backup support. These are important parts of the proposal submission asthey dictate the price.
The Agency needs to clearly state their main objectives in acquiring the new technology.The objective should emphasize this goal. For example COLTS defines their objectivesas:
1. Interconnection of GPS receiver units and antenna system.2. A tracking and display system located at the dispatch center.
The next step would be to detail the scope of work. Most agencies have outlined thefollowing requirements:
1. In-Vehicle Units,2. Communications Link,3. Dispatch center console,4. Documentation,5. Services to be provided.
In addition, the RFP should require that the system design and components should beconsistent with the national and regional ITS architecture and established ITS standard toensure the compatibility with other ITS system and expandability to include othercomponents in the future. System support is another important item that is detailed in thecontracting document. Most transit agencies require 3 years of system support thatincluding trouble shooting and software update.
A sample of a complete RFP or bid document has been attached in the appendix as aguideline for future procurements.

Evaluation of the Benefits of Automated Vehicle Location Systems
46
Conclusion and RecommendationsChapter V
Conclusions
Automatic Vehicle Locator technology has matured to the point where it can beimplemented in a wide variety of agencies. There have been sufficient field applicationsof the technology to resolve technical features of AVL and make it a viable option forsmaller transit agencies.
Most purchasers of AVL systems appear to have focused on GPS technology as theprimary means of tracking vehicles. This should be sufficient for nearly all applications,with the only exception being locations where large buildings or natural features blockdirect satellite signal access. AVL is adaptable to all forms of radio communicationssystems from digital to analog. AVL can also work with most mapping software.
The number of vendors of AVL technology has undergone significant change in the pastseveral years through mergers, new startups and discontinuance of product lines. It isimportant to select an AVL vendor with a significant track record in AVL for transit andlikelihood for continuance in the AVL business. Vendor service and assistance at startupis extremely important to the success of an AVL system.
Transit users place a high degree of importance on features that minimize waitinguncertainty and increase their feeling of security. Features that AVL may provide suchas: vehicles operating on schedule, knowing when a bus will arrive if late, knowinganother bus can be dispatched if there is a breakdown and knowing there is an emergencycommunications system were rated highly by transit users based on the survey done aspart of this study.
AVL system design and components should be consistent with the national and regionalITS architecture and established ITS standard to ensure the compatibility with other ITSsystem and expandability to include other components in the future.
The implementation of AVL technology involves significant human factors andmanagement issues that should not be underestimated. AVL provides more control ofvehicles and may change the way in which transit systems acquire and use information.Transit agencies considering the use of AVL need to examine their entire operatingprocedure to assure that the maximum potential of AVL is utilized.
AVL systems for small transit agencies have the potential of sharing the system withother government agencies. Cooperative arrangements with public works departments,law enforcement agencies and other transit agencies should be explored before an AVLsystem is implemented. AVL systems should be designed to be easily adaptable to otherusers.

Evaluation of the Benefits of Automated Vehicle Location Systems
47
The costs of an AVL system include a fixed cost for dispatch center equipment and a costper vehicle for on board equipment. In addition, there would also be an annual cost formaintenance and dispatch center operation. The actual cost will depend on the featuresincluded, the extent to which existing radio systems can be used and the availability ofexisting base maps. The life of the project is an important variable in project costs.Discount rate has a small effect on annual costs.
AVL systems potentially can have large benefits, which easily exceed the costs of thesystems. These benefits largely occur to transit users if their vehicle waiting time can bereduced by even a small amount. Other effects such as increased sense of security andreduced response time for incidents cannot be easily quantified but would add to thebenefits of an AVL system. In addition, AVL systems have the potential for bettermanagement information, which can lead to more productive service, and better planningfor future needs.
The potential benefits for paratransit service are also great. AVL has the potential toincrease vehicle productivity by facilitating more trip combinations. In addition, AVL canreduce the advance time needed for a trip reservation and reduce the uncertainty ofvehicle arrival time.
The benefits of AVL systems are chiefly a direct function of annual system ridershipwhile costs tend to vary only slightly with ridership. Benefits are also most likely to occuron systems that have problems maintaining schedules and service reliability.
AVL systems should be implemented in a way to maximize their impact on passengerwaiting times. This is an area of high potential benefits. Mechanisms to increaseawareness of vehicle arrival times should be actively explored to provide the best use ofan AVL system
Recommendations
Based on our analysis of the nature of AVL systems and their potential benefits, werecommend the following:
• A demonstration project or projects of AVL should occur in Wisconsin. Theseprojects ideally should include a demonstration of the potential for shared AVLsystems with other government agencies such as public works departments, lawenforcement agencies and other transit agencies.
• Criteria for selection of a demonstration site should include: existence of a GISsystem for the municipality, agreements between departments to share services, theexistence of a coordination committee to assure compliance with national architecturestandards, willingness to do a “before and after” study of the effectiveness of the

Evaluation of the Benefits of Automated Vehicle Location Systems
48
system, potential for paratransit/regular transit AVL coordination, needs to replaceexisting communications system, and availability of radio channels for an AVLsystem.
• Demonstration projects should be accompanied with a rigorous evaluation thatincludes a before and after analysis of effects. Data should be collected on user waittimes, on-time performance, incidents, management practices and system usage toassist in the evaluation of the demonstration.
• Transit systems equipped with AVL should make an effort to let passengers knowabout the system. These agencies should actively pursue systems that provide realtime bus location and arrival information to users. Such services can lead to fullerrealization of AVL benefits.
• AVL system design and components must be consistent with the national andregional ITS architecture and established ITS standard to ensure the compatibility withother ITS systems and expandability to include other components in the future.

Evaluation of the Benefits of Automated Vehicle Location Systems
49
REFERENCES
Cain, David A. and Pekilis, Barry R. 1993. AVLC Technology Today: A Developmental Historyof Automatic Vehicle Location and Control Systems for the Transit Environment. IEEE-IEEVehicle Navigation & Information Systems Conference, Ottawa.
Casey, R. F., et al. 1996. Advanced Public Transportation Systems. State of the Art Update ’96.United States Department of Transportation, Washington DC.
Casey, R. F., et al. 1998. Advanced Public Transportation Systems. State of the Art Update ’96.United States Department of Transportation, Washington DC.
Chira-Chavala, T., Venter, C. and Gosling, G. 1997. Advanced paratransit System: AnApplication of Digital Map, Automated Vehicle Scheduling and Location Systems. Institute ofTransportation Studies, University of California at Berkeley.
Dana, P. H. An Overview of the Global Positioning System (GPS).Http://www.utexas.edu/depts/grg/gcraft/notes/gps.
Farwell, Randall G., and Marx, Eric. Planning, Implementation and Evaluation of OmniRideDemand Driven Transit Operations: Feeder and Flex Route Services. TRB, April 1996.
Gomez, A., Zhao, F., and Shen, L. D. 1998. Benefits of Transit AVL and Transit AVLImplementation in the U.S. Paper presented at the 77th annual meeting of the TransportationResearch Board, Washington, DC.
Khattak, A., H. Noeimi, H. Al-Deek, and R. Hall. 1993. Advanced Public Transportation Systems:A Taxonomy and Commercial Availability, Partners in Advanced Transit and Highways (PATH)Research Report UCB-ITS-PRR-93-9, Institute of Transportation Studies, University ofCalifornia at Berkeley, California.
Khattak, A., H. Noeimi, and H. Al-Deek. 1996. A Taxonomy for Advanced Public TransportationSystems, Journal of Public Transportation, 1 (1): 39-64.
Khattak, A. and M. Hickman. 1998. Automatic Vehicle Location and Computer Aided DispatchSystems: Commercial Availability and Deployment in Transit Agencies. Paper presented at the77th annual meeting of the Transportation Research Board, Washington, DC.
McKeen, R. G. 1997. Urban/Rural Intelligent Corridor Application (URICA) Evaluation Report.ATR Institute, University of New Mexico.
Nelson, John D., 1995. “The Potential for Real-Time Passenger Information as Part of anIntegrated Bus-Control/Information System”, Journal of Advanced Transportation, Vol. 29, No.1, pp. 13-25.

Evaluation of the Benefits of Automated Vehicle Location Systems
50
Okunieff, Paula E. TCRP Synthesis 24: AVL Systems for Bus Transit. Transportation ResearchBoard, Washington DC: National Academy Press, 1997.
Tellechea, Suzanne B. and John R. Stone. 1998. AVL Planning for the Winston-Salem MobilityManager. Paper presented at the 77th annual meeting of the Transportation Research Board,Washington, DC.

Evaluation of the Benefits of Automated Vehicle Location Systems
51
Appendix A:AVL STATE OF THE ART REPORT

Evaluation of the Benefits of Automated Vehicle Location Systems
52
Appendix B:AVL Vendors Report
Evaluation of the Benefits of Automated Vehicle Location Systems
53
Vendor Survey Final Report
Abstract
AVL is a rapidly changing technology and it is important to identify companies andproducts that have been around and will continue to exist in the future. This continuity or“here today still here tomorrow” allows investments in Automatic Vehicle Location(AVL) technology to take place with less risk of a company dissolving and a transitagency being left without maintenance and product support for their investment. Toidentify these companies a search and survey was done to compile a list of AVL vendorsand their products. The following section of this report identifies companies that have arecord of serving the transit market. It also provides information about company profiles,products, service plans, and the type and size of AVL systems they have installed to date.
Summary of Findings
The following is a list of major survey finding:
1. Of all the survey participants 80% have been offering AVL products and services to thetransit industry for less than 10 years. In contrast the average number of years thateach company has been offering products and services for vehicle tracking to theUnited States military and private sector was 27.
2. Of the survey participants 20% offered Signpost, 40% offered Dead-reckoning, and 80%offered GPS and or Differential GPS. This shows the trend in vehicle locationtechnology is toward supplying the transit industry with GPS or DGPS. Of thosevendors that offer products other than GPS such as in the case of Dead-reckoning, itwas found that these products are used to add accuracy to a GPS system rather thanused as a stand-alone system.
3. Information varied about the accuracy of the individual AVL products offered. Evenamong the GPS products, accuracy ranged from 300 to 100 meters and for DGPS from100 meters to 1 meter. This information shows that not all systems have the sameperformance, regardless if they are in the same category of AVL systems.
4. Conventional radio was the most common communication method utilized in AVLpackages. This is due to the prevalence of conventional radio in the transit industry,although it was also indicated that most AVL systems could be made to work using avariety of communication means.
5. In the past, personal computers (PC) used with AVL have been too “under-powered” torun sophisticated software programs. This meant that specially designed workstationswere custom built and used in place of the PC for many years. With the increasing

Evaluation of the Benefits of Automated Vehicle Location Systems
54
speed and power of the microprocessor this is no longer the case. All surveyparticipants use a PC to display vehicle movements in situations that call for trackingless than 100 vehicles. The PC operating systems used range from Windows 95 to NT.At a point between 100 and 500 vehicles the option of using a workstation or a PCshould be considered. If more than 500 vehicles will be displayed, then a workstation isstill recommended.
6. The maps used to display the location of vehicles as they travel are obtained throughthree ways. The first way is to purchase the map information from outside vendors.Most major cities have been digitally mapped by vendors. These digitized maps aresold for a variety of reasons. Out of the total number of participants, 80% said that theyobtain their maps in this fashion. The next possibility is for the AVL vendors to digitizetheir own map. This is usually accomplished through the Federal GovernmentCensus’s TIGER files for less than $100. And the final possibility is to get a digitizedmap from a municipality that uses a Geographical Information System (GIS). ManyGIS systems require the same information that an AVL systems uses to track vehiclesmaking it very easy and inexpensive to generate the base map.
7. Service programs are consistent among AVL vendors. Information gathered fromparticipants showed the average system warranty to be 12 months with maintenanceprovided through service contracts arranged between the vendor and the transit agency.
8. The average number of systems any vendor has installed and is in the process ofinstallation was 8, with the highest number of installations being 15 and the lowest 5.Out of these systems the largest single installation of vehicles in any given systems was12,000 (taxi system in Singapore) and the smallest was 5 (Orlando, FL demo).
Methodology
The process of compiling information on various vendors required several steps. The firststep was to identify the possible vendors that are servicing or could service the transitindustry. This was done three ways, through industry publications, Federal Governmentdocuments, and through Internet search engines. Through industry publications, only ahandful of vendors was obtained. Federal documents, especially those gathered throughthe Federal Transit Administration, yielded a more detailed list of over 15 possiblecompanies. The Internet search yielded more vendors. The following information wasobtained from these searches and compiled into lists of possible AVL vendors.

Evaluation of the Benefits of Automated Vehicle Location Systems
55
APTS Co. Name Other Information
From PublicationsAVL-GPS Orbital Science Corporation - ITS 20301 Century Boulevard Germantown MDAVL-GPS Harris Corporation P.O. Box 5100 Melbourne FLAVL-GPS 3M Intelligent Transportation Systems 3M Center, Building 225-4N-14 St. Paul MNAVL-GPS Rockwell International Dept.120-130, 350 Collins Road NE Cedar Rapids IAAVL-GPS Transportation Management Solutions 800 International Drive, Suite 110 Linthicum MD
From Federal Transit AdministrationAVL-GPS Rockwell Int'l SunTran Tucson AZAVL-SO General Roadway Signal LAMTA Los Angeles CAAVL-GPS 3M Corp. The Vine Napa CAAVL-SO Motorola Muni San Francisco CAAVL-GPS UMA, Trimble Outreach San Jose CAAVL-GBR Teletrac (lease Co.) SMMBL Santa Monica CAAVL-GPS Traffic Management Solutions RTD Denver COAVL-GPS Harris Corp. SCAT Cocoa FLAVL-GPS Ericson MDTA Miami FLAVL-GPS Management Analysts Arc Transit Palatka FLAVL-SO Glenayre Municipality Louisville KYAVL-GPS Orbital Science Ride-On Montgomery MDAVL-GPS GMSI WSTA Winston-Salem NCAVL-SO F&M Global TRT Norfolk VAAVL-LC II Marrow STS Sheboygan WIAVL-SO Siemens LTC London ON
From Internet SearchAVL-GPS II Marrow Inc. 2345 Turner Road SE Salem ORAVL-GPS Ashtech 1170 Kifer Road Sunnyvale CAAVL-GPS Locsys Inc. 2016 East Broadway Boulevard Tucson AZAVL-GPS Orbital Science Corporation - ITS 20301 Century Boulevard Germantown MDAVL-GPS Glenayre Electronics, Inc. 5935 Carnegie Blvd. Charlotte NCAVL-GPS Harris Corporation P.O. Box 5100 Melbourne FLAVL-GBR TeletracAVL-GPS MotorolaAVL-GPS 3M Intelligent Transportation Systems 3M Center, Building 225-4N-14 St. Paul MNAVL-GPS Rockwell International Dept.120-130, 350 Collins Road NE Cedar Rapids IAAVL-GPS Pacific Arepco 3195B Airport Loop Drive Cosa Mesa CAAVL-GPS CES Wireless Technologies 925122 S. Semoran Boulevard Winter Park FLAVL-GPS Datalink Systems Inc. Vancouver B.C.AVL-GPS Matrixmedia-Unicom P.O. Box 3486 Winter Springs FLAVL-GPS AVL Information Systems Inc. 16135 Harper Avenue, Suite 210 Detroit MIAVL-GPS PacComm Packet Radio Systems, Inc. 4413 N. Hesperides Street Tampa FLAVL-GPS Thorcom Systems Limited Unit 4, 96B Blackpole Trading Estate
WestWorcester U.K.
AVL-GPS American Technologies Inc. 460 Cedar St. Fond du Lac WIAVL-DR Andrew Corporation 10500 W. 153rd Street Orland Park ILAVL-GPS International Road Dynamics Inc. 702-43rd Street East Saskatoon SKAVL-GPS Advanced Research Corporation 8195 Spire Ct. Colorado Springs COAVL-GPS Transportation Management Solutions 800 International Drive, Suite 110 Linthicum MDAVL-GPS Automatic Vehicle Location Systems
Ltd.6130 3rd street SE, Suite 500 Calgary Alber
taAVL-GPS Trimble Navigation Limited 675-J Tollgate Road Elgin ILAVL-GPS General Railway Signal Corp. P.O. Box 20600 Rochester NYAVL-GPS Position Inc. USA 16155 Park Row, Suite 190 Houston TXAVL-GPS Starlink, Incorporated 6400 Highway 290 East, Sutie 202 Austin TXAVL-GPS GMSI Inc. Schaumberg IL
AVL-GPS ElectroCom Communications Systems 2910 Avenue F Arlington TX

Evaluation of the Benefits of Automated Vehicle Location Systems
56
On these lists several companies appeared more than once. However, several othersappeared only on a single list such as many of the vendors obtained from the Internet. Atthis point, a decision was made to focus on companies that appeared in more than one listand to draw heavily from the list obtained through the FTA. In this way, informationwould be gathered from vendors that maintain a presence in the transit industry. Thisdecision allowed information gathered to be more relevant to the project. A final list ofthe vendors contacted appears below.
APTS Company
AVL-GPS 3M Corp.AVL-GPS EricsonAVL-GPS GMSIAVL-GPS Harris Corp.AVL-GPS Management
AnalystsAVL-GPS Orbital ScienceAVL-GPS Rockwell Int'lAVL-GPS Traffic
ManagementSolutions
AVL-GPS UMA, TrimbleAVL-LC II MarrowAVL-SO F&M GlobalAVL-SO General Roadway
SignalAVL-SO GlenayreAVL-SO MotorolaAVL-SO Siemens
After the final list was compiled, the focus of the project shifted to identifying informationabout individual vendors and the AVL industry as a whole. Information gathered lookedto answer basic questions such as: What industries do their products serve? How manysystems have they installed? Do they have any experience doing work for governmentagencies? Etc. Firms on the final list were contacted with a survey that focused oninformation about their products for transit agencies.
The survey used had four categories of questions. These categories were companyprofile, product profile, service profile, and installed systems profiles. Each areacategory had a specific purpose as outlined below.
COMPANY PROFILE

Evaluation of the Benefits of Automated Vehicle Location Systems
57
Survey questions in this area dealt with the company’s organization andbackground to give insight on where the company has been and its future.
PRODUCT PROFILEQuestions in this area highlight the products and services offered by the agency.Information is narrowed to AVL hardware, Communication Packages, andMapping or Display Systems.
SERVICE PROFILEIn this area the vendor will have the opportunity to explain how individualsystems are serviced after they are installed.
INSTALLED SYSTEMS PROFILEThe final area of the survey addressed the size and location of installed systems.Included in this area were questions on the feasibility or knowledge of anyregional AVL system in planning or operating.
A copy of the survey form used for this step of the project appears in the Appendix.
Results of the Survey
Since most of the vendors used in the survey were obtained through Federal documentsthere was a problem in locating a person to contact at each firm. This was due to the lackof a phone numbers and addresses in the original documents. It was also found thatsome companies have merged, been bought out, or no longer have the same address orphone number. Out of the initial 15 vendors that were picked for the survey 3 wherefound to no longer be in business or no longer offer AVL products. Other companieshave one primary salesperson that handles all questions and comments on their productswhich made it difficult to acquire information. Two other companies declined toparticipate in the survey. Out of those that remained the following information wasgenerated, results are presented here broken down into the categories used on the surveyform.
Company ProfileOf all the survey participants approximately 80% of them have been offering AVLproducts and systems to the transit industry for less than 10 years. However, severalof these same vendors have been offering vehicle-tracking technology to the USmilitary and commercial fleet sectors for the past two decades. In fact, one of thecurrent vendors that participated in the survey was responsible for helping the USmilitary deploy the first GPS constellation.

Evaluation of the Benefits of Automated Vehicle Location Systems
58
Product ProfileAVL Hardware:
The survey originally listed GPS, DGPS, Signpost, and Dead-reckoning as thedifferent AVL hardware systems that are on the market. From contacts made withthe vendors 80% of them offered GPS or DGPS systems, 40% offered Dead-reckoning (mostly as a backup to GPS systems), and 20% offered Signposttechnology. This may be surprising considering that GPS is the newest of theavailable technologies. Accuracy of these systems was also listed by vendors asbetween 100 to 300 meters for GPS systems and for DGPS 100 to 1 meter. Thisshows that among different vendors there is a difference in the products availableeven though they are using the same satellites.
Communication Packages:Of the participants in the survey, all expressed the ability to use the transitagency’s existing communication systems as a means for linking the vehicle withthe monitoring station. The most common communication system encounteredby the vendors is conventional radio.
Mapping and Location Display Systems:The number of vehicles that need to be tracked and a transit agency’s location willaffect an AVL vendor’s decision on what hardware and mapping systems that itwill provide. In situations where the number of vehicles is more than 500, manyvendors recommend an especially designed workstation over the personalcomputer (PC). This is due to the speed and memory restrictions of most PC’s.However, when the number of vehicles is less than 500 or as little as 100, a PC isthe most commonly used system. When a PC is used the most commonly usedoperating system is Windows NT, however, Windows 95 is also utilized. And inlarger urban areas AVL vendors will elect to purchase available digital maps froma supplier or inquire if that municipality has a Geographic Information System(GIS) file with a digital map that can be utilized. In areas where no digital mapsexists a vendor may choose to construct their own digital map through TIGERfiles obtained through the Census Department of the Federal Government.
Service ProfileSurvey participants listed a 12-month period as the standard AVL system warranty.If during that time the system should fail or not perform to expectations, the cost ofadjusting or fixing is still included in the original purchase price. The one-year is theindustry standard; however, service contracts, which a vendor negotiates with thetransit agency, vary greatly depending on the individual needs of the agency.
Installed Systems ProfileThe number of systems a company has installed and is in the process of installingwas not as many as would be expected. The average number of systems any vendorhas installed for transit agencies was 8. The largest number of AVL systems that any

Evaluation of the Benefits of Automated Vehicle Location Systems
59
vendor had installed was 15 and the lowest 5. However, when looking at the numberof vehicles that were outfitted with AVL technology in any given contract, the largestnumber appears to be 12,000 for a taxi system in Singapore and the smallest 5, whichwas a demonstration project done for Orlando Florida.
Conclusion
When evaluating the results of the AVL vendor survey one can see that there aresimilarities or emerging trends between different companies. With 80% of the vendorsoffering GPS and DGPS, the trend shows that this will likely become the preferred way totrack and monitor vehicles. The display units, which only a few years ago would havebeen all workstations due to the under-powered PC, are now PC’s, as their speed andprocessing power have increased. In addition, it will be more likely that vendors will alsoutilize existing digital maps as more municipalities generate city grids using GIS and asthe digital map vendors branch out from the large urban areas. In the coming years, themarket will continue to converge on similar products and methods for producing thesesystems which will lead to competition growing and lower prices. This will allow forfurther growth and better products.

Evaluation of the Benefits of Automated Vehicle Location Systems
60
Appendix C:Survey Forms

Evaluation of the Benefits of Automated Vehicle Location Systems
61
Manitowoc Transit System-On-board Survey
The purpose of this survey is to assess the impact of using improved technology in transit facilities to provide better service to the riders. By filling out thisform you are giving informed consent to be in this study. All information will be anonymous.
1. How often do you ride the bus?r More than 5 times a week. r 3-5 times a week. r1-2 times a week r 1-3 times a month. r Less than once a month
2. What is the purpose of your trip today? r Work r Shopping r School r Medical r Other
3. How do you get information about the bus service? (check all that apply)________I have a copy of the bus schedule________I call the bus company________From other people________From information displayed at the bus stop_______ Other__________________________
4. Do you use the bus schedule for planning your trip?r Yes r No r Sometimes
5. How long did you have to wait for the bus today?r Less than 5 min r 5-10 min r 10- 15 min r More than15 min
6. Is the schedule information displayed on-board the bus adequate?r Yes r No
7. How would better information about when the bus actually arrives at the stop affect your use of transit?rRide more r Ride less r Ride the same
8. Please rate how important the following are in your decision to ride the bus.
VeryImportant
SomewhatImportant
Neutral SomewhatUnimportant
VeryUnimportant
To have information at the bus stop on when the bus willactually arrive
r r r r r
Bus arrives at the scheduled time r r r r rKnowing how late the bus is in case of a delay r r r r rDisplaying the next stop inside the bus r r r r rHaving the driver call out the stops r r r r rKnowing the bus is equipped with a 911 emergency system r r r r rKnowing that another bus can be immediately dispatched ifthere is a breakdown
r r r r r
Knowing the transit system uses the latest vehicle locationtechnology
r r r r r
Having a seat available at all times r r r r rLow bus fares r r r r r
9. Did you have a car available that you could have used for the trip you are making today? r Yes r No
10. Are you a: r Male r Female
11. What is your age group:r Under 18 r 18-25 r 26-45 r 46-65 r Over 65
12. Please use the back of this page to let us know if you have any additional suggestions or information youthink will be helpful in providing better bus service.

Evaluation of the Benefits of Automated Vehicle Location Systems
62
Page 1 of the Vendor Survey
Page 2 of the Vendor Survey

Evaluation of the Benefits of Automated Vehicle Location Systems
63