Center for Economic Institutions Working Paper …cei.ier.hit-u.ac.jp/Japanese/wp2018-1.pdfCEI...
36
No. 2018-1 “Institutions and Determinants of Firm Survival in European Emerging Markets” Eduard Baumöhl, Ichiro Iwasaki, and Evžen Kočenda April, 2018 Center for Economic Institutions Working Paper Series Center for Economic Institutions Working Paper Series Institute of Economic Research Hitotsubashi University 2-1 Naka, Kunitachi, Tokyo, 186-8603 JAPAN http://cei.ier.hit-u.ac.jp/English/index.html Tel:+81-42-580-8405/Fax:+81-42-580-8333
Transcript of Center for Economic Institutions Working Paper …cei.ier.hit-u.ac.jp/Japanese/wp2018-1.pdfCEI...

No. 2018-1
“Institutions and Determinants of Firm Survival in European Emerging Markets”
Eduard Baumöhl, Ichiro Iwasaki, and Evžen Kočenda
April, 2018
Center for Economic Institutions
Working Paper Series
Center for Economic Institutions
Working Paper Series
Institute of Economic Research
Hitotsubashi University 2-1 Naka, Kunitachi, Tokyo, 186-8603 JAPAN
http://cei.ier.hit-u.ac.jp/English/index.html Tel:+81-42-580-8405/Fax:+81-42-580-8333

CEI Working Paper Series No. 2018-1 April 2018
Institutions and Determinants of Firm Survival in European Emerging Markets †
Eduard Baumöhla, Ichiro Iwasakib, and Evžen Kočendac
a Institute of Economics and Management, University of Economics in Bratislava, Dolnozemská
cesta 1, 852 35 Bratislava, Slovakia; E-mail: [email protected] b Institute of Economic Research, Hitotsubashi University, Naka 2-1, Kunitachi, Tokyo 186-8603,
Japan; E-mail: [email protected] c Institute of Economic Studies, Charles University, Opletalova 26, 110 00, Prague, Czech
Republic. ÚTIA, Prague; CESifo, Munich; IOS, Regensburg; E-mail: [email protected]
Abstract: We analyze the impact of institutional quality on firm survival in 15 Central and Eastern European (CEE) countries. We employ the Cox proportional hazards model with a large dataset of firms from 2006–2015 and control for firm-specific determinants and country differences. Our results show that institutional quality (IQ) is a significant preventive factor for firm survival, and the result is robust to different measures of IQ and industry sectors. Furthermore, we document the existence of diminishing productivity of IQ, as the economic effect upon institutions is largest for low-level IQ countries and smallest for high-level IQ countries. In terms of firm-specific controls, ownership structure plays a vital role in strengthening the probability of firm survival. Notably, foreign ownership helps firms survive in all three country groups, and the effect is again larger for countries with low- and mid-level IQs. ROA, profit margin, solvency ratio, and firm age represent additional significant preventive factors, albeit with smaller economic effects.
Keywords: firm survival; CEE countries; survival and exit determinants; hazards model
JEL Classification: D22, G01, G33, G34, P34
† This work was supported by the Slovak Research and Development Agency, grant no. APVV-
17-0155. Iwasaki acknowledges financial support from the Japan Securities Scholarship
Foundation (JSSF), the Nomura Foundation, and the Mitsubishi Foundation, and research
assistance by Eriko Yoshida and editorial assistance by Tammy Bicket. The usual disclaimer
applies.

1
1. Introduction
The quality of institutions has been empirically shown to affect economic growth (Hall
and Jones, 1999; Acemoglu et al., 2001; Eicher and García-Peñalosa, 2006; Hasan et al.,
2009). On a corporate level, institutions were identified as impacting firm performance
(Porter, 1998; Yasar et al., 2011; Faruq and Weidner, 2018; Ghoul et al., 2017). Despite
the above evidence, the role of institutions has, thus far, largely been neglected with
respect to firm survival (Che et al., 2017). What is the potential channel of such an effect?
Égert (2016) shows that the quality of institutions positively affects firm productivity, and
Dosi et al. (2017) demonstrates that productivity plays an important role in a firm’s ability
to survive.1 Furthermore, the link between institutions and firm survival might be even
more important for firms in emerging markets or developing countries where the
institutional quality is lower than in developed economies (Acemoglu et al., 2005).
In this paper, we aim to bridge the gap in the empirical research in two ways. First,
we contribute to the literature by analyzing how institutional quality impacts on firms’
survival chances while controlling for standard firm characteristics. Second, we analyze
firm survival in an under-researched region of European emerging markets, where the
importance of institutional quality represents an important issue (Fan et al., 2011).
We chose the emerging European markets because their firms represent an ideal
basis for empirical assessment. The economic reforms of the 1990s in Central and Eastern
Europe (CEE) were aimed at creating competitive market economies and more efficient
enterprises by firm restructuring, privatization, and reform of supporting institutions
(Aussenegg and Jelic, 2007; Kočenda and Hanousek, 2012). Large numbers of new firms
were entering the market at that time, and while firms’ entry might be quite easy, their
survival in the market was often difficult (McDermott, 2004). This fact is particularly
important for firms from the new member states of the EU that first had to go through an
uneasy transformation process before their EU accession (Estrin et al., 2009) and almost
immediately had to cope with the global financial crisis (GFC) that, in general, negatively
affected their performance (Hanousek et al., 2015).
1 New firms tend to be less productive than incumbent firms. A new firm remains in a less
competitive position unless it is able to raise its productivity fast enough to either catch up or
exceed that of incumbent firms.

2
In our analysis, we adopted the following research strategy. First, in order to analyze
the impact of institutions with the Cox proportional model, we select several
characteristics of institutional quality in each country under research. It is argued that the
level of legal protection of private property represents a key aspect of institutional quality
(North, 1990; Acemoglu et al., 2001; Besley and Ghatak, 2009). Hence, we use the Rule
of Law index as a representative proxy. Institutional quality cannot be fully captured by
a single characteristic, though. For that reason, we also perform our analysis with
individual alternative measures to capture the extent of corruption control, banking and
enterprise reforms, plus levels of democracy, national governance, and civil society. We
are aware that our sample of 15 CEE countries exhibits some heterogeneity in economic,
social, and political characteristics. For that reason, we performed a principal component
analysis and used it to create a comprehensive institutional quality index formed from our
measures of institutional quality. This step has two advantages: (i) we can analyze the
aggregate impact of institutions without omitting any particular institutional variable, and
(ii) with the various measures listed above, we are able to control for cross-country
differences in country characteristics.
Second, D'Souza et al. (2005) showed that institutional factors are quite significant
with respect to firm performance in developing countries; however, Goddard et al. (2009)
argued that firm-specific factors are most important in explaining variations in firm
performance. This empirical evidence is the basis for our parallel study of firm survival.
Despite the fact that in our analysis we accentuate the impact of institutions on firm
survival, we must control for firm-specific as well as industry-level factors. We employ
a number of representative controls to account for legal, ownership, governance,
performance, financial, and other aspects of firms to effectively account for the impact of
firm-specific characteristics on firm survival.
Due to the general lack of analysis linking institutions with firm survival, we have
formulated our key hypotheses as an analogy to firm performance literature; we are aware
of only one exception—an expertly conducted analysis of the impact of institutions on
the survival of Chinese firms by Che et al. (2017). Since the quality of institutions is
positively linked with productivity, which enhances firms’ ability to survive, we expect
that better institutions should enhance firms’ survival chances. Furthermore, based on the
fundamental principle of decreasing marginal productivity, we also hypothesize that in
3
countries with high institutional quality levels, the contribution of institutions to firm
survival should be lower than in countries with institutions of lower quality. We have also
formulated additional hypotheses related to firm-specific control variables in Section 2.
Our paper contributes to the existing literature on firm survival by utilizing an
extensive database of 79,591 companies with their firm-level characteristics from 15
countries of Central and Eastern Europe (CEE). As a key issue, we have assessed the
effect of institutions, proxied by a number of relevant variables that reflect the quality of
institutions in the CEE region. Apart from the baseline estimation of the Cox proportional
hazards model, we also have re-estimated our model on different country groups and
different industries. The main results show that institutional quality is an important factor
positively affecting firm survival and that institutions exhibit decreasing marginal returns.
Furthermore, we show that ownership concentration and corporate governance are key
economically significant factors that increase the probability of firm survival. These
results are robust across country groups and industries.
The remainder of the paper is organized as follows. In Section 2, we review relevant
literature and formulate testable hypotheses. Section 3 describes the data and applied
methodology. In Section 4, we bring forth extensive and detailed results. Section 5 is the
conclusion.
2. Hypotheses and related research
In Section 2, we perform two tasks. We review literature relevant to our analysis and, on
its basis, we formulate the hypotheses that we will test later.
2.1 Institutions
The idea of a country’s institutional quality affecting the local business environment,
competition, and firm profitability—and as a direct consequence firm bankruptcy—is
certainly not new. In one of his classical works, Porter (1998, p. 80) states: “Businesses
cannot operate efficiently under onerous regulatory red tape or under a court system that
fails to resolve disputes quickly and fairly.” Obviously, some aspects of the business
environment (for example, the legal system) affect all industries. A closely related topic
is corruption, which is widely believed to prevent poor countries from catching up with

4
developed countries (De la Croix and Delavallade, 2009). Economic freedom in general
is a significant factor determining overall economic growth (Gwartney et al., 1999).
In terms of firms, Égert (2016) shows that the quality of institutions positively
affects firm productivity in OECD countries. When new firms enter a market, they tend
to be less productive than incumbent firms. A new firm remains in a less competitive
position unless it is able to raise its productivity fast enough to either catch up with or
exceed that of incumbent firms. Using the U.S. data, Dosi et al. (2017) demonstrates that
productivity plays an even more important role than profitability in a firm’s ability to
survive. The potential link between institutions and firm survival can be supplemented
further by empirical evidence relevant specifically to the CEE countries being researched.
Hanousek and Kočenda (2014) show that geographical, cultural, and institutional factors
affect trade in primary goods, parts and components, capital goods, and consumer goods
between ten new EU members and old EU countries. Since their analysis was conducted
on disaggregated data, the impact of institutional factors on firm performance,
represented by their bilateral international trade, might be considered as potentially
impacting their ability to survive in the market as well. A similar analogy can be drawn
from the empirical evidence presented by Kafouros and Aliyev (2016), who showed that
domestic firms in 16 CEE economies benefit from improvements in institutional
environments.
The above evidence forms the basis for our assessment of the quality of institutions
as a determinant of firm survival. We will employ several comprehensive indices that
capture various aspects of what we refer to as the “quality of institutions” (although we
use this term in a broader sense). Our main research hypothesis is:
H1: The quality of institutions does not have a positive impact on firm survival.
Institutional quality is usually measured through some complex index. As no index
captures all aspects of the quality of institutions, we utilized quite a wide range of
institutional variables to control for legal system, democracy, national governance,
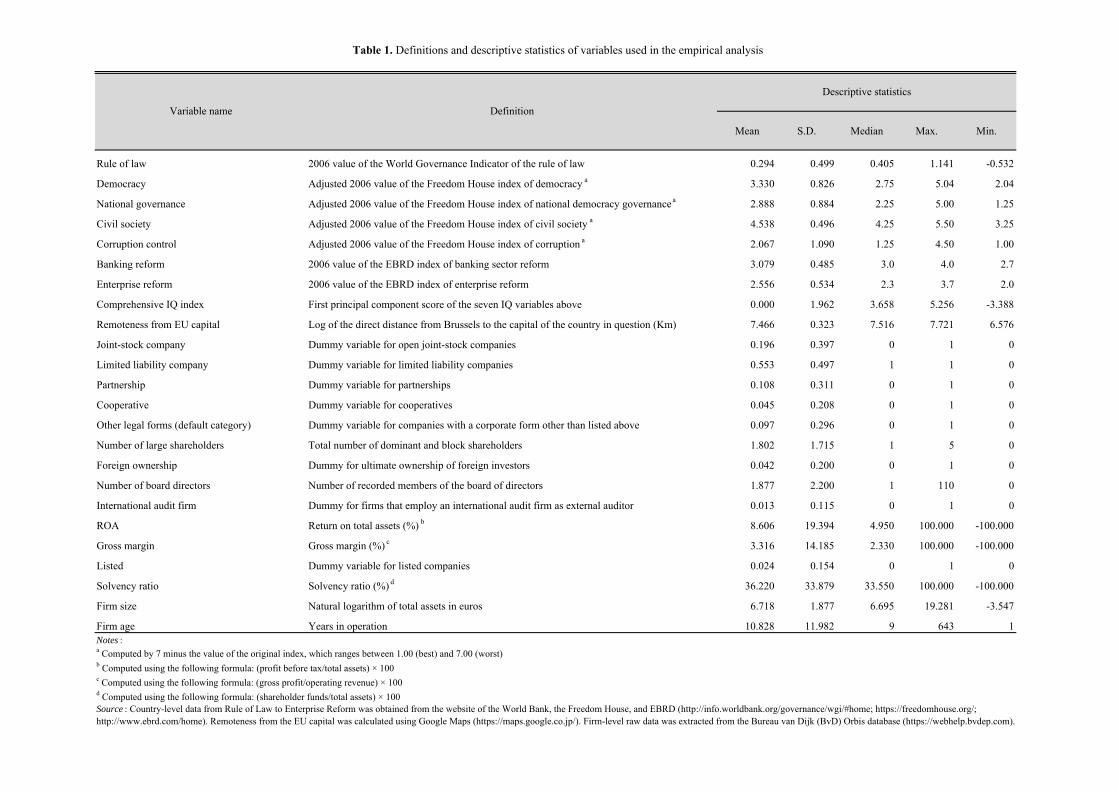
corruption, or banking and enterprise reforms. Table 1 contains definitions and
descriptive statistics of the variables used in our empirical analysis.

5
Institutions are the rules of the game in a society that induce economic growth
(North, 1990); as such, the quality of institutions is different in specific countries, and its
impact on firm survival might differ as well. Acemoglu et al. (2015) also argued that
institutions play a vital role in explaining differences in economic growth among
countries. Hence, we also focus on a possible unequal effect of institutional quality on
firm survival in different countries based on differences in the existing levels of their
institutional quality, which is a pressing issue in emerging markets (Fan et al., 2011).
Thus, our second hypothesis is:
H2: The effect of institutions on firm survival does not change with the existing level
of institutional quality.
2.2 Firm-specific factors
In Table 1, we further listed our firm-specific controls. We can see from Table 1 that the
limited liability company is the most numerous type of firm in our sample, followed by
the joint-stock company. Other corporate legal forms we examine in our sample—
partnerships, cooperatives, and other corporate legal forms—are less frequent and are
grouped into one category. A firm’s corporate legal form is quite likely to play a
significant role in its survival, as confirmed by Harhoff et al. (1998), who found that
German firms with limited liability have (as opposed to their counterparts with full
liability) higher growth but also higher insolvency rates. Hence, out fourth hypothesis is:
H3: Various corporate legal forms do not have different impacts on firm survival.
Apart from institutional quality and corporate legal form, we are interested in firms’
ownership structure and corporate governance, which are both often neglected in survival
literature. Several studies have addressed the impact of ownership concentration on firm
performance; however, as shown in a meta-analysis of 42 studies (Wang and Shailer,
2015), in emerging markets, the literature presents conflicting and inconclusive empirical
results. In fact, there are two theoretical hypotheses that explain both a positive
relationship between large shareholders and firm failure (the alignment hypothesis; see
Shleifer and Vishny, 1986) and negative relationship between large shareholders and firm

6
failure (the expropriation hypothesis; see Claessens et al., 2000). Taking this ambiguity
into account, our fourth hypothesis is:
H4: Ownership concentration does not positively influence firm survival.
Within the ownership structure, we also introduce the variable of foreign ownership.
After the transition from centrally planning to market orientation, in economies such as
those in our sample, we expect foreign ownership to increase the probability of firm
survival. Since the 1980s, literature on industrial organization concentrated on how
foreign direct investments affect market dynamics. Generally speaking, two outcomes are
possible: (i) foreign ownership increases overall sector efficiency, causing less efficient
domestic firms to exit, or (ii) a spillover effect transmits higher productivity to domestic
firms, allowing them to survive even with increased competition (Franco and Gelübcke,
2015). Again, empirical findings are not that persuasive. For example, Taymaz and Özler
(2007) found that foreign ownership does not significantly impact the survival of
domestic firms. However, after the recent global financial crisis, Alfaro and Chen (2012)
showed that foreign firms had better survival chances than their local counterfactuals with
similar economic characteristics. However, this result does not hold in non-crisis periods.
Thus, in our fifth hypothesis, we link the foreign ownership to firm survival as:
H5: Foreign ownership does not increase the probability of firm survival.
Within the category of corporate governance, we will consider two main factors:
the number of board directors and employment of an international audit firm. The
composition of boards of directors has been studied extensively, since the agency theory
explains why the separation of ownership and control can be an efficient form of
economic organization (e.g., Fama, 1980). Early on, the literature did not offer full
consensus about the relationship of the number of board directors and firm performance.
Daily and Dalton (1994) confirmed that there are differences in proportions of affiliated
directors between the bankrupted and non-bankrupted firms. The extensive meta-analysis
of Dalton et al. (1999) also showed evidence for a positive relationship between board
size and performance. However, later empirical findings tell us a different story. Results

7
of Boone et al. (2007) indicate that board size varies across firms and has a changing
nature over time due to specific characteristics of individual firms. Coles et al. (2008)
challenged the idea that one board size could possibly fit all firms. For example, small
and large firms have dramatically different board structures (Linck et al., 2008). Therefore,
our sixth hypothesis to verify is:
H6: The number of board directors does not positively impact firm survival.
The body of research on audit quality and its impact on firm performance increased
significantly after the Enron–Andersen affair. Some indication that audit quality may
have declined in the 1990s was provided by Francis (2004). After the financial crisis,
Aldamen et al. (2012) found in a sample of US listed firms that a smaller (more
experienced) audit committee is more likely to be positively associated with firm
performance. Recent findings of Bajra and Čadež (2018) suggested that the formal
existence of an audit committee in large EU listed firms is a necessary, but not a sufficient
condition for enhancing the quality of financial reporting. As noted by Fan et al. (2011,
p. 207), “there are important organizational and behavioral differences between firms in
emerging markets and those in developed ones.” As such, what holds true for large firms
from developed markets (US, EU) might not necessarily be true for CEE countries.
Sucher and Kosmala-MacLullich (2004) raised a concern about the nature of auditors’
independence in transitional economies. Baumöhl et al. (2017) found that for firms
operating in the Czech Republic, Poland, and Slovakia, employing an international audit
firm is associated with lower probability of firm survival. Our seventh hypothesis is:
H7: Employing an international audit firm does not impact firm survival.
Most research in bankruptcy and firm survival literature focuses on financial
aspects and variables of businesses (Kumar and Ravi, 2007). Although we are deviating
from the mainstream literature by employing a wider set of possible firm survival
determinants, we also add categories of control variables: firm performance, linkage with
capital market, and firm size and age. Financial performance, or financial variables in
general, is obviously among the most prominent determinants of firm survival and, thus,

8
should be present in any empirical work within this area of research (Görg and Spaliara,
2014). The ability to access external funds should also have a positive impact on firm
growth and survival (Musso and Schiavo, 2008). Even though stock markets in CEE
countries have various specific characteristics (as emerging markets), solvency as a ratio
of share shareholders’ funds to total assets should be positively associated with firm
survival (as recently found by, e.g., Guariglia et al., 2016). The recent financial crisis
influenced listed and bond-issuing firms roughly by reducing their capital (Iwasaki, 2014),
and, as found by Guariglia et al. (2016), during and after the crisis, chances of survival
for bank-dependent, younger, and non-exporting firms are most affected by changes in
the interest burden. Our eighth hypothesis is:
H8: Neither firm performance nor linkage with a capital market is positively
associated with firm survival.
The last two variables included in our models are firm size and age. The large body
of empirical literature challenged Gibrat’s Law (Gibrat, 1931), which assumed that firm
growth is independent of its size. Geroski (1995) found that both firm size and age are
positively related to firm survival, convincingly refuting Gibrat’s Law. This is something
we may refer to as a “stylized result.” However, Agarwal and Audretsch (2001) showed
that this contradicts the theory of strategic niches proposed by Porter (1979). They
suggested that both views are actually correct, but firm survival depends on industry life
cycle and its technology intensity. Therefore, even smaller firms could remain small and
take advantage of their size in the mature phase of the life cycle and in high-tech industries.
Results of Agarwal and Gort (2002) also indicated that small firms are positively related
to hazard rates, as opposed to firm age. Our ninth hypothesis is formulated as:
H9: Firm size and age do not positively impact firm survival.
Our review of the related literature is far from exhausted. 2 One of our main
conclusions is that conflicting results are common in governance literature, as well as in
2 For further reading, please see relevant reviews, such as Santarelli and Vivarelli, 2007; and
Manjón-Antolín and Arauzo-Carod, 2008.

9
literature on firm survival and bankruptcy. In our analysis, we aimed to present results
relevant to firms in emerging markets and to eliminate some discrepancies by our
comprehensive assessment.
3. Data and methodology
3.1 Data coverage
Our dataset comprises 79,591 companies from 15 countries in the Central and Eastern
Europe (CEE), namely those from: (a) Central EU countries (36,743 obs.)—the Czech
Republic, Hungary, Poland, and Slovakia; (b) Baltic countries (8,804 obs.)—Estonia,
Latvia, and Lithuania; and (c) Balkan countries (34,044 obs.)—Bosnia, Bulgaria, Croatia,
Macedonia, Moldova, Montenegro, Romania, and Serbia.
The entire set of company-specific variables that can be considered firm survival
determinants is extracted from the Bureau van Dijk’s Orbis database. Companies included
in our dataset had to satisfy two conditions: (i) they were in business at the end of 2006
(i.e., before the global financial crisis), and (ii) they provided information about their
survival status at the end of 2015. We consider failed firms to be those with the explicit
status of dormant/inactive, in liquidation/bankruptcy, and/or dissolved. We do not
consider firms in the category of mergers/acquisitions as having failed.
We further compile a set of several indices that capture well various aspects of the
institutional environment and institutional quality (IQ). The Rule of Law Index (RofL)
published within the Worldwide Governance Indicators of the World Bank database
captures perceptions of the extent to which agents have confidence in and abide by the
rules of society and, in particular, the quality of contract enforcement, property rights, the
police, and the courts, as well as the likelihood of crime and violence
(info.worldbank.org). The RofL index provides a country's score on a scale of -2.5 to 2.5
and is commonly used to capture the degree of institutional quality across countries
(Kočenda and Poghosyan, 2018).
We also use four indices obtained from Freedom House (freedomhouse.org):
democracy (Freedom House index of democracy), national governance (Freedom House
index of national democracy governance), civil society (Freedom House index of civil
society), and corruption control (Freedom House index of corruption). All indices are
based on ratings on a scale of 1 to 7, with 1 representing the highest and 7 the lowest level

10
of democratic progress. The ratings follow a quarter-point scale and are assessed by the
report authors, a panel of academic advisors, and a group of regional expert reviewers.
As such, these ratings (more or less) indicate how democratic or authoritarian a country
is.
Finally, we employ two additional indices from the European Bank for
Reconstruction and Development (EBRD): banking reform (EBRD index of banking
sector reform), and enterprise reform (EBRD index of enterprise reform). Both indices
are published as transition indicators on a scale of 1 to 4+, based on the judgment of the
EBRD’s Office of the Chief Economist about country-specific progress during transition.
Due to potential multicollinearity problems, we estimate our models with each IQ
variable separately. However, we also include in our estimation a first principal
component extracted from seven individual IQ variables. We call this synthetic IQ
variable a “Comprehensive IQ index.” Additional details and descriptive statistics are
presented in Table 1.
3.2 Cox proportional hazards model
To estimate the effects of our variables (in Table 1) on firm survival, we utilized the Cox
proportional hazards model (Cox, 1972). It is the most commonly used model in empirical
firm survival literature (Manjón-Antolín and Arauzo-Carod, 2008) and allows for an easy
comparison of our results to those in other studies.
The Cox proportional hazards model assumes that the hazard denoting the
probability of an event (firm exiting the market) h0(t) depends on time t and a set of
relevant covariates xin:
,
(1)
where β1, β2,…, and βn are the parameters to be estimated. Specification (1) defines the
hazard rate at time t for subject i, which depends on a vector of covariates x. Considering
two observations, i and i , that differ in their covariates (values of xi), with the following
linear representation:
0,expexp,,| 0T
0221101 ththxxxthxxth inniiini βx

11
(2)
and
,
(3)
then the so-called hazard ratios for these two observations are defined as (note that
they are independent of time t):
.
(4)
Estimates of parameters β are obtained from the maximum likelihood estimation of
the logarithmic transformation of specification (1), which is represented by the following
linear model:
1 01
ln | , , lnn
i in j ij jj
h t x x h t b x
K .
(5)
In our results, we will present each parameter β in the form of a hazard ratio, due to
its straightforward interpretation—a hazard ratio indicates how the probability of a firm
exiting the market is multiplied when a specific covariate x (e.g., a firm survival
determinant in a form of an independent variable) changes by one unit. If an estimate is
over 1, we may consider a determinant (covariate x) to be a risk factor, increasing the
probability of firm exit. Similarly, if an estimate is below 1, such a determinant (covariate)
is considered to be a preventive factor inhibiting a firm’s exit from the market.
Statistically significant estimates below 1 are economically more (less) significant
preventive factors if they are further from (closer to) 1, respectively. Our estimation
strategy follows examples of approaches adopted by Esteve-Pérez et al. (2004), Taymaz
and Özler (2007), and Iwasaki (2014).
Finally, we are aware of the fact that an endogeneity issue may arise in the survival
analysis under certain conditions if: (i) an independent variable is a future variable, (ii)
inniii xxx 2211
inniii xxx 2211
i
i
i
i
i
i
th
th
th
th
exp
exp
exp
exp
0
0

12
the estimation period is very short, or (iii) the dependent variable is continuous (Liu,
2012). Under these circumstances, an instrumental variable (IV) method or a two-stage
residual inclusion method (2SRI) should be applied (Liu, 2012; Carlin and Solid, 2014).
However, as we showed earlier in this section, all independent variables in our analysis
are predetermined, which rules out the endogeneity problem arising from simultaneity
between dependent and independent variables (Iwasaki, 2014). Furthermore, the
estimation period of 9 years is sufficiently long, and the dependent variable observed on
a yearly basis is, thus, a discretional variable. On the basis of the above arguments that
follow those of Liu (2012), we conclude that our survival analysis is not plagued by
endogeneity.
4. Results
The number of failed firms during the analyzed period is captured in Figure 1. We can
see the evolution of exit rates and Nelson-Aalen estimates of the cumulative hazard
functions are distinct in different country groups, as well as in different industries. This
motivates us to re-estimate our baseline model for country groups and industries
separately, in Section 4.3 and 4.4, respectively. Figure A.1 in Appendix shows Kaplan-
Meier survival functions of the firm survival probability for each variable studied. This
gives a better perspective as to which variables should affect firm survival significantly,
both from statistical and economic perspectives. For example, survival rates of firms in
countries with lower levels of rule of law decrease as firms become older (Figure A.1; d).
A remarkable difference is visible with respect to the survival chances of firms with more
large shareholders, which are significantly better than those with fewer large shareholders
(Figure A.1; f); the difference is striking after the second year. All in all, a visual
inspection of Figure A.1 provides a first and basic outlook on possibly significant
preventive and risk factors.
4.1 Baseline estimation
Our baseline estimation of the Cox proportional hazards model is presented in Table 2.
Institutional quality is our key independent variable and a covariate in the Cox
proportional hazards model. Since the level of legal protection of private property
represents a key aspect of institutional quality (North, 1990; Acemoglu et al., 2001;

13
Besley and Ghatak, 2009), we use the Rule of Law Index as our main reference variable.
The results are presented for a full dataset, i.e., all countries and all industries, and indicate
that institutional quality as represented by the Rule of Law is an economically significant
preventive factor for firm survival, as the estimated hazard ratio is 0.83 (e.g., the distance
from the threshold of 1 is non-marginal).
All other variables are statistically significant as well, but their economic impact
varies. The corporate legal form of a company appears to be the most economically
significant preventive factor, especially limited liability, partnership, and cooperative
forms. This finding is in line with previous research (e.g., Esteve-Pérez and Mañez-
Castillejo, 2008).
As for ownership structure and corporate governance, many and foreign
shareholders decrease the probability of firm failure quite significantly (0.90 and 0.60,
respectively), and the same applies to larger boards of directors. However, here the effect
is not that straightforward, as the squared term of the number of board directors is slightly
over 1. The relationship between this variable and probability of firm survival appears to
have an inverted U-shaped pattern: i.e., the probability of exit for firms with larger boards
is low, but it increases to reach a peak and eventually prompts an increase in the
probability of failure as the board grows larger.
Surprisingly, employing an international audit firm appears to be a risk factor for
firms operating in the CEE region. Based on the research of Sucher and Kosmala-
MacLullich (2004), which raised a concern about the nature of auditors’ independence in
transitional economies, such a finding is, perhaps, not that surprising at all. Apart from
the prevailing socioeconomic and cultural background over professional integrity and
competence, there is an alternative explanation provided by Baumöhl et al. (2017), who
found the same results for firms operating in the Czech Republic, Poland, and Slovakia
where the international auditors’ market in the region is practically monopolized by Big
Four auditing firms (Deloitte, Ernst & Young, KPMG, PricewaterhouseCoopers). The
Big Four provides auditing services mostly to large and medium-sized firms. Because of
several past auditing scandals, these international auditors might be more cautious in
issuing “no objection” statements. This approach could put more pressure on audited
firms that might not be in the best shape in the first place. On the other hand, the Big Four

14
auditors do not necessarily provide higher quality audits, as these depend to a large extent
on client characteristics (Lawrence et al., 2011).
Another statistically and economically (with a hazard ratio of 1.44) significant risk
factor is whether the firm is listed on a stock exchange. It is worth mentioning that
emerging stock markets in the CEE region have several peculiarities. After the transition
process from centrally planned to market-oriented economies, national stock exchanges
ended up with a large number of listed firms (as a result of mass privatization). These
firms, however, are not necessarily the most efficient and profitable ones. Moreover, as
Iwasaki (2014) noted, the recent global financial crisis caused severe damage to listed
and bond-issuing companies through a significant capital crunch and/or unrealized losses
on assets.
The last quite surprising result is the firm size, which, again, is a risk factor for firm
survival, although with a negligible economical effect (a hazard ratio only slightly over
the threshold of 1). Firm size is usually considered to be a preventive factor (e.g., Geroski,
1995, 2010), which intuitively is straightforward, as it is expected that larger firms have
lower hazard rates of exiting than smaller firms. Nevertheless, markets in the CEE region
are still quite distinct from those of developed countries; thus, obtained results are just
confirming such specifics. Our finding is indirectly supported by Hanousek et al. (2015),
who found that larger EU firms can be associated with less efficiency in general.
All remaining variables (ROA, profit margin, solvency ratio, and firm age) have an
expected effect, even though from the perspective of economic significance, their impact
on firm survival is rather low. Estimated hazard ratios are very close to 1.
4.2 Effect of different measures of institutional quality
As all institutional quality (IQ) variables are highly correlated, we estimated the same
baseline model with each IQ variable separately. The set of all control variables is always
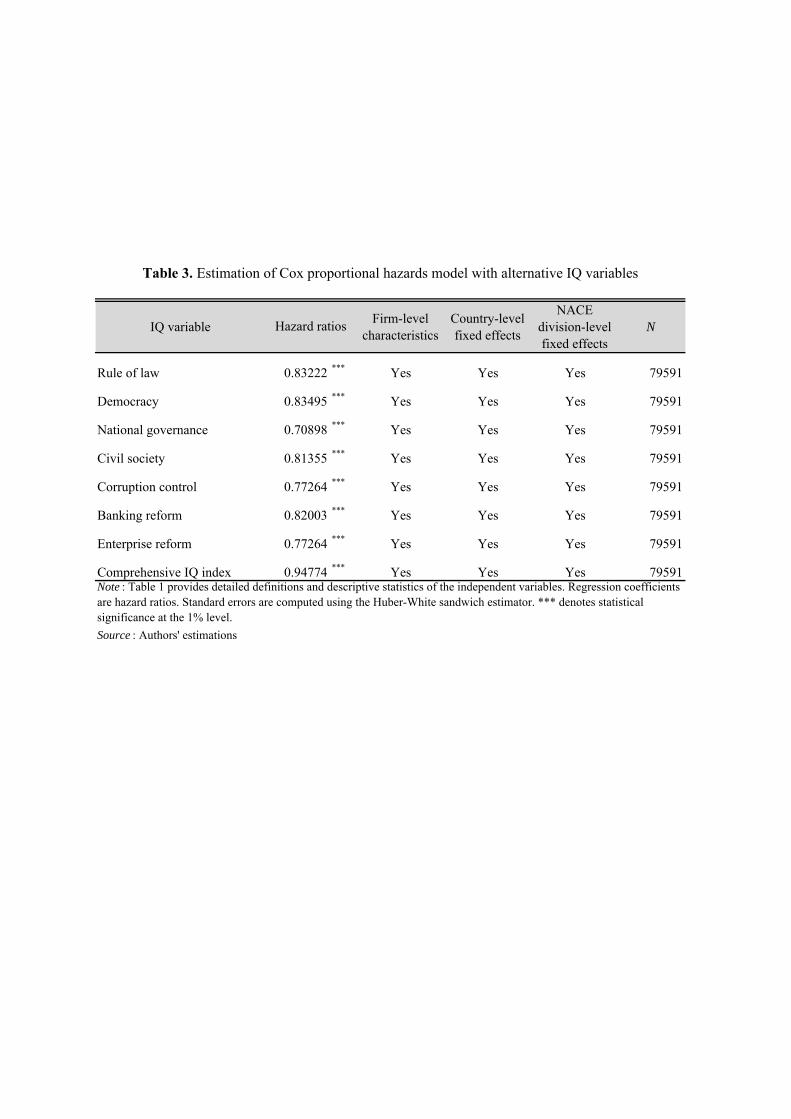
included as well. In Table 3, we present the estimated hazard ratios for individual IQ
variables; all of them are less than 1 and statistically significant. We do not present
estimates for other control variables, as their hazard ratios are practically identical, no
matter what IQ variable is used. Thus, we can say that our results are consistent across
different IQ variables, and, at the same time, the inclusion of a country-level IQ variable
does not affect estimates of firm-level variables.

15
All alternative measures of institutions can be considered as preventive factors,
lowering the probability of a firm’s exit. The three institutional quality variables with the
strongest positive impact on firm survival are national governance, corruption control,
and enterprise reform. Democracy, civil society, and banking reform are somewhat less
economically significant.
In order to gauge the aggregate effect of institutions on firm survival, we construct
a comprehensive IQ index from all seven IQ variables. First, we perform a principle
component analysis to capture the potential structure behind institutional quality. Its
results are presented in Table A.1. All IQ variables exhibit similar eigenvector values.
Furthermore, the results of the principal component analysis show that the first
component alone explains more than 92 percent of all variance among the seven IQ
variables. Hence, we can confidently say that the first component is a suitable proxy for
the aggregate IQ level in countries under research.
We estimate our baseline model with the comprehensive IQ variable, along with all
firm-level controls, and present the result in Table 3. The estimated hazard ratio
associated with the comprehensive IQ variable is 0.948, which means that the aggregate
effect of institutions decisively helps to lower a firm’s exit probability. This aggregate
result is in line with a general argument that institutional quality is mirrored in the level
of legal protection of private property (North, 1990; Acemoglu et al., 2001; Besley and
Ghatak, 2009) as well as with a specific result of Che et al. (2017), who show a positive
effect of property right protection on firm survival in China.
4.3 Differences in institutional quality and firm survival
The group of 15 CEE countries in our sample exhibits some degree of heterogeneity in
terms of their economic and political development. The differences among countries also
apply to the institutional environment. In Table A.2, we present the values of employed
IQ variables that illustrate the institutional quality differences among countries. These
differences are summarized by the values of the comprehensive IQ index introduced in
Section 4.2.
Based on the comprehensive IQ index, we divided 15 CEE countries into three
country groups according to their comprehensive IQ index levels. The three groups
distinguish countries (alphabetically) with high (Czech Republic, Estonia, Hungary,

16
Latvia, Slovakia), mid-level (Bulgaria, Croatia, Lithuania, Poland, Romania), and low
institutional quality (Bosnia, Macedonia, Moldova, Montenegro, Serbia). Grouping of the
countries based on the institutional quality indirectly accounts for potential differences in
internal factors (tax system etc.) among countries as countries with similar level of
institutional quality are expected to exhibit similar level of development of various
internal factors. We then re-estimate the Cox model for each country group and present
our results in Table 4. Again, we see that the quality of the institutional environment is a
factor that is associated with improving a firm’s chances of survival. Hence, evidence
presented in Tables 2, 3, and 4 enables us to reject our key hypothesis H1, as the
institutions are shown to be a contributing factor to firm survival.
We can go even further in our inferences. Based on the values of the coefficients
associated with the comprehensive IQ indicator, it is evident that the economic
significance of institutions is highest in countries with low quality of institutions. On the
contrary, countries with high institutional quality exhibit the smallest effect economically.
Thus, estimation results indicate the presence of diminishing returns from improvement
in country-level IQ. As the effect of institutions on firm survival visibly changes with the
level of institutional quality, we are able to reject our hypothesis H2. In countries with a
low IQ, a marginal increase in IQ has a strong impact on firm survival. In countries with
a high IQ, a marginal increase in IQ causes a much smaller effect. In other words, the
effort to refine institutions brings more fruit to developing economies than developed
ones.
Finally, when we compare the results presented in Tables 2 and 4, the effect of firm-
specific control variables remains, in principle, the same. Ownership structure plays a
vital role in strengthening the probability of firm survival; especially foreign ownership
helps firms to survive significantly in all three country groups, although the effect is larger
for low and middle IQ countries. Other statistically significant preventive factors
(although not that economically significant) that remained unchanged from our baseline
estimation are: the number of board directors (its squared term was still slightly higher
than 1), ROA, profit margin, solvency ratio, and firm age. Firm size is still a risk factor,
but its economic significance is negligible. Exceptions, where the effect of control
variables differs across groups of countries as well as with respect to Table 2, are
covariates: joint-stock companies, cooperatives, international audit firms, and listed

17
companies. These few exceptions are not materially important, though, and probably
reflect country-specific differences that cannot be captured by country-level fixed effects.
4.4 Breakdown of firm survival by industry
As argued by Audretsch and Mahmood (1995), business survival rates may vary across
industries. For this reason, we estimate our baseline model irrespective of the country in
which a firm operates, but instead, for different industries according to NACE Rev. 2
classification combined into four groups—agriculture, forestry, and fishing (Section A);
mining and manufacturing (Sections B–E); construction (Section F); and services
(Sections G–S). These results are available in Table 5.
First, our comprehensive IQ index is statistically significant for all industries except
services. In agricultural industries, it became an even much more economically
significant preventive factor, as opposed to our previous results.
All other results remained practically the same, although some variables are now
not statistically significant, preventing us from drawing some general conclusions. This
is true even for industries that are well-represented in our sample, i.e., with more than
30,000 observations (Sections B–E and Sections G–S). Ownership structure and
corporate governance factors still appear to lower the probability of firm exit. The same
holds for firm performance and solvency ratio. As in the previous results, whether a firm
is listed, as well as the firm size, does not help a firm survive.
4.5 Robustness checks
In order to verify the validity of our results, we performed various robustness checks.
Some can be drawn from previous subsections. In Table 3, we report results of the Cox
proportional hazards model with alternative measures of institutional quality and show
that the results are robust with respect to different IQ indicators. Furthermore, because of
the variety of IQ variables, we constructed a synthetic IQ indicator and showed that the
beneficial impact of institutions is robust with respect to the level of the institutional
environment in different country groups (Table 4) as well as across different industries
(Table 5). The country grouping is robust with respect to individual IQ variables because
the comprehensive IQ indicator is highly correlated with individual IQ variables, and

18
country ranking remains stable irrespective of differences in individual IQ variables.
More details are provided in Table A.2.
Further, we re-estimated the Cox proportional hazards model for different periods
for which we also adjusted the number of analyzed (failed and survived) firms. Despite
that in the crisis period our comprehensive IQ index was not statistically significant, our
results show that effect of the institutions does not vary with time period analyzed (Table
A.3). The effect of the firm-specific controls is largely time-invariant as well.
Finally, we re-estimated the Cox hazards model with different assumptions on
survival distribution. These include the exponential, Weibull, Gompertz, log-normal, log-
logistic, and generalized gamma distributions. The results are presented in Table A.4,
showing that effect of the institutions is invariant with respect to assumptions of survival
distribution. This is also largely true in terms of firm-specific controls.
5. Concluding remarks
We analyzed the effects of institutional quality on firm survival. We employed the Cox
proportional hazards model on a large sample of 79,591 companies from 15 countries in
Central and Eastern Europe (CEE) from 2006–2015. Furthermore, we employed an
extensive set of firm-specific characteristics as controls and also accounted for country-
specific differences.
Our results show that institutions and their quality play an important role as a
preventive factor helping firms improve their probability of survival. In terms of specific
indicators, the rule of law represents a key institutional impact that is in line with relevant
literature on institutional quality. Other measures—national governance, corruption
control, enterprise and banking reforms, civil society, and democracy—economically
impact firm survival significantly.
In addition, we created a synthetic comprehensive indicator of institutional quality
based on the principal component analysis of individual institutional measures and
assessed the effect of institutions on groups of countries with different levels of
institutional quality. We show that the economic significance of institutions is highest in
countries with the lowest quality of institutions. Estimation results clearly indicate that
returns from improving institutions diminish as the quality of institutions increases.
19
Assessing firm-specific controls brings also interesting outcomes. Ownership
structure and corporate governance lower the probability of firm exit. Foreign ownership
and many shareholders are factors with the most significant impact. Other significant
preventive factors (although not that economically significant) are: ROA, profit margin,
solvency ratio, and firm age. The size of the firm appears to be a risk factor for firm
survival, although with a negligible economic effect (a hazard ratio only slightly over the
threshold of 1). The corporate legal form and the fact of whether the firm is listed provide
mixed results, depending on the country group and individual industries.
Overall, our results are robust with respect to institutional quality indicators,
country groups, industries, and assumptions of survival distributions.
Our results also can be used as a basis for direct policy decisions. Building an
institutional environment similar to that of developed countries is directly linked with
better survival chances for firms in CEE countries. The greatest benefits of improved
institutions can be expected in those countries that lag behind most.
References
Acemoglu, D., Johnson, S., Robinson, J. A. (2001). The Colonial Origins of Comparative Development: An Empirical Investigation. American Economic Review, 91(5), 1369-1401.
Acemoglu, D., Johnson, S., Robinson, J. A. (2005). Institutions as the fundamental cause of long-run growth, in Aghion, P. and Durlauf, S. (eds.), Handbook of Economic Growth, North Holland: Elsevier Press, 385–472.
Agarwal, R., Audretsch, D. B. (2001). Does entry size matter? The impact of the life cycle and technology on firm survival. Journal of Industrial Economics, 49(1), 21-43.
Agarwal, R., Gort, M. (2002). Firm and product life cycles and firm survival. American Economic Review, 92(2), 184-190.
Aldamen, H., Duncan, K., Kelly, S., McNamara, R., Nagel, S. (2012). Audit committee characteristics and firm performance during the global financial crisis. Accounting & Finance, 52(4), 971-1000.
Alfaro, L., Chen, M.X. (2012). Surviving the global financial crisis: foreign ownership and establishment performance. American Economic Journal: Economic Policy, 4(3), 30-55.
Audretsch, D. B., Mahmood, T. (1995). New firm survival: new results using a hazard function. The Review of Economics and Statistics, 77(1), 97-103.
Aussenegg, W., Jelic, R. (2007). The operating performance of newly privatised firms in Central European transition economies. European Financial Management, 13(5), 853-879.
Bajra, U., Čadež, S. (2018). Audit committees and financial reporting quality: The 8th EU Company Law Directive perspective. Economic Systems, 42(1), 151-163.
Baumöhl, E., Iwasaki, I., Kočenda, E. (2017). Firm Survival in New EU Member States. Center for Economic Institutions Working Paper Series, no. 2017-5, Institute of Economic Research, Hitotsubashi University, Tokyo, Japan.

20
Besley, T., Ghatak, M. (2009). Property Rights and Economic Development, in Rodrik, D. and Rosenzweig, M. (eds.), Handbook of Development Economics (Vol. 5), Amsterdam: North Holland Press, 4525–4595.
Boone, A. L., Field, L. C., Karpoff, J. M., Raheja, C. G. (2007). The determinants of corporate board size and composition: An empirical analysis. Journal of Financial Economics, 85(1), 66-101.
Carlin, C. S., Solid, C. A. (2014). An approach to addressing selection bias in survival analysis. Statistics in Medicine, 33(23), 4073-4086.
Che, Y., Lu, Y., Tao, Z. (2017). Institutional quality and new firm survival. Economics of Transition, 25(3), 495-525.
Claessens, S., Djankov, S., Lang, L. H. P. (2000). The separation of ownership and control in East Asian corporations. Journal of Financial Economics, 58(1/2), 81-112.
Coles, J. L., Daniel, N. D., Naveen, L. (2008). Boards: Does one size fit all?. Journal of Financial Economics, 87(2), 329-356.
Cox, D. R. (1972). Regression Models and Life-Tables. Journal of the Royal Statistical Society. Series B. 34(2), 187-220.
De la Croix, D., Delavallade, C. (2009). Growth, public investment and corruption with failing institutions. Economics of Governance, 10(3), 187-219.
Dosi. G., Pugliese, E., Santoleri, P. (2017). Growth and survival of the 'fitter'? Evidence from US new-born firms. LEM Papers Series 2017/06, Laboratory of Economics and Management (LEM), Sant'Anna School of Advanced Studies, Pisa, Italy.
D'Souza, J., Megginson, W., Nash, R. (2005). Effect of institutional and firm-specific characteristics on post-privatization performance: Evidence from developed countries. Journal of Corporate Finance, 11(5), 747-766.
Égert, B. (2016). Regulation, institutions, and productivity: new macroeconomic evidence from OECD countries. American Economic Review, 106(5), 109-13.
Eicher, T. S., García-Peñalosa, C. (2006). Institutions, Development, and Economic Growth. MIT Press Books, The MIT Press.
Esteve-Pérez, S., Mañez-Castillejo, J. A. (2008). The resource-based theory of the firm and firm survival. Small Business Economics, 30(3), 231-249.
Esteve-Pérez, S., Sanchis Llopis, A., Sanchis Llopis, J. A., (2004). The Determinants of Survival of Spanish Manufacturing Firms. Review of Industrial Organization 25, 251-273.
Fama, E. F. (1980). Agency problems and the theory of the firm. Journal of Political Economy, 88(2), 288-307.
Fan, J. P. H., Wei, K. C. J., Xu, X. (2011). Corporate finance and governance in emerging markets: A selective review and an agenda for future research. Journal of Corporate Finance, 17(2), 207-214.
Faruq, H. A., Weidner, M. L. (2018). Culture, Institutions, and Firm Performance. Eastern Economic Journal. Forthcoming. https://doi.org/10.1057/s41302-016-0087-5.
Francis, J. R. (2004). What do we know about audit quality? The British Accounting Review, 36(4), 345-368.
Franco, Ch., J. P. W. Gelübcke (2015). The death of German firms: What role for foreign direct investment?. The World Economy, 38(4), 677-703.
Geroski, P. A. (1995). What do we know about entry? International Journal of Industrial Organization, 13(4), 421-440.

21
Geroski, P. A., Mata, J., Portugal, P. (2010). Founding conditions and the survival of new firms. Strategic Management Journal, 31(5), 510-529.
Ghoul, S., Guedhami, O., Kim, Y. (2017). Country-level institutions, firm value, and the role of corporate social responsibility initiatives. Journal of International Business Studies, 48(3), 360-385.
Gibrat, R. (1931). Les Inegalites Economiques, Librairie du Recueil Sirey, Paris. Goddard, J., Tavakoli, M., Wilson, J. O. (2009). Sources of variation in firm profitability and
growth. Journal of Business Research, 62(4), 495-508. Görg, H., Spaliara, M. E. (2014). Financial Health, Exports and Firm Survival: Evidence from
UK and French Firms. Economica, 81(323), 419-444. Guariglia, A., Spaliara, M. E., Tsoukas, S. (2016). To what extent does the interest burden affect
firm survival? Evidence from a panel of UK firms during the recent financial crisis. Oxford Bulletin of Economics and Statistics, 78(4), 576-594.
Gwartney, J. D., Lawson, R. A., Holcombe, R. G. (1999). Economic freedom and the environment for economic growth. Journal of Institutional and Theoretical Economics, 155(4), 643-663.
Hall, R., and Jones, C. I. (1999). Why Do Some Countries Produce So Much More Output per Worker than Others? Quarterly Journal of Economics, 114(1), 83-116.
Hanousek, J., Kočenda, E. (2014) Factors of trade in Europe. Economic Systems, 38(4), 518-535. Hanousek, J., Kočenda, E., Shamshur, A. (2015). Corporate efficiency in Europe. Journal of
Corporate Finance, 32, 24-40. Harhoff, D., Stahl, K., Woywode, M. (1998). Legal form, growth and exit of West German
firms—empirical results for manufacturing, construction, trade and service industries. Journal of Industrial Economics, 46(4), 453-488.
Hasan, I., Wachtel, P. Zhou, M. (2009). Institutional development, financial deepening and economic growth: Evidence from China. Journal of Banking & Finance, 33(1), 157-170.
Iwasaki, I. (2014). Global financial crisis, corporate governance, and firm survival: The Russian experience. Journal of Comparative Economics, 42(1), 178-211.
Kafouros, M., Aliyev, M. (2016). Institutional development and firm profitability in transition economies. Journal of World Business, 51(30), 369-378.
Kočenda, E., Hanousek, J. (2012). Firm Break-up and Performance. Economics of Governance, 13(2), 121-143.
Kočenda, E., Poghosyan, K. (2018). Export sophistication: A dynamic panel data approach. Forthcoming in Emerging Markets Finance and Trade.
Kumar, P. R., Ravi, V. (2007). Bankruptcy prediction in banks and firms via statistical and intelligent techniques–A review. European Journal of Operational Research, 180(1), 1-28.
Lawrence, A., Minutti-Meza, M., Zhang, P. (2011). Can Big 4 versus non-Big 4 differences in audit-quality proxies be attributed to client characteristics? Accounting Review, 86(1), 259-286.
Linck, J. S., Netter, J. M., Yang, T. (2008). The determinants of board structure. Journal of Financial Economics, 87(2), 308-328.
Liu, X. (2012). Survival Analysis: Models and Applications. John Wiley & Sons: Chichester. Manjón-Antolín, M. C., Arauzo-Carod, J. M. (2008). Firm survival: Methods and evidence.
Empirica, 35(1), 1-24. Musso, P., Schiavo, S. (2008). The impact of financial constraints on firm survival and growth.
Journal of Evolutionary Economics, 18(2), 135-149.

22
North, D. C. (1990). Institutions, Institutional Change and Economic Performance. Cambridge University Press, Cambridge.
Porter, M. E. (1979). The structure within industries and companies' performance. Review of Economics and Statistics, 61(2), 214-227.
Porter, M. E. (1998). Clusters and the new economics of competition. Harvard Business Review, 76(6), 77-90.
Santarelli, E., Vivarelli, M. (2007). Entrepreneurship and the process of firms’ entry, survival and growth. Industrial and Corporate Change, 16(3), 455-488.
Shleifer, A., Vishny, R. W. (1986). Large shareholders and corporate control. Journal of Political Economy, 94(3), 461-488.
Sucher, P., Kosmala-MacLullich, K. (2004). A construction of auditor independence in the Czech Republic: Local insights. Accounting, Auditing & Accountability Journal, 17(2), 276-305.
Taymaz, E., Özler, S. (2007). Foreign Ownership, Competition, and Survival Dynamics. Review of Industrial Organization, 31, 23–42.
Umber, M. P., Grote, M. H., & Frey, R. (2014). Same as it ever was? Europe's national borders and the market for corporate control. Journal of International Money and Finance, 40, 109-127.
Wang, K., Shailer, G. (2015). Ownership concentration and firm performance in emerging markets: A meta-analysis. Journal of Economic Surveys, 29(2), 199-229.
Yasar, M., Paul, C. J. M., Ward, M. R. (2011). Property rights institutions and firm performance: a cross-country analysis. World Development, 39(4), 648-661.
Mean S.D. Median Max. Min.
Rule of law 2006 value of the World Governance Indicator of the rule of law 0.294 0.499 0.405 1.141 -0.532
Democracy Adjusted 2006 value of the Freedom House index of democracy a 3.330 0.826 2.75 5.04 2.04
National governance Adjusted 2006 value of the Freedom House index of national democracy governance a 2.888 0.884 2.25 5.00 1.25
Civil society Adjusted 2006 value of the Freedom House index of civil society a 4.538 0.496 4.25 5.50 3.25
Corruption control Adjusted 2006 value of the Freedom House index of corruption a 2.067 1.090 1.25 4.50 1.00
Banking reform 2006 value of the EBRD index of banking sector reform 3.079 0.485 3.0 4.0 2.7
Enterprise reform 2006 value of the EBRD index of enterprise reform 2.556 0.534 2.3 3.7 2.0
Comprehensive IQ index First principal component score of the seven IQ variables above 0.000 1.962 3.658 5.256 -3.388
Remoteness from EU capital Log of the direct distance from Brussels to the capital of the country in question (Km) 7.466 0.323 7.516 7.721 6.576
Joint-stock company Dummy variable for open joint-stock companies 0.196 0.397 0 1 0
Limited liability company Dummy variable for limited liability companies 0.553 0.497 1 1 0
Partnership Dummy variable for partnerships 0.108 0.311 0 1 0
Cooperative Dummy variable for cooperatives 0.045 0.208 0 1 0
Other legal forms (default category) Dummy variable for companies with a corporate form other than listed above 0.097 0.296 0 1 0
Number of large shareholders Total number of dominant and block shareholders 1.802 1.715 1 5 0
Foreign ownership Dummy for ultimate ownership of foreign investors 0.042 0.200 0 1 0
Number of board directors Number of recorded members of the board of directors 1.877 2.200 1 110 0
International audit firm Dummy for firms that employ an international audit firm as external auditor 0.013 0.115 0 1 0
ROA Return on total assets (%) b 8.606 19.394 4.950 100.000 -100.000
Gross margin Gross margin (%) c 3.316 14.185 2.330 100.000 -100.000
Listed Dummy variable for listed companies 0.024 0.154 0 1 0
Solvency ratio Solvency ratio (%) d 36.220 33.879 33.550 100.000 -100.000
Firm size Natural logarithm of total assets in euros 6.718 1.877 6.695 19.281 -3.547
Firm age Years in operation 10.828 11.982 9 643 1Notes :a Computed by 7 minus the value of the original index, which ranges between 1.00 (best) and 7.00 (worst)b Computed using the following formula: (profit before tax/total assets) × 100c Computed using the following formula: (gross profit/operating revenue) × 100d Computed using the following formula: (shareholder funds/total assets) × 100
Table 1. Definitions and descriptive statistics of variables used in the empirical analysis
Variable name Definition
Descriptive statistics
Source : Country-level data from Rule of Law to Enterprise Reform was obtained from the website of the World Bank, the Freedom House, and EBRD (http://info.worldbank.org/governance/wgi/#home; https://freedomhouse.org/;http://www.ebrd.com/home). Remoteness from the EU capital was calculated using Google Maps (https://maps.google.co.jp/). Firm-level raw data was extracted from the Bureau van Dijk (BvD) Orbis database (https://webhelp.bvdep.com).

(a) All 15 CEE countries (b) Central European states
(c) Balkan states (d) Baltic states
(e) Agriculture, forestry, and fishing (Section A) (f) Mining and manufacturing (Sections B–E)
(g) Construction (Section F) (h) Services (Sections G–S)
Notes :
Source : Illustrated by the authors
Figure 1. Number of failed firms, exit rate, and Nelson-Aalen estimate of the cumulative hazard function by region, industry, and year, 2007–2015
Number of failed firms (left axis)
Exit rate (right axis)
Nelson-Aalen estimate of the cumulative hazard function (right axis)
1001
1842 1844
15521676
2542
3148
3628
2402
0.000
0.050
0.100
0.150
0.200
0.250
0.300
0.350
0
500
1000
1500
2000
2500
3000
3500
4000
2007 2008 2009 2010 2011 2012 2013 2014 2015
526
837897
608530
636693
599
356
0.000
0.050
0.100
0.150
0.200
0.250
0.300
0.350
0
200
400
600
800
1000
2007 2008 2009 2010 2011 2012 2013 2014 2015
458
965863
760 818
1446
1956
2514
1447
0.000
0.050
0.100
0.150
0.200
0.250
0.300
0.350
0
500
1000
1500
2000
2500
3000
2007 2008 2009 2010 2011 2012 2013 2014 2015
1740
84
184
328
460499 515
599
0.000
0.050
0.100
0.150
0.200
0.250
0.300
0.350
0
100
200
300
400
500
600
2007 2008 2009 2010 2011 2012 2013 2014 2015
29
43 44
33
68 64
104
90
66
0.000
0.050
0.100
0.150
0.200
0.250
0.300
0.350
0
20
40
60
80
100
120
2007 2008 2009 2010 2011 2012 2013 2014 2015
427
823707
576 567
10281164
1455
858
0.000
0.050
0.100
0.150
0.200
0.250
0.300
0.350
0
200
400
600
800
1000
1200
1400
1600
2007 2008 2009 2010 2011 2012 2013 2014 2015
118
208239 247 254
461
607
685
477
0.000
0.050
0.100
0.150
0.200
0.250
0.300
0.350
0
100
200
300
400
500
600
700
800
2007 2008 2009 2010 2011 2012 2013 2014 2015
427
768854
696787
989
1273
1398
1001
0.000
0.050
0.100
0.150
0.200
0.250
0
200
400
600
800
1000
1200
1400
1600
2007 2008 2009 2010 2011 2012 2013 2014 2015

Target industry (NACE Rev2 section classification)
Target country
Institutional quality
Rule of law 0.83222 ***
(-5.96)
Legal form (default category: other legal forms)
Joint-stock company 0.90044 *
(-1.87)
Limited liability company 0.73739 ***
(-5.45)
Partnership 0.45460 ***
(-13.70)
Cooperative 0.69453 ***
(-5.63)
Ownership structure
Number of large shareholders 0.90260 ***
(-3.92)
Foreign ownership 0.60060 ***
(-14.11)
Corporate governance
Number of board directors 0.91163 ***
(-15.08)
Number of board directors 2 1.00097 ***
(12.47)
International audit firm 1.11921 *
(1.92)
Firm performance
ROA 0.99545 ***
(-5.98)
Profit margin 0.99409 ***
(-7.20)
Linkage with capital market
Listed 1.44165 ***
(4.65)
Solvency ratio 0.98931 ***
(-32.13)
Firm size and age
Firm size 1.02596 ***
(4.06)
Firm age 0.99710 ***
(-2.85)
Country-level fixed effects Yes
NACE division-level fixed effects Yes
N 79591
Log pseudolikelihood -170960.46
Wald test (χ 2 ) 8826.12 ***
Source : Authors' estimations
Table 2. Determinants of firm survival: Baseline estimation of the Coxproportional hazards model
All industries(Sections A-S)
All 15 CEEcountries
Notes : This table contains the results from the survival analysis using the Coxproportional hazards model. Table 1 provides detailed definitions and descriptive statisticsof the independent variables. Regression coefficients are hazard ratios. Standard errors arecomputed using the Huber-White sandwich estimator. z statistics are reported inparentheses beneath the regression coefficients. The Wald test examines the nullhypothesis that all coefficients are zero. ***, **, and * denote statistical significance at the1%, 5%, and 10% levels, respectively.
IQ variableFirm-level
characteristicsCountry-levelfixed effects
NACEdivision-levelfixed effects
N
Rule of law 0.83222 *** Yes Yes Yes 79591
Democracy 0.83495 *** Yes Yes Yes 79591
National governance 0.70898 *** Yes Yes Yes 79591
Civil society 0.81355 *** Yes Yes Yes 79591
Corruption control 0.77264 *** Yes Yes Yes 79591
Banking reform 0.82003 *** Yes Yes Yes 79591
Enterprise reform 0.77264 *** Yes Yes Yes 79591
Comprehensive IQ index 0.94774 *** Yes Yes Yes 79591
Source : Authors' estimations
Hazard ratios
Table 3. Estimation of Cox proportional hazards model with alternative IQ variables
Note : Table 1 provides detailed definitions and descriptive statistics of the independent variables. Regression coefficientsare hazard ratios. Standard errors are computed using the Huber-White sandwich estimator. *** denotes statisticalsignificance at the 1% level.

Model
Target industry (NACE Rev2 section classification)
Target country
Institutional quality
Comprehensive IQ index 0.98241 * 0.70549 *** 0.67486 **
(-1.88) (-6.64) (-2.21)
Legal form (default category: other legal forms)
Joint-stock company 0.56089 *** 0.98233 1.88734 ***
(-7.30) (-0.15) (3.77)
Limited liability company 0.55376 *** 0.98028 0.74390 **
(-7.38) (-0.21) (-2.00)
Partnership 0.26065 *** 0.81865 ** 0.23900 ***
(-17.16) (-2.35) (-8.83)
Cooperative 0.37786 *** 1.17264 * 0.72351(-5.94) (1.76) (-0.92)
Ownership structure
Number of large shareholders 0.79286 *** 0.78933 *** 0.99839(-12.19) (-10.58) (-1.04)
Foreign ownership 0.70042 *** 0.57947 *** 0.50672 ***
(-5.56) (-11.87) (-4.27)
Corporate governance
Number of board directors 0.84626 *** 0.99607 * 0.95802 *
(-14.35) (-1.81) (-1.67)
Number of board directors 2 1.00159 *** 1.09816 ** 1.00145(13.43) (2.02) (0.92)
International audit firm 0.85966 * 1.82279 *** 0.42245(-1.88) (7.01) (-1.23)
Firm performance
ROA 0.99314 *** 0.99620 *** 0.98033 ***
(-4.68) (-3.81) (-6.01)
Profit margin 0.99460 *** 0.99720 ** 0.99565 **
(-2.83) (-2.32) (-2.50)
Linkage with capital market
Listed 1.72368 * 1.25354 *** 0.46600 ***
(1.82) (2.96) (-7.02)
Solvency ratio 0.98956 *** 0.98973 *** 0.99004 ***
(-18.05) (-23.51) (-8.04)
Firm size and age
Firm size 1.05054 *** 1.01038 1.07697 ***
(4.16) (1.29) (3.44)
Firm age 0.99547 0.99571 *** 0.99734(-1.54) (-3.20) (-1.58)
Country-level fixed effects Yes Yes Yes
NACE division-level fixed effects Yes Yes Yes
N 28003 43590 7998
Log pseudolikelihood -52932.69 -93492.76 -9897.84
Wald test (χ 2 ) 13513.78 *** 34251.51 *** 88617.34 ***
a Czech Republic, Estonia, Hungary, Latvia, Slovakiab Bulgaria, Croatia, Lithuania, Poland, Romaniac Bosnia, Macedonia, Moldova, Montenegro, Serbia
Source : Authors' estimations
Notes : This table contains results from the survival analysis using the Cox proportional hazards model. Table 1 providesdetailed definitions and descriptive statistics of the independent variables. Regression coefficients are hazard ratios. Standarderrors are computed using the Huber-White sandwich estimator. z statistics are reported in parentheses beneath the regressioncoefficients. The Wald test examines the null hypothesis that all coefficients are zero. ***, **, and * denote statisticalsignificance at the 1%, 5%, and 10% levels, respectively.
All industries (Sections A–S)
Table 4. Estimation of the Cox proportional hazards model by the level of institutional quality
[1]
High IQ
countries a
Middle IQ
countries bLow IQ
countries c
[2] [3]

Model
Target industry(NACE Rev2 section classification)
Institutional quality
Comprehensive IQ index 0.78053 *** 0.93951 *** 0.91498 *** 0.99206(-4.18) (-4.73) (-3.10) (-0.56)
Legal form (default category: other legal forms)
Joint-stock company 0.25850 *** 1.04971 1.08629 0.87393(-6.82) (0.53) (0.39) (-1.55)
Limited liability company 0.24040 *** 0.74565 *** 0.82204 0.83330 **
(-6.21) (-3.37) (-0.95) (-2.16)
Partnership 0.17325 *** 0.44500 *** 0.71208 0.48808 ***
(-7.90) (-8.57) (-1.45) (-8.61)
Cooperative 0.27940 *** 0.71665 *** 1.18813 0.73057 ***
(-5.82) (-3.18) (0.65) (-3.22)
Ownership structure
Number of large shareholders 0.96817 0.89360 *** 0.96333 0.86982 ***
(-0.86) (-4.85) (-0.49) (-3.70)
Foreign ownership 0.66068 0.51752 *** 0.70106 ** 0.68117 ***
(-1.37) (-11.94) (-2.49) (-7.46)
Corporate governance
Number of board directors 0.85128 *** 0.90563 *** 0.90092 *** 0.89454 ***
(-5.02) (-10.09) (-4.50) (-11.28)
Number of board directors 2 1.00328 *** 1.00247 *** 1.00262 *** 1.00109 ***
(4.79) (9.48) (2.76) (11.53)
International audit firm 1.42885 1.19194 * 0.78326 1.10548(0.47) (1.94) (-1.00) (1.21)
Firm performance
ROA 0.98841 0.99561 *** 0.99701 0.99319 ***
(-1.57) (-3.34) (-1.45) (-6.10)
Profit margin 0.99187 ** 0.99315 *** 0.99473 * 0.99725 **
(-1.97) (-5.83) (-1.70) (-2.09)
Linkage with capital market
Listed 1.13018 1.38803 *** 0.92204 1.86350 ***
(0.37) (3.93) (-0.34) (5.05)
Solvency ratio 0.99124 *** 0.98847 *** 0.98541 *** 0.99157 ***
(-3.96) (-22.84) (-13.21) (-16.52)
Firm size and age
Firm size 1.06039 1.00399 1.07287 *** 1.03124 ***
(1.24) (0.39) (4.35) (3.21)
Firm age 0.99075 1.00191 * 0.98791 *** 0.98820 ***
(-1.08) (1.93) (-3.06) (-5.50)
Country-level fixed effects Yes Yes Yes Yes
NACE division-level fixed effects Yes Yes Yes Yes
N 3327 31564 9889 34811
Log pseudolikelihood -3135.27 -60048.80 -23982.58 -65623.95
Wald test (χ 2 ) 40660.37 *** 3615.16 *** 1346.19 *** 3430.19 ***
Source : Authors' estimations
Notes : This table contains results from the survival analysis using the Cox proportional hazards model. Table 1 provides detailed definitions anddescriptive statistics of the independent variables. Regression coefficients are hazard ratios. Standard errors are computed using the Huber-Whitesandwich estimator. z statistics are reported in parentheses beneath the regression coefficients. The Wald test examines the null hypothesis that allcoefficients are zero. ***, **, and * denote statistical significance at the 1%, 5%, and 10% levels, respectively.
Table 5. Estimations of the Cox proportional hazards model in different industries
[1] [2] [3] [4]
Agriculture,forestry, and
fishing(Section A)
Mining andmanufacturing(Sections B–E)
Construction(Section F)
Services(Sections G–S)

Componentno.
Eigenvalue DifferenceCumulative
percentage oftotal variance
Variables Eigenvector
1 6.4675 6.247 0.924 Rule of law 0.3872
2 0.2208 0.062 0.956 Democracy 0.3909
3 0.1589 0.082 0.978 National governance 0.3787
4 0.0767 0.037 0.989 Civil society 0.3711
5 0.0397 0.010 0.995 Corruption control 0.3802
6 0.0298 0.023 0.999 Banking reform 0.3649
7 0.0065 - 1.000 Enterprise reform 0.3720Source : Author's estimations. For definitions and descriptive statistics of the variables, see Table 1.
Table A.1. Estimation results of principal component analysis of the IQ variables
Eigenvalue of the correlation matrix Eigenvectors of the first component
Appendix

(a) All 15 CEE countries
Log-rank test for equality of survivor functions: χ 2=7563.38, p =0.000
Log-rank test for equality of survivor functions: χ 2=562.16, p =0.000 Log-rank test for equality of survivor functions: χ 2=1106.88, p =0.000
Log-rank test for equality of survivor functions: χ 2=2948.69, p =0.000 Log-rank test for equality of survivor functions: χ 2=6940.38, p =0.000
Log-rank test for equality of survivor functions: χ 2=256.93, p =0.000 Log-rank test for equality of survivor functions: χ 2=3708.26, p =0.000
(g) Foreign ownership—Companies with foreign ownership (solid); Others (dashes)(h) Number of board directors—Companies with upper number of board directors (solid);
Companies with lower number of board directors (dashes) b
Figure A.1. Kaplan-Meier survival function of firm survival probability a
(b) Country group—Central European states (solid); Balkan states (dashes); Baltic states (dots)
(c) Industry—Agriculture, forestry, and fishing (solid); Mining and manufacturing (dashes);Construction (dots); Services (tight dots)
(d) Institutional quality—Countries with upper level of rule of law (solid); Countries with lowerlevel of rule of law (dashes)
(e) Legal form—Joint Stock Company (solid); Limited liability company (dashes); Partnership(dots); Cooperative (tight dots); Others (long dashes)
(f) Ownership concentration—Companies with upper number of large shareholders (solid);Companies with lower number of large shareholders (dashes)
0.60
0.70
0.80
0.90
1.00
0 1 2 3 4 5 6 7 8 9 10
0.60
0.70
0.80
0.90
1.00
0 1 2 3 4 5 6 7 8 9 10
0.60
0.70
0.80
0.90
1.00
0 1 2 3 4 5 6 7 8 9 10
0.60
0.70
0.80
0.90
1.00
0 1 2 3 4 5 6 7 8 9 10
0.60
0.70
0.80
0.90
1.00
0 1 2 3 4 5 6 7 8 9 10
0.60
0.70
0.80
0.90
1.00
0 1 2 3 4 5 6 7 8 9 10
0.60
0.70
0.80
0.90
1.00
0 1 2 3 4 5 6 7 8 9 10
0.60
0.70
0.80
0.90
1.00
0 1 2 3 4 5 6 7 8 9 10

Log-rank test for equality of survivor functions: χ 2=91.33, p =0.000 Log-rank test for equality of survivor functions: χ 2=4164.06, p =0.000
Log-rank test for equality of survivor functions: χ 2=464.26, p =0.1020 Log-rank test for equality of survivor functions: χ 2=5679.02, p =0.000
Log-rank test for equality of survivor functions: χ 2=4058.80, p =0.0000 Log-rank test for equality of survivor functions: χ 2=4646.37, p =0.000
Notes :a See Table 3 for definitions and descriptive statistics of variables used for comparisonb Observations are divided by medium value of the variable in questionSource : Authors' illustrations and estimations
(m) Firm size—Upper-scale companies in terms of total assets (solid); Lower-scale companies
(dashes) b (n) Firm age—Upper-age companies (solid); Lower-age companies (dashes) b
(i) Quality of external audit—Companies contracted with an international audit firm (solid);Others (dashes)
(j) Firm performance—Companies with upper ROA (solid); Companies with lower ROA
(dashes) b
(k) Dependence on stock market—Listed companies (solid); Unlisted companies (dashes)(l) Dependence on fund procurement from outside—Companies with upper solvency ratios
(solid); Companies with lower solvency ratios (dashes) b
0.60
0.70
0.80
0.90
1.00
0 1 2 3 4 5 6 7 8 9 10
0.60
0.70
0.80
0.90
1.00
0 1 2 3 4 5 6 7 8 9 10
0.60
0.70
0.80
0.90
1.00
0 1 2 3 4 5 6 7 8 9 10
0.60
0.70
0.80
0.90
1.00
0 1 2 3 4 5 6 7 8 9 10
0.60
0.70
0.80
0.90
1.00
0 1 2 3 4 5 6 7 8 9 10
0.60
0.70
0.80
0.90
1.00
0 1 2 3 4 5 6 7 8 9 10

(a) Country score
Country Rule of law DemocracyNational
governanceCivil society
Corruptioncontrol
Bankingreform
Enterprisereform
ComprehensiveIQ index
Bosnia -0.496 2.960 2.250 3.500 2.750 2.700 2.000 -1.712
Bulgaria -0.094 4.110 4.000 4.500 3.250 3.700 2.700 1.988
Croatia 0.006 3.250 3.500 4.250 2.250 4.000 3.000 1.326
Czech Republic 0.873 4.750 4.000 5.500 3.500 4.000 3.300 4.354
Estonia 1.141 5.040 4.750 5.000 4.500 4.000 3.700 5.228
Hungary 0.998 4.860 4.750 5.500 4.000 4.000 3.700 5.256
Latvia 0.669 4.930 5.000 5.250 4.000 4.000 3.000 4.523
Lithuania 0.716 4.710 4.500 5.250 3.000 3.700 3.000 3.658
Macedonia -0.532 3.180 3.250 3.750 2.250 2.700 2.700 -0.701
Moldova -0.520 2.040 1.250 3.250 1.000 2.700 2.000 -3.388
Montenegro -0.271 3.070 2.500 4.000 1.500 2.700 2.000 -1.479
Poland 0.405 4.640 3.750 5.500 4.000 3.700 3.700 4.139
Romania -0.118 3.710 3.500 4.750 3.000 3.000 2.700 1.143
Serbia -0.532 3.320 3.250 4.250 2.500 2.700 2.300 -0.452
Slovakia 0.547 4.860 4.750 5.500 3.750 3.700 3.700 4.670
(b) Correlation matrix
Rule of law DemocracyNational
governanceCivil society
Corruptioncontrol
Bankingreform
Enterprisereform
ComprehensiveIQ index
Rule of law 1.000
Democracy 0.905 1.000
National governance 0.762 0.841 1.000
Civil society 0.848 0.912 0.677 1.000
Corruption control 0.732 0.885 0.688 0.807 1.000
Banking reform 0.840 0.798 0.728 0.669 0.634 1.000
Enterprise reform 0.813 0.840 0.627 0.880 0.838 0.744 1.000
Comprehensive IQ index 0.938 0.975 0.829 0.925 0.872 0.861 0.916 1.000Source : Authors' estimations. For definitions and descriptive statistics of the variables, see Table 1.
Table A.2. Country score and correlation matrix of IQ variables

Model
Estimation period
Institutional quality
Comprehensive IQ index 1.00935 0.98400 0.97016 *** 0.95764 ** 0.96264 *** 0.86451 ***
(0.43) (-1.14) (-2.96) (-2.30) (-2.58) (-7.83)
Legal form (default category: other legal forms)
Joint-stock company 0.37965 *** 0.52871 *** 0.76197 *** 0.81033 * 1.11672 2.07903 ***
(-9.39) (-8.27) (-4.49) (-1.84) (1.13) (5.49)
Limited liability company 0.57461 *** 0.66145 *** 0.66331 *** 0.83661 0.89320 1.53409 ***
(-5.58) (-5.64) (-7.27) (-1.64) (-1.26) (3.18)
Partnership 0.14828 *** 0.26752 *** 0.37992 *** 0.51889 *** 0.70299 *** 1.11449(-18.01) (-17.22) (-16.10) (-5.71) (-3.65) (0.83)
Cooperative 0.30074 *** 0.43484 *** 0.57136 *** 0.64631 *** 0.88253 1.57151 ***
(-9.20) (-8.55) (-7.84) (-2.99) (-1.15) (3.22)
Ownership structure
Number of large shareholders 0.39152 *** 0.50609 *** 0.83085 *** 0.60892 *** 0.96949 *** 0.97532(-19.31) (-18.47) (-9.67) (-10.01) (-2.68) (-0.76)
Foreign ownership 0.39830 *** 0.53048 *** 0.63872 *** 0.64375 *** 0.78697 *** 0.53717 ***
(-6.77) (-8.31) (-10.23) (-4.80) (-4.52) (-10.11)
Corporate governance
Number of board directors 0.78929 *** 0.80275 *** 0.89100 *** 0.81664 *** 0.94844 *** 0.94913 ***
(-10.27) (-14.87) (-14.65) (-10.66) (-6.02) (-5.24)
Number of board directors 2 1.00221 *** 1.00202 *** 1.00113 *** 1.00184 *** 1.00062 *** 1.00068 ***
(10.49) (13.19) (12.77) (9.74) (7.34) (4.23)
International audit firm 1.74303 *** 1.56921 *** 1.23888 *** 1.46685 *** 0.93435 0.83984(4.28) (4.87) (3.15) (3.15) (-0.69) (-1.60)
Firm performance
ROA 0.99378 *** 0.99438 *** 0.99559 *** 0.99515 *** 0.99739 ** 0.99527 ***
(-3.22) (-4.37) (-4.92) (-2.97) (-2.29) (-3.73)
Profit margin 0.99584 * 0.99497 *** 0.99375 *** 0.99419 *** 0.99267 *** 0.99433 ***
(-1.76) (-3.32) (-6.28) (-2.99) (-5.84) (-4.28)
Linkage with capital market
Listed 1.63122 ** 1.39996 ** 1.32754 *** 1.19396 1.10278 1.57881 ***
(2.11) (2.18) (3.68) (0.88) (1.04) (3.93)
Solvency ratio 0.99247 *** 0.99190 *** 0.98962 *** 0.99164 *** 0.98841 *** 0.98892 ***
(-9.16) (-14.41) (-26.40) (-11.02) (-21.94) (-19.14)
Firm size and age
Firm size 0.96231 ** 0.95410 *** 0.99196 0.94766 *** 1.02365 ** 1.09993 ***
(-2.33) (-4.12) (-1.03) (-3.38) (2.29) (9.06)
Firm age 0.99024 *** 0.98585 *** 0.99547 *** 0.98192 *** 0.99918 0.99889(-2.87) (-5.39) (-3.24) (-4.73) (-0.53) (-0.71)
Country-level fixed effects Yes Yes Yes Yes Yes Yes
NACE division-level fixed effects Yes Yes Yes Yes Yes Yes
N 79591 79591 79591 77416 74724 68834
Log pseudolikelihood -22474.43 -51572.07 -117107.06 -28808.28 -63904.65 -52856.06
Wald test (χ 2 ) 538991.17 *** 4724.55 *** 5694.68 *** 2160.58 *** 195767.70 *** 43553.09 ***
Source : Authors' estimations
2014–2015
Notes : This table contains results from the survival analysis using the Cox proportional hazards model. Models [4], [5], and [6] show estimates without the observations of firms thatfailed before the period in question. Table 1 provides detailed definitions and descriptive statistics of the independent variables. Regression coefficients are hazard ratios. Standard errorsare computed using the Huber-White sandwich estimator. z statistics are reported in parentheses beneath the regression coefficients. The Wald test examines the null hypothesis that allcoefficients are zero. ***, **, and * denote statistical significance at the 1%, 5%, and 10% levels, respectively.
2007–2008 2007–2010 2007–2013 2009–2010 2011–2013
Table A.3. Estimation of Cox proportional hazards model in different periods
[1] [2] [3] [4] a [5] a [6] a

Model
Assumption of survival distribution
Institutional quality
Comprehensive IQ index 0.94787 *** 0.94596 *** 0.94574 ***
(-6.06) (-6.06) (-6.09)
Legal form (default category: other legal forms)
Joint-stock company 0.90964 * 0.90405 * 0.90948 *
(-1.75) (-1.75) (-1.66)
Limited liability company 0.74822 *** 0.73926 *** 0.74388 ***
(-5.34) (-5.25) (-5.18)
Partnership 0.46544 *** 0.45087 *** 0.45546 ***
(-13.85) (-13.35) (-13.33)
Cooperative 0.70567 *** 0.70205 *** 0.70900 ***
(-5.56) (-5.28) (-5.18)
Ownership structure
Number of large shareholders 0.90620 *** 0.89595 *** 0.89667 ***
(-3.85) (-4.04) (-4.03)
Foreign ownership 0.60605 *** 0.58955 *** 0.59022 ***
(-14.03) (-14.32) (-14.29)
Corporate governance
Number of board directors 0.91387 *** 0.90970 *** 0.91008 ***
(-15.04) (-15.02) (-15.01)
Number of board directors 2 1.00094 *** 1.00100 *** 1.00100 ***
(12.31) (12.68) (12.72)
International audit firm 1.11857 * 1.11370 * 1.11154 *
(1.94) (1.80) (1.77)
Firm performance
ROA 0.99558 *** 0.99528 *** 0.99533 ***
(-6.01) (-5.99) (-5.97)
Profit margin 0.99422 *** 0.99395 *** 0.99394 ***
(-7.28) (-7.13) (-7.18)
Linkage with capital market
Listed 1.43556 *** 1.46740 *** 1.46750 ***
(4.64) (4.80) (4.79)
Solvency ratio 0.98955 *** 0.98900 *** 0.98902 ***
(-32.19) (-32.17) (-32.21)
Firm size and age
Firm size 1.02770 *** 1.02793 *** 1.02882 ***
(4.44) (4.22) (4.37)
Firm age 0.99720 *** 0.99701 *** 0.99704 ***
(-2.83) (-2.86) (-2.84)
Country-level fixed effects Yes Yes Yes
NACE division-level fixed effects Yes Yes Yes
N 79591 79591 79591
Log pseudolikelihood -45298.38 -43483.01 -43979.44
Wald test (χ 2 ) 9323.21 *** 8691.67 *** 8702.12 ***
Source : Authors' estimations
Table A.4. Estimation of parametric survival model for robustness check
Notes : This table contains the results from a survival analysis using 3 parametric estimators for a robustness check. Table 1provides detailed definitions and descriptive statistics of the independent variables. Standard errors are computed using theHuber-White sandwich estimator. z statistics are reported in parentheses beneath the regression coefficients. The Wald testexamines the null hypothesis that all coefficients are zero. ***, **, and * denote statistical significance at the 1%, 5%, and10% levels, respectively.
Exponential Weibull Gompertz
[1] [2] [3]