CENOZOIC RECORD OF ELONGATE, CYLINDRICAL, · PDF filecenozoic record of elongate, cylindrical,...
21
CENOZOIC RECORD OF ELONGATE, CYLINDRICAL, DEEP-SEA BENTHIC FORAMINIFERA IN THE INDIAN OCEAN (ODP SITES 722, 738, 744, 758, AND 763) BRUCE W. HAYWARD 1,8 ,ASHWAQ T. SABAA 1 ,ELLEN THOMAS 2,3 ,SHUNGO KAWAGATA 1,4 ,RITSUO NOMURA 5 ,CLAUDIA SCHRO ¨ DER-ADAMS 6 ,ANIL K. GUPTA 7 AND KATIE JOHNSON 1 ABSTRACT A group of ,100 species of elongate, cylindrical deep-sea benthic foraminifera (families Stilostomellidae, Pleurosto- mellidae, Nodosariidae) with complex, often constricted apertural structures, became extinct during increasingly cold glacial periods in the late Pliocene to mid-Pleistocene Climate Transition (MPT, ,2.6–0.6 Ma). We document the evolutionary history and architecture of this Extinction Group (Ext. Gp) through the Cenozoic at four lower bathyal- upper abyssal Indian Ocean sites (ODP 722, 744/738, 758, 763), seeking clues to the cause of this morphologically- targeted extinction episode late in the Cenozoic. Eighty percent of the 116 Ext Gp. species present in the Cenozoic of the Indian Ocean originated globally in the Eocene or earlier, compared with 23–37% of other Quater- nary deep-sea foraminifera. The Ext. Gp had its peak species richness and relative and absolute abundances in the late Eocene. The rapid warming of the Paleocene-Eocene Thermal Maximum, that resulted in a loss of 30–50% of deep-sea foraminiferal species, had no impact on the Ext. Gp in the one Indian Ocean section (ODP 744/738) studied. Major Cenozoic changes in the Ext. Gp, including increased species turnover, changes in dominant species, a decline in abun- dance, loss in diversity, and finally extinction, mostly occurred during the middle Eocene to early Oligocene, middle to late Miocene, and late Pliocene to middle Pleistocene. These were times of stepped increase in the volume of polar ice, global oceanic cooling, surface-water eutrophication, seasonality of phytoplankton production, deep-water ventilation, and southern deep-water carbonate corrosiveness. The final decline and disappearance of the Ext. Gp began in the late Miocene at high latitudes (744/738), but not until the late Pliocene (758, 763) or MPT (722) at lower latitudes. We hypothesize that the loss of the Ext. Gp of deep-sea foraminifera may have been caused by the decline or demise of their specific food source (detrital phytoplankton or bottom-dwelling microbes) that was abundant in the Green- house World and was decimated by the stepwise cooling, ventilation, or eutrophication of the oceans that began in the middle and late Eocene. INTRODUCTION GLOBAL TURNOVERS IN CENOZOIC DEEP-SEA FORAMINIFERA The Cenozoic fossil record of deep-sea benthic forami- nifera indicates that they had relatively slow background species turnover rates of ,2% myr 21 (Boltovskoy, 1987; McKinney, 1987; Kucera and Scho ¨ nfeld, 2007). Within this period, there are four intervals of enhanced global turnover (Fig. 1). Each has been related to times of significant climate change (e.g., Thomas, 1992a; Miller and others, 1993; Hayward and others, 2007; Thomas, 2007). These turnovers were during the Paleocene-Eocene Thermal Maximum event (PETM, ,55 Ma: Thomas, 1992a), the late Eocene–early Oligocene (,36–30 Ma; Miller and others, 1993), the middle Miocene (,16–12 Ma; Miller and others, 1993), and the late Pliocene to mid-Pleistocene Climate Transition (MPT) (2.6–0.55 Ma; Weinholz and Lutze, 1989; Scho ¨ nfeld, 1996; Hayward and others, 2007). These turnovers were associated with increased numbers of species originations and extinctions, but also with major changes in the dominant deep-sea foraminiferal assem- blages and populations. Up to 50% of deep-sea species died out across the PETM event (Thomas, 1998, 2007), possibly associated with the expansion of warm, oxygen-depleted, corrosive bottom waters (Katz and others, 1999). In a period of less than 10 kyrs, oceanic bottom temperatures warmed by 5–6uC (Zachos and others, 2001, 2005) and typical late Cretaceous-Paleocene faunal assemblages, dominated by Stensioeina beccariiformis, were replaced by late Paleogene Greenhouse World assemblages, dominated by Nuttallides truempyi and a variety of buliminids (e.g., Tjalsma and Lohmann, 1983; Thomas, 1990; Kaiho and others, 1996; Alegret and Ortiz, 2006; Takeda and Kaiho, 2007; Thomas, 2007; Alegret and others, 2009). The late Eocene-early Oligocene and middle Miocene turnovers were more significant in terms of community structure but had fewer species originations or extinctions (e.g., Woodruff, 1985; Thomas, 1986, 1987; Thomas and others, 2000). These occurred at times of strengthening circulation of cool, well-oxygenated bottom water and increasing primary productivity and seasonality of phyto- plankton blooms in the oceans, coupled with global cooling due to formation and growth of Antarctic ice sheets (e.g., Thomas and Vincent, 1987; Thomas, 2007). Nuttallides truempyi and many large buliminids disappeared at the end of the Eocene, replaced by faunal assemblages transitional in composition between those of late Paleogene Greenhouse conditions and those of the late Neogene Icehouse World (Fig. 1) (e.g., Thomas, 1992a, b). The transitional and late 1 Geomarine Research, 49 Swainston Rd, St Johns, Auckland, New Zealand. 2 Department of Geology and Geophysics, Yale University, New Haven, CT, USA. 3 Department of Earth and Environmental Sciences, Wesleyan University, Middletown, CT, USA. 4 Present address: Faculty of Education and Human Sciences, Yokohama National University, 79-2 Tokiwadai, Yokohama, Japan. 5 Faculty of Education, Shimane University, Nishikawatsu, Matsue 690-8504, Japan. 6 Department of Earth Sciences, Carleton University, Ottawa, Ontario, Canada. 7 Department of Geology and Geophysics, Indian Institute of Technology, Kharagpur 721 302, India. 8 Correspondence author. Email: [email protected] Journal of Foraminiferal Research, v. 40, no. 2, p. 113–133, April 2010 113
Transcript of CENOZOIC RECORD OF ELONGATE, CYLINDRICAL, · PDF filecenozoic record of elongate, cylindrical,...

CENOZOIC RECORD OF ELONGATE, CYLINDRICAL, DEEP-SEA BENTHICFORAMINIFERA IN THE INDIAN OCEAN (ODP SITES 722, 738, 744, 758, AND 763)
BRUCE W. HAYWARD1,8, ASHWAQ T. SABAA
1, ELLEN THOMAS2,3, SHUNGO KAWAGATA
1,4, RITSUO NOMURA5, CLAUDIA
SCHRODER-ADAMS6, ANIL K. GUPTA
7AND KATIE JOHNSON
1
ABSTRACT
A group of ,100 species of elongate, cylindrical deep-seabenthic foraminifera (families Stilostomellidae, Pleurosto-mellidae, Nodosariidae) with complex, often constrictedapertural structures, became extinct during increasingly coldglacial periods in the late Pliocene to mid-PleistoceneClimate Transition (MPT, ,2.6–0.6 Ma). We documentthe evolutionary history and architecture of this ExtinctionGroup (Ext. Gp) through the Cenozoic at four lower bathyal-upper abyssal Indian Ocean sites (ODP 722, 744/738, 758,763), seeking clues to the cause of this morphologically-targeted extinction episode late in the Cenozoic.
Eighty percent of the 116 Ext Gp. species present in theCenozoic of the Indian Ocean originated globally in theEocene or earlier, compared with 23–37% of other Quater-nary deep-sea foraminifera. The Ext. Gp had its peak speciesrichness and relative and absolute abundances in the lateEocene. The rapid warming of the Paleocene-Eocene ThermalMaximum, that resulted in a loss of 30–50% of deep-seaforaminiferal species, had no impact on the Ext. Gp in the oneIndian Ocean section (ODP 744/738) studied. MajorCenozoic changes in the Ext. Gp, including increased speciesturnover, changes in dominant species, a decline in abun-dance, loss in diversity, and finally extinction, mostlyoccurred during the middle Eocene to early Oligocene,middle to late Miocene, and late Pliocene to middlePleistocene. These were times of stepped increase in thevolume of polar ice, global oceanic cooling, surface-watereutrophication, seasonality of phytoplankton production,deep-water ventilation, and southern deep-water carbonatecorrosiveness. The final decline and disappearance of the Ext.Gp began in the late Miocene at high latitudes (744/738), butnot until the late Pliocene (758, 763) or MPT (722) at lowerlatitudes.
We hypothesize that the loss of the Ext. Gp of deep-seaforaminifera may have been caused by the decline or demiseof their specific food source (detrital phytoplankton orbottom-dwelling microbes) that was abundant in the Green-house World and was decimated by the stepwise cooling,
ventilation, or eutrophication of the oceans that began in themiddle and late Eocene.
INTRODUCTION
GLOBAL TURNOVERS IN CENOZOIC
DEEP-SEA FORAMINIFERA
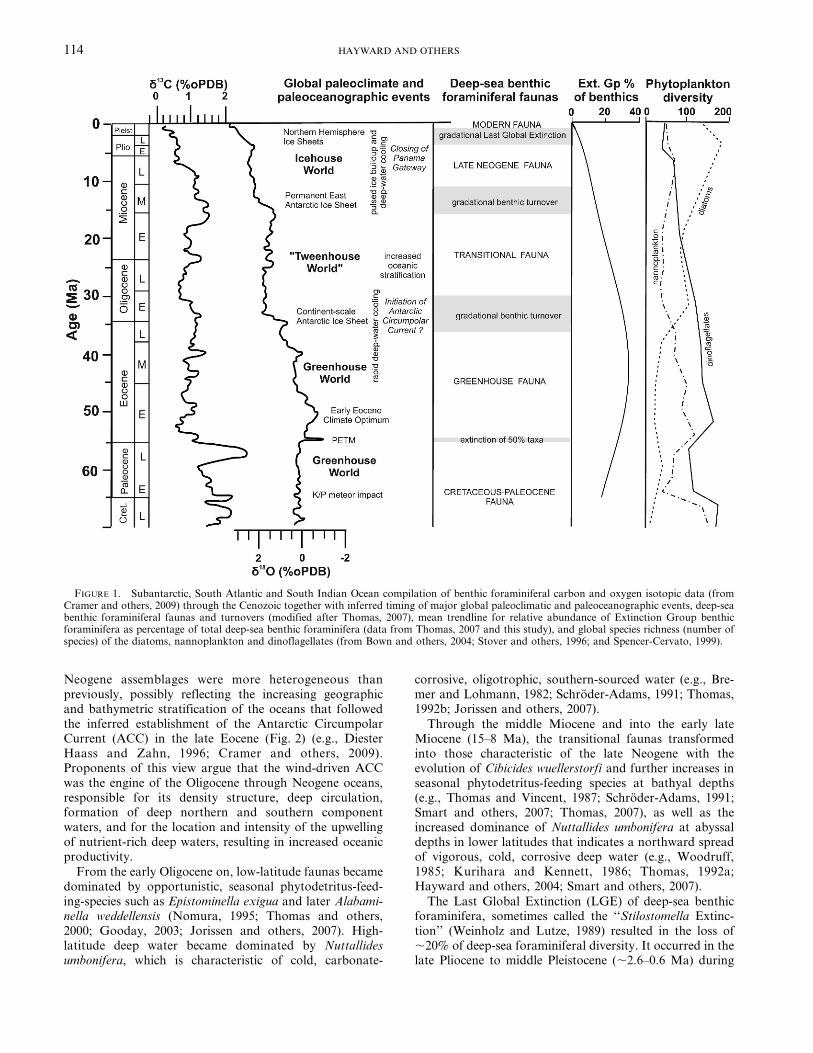
The Cenozoic fossil record of deep-sea benthic forami-nifera indicates that they had relatively slow backgroundspecies turnover rates of ,2% myr21 (Boltovskoy, 1987;McKinney, 1987; Kucera and Schonfeld, 2007). Within thisperiod, there are four intervals of enhanced global turnover(Fig. 1). Each has been related to times of significantclimate change (e.g., Thomas, 1992a; Miller and others,1993; Hayward and others, 2007; Thomas, 2007). Theseturnovers were during the Paleocene-Eocene ThermalMaximum event (PETM, ,55 Ma: Thomas, 1992a), thelate Eocene–early Oligocene (,36–30 Ma; Miller andothers, 1993), the middle Miocene (,16–12 Ma; Millerand others, 1993), and the late Pliocene to mid-PleistoceneClimate Transition (MPT) (2.6–0.55 Ma; Weinholz andLutze, 1989; Schonfeld, 1996; Hayward and others, 2007).
These turnovers were associated with increased numbersof species originations and extinctions, but also with majorchanges in the dominant deep-sea foraminiferal assem-blages and populations. Up to 50% of deep-sea species diedout across the PETM event (Thomas, 1998, 2007), possiblyassociated with the expansion of warm, oxygen-depleted,corrosive bottom waters (Katz and others, 1999). In aperiod of less than 10 kyrs, oceanic bottom temperatureswarmed by 5–6uC (Zachos and others, 2001, 2005) andtypical late Cretaceous-Paleocene faunal assemblages,dominated by Stensioeina beccariiformis, were replaced bylate Paleogene Greenhouse World assemblages, dominatedby Nuttallides truempyi and a variety of buliminids (e.g.,Tjalsma and Lohmann, 1983; Thomas, 1990; Kaiho andothers, 1996; Alegret and Ortiz, 2006; Takeda and Kaiho,2007; Thomas, 2007; Alegret and others, 2009).
The late Eocene-early Oligocene and middle Mioceneturnovers were more significant in terms of communitystructure but had fewer species originations or extinctions(e.g., Woodruff, 1985; Thomas, 1986, 1987; Thomas andothers, 2000). These occurred at times of strengtheningcirculation of cool, well-oxygenated bottom water andincreasing primary productivity and seasonality of phyto-plankton blooms in the oceans, coupled with global coolingdue to formation and growth of Antarctic ice sheets (e.g.,Thomas and Vincent, 1987; Thomas, 2007). Nuttallidestruempyi and many large buliminids disappeared at the endof the Eocene, replaced by faunal assemblages transitionalin composition between those of late Paleogene Greenhouseconditions and those of the late Neogene Icehouse World(Fig. 1) (e.g., Thomas, 1992a, b). The transitional and late
1 Geomarine Research, 49 Swainston Rd, St Johns, Auckland, NewZealand.
2 Department of Geology and Geophysics, Yale University, NewHaven, CT, USA.
3 Department of Earth and Environmental Sciences, WesleyanUniversity, Middletown, CT, USA.
4 Present address: Faculty of Education and Human Sciences,Yokohama National University, 79-2 Tokiwadai, Yokohama, Japan.
5 Faculty of Education, Shimane University, Nishikawatsu, Matsue690-8504, Japan.
6 Department of Earth Sciences, Carleton University, Ottawa,Ontario, Canada.
7 Department of Geology and Geophysics, Indian Institute ofTechnology, Kharagpur 721 302, India.
8 Correspondence author. Email: [email protected]
Journal of Foraminiferal Research, v. 40, no. 2, p. 113–133, April 2010
113
Neogene assemblages were more heterogeneous thanpreviously, possibly reflecting the increasing geographicand bathymetric stratification of the oceans that followedthe inferred establishment of the Antarctic CircumpolarCurrent (ACC) in the late Eocene (Fig. 2) (e.g., DiesterHaass and Zahn, 1996; Cramer and others, 2009).Proponents of this view argue that the wind-driven ACCwas the engine of the Oligocene through Neogene oceans,responsible for its density structure, deep circulation,formation of deep northern and southern componentwaters, and for the location and intensity of the upwellingof nutrient-rich deep waters, resulting in increased oceanicproductivity.
From the early Oligocene on, low-latitude faunas becamedominated by opportunistic, seasonal phytodetritus-feed-ing-species such as Epistominella exigua and later Alabami-nella weddellensis (Nomura, 1995; Thomas and others,2000; Gooday, 2003; Jorissen and others, 2007). High-latitude deep water became dominated by Nuttallidesumbonifera, which is characteristic of cold, carbonate-
corrosive, oligotrophic, southern-sourced water (e.g., Bre-mer and Lohmann, 1982; Schroder-Adams, 1991; Thomas,1992b; Jorissen and others, 2007).
Through the middle Miocene and into the early lateMiocene (15–8 Ma), the transitional faunas transformedinto those characteristic of the late Neogene with theevolution of Cibicides wuellerstorfi and further increases inseasonal phytodetritus-feeding species at bathyal depths(e.g., Thomas and Vincent, 1987; Schroder-Adams, 1991;Smart and others, 2007; Thomas, 2007), as well as theincreased dominance of Nuttallides umbonifera at abyssaldepths in lower latitudes that indicates a northward spreadof vigorous, cold, corrosive deep water (e.g., Woodruff,1985; Kurihara and Kennett, 1986; Thomas, 1992a;Hayward and others, 2004; Smart and others, 2007).
The Last Global Extinction (LGE) of deep-sea benthicforaminifera, sometimes called the ‘‘Stilostomella Extinc-tion’’ (Weinholz and Lutze, 1989) resulted in the loss of,20% of deep-sea foraminiferal diversity. It occurred in thelate Pliocene to middle Pleistocene (,2.6–0.6 Ma) during
FIGURE 1. Subantarctic, South Atlantic and South Indian Ocean compilation of benthic foraminiferal carbon and oxygen isotopic data (fromCramer and others, 2009) through the Cenozoic together with inferred timing of major global paleoclimatic and paleoceanographic events, deep-seabenthic foraminiferal faunas and turnovers (modified after Thomas, 2007), mean trendline for relative abundance of Extinction Group benthicforaminifera as percentage of total deep-sea benthic foraminifera (data from Thomas, 2007 and this study), and global species richness (number ofspecies) of the diatoms, nannoplankton and dinoflagellates (from Bown and others, 2004; Stover and others, 1996; and Spencer-Cervato, 1999).
114 HAYWARD AND OTHERS

increasingly colder glacial periods that accompanied growthof polar ice and further increases in primary productivity atlower latitudes (Hayward and others, 2007). Late Neogenefaunas were replaced by those essentially similar to modernfaunas, with the loss of elongate, cylindrical species duringthe LGE and the decline in previously abundant taxa, suchas reticulate-ornamented bolivinids, Rectuvigerina, Vulvu-lina, Trifarina bradyi, Bulimina exilis, Uvigerina hispida,Haeuslerella, and Bolivinita, to be replaced with increaseddominance at bathyal and upper abyssal depths byCassidulina carinata, Bulimina marginata aculeata, Nonio-nella, Trifarina angulosa, and Uvigerina peregrina (Mack-ensen and others, 1992; Nomura, 1995; Hayward, 2002;Hayward and others, 2004, 2007), and by Alabaminellaweddellensis (Kurihara and Kennett, 1986; Schroder-Adams, 1991; Yasuda, 1997; Hayward and others, 2004).
THE LAST GLOBAL EXTINCTION
(STILOSTOMELLA EXTINCTION)
During the LGE, ,20% (19 genera and 95 species) ofcosmopolitan, deep-sea (500–4000 m), benthic foraminiferalspecies (excluding unilocular taxa), belonging to threefamilies, became extinct. During the late Pliocene–middlePleistocene (3.0–0.12 Ma), one family (Stilostomellidae, 30species) was completely wiped out and a second (Pleur-ostomellidae, 29 species) was decimated, leaving just onespecies possibly surviving through to the present (Haywardand others, 2007). The peak of extinctions (76 species)occurred during the mid-Pleistocene Climate Transition(MPT, 1.2–0.55 Ma). Unlike the PETM deep-sea extinctionevent (MacLeod and others, 2000), this LGE preferentiallyimpacted specific foraminiferal morphologies (i.e., elongate,cylindrical, often uniserial tests) and types of apertures (e.g.,small rounded, dentate, cribrate, lunate).
In our recent studies on 23 deep-sea core sites, westandardised the previously chaotic taxonomy of theExtinction Group of taxa (Ext. Gp), thus allowing us todocument the global architecture of its populations throughthe late Pliocene–Recent (Hayward 2001, 2002; Kawagataand others, 2005; Hayward and others, 2006; Kawagata andothers, 2006, 2007; Hayward and others, 2007; O’Neill andothers, 2007; Hayward and others, 2009). These studies showwidespread, pulsed declines in abundance and diversity ofthe Ext. Gp during more extreme glacials, with only partialinterglacial recoveries. The declines started in the latePliocene in southern-sourced deep-water masses such asAntarctic Bottom Water (AABW) and Circumpolar DeepWater (CPDW), and extended into intermediate watermasses such as Antarctic Intermediate Water (AAIW) andNorth Atlantic Deep Water (NADW) during the MPT, withthe latest declines in sites farthest downstream from high-latitude source areas of intermediate waters.
RATIONALE FOR THIS STUDY
The underlying rationale for this study is to provide ananswer to this question: What caused the Last GlobalExtinction of foraminifera in the deep sea during increas-ingly cold glacial periods of the late Pliocene to mid-Pleistocene Climate Transition? Our approach to resolvingthis fundamental issue addresses the following:
1. Does the Cenozoic history of the Ext. Gp provide cluesas to why it became extinct during the most recentperiod of rapid global cooling?
2. Was the Ext. Gp comprised of taxa with a long historyof frequent turnovers?
3. Was the Ext. Gp impacted ‘‘preferentially’’ by theother periods of major, rapid global climate change.(i.e., the Paleocene–Eocene thermal maximum, theEocene–Oligocene cooling and the middle Miocenecooling)?
4. Were the Ext. Gp taxa some of the last remnants of theGreenhouse World deep-sea biota?
5. Has the decline of the Ext. Gp been accompanied by amajor change in the other dominant deep-sea benthicforaminiferal taxa since the end of the GreenhouseWorld?
FIGURE 2. Back-tracked location of ODP study sites and hypothe-sized deep-ocean circulation (from Cramer and others, 2009) in theearly Eocene (50 Ma), Oligocene (30 Ma) and late Miocene (10 Ma).Tectonic reconstructions are from ,http://www.serg.unicam.it/Intro-Reconstr.html.. ACC 5 Antarctic Circumpolar Circulation.
INDIAN OCEAN DEEP-SEA FORAMINIFERA 115
STUDY SITES
We chose four (one a composite of two nearby sites)deep-sea core sites at bathyal and abyssal depths spacedacross the Indian Ocean that had well-preserved benthicforaminiferal faunas and long Cenozoic records. Agemodels for the sequences have been recalibrated to thelatest International Commission on Stratigraphy’s timescale (Gradstein and others, 2004), with the base Quater-nary taken at 1.8 Ma, and divisions between the early,middle, and late Pleistocene defined at 0.78 and 0.126 Ma.
ODP Site 722
ODP Site 722 is located on the crest of Owen Ridge(16u379 N, 59u489 E, 2045 m present water depth) in thenorthwest Arabian Sea (Fig. 2). A 200-m-thick uppermostMiocene to Recent sequence of calcareous ooze and eolian-derived terrigenous sediment (Murray and Prell, 1991) wasrecovered (Table 1). Today the site is bathed in NorthIndian Deep Water (NIDW) with a high-salinity core layer(temperature 2uC, salinity 35.85 psu, oxygen 4.7 ml/l)originating from saline NADW (Vincent, 1974; Kawagataand others, 2006). The age model for this site combines theastronomically tuned, planktic oxygen-isotope-based modelfor the last ,3.7 Ma of Clemens and others (1996) with theoriginal biostratigraphic model (Prell and others, 1989).The Last Global Extinction has been documented in detailthrough the Pleistocene at Site 722 (Kawagata and others,2006) and those data are incorporated into this study.
ODP Site 758
ODP Site 758 is located on the northern end ofNinetyeast Ridge (5u239 N, 90u229 E, 2925 m present waterdepth) in the southern Bay of Bengal. A nearly continuous,250-m-thick sequence from uppermost Eocene to Recentsequence (short hiatus in middle Miocene) plus a 50-m-thick Paleocene sequence of calcareous ooze and chalk(Pierce and others, 1989) were recovered (Table 1). Todaythe site is bathed in NIDW, originating from CPDWadmixed with NADW (Warren, 1981). The age model forthis site combines the original biostratigraphically-basedmodel of Pierce and others (1989) with the astronomically-tuned, benthic oxygen-isotope-based model for the last,3.6 myrs of Chen and others (1995). Previous works onthe total benthic foraminiferal faunas of Site 758 has been
undertaken by Nomura (1995) on all of the, full Cenozoicsequence) and by Gupta and Thomas (2003)on the, upperMiocene-Pleistocene sequence). The Last Global Extinctionhas been documented in detail through the late Plioceneand Pleistocene in Site 758, (Kawagata and others, 2006)and their data have been incorporated into our study.
ODP Site 763
ODP Site 763 is located on the western side of theExmouth Plateau (20u359 S, 112u139 E, present water depth1367 m) off northwest Australia (Fig. 2). A near contin-uous, 250-m-thick sequence of middle Eocene-Recent (shortmiddle-Miocene hiatus) calcareous ooze (Haq and others,1990) was sampled. Today the site is bathed in the upperpart of NIDW, originating from Circumpolar Deep Water(CPDW) admixed with NADW (Warren, 1981). The agemodel is based on nannofossil biostratigraphy (Siesser andBralower, 1992) and late Neogene planktic foraminiferalbiostratigraphy (Sinha and Singh, 2008). Previous work onbenthic foraminifera at this site has recognized fourbiostratigraphic zones through the Pliocene-Pleistocene(Rai and Singh, 2004).
ODP Sites 738 and 744
ODP sites 738 (62u439 S, 82u479 E) and 744 (61u359 S,80u359 E) are located at the southern end of the KerguelenPlateau in the southern Indian Ocean, at present waterdepths of 2253 m and 2308 m respectively. To obtain a long
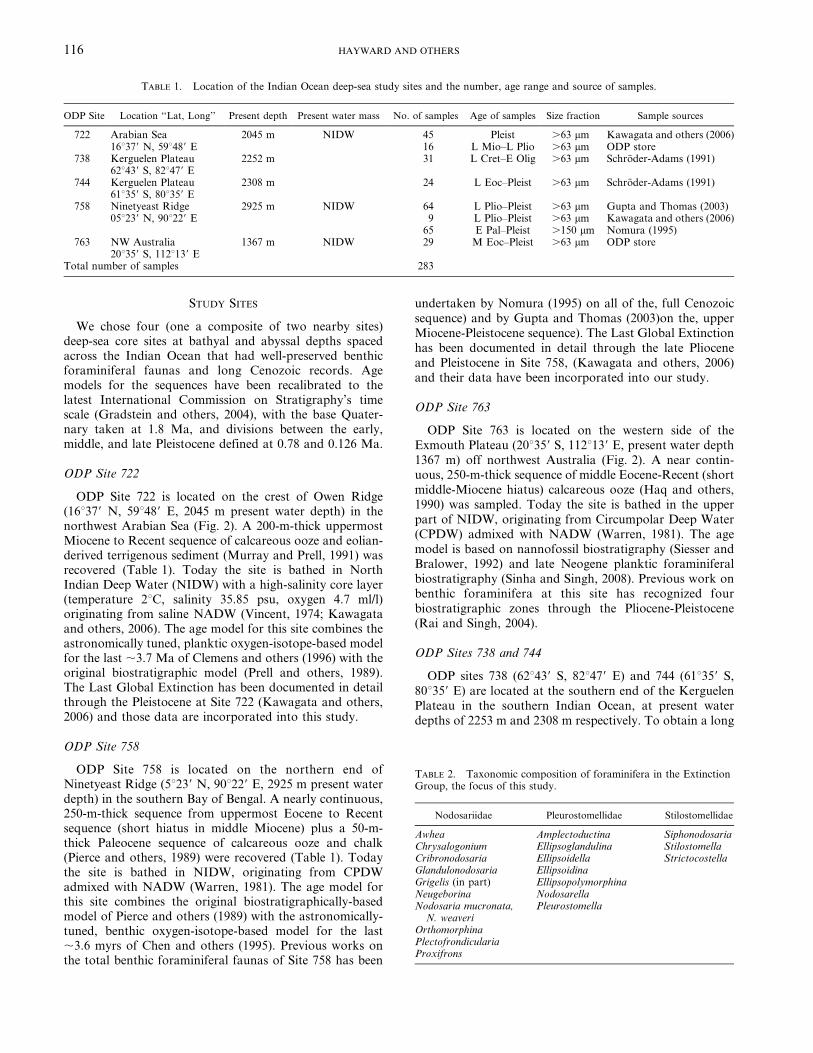
TABLE 1. Location of the Indian Ocean deep-sea study sites and the number, age range and source of samples.
ODP Site Location ‘‘Lat, Long’’ Present depth Present water mass No. of samples Age of samples Size fraction Sample sources
722 Arabian Sea 2045 m NIDW 45 Pleist .63 mm Kawagata and others (2006)16u379 N, 59u489 E 16 L Mio–L Plio .63 mm ODP store
738 Kerguelen Plateau 2252 m 31 L Cret–E Olig .63 mm Schroder-Adams (1991)62u439 S, 82u479 E
744 Kerguelen Plateau 2308 m 24 L Eoc–Pleist .63 mm Schroder-Adams (1991)61u359 S, 80u359 E
758 Ninetyeast Ridge 2925 m NIDW 64 L Plio–Pleist .63 mm Gupta and Thomas (2003)05u239 N, 90u229 E 9 L Plio–Pleist .63 mm Kawagata and others (2006)
65 E Pal–Pleist .150 mm Nomura (1995)763 NW Australia 1367 m NIDW 29 M Eoc–Pleist .63 mm ODP store
20u359 S, 112u139 ETotal number of samples 283
TABLE 2. Taxonomic composition of foraminifera in the ExtinctionGroup, the focus of this study.
Nodosariidae Pleurostomellidae Stilostomellidae
Awhea Amplectoductina SiphonodosariaChrysalogonium Ellipsoglandulina StilostomellaCribronodosaria Ellipsoidella StrictocostellaGlandulonodosaria EllipsoidinaGrigelis (in part) EllipsopolymorphinaNeugeborina NodosarellaNodosaria mucronata,
N. weaveriPleurostomella
OrthomorphinaPlectofrondiculariaProxifrons
116 HAYWARD AND OTHERS

Cenozoic record a continuous 170-m-thick upper Eocene-Recent calcareous ooze sequence from Site 744 was splicedto the top of a 190-m-thick middle-upper Eocene nanno-fossil ooze sequence recovered from Site 738 (e.g.,Schroder-Adams and others, 1991). Both sites are southof the polar front and bathed in CPDW (Lindenberg andAuras, 1984). The age model is based on the biostratig-raphy of Barron and others (1991) and Huber (1991).
METHODS
SAMPLE PROCESSING
Core sites were selected for their long Cenozoiccarbonate-rich records from lower bathyal-middle abyssaldepths (1000–4000 m) with common Ext. Gp specimens.Samples were selected to span as much of the Cenozoic aspossible at each studied site (Table 1). Approximately20 cm3 of dry sediment was weighed, washed gently withwater over a 63mm sieve, and the retained sand fraction wasdried. Samples washed but not picked for the benthicforaminiferal study of Schroder-Adams, (1991) were usedfor Site 744/738.
CENSUS COUNTS
Each sample was dry-sieved, and three size fractions(.300 mm, 150–300 mm, 63–150 mm) were picked andseparately counted. The amount searched for every samplewas 100% of the .300-mm fraction and, depending uponthe quantity of sand in the other size fractions, 50–100% ofthe 150–300-mm fraction and 5–50% of the 63–150-mmfraction (using a sample splitter). The quantitative censuscounts were subsequently multiplied up to the number ofspecimens in the total sample and standardized as speci-mens g21 sediment (bulk sediment). For most samples fromSite 758, we used Nomura’s (1995) quantitatively pickedslides of ,300 benthic foraminifera (.63 mm) to obtain aninitial census of Ext. Gp species and their relativeabundance as a percentage of the total benthic foraminif-eral faunas. These were supplemented by additionalpicking, especially of the coarser fractions (as above). Alldata were multiplied up and combined to providestandardized absolute abundance data.
The benthic foraminiferal census counts were selectiveand designed to target just Ext. Gp (Table 2) species, whichare readily distinguished by their generally elongate tests.
FIGURE 3. Stratigraphic records of absolute abundance of the more common Extinction Group species (specimens g21 sediment) in ODP Site 722.
INDIAN OCEAN DEEP-SEA FORAMINIFERA 117

All Ext. Gp specimens encountered were picked from eachsplit fraction and mounted on gummed slides for more preciseidentification and counting. Census counts were convertedinto absolute abundances (specimens g21 sediment) and fluxrates (flux 5 specimens cm22 kyr21) using sample dry bulkdensity, weights, and calculated sedimentation rates (cmkyr21). The majority of the Ext. Gp comprises large specieswith their populations mostly found in the .150-mm fractions(Hayward and others, 2006, which were more comprehen-sively examined than the finest fraction, where only 5–10 Ext.Gp species were present. The total number of benthicforaminifera and extant uniserial nodosariids in a split ofunsieved sample was also counted and used in calculations ofrelative abundance in the Ext. Gp and total uniserialnodosariids as percentages of benthic foraminifera. Previoushigher-resolution Ext. Gp census results from the upperPliocene and Pleistocene of sites 722 and 758 (Kawagata andothers, 2006) obtained by the same methodology were usedfor the youngest parts of these two sites.
COMPUTER METHODS
The faunal data consist of census counts (0–3120specimens per sample) of 116 Ext. Gp foraminiferal species
from 283 samples (Appendices 1–5). For cluster analysisonly the 172 samples with more than 50 Ext. Gp specimenswere used. The data matrix was standardized by convertingcounts to percentages of sample totals. A Q-mode clusteranalysis dendrogram classification was produced using thechord dissimilarity coefficient (Sneath and Sokal, 1973).The analysis was carried out using the MVSP statisticalpackage (Kovach, 1993).
SPECIMEN ARCHIVING
Picked slides of Ext. Gp specimens used for census countsand figured specimens (prefixed by BWH) are housed in thecollections of the Institute of Geological and NuclearSciences, Lower Hutt, New Zealand.
CENOZOIC HISTORY AND ARCHITECTURE OFTHE EXTINCTION GROUP
The stratigraphic range and absolute abundance of themore common Ext. Gp species are shown for each of thestudy sites in Figs 3–6. A total of 117 Ext. Gp taxa wereidentified from the Cenozoic of the Indian Ocean (Appen-dix 1). Site 722 has the lowest species richness (65 spp.)
FIGURE 4. Stratigraphic records of absolute abundance of the more common Extinction Group species (specimens g21 sediment) in ODP Site 758.
118 HAYWARD AND OTHERS

because of its short stratigraphic range (5.6–0 Ma). In theother three sites there was a latitudinal increase in speciesrichness from polar Site 744/738 (73 spp.) through Site 763(82 spp.) to equatorial Site 758 (91 spp.), although thislatter site also had a greater intensity of sampling (138samples; Table 1). Eighty percent of the 110 Ext. Gp speciesknown globally from the Pliocene–Pleistocene are recordedfrom the Indian Ocean. Ten of those not recorded areclassified in the subfamily Plectofrondiculariinae, known tobe more prevalent in shallower water (outer shelf-midbathyal) than our sites.
ABSOLUTE ABUNDANCE AND FLUX
The absolute abundance (specimens g21 sediment) and flux(specimens cm22 kyr21) of the Ext. Gp (Fig. 7) wereconsiderably greater at the two shallowest sites (722, 763).Ext. Gp absolute abundance and flux in the Paleocene wasapproximately half the maximum values for the late Eocene–Oligocene (sites 744/738, 758). At two sites (744/738, 763)there was a progressive overall decline in abundance fromOligocene onwards, but the decline occurred later at Site 758,from the middle Miocene on. The abundance and fluxfluctuated wildly during the glacial-interglacial cycles at sites
722 and 758, with peak abundances during interglacials(Kawagata and others, 2006), and final disappearances ofthe Ext. Gp at all sites in the middle Pleistocene. Thisdisappearance is particularly well documented from high-resolution sampling through the Pleistocene at sites 722 and758 (Kawagata and others, 2006).
RELATIVE ABUNDANCE
The abundance of the Ext. Gp as a percentage of totalbenthic foraminifera (Fig. 7) was considerably higher atabyssal sites 744/738 and 758 (up to 45–60%) than at bathyalSite 763 (up to 17%). The most complete Cenozoic record(Site 744/738) had fairly low relative abundances of 5–25% ofthe Ext. Gp under Greenhouse World conditions (Paleo-cene–early Eocene), increasing rapidly to a peak of 20–55%
during the middle Eocene–early Oligocene. Abundancesdeclined stepwise in the middle Oligocene (to 10–27%),middle Miocene (to 4–17%), and late Miocene (to ,4%).
The relative abundance pattern at Site 758 (allowing forthe missing Eocene section) was remarkably similar to that atSite 744/738 (Fig. 7). Abundances peaked in the late Eocene(10–50%), then declined across the Eocene/Oligoceneboundary to 10–27% in the Oligocene–early Miocene. There
FIGURE 5. Stratigraphic records of absolute abundance of the more common Extinction Group species (specimens g21 sediment) in ODP Site 763.
INDIAN OCEAN DEEP-SEA FORAMINIFERA 119

were two further stepped declines in the middle Miocene, oneclose to the middle-Miocene cooling event (,14 Ma), and theother in the late Miocene (,7.5 Ma). In the late Miocene–Pliocene relative abundances of the Ext. Gp were 2–10%, ascompared to less than 3% in the Pleistocene.
At Site 763, the peak relative abundance of the Ext. Gp(5–13%) was in the latest Eocene to earliest Miocene,declining to less than 3% from the late early Miocenethrough to their disappearance in the MPT (Fig. 7).
If the Ext. Gp is broken into its three main families(Pleurostomellidae, Stilostomellidae, Nodosariidae), wefind that pleurostomellids were generally more abundantat Site 758 (up to 25% compared with ,8% at other sites)and stilostomellids were more abundant in sites 744/738 (upto 55% compared with ,20% at other sites). At all threesites, the relative abundance of stilostomellids followed apattern similar to that of the total Ext. Gp (Fig. 8), withincreasing values from the late Cretaceous and Paleocene toa peak in the middle Eocene–earliest Miocene, followed bya progressive decline from the middle Miocene on. In thepleurostomellids, the pattern is less pronounced with aslight increase in relative abundance from the Paleoceneinto the Eocene, followed by a relatively flat peak through
the Eocene and Oligocene (Site 744/738), which extendedthrough the early Miocene at Site 758. A significant drop inabundance occurred at the start of the early Miocene at Site744/738 and at the start of the middle Miocene at Site 758,after which there was a slow, progressive decline to theextinction in the middle Pleistocene. The uniserial nodosar-iids (which includes many extant species) had their peakrelative abundance from the Paleocene through to the earlyOligocene followed by a significant drop to abundances ofless than 6% since the late Oligocene, progressivelydeclining still further from the late Miocene to the present.
SPECIES TURNOVER
The plots of Ext. Gp species richness (number of speciesin each sample) and overall species number (number ofspecies present at any time, assuming continuous presencebetween a species’ lowest and highest occurrences) for thefour sites (Fig. 9) show only one interval of significantspecies turnover – the LGE. At the site (744/738) with thelongest continuous Cenozoic record, there was a gradualincrease in species richness and overall species numberthrough the Paleocene and early Eocene, peaking at 40
FIGURE 6. Stratigraphic records of absolute abundance of the more common Extinction Group species (specimens g21 sediment) in ODP Site 744/738.
120 HAYWARD AND OTHERS

species overall in the late Eocene. Species loss began in theOligocene (11 spp.), with increased tempo of loss in the lateMiocene (15 spp.). Just five species survived into thePliocene, only to disappear completely in the MPT. At Site763, peak species richness and number (48 spp.) alsooccurred in the late Eocene-earliest Oligocene, and wasfollowed by moderate declines during the Oligocene–Miocene (10 spp. loss) and Pliocene (6 spp.), then loss ofthe remaining taxa (32 spp.) in the Pleistocene LGE.
The greatest Ext. Gp species richness occurred at Site758, with its peak of overall species number (57–59 spp.)during the Oligocene-early Miocene (Fig. 9). A few speciesdisappeared during the middle Miocene (4 spp.), withincreased loss in the late Miocene (11 spp.), and earlyPliocene (9 spp.). The final 35 species disappeared duringthe late Pliocene-middle Pleistocene LGE. In the shortPliocene–Recent record of Site 722, the peak Ext. Gpspecies richness (31 spp. per sample) and overall speciesnumber (50 spp.) occurred in the early Pleistocene, with thedramatic loss of all these species in the LGE.
In Site 744/738, with the longest Cenozoic record, there isevidence for a late Eocene interval of increased turnover ofthe Ext. Gp (increased number of lowest occurrences [LOs],and highest occurrences [HOs]) followed by a relatively
stable rate of turnover (Fig. 10). This same late Eocene peakin HOs is evident in Site 763, but the peak of LOs at this timemerely reflects the start of sampling. Upper Eocene strata arenot present in the other two sites. At the deeper Site 758,there is evidence for significantly increased turnovers in thenumber of LOs and especially HOs in the middle and lateMiocene (Fig. 10). This turnover began later in Site 763, withincreased LOs and HOs in the late Miocene. The majorincrease in HOs in the Pliocene-Pleistocene LGE is the mostobvious turnover event at sites 763, 758 and 722, with theonset later (in the Pleistocene) at Site 722 than at the othertwo sites. Part of this last turnover also includes an increasein the number of LOs in the Pliocene at these three sites(Fig. 10), but not at Site 744/738.
When all our Indian Ocean data are combined, two peaksof LOs of Ext. Gp species are evident (Fig. 11) – in thePaleocene and the middle–late Eocene. The Paleocene peakis likely to be more evenly spread throughout the lateCretaceous (as evidenced by the number of Ext. Gp specieswith Cretaceous LOs – Fig. 11), which might have beenclear if we had studied more Cretaceous samples, but themiddle-late Eocene peak appears to have been global. Thelate Eocene peak of HOs at sites 744/738 and 763 was local,not ocean-wide. Similarly, the middle–late Miocene increase
FIGURE 7. Stratigraphic records of the absolute abundance, accumulation rate (specimens cm22 kyr21) and relative abundance (% of total benthicforaminifera) of the total Extinction Group through the Cenozoic at each study site.
INDIAN OCEAN DEEP-SEA FORAMINIFERA 121

FIGURE 8. Stratigraphic record of the relative abundance of the families Stilostomellidae, Pleurostomellidae, uniserial Nodosariidae (includesextinct and extant species) and the total Extinction Group (Table 2) at Indian Ocean sites 744/738, 763 and 758 (this study), compared with the NorthAtlantic (Site 608), equatorial Pacific (sites 573, 574, 575, 865), and Southern Ocean (sites 689, 690) (from Thomas, 2007).
122 HAYWARD AND OTHERS

in HOs at Site 758 were not ocean-wide (Fig. 10). Theincrease in LOs in the late Miocene and especially Plioceneat sites 758 and 763 (Fig. 10) appears to have been morewidespread in the Indian Ocean, but it was not global(Fig. 11). The major increase in HOs in the late Pliocene-middle Pleistocene (LGE) is the dominant feature of theCenozoic history of the Ext. Gp, with 75 species (64% ofExt. Gp) disappearing from the Indian Ocean at this time(Fig. 11). The recorded global extinction of Ext. Gp speciesis skewed more towards the middle Pleistocene, probablybecause there have been more studies in Intermediate Watersites in other oceans (Hayward and others, 2007).
SPECIES DURATION
The Indian Ocean data on the timing of Ext. Gp speciesLOs are skewed towards the Paleocene (Fig. 11) because fewCretaceous samples were examined in this study. A largeproportion 80% (93 spp.) of the Ext. Gp species have globalGreenhouse World (Eocene or earlier) LOs, and this includesthe majority (67%, 78 spp.) of Ext. Gp species in the IndianOcean (Fig. 11). Five percent of Ext. Gp species seem to have
evolved globally since the middle-Miocene cooling (IcehouseWorld), with the remaining 15% having originated duringthe Oligocene-early Miocene (Tweenhouse World). Thesame pattern of LOs is apparent for the group of Ext. Gpspecies that became extinct in the Pliocene–Pleistocene in theIndian Ocean (Fig. 11b) and for a separate group of 91 Ext.Gp species recorded in Boltovskoy’s (1987) global study ofdeep-sea foraminifera (Fig. 11a).
The dominance of Ext. Gp species with originations inthe Greenhouse World contrasts with the more evenlyspread originations of extant deep-sea benthic foraminiferalspecies across the Cenozoic epochs (Figs 11c–d). In theselatter instances, 23–37% of extant species had LOs in theCretaceous-Eocene interval. An adjunct observation fromthis data is that the Ext. Gp had longer mean speciesdurations than the extant deep-sea group.
FAUNAL COMPOSITION
On the chord cluster analysis dendrogram of Ext. Gp datain all samples with more than 50 Ext. Gp specimens, werecognize nine Ext. Gp associations (Appendices 6–7). These
FIGURE 9. Stratigraphic records of the number of Ext. Gp species recorded in each sample and total number of Ext. Gp species inferred to havebeen present (assuming continuous presence between lowest occurrence (LO) and highest occurrence (HO) of each species) through the studiedintervals at each site.
INDIAN OCEAN DEEP-SEA FORAMINIFERA 123

associations have strong stratigraphic and weaker geo-graphic and bathymetric distribution patterns (Fig. 12).Three associations (1–3) were mainly present in the Green-house World, two (4–5) in the Tweenhouse World (Oligo-cene–early Miocene), and four (6–9) in the Icehouse World.
Low-diversity assoc. 1, strongly dominated by Stricto-costella matanzana (Figs. 14.26–14.27), only occurred in thePaleocene and earliest Eocene in the subantarctic IndianOcean(744/738), and was not impacted by the PETM deep-sea extinction event. Assoc. 2, co-dominated by S.matanzana and Siphonodosaria subspinosa (Figs. 14.20–14.21), occurred predominantly in the latest Cretaceous–Eocene of the subantarctic, but also in the Paleocene andlate Eocene deep-water of Site 758 (Fig. 12).
Assoc. 3, dominated by small, spine-bearing Strictocos-tella pseudoscripta (Figs. 14.22–14.23), was present in thesubantarctic from early Eocene to earliest Miocene and alsoin the late Eocene of Site 763. High-diversity assoc. 4, co-dominated by Pleurostomella acuta (Figs. 14.10–14.12) andSiphonodosaria lepidula (Fig. 14.16–14.17), was the majorfaunal group in the Oligocene–middle Miocene of Site 758,
although it also extended into the Pliocene (Fig. 12). Assoc.5, dominated by Strictocostella hyugaensis, (Figs. 14.24–14.25) occurred in the Miocene of sites 763 and 744/738,with one sample in the upper Oligocene of the former site.
Assoc. 6, which is also diverse, is dominated by S. lepidula,Pleurostomella tenuis (Figs. 14.13–14.15), and Cribronodo-saria stimulea (Figs. 3–4), and occurred in the upperMiocene–Pliocene of sites 758 and 763, with one Oligocenesample at each site (Fig. 12). Associations 7 and 9 bothoccurred in the two shallowest sites 722 and 763. Assoc. 7,dominated by Strictocostella sharbergeana, S. matanzana,and S. lepidula, was present from the late Miocene to earlyPleistocene at both sites and sporadically back to theOligocene at Site 763 (Fig. 12). Small assoc. 8, co-dominatedby Pleurostomella incrassata and Siphonodosaria pomuligera(Figs. 14.18–14.19), was rare in the middle Miocene andPliocene of the deepest Site 758. Small, low-diversity assoc. 9,co-dominated by Pleurostomella acuminata (Figs. 7–9) andS. matanzana, only occurred near the end of the LGE close tothe early/middle Pleistocene boundary (0.78 Ma), after manyof the other Ext. Gp species had disappeared.
FIGURE 10. Stratigraphic records of the number of lowest occurrences (LOs) and highest occurrences (HOs) per 1 myrs and per 5 myrs of Ext. Gpspecies through the studied intervals at each site.
124 HAYWARD AND OTHERS

DISCUSSION
GLOBAL PATTERN OF EXTINCTION GROUP’SRELATIVE ABUNDANCE
The global relative abundance for the Ext. Gp throughthe Cenozoic, as revealed in seven deep-sea sites (Thomas,2007) together with this study’s Indian Ocean sites 744/738and 758, increased through the Paleocene and early EoceneGreenhouse World to a middle-late Eocene peak (Ext. Gpup to 60–70%; Stilostomellidae up to 40–70%), followed bya gradual or pulsed decline (Fig. 8). Pleurostomellidsincreased in relative abundance through the Paleocene toa long Eocene–early Miocene peak of up to 10–25%. Arapid decline occurred at the start of the middle Miocene,followed by a more gradual decline through to the middlePleistocene. Uniserial nodosariids had peak abundances inthe late Paleocene–Eocene (up to 12–25%) with a significantdecline in the late Eocene–early Oligocene, then a moregradual decline after the middle Miocene (Fig. 8). In thePaleocene–Eocene, stilostomellids appear to have beenmore abundant in the Southern Ocean (including Site744/738) than elsewhere at high latitudes, whereas pleur-ostomellids and uniserial nodosariids were more abundantat lower latitudes, especially since the middle Eocene. Therelative abundance of the Ext. Gp in Site 763 through theCenozoic is among the lowest recorded at any deep-sealocation, but the reason for this not yet clear.
TIMING OF EXTINCTION GROUP CHANGES
The major global turnovers in deep-sea benthic foraminif-eral faunas (Fig. 1) have also been recorded in the Indian andSouthern oceans (e.g., Gupta and Srinivasan, 1990; Schroder-Adams, 1991; Thomas, 1992b; Nomura, 1995; Smart and
others, 2007). These turnovers were associated with stepwiseclimatic and oceanographic changes that resulted in increasedNeogene faunal complexity as the geographic and bathymetricstratification of the oceans developed (e.g., Thomas, 2007). Inthe northern Indian Ocean, deep-sea foraminiferal faunaswere additionally influenced by the late Miocene (,8 Ma)onset of the seasonal tropical monsoons, which led toincreased oceanic primary productivity and locally decreasedlevels of bottom-water oxygen (e.g., Gupta and Thomas,2003; Singh and Gupta, 2004).
Paleocene-Eocene Thermal Maximum (PETM)
In the section across the PETM that we studied (Site 744/738), there were no impacts on the Ext. Gp. This contrastswith the reported 30–50% loss of total deep-sea benthicforaminiferal diversity and major changes in dominantfaunal assemblage composition (e.g., Kaiho and others,1996; Thomas, 1998). These earlier studies did not includeinformation on the Ext. Gp. taxa at the species level; thegroup as a whole showed short-term decline in relativeabundance during the PETM, but recovered afterwards.
Middle Eocene–Early Oligocene Cooling
In the Subantarctic (744/738), changes in the Ext. Gpfaunal dominants (from assocs. 1 and 2 to assoc. 3) occurredin the middle Eocene (,47–40 Ma; Fig. 12), coincident withreported accelerated extinctions of other benthic foraminiferain the subantarctic Weddell Sea (Thomas, 1989, 1992b)during initial global cooling after the early Eocene climateoptimum (Zachos and others, 2001). This was a time ofincreased oceanic primary productivity (Diester-Haass, 1995;Thomas and others, 2000; Diester-Haass and Zahn, 2001;Schumacher and Lazarus, 2004) and the onset of increased
FIGURE 11. Left. Number of lowest (LO) and highest (HO) occurrences per epoch or part-epoch of Ext. Gp species in the Indian Ocean(Appendix 6) compared with the current state of knowledge globally (pers. unpubl. data). Right. Percentage of Ext. Gp species with global LOs inspecified epochs or part epochs from: a. global deep-sea data set of Boltovskoy (1987), b. the present Indian Ocean study (species with Indian OceanHOs of Pliocene or Pleistocene). Percentage of extant deep-sea benthic foraminifera with global LOs in specified epochs or part epochs from: c. globaldeep-sea data set of Boltovskoy (1987), d. New Zealand deep-sea data set of Hayward and others (in press).
INDIAN OCEAN DEEP-SEA FORAMINIFERA 125

diatom abundance and diversity that now contribute half ofexport productivity in modern oceans (Falkowski and others,2004a, b), and decreased nannoplankton diversity (Fig. 1)(e.g., Aubry, 1992; Bown, 2005). These would have resulted inmajor changes in the amount and composition of the foodflux for Greenhouse World deep-sea benthic communities(e.g., Thomas and Gooday, 1996).
Globally, there seems to have been a slight increase in Ext.Gp originations in the middle-late Eocene period of cooling(Fig. 11). The late Eocene–early Oligocene global deep-seabenthic turnover (Fig. 1) coincided with a slightly increasedturnover (both LOs and HOs) of Ext. Gp species in the twoIndian Ocean sites studied (744/738, 763). There was asignificant decrease in the relative abundances of Ext. Gp,stilostomellids, and uniserial nodosariids in the Indian Ocean(744/738, 758) and globally (Figs. 7–8). The overall characterof the dominant Ext. Gp faunas did not change through thisinterval in the Subantarctic (Assoc. 3, Site 744/738), but it didchange farther north (sites 758, 763), with the switch to morediverse assocs. 4, 6, and 7 faunas. Thus the Ext. Gp appears
to have been significantly impacted during the first of theglobal turnovers (late Eocene-early Oligocene), althoughExt. Gp changes started somewhat earlier (middle Eocene) athigher latitudes (744/738), possibly associated with the firstevidence of ACC development and resulting Antarctic ice(e.g., Diester Haass and Zahn, 1996).
Late Oligocene–Early Miocene Transitional Faunas
The late Oligocene–early Miocene was a fairly stable timefor the transitional deep-sea benthic faunas globally(Fig. 1). There were however a few changes in the Ext.Gp in the Indian Ocean through this 10 myr interval. In theSubantarctic (744/738) there was a switch from dominantassoc. 3 to assoc. 5 faunas – a change that occurred earlierin lower latitudes (Fig. 12). The long-term decline in theoverall number of Ext. Gp species began in this period andwas earlier in high latitudes than low latitudes (lateOligocene at Site 744/738, early Miocene at Site 763, middleMiocene at Site 758; Fig. 9).
FIGURE 12. Stratigraphic distribution of the nine faunal associations (1–9) in the four ODP study sites. Solid bars represent more than onesample, small squares represent single sample records.
126 HAYWARD AND OTHERS

Middle Miocene Cooling
There was no apparent increased faunal turnover (LOs,HOs) of the Ext. Gp in the Indian Ocean at this time, butthere was a major decline in its absolute abundance, flux,relative abundance, and species richness in the subantarctic(744/738) and in the relative abundance in the northern(758) and equatorial Indian Ocean (Smart and others,2007), and globally (Fig. 8).
Late Miocene Cooling
There were late Miocene switches in the dominant speciesof Ext. Gp faunas in the east Indian Ocean from assoc. 5 toassocs. 6 and 7 (Fig. 12) but only a small increase inturnover rate (Fig. 10). In the Subantarctic (744/738),declines in Ext. Gp species richness and overall speciesnumber began in the middle and late Miocene respectively,considerably earlier than in lower latitudes (Fig. 9). Thelate Miocene is not noted as a time of global faunal changein the deep-sea, but significant benthic foraminiferal faunalchanges at bathyal depths in the northern Indian Ocean at,8 Ma have been attributed to the onset of tropicalmonsoons (e.g., Singh and Gupta, 2004). We infer however,that Ext. Gp changes, including significant declines inrelative abundance, that occurred at our study sites weremost probably associated with the inferred increasedproduction of corrosive, deep Antarctic Bottom Water(AABW), which may have circulated northwards at abyssalto lower-bathyal depths in the late Miocene (e.g., Nomura,1995; Smart and others, 2007).
Late Pliocene–Mid-Pleistocene Climate Transition, LastGlobal Extinction
The terminal decline in overall Ext. Gp species numbersthat began in the late Miocene in the Subantarctic wascompleted there during the late Pliocene–Pleistocene(Fig. 9). This decline in overall number of species (loss of74 spp., Fig. 11) began in the late Pliocene (,2.6 Ma) atsites 758 and 763 in the northeast Indian Ocean, but did notbegin until onset of the MPT (,1.2 Ma) in somewhatshallower water in the northwest Indian Ocean (Site 722).The Ext. Gp associations did not change through the latePliocene–early Pleistocene in any of our study sites(Fig. 12), with the only switch (to low-diversity assoc. 9)occurring in the early–middle Pleistocene, when manyspecies disappeared from the two shallower sites (722, 763).
In their high-resolution study of deep Site 758 in thenorthern Indian Ocean, Kawagata and others (2006)recorded a stepped decline in Ext. Gp abundance anddiversity at ,2.5, 1.7, and 1.2 Ma. They inferred that theseglacial declines were a result of increased production ofcolder, well-ventilated AABW which flowed northwardsover the site during pulsed increases of southern polar icesheet volume (e.g., Elmstrom and Kennett, 1986; Froelichand others, 1991; Hodell and Venz, 1992). The Ext. Gp didnot decline at shallower, intermediate water depths (Site722) until the onset of the MPT, when the volume of cold,well-ventilated Glacial North Atlantic Intermediate Water(GNAIW) increased and spread into the Indian Ocean (e.g.,Boyle, 1997; Kallel and others, 1988).
FIGURE 13. Mean relative abundance and standard deviation of the common Ext. Gp species (as proportion of the total Ext. Gp census count) infaunal associations 1–9, selected from the chord cluster analysis dendrogram (Appendix 8).
INDIAN OCEAN DEEP-SEA FORAMINIFERA 127

FIGURE 14. SEM images of a selection of the Extinction Group species from the Indian Ocean study sites 763, 758, and 738. Scale bar indicates100 mm, unless otherwise labeled. All units are in mm. 1–2 Cribronodosaria deceptoria (Schwager, 1866). Side and apertural views, BWH 182/1, sample763A-3H-4, 0–4 cm. 3–4 Cribronodosaria stimulea (Schwager, 1866). Apertural and side views, BWH 182/3, sample 763A-5H-CC. 5–6 Nodosarellatuberosa (Gumbel, 1868). Apertural and side views, BWH 182/5, sample 758A-25X-1, 76–78 cm. 7–9 Pleurostomella acuminata (Cushman, 1922). Side,apertural, and front views, BWH 182/12, sample, 763A-4H-CC. 10–12 Pleurostomella acuta (Hantken, 1875). Side, apertural, and front views, BWH182/6, sample 758A-17X-3, 75–80 cm. 13–15 Pleurostomella tenuis (Hantken, 1883). Side, apertural, and front views, BWH 182/13, sample 758A-10H-1,
128 HAYWARD AND OTHERS

The major decline and loss of the Ext. Gp in the latePliocene–MPT coincided with significant changes in thetotal deep-sea benthic faunas globally. These have beenattributed to intensified cooling combined with increasedupwelling and primary productivity, and in places increasedstrength of tropical monsoons (e.g., Gupta and Thomas,2003).
CAUSE OF THE DECLINE AND LOSS OF THE
EXTINCTION GROUP
Survival of the Ext. Gp virtually unscathed through thePETM implies that species of this group tolerated warm,possibly and locally oxygen-depleted, carbonate-corrosivebottom waters. An inferred, moderately deep-infaunallifestyle for the Ext. Gp (Gupta, 1993; Hayward andothers, 2007) might have enabled them to survive theseconditions. The presence of many Ext. Gp species inGreenhouse World seas and the groups’ peak globalabundance towards the end of this time agree with thehypothesis that it was adapted to the warm oceans of theGreenhouse World. These oceans might have been char-acterized by a very different circulation pattern than that ofthe Icehouse World by lacking clearly delineated watermasses and having much more active diapycnal mixing(e.g., Thomas and others, 2006; Huber and Thomas, 2008;Cramer and others, 2009).
The start of the Ext. Gp’s decline during the middleEocene–early Oligocene cooling of the high latitudes, andits final demise during the increasingly colder glacials of thelate Pliocene and MPT, provide clues to understanding thecause of its extinction. The middle Eocene–early Oligoceneexperienced the most extreme drop in deep-water tempera-ture (,8uC) of the Cenozoic, probably as the result of high-latitude cooling (e.g., Zachos and others, 2001; Liu andothers, 2009). The associated oceanic upheaval led towholesale changes in oceanic phytoplankton compositionand productivity (e.g., Aubry, 1992; Baldauf, 1992; Fal-kowski and others, 2004a, b; Bown, 2005) and probablyalso change in efficiency of delivery of organic matter to theseafloor (e.g., Finkel and others, 2005), and possibly itsseasonality (e.g., Thomas, 2007; Eldrett and others, 2009).Physicochemical changes associated with the significantcooling of oceanic deep water included increased ventilationand increased carbonate corrosiveness (e.g., Kennett, 1977;Wright and Miller, 1996; Thomas, 2007).
Pulsed growth of polar ice sheets in the middle-lateMiocene and late Pliocene MPT resulted in further deep-water cooling, more clearly demarcated water masses, andincreased deep-sea ventilation. Overall benthic foraminif-eral changes point to further increased seasonality in foodsupply (especially in the middle Miocene), increasedproduction of corrosive AABW (late Miocene), and
increased total food supply in the Indian Ocean (especiallylate Pliocene–MPT) during these cooling steps. Thesignificant cooling of deep water during these steps wouldalso have lowered microbial activity rates (includingchemosynthetic) in bottom waters and on the seafloor,with downstream effects on any benthic foraminifera thatfed on them (e.g., Thomas, 2007).
The elongate, cylindrical shape of the Ext. Gp speciessuggests that they may have had a moderately deep infaunalhabitat tolerant of lower-oxygen conditions (Gupta, 1993).It is unlikely that the actual temperature or oxygen changesin the deep water directly impacted Ext. Gp foraminifera, astheir global Neogene distribution shows they were tolerantof an extremely wide range of bottom temperature anddissolved oxygen levels (Hayward and others, 2007). Thewide distribution of the Ext. Gp in oligotrophic andeutrophic regions, with sustained or highly seasonalphytoplankton productivity, also suggests that merechanges in the quantity or seasonality of food supplywould not have resulted directly in the extinction of theseforaminifera.
The highly specialized modifications of the apertures ofmost of the Ext. Gp probably contain the answer to the causeof the extinctions, but we do not know the ecologicalfunction of these modifications. We have hypothesized thatthey directed pseudopodial flow into and out of the shell(e.g., Hayward, 2007; Thomas, 2007), which might have beenrelated to the collecting or rupturing of specific food sources.These specific food sources were abundant in the Green-house World and presumably were directly impacted by thechanges that occurred during the stepwise cooling; thus,disappearance of these food sources during the MPTpossibly caused the final extinction of the foraminifera thatdepended on them. There are several possible candidates forthe specific food source. It could have been a phytoplanktongroup, as we know the hard skeleton-bearing phytoplanktonwere greatly impacted by the periods of cooling, especiallyduring the middle Eocene-early Oligocene (Aubry, 1992;Bown, 2005). Alternatively, it could have been deep-water orbenthic chemosynthetic or other microscopic prokaryotes, aswe know that they are more susceptible than foraminifera tosmall temperature changes (Thomas, 2007).
CONCLUSIONS
Our study provides some answers to the questions posedabove, but it seems clear that data are needed from otherocean basins:
1. Does the Cenozoic history of the Ext. Gp provide someclues as to why it became extinct during this most recentperiod of rapid cooling? It provides clues, but nodefinitive answer.
r
75–80 cm. 16–17 Siphonodosaria lepidula (Schwager, 1866). Side and apertural views, BWH 182/7, sample 763A-5H-CC. 18–19 Siphonodosariapomuligera (Stache, 1864). Apertural and side views, BWH 182/8, sample 763A-10H-CC. 20–21 Siphonodosaria subspinosa (Cushman, 1943). Side andapertural views, BWH 182/4, sample 763A-14H-CC. 22–23 Strictocostella pseudoscripta (Cushman, 1937). Apertural and side views, BWH 182/11,sample 738 B-11H-CC. 24–25 Strictocostella hyugaensis (Ishizaki, 1943). Side and apertural views, BWH 182/10, sample 763A-17H-CC. 26–27Strictocostella matanzana (Palmer and Bermudez, 1936). Apertural and side views, BWH 182/9, sample 763A-5H-CC. 28–29 Strictocostella scharbergana(Neugeboren, 1856). Apertual and side views, BWH 182/2, sample 763A-4H-CC.
INDIAN OCEAN DEEP-SEA FORAMINIFERA 129
2. Did the Ext. Gp comprise taxa with a long history offrequent turnovers? No, most of the Ext. Gp specieshad relatively long species durations characteristic ofdeep-water benthic foraminifera. They were not agroup of plastic taxa subject to rapid evolutionarychanges.
3. Was the Ext. Gp impacted preferentially by the threeother major periods of enhanced global turnover in deep-sea foraminifera? The Ext. Gp survived the PETMwarm event with no obvious impact. The two intervalsof enhanced cooling and consequent oceanic changehad some impact on the abundance and compositionof the Ext. Gp in the Indian Ocean, with the muchgreater cooling of the middle Eocene–early Oligocenehaving more significant effects, including slightlyenhanced turnover rates, than the middle Miocene.The LGE decline in the Ext. Gp began as early as thelate Miocene in the subantarctic Southern Ocean.
4. Were the Ext. Gp taxa some of the last remnants of theGreenhouse World deep-sea biota? Mostly yes, with80% of Indian Ocean members of the Ext. Gporiginating in the Eocene or earlier.
5. Has the decline of the Ext. Gp been accompanied by amajor change in the other dominant deep-sea benthicforaminiferal taxa since the end of the GreenhouseWorld? Yes mostly, with 63–77% of extant deep-seaforaminifera originating in the Oligocene or later,including most of the dominant species.
These observations lead us to conclude that the possiblecause of the LGE of deep-sea foraminifera was thedecimation of their detrital phytoplankton or deep-sea,benthic microbial food source that had been abundant inthe Greenhouse World. Likely causes of this trophicalteration were the stepwise cooling, changing circulationpatterns, increased ventilation and changes in oceanicprimary productivity and the efficiency of the biologicalpump that began in the middle to late Eocene.
ACKNOWLEDGMENTS
Samples were provided by the Integrated Ocean DrillingProgram (IODP), which is sponsored by the U.S. NationalScience Foundation and participating countries undermanagement of Joint Oceanographic Institutions. Scanningelectron micrographs were taken at the Research Centre forSurface and Material Science, University of Auckland. Wethank Lilian Weiland for laboratory assistance and Drs. M.Katz, K. Kaiho, and K. Finger for their thorough reviews.Funding was provided by the Marsden Fund of the RoyalSociety of New Zealand. ET acknowledges funding by NSFOCE -720049
REFERENCES
ALEGRET, L., and ORTIZ, S., 2006, Global extinction event in benthicforaminifera across the Paleocene/Eocene boundary at theDababiya stratotype section: Micropaleontology, v. 53, p. 433–447.
———, ———, ORUE-ETXEBARRIA, X., BERNAOLA, G., BACETA, J. I.,MONECHI, S., APELLANIZ, E., and PUJALTE, V., 2009, ThePaleocene–Eocene Maximum: new data on microfossil turnoverat the Zumaia section, Spain: Palaios, v. 24, p. 318–328.
AUBRY, M.-P., 1992, Late Paleogene calcareous nannoplanktonevolution: A tale of climatic deterioration, in Prothero, D. R.,and Berggren, W. A. (eds.), Eocene–Oligocene Climatic and BioticEvolution: Princeton University Press, Princeton, New Jersey,p. 272–309.
BALDAUF, J. G., 1992, Middle Eocene through early Miocene diatomfloral turnover, in Prothero, D. R., and Berggren, W. A. (eds.),Eocene–Oligocene Climatic and Biotic Evolution: PrincetonUniversity Press, Princeton, New Jersey, p. 310–326.
BARRON, J. A., BARRERA, E., and OTHERS, 1991, Biochronologic andmagnetochronologic synthesis of Leg 119 sediments from theKerguelen Plateau and Prydz Bay, Antarctica, in Barron, J. A.,Larsen, B., and others, Proceedings of the Ocean Drilling Pro-gram, Scientific Results, v. 119: Ocean Drilling Program, CollegeStation, Texas, p. 813–847.
BOLTOVSKOY, E., 1987, Tertiary benthic foraminifera in bathyaldeposits of the Quaternary world ocean: Journal of ForaminiferalResearch, v. 17, p. 279–285.
BOYLE, E. A., 1997, Characteristics of the deep ocean carbon systemduring the past 150,000 years: gCO2 distributions, deep waterflow patterns and abrupt climate change: Proceedings of theNational Academy of Science, v. 94, p. 8300–8307.
BREMER, M. L., and LOHMANN, G. P., 1982, Evidence for primarycontrol of the distribution of certain Atlantic Ocean benthonicforaminifera by degree of carbonate saturation: Deep-SeaResearch, v. 29, p. 987–998.
BOWN, P. R., 2005, Calcareous nannoplankton evolution: a tale of twooceans: Micropaleontology, v. 51, p. 299–308.
———, LEES, L. A., and YOUNG, J. R., 2004, Calcareous nanno-plankton evolution and diversity through time, in Thiersten, H.R., and Young, J. R. (eds.), Coccolithophores – From MolecularProcesses to Global Impact: Springer, p. 481–508.
CHEN, J., FARRELL, J. W., MURRAY, D. W., and PRELL, W. L., 1995,Timescale and paleoceanographic implications of a 3.6 m.y.oxygen isotope record from the northeast Indian Ocean (OceanDrilling Program Site 758): Paleoceanography, v. 10, p. 21–47.
CLEMENS, S. C., MURRAY, D. W., and PRELL, W. L., 1996, Non-stationary phase of the Plio-Pleistocene Asian monsoon: Science,v. 274, p. 943–948.
CRAMER, B. S., TOGGWEILER, J. R., WRIGHT, J. D., KATZ, M. E., andMILLER, K. G., 2009, Benthic foraminiferal isotope syntheses:Ocean overturning since the Late Cretaceous: Paleoceanography,doi:10.1029/2008PA001683.
DIESTER-HAASS, L., 1995, Middle Eocene to early Oligocene pale-oceanography of the Antarctic Ocean (Maud Rise, ODP Leg 113,Site 689): change from a low to a high productivity ocean:Palaeogeography, Palaeoclimatology, Palaeoecology, v. 113,p. 311–334.
———, and ZAHN, R., 1996, Eocene–Oligocene transition in theSouthern Ocean: History of water mass circulation and biologicalproductivity: Geology, v. 24, p. 163–166.
———, and ———, 2001, Paleoproductivity increase at the Eocene–Oligocene climatic transition: ODP/DSDP sites 763 and 592:Palaeogeography, Palaeoclimatology, Palaeoecology, v. 172,p. 153–170.
ELDRETT, J. S., GREENWOOD, D. R., HARDING, I. C., and HUBER, M.,2009, Increased seasonality through the Eocene to Oligocenetransition in northern high latitudes: Nature, v. 459, p. 969–973.
ELMSTROM, K. M., and KENNETT, J. P., 1986, Late Neogenepaleoceanographic evolution of Site 590: Southwest Pacific, inKennett, J. P. (ed.), Initial Reports of the Deep Sea DrillingProject, v. 90: Government Printing Office, Washington, D.C.,p. 1361–1382.
FALKOWSKI, P. G., KATZ, M. E., KNOLL, A., QUIGG, A., RAVEN, J. A.,SCHOFIELD, O., and TAYLOR, M., 2004a, The evolution of moderneukaryotic phytoplankton: Science, v. 305, p. 354–360.
———, SCHOFIELD, O., KATZ, M. E., VAN DE SCHOOTBRUGGE, B., andKNOLL, A., 2004b, Why is the land green and the ocean red?, inThierstein, H., and Young, J. (eds.), Coccolithophores – FromMolecular Processes to Global Impact: Elsevier, Amsterdam,p. 429–453.
FINKEL, Z. V., KATZ, M. E., WRIGHT, J. D., SCHOFIELD, O. M., andFALKOWSKI, P. G., 2005, Climatically driven macroevolutionarypatterns in the size of marine diatoms over the Cenozoic:
130 HAYWARD AND OTHERS

Proceedings of the National Academy of Sciences, USA, v. 102,p. 8927–8932, doi: 10.1073/pnas.0409907102.
FROELICH, P. N., MALONE, P. N., and OTHERS, 1991, Biogenic opal andcarbonate accumulation rates in the subantarctic South Atlantic:The late Neogene of Meteor Rise Site 704, in Ciesielski, P. F., andKristffersen, Y. (eds.), Proceedings of the Ocean DrillingProgram, Scientific Results, v. 114. College Station, Texas,p. 515–550.
GOODAY, A. J., 2003, Benthic foraminifera (Protista) as tools in deep-water palaeoceanography: environmental influences on faunalcharacteristics: Advances in Marine Biology, v. 46, p. 1–90.
GRADSTEIN, F. M., OGG, J. G., and SMITH, A. G., 2004, A GeologicTime Scale, 2004: Cambridge University Press, Cambridge, 589 p.
GUPTA, A. K., 1993, Biostratigraphic vs. paleoceanographic impor-tance of Stilostomella lepidula (Schwager) in the Indian Ocean:Micropaleontology, v. 39, p. 47–52.
———, and SRINIVASAN, M. S., 1990, Response of northern IndianOcean deep-sea benthic foraminifera to global climates duringPliocene-Pleistocene: Marine Micropaleontology, v. 16, p. 77–91.
HAQ, B. U., VON RAD, U., and others., 1980, Proceedings of the OceanDrilling Program, Initial Reports, v. 122: Ocean Drilling Program,College Station, Texas.
HAYWARD, B. W., 2001, Global deep-sea extinctions during thePleistocene ice ages: Geology, v. 29, p. 599–602.
———, 2002, Late Pliocene to middle Pleistocene extinctions of deep-sea benthic foraminifera (‘‘Stilostomella Extinction’’) in theSouthwest Pacific: Journal of Foraminiferal Research, v. 32,p. 274–307.
———, GRENFELL, H. R., CARTER, R., and HAYWARD, J. J., 2004,Benthic foraminiferal proxy evidence for the Neogene palae-oceanographic history of the Southwest Pacific, east of NewZealand: Marine Geology, v. 205, p. 147–184.
———, KAWAGATA, S., GRENFELL, H. R., DROXLER, A. W., andSHEARER, M., 2006, Mid-Pleistocene extinction of bathyal benthicforaminifera in the Caribbean Sea: Micropaleontology, v. 52,p. 53–73.
———, ———, ———, SABAA, A. T., and O’NEILL, T., 2007, The lastglobal extinction in the deep sea during the mid-Pleistoceneclimate transition: Paleoceanography, v. 22, PA3103, doi:10.1029/2007PA001424.
———, SABAA, A. T., KAWAGATA, S., and GRENFELL, H. R., 2009,The early Pliocene re-colonisation of the deep Mediterranean Seaby benthic foraminifera and their pulsed late Pliocene-middlePleistocene decline: Marine Micropaleontology, v. 71, p. 97–112.
———, TENDAL, O. S., CARTER, R., GRENFELL, H. R., MORGANS, H.E. G., SCOTT, G. H., STRONG, C. P., and HAYWARD, J. J., in press,Phylum Foraminifera. Foraminifera and Xenophyophores, inGordon, D. P. (ed.), New Zealand Inventory of Biodiver-sity. A Species 2000 Symposium Review: Canterbury UniversityPress, Christchurch.
HODELL, D. A., and VENZ, K., 1992, Toward a high-resolution stableisotopic record of the southern ocean during the Pliocene–Pleistocene (4.8 to 0.8 Ma). The Antarctic paleoenvironment: aperspective on global change: Antarctic Research Series, v. 56,p. 265–310.
HUBER, B. T., 1991, Paleogene and early Neogene planktonicforaminiferal biostratigraphy of sites 738 and 744, KerguelenPlateau (southern Indian Ocean), in Barron, J. A., Larsen, B., andothers (eds.), Proceedings of the Ocean Drilling Program,Scientific Results, v. 119: Ocean Drilling Program, CollegeStation, Texas, p. 427–450.
HUBER, M., and THOMAS, E., 2008, Paleoceanography: greenhouseclimates, in Steele, J. H., Thorpe, S. A., and Turekian, K. K.(eds.), Encyclopedia of Ocean Sciences, 2nd edition: Elsevier, NewYork, p. 4229–4239.
JORISSEN, F. J., FONTANIER, C., and THOMAS, E., 2007, Paleoceano-graphical proxies based on deep-sea benthic foraminiferalassemblage characteristics, in Hillaire-Marcel, C., and de Vernal,A. (eds.), Proxies in late Cenozoic Paleoceanography: Pt. 2:Biological tracers and biomarkers: Elsevier, Amsterdam, p. 263–326.
KAIHO, K., and OTHERS, 1996, Latest Paleocene benthic foraminiferalextinction and environmental changes at Tawanui, New Zealand:Paleoceanography, v. 11, p. 447–465.
KALLEL, N., LABEIRIE, L. D., JUILLET-LECLERC, A., and DUPLESSY,J.-C., 1988, A deep hydrological front between intermediate anddeep-water masses in the glacial Indian Ocean: Nature, v. 333,p. 651–655.
KATZ, M. E., PAV, D. M., DICKENS, G. R., and MILLER, K. G., 1999,The source and fate of massive carbon input during the latestPaleocene thermal maximum: Science, v. 286, p. 1531–1533.
KAWAGATA, S., HAYWARD, B. W., GRENFELL, H. R., and SABAA, A.T., 2005, Mid-Pleistocene extinction of deep-sea foraminifera inthe North Atlantic Gateway (ODP sites 980 and 982): Palaeoge-ography, Palaeoclimatology, Palaeoecology, v. 221, p. 267–291.
———, ———, and GUPTA, A. K., 2006, Benthic foraminiferalextinctions linked to late Pliocene-Pleistocene deep-sea circulationchanges in the northern Indian Ocean (ODP sites 722 and 758):Marine Micropaleontology, v. 58, p. 219–242.
———, ———, and KUHNT, W., 2007, Extinction of deep-seaforaminifera as a result of Pliocene-Pleistocene deep-sea circula-tion changes in the South China Sea (ODP sites 1143 and 1146):Quaternary Science Reviews, v. 26, p. 808–827.
KENNETT, J. P., 1977, Cenozoic evolution of Antarctic glaciation, theCircum-Antarctic Ocean, and their impact on global paleocean-ography: Journal of Geophysical Research, v. 82, p. 3843–3859.
KOVACH, W. L., 1993, MVSP shareware, multivariate statisticspackage: Kovach Computing Services, Pentraeth, Wales.
KUCERA, M., and SCHONFELD, J., 2007, The origin of modern oceanicforaminiferal faunas and Neogene climate change, in Williams,M., Haywood, A. M., Gregory, F. J., and Schmidt, D. N. (eds.),Deep Time Perspectives on Climate Change: Marrying the Signalfrom Computer Models and Biological Proxies: The Micropa-laeontological Society, Special Publication v. 2, p. 409–426.
KURIHARA, K., and KENNETT, J. P., 1986, Neogene benthicforaminifers: Distribution in depth traverse, Southwest Pacific,in Kennett, J. P., von der Borch, C. C., and others. (eds.), InitialReports of the Deep Sea Drilling Project, v. 90: U.S. GovernmentPrinting Office, Washington, D.C., p. 1037–1077.
LINDENBERG, H. G., and AURAS, A., 1984, Distribution of arenaceousforaminifera in depth profiles of the Southern Ocean (KerguelenPlateau area): Palaeogeography, Palaeoclimatology, Palaeoecol-ogy, v. 48, p. 61–106.
LIU, Z., PAGANI, M., ZINNIKER, D., DECONTO, R., HUBER, M.,BRINKHUIS, H., SHAH, S. R., LECKIE, R. M., and PEARSON, A.,2009, Global cooling during the Eocene-Oligocene climate transi-tion, Science, v. 323, p. 1187–1189. doi 10.1126/science.1166368.
MACKENSEN, A., BARRERA, E., and HUBBERTEN, H.-W., 1992,Neogene circulation in the southern Indian Ocean: evidence frombenthic foraminifers, carbonate data, and stable isotope analyses(site 751): in Wise, S. W., and Schlich, R. (eds.), Proceedings of theOcean Drilling Program, Scientific Results, v. 120: Ocean DrillingProgram, College Station, Texas, p. 867–880.
MACLEOD, N., ORTIZ, N., FEFFERMAN, N., CLYDE, W., SCHULTER, C.,and MACLEAN, J., 2000, Phenotypic response of foraminifera toepisodes of global environmental change, in Culver, S. J., andRawson, P. F. (eds.), Biotic Response to Global Change: The Last145 Million Years: Cambridge University Press, Cambridge, p. 51–78.
MCKINNEY, M. L., 1987, Taxonomic selectivity and continuousvariation in mass and background extinctions of marine taxa:Nature, v. 325, p. 143–145.
MILLER, K. G., KATZ, M. E., and BERGGREN, W. A., 1993, Cainozoicdeep-sea benthic foraminifera: A tale of three turnovers, inTakayanagi, Y., and Saito, T. (eds.), Studies in BenthicForaminifera: Tokai University Press, Tokyo, p. 67–75.
MURRAY, D. W., and PRELL, W. L., 1991, Pliocene to Pleistocenevariations in calcium carbonate organic carbon, and opal on theOwen Ridge, northern Arabian Sea, in Prell, W. J., Niitsuma, N.,and others. (eds.), Proceedings of the Ocean Drilling Program,Scientific Results, v. 117: Ocean Drilling Program, CollegeStation, Texas, p. 343–363.
NOMURA, R., 1995, Paleogene to Neogene deep-sea paleoceanographyin the eastern Indian Ocean: benthic foraminifera from ODP sites747, 757 and 758: Micropaleontology, v. 41, p. 251–290.
O’NEILL, T. A., HAYWARD, B. W., KAWAGATA, S., SABAA, A. T., andGRENFELL, H. R., 2007, Pleistocene extinctions of deep-sea forami-nifera: the South Atlantic record: Palaeontology, v. 50, p. 1073–1102.
INDIAN OCEAN DEEP-SEA FORAMINIFERA 131

PEIRCE, J., WEISSEL, J., and OTHERS (eds.), Proceedings of the OceanDrilling Program, Initial Reports, v. 121: Ocean Drilling Program,College Station, Texas.
PRELL, W. L., NIITSUMA, N., and OTHERS, 1989, Proceedings of theOcean Drilling Program, Initial Reports, v. 122: Ocean DrillingProgram, College Station, Texas.
RAI, A. K., and SINGH, V. B., 2004, Late Neogene deep sea benthicforaminiferal biostratigraphy of ODP sites 762B and 763A(Exmouth Plateau), eastern Indian Ocean: Journal of theGeological Society of India, v. 63, p. 415–429.
SCHONFELD, J., 1996, The ‘Stilostomella Extinction’. Structure anddynamics of the last turnover in deep-sea benthic foraminiferalassemblages, in Moguielsky, E. A., and Whatley, R. (eds.),Microfossils and Oceanic Environments: Aberystwyth Press,University of Wales, Aberystwyth, p. 27–37.
SCHRODER-ADAMS, C. J., 1991, Middle Eocene–Holocene benthicforaminifera, Kerguelen Plateau (south Indian Ocean), in Barron,J. A., Larsen, B., and others (eds.), Proceedings of the OceanDrilling Program, Scientific Results, v. 119: Ocean DrillingProgram, College Station, Texas, p. 611–630.
SCHUMACHER, S., and LAZARUS, D., 2004, Regional differences inpelagic productivity in the late Eocene to early Oligocene – acomparison of southern high latitudes and lower latitudes:Palaeogeography, Palaeoclimatology, Palaeoecology, v. 214,p. 243–263.
SIESSER, W. G., and BRALOWER, T. J., 1992, Cenozoic calcareousnannofossil biostratigraphy on the Exmouth Plateau, easternIndian Ocean, in Proceedings of the Ocean Drilling ProgramScientific Results, v. 122: Ocean Drilling Program, CollegeStation, Texas, p. 601–631.
SINGH, R. K., and GUPTA, A. K., 2004, Late Oligocene–Miocenepaleoceanographic evolution of the southeastern Indian Ocean:evidence from deep-sea benthic foraminifera (ODP Site 757):Marine Micropaleontology, v. 51, p. 153–170.
SINHA, D. K., and SINGH, A. K., 2008, Late Neogene plankticforaminiferal biochronology of the ODP Site 763a, ExmouthPlateau, southeast Indian Ocean: Journal of ForaminferalResearch, v. 38, p. 251–270.
SMART, C. W., THOMAS, E., and RAMSAY, A. T. S., 2007, Middle–lateMiocene benthic foraminifera in a western equatorial IndianOcean depth transect: paleoceanographic implications: Palaeoge-ography, Palaeoclimatology, Palaeoecology, v. 247, p. 402–420.
SNEATH, P. H. A., and SOKAL, R. R., 1973, Numerical Taxonomy:Freeman, San Francisco, 573 p.
SPENCER-CERVATO, C., 1999, The Cenozoic deep-sea microfossilrecord: explorations of the DSDP/ODP sample set using theNeptune database: Paleontologica Electronica 2, art. 5.
STOVER, L. E., BRINKHUIS, H., DAMASSA, S. P., DE VERTEUIL, L.,KELEY, R. J., MONTEIL, E., PARTRIDGE, A. D., POWELL, A. J.,RIDING, J. B., SMELROR, M., and WILLIAMS, G. L., 1996,Mesozoic-Tertiary dinoflagellates, acritarchs and prasinophytes,in Jasonius, J., and McGregor, D. C. (eds.), Palynology: Principlesand Applications, v. 2: American Association of StratigraphicPalynologists Foundation, p. 641–750.
TAKEDA, K., and KAIHO, K., 2007, Faunal turnovers in central Pacificbenthic foraminifera during the Paleocene-Eocene ThermalMaximum: Palaeogeography, Palaeoclimatology, Palaeoecology,v. 251, p. 175–197.
THOMAS, E., 1986, Changes in composition of Neogene benthicforaminiferal faunas in equatorial Pacific and North Atlantic:Palaeogeography, Palaeoclimatology, Palaeoecology, v. 53,p. 47–61.
———, 1987, Late Oligocene to Recent deep-sea benthic foraminiferafrom the central equatorial Pacific Ocean, in Ruddiman, W. F.,Kidd, R. B., and others. (eds.), Initial Reports of the Deep SeaDrilling Project, v. 94: U.S. Government. Printing Office,Washington, D.C., p. 997–1032.
———, 1989, Development of Cenozoic deep-sea benthic foraminiferalfaunas in Antarctic waters: Geological Society London SpecialPublication, v. 47, p. 283–296.
———, 1990, Late Cretaceous–early Eocene mass extinctions in thedeep sea. In: Sharpton, V. L., and Ward, P. D. (eds.), GlobalCatastrophes in Earth History: Geological Society of America,Special Publication, v. 247, p. 481–495.
———, 1992a, Cenozoic deep-sea circulation: evidence from deep-seabenthic foraminifera, in Kennett, J. P., and Warnkke, D. A. (eds.),The Antarctic Paleoenvironment: A Perspective on Global Change:Antarctic Research Series, v. 56, Washington D.C., p. 141–165.
———, 1992b, Middle Eocene–late Oligocene bathyal benthicforaminifera (Weddell Sea): faunal changes and implications forocean circulation, in Prothero, D. R., and Berggren, W. A. (eds.),late Eocene–Oligocene and Biotic Evolution: Princeton UniversityPress, Princeton, New Jersey, p. 245–271.
———, 1998, Biogeography of the late Paleocene benthic foraminiferalextinction, in Aubry, M.-P., Lucas, S., and Berggren, W. A. (eds.),Late Paleocene–Early Eocene Biotic and Climatic Events in theMarine and Terrestrial Records: Columbia University Press, NewYork, p. 214–243.
———, 2007, Cenozoic mass extinctions in the deep sea: what perturbsthe largest habitat on earth?, in Monechi, S., Coccioni, R., andRampino, M. R. (eds.), Mass Extinctions and Other LargeEcosystem Perturbations: Extraterrestrial and Terrestrial Causes:Geological Society of America, Special Paper 424, p. 1–23.
———, BRINKHUIS, H., HUBER, M., and ROHL, U., 2006, An oceanview of the early Cenozoic Greenhouse World: Oceanography(Special Volume on Ocean Drilling), v. 19, p. 63–72.
———, and GOODAY, A. J., 1996, Deep-sea benthic foraminifera:tracers for Cenozoic changes in oceanic productivity? Geology,v. 24, p. 355–358.
———, and VINCENT, E., 1987, Major changes in benthic foraminiferain the equatorial Pacific before the middle Miocene polar cooling:Geology, v. 15, p. 1035–1039.
———, ZACHOS, J. C., and BRALOWER, T. J., 2000, Deep-seaenvironments on a warm Earth: latest Paleocene–early Eocene,in Huber, B., MacLeod, K., and Wing, S. (eds.), Warm Climates inEarth History: Cambridge University Press, Cambridge,p. 132–160.
TJALSMA, R. C., and LOHMANN, G. P., 1983, Paleocene–Eocenebathyal and abyssal benthic foraminifera from the Atlantic Ocean:Micropaleontology, Special Publication, v. 4, p. 1–90.
VINCENT, E., 1974, Cenozoic planktic biostratigraphy and paleocean-ography of the tropical western Indian Ocean, in Fisher, R. L.,Bunce, E. T., and others (eds.), Initial Reports of Deep SeaDrilling Project, v. 73: U.S. Government Printing Office,Washington, D.C., p. 1111–1150.
WARREN, B. A., 1981, Transition hydrographic section at Lat. 18uS.Property distribution and circulation in the South Indian Ocean:Deep-Sea Research, v. 28, p. 759–788.
WEINHOLZ, P., and LUTZE, G. F., 1989, The Stilostomella extinction, inRuddiman, W. F., Sarnthein, M., and others. (eds.), Proceedingsof Ocean Drilling Program, Scientific Results, v. 108: ODP,College Station, Texas, p. 113–117.
WOODRUFF, F., 1985, Changes in Miocene deep-sea benthic forami-niferal distribution in the Pacific Ocean: Relationship topaleoceanography, in Kennett, J. P. (ed.), The Miocene Ocean:Paleoceanography and Biogeography: Geological Society ofAmerica Memoir, 163, p. 131–175.
WRIGHT, J., and MILLER, K., 1996, Control of North Atlantic DeepWater circulation by the Greenland-Scotland Ridge: Paleocean-ography, v. 11, p. 157–170, doi: 10.1029/95PA03696.
YASADA, H., 1997, Late Miocene–Holocene paleoceanography of thewestern equatorial Atlantic: evidence from deep-sea benthicforaminifers, in Shackleton, N. J., Curry, W. B., Richter, C.,and Bralower, T. J. (eds.), Proceedings of the Ocean DrillingProgram, Scientific Results, v. 154: ODP, College Station, Texas,p. 395–431.
ZACHOS, J. C., PAGANI, M., SLOAN, L., THOMAS, E., and BILLUPS, K.,2001, Trends, rhythms, and aberrations in global climate 65 Ma topresent: Science, v. 292, p. 686–693.
———, and OTHERS, 2005, Extreme Acidification of the AtlanticOcean at the Paleocene-Eocene Boundary (,55 Mya): Science,v. 308, p. 1611–1615.
Received 28 May 2009Accepted 3 November 2009
132 HAYWARD AND OTHERS
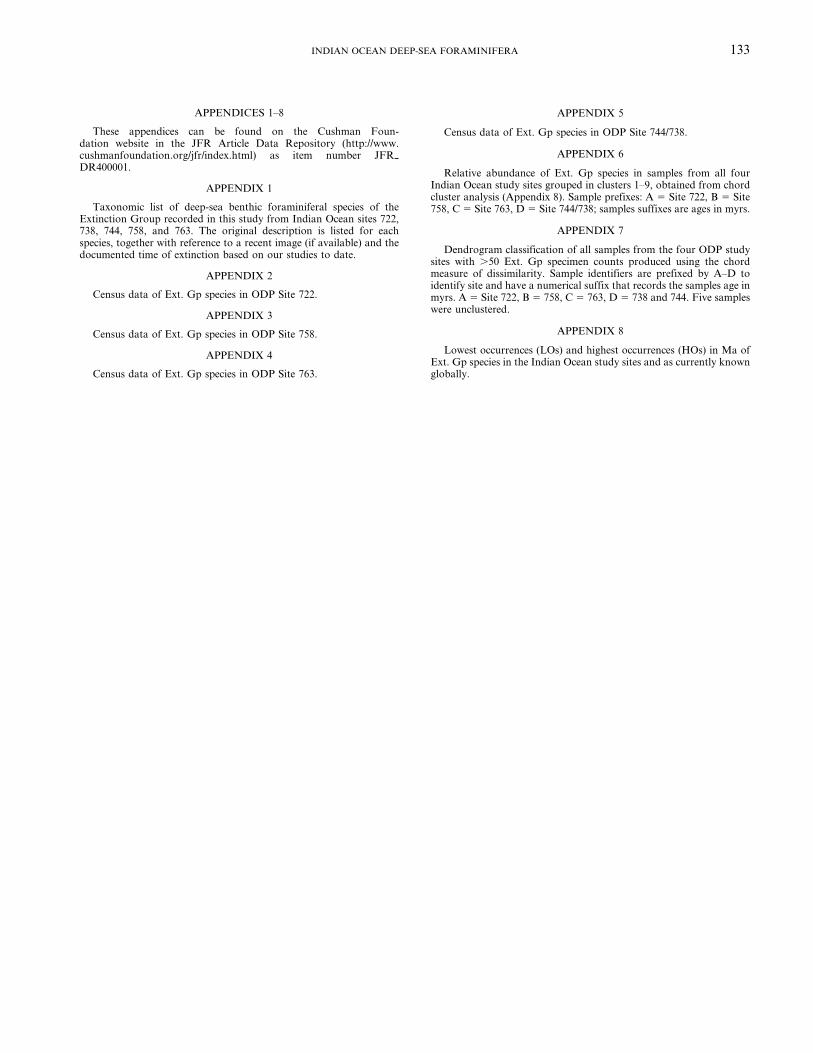
APPENDICES 1–8
These appendices can be found on the Cushman Foun-dation website in the JFR Article Data Repository (http://www.cushmanfoundation.org/jfr/index.html) as item number JFR-DR400001.
APPENDIX 1
Taxonomic list of deep-sea benthic foraminiferal species of theExtinction Group recorded in this study from Indian Ocean sites 722,738, 744, 758, and 763. The original description is listed for eachspecies, together with reference to a recent image (if available) and thedocumented time of extinction based on our studies to date.
APPENDIX 2
Census data of Ext. Gp species in ODP Site 722.
APPENDIX 3
Census data of Ext. Gp species in ODP Site 758.
APPENDIX 4
Census data of Ext. Gp species in ODP Site 763.
APPENDIX 5
Census data of Ext. Gp species in ODP Site 744/738.
APPENDIX 6
Relative abundance of Ext. Gp species in samples from all fourIndian Ocean study sites grouped in clusters 1–9, obtained from chordcluster analysis (Appendix 8). Sample prefixes: A 5 Site 722, B 5 Site758, C 5 Site 763, D 5 Site 744/738; samples suffixes are ages in myrs.
APPENDIX 7
Dendrogram classification of all samples from the four ODP studysites with .50 Ext. Gp specimen counts produced using the chordmeasure of dissimilarity. Sample identifiers are prefixed by A–D toidentify site and have a numerical suffix that records the samples age inmyrs. A 5 Site 722, B 5 758, C 5 763, D 5 738 and 744. Five sampleswere unclustered.
APPENDIX 8
Lowest occurrences (LOs) and highest occurrences (HOs) in Ma ofExt. Gp species in the Indian Ocean study sites and as currently knownglobally.
INDIAN OCEAN DEEP-SEA FORAMINIFERA 133