Cement paper GCook 28Sept09 Main text 3 - Climate...
25
"#$%&'( ")&*+( &*, ')( "(%(*' -*,./'01 2//(//$*+ (%$//$3*/ &*, 43#$51 0(/43*/(/ '3 5&063* 40$5(/ !"#$%& 70(+301 "338 (%&)*+, -./0& 9: ;(4'(%6(0 9<<= "#$%&'( ;'0&'(+$(/ &$%/ '3 &//$/' +3>(0*%(*' $* /3#>$*+ ')( 53##(5'$>( &5'$3* 4036#(% 3? 5#$%&'( 5)&*+(@ 2 A*3' ?30 403?$'B %(%6(0/)$4 30+&*$/&'$3*C "3%4&*$(/ D3./( E.%6(0 <FG=H:9:@ I.*,(0/ $*5#.,( +3>(0*%(*'/ &*, ?3.*,&'$3*/@ 2## 3.0 0(/(&05) $/ 4.6#$/)(, $* ')( 4.6#$5 ,3%&$*@ JJJ@5#$%&'(/'0&'(+$(/@30+
-
Upload
nguyenthuy -
Category
Documents
-
view
216 -
download
0
Transcript of Cement paper GCook 28Sept09 Main text 3 - Climate...

!
!
"#$%&'(!")&*+(!&*,!')(!"(%(*'!-*,./'01!!!
!
2//(//$*+!(%$//$3*/!&*,!43#$51!0(/43*/(/!'3!5&063*!40$5(/!!!
!
!"#$%&'70(+301!"338!!!!!!!!
!!!!!!(%&)*+,'-./0&!!!9:!;(4'(%6(0!9<<=!"#$%&'(! ;'0&'(+$(/! &$%/! '3! &//$/'! +3>(0*%(*'! $*! /3#>$*+! ')(!53##(5'$>(! &5'$3*! 4036#(%! 3?! 5#$%&'(! 5)&*+(@! 2! A*3'! ?30! 403?$'B!%(%6(0/)$4!30+&*$/&'$3*C'"3%4&*$(/!D3./(!E.%6(0!<FG=H:9:@!I.*,(0/! $*5#.,(!+3>(0*%(*'/!&*,! ?3.*,&'$3*/@!2##! 3.0! 0(/(&05)!$/!4.6#$/)(,!$*!')(!4.6#$5!,3%&$*@!!!!
!JJJ@5#$%&'(/'0&'(+$(/@30+!!!!

CLIMATE CHANGE AND THE CEMENT INDUSTRY, GREGORY COOK
1
Author Gregory Cook, Carbon Counts Ltd ([email protected]) Acknowledgement The author wishes to thank Peter Wooders of the International Institute for Sustainable Development (IISD) for providing useful comments and assistance. Publisher Climate Strategies 2009 For citation and reprints, please contact the publisher Climate Strategies

CLIMATE CHANGE AND THE CEMENT INDUSTRY, GREGORY COOK
2
Climate Change and the Cement Industry Assessing emissions and policy responses to carbon prices
Contents Preface .......................................................................................................................... 3
Energy and CO2 emissions performance ......................................................................... 4
Cement production and trade ....................................................................................... 12
Cost of production and carbon price impacts ................................................................. 14
Policy responses to carbon leakage ............................................................................... 21
References ................................................................................................................... 22

CLIMATE CHANGE AND THE CEMENT INDUSTRY, GREGORY COOK
3
Preface This working paper was commissioned by Climate Strategies in the context of our wider project on Tackling Carbon Leakage, led by Susanne Dröge, the final report of which was published in July 2009. In analysing the economic, legal and practical dimensions of various policy options, that research underlined the need to consider specific sector characteristics in developing potential solutions to carbon leakage, and identified cement as a particularly interesting case. An additional planned output from the overall Tackling Leakage project is a shorter synthesis report for a broad-based business and policy audience, by the Carbon Trust. In considering the implications of the project, the Carbon Trust identified sector-specific applications as being of particular interest. Climate Strategies consequently commissioned Greg Cook to undertake a review of key relevant characteristics of the cement sector, to provide a more extensive and robust basis for potential policy recommendations. This working paper presents the results. It sets out the basic characteristics of cement production and associated emissions, reviews options for reducing emissions, and surveys the economic and industry fundamentals that would drive the response of the sector to various policy options. We are grateful to Greg Cook for carrying out an excellent analysis with limited resources, and also grateful to the initiatives of the various companies involved in the global Cement Sustainability Initiative, which has resulted in an unprecedented level of data availability and transparency on which Greg has been able to draw substantially. The views expressed, of course, remain those of the author.
Michael Grubb
Chair of Climate Strategies

CLIMATE CHANGE AND THE CEMENT INDUSTRY, GREGORY COOK
4
Energy and CO2 emissions performance Production process and established abatement options The cement-making process can be divided into two basic steps; first clinker is produced from heating limestone in a kiln to temperatures up to 1,400°C. Then the clinker is milled with other materials to produce powdered cement product. The production of cement gives rise to three principal sources of CO2:
1. Process emissions associated with de-carbonation of limestone in the kiln (525 kg CO2 per tonne of clinker)
2. Combustion of fuel in the kiln (typically 300-350 kg CO2 per tonne of cement) 3. Indirect emissions from electricity use for raw materials and clinker grinding,
and cement finishing (typically 50 kg CO2 per tonne of cement) Emissions can be reduced principally through three established abatement measures:
1. Energy efficiency improvements (notably in kiln technology, but also there is a more limited potential from waste heat recovery and reducing electricity consumption)
2. Combustion of waste and biomass fuels in the kiln 3. Increased use of clinker substitutes in cement blending
In addition, significant emissions reductions could be achieved through the use of CO2 capture and storage using post combustion or oxy-firing technology and also via the development of alternative low-carbon cement products (see next section). The production of clinker from raw materials (limestone, chalk, clay) in the kiln is the main energy consuming process in a cement plant. The energy efficiency of clinker production varies considerably according to the kiln technology used (see Figure 1). Figure 1: Typical energy efficiency of various cement-clinker production technologies
Note: For wet kilns, the arrow represents the range of energy consumption for different wet kiln types. Source: FLSmidth, 2006. In most OECD countries large-scale rotary kilns are used, whereas in non-OECD countries a mix of kiln types is common, sometimes including less efficient, small-scale shaft (vertical) kilns. The use of inefficient shaft kilns is particularly high in China,

CLIMATE CHANGE AND THE CEMENT INDUSTRY, GREGORY COOK
5
accounting for almost half of all production, although government policies have been introduced to phase out their use. A typical cement plant usually produces between 1-1.5 Mt cement per year. The predominant clinker production process is the relatively energy efficient dry process; a best available technology (BAT) modern dry process rotary kiln with multi-stage suspension pre-heating and pre-calcination can achieve a thermal efficiency of around 2.9 to 3.0 GJ/t clinker (see Figure 1). Wet process production has around half the thermal efficiency of dry process production due to additional drying requirements. Although their use is still common in the Former Soviet Union and other regions, wet kilns are being gradually replaced by dry kilns worldwide (although where the limestone feedstock is wet, the process must remain at least partially wet). Over the last few decades, long dry kilns have also been replaced by kilns with multi-stage pre-heaters (IEA 2008a). Dry rotary-kiln technology with multi-stage preheaters and pre-calcination is now the technology of choice for new build plants globally and is approaching the limits of its energy efficiency potential.
Table 1: Cement production technologies by region in 2005
Dry Semi-dry Wet Vertical
United States 82 0 18 0Canada 71 6 23 0Europe 92 4.5 3.5 0Japan 100 0 0 0Australia & New Zealand 24 3 72 0China 50 0 3 47Southeast Asia 80 9 10 1South Korea 93 0 7 0India 50 9 25 16FSU 12 3 78 7Latin America 67 9 23 1Africa 66 9 24 0Middle East 82 3 16 0
RegionProcess Type (%)
Data sources: Battelle, 2002; PCA, 2005; USGS, 2006; LBNL, JCA, 2006; CEMBUREAU, 2006; Siam Cement Industrial Company Ltd, 2005. The use of electricity in cement production is not dependent upon whether the process is dry or wet. The major demand for electricity in cement production is associated with grinding. Although BAT plants use roller presses and high-efficiency classifiers, the typical energy efficiency of grinding is still only 5% to 10% (IEA, 2008a). Electricity consumption rates typically range between 30-70 kWh/tonne clinker. Indirect emissions associated with electricity use are dependent upon the carbon intensity of the local or regional power grid supply. Power generation from low-temperature residual heat recovery has been applied at some modern kilns equipped with pre-heaters and clinker heat recovery. The potential for power generation for such kilns is about 20 kWh per tonne of clinker, but it is expensive (IEA, 2008a). Fossil fuels currently account for over 90% of fuel used in the cement sector globally (see Table 2). The combustion of coal (and in OECD Europe and North America, petroleum coke) account for most fossil fuel used and is generally needed for the properties of its

CLIMATE CHANGE AND THE CEMENT INDUSTRY, GREGORY COOK
6
flame in the kiln, and thus must be retained to at least some share. Natural gas does not have the same properties and is also generally too expensive except in countries in the Middle East and Former Soviet Union where it accounts for most of plant fuel requirements. The use of heavy fuel oil is still common in areas of the Middle East and Latin America. Energy-related CO2 emissions can also be reduced by substitution of fossil fuels with waste and/or biomass fuels. Cement kilns are well suited for waste-combustion because of their high process temperature and because the clinker product and limestone feedstock act as gas-cleaning agents. Waste materials such as tyres and plastics are combusted in large quantities and have reached levels of over 70% of energy demand in some European plants. Achieving such high levels can however require significant pre-treatment to obtain homogeneous calorific values and feed characteristics. According to IEA statistics, the cement industry in OECD countries used 1.6 Mtoe of combustible renewables and waste in 2005. Worldwide, the sector consumed around 2.7 Mtoe of biomass and 0.8 Mtoe of waste in 2005. The IEA estimates that the use of alternative fuels could be raised to 24 Mtoe to 48 Mtoe worldwide, although there would be differences among regions due to the varying availability of such fuels. Policy is important here. Where waste disposal has a cost and where waste is collected, the availability is highest; the availability of waste tends to be correlated with GDP/capita. Whether waste is collected is largely a matter of decisions made outside the cement sector, but the cement sector itself can organise the collection and treatment of waste in some cases. The access companies have to supplies of waste is a source of competitive advantage.
Table 2: Use of alternative fuels and blending by region 2005
Fossil derived waste Biomass Fossil fuels
Europe 13.6% 4.1% 82.3% 23.5%Japan NZ Aus 9.3% 2.5% 88.2% 17.2%North America 10.2% 0.4% 89.3% 15.8%CIS 0.0% 0.0% 100.0% 19.0%China 0.9% 2.3% 96.8% 27.0%Asia 0.9% 2.3% 96.8% 18.8%Latin America 5.5% 4.5% 90.0% 26.2%Africa +ME 0.7% 3.2% 96.0% 19.4%
Fuel share in energy use (%)Region Blending rate
Source: IEA, 2008a; CSI analysis, 2009 Process CO2 emissions associated with limestone calcination account for around 60% of direct sector emissions. Because these emissions are independent of plant energy use, they cannot be reduced through increased energy-efficiency or fuel substitution. The principal option available to reduce process emissions is through the increased blending of cement with �‘pozzolans�’ (substances with similar properties to clinker). Blending reduces the clinker production needed per tonne of cement product. The use of clinker substitutes such as fly ash, blast furnace slag and volcanic ash varies considerably by world region according to the local availability of such materials and varying requirements for product specifications (for example in the US, the blending of fly ash into cement is prohibited but can be blended into cement when making concrete). Again this is an example of where policy outside the cement sector affects the potential for sectoral GHG reduction). The average world blending ratio is currently around 22%,

CLIMATE CHANGE AND THE CEMENT INDUSTRY, GREGORY COOK
7
varying from around 16% in North America to 27% in China (see Table 2). It is estimated that 321 Mt/yr of fly ash, 308 Mt/yr of ground granulated blast furnace slag and 50 Mt/yr of other substitutes are available for blending. The IEA estimates that the total technical energy efficiency and alternative fuel use potential in cement-making today equates to a reduction of about 290 Mt CO2 globally. With the inclusion of increased clinker substitutes, the potential savings rises to around 450 Mt CO2 (see Figure 2). China accounts for more than half of this potential, because of its large production volume and its current low energy efficiency. The world average emissions reduction potential is estimated to be around 0.18 tCO2 per tonne cement, ranging from 0.39 tCO2 in Russia to 0.06 tCO2 in Japan.
Figure 2: CO2 emission reduction potentials in 2006, based on best available technology
Source: IEA, 2008a
Potential for further emissions reductions Significant CO2 reductions could be achieved in the cement sector through application of carbon capture and storage (CCS) technology. Chemical absorption units (e.g. amine scrubbers) and CO2 compressors could be integrated into new-build plant or retrofitted to existing facilities; alternatively the use of oxy-firing in cement kilns would result in a pure CO2 off-gas allowing for capture of up to 95% of plant process emissions (i.e. around 60% of total emissions on average). There is some experience from cement kilns in the USA operated with oxygen enrichment (ECRA, 2007) and oxy-fuel technology demonstrated at power plants in coming years may be transferred to cement kilns. However, oxy-fuel technology would probably only be applicable to new kilns, due to the prohibitive cost of retrofitting. The use of CCS in cement kilns would likely raise production costs by 40% to 90% (IEA, 2008b). For chemical or physical absorption systems, the cost is estimated to be approximately $50 to $75 per tonne of clinker, or $75 to $100 per tCO2 captured. This cost comprises 40% capital cost, 30% cost for the heat required to raise steam, and 30% for transportation and storage (ibid). Different process designs using oxy-fuelling or

CLIMATE CHANGE AND THE CEMENT INDUSTRY, GREGORY COOK
8
chemical looping might halve the cost, although they remain at an early stage of development. McKinsey & Company (2009) have constructed global abatement cost curves for a number of industrial sectors including the cement sector, relative to a reference scenario and based on the societal costs of abatement. The analysis estimates that by 2030 almost 1 GtCO2 (around 25%, compared to business-as-usual) could be saved within the cement sector globally through the combination of increased use of clinker substitutes, alternative fuels, energy efficiency measures and CCS1. The analysis finds that almost 80% of the abatement potential can be achieved through conventional measures such as blending and use of alternative fuels (but excluding CCS), largely at a negative abatement cost to society. It is however important to note that considerable barriers serve to prevent such cost-negative options from being fully deployed by cement companies, including insufficient infrastructure and materials availability in many regions. A study commissioned by the Carbon Trust (BRE, 2007) assesses the prospects for development of alternative low CO2 cement products to Portland cement2. The study notes two significant areas of recent research:
1. Blends of calcium sulfoaluminate cement (CSA) with materials such as ground granulated blast furnace slag and calcium sulphate. These blends have been found to have good physical properties and to be suitable for use in precast cement. The total CO2 generated from decarbonisation of limestone in these mixes is up to 80% lower than that of Portland cement (and therefore total direct emissions are around 50% lower Portland cement).
2. Belite-CSA cement with a higher iron content allowing a wider range of raw materials to be used in manufacture. The first cement of this type is estimated to generate 20-25% less CO2 than Portland cement; the use of these cements in blends with materials such as ground granulated blast furnace slag is being investigated by Lafarge and will lead to greater CO2 savings.
It is thought that belite-CSA cements have the potential to replace Portland cements in a wide range of markets and applications (BRE, 2007). However, there are a number of barriers to their use including potentially high production costs (large scale production trials have yet to be undertaken) and unforeseen problems in manufacturing the cement or using it in concrete. In the longer term, new cement types (eco-cements) may be developed that do not use limestone as a primary resource. Such cements could be made using magnesium carbonate rather than calcium carbonate (limestone). These cements have been developed and patented in Australia and the manufacturer claims that reductions in global sector CO2 emissions of up to 15% could be achieved (ibid). However, the technological feasibility, economics and energy effects of such alternative cements remain speculative (IEA, 2008a). Market acceptance may also take a while: in general, cement costs are a low share of total building costs. Builders will therefore tend to show loyalty to existing
1 The analysis suggests global sector direct and indirect emissions rising from 1,840 tCO2 in 2005 to 3,880 tCO2 in 2030 under a business-as-usual scenario; and to 2,900 tCO2 in 2030 under the alternative emissions abatement scenario. 2 Cement with at least 95% clinker by volume
CLIMATE CHANGE AND THE CEMENT INDUSTRY, GREGORY COOK
9
cement products whose properties they are familiar with and whose supply meets their service requirements (timeliness, form, etc.). Thus overall, cement sector emissions are characterised by a present convergence towards a fairly mature technology (dry kilns with pre-heaters), of which the best plants represent a reasonable indicator of �“best available technology�” for clinker production. The major mitigation options beyond this comprise:
more efficient use of clinker, both within the cement production process and through more efficient use of cement downstream
increased use of clinker substitutes in cement blending such as industrial waste products (e.g. fly ash, blast furnace slag);
capture of the CO2 emitted during production for transportation and storage (CCS), which could provide extensive reductions but at a substantial cost;
radical innovations, including processes that might avoid clinker and/or process emissions entirely, but which are largely untried, have uncertain degrees of emission savings, and mostly remain at the research stage with little involvement of the cement industry to date.
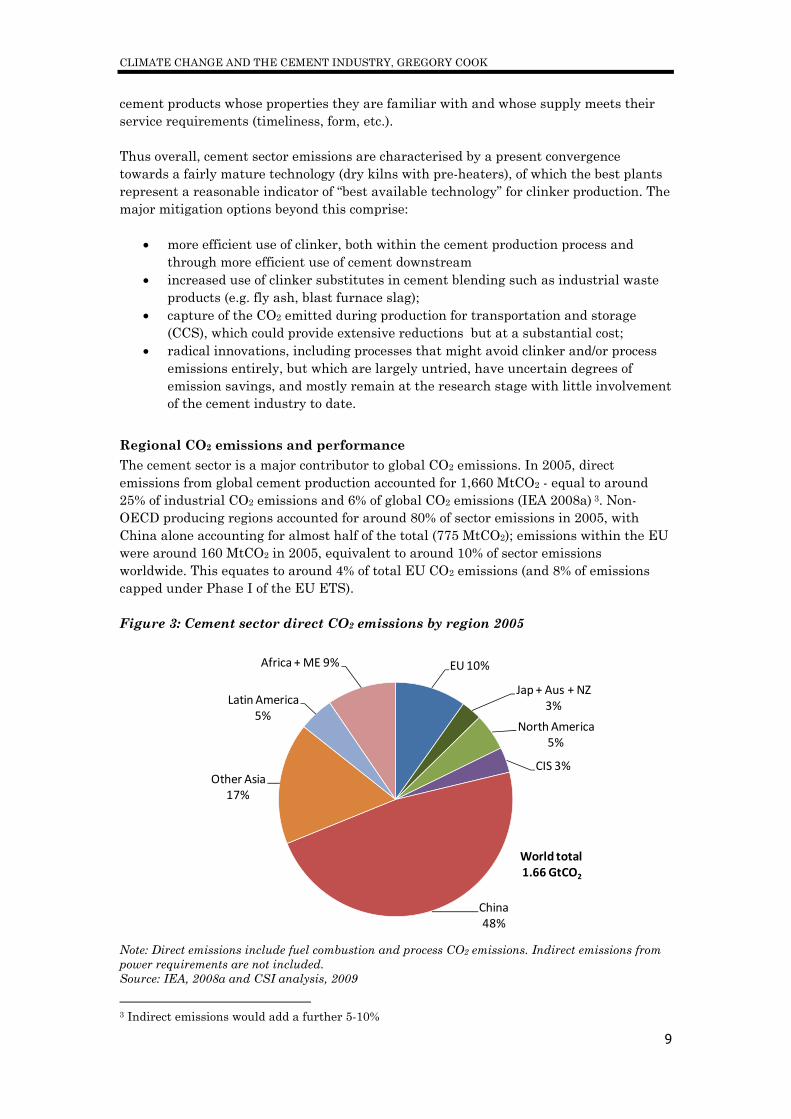
Regional CO2 emissions and performance The cement sector is a major contributor to global CO2 emissions. In 2005, direct emissions from global cement production accounted for 1,660 MtCO2 - equal to around 25% of industrial CO2 emissions and 6% of global CO2 emissions (IEA 2008a) 3. Non-OECD producing regions accounted for around 80% of sector emissions in 2005, with China alone accounting for almost half of the total (775 MtCO2); emissions within the EU were around 160 MtCO2 in 2005, equivalent to around 10% of sector emissions worldwide. This equates to around 4% of total EU CO2 emissions (and 8% of emissions capped under Phase I of the EU ETS). Figure 3: Cement sector direct CO2 emissions by region 2005
Note: Direct emissions include fuel combustion and process CO2 emissions. Indirect emissions from power requirements are not included. Source: IEA, 2008a and CSI analysis, 2009 3 Indirect emissions would add a further 5-10%
EU10%
Jap + Aus + NZ3%
North America5%
CIS 3%
China48%
Other Asia17%
Latin America5%
Africa +ME 9%
World total1.66 GtCO2

CLIMATE CHANGE AND THE CEMENT INDUSTRY, GREGORY COOK
10
According to the CSI GNR database, the global average sector CO2 emissions intensity was 661 kg CO2 per tonne cement product in 2006. 4 As shown in Figure 4, average emissions intensity has decreased over recent years, at a rate of around 12% over the period 1990-2006 and 8% over the period 2000-2006. This improvement has been most marked in China and India (21% for 1990-2006) largely due to a replacement of smaller shaft kilns with high efficiency dry rotary technology. Europe has also seen a significant reduction driven by increased blending rates and use of alternative fuels and has the lowest average intensity worldwide. However, there is insufficient evidence to assess to what extent improvements have been attributable solely to the introduction of the EU Emissions Trading Scheme. The Japan-Australia-New Zealand region has seen little performance progress from 2000 to 2006. Figure 4: Regional average net CO2 emissions per tonne cementitious5 produced
813
807
773
797
711
699
705
890
752
742
742
771
768
671
671
659
817
715
684
667 723
732
636
650
620
764
675
667
638 724
722
619 662
621 76
0
661
0
100
200
300
400
500
600
700
800
900
1000
Africa +ME
China andIndia
CIS OtherAsia
Europe Japan +Aus+ NZ
LatinAmerica
NorthAmerica
World
kgCO
2perton
necementitious
1990
2000
2005
2006
Source: CSI, 2009a The data also show that there is comparatively little spread in CO2 intensity across world regions �– less than 20% between the least and most carbon intensive regions in 2006 (Europe and North America, respectively). This is partly due to the fact that calcination process emissions represent the largest share of sector emissions (around 60% of direct plant emissions) whereas energy-related emissions, where fuel usage is a key factor influencing regional variations in carbon intensity, are less important. For example, the spread in net CO2 emissions intensity between Annex 1 and non-Annex 1 regions is only 3%, compared to 10% for thermal consumption (CSI, 2009a). 4 �‘Getting the Numbers Right�’ (GNR) is a CO2 and energy performance information system, based on emissions data reported annually from individual cement plants operated by WBCSD Cement Sustainability Initiative (CSI) member companies. GNR includes information from 844 cement installations worldwide, covering over 73% of cement production in Kyoto Annex 1 and around 20% in non Annex-1 countries (CSI, 2009a). Note that this figure represents �‘net CO2 emissions�’ which treats emissions from alternatives to fossil fuels combustion as zero-rated. 5 Includes cement and clinker materials

CLIMATE CHANGE AND THE CEMENT INDUSTRY, GREGORY COOK
11
Figure 5 shows gross CO2 emissions per tonne clinker for CSI members 1990-2006. The global average gross CO2 emissions per tonne of clinker were 866 kg CO2 in 2006 (CSI, 2009a). The figure illustrates the small spread in emissions intensity against cumulative clinker production, which has further narrowed through the period 1990-2006. For the same year, the global average net CO2 emissions per tonne of clinker were 2.5% lower than gross emissions. The difference amounts to 4.4% in the Annex 1 regions and 5.2% in Europe, where waste co-processing is more widely used. The difference between gross and net emissions in the non-Annex 1 region is less than 1%, indicative of a much smaller use of alternative fuels. Figure 5: Gross CO2 emissions per tonne clinker
Source: CSI, 2009a

CLIMATE CHANGE AND THE CEMENT INDUSTRY, GREGORY COOK
12
Cement production and trade Global cement production grew from 594 Mt in 1970 to 2,310 Mt in 2005 and 2,613 Mt in 2006, with the vast majority of the growth occurring in developing countries, especially China (IEA, 2008a; Global Cement Report, 2007). In 2005, developed countries produced 563 Mt (24% of world cement production), transition economies 98 Mt (4% of world output) and developing countries 1,649 Mt (72% of world output), with China alone accounting for almost half of all production. Demand is forecast to rise to around 3,100 Mt in 2015 and 4,100 Mt in 2050 (IEA, 2008c), driven by strong forecast growth in India and other non-OECD regions. However, recent forecasts of cement demand and production have been significantly lower than in previous studies. The latest ETP model results from the IEA (IEA, 2009)6 include an alternative �‘low demand�’ scenario which is around 20% lower than the forecast assumed in ETP 2008. Under the high demand scenario, these data suggest EU25 cement production to remain stable at around 250 Mt through 2050; and to fall to around 230 Mt in 2015, 210 Mt in 2030 and 200 Mt in 2050 under the low demand scenario. World production is forecast to rise to 4,400 Mt in 2050 under the high demand scenario and 3,700 under the low demand scenario). World cement trade is a complex combination of regular movements and sporadic short-term opportunistic shipments (GlobalSecurity.org, 2009). Trade typically results from short-term imbalances in markets, those with excess selling to those with deficits. To date, the vast majority of cement plant has been built to supply local markets rather than export markets. A high proportion of cement trade represents movements between companies under the umbrella of the same multinational group. Construction booms and downturns can also alter the regional cement trade profile dramatically, as witnessed in recent years in many of the world�’s leading markets. Traded cement is a relatively homogenous commodity, with most cement trades being Portland cement (i.e. with less than 5% blended materials) or other high-clinker cements. Worldwide the composition of cement product is regulated by standards although there remains no universal international specification. The two main standards for cement are the European EN 197-1 and the American ASTM C150/C5957. Both the European and American systems have been widely adopted by other OECD and non-OECD regions8, although China, India and North Africa have developed other standards. It is thought that further harmonisation of cement standards will take place over the medium to long-term with increased global cement trade. It should be noted that importers tend to specify the type of cement they require under trades which are bilateral, rather than buying generic cement from the market. Table 3 shows reported international trade flows for cement and clinker in 2004-2006. In 2005, total international trade flows were around 160 Mt and increased to around 169 Mt in 2006. The total trade in cement and clinker therefore represented around 6-7% of
6 Energy Technology Perspectives (ETP) data based on the IEA BLUE Map model scenarios 7 EN 197-1 classifies five main cements with 27 different type and their constituents and includes specifications on the proportions in which they are combined, as well as mechanical, physical and chemical requirements for both products and their constituents. Portland cement is designated CEM I and must contain between 95-100% clinker. 8 South America, Middle East, OECD Pacific and South East Asia tend to be ASTM based; parts of South America and Africa are EN 197-1 based.

CLIMATE CHANGE AND THE CEMENT INDUSTRY, GREGORY COOK
13
global cement production in 2005-6. Seaborne trade typically represents approximately 75-80% of all internationally traded cement, and for 2005 included around 80 Mt finished cement and 45 Mt clinker (Ocean Shipping Consultants Ltd, 2008).
Table 3: Cement trade flows 2004-6 (million tonnes cementitious9)
Exports Imports Net Exports Exports Imports Net Exports Exports Imports Net Exports
China 6.0 3.1 2.9 22.2 2.9 19.3 35.0 1.6 33.4Asia excluding China 49.9 26.9 23.0 51.9 29.9 22.0 51.9 32.8 19.1Latin America 8.7 2.1 6.6 9.9 2.3 7.6 10.9 2.0 8.9CIS 11.3 5.2 6.1 13.0 7.4 5.6 13.7 6.6 7.1Japan NZ Aus 10.4 2.1 8.3 9.7 2.6 7.1 10.9 2.6 8.3Europe 33.0 34.8 1.8 34.3 36.7 2.4 33.7 37.6 3.8North America 5.8 27.8 21.9 5.5 34.1 28.5 6.6 36.4 29.8Africa +ME 26.6 42.0 15.4 22.2 45.3 23.1 16.5 49.1 32.7World 151.8 144.0 7.8 168.7 161.0 7.7 179.2 168.7 10.5
2004 2005 2006Region
Note: ordered by regional net exports in 2006; statistical errors lead to positive net export data Source: Global Cement Report, 2007 Major international trade flows currently include large imports of finished cement to the United States, predominantly from Asia into California, as well as strong recent growth in imports to North Africa due to increased demand and domestic production capacity and operational constraints. North America has had a deliberate policy of producing less than its needs and relying on trade to meet its peak demand. Increased imports are anticipated in Europe as production expands rapidly in North Africa and the Middle East (IEA, 2008a). Trade patterns have changed markedly in the recent past: for example, China was a major importer of cement in the early part of this decade and is now a major exporter. The cost of transportation poses a significant barrier to international trade because cement and clinker are one of the heaviest commodities with respect to their value per tonne10. For example, shipping costs for reported cement trades between EU and North Africa for 2007 were around $44/tonne; between China and the US, $54/tonne (Baltic Dry Exchange, 2007) and between China and Europe, $59/tonne These costs are therefore equal to or greater than the short-run cost of production in OECD (see below). Developments in general dry bulk shipping markets have had major effects on the international cement trade in recent years, with the prevalence of low freight rates in the early part of this decade favouring a host of shipping routes previously unfeasible, and the subsequent unprecedented rise in shipping costs causing prices to reach uncompetitive levels on certain routes. The volatility of shipping costs therefore provides an extra layer of uncertainty for the future prospects of cement trade patterns and volumes (GlobalSecurity.org, 2009).
9 Includes cement and clinker materials10 Clinker is typically cheaper to transport than cement due to lower volume and can also be blended by the importer to meet regional standards and product requirements.

CLIMATE CHANGE AND THE CEMENT INDUSTRY, GREGORY COOK
14
Cost of production and carbon price impacts Table 4 shows a breakdown of short-run cash costs11 for dry-process cement production in Latin America for 2004; no investment or financing costs are included in the figures. Average cash costs for cement production vary considerably by country, ranging from around US$20 per tonne in China to US$45 per tonne in OECD regions. It can be seen that the relative share of variable cost components (e.g. materials and energy) is larger than for fixed components (e.g. manpower and administration). Energy requirements account for around 35-40% of cash costs12. Variations in energy requirements per tonne of production between different production processes (see Figure 1) are the key factor driving higher production costs for wet process production which may be up to 10-20% higher than for dry process production13. In 2005, the CO2 intensity of cement production14 from in Latin America was around 0.65 tCO2/t cement. A GHG reduction policy - such as an emission trading scheme - which imposed a carbon cost of $20/tCO2 would therefore add around $13 per tonne to the short-run cash cost of cement production. Assuming an average production cost of �€30/t cement15 for EU producers (and given a gross CO2 intensity of 0.67 tCO2/t cement), a carbon price of �€20/tCO2 would lead to an increase in production cost of around 45% (i.e. a carbon cost of �€13/tCO2, equal to 30% of the total production cost). This would rise to 50% under a carbon price of �€30/tCO2 (i.e. a carbon cost of �€20/tCO2, equal to 40% of the total production cost).
Table 4: Cash costs of cement production in Latin America (US$ per tonne)
Item Cost (US$ per tonne) Share of total
Raw materials 2.00 8%
Consumables 1.50 6%
Electricity 4.50 19%
Fuel 4.00 17%
Manpower 2.00 8%
Sales and administration 1.50 6%
Packaging 5.00 21%
Total 24.00 100% Source: IFC, 2004 Construction costs for a greenfield dry process cement plant typically range between around US$150-200/t cement in developing and emerging economies countries and 250-300/t cement in OECD regions (OneStone, 2005; CSI analysis)16. Key factors driving regional investment costs include differences in construction costs (i.e. civil works), how much of the equipment is sourced from non-Western sources and the build quality (e.g. certain new Chinese plants are expected to see more regular maintenance and higher downtimes than Western multinationals would design for). Adding new production lines 11 Marginal production costs including fixed and variable operating costs only. 12 Cembureau (2009) estimates that in the EU, energy costs may account for over 40% of production costs. 13 Industry estimates also suggest that production from shaft kilns in China increase production costs by around $3/t cement compared to Chinese production from dry kiln process (i.e. 15% higher). 14 Direct (fuel combustion and process) CO2 emissions only i.e. excluding indirect electricity emissions. 15 assuming 1 US$ = 0.67 �€ (August 2009)16 assuming a plant size of around 1.5 million tonnes per annum (Mta)

CLIMATE CHANGE AND THE CEMENT INDUSTRY, GREGORY COOK
15
to existing sites can lead to significant reductions in costs when compared to greenfield sites; OneStone (2005) estimates construction costs for a new cement line at around $100/t cement, or around one third the cost of a greenfield plant. The cost of a brownfield site17 is estimated at around $165/t cement, or around 55-60% of a greenfield plant (OneStone, 2005). Economies of scale effects can be significant, with investment costs typically doubling between a 0.5 Mta and 2.5 Mta plant (OneStone, 2005). For a new greenfield plant, the cost of capital may therefore be of a similar scale to the short-run production costs; assuming a capital cost of $200/t for a non-OECD region discounted over 15 years at a real discount rate of 8% would give an annual cost of capital of around $23/t for the first 15 years of production. On a long-run cost basis therefore, cement production is a capital intensive process suggesting a limited ability to economically produce at part load; on a short-run cash basis part-load production may however be economic, given low fixed operating costs. Reported market prices for cement in 2005 are typically around twice the level of short-run production costs in most OECD regions. For example, the average price was around US$88/tonne in the EU25 (weighted across Member States) and $90/tonne in North America (compared to typical production costs of $40-45/tonne). Similar average prices were reported for Middle East and African countries. The lowest prices were reported for mainland China ($34/tonne) and the highest for Latin America ($115/tonne) (Global Cement Report, 2007), suggesting a wide range in economic returns between some regions. Whether, and to what extent, cement firms can pass on carbon costs to consumers depends on both the supply (i.e. the level of competition within the market) and the demand (i.e. how consumers react to changes in the price of cement). Wooders et al (2009) illustrate that market structure is an important determinant of a sector�’s ability to pass-through cost, and that monopoly suppliers are less able to pass-through carbon costs than suppliers in full market competition.18 Based upon supply and demand curves for full competition and monopoly market structures developed by Sijm el al (2008), their analysis suggests that:
a. assuming both supply and demand are inelastic, pass-through rates of 50% and 33% would be possible for fully competitive and monopoly markets respectively; and
b. assuming inelastic demand but elastic supply19, pass-through rates of 90% and 50% would be possible for fully competitive and monopoly markets respectively.
These are indicative figures only. The extent to which cement firms are able to pass through carbon costs therefore depends upon the market structure and the elasticity of demand for their products. Over the past two decades, the cement industry has seen increased concentration of production ownership. In 2005, the top ten cement companies
17 Includes infrastructure upgrade and quarry expansion18 This apparently surprising conclusion reflects the fact that in a competitive market, prices are set by marginal production costs and these would include carbon costs on all producers, whereas in a less competitive setting, other factors serve to constrain prices. 19 The authors assume a price elasticity demand of -0.2 and price elasticity of supply of 2. Cement is generally believed to be a good with a low demand elasticity, i.e. demand is not greatly affected by price. Key issues include the price and availability of substitutes (e.g. steel, wood), how significant cement is as a share of the total costs of projects it is used in and whether building design/practices can be changed over time. The literature includes some estimates of price elasticity of demand for various countries and time periods, which are typically of the order of -0.2

CLIMATE CHANGE AND THE CEMENT INDUSTRY, GREGORY COOK
16
accounted for around 39% of global cement production capacity whereas in 1990 the top ten companies accounted for just 20%. In Europe 20 the cement market is significantly concentrated; the top ten companies represented 66%, and the top five companies 50% of total production capacity in 200521 (OneStone, 2005). Therefore, in common with other energy-intensive tradable commodities, the cement market has relatively few major suppliers and can be considered to lie somewhere between full competition and a monopoly. It is also understood from the literature that cement has a relatively low elasticity of demand (between 0 and -0.2). In addition, pass-through rates are likely to be higher for in-land producers than for producers in coastal regions. The rate at which carbon costs are passed through to cement prices are central in determining the economic impact of the EU ETS (or other policies imposing carbon costs) upon the sector. In particular, under fixed free allocation of allowances there is potential for increased sector profits when compared to an unregulated carbon regime (i.e. pre-ETS). This is because, where allowances are allocated freely, then for the sector to retain the same level of economic returns under the ETS as compared to pre-ETS, only a modest pass-through of carbon costs would be required to cover the likely shortfall in allowances required by the cap. Table 5 illustrates the relationship between pass-through rates and sector profits under the ETS with fixed free allocation assuming two different allowance prices (�€20/tCO2 and �€30/tCO2). The figures produced are based upon some simple assumptions. A pre-ETS cement price of �€60/tonne is assumed (see earlier); the carbon cost associated with the ETS is then passed into cement prices according to the following: Cement price with ETS = cement price pre-ETS + (carbon cost x pass-through rate) where carbon cost = (carbon price x carbon intensity of cement production) Assuming an average carbon intensity value of 0.67 tCO2/t cement then, for a carbon price of �€20/tCO2, cement prices would increase by up to 22% and for a carbon price of �€30/tCO2 up to 33%, depending upon sector pass-through rates. As prices increase, there would be reduced demand for cement according to demand-price elasticity (assumed here to be a value of -0.2) and therefore reduced sales volumes. However, these losses are compensated for by the value of free allowances. Assuming an average ETS Phase III allowance cap of 87% and an improved carbon intensity of around 0.60 tCO2/t cement during Phase III (e.g. a 10% improvement), then pass-through rates of only around 15-20% would be required to maintain sector profits at pre-ETS levels (all other factors being equal). Higher pass-through rates, moving closer to reflecting the marginal cost of carbon, would increase overall sector profits compared to the pre-ETS situation, by the amounts shown in Table 5.
20 Includes EU Member States in 2005, and Switzerland and Norway 21 Italcementi, Heidelberg, Lafarge, Holderbank and BCI.

CLIMATE CHANGE AND THE CEMENT INDUSTRY, GREGORY COOK
17
Table 5: EU-Aggregate cement sector profits under EU ETS with fixed free allocation
Cement price(�€/t cement)
Cement priceincrease
Increase inprofits underETS (�€m/yr)
Cement price(�€/t cement)
Cement priceincrease
Increase inprofits underETS (�€m/yr)
0% �€60.00 0.0% �€ 503 �€ 60.00 0.0% �€ 75430% �€64.02 6.7% �€ 431 �€ 66.03 10.1% �€ 69750% �€66.70 11.2% �€ 1,038 �€ 70.05 16.8% �€ 1,63270% �€69.38 15.6% �€ 1,635 �€ 74.07 23.5% �€ 2,54290% �€72.06 20.1% �€ 2,220 �€ 78.09 30.2% �€ 3,426100% �€73.40 22.3% �€ 2,508 �€ 80.10 33.5% �€ 3,858
Carbon price �€20/tCO2 Carbon price �€30/tCO2
Cost pass through rate
As shown in the table, if the sector was able to pass through costs at 50% for example, then it might benefit from ETS inclusion by over �€ 1billion/yr; for higher pass-through this benefit could be significantly higher. These results are illustrative only and do not include the potential for loss of sales due to increased imports as domestic cement prices increase. Beyond a certain pass-through rate the potential for increased imports and/or plant relocation will increase, leading to carbon leakage (see next section). With fixed free allocation, there also exists the potential to reduce output from plants (i.e. �“part-loading�”). This is because beyond a certain carbon price the carbon cost will increase the marginal cost of production to a level whereby selling allowances is worth more than producing and selling cement. Such an outcome would reduce domestic production and therefore increase the potential for carbon leakage, as imports from lower cost regions without carbon constraints increase to meet demand. Figure 6 shows the points at which reducing output would be more profitable under the EU ETS, assuming a short-run marginal cost of production (before carbon costs) of �€30 and �€40/tonne cement, with a �‘pre-ETS�’ cement price of �€60/tCO2. It can be seen that where pass-through rates are greater than around 60-65%, it is always more profitable to maintain production. Only for low pass-through rates and/or carbon prices significantly higher than �€30/tCO2 does reducing output become economically preferable. Assuming an average marginal production cost of approximately �€30/tonne does not account for any costs associated with reduction in output (e.g. mothballing; re-start costs); it can be seen from the graph that adopting a higher average marginal production cost (�€40/tonne) to reflect such factors serves to reduce the carbon price needed to incentivise reducing output for a given pass-through rate.

CLIMATE CHANGE AND THE CEMENT INDUSTRY, GREGORY COOK
18
Figure 6: Potential for incentivising reduced cement production with ETS free allocation
0%
25%
50%
75%
100%
�€ 20 �€ 40 �€ 60 �€ 80 �€ 100 �€ 120 �€ 140 �€ 160
Carbon
costpassthroughrate
Carbon price (�€/tCO2)
SRMC �€40/t
SRMC �€30/t
moreprofitableto reducecementproductionand sell
surplusallowances
moreprofitableto maintaincementproduction
Note: assumes �€30/tCO2 carbon price, �€60/tonne cement price and profit maximisation behaviour. In view of the likely range of sector pass-through rates and prices under Phase III of the ETS, there would appear to be a relatively low likelihood of the sector seeking to �‘part-load�’ to maintain or enhance profit levels. Where there are low carbon prices it is likely that the sector would pass through their carbon costs at comparatively low rates (the difference between cement prices and the marginal cost of production suggests that they would be able to do so profitably, and reducing output would not be preferable). However, note that if carbon prices were to increase significantly (e.g. reflecting a higher EU target of 30% post-Copenhagen) then higher pass-through rates might occur. Under such circumstances, a corresponding increase in cement prices would increase the potential for increased imports (and therefore carbon leakage). Therefore, it can be seen that the potential for operational leakage sets constraints on the carbon price, and that as carbon prices rise, the use of fixed free allocation becomes increasingly ineffective in addressing leakage concerns. Furthermore, it is important to note that whilst the sector may attempt to maximise profits over the long-term, other objectives may influence short and medium-term behaviour (e.g. maintaining market share; preventing increased imports). However, the analysis suggests that under certain economic conditions (high carbon prices, low pass-through rate) the use of free allocation does not necessarily present an effective means of addressing the potential for carbon leakage within the sector.

CLIMATE CHANGE AND THE CEMENT INDUSTRY, GREGORY COOK
19
Carbon leakage rates under the EU ETS There is a consensus within the literature that, under certain economic conditions, carbon leakage22 effects could occur within the cement sector arising from the ETS or other GHG policies. In the short-term, assuming profit-maximisation behaviour, competitiveness and leakage impacts will be driven inter alia by the rate of carbon cost pass-through (increasing domestic product prices) and the ability for lower cost exporters to overcome the costs of entering the importer�’s market whilst retaining a profit margin. In the longer term, impacts may be higher as companies chose to locate production in lower cost regions. Figure 7 shows a simple schematic of the principal short-run cost elements determining whether cement trade occurs between two regions; Region A has adopted a carbon commitment and Region B has not. In this case, Region A has a marginal production cost of $45/t and a carbon cost of $20/t resulting in a total production cost of $65/t. Production in Region B is achieved at a lower cost of $25/t and with no cost of carbon. However, at $50/t the cost of transportation acts as a barrier to trade between the two regions. Furthermore, the importer�’s (Region A) preference for domestic product (whereby factors such as brand loyalty, local product standards and supply reliability provide an �‘Armington elasticity�’ effect23) serves as an additional cost barrier to trade.
Figure 7: Marginal cost components for two cement producing regions
Production cost
Production cost
Carbon cost Transport cost BtoA
Armingtonelasticity effect
$0
$20
$40
$60
$80
$100
Region A (carboncommitment)
Region B (no carboncommitment)
Cost(US$
/tcemen
t)
22 The term is used throughout this paper according to the IPCC (2007) definition, whereby carbon leakage due to a particular policy implemented in a country is calculated as: increase in emissions outside the country / decrease in emissions inside the country. For a fuller discussion of the term see Reinaud (2008) and Wooders et al (2009). 23 Paul Armington (1969) described how products traded internationally are differentiated by country of origin; the term commonly refers to the elasticity of substitution between products of different countries, i.e. the percentage change in trade for a given percentage change in their relative prices.

CLIMATE CHANGE AND THE CEMENT INDUSTRY, GREGORY COOK
20
The figure serves to show the relationship between the importing region�’s carbon cost and the cost of transport in determining whether trade occurs (and therefore the potential for competitiveness and leakage impacts). In the simple example given here, the carbon cost in Region A would need to be $30-50/t for trade to occur (depending upon the size of the Armington elasticity effect in Region A�’s market); similarly, for a carbon cost in Region A of $20/t, the cost of transport would need to fall below $40/t. Given the cost components described above, then the extent to which (a) carbon costs in Region A are passed through to domestic prices and (b) the level of reduced profit margins Regions A would be willing to accept, would also influence the ability for Region B to sell into Region A�’s market. Data available to date do not reveal a significant impact of the EU ETS on cement trade in the period 2005-2006. In an empirical statistical analysis of four EU Member States for the period 1976-2005, Quirion and Walker (2008) show that available production capacity is the main driver of net exports and that relative energy costs play a minor role. In addition they find that carbon pricing did not have a significant impact on net cement exports over this period. A study by the Carbon Trust (2004) assessed the likely impact of the EU ETS on industrial competitiveness and predicted that for an allowance price of �€10/tCO2 cement price rises of between 1-2% would be required to maintain the sector�’s levels of profitability24. An empirical study of cement market prices between 1995 and 2007 undertaken by Ponssard and Walker (2008) suggests that, following the introduction of the EU ETS, there has been little observed change in EU cement prices; Walker (2006) has estimated cost pass-through rates during the first year of the ETS of between 10-40% depending on countries and economic assumptions. However, it should be noted in this context that as many cement prices are determined on an annual contract basis, any carbon costs would be unlikely to have a major observable impact upon prices after only one year of the ETS. Several studies have sought to quantify the potential for carbon leakage in the European cement sector based on partial equilibrium modelling; they indicate a range of carbon leakage rates according to different assumptions made. Demailly and Quirion (2006) find a carbon �‘leakage to reduction ratio�’ of around 40% assuming grandfathering of allowances and a carbon price of �€20/tCO2. The model assumes that pass-through rates are high for inland producers and low for producers located in coastal areas. Ponssard and Walker (2008) indicate leakage-to-reduction ratios of up to 73% assuming a higher carbon price of �€50/tCO2 and with full auctioning of allowances. However, according to Reinaud (2008) the authors admit that the modelled leakage rates may have been over-estimated. Estimates produced by the CSI (2009b) also suggest that leakage-to-reduction ratios of up to 73% may be excessive; with full auctioning of allowances, they estimate 56% between the EU and the rest of the world25. The results are based on future carbon prices of up to US$100-150/tCO2 and assume a full pass-through of carbon costs. The CSI results also illustrate the potential value of more widespread action; if instead of the EU acting alone to introduce carbon constraints, all industrialised (Annex I) countries act together, then carbon leakage is found to be reduced to around 25%, due to the migration of cement manufacturing to developing countries, as the price impact (and therefore leakage effect) is spread across a wider range of carbon-constrained countries.
24 For an allowance price of �€10/tCO2, the increase in marginal production cost was found to be 54.5% 25 Under a scenario whereby only EU producers face a cap on sector emissions; the modelling resultsindicate leakage arising mainly from increased EU imports of cement and clinker from North Africaand Asia.

CLIMATE CHANGE AND THE CEMENT INDUSTRY, GREGORY COOK
21
Policy responses to carbon leakage Existing studies indicate some potential for competitiveness and carbon leakage impacts arising within the cement sector as a result of differential carbon costs. However, the estimated leakage rates vary considerably depending upon key assumptions concerning inter alia carbon prices, emissions allocation rules, market structure and behaviour, cost pass-through rates, and cement pricing dynamics. Cement production is highly energy-intensive with high carbon costs relative to both (short-run) marginal and total production costs. Although the sector has the potential for significant emissions reductions in the medium-long term through the use of CCS and alternative �‘breakthrough�’ cement products, the potential for emissions savings from existing established options is limited in most world regions by a range of factors including materials availability, technical and product requirements, and non-economic barriers. However, whilst there is some international competition in the sector, trade accounts for a small share of overall production due to high transportation costs and Armington elasticity type effects which act to favour the consumption of domestic products. These characteristics suggest a mixed potential for increasing competitiveness and leakage impacts arising from the EU ETS or other GHG policies which impose differential carbon costs. The range of estimates suggest that, in the absence of policy measures to address differential carbon costs between producing regions, carbon leakage-to-reduction ratios of between 40% and 73% may be possible. The technical and economic characteristics of the cement sector do not provide a simple indication of the policy response option(s) most likely to be effective in addressing leakage concerns. However, some broad conclusions may be drawn from the above analysis. Although cement production is capital intensive, on a short-run marginal cost basis the potential for maximising profit by reducing output and selling surplus allowances suggests that fixed free-allocation may be ineffective in reducing leakage effects where carbon prices are high (although it may at least partially address the potential for so-called �‘relocation leakage�’ for new entrants). The use of output-based free allocation would address this concern although introduce additional complexity and reduce the overall economic efficiency of an emissions trading scheme. The use of border adjustment measures is likely more suited to the cement sector than other industries with potential exposure to leakage. Although some significant variation in cement process exists worldwide (notably the use of shaft kiln in China and wet process production in Former Soviet Union), modern BAT production is relatively homogenous globally with highly efficient multi-stage dry kilns being the technology of choice for the vast majority of new-build plant; this trend is likely to continue with replacement of older stock and new kilns approaching thermal efficiency limits. Whilst improvements in plant efficiency, increased rates of blending and alternative fuel use have led to reduced emissions intensity over the past two decades, available data indicates that there is a marked lack of variation in energy and carbon intensity between major cement producing regions. Furthermore, cement and clinker are relatively homogenous commodities when compared to other energy-intensive industrial sectors. Such factors suggest that, legal and trade policy aspects aside, use of border carbon adjustments - requiring the importer to purchase EU ETS or equivalent allowances - using a relatively simple set of product benchmarks (e.g. one for EU cement- and one for EU clinker-production) may represent the most suitable short- to medium-term unilateral response to tacking leakage concerns in terms of both environmental and economic effectiveness.
CLIMATE CHANGE AND THE CEMENT INDUSTRY, GREGORY COOK
22
References
Armington, P. (1969), A Theory of Demand for Products Distinguished by Place of Production, International Monetary Fund Staff Papers, XVI (1969), 159-78.
BRE (2007), Low CO2 Cements, Draft paper prepared for the Carbon Trust. Building Research Establishment Ltd 2007
Carbon Trust (2004), The European Emissions Trading Scheme: Implications for
Industrial Competitiveness, June 2004 Carbon Trust (2009), Tackling Leakage in a World of Unequal Carbon Prices, Carbon
Trust Report, forthcoming January 2010 Cembureau (2009), Cembureau website http://www.cembureau.be/ CSI (2009a), Cement Industry Energy and CO2 Performance - �“Getting the Numbers
Right�”, WBCSD/CSI, Geneva CSI (2009b), CSIM3 Model Scenarios and Results Overview, WBCSD/CSI, Geneva
Dröge, S. (2009), Tackling Leakage in a World of Unequal Carbon Prices, Synthesis Report. Cambridge, UK: Climate Strategies
ECRA (2007), Carbon Capture Technology - Options and Potentials for the Cement Industry Technical Report TR044/2007, European Cement Research Academy, Dusseldorf
FLSmidth (2006), Cement Plant Pyro-Technology, paper presented at the IEA WBCSD workshop, Energy Efficiency and CO2 Emission Reduction Potentials and Policies in the Cement Industry, 4-5 September, OECD/IEA, Paris
GlobalSecurity.org (2009), website
http://www.globalsecurity.org/military/systems/ship/bulk.htm IEA (2006), Energy efficiency and CO2 Emission Reduction Potentials and Policies in the
Cement Industry, presentation given by Michael Taylor at IEA workshop 4-5 September 2006, OECD/IEA, Paris
IEA (2007), Tracking Industrial Energy Efficiency and CO2 Emissions, OECD/IEA, Paris IEA (2008a), Energy Technology Perspectives 2008 - Scenarios and Strategies to 2050,
OECD/IEA, Paris IEA (2008b), CO2 Capture and Storage - a key carbon abatement option, OECD/IEA, Paris IEA (2008c), IEA G8 Activities and the Cement Industry, presentation given by Dolf
Gielen at CSI conference in Beijing, 17 November 2008 IEA (2009), Energy Technology Transitions for Industry, OECD/IEA, Paris IEA Greenhouse Gas R&D Programme (2008), CO2 Capture in the Cement Industry,
2008/3, July 2008 IFC (2004), Latin American Cement Industry: Looking Ahead. George Thomas, Principal
Industry Specialist IFC, Washington DC. October 2004

CLIMATE CHANGE AND THE CEMENT INDUSTRY, GREGORY COOK
23
International Cement Review (2008), Global Cement Report 2007 IPCC (2007), Mitigation. Contribution of Working Group III to the Fourth Assessment
Report of the Intergovernmental Panel on Climate Change (eds. Metz, B., Davidson, O. R., Bosch, P. R., Dave, R. & Meyer, L. A.)
McKinsey & Company (2009), Pathways to a Low-Carbon Economy - Version 2 of the
Global Greenhouse Gas Abatement Cost Curve Ocean Shipping Consultants Ltd (2008), Global Cement Trade and Shipping - Future
Outlook to 2015 OneStone Intelligence (2005), Cement Projects Focus 2005, Market Report, Buxtehude,
Germany Ponssard, J.-P. and Walker, N. (2008), EU emissions trading and the cement sector: a
spatial competition analysis, March, University College Dublin and Ecole Polytechnique, Paris
Quirion, P. and Walker, N. (2008), Potential Feedbacks of Climate Policy on Leakage: the
Building Sector, presentation given at the Tackling Leakage in a World of Unequal Carbon Prices Climate Strategies Workshop, 4 February 2008, Paris
Reinaud, J. (2008), Issues Behind Competitiveness and Carbon Leakage: Focus on Heavy
Industry, IEA Information Paper, OECD/IEA, Paris Sijm, J.P.M. et al (2008), The impact of the EU ETS on electricity prices. Final report to
DG Environment of the European Commission. ECN-E-08-007 Walker, N. (2006), Concrete Evidence? An Empirical Approach to Quantify the Impact of
EU Emissions Trading on Cement Industry Competitiveness. School of Goegrpahy, Planning and Environmental Policy, University College Dublin. Working paper
Wooders, P., Cosbey, A. and Stephenson, J. (2009), Border Carbon Adjustment and Free
Allowances: Responding to Competitiveness and Leakage Concerns. IISD, Geneva

Climate Strategies aims to assist governments in solving the collective action problem of climate change. It connects leading applied research on international climate change issues to the policy process and to public debate, raising the quality and coherence of advice provided on policy formation.
We convene international groups of experts to provide rigorous, fact-based and independent assessment on international climate change policy. To effectively communicate insights into climate change policy, Climate Strategies works with decision-makers in government and business, particularly, but not restricted to, the countries of the European Union and EU institutions.
Contact Details
UK - Managing Director: Jon Price ([email protected]) US - Research Director: Thomas L. Brewer Secretariat: Climate Strategies c/o University of Cambridge
13-14 Trumpington Street Cambridge, CB2 1QA, UK +44 (0) 1223 748812 www.climatestrategies.org