Cellular/Molecular Olfactory Horizontal Basal Cells … · Cellular/Molecular Olfactory Horizontal...
14
Cellular/Molecular Olfactory Horizontal Basal Cells Demonstrate a Conserved Multipotent Progenitor Phenotype Lindsay A. Carter, Jessica L. MacDonald, and A. Jane Roskams Department of Zoology and Center for Molecular Medicine and Therapeutics, University of British Columbia, V6T 1Z4 Vancouver, Canada Stem cells of adult regenerative organs share a common goal but few established conserved mechanisms. Within the neural stem cell niche of the mouse olfactory epithelium, we identified a combination of extracellular matrix (ECM) receptors that regulate adhesion and mitosis in non-neural stem cells [intercellular adhesion molecule-1 (ICAM-1), 1 , 4 , and -1, -3, and -6 integrins] and on horizontal basal cells (HBCs), candidate olfactory neuro-epithelial progenitors. Using ECM receptors as our guide, we recreated a defined microen- vironment in vitro that mimics olfactory basal lamina and, when supplemented with epidermal growth factor, transforming growth factor , and leukemia inhibitory factor, allows us to preferentially expand multiple clonal adherent colony phenotypes from individual ICAM-1 and ICAM-1/ 1 integrin-selected HBCs. The most highly mitotic colony-forming HBCs demonstrate multipotency, spon- taneously generating more ICAM-positive presumptive HBCs, a combination of olfactory neuroglial progenitors, and neurons of olfac- tory and potentially nonolfactory phenotypes. HBCs thus possess a conserved adhesion receptor expression profile similar to non-neural stem cells, preferential self-replication in an in vitro environment mimicking their in vivo niche, and contain subpopulations of cells that can produce multiple differentiated neuronal and glial progeny from within and beyond the olfactory system in vitro. Key words: degeneration; development; olfactory; progenitor; extracellular matrix; gliogenesis Introduction The mammalian olfactory system has historically been consid- ered a hotspot for endogenous adult neurogenesis (Schwob, 2002). More recently, the migration and differentiation of olfac- tory bulb-bound subventricular zone (SVZ)-derived rostral mi- gratory stream (RMS) progenitors has taken center stage (Luskin, 1993; van der Kooy and Weiss, 2000), but it is at the peripheral end of the olfactory neuraxis, in the olfactory neuroepithelium (OE), where prolific functional neurogenesis has been estab- lished for more than 30 years (Graziadei and Graziadei, 1979b; Farbman, 1990). In the OE, apoptotic olfactory receptor neurons (ORNs) are replaced by new neurons derived from basally situ- ated progenitor populations to help maintain the sense of olfac- tion during the lifetime of an organism (Carr and Farbman, 1992; Huard et al., 1998). The OE is thus an accessible source of peripheral adult neuro- glial progenitors (“potential stem cells”), but a means of identi- fying candidate quiescent OE stem cell and progenitor popula- tions has thus far remained elusive. This is because of a common problem in progenitor biology, a lack of readily identifiable markers to select undifferentiated quiescent neural stem cells (NSCs) from an adult tissue before they divide and assume a more differentiated phenotype (Weiss and van der Kooy, 1998; Gage, 2000). Thus, there is an essential need for understanding the pathways that combine to regulate neural stem cells in vivo, to guide how to manipulate them in vitro, or regulate their activa- tion from quiescence in the context of repair strategies (McKay, 2000). ORN progenitors have been localized to the basal cell compartment of the OE, and globose basal cells (GBCs) in par- ticular have been identified as neuronal precursors for ORNs (Graziadei and Graziadei, 1979b; Calof and Chikaraishi, 1989; Caggiano et al., 1994; Schwob et al., 1994; Huard et al., 1998). GBCs are neurogenic, their differentiation is regulated by bone morphogenetic protein 4 and FGF2, and they appear to have a limited ability to self-replicate (Calof and Chikaraishi, 1989; De- Hamer et al., 1994; Shou et al., 1999). In contrast, their neighbors, horizontal basal cells (HBCs), are a relatively quiescent popula- tion, that both in vivo and in explant or mixed culture are epider- mal growth factor (EGF) and transforming growth factor (TGF) responsive (Mahanthappa and Schwarting, 1993; Farb- man and Buchholz, 1996; Getchell et al., 2000). Although GBCs clearly contain neuronal progenitors, other basally situated stable multipotent neuroglial progenitors and glial progenitors likely exist in the OE. The OE is arranged in a hierarchical manner, much like the epithelia of the colon and epidermis, where progenitors, transit amplifying cells, and mature terminally differentiated cells oc- cupy discrete laminas, each capable of both lateral and hierarchi- cal control of the adjacent population (Booth and Potten, 2000; Received Jan. 29, 2004; revised April 18, 2004; accepted May 6, 2004. This work was supported by a Rick Hansen Neurotrauma studentship to L.A.C., a Paetzold fellowship to J.L.M., and a Canadian Institutes of Health (199907TOP-76703)/Canadian Neurotrauma Partnership program grant to A.J.R. We thank Andrea Griffiths for technical assistance and members of the Roskams Laboratory for discussion of this manuscript. We thank Linda Barlow (University of Colorado Health Sciences Center, Denver, CO), Dr. Frank Margolis (University of Maryland, Baltimore, MD), and Barbara Murdoch for critical reading of this manuscript; Barbara Murdoch and Andy Johnson for assistance with fluorescence-activated cell sorting analysis; and Dr. Frank Margolis and Dr. Jim Schwob (Tufts University, Boston, MA) for their generous gifts of olfactory marker protein and globose basal cells 1, 2, and 3 antibodies. We also thank Edward Au for artistic contributions to Figure 9. Correspondence should be addressed to Dr. Jane Roskams, University of British Columbia, Department of Zoology, 6270 University Boulevard, Room 3479, Vancouver, British Columbia V6T 1Z4, Canada. E-mail: [email protected]. DOI:10.1523/JNEUROSCI.0330-04.2004 Copyright © 2004 Society for Neuroscience 0270-6474/04/245670-14$15.00/0 5670 • The Journal of Neuroscience, June 23, 2004 • 24(25):5670 –5683
Transcript of Cellular/Molecular Olfactory Horizontal Basal Cells … · Cellular/Molecular Olfactory Horizontal...

Cellular/Molecular
Olfactory Horizontal Basal Cells Demonstrate a ConservedMultipotent Progenitor Phenotype
Lindsay A. Carter, Jessica L. MacDonald, and A. Jane RoskamsDepartment of Zoology and Center for Molecular Medicine and Therapeutics, University of British Columbia, V6T 1Z4 Vancouver, Canada
Stem cells of adult regenerative organs share a common goal but few established conserved mechanisms. Within the neural stem cellniche of the mouse olfactory epithelium, we identified a combination of extracellular matrix (ECM) receptors that regulate adhesion andmitosis in non-neural stem cells [intercellular adhesion molecule-1 (ICAM-1), �1 , �4 , and �-1, -3, and -6 integrins] and on horizontalbasal cells (HBCs), candidate olfactory neuro-epithelial progenitors. Using ECM receptors as our guide, we recreated a defined microen-vironment in vitro that mimics olfactory basal lamina and, when supplemented with epidermal growth factor, transforming growth factor�, and leukemia inhibitory factor, allows us to preferentially expand multiple clonal adherent colony phenotypes from individualICAM-1� and ICAM-1�/�1 integrin�-selected HBCs. The most highly mitotic colony-forming HBCs demonstrate multipotency, spon-taneously generating more ICAM-positive presumptive HBCs, a combination of olfactory neuroglial progenitors, and neurons of olfac-tory and potentially nonolfactory phenotypes. HBCs thus possess a conserved adhesion receptor expression profile similar to non-neuralstem cells, preferential self-replication in an in vitro environment mimicking their in vivo niche, and contain subpopulations of cells thatcan produce multiple differentiated neuronal and glial progeny from within and beyond the olfactory system in vitro.
Key words: degeneration; development; olfactory; progenitor; extracellular matrix; gliogenesis
IntroductionThe mammalian olfactory system has historically been consid-ered a hotspot for endogenous adult neurogenesis (Schwob,2002). More recently, the migration and differentiation of olfac-tory bulb-bound subventricular zone (SVZ)-derived rostral mi-gratory stream (RMS) progenitors has taken center stage (Luskin,1993; van der Kooy and Weiss, 2000), but it is at the peripheralend of the olfactory neuraxis, in the olfactory neuroepithelium(OE), where prolific functional neurogenesis has been estab-lished for more than 30 years (Graziadei and Graziadei, 1979b;Farbman, 1990). In the OE, apoptotic olfactory receptor neurons(ORNs) are replaced by new neurons derived from basally situ-ated progenitor populations to help maintain the sense of olfac-tion during the lifetime of an organism (Carr and Farbman, 1992;Huard et al., 1998).
The OE is thus an accessible source of peripheral adult neuro-glial progenitors (“potential stem cells”), but a means of identi-fying candidate quiescent OE stem cell and progenitor popula-
tions has thus far remained elusive. This is because of a commonproblem in progenitor biology, a lack of readily identifiablemarkers to select undifferentiated quiescent neural stem cells(NSCs) from an adult tissue before they divide and assume amore differentiated phenotype (Weiss and van der Kooy, 1998;Gage, 2000). Thus, there is an essential need for understandingthe pathways that combine to regulate neural stem cells in vivo, toguide how to manipulate them in vitro, or regulate their activa-tion from quiescence in the context of repair strategies (McKay,2000). ORN progenitors have been localized to the basal cellcompartment of the OE, and globose basal cells (GBCs) in par-ticular have been identified as neuronal precursors for ORNs(Graziadei and Graziadei, 1979b; Calof and Chikaraishi, 1989;Caggiano et al., 1994; Schwob et al., 1994; Huard et al., 1998).GBCs are neurogenic, their differentiation is regulated by bonemorphogenetic protein 4 and FGF2, and they appear to have alimited ability to self-replicate (Calof and Chikaraishi, 1989; De-Hamer et al., 1994; Shou et al., 1999). In contrast, their neighbors,horizontal basal cells (HBCs), are a relatively quiescent popula-tion, that both in vivo and in explant or mixed culture are epider-mal growth factor (EGF) and transforming growth factor �(TGF�) responsive (Mahanthappa and Schwarting, 1993; Farb-man and Buchholz, 1996; Getchell et al., 2000). Although GBCsclearly contain neuronal progenitors, other basally situated stablemultipotent neuroglial progenitors and glial progenitors likelyexist in the OE.
The OE is arranged in a hierarchical manner, much like theepithelia of the colon and epidermis, where progenitors, transitamplifying cells, and mature terminally differentiated cells oc-cupy discrete laminas, each capable of both lateral and hierarchi-cal control of the adjacent population (Booth and Potten, 2000;
Received Jan. 29, 2004; revised April 18, 2004; accepted May 6, 2004.This work was supported by a Rick Hansen Neurotrauma studentship to L.A.C., a Paetzold fellowship to J.L.M.,
and a Canadian Institutes of Health (199907TOP-76703)/Canadian Neurotrauma Partnership program grant toA.J.R. We thank Andrea Griffiths for technical assistance and members of the Roskams Laboratory for discussion ofthis manuscript. We thank Linda Barlow (University of Colorado Health Sciences Center, Denver, CO), Dr. FrankMargolis (University of Maryland, Baltimore, MD), and Barbara Murdoch for critical reading of this manuscript;Barbara Murdoch and Andy Johnson for assistance with fluorescence-activated cell sorting analysis; and Dr. FrankMargolis and Dr. Jim Schwob (Tufts University, Boston, MA) for their generous gifts of olfactory marker protein andglobose basal cells 1, 2, and 3 antibodies. We also thank Edward Au for artistic contributions to Figure 9.
Correspondence should be addressed to Dr. Jane Roskams, University of British Columbia, Department ofZoology, 6270 University Boulevard, Room 3479, Vancouver, British Columbia V6T 1Z4, Canada. E-mail:[email protected].
DOI:10.1523/JNEUROSCI.0330-04.2004Copyright © 2004 Society for Neuroscience 0270-6474/04/245670-14$15.00/0
5670 • The Journal of Neuroscience, June 23, 2004 • 24(25):5670 –5683

Watt, 2002). In these non-neuronal systems, the stem cell niche isdefined primarily by adhesion to a defined basal lamina orstroma, where adhesion mechanisms regulate stem cell prolifer-ation and inhibit differentiation (Zhu et al., 1999; Watt, 2002).We thus decided to test the hypothesis that these same integrin-driven mechanisms might also regulate progenitors within thenervous system environment of the OE. By following the mech-anistic lead of stem cells beyond the nervous system, we hypoth-esize that common cellular and extracellular substrates mightalso define the in vivo niche of OE progenitors and, once identi-fied, may allow us to isolate and control the behavior of individ-ual selected progenitors in vitro to assay their potential as stemcells for the OE.
Materials and MethodsOlfactory bulbectomies and tissue preparationUnilateral bulbectomies on adult outbred CD-1 mouse strain (CD-1mice) (6 weeks of age) were performed as described previously (Roskamset al., 1996). The presence of complete lesion was verified both visuallyand microscopically. After recovery from anesthesia, animals were main-tained according to University of British Columbia Animal Care and Useprotocols until they were killed at 2–14 d postbulbectomy. Mice wereperfused with PBS and 4% paraformaldehyde as described previously(Cowan et al., 2001). The brain and olfactory epithelium were dissected,immersion fixed in 4% paraformaldehyde for 2 hr, and then sequentiallybathed in 10 and 30% sucrose to cryoprotect. Tissue was embedded inplastic molds with OCT compound (Tissue-Tek; Baxter, Columbia, MD)over liquid nitrogen. Cryostat sections (10 –14 �m) were then cut andfrozen until needed.
Bromodeoxyuridine incorporation and detectionMice were injected with 30 mg/kg bromodeoxyuridine (BrdU) (Sigma,St. Louis, MO) at 3 and 1 hr before they were killed. Tissue sections wereprocessed according to standard immunohistochemistry protocols (seebelow) with the exception that a 20 min treatment in 4 M HCl was re-quired before the incubation with primary antibody. BrdU incorpora-tion was visualized using monoclonal mouse anti-BrdU alkaline phos-phatase (Roche Diagnostics, Mannheim, Germany) or monoclonalunconjugated mouse anti-BrdU G3G4 (1:500; Developmental StudiesHybridoma Bank, Iowa City, IA) recognized by a fluorescently labeledsecondary antibody.
ImmunohistochemistryFrozen sections were rehydrated in PBS for 5 min, permeablized in 0.1%Triton X-100 (Sigma), blocked with 4% normal serum, and incubated at4°C for 12–20 hr in primary antibody. Tissue sections were washed andincubated with either biotinylated (Vectastain ABC kit; Vector Labora-tories, Burlingame, CA) or fluorophore-conjugated secondary antibod-ies as described previously (Cowan et al., 2001). HRP activity was visu-alized with VIP, diaminobenzidine (both from Vector Laboratories), orAmplex red (Molecular Probes, Eugene, OR).
AntibodiesThe following primary antibodies were used for immunohistochemistry:monoclonal hamster anti-mouse intercellular adhesion molecule-1(ICAM-1) (CD54; 1:100; PharMingen, San Diego, CA), rat anti-mouse�1 integrin subunit (CD29; 1:100; PharMingen), monoclonal rat anti-mouse �4 integrin subunit (CD104; 1:100; PharMingen), rat anti-mouseCD34 (1:100; PharMingen), monoclonal mouse anti-rat �-III neuron-specific tubulin [NST; 1:500; class III �-tubulin (TuJ1); BabCo, Rich-mond, CA), polyclonal rabbit anti-bovine glial fibrillary acidic protein(GFAP; 1:5; Incstar, Stillwater, MN), monoclonal mouse anti-bovineS100� (1:1000; Sigma), polyclonal rabbit anti-mouse p75 low-affinitynerve growth factor receptor (1:1000; Chemicon, Temecula, CA), anti-proliferating cell nuclear antigen (PCNA; 1:5000; Sigma), polyclonal goatanti-rat olfactory marker protein (OMP; 1:5000; gift from Dr. F. Margo-lis, University of Maryland, Baltimore, MD), polyclonal rabbit anti-chicken neural cell adhesion molecule (NCAM; 1:500; Chemicon),monoclonal mouse anti-rat GBC-2 (undiluted hybridoma; gift from Dr.
J. Schwob, Tufts University, Boston, MA), polyclonal goat �integrins 1(rat origin), 3 (human origin), and 6 (human origin) (1:100; Santa CruzBiotechnology, Santa Cruz, CA), polyclonal rabbit anti-rat adenylate cy-clase III (1:200; Santa Cruz Biotechnology), polyclonal rabbit anti-ratG�S/olf (1:1000; Santa Cruz Biotechnology), monoclonal mouse anti-human keratin 903 (undiluted; Enzo Life Sciences, Farmingdale, NY),and polyclonal rabbit anti-mouse laminin (1:1000; Sigma). Biotinylatedsecondary antibodies used for peroxidase immunohistochemistry werehorse anti-hamster (PharMingen), goat anti-rat (Vector Laboratories),goat anti-rabbit (Vector Laboratories), rabbit anti-goat (Vector Labora-tories), and horse-anti mouse (Vector Laboratories). Secondary antibod-ies used for immunofluorescence were goat anti-hamster cyanin (Cy)-2and Cy-3 (Jackson ImmunoResearch, West Grove, PA), donkey anti-goat, goat anti-rabbit Alexa 350, goat anti-mouse, goat anti-rat Alexa488, and Alexa 594 (Molecular Probes).
Primary culture of basal cellsFor each basal cell preparation, the olfactory epithelium was carefullydissected from a litter of postnatal day (P) 5 CD-1 mice into 10 ml ofDMEM/F12 (1:1; Invitrogen) prewarmed to 37°C. Care was taken duringdissection to ensure that the forceps tips were not pushed beyond thecribiform plate (into olfactory bulb tissue) or past the olfactory epithe-lium (to avoid removing adjacent optic tissue). OE tissue was minced to1 mm 3 in size and spun at 110 � g for 10 min. The supernatant wasaspirated and the pellet resuspended in 10 ml of DMEM/F12. The sus-pension was triturated with a P1000 plastic tip pipettor and spun at 43 �g for 5 min, after which the supernatant was aspirated and the pellet wasresuspended in 10 ml of fresh DMEM/F12. The tissue suspension wasdissociated enzymatically by incubation with Liberase blendzyme I (0.45mg/ml; Roche), hyaluronidase (1 mg/ml; Sigma), and DNase I (1 mg/ml;Roche) for 1 hr in a 37°C water bath with occasional swirling to resus-pend tissue. Initial experiments determined that these digestion condi-tions produced the best yield of basal cells in culture. After enzymaticdissociation, the suspension was triturated and filtered through a sterile80 �m wire mesh to remove larger pieces of undissociated tissue. Theflow-through was centrifuged at 250 � g for 5 min, after which thesupernatant was aspirated and the pellet resuspended DMEM/F12. Afteradditional trituration, the suspension was filtered through a 40 �m cellstrainer to remove nondissociated cell aggregates. Cell fractions fromeach of the filtrates and flow-through steps were cultured in DMEM/F12plus 10% FBS (DMF/10) supplemented with fungizone and penstrep,and it was determined that the highest number of ICAM-1� basal cellswas among cells remaining on top of the 40 �m cell strainer. These cellswere used for initial plating experiments, before the selection of ICAM-1-positive cells using magnetic activated bead cell sorting (MACS), andpurification using fluorescence-activated cell sorting (FACS).
ICAM-1 (CD54) selection of basal cellsThe culture method used for immunomagnetic selection of basal cellswas the same as that used for initial experiments detailed above, exceptthat the post-80 �m suspension was treated in 2 mM EDTA in PBS for 10min at 37°C to further dissociate cells, to enable more basal cells to passthrough the 40 �m cell strainer. The single-cell suspension obtainedfrom the 40 micron flow-through was spun at 250 � g for 5 min andblocked in 2% FBS in PBS for 10 min at room temperature to preventnonspecific binding of primary antibody. The suspension was centri-fuged at 250 � g for 5 min, the supernatant aspirated, and the cellsincubated with a 1:100 dilution of biotinylated anti-ICAM-1 (CD54)antibody (PharMingen) in PBS for 30 min on ice. The cells were washedtwice in 2 mM EDTA/PBS and incubated with MACS streptavidin mi-crobeads (Miltenyi Biotec, Auburn, CA) for 20 min at 4°C. Labeled cellswere separated using a MACS magnetic separator separation column(Miltenyi Biotec) placed in the magnetic field of the MACS stand (Milte-nyi Biotec). The yield of CD54-positive, -negative, and unsorted frac-tions (taken before sorting) was then determined using a hemocytome-ter. For clonal density plating, cells were plated at 6000 cells per 10 cmPetri dish (75 cells/cm 2). Standard plating medium was DMF/10 supple-mented with fungizone and penstrep (2.5 mg/ml and 100 mg/ml, respec-tively; Invitrogen). The standard coating substrate was rat tail collagen, a
Carter et al. • Multipotency of Olfactory Horizontal Basal Cells J. Neurosci., June 23, 2004 • 24(25):5670 –5683 • 5671

source that contains primarily type I collagen (5�g/cm 2; Roche). Cells were incubated at 37°Cwith 5% CO2 for 2 weeks, at which point small,medium, and large colonies were counted.Cloning efficiencies were determined by divid-ing the total number of total colonies by thenumber of cells initially plated.
Fluorescence-activated cell sortingThe olfactory epithelium of P5 mice was dis-sected and digested as described for themagnetic-activated cell sorting. After filteringthrough an 80 �m wire mesh, the suspensionwas centrifuged at 310 � g for 5 min and thenincubated in 2 mM EDTA in PBS on ice for 10min. The cells were then centrifuged at 310 � gfor 5 min and resuspended in 10% FBS in PBS ata concentration of 10 6 cells/uL for staining withmonoclonal antibodies. The cells were then in-cubated in the dark on ice for 20 min with7-aminoactinomycin D (7-AAD; 20 �g/ml;Molecular Probes), R-phycoerythrin (R-PE)-conjugated anti-ICAM-1 (CD54) monoclonalantibody (20 �g/ml; BD Biosciences, Missis-sauga, Ontario, Canada), and fluorescein iso-thiocyanate (FITC)-conjugated anti-Integrin�1 (CD29) monoclonal antibody (20 �g/ml;Santa Cruz Biotechnology). The cells werewashed twice and resuspended at a concentra-tion of 2 � 10 6 cells/ml and passed through a 40�m filter immediately before sorting on a Becton Dickinson (San Jose,CA) FACSVantage. Sorted cells were first examined according to size andcomplexity using forward scatter and side scatter to eliminate debris andthen gated for 7-AAD exclusion to eliminate dead cells. They were thensorted for ICAM-1 (R-PE) positivity or ICAM-1 and �1-integrin (FITC)double positivity. The purified cells were then cultured as described forthe MACS isolated cells.
Test conditions for optimizing cloning efficiencyMedia. Alternative media tested for effect on cloning efficiency includedOpti-MEM supplemented with 4% FBS, keratinocyte serum-free media(K-SFM), DMEM/F12 supplemented with N2, and RPMI supplementedwith 10% FBS (all media and supplements are from Invitrogen). Allmedia conditions were supplemented with fungizone and penstrep.
Growth factors tested were used to supplement Opti-MEM/4% FBS:EGF (10 ng/ml; Roche), TGF� (0.5 ng/ml; Sigma), and leukemia inhib-itory factor (LIF) (20 ng/ml; Sigma), individually and in combination.
Extracellular matrix (ECM) tested for cloning efficiencies of CD54-positive cells: 10 cm dishes or four-chambered slides were coated withcollagen (5 �g/cm 2; Roche), laminin (3 �g/cm 2; Roche), fibronectin (5�g/cm 2;Roche), and laminin/collagen and fibronectin/collagen combi-nations. The concentrations of collagen, fibronectin, and laminin usedfor the substrate mixture experiments were as follows: 3.4 �g/cm 2 colla-gen and 1 �g/cm 2 laminin (2 collagen:1 laminin), 1.7 �g/cm 2 collagenand 2 �g/cm 2 laminin (1 collagen:2 laminin), 3.4 �g/cm 2 collagen and1.7 �g/cm 2 fibronectin, and 1.7 �g/cm 2 collagen with 3.3 �g/cm 2
fibronectin.
Assessment of adhesion kineticsCD54-positive cells were plated at high density (between 7.5 � 10 4 and1.1 � 10 5 cells per well) in DMF/10 onto six-well tissue culture platescoated with collagen, laminin, and fibronectin. Media from these wellswere removed after 4 or 24 hr (one time point per well), wells werewashed three times in PBS, and nonadherent cells were counted with ahemocytometer.
ImmunocytochemistryCells were fixed for 10 min in 4% paraformaldehyde, permeabilized in0.1% Triton X-100 for 15 min, and blocked in 4% normal serum for 30
min before an incubation in primary antibody for 12–18 hr at 4°C. Afterwashes in PBS, the cells were then incubated in the appropriate fluores-cently conjugated secondary antibody for 1 hr at room temperature.Before coverslipping in vectashield (Vector Laboratories), the cells weretreated with the nulear counterstain 4�,6�-diamidino-2-phenylindole(DAPI; Roche). All images were visualized with an Axioskop 2 MOT mi-croscope (Jena GER; Zeiss, Thornwood, NY) using a SPOT camera (Di-agnostic Instruments, Sterling Heights, MI) with Northern Eclipse soft-ware (Empix Imaging, Mississauga, Ontario, Canada) and werecompiled using Adobe Photoshop 6.0 (Adobe Systems, San Jose, CA).
ResultsBoth globose and horizontal basal cells undergo mitosisduring ORN genesis in response to the loss of mature ORNsIn rodents, surgical removal of the ORN target, the olfactory bulb(bulbectomy), induces a retrograde wave of apoptosis of matureORNs within 72 hr of lesion (Cowan et al., 2001), stimulatingmitosis in local progenitors. In a pattern that has been suggestedto recapitulate developmental olfactory neurogenesis, 8 –10 mil-lion neurons are generated from these progenitors by 2–3 weeksafter bulbectomy (Costanzo and Graziadei, 1983; Schwob et al.,1992). The replacement of ORNs in the adult OE after lesion isreported to result from the division of globose basal cells, hori-zontal basal cells, or a combination of both (Graziadei and Gra-ziadei, 1979b; Caggiano et al., 1994; Schwob et al., 1994). Most ofthese studies have examined OE neurogenesis at a single site inthe OE (e.g., the nasal septum), but clearly ORN replacement isnot uniform (Weiler and Farbman, 1997). In fact, it appears to begoverned by a balance between the loss rate of mature ORNs(demand for replacement) and the degree of readiness of the localendogenous progenitor population (active vs quiescent). Giventhat either in the steady state or after lesion, ORN loss does notoccur uniformly in all regions of the OE concurrently (Cowan etal., 2001), we first determined whether the temporal and spatialpattern of the initial wave of ORN neurogenesis does relatedirectly to the loss of only the mature ORN population.
The number of BrDU� cells per linear millimeter of lesioned
Figure 1. Basal cell mitosis after bulbectomy drives neurogenesis in the OE. A, After bulbectomy, cells in the basal cell layer takeup BrDU during neurogenesis, predominantly on the side ipsilateral to the lesion (6d Lesioned). Three different points withinturbinates (1–3; arrowheads) were assessed for the number of BrDU� basal cells and show that maximal basal cell BrDU uptake( B) occurs at 6 d after bulbectomy in the lesioned OE when compared with the unlesioned side of the OE (n � 4). A significant(*p � 0.01) mitotic response is also seen on the side contralateral to the lesion (BrDU� UL) by 10 d postbulbectomy whencompared with unlesioned mice, with the majority of contralateral BrDU� basal cells located along the septum (Sep) (position 2).C, The basal cell mitotic index is inversely proportional to the number of neurons directly overlying the basal cell layer. D, Basal cellmitosis is chiefly seen in the globose basal cell layer (two cell layers above basal lamina; dotted line) beginning at 2 d postbulbec-tomy in evenly spaced GBCs. Basal cell BrDU uptake expands from 2 to 14 d broadly within the GBC layer to also include rarelydividing flattened horizontal basal cells (arrow) on the basal lamina at the peak of neurogenesis (6 d postbulbectomy).
5672 • J. Neurosci., June 23, 2004 • 24(25):5670 –5683 Carter et al. • Multipotency of Olfactory Horizontal Basal Cells

or unlesioned OE was assayed at three distinct sites within the OE:(1) OE within a dorsal ecto-turbinate, (2) OE lying along theseptal midline, and (3) OE within a ventromedial endo-turbinate(Fig. 1A). In each ipsilateral turbinate assessed at any time, 12–20cell stretches of actively dividing basal cells (BrDU� cells) werefound adjacent to quiescent (BrDU-negative) basal cell zones.Temporally, the number of BrDU� cells found per linear milli-meter of OE revealed a number of distinct patterns on both thelesioned and unlesioned sides of the OE (Fig. 1B). First, the peakof proliferation on the lesioned side of the OE occurred at 6 dpostbulbectomy but continued in isolated adjacent patches forseveral more days. In addition, a significant later increase inBrDU� basal cells was also seen on the side of the OE contralat-eral to lesion ( p � 0.01), with the majority of the contralateralBrDU� cells lying in OE situated along the septum, at 8 –10 dpostbulbectomy.
In each individual turbinate examined, there was a clear in-verse relationship between the number of proliferating basal cellsper linear millimeter and the number of cells above the basal celllayer within the same millimeter of OE (Fig. 1C). Cells within theOE above the basal cell layer at any time are a mixture of imma-ture neurons, ORNs, and sustentacular cells, but the postbulbec-tomy stimulation of neurogenesis has been attributed primarilyto a need to replace the lost mature, OMP-positive ORNs (Cowanet al., 2001). After close examination of the mitotic basal cells, theearliest cells to become BrDU� (at 2 d postbulbectomy in eachturbinate assessed) were in the GBC compartment, situated di-rectly on top of the flattened HBC layer, and were spatially sepa-rated by defined 6 –10 cell lateral intervals (Fig. 1D). From 4 – 8 dpostbulbectomy, 96 –98% of BrDU� cells of the OE were in theglobose basal cell compartment, with rare BrDU� cells also aris-ing in the HBC population. After the initial peak of proliferation(6 d postbulbectomy), widespread proliferation of GBCs contin-ued until 10 –14 d postbulbectomy. GBC progeny could be seenmigrating to a more superficial OE layer, whereas flattenedBrDU� horizontal basal cells were rare and even more rarelyappeared to leave the HBC layer, causing a disruption in thisnormally continuous layer (Fig. 1D). The behavior of GBCs afterbulbectomy (dividing rapidly in a neurogenic response) is con-sistent with the hypothesis that the majority of GBCs may repre-sent a rapidly dividing transit amplifying population or morecommitted progenitor (Potten and Loeffler, 1990; Watt, 2001).HBCs, in contrast, divide rarely, even at the peak of neurogenesis,similar to stem cells of non-neural systems. We thus testedwhether any cells in the HBC layer may display additional biolog-ical distinguishing characteristics in vivo that may resemble po-tential stem cells from beyond the nervous system.
Do HBCs resemble cells found in other stem cell niches?In the stem cell niches of the epidermis, colon, and bone marrow,cell adhesion molecules, especially integrins, act in concert withgrowth factors to control differentiation and proliferation ofmore primitive progenitors and stem cells (Sastry and Horwitz,1996; Watt, 2002). Similar adhesion-dependent mechanismsmay be used by putative NSCs to regulate a stem cell phenotype,but this has not been tested in a readily identifiable in vivo candi-date quiescent NSC pool, especially as most have been tested in anonadherent (neurosphere) state. We thus tested whether HBCsin the quiescent OE may express adhesion receptors more com-monly found in non-neural quiescent stem cell populations thatmay regulate their ability to respond to environmental signals toinhibit their differentiation and promote quiescence.
In the quiescent OE, ICAM-1 (recognized by CD54) is ex-pressed continuously on the basal, lateral, and to a lesser extentapical membranes of HBCs of both rat and mouse (Fig. 2A,B). Incontrast, the cell adhesion molecule more characteristic of neu-rons, NCAM (recognized by CD56), is not detected on HBCs butis strongly expressed in cells above these in the GBC and neuronal
Figure 2. Adhesion receptor expression in horizontal basal cells. A, B, The ICAM-1 is exclu-sively expressed (arrow) in the HBC population of rat ( A) and mouse ( B) but not in the globosebasal cell layer (*) or ORNs, using DAB immunohistochemistry. In the OE proper (above the basallamina), the NCAM (C; VIP immunohistochemistry) is restricted to the neuronal population(ORN) and is excluded from basal cells (arrow points to HBC layer in all images). D–F, �1 Integrin( D) and �4 integrins ( E) are also expressed chiefly by HBCs that ( F) do not express the stem cellmarker CD34 (arrow), which is found only on blood vessels in the lamina propria (LP; arrow-head). HBCs (arrows) also express �1 integrin ( G) on their basal surface where they adhere tothe basal lamina �3 integrin ( H ), which is also found in some mesaxon bundles (arrowhead),and �6 integrin ( I ), which is also expressed by periaxonal olfactory ensheathing cells (arrow-head) of the lamina propria. J–L, By double immunofluorescence, basal cell ICAM-1 expression(green) coincides on the HBC basal membrane (becoming yellow) with �1 integrin (J, red), �4integrin (K, red), and also cytokeratin 903 (CK; L, red). Eruptions in the basal membrane causedby glandular ducts are indicated (**).
Carter et al. • Multipotency of Olfactory Horizontal Basal Cells J. Neurosci., June 23, 2004 • 24(25):5670 –5683 • 5673

layers of the OE (Fig. 2C). The �1 integrin subunit (CD 29) isfound on HBCs where their basal membrane is closely apposed tothe basal lamina separating the OE proper from the lamina pro-pria (Fig. 2D, J). A similar distribution is detected for the �4
integrin subunit (CD 104), which is found on the basal surface ofHBCs where they attach to the basal lamina (Fig. 2E,K). CD 34,which recognizes the mucosialin antigen and is widely expressedon hematopoietic progenitors, is not expressed on any cell typewithin the OE proper but is expressed on endothelia of the laminapropria (Fig. 2F).
�-Integrins complex with a range of � subunits to form activeheterodimers, which interact with secreted proteins of the extra-cellular matrix (Hynes, 1992; Watt, 2002). We detected expres-sion of �1 integrin (CD49a), �3 integrin (CD49c), and �6 integrin(CD49f) on some HBCs in vivo, with expression again segregatedprimarily to the basal surface of the cell (Fig. 2G–I, respectively).�3 Integrin was also expressed on subsets of axons within axonbundles of the lamina propria, and �6 integrin was expressed onthe processes of cells on the periphery of axon bundles, which arelikely olfactory ensheathing cells (OECs) (Ramon-Cueto andAvila, 1998). �2,4,5 Integrins were not detected on any basal cellsin vivo but were detected in positive control tissue (data notshown).
Double immunofluorescence revealed that in the quiescentOE, ICAM1 is coexpressed in HBCs with �1 integrin (Fig. 2 J).ICAM-1 and �4 integrin are also coexpressed, but both �1 and �4
are restricted primarily to the basal membrane of HBCs (Fig. 2K);HBC expression was also confirmed by ICAM-1 coexpressionwith the accepted HBC marker, cytokeratin (keratin 903) (Fig.2L) (Suzuki and Takeda, 1993). The heterophilic ICAM-1 ligandsMac-1 (CD11) and leukocyte function antigen-1 are not ex-pressed by OE basal cells or cells adjacent to them in the normal(unlesioned) OE, although Mac-1 (CD11) is expressed by infil-trating macrophages involved in the repair process of the OE afterlesion (data not shown). These data have allowed us to signifi-cantly expand the reference set of neuronal, glial, and extracellu-lar matrix receptors that antigenically distinguish cells belongingto the different lineages within the OE and lamina propria, in-cluding HBCs (Table 1).
Laminin is highly expressed in the periphery of olfactory nervefascicles but is concentrated in the olfactory basal lamina betweenthe OE and the lamina propria, demonstrating the close associa-tion between the basal lamina and continuous layer of ICAM-1�HBCs (BL) (Fig. 3A,D), with minor interruptions only whereBowman’s glands pierce into the OE. In contrast, HBC expres-sion of the laminin ligand, �1-integrin, is not uniform but segre-gated in zones of alternating high-expressing and low-expressingHBCs (Fig. 3E). A similar pattern is seen for HBCs strongly ex-
pressing the ECM receptor, �4-integrin (Fig. 3F). These data sug-gest that, similar to basally situated epidermal stem cells, com-plexes of specific � and � integrins and cell adhesion moleculesmay define the cellular environment in which HBCs preferen-
Table 1. Developmental expression profiles of cells in the olfactory epithelium
Cell type OMP NST Mash-1 GBC-2 ICAM-1 �1 �4 �1 �3 �4 �6 CD34 CD43 CD44 Nestin
ORN � � � � � � � � � � � � � � �IRN � � � � � � � � � � � � � � �GBC � � � � � � � � � � � � � � �HBC � � � � � � � � � � � � � � �OEC � � � � � � � � � � � � � � �Mac � � � � � � � � � � � � � � �Endoth � � � � � � � � � � � � � � �Sus � � � � � � � � � � � � � � �BGs � � � � � � � � � � � � � � �
Antigens are scored as either being negative (�), positive (�) in the quiescent OE, or variable (�) depending on a change in state. Cell types are ORN (olfactory receptor neuron), IRN (immature receptor neuron), GBC (globose basal cell),HBC (horizontal basal cell), OEC (olfactory ensheathing cell), Mac (macrophages), Endoth (endothelial cells), and Sus (sustentacular cells); data are summarized from this study and Schwob (2002).
Figure 3. �1 and �4 integrins adhere HBCs to specific zones of olfactory epithelium basal lamina.A, D, HBCs expressing ICAM-1 (A, red) on their lateral and basal surface sit directly on a laminin-rich(green)basal laminaandare,at lowerpower( D),evenlydistributedacrossthebasal lamina(BL)oftheOE. In contrast,�1 integrin (B, red) is expressed only on the basal membrane of HBCs in direct contactwith the laminin-rich (green) basal lamina (areas of direct contact are yellow), which is secreted byOECs of the lamina propria (LP). E, HBCs with high�1-integrin expression (red) define specific zones ofthe OE, which are flanked by stretches of HBCs that are mostly �1 negative. Boundary between thesezones is marked with white arrowhead, under which are located the laminin-rich OEC ensheathmentsof ORN axon bundles (Ax). C, Similarly, HBCs localize�4 integrin (red) to their basal membrane wherethey are tightly bound to the basal lamina (green) and, at lower power, are distributed in high-expressing and low-expressing zones (F, separated by arrowhead) along the laminin-rich (green)basal lamina. Scale bars: A–C, 10 �m; D–F, 50 �m.
5674 • J. Neurosci., June 23, 2004 • 24(25):5670 –5683 Carter et al. • Multipotency of Olfactory Horizontal Basal Cells

tially adhere and quiesce, and that integrin activation by the ap-propriate basal lamina ECM may similarly negatively regulateHBC mitosis and differentiation (Watt, 2002). It is thus impor-tant to assess the stability of HBC adhesion receptor expression ina nonquiescent environment, when mitosis and neurogenesis aremaximally stimulated.
HBC integrin expression is disrupted in mitotic HBCs duringolfactory neurogenesisIn the normal (quiescent) OE, BrDU� GBCs (directly above theHBC layer) can be readily detected in regions of the unlesionedOE that appear to have a full complement of OMP� ORNs andNCAM� immature receptor neurons (IRNs)/ORNs (Fig. 4A,C).However, the loss of �90% of the mature OMP� ORN popula-tion by 6 d after bulbectomy stimulates widespread mitosis inboth GBCs and HBCs (Fig. 4B). The first wave of neurogenesis isalso accompanied by the immediate expression of NCAM by anormally NCAM-negative population of developing ORNs im-mediately above GBCs (Fig. 4D).
At the initiation of basal cell mitosis, the continuous highexpression of ICAM-1, and �1 and �4 integrins adjacent to thebasal lamina became disrupted and discontinuous (Fig. 4E–J).By 6 d after bulbectomy, rare BrDU� nuclei of presumptiveHBCs (identifiable by distinct, flattened BrDU� nuclei in closeapposition to the basal lamina) were most frequently ICAM-1negative. In contrast, where clusters of GBCs appeared BrDUpositive, ICAM-1 expression was readily detected in adjacentHBCs (Fig. 4E, arrow). ICAM-1 expression was not detectable inmitotic cells as they exited the basal cell layer but was stronglyexpressed in groups of adjacent, BrDu-negative HBCs (Fig. 4F,arrowhead). A similar response was seen for both �1 (Fig. 4G,H)and �4 integrins (Fig. 4 I, J), where HBC mitosis was accompa-nied by a decrease and disruption of integrin expression in re-gions of localized BrDU� mitotic HBCs and a comparative in-crease in detectable expression of integrin expression in adjacentBrDU-negative HBCs. Thus, it appears that, similar to epidermalstem cells, the expression of each adhesion receptor is downregu-lated in dividing nonquiescent HBCs during olfactory neurogen-esis and retained in HBCs committed to remaining on the basallamina (Adams and Watt, 1990; Zhu et al., 1999).
Do HBCs display an in vitro progenitor phenotype?Collectively, the in vivo expression of adhesion receptors andtheir concomitant changes during neurogenesis suggests that, ofall the cells of the OE, some horizontal basal cells have an inter-changeable quiescent and active phenotype similar to stem cellsfrom other systems. This is most evident during the early postna-tal phase of olfactory neurogenesis at P5 where, although ICAM-1�/�1/4 integrin-positive cells are already arranged along alaminin-rich basal lamina (Fig. 5A), some regions contain areasof ICAM-1-positive HBC doublets aligned perpendicular to thebasal lamina (Fig. 5B), whereas others demonstrate compactedregions of restricted ICAM-1/�-4 expression (Fig. 5C). At P5,many zones of OE are highly expanded (Fig. 5D) and containICAM-1�/cytokeratin� cells within regions of high PCNA ex-pression that appear to represent ongoing progenitor mitosis(Fig. 5E,F).
Because the P5 OE contains extensive populations of HBCsthat are both actively mitotic and apparently quiescent, we estab-lished culture conditions that allowed us to promote retention ofthese phenotypes in vitro, to test whether cells antigenically re-sembling HBCs were capable of forming adherent colonies sim-ilar to those generated from other stem cell-containing systems.Because OE basal lamina is also rich in collagen during develop-ment (Julliard and Hartmann, 1998) and integrin receptors forcollagen are highly expressed on HBCs in vivo (Figs. 2– 4), weinitially used a mixed collagen substrate for all initial colony-forming adhesion assays. We first refined cell fraction selectionby size and adherence from dissected OE and tested colony for-mation on successive dilutions of cells. In this way, we identified
Figure 4. Loss of the mature ORN population stimulates basal cells to lose adhesion receptorexpression as they undergo mitosis. The unlesioned (UL) OE contains a robust population ofOMP� ORNs (A, green), NCAM� neurons ( C), and rare, dividing, BrDU� globose basal cells(red). Double-headed arrows indicate the thickness of the OE. The basal lamina is indicated witha dotted line. B, The OE at 4 d after bulbectomy (L) has a vastly reduced sporadic OMP�population (green) and exhibits robust BrDU uptake (red) in the basal cell layer. C, In unlesionedOE, NCAM (green) is expressed in immature and mature ORNs but excluded (*) from a zone ofcells around dividing (red) basal cells. D, After bulbectomy, this layer immediately above theBrDU� (red) basal cells becomes an NCAM� immature receptor neuron population (green). E,Where GBCs become BrDU� (red), adjacent HBCs (arrowhead) strongly express ICAM-1(green). Where flattened nuclei of HBCs become BrDU� (red, arrow) and prepare to leave thebasal lamina, ICAM-1 expression is lost. F, At higher power, loss of lateral ICAM-1 expression byBrDU� HBCs is more evident, whereas ICAM-1 expression is increased in neighboring BrDU-negative HBCs (green, arrowhead). G, Similarly, where cells of the globose basal cell layer areBrDU� (red), adjacent HBCs on the basal lamina clearly express �1 integrin (G, green, arrow-head), and flattened HBCs lose �1 expression as they take up BrDU and prepare to leave thebasal lamina ( H ). I, J, �4 integrin expression (I, green, arrowhead) is similarly upregulated onthe basal surface of HBCs adjacent to BrDU� GBCs adherent to the basal lamina and is lost asthese cells take up BrDU, become mitotic (J, red, arrow) and leave the basal lamina.
Carter et al. • Multipotency of Olfactory Horizontal Basal Cells J. Neurosci., June 23, 2004 • 24(25):5670 –5683 • 5675

an adherent cell fraction that seeded morphologically definedcolonies and generated an in vitro population that was initiallyassayed as �80% HBC-like at 7 d in vitro (DIV), by cell clusteringphenotype and coexpression of ICAM-1 with either �1 or �4
integrin on cells in the colony. The most HBC-rich fraction wassubsequently plated at clonal density (limiting dilution) to assayfor cells that may be more stem-like (capable of forming coloniesin isolation). By 7 DIV, the majority of cells (�90%) plated fromthis fraction had not adhered but died, a small percentage (�7%)spontaneously differentiated into individual bipolar or multipo-lar cells, and a consistent percentage (2–3%) expanded over 7DIV to form small clusters (4 –30 cells) and large clusters (100 –1000 cells) (Fig. 5H) by 14 DIV. Most (�70%) large adherent cellclusters subsequently expanded over 14 DIV into larger adherentcolonies up to several thousand cells. A typical colony (with theoriginating cell position marked with an asterisk) was followedfrom 1–28 DIV (Fig. 5G–K). Each cluster of cells was marked andexamined microscopically every day to confirm their isolationfrom other colonies. When expanded in 10% FBS, larger colonies(from 21–28 DIV) produced multiple migratory cells of a moredifferentiated morphology (Fig. 5I–K) that were later confirmedas representing both neuronal (NST�) and glial (S100��) phe-notypes (Fig. 5L,M).
Cell surface antigen selection of HBCsThese results suggested either that colony-seeding cells from theOE preferentially generate ICAM-1-positive basal cells in vitro orthat ICAM-1� HBCs themselves may contain subpopulations ofcells capable of forming colonies of self-replicating cells with pre-dictable frequency. We hypothesized that by generating condi-tions that better resemble (at least in part) the HBC in vivo niche,we may better promote retention of an HBC in vivo phenotypeafter cell selection in vitro. We first used a gentle but stringentsorting approach, MACS, to isolate single-cell suspension en-riched (�90% enrichment) in ICAM-1� (CD54�) cells. MACSwas used to minimize HBC loss, given that the in vivo adhesionreceptor suggested that strongly adherent HBCs may display sig-nificant dependence on cell– cell or cell–matrix interactions forsurvival and could be lost (because of anoikis) (Frisch and Fran-cis, 1994) during the harsher cell processing required for FACS.MACS was followed by clonal density plating of cells on collagen,with cultures marked 24 hr after plating and monitored contin-uously to ensure that colonies were indeed derived from a singlefounder cell. This enabled us to test whether ICAM-1-positiveHBCs in vitro expand and also whether they continue to expressICAM-1 (CD54) and either �1 (CD 29) or �4 (CD104) integrin(or downregulate as they divide or differentiate) in a mannersimilar to that observed in vivo.
Figure 5. Cells from the ICAM-1-rich fraction of OE form highly adhesive clonal colonies and produce differentiated neurons and glia in vitro. A, At P5, the HBC layer contains ICAM-1 (green)/�4
integrin (red)-rich cells on a laminin-rich (blue) basal lamina. B, ICAM-1 HBCs are dividing in a direction perpendicular to the basal lamina (double arrow), where one daughter contains �4 integrin(red) and the other does not. C, Some regions contain HBC with ICAM-1 and �4 expression primarily restricted to the basal surface. D–F, The ICAM-1� (green)/cytokeratin� (red) is a smallpercentage of the total population (DAPI; blue) but represents the majority of PCNA/Ki67-positive cells ( E) that are clearly undergoing mitosis (* on HBC of origin) in a plane perpendicular to the basallamina ( F). An ICAM-1�-rich/NCAM-negative cell fraction prepared from the neonatal mouse OE was subsequently dissociated into single cells and plated at clonal density on a collagen matrix inDMEM/F12 with 10% fetal calf serum. G, Single cells (* marks the same cell position followed over time in vitro) of this cell fraction expanded rapidly over 7 DIV to form small, tightly adhesive colonies.H, Colony expansion continued from 7 to 14 DIV to produce colonies containing 25– 40,000 cells (medium-large colony shown here). C, At 14 –28 DIV, the larger colonies (colony marked with * intop left-hand corner) produced multiple differentiated progeny ( I–K) (bipolar and multipolar), which usually migrated away from the edge the colony. J begins at the edge of the original colonyboundary. In some instances, differentiated progeny arose from the center of the colony and migrated along the more adhesive colonies beneath. L, M, Cells of both glial ( L) (S100��) and neuronal( M ) (type III � neuron-specific tubulin (TuJ1�) phenotypes were represented in migratory cells. Scale bars: B, C, F, 10 �m; G–M, 50 �m.
5676 • J. Neurosci., June 23, 2004 • 24(25):5670 –5683 Carter et al. • Multipotency of Olfactory Horizontal Basal Cells
Colony-forming ability at clonal density was initially testedbetween the ICAM 1-positive and -negative MACS fractions(CD54�/�) and compared with the original unselected cell frac-tion used for sorting (Fig. 6A). By 14 DIV, 96.8% of the colony-forming cells from the OE were found in the CD54� MACS-selected fraction, whereas 3.2% of the CD54-negative cells fromthis fraction formed colonies, with a baseline cloning efficiency(assayed as the percentage of single cells plated that form colo-nies) of 0.033% (Fig. 6A). To identify the best media in which totest mitogens and growth factors known to influence HBC divi-
sion in vivo, we tested DMEM/F12 againsta variety of media, including OptiMEM, amedium optimized for low-serum condi-tions. Serum concentrations ranging from2 to 10% were also used. DMF/10 yieldedthe highest number of colonies, with Opti-Mem/4% FBS (Opti4) yielding 72% of thisnumber. Adherent colony formation fromICAM1� cells was calcium dependent, be-cause cells did not adhere and form colo-nies in RPMI (even supplemented with10% serum) or K-SFM. Initial adhesion as-says on single selected cells confirmed colla-gen as the single preferred substrate forICAM-1� HBCs, given that 78% of MACS-selected CD54� cells preferentially adhereto a collagen substrate within 4 hr of selec-tion (Fig. 6B).
When assayed by immunofluorescenceat 1 DIV after adhesion, 92.3% of cells ad-hering to collagen still expressed ICAM-1,whereas only 13.9% expressed �1 integrin.After 1 DIV, after adhesion to a collagensubstrate, �80% of single ICAM-1� cells(Fig. 6C) also continued to coexpress �4
(Fig. 6D) with a smaller percentage (11%)coexpressing �1 integrin. Selected ICAM-1-positive cells undergoing mitosis ap-peared to divide symmetrically and asym-metrically, where ICAM-1 expression waslost in a single daughter (Fig. 6F) or re-tained in both daughters as they divided(Fig. 6G). As cells expanded to form circu-lar, symmetrical colonies, coexpression ofICAM-1 and �4 integrin was retained insome of the progeny (Fig. 6H, I). Oncecolonies became larger than 10 –12 cells, apattern was established where ICAM-1�cells tended to form a select subset of cellsat the core of the colony and occasionallystretched to the outer edge of the colony(Fig. 6 J). At 14 DIV, a 48 hr incubationwith BrDU indicated that a subpopulation(�8%) of ICAM-1� cells became BrDU�in vitro, but most ICAM-1� cells (�90%)did not become BrDU� during the assay.In addition, the majority (�95%) ofBrDU� cells did not express ICAM-1 butwere frequently clustered immediately adja-cent to the ICAM-1� population (Fig. 6J).Although these BrDU� cells may representa more committed (GBC) progenitor, thespecific GBC antibodies available to us will
not work in the conditions necessary for detecting BrDU in vitro.After 14 DIV, HBCs plated on collagen presented distinct col-
ony morphologies that also represented three major size classes(Fig. 6K–M). Small colonies (�30 cells/colony) contained dis-persed populations of process-bearing cells and demonstratedminimal proliferation. Medium colonies (30 –150 cells/colony)formed tighter clusters of polygonal epithelioid cells surroundedwith a penumbra of flatter cells in minimal media (Fig. 5B), withcells more dispersed in DMF/10, and large colonies (151– 40,000cells; average colony size, 5363 cells) contained small, densely
Figure 6. Single-cell selection for ICAM-1 yields a population of horizontal basal cells capable of surviving and expanding atclonal density. ICAM-1� cells (CD54�) were selected by MACS and plated at clonal density to assay for colony forming ability. A,More than 90% of the colony-forming cells from the OE were found in the CD54� fraction. B, An adherence assay revealed that theICAM-1� cells preferentially adhered to a collagen matrix, over fibronectin or laminin, within 4 hr of plating. Statistical signifi-cance (n � 3) was calculated by a Student’s t test; *p � 0.0005. After plating selected CD54� cells on a collagen matrix, singlecells were positive for ICAM-1 (CD54; C, green) and �4 integrin (CD104; D, red; DAPI stains nuclei blue), where E is the bright-fieldimage for both at 1 DIV. ICAM� cells divide asymmetrically ( F) and symmetrically ( G) as they expand to first form small coloniesthat are frequently homogeneously positive for ICAM-1 (CD54; H, green) and �4 integrin (CD104; I, red). As the colonies expand,they become more heterogeneous, with some ICAM-1� cells (green) concentrated at the core becoming BrDU� in the interiorof the colony (J, red; marked with *). Other BrDU� cells on the periphery of the colony are negative for ICAM-1 expression (arrow).At 14 DIV, the colonies can be subdivided into three categories on the basis of size: small,�30 cells ( K); medium, 30 –150 cells ( L);and large, �150 cells ( M ). Scale bars: K, L, 50 �m; M, 1 mm.
Carter et al. • Multipotency of Olfactory Horizontal Basal Cells J. Neurosci., June 23, 2004 • 24(25):5670 –5683 • 5677

packed, tightly adherent cells. Averagepopulation doubling time from 7 to 14DIV on collagen was 109 hr for small col-onies, 68.4 hr for medium colonies, and 28hr for large colonies. After 14 DIV on acollagen matrix, ICAM-1� cells could bedetected in 95–100% of large colonies, 60 –65% of the medium colonies, and very few(0 –5%) of the small colonies (data notshown). Assayed at 14 DIV, the large colo-nies were highly heterogeneous forICAM-1 expression, containing 5– 65%ICAM-1� cells/total cells in colony.
Improving cloning efficiency of ICAM-1� HBCs by reproducing componentsof the olfactory microenvironmentThe HBC expression profile of � and �integrins (Fig. 2) demonstrated that invivo, HBCs express potential receptors forcollagen, laminin, or fibronectin. CollagenIV and laminin are also the primary com-ponents of the olfactory basal lamina (Jul-liard and Hartmann, 1998). We thus testedwhether in a standard medium of DMF/10, a mixed matrix that may better simu-late the endogenous olfactory basal lam-ina, could promote the ability of ICAM-1-selected cells to adhere, self-replicate, andproduce colonies. In results parallelingthose of the adhesion kinetics experiment(Fig. 6B), laminin and fibronectin alonewere less effective at promoting HBC ad-hesion than collagen alone, and 54.9 and42.5% as effective at producing colonies(Fig. 7A). On collagen, the different classesof colony size were equally represented(Fig. 7B). On fibronectin and lamininalone, however, �75% of colonies at 14DIV were dispersed, small colonies (�30cells) (Fig. 7B). When collagen was mixedwith laminin (either in 1:2 or 2:1 ratio),however, total cloning efficiency was in-creased 140 –160% over collagen alone(Fig. 7A). The increase in cloning effi-ciency on a mixed collagen:laminin sub-strate reflects a specific and significant in-crease in the representation of largecolonies, where large colony formationwas increased fourfold on a mixed lamin-in:collagen matrix compared with colla-gen (Fig. 7B).
Using Opti4 on collagen as the baseline (control) media, wethen tested mitogens for their ability to improve cloning effi-ciency and expansion of ICAM-1� cells. Initial experiments in-dicated that EGF, a mitogen known to enhance progenitor pro-liferation in the OE in vivo and in vitro, would stimulate colonyformation in Opti4, with no observable change for EGF in DMF/10% (Mahanthappa and Schwarting, 1993; Farbman and Buch-holz, 1996; Getchell et al., 2000). Both EGF and TGF� in Opti4were the single mitogens with the most significant improvementin cloning efficiency (224.9 and 188.7% over Opti4 alone, respec-tively), whereas EGF combined with TGF� was the most effective
mitogen mixture overall (289.3% better than Opti4 alone) (Fig.7C). In Opti4, neither � FGF (data not shown) nor LIF signifi-cantly enhanced the initial number of colonies obtained. Theincrease in cloning efficiency with EGF and TGF� once againreflected a specific increase in the representation of large colonies,with little change in the incidence of small or medium colonies(Fig. 7C,D). When compared with Opti4 alone, the representa-tion of large colonies increased 10-fold with EGF, fourfold withLIF, and fivefold with TGF� (Fig. 7D). In addition, large ICAM-1�-seeded colonies plated in Opti4 with LIF (10 ng/ml) withoutadditional media changes were capable of surviving, slowly ex-
Figure 7. Optimizing cloning efficiency of ICAM-1-selected cells by substrate and growth factor selection. A, At clonal density,single ICAM-1� cells adhered to a collagen (C) matrix, but overall cloning efficiency was significantly enhanced when collagenwas mixed with laminin (L) in a 1:2 ratio. Overall cloning efficiency was diminished when fibronectin (Fn) was included as asubstrate (n � 4). B, The relative percentage of large colonies increased on a collagen:laminin mixed substrate, whereas alaminin-rich environment promoted the growth of small colonies at the expense of large colonies (n � 4). C, Overall cloningefficiency of ICAM-1� HBCs on collagen, tested in Opti-MEM/4% FCS, was significantly enhanced in the presence of EGF (10ng/ml) and further enhanced when a mixture of EGF and TGF� (0.5 ng/ml) was used. D, Predominantly small colonies weregenerated from all ICAM-1� cells grown in Opti-MEM with 4%FCS alone. However, the addition of EGF, LIF, and TGF� signifi-cantly increased the percentage of large colonies obtained primarily at the expense of small colonies. Statistical significance wascalculated using a Student’s t test (n � 4 – 6). *p � 0.05; **p � 0.01; *** p � 0.0005. E, For FACS, live cells were first gated by7-AAD exclusion. F, G, They were then gated for ICAM-1 positivity ( F) (R2; 12.3 � 1.9% of live cells) or ICAM-1/�1 doublepositivity (R3; 6.2 � 0.8% of live cells) before plating ( G).
5678 • J. Neurosci., June 23, 2004 • 24(25):5670 –5683 Carter et al. • Multipotency of Olfactory Horizontal Basal Cells

panding, and maintaining their in vitro phenotype for 4 – 6months, whereas small and medium colonies did not survivebeyond 4 weeks under these conditions (data not shown).
Having identified conditions that would improve the survivaland cloning efficiency of MACS-isolated ICAM-1� cells, we thenperformed FACS isolation of ICAM-1� cells and doubly positiveICAM-1�/�1 integrin� cells. Using gating conditions for livecells, which highly expressed each of these antigens (Fig. 6F,G),we obtained 9814 � 2179 ICAM-1� cells per mouse OE (12.27 �1.9%) and 4654 � 396 ICAM-1�/�1 integrin� cells per mouseOE (6.24 � 0.86%) from the fraction already shown to containthe highest number of colony-forming cells. This yield was notsignificantly different when whole, unfractionated OE was usedas source material, and is in line with the total estimated percent-age of ICAM-1� cells per total number of cells in OE (6.59 �1.24%) in vivo. Although we obtained 45–50% fewer ICAM-1�live (7AAD�) (Fig. 6E) cells with FACS as opposed to MACS,this selection approach is more rigorous (�95% pure), and theoverall cloning efficiency for ICAM-1� (0.28 � 0.17%) in base-line control conditions (DMF/10 on collagen) was comparablewith that obtained with MACS selection. Similarly, when FACS-sorted cells were plated on collagen/laminin instead of collagenalone, cloning efficiency was increased 1.59-fold, with large col-onies enriched at the expense of small colonies. All colonies weretested for secondary cloning, but, regardless of initial growth con-dition, neither small nor medium colonies appeared capable offorming adherent secondary colonies after passaging under theseconditions. However, 30 –35% of large colonies expanded onlaminin/collagen were capable of forming adherent secondaryand tertiary colonies, with similarly low frequency (0.2– 0.4%cloning efficiency) to primary selected cells, in DMF10. The ratioof new colonies obtained (small � medium � large) was similarto that seen in primary colony formation. When HBCs were se-lected on the basis of ICAM-1�/�1 integrin� double selection,cloning efficiency was only 57% of that of ICAM-1� cells oncollagen but was significantly enhanced when the cells wereseeded onto a laminin/collagen mixed matrix or grown in DMF/10. The most significant difference in double-selected cells wasthe prevalence of small colonies, particularly when laminin wasincluded in the matrix. Small colonies comprised 70 –75% of allcolonies seeded by ICAM-1�/� 1 integrin � cells.
ICAM-1� HBC-seeded colonies produce multipledifferentiated progeny that are neuronal, glial, andolfactory specificThe small colonies from either ICAM-1� or ICAM-1�/�-1�selection demonstrated limited capacity to proliferate, and theirdifferentiated progeny were subsequently assayed as being pre-dominantly glial (S100� or GFAP positive), with no evidence forneuronal progeny. In contrast, large colonies contained the high-est percentage of ICAM-1�/�4 integrin-positive cells, displayedthe maximal responses to EGF, TGF�, and LIF (in vivo ligandsthat regulate OE neurogenesis), and were therefore hypothesizedto contain the highest representation of neuroglial progenitors(potential stem cells). We therefore examined the potential forlarge colonies to generate a variety of differentiated progenyfound within the olfactory system. ICAM-1� cells were plated assingle cells in either DMF/10 or Opti4 with EGF and LIF on acollagen/laminin substrate. After assessment of cloning efficiencyat 14 DIV, all colonies were switched to fresh DMF/10 and al-lowed to differentiate for an additional 2– 6 weeks. The resultingcolonies (from 1–2 months in vitro) contained a core of adhesivecells with a variety of progeny that migrated either away from or
on top of the colony and that exhibited a wide range of cellularmorphologies and phenotypes (Fig. 8).
Within the colony core, a large percentage of the cells segre-gated into subpopulations that coexpressed ICAM-1 and �4 in-
Figure 8. A single ICAM-1-selected horizontal basal cell can produce multiple differentiatedneuronal and glial progeny. After the expansion of single ICAM-1� cell into a colony on alaminin-collagen mixed substrate, ICAM-1 (CD54; A, green; DAPI nuclear stain) continues to beexpressed in subpopulations of cells at the core of the adherent colony that also express ( B) �4
integrin (CD104; red). Small islands of cells positive for the GBC-2 (green) were also foundwithin some large colonies. Cells migrating up from the colony were found to express �-III NST( D) (TuJ1�) and have a bipolar morphology (green) and a multipolar morphology (E, red).Long bipolar cells, which formed streams of migrating cells leaving colonies and extendingprocesses across the matrix, demonstrated robust process and cell body expression of the ACIII(F, red) and the Golf (G, green). H, The OMP (red) is expressed in the cell bodies (overlapping withDAPI to become purple) and some processes of cells with a bipolar morphology, which werefound growing with other OMP-negative cells. I, Highest OMP expression levels were found incells that had migrated into a substrate-rich, cell-poor region of the culture. Populations of cellsresembling olfactory ensheathing cells (S100�, green; p75 red) were frequently found in clus-ters but infrequently alone. Large colonies also generated intermingling populations of spindlyS100�� glial cells (K, red), NST� neurons (green), and flattened GFAP� glial cells (L, blue)lying beneath networks of NST� (green) neurons.
Carter et al. • Multipotency of Olfactory Horizontal Basal Cells J. Neurosci., June 23, 2004 • 24(25):5670 –5683 • 5679

tegrin (CD54�/CD104�) (Fig. 8A,B). A significant degree ofheterogeneity was also created within the colony core, however,where some regions were strongly ICAM-1/�4-positive and otherlarger, flattened cells were negative for either or both proteins(Fig. 8A,B). Cells expressing the globose basal cell marker,GBC-2, could occasionally be found grouped together (Fig. 8C)(Goldstein and Schwob, 1996). Type III �-NST (TuJ1) expres-sion was detected in cells that exhibited a variety of neuronalmorphologies (Roskams et al., 1998). These included bipolar cellsresembling developing ORNs (Fig. 8D) and highly multipolarcells (most often found on a bed of sheet-like colony-derivedcells), which do not resemble immature or mature ORNs (Fig.8E). From 28 –56 DIV, some small networks of bipolar, fascicu-lating cells that migrated away from the edge of the colony werefound to express type III adenylate cyclase (ACIII) (Fig. 8F) andthe olfactory G-protein (Golf) (Fig. 8G) throughout their cellbodies and processes. A small percentage of cells (�2% of cellswith a bipolar neuronal morphology) also expressed the OMP(Farbman and Margolis, 1980) and exhibited a characteristic bi-polar morphology of ORNs either when networking together(Fig. 8H) or after migrating from the colony as individual cells(Fig. 8 I). Large flattened migratory groups of cells, which ap-peared in the majority of differentiated cultures, coexpressed theolfactory ensheathing cell markers S100 � and p75 (Fig. 8 J) orp75 with glial fibrillary acidic protein (data not shown) (for re-view, see Ramon-Cueto and Avila, 1998). Mixed populations ofneuronal (NST) and glial (either S100� or GFAP�) cells werealso found interdigitating, where the neuronal cells were almostalways arranged along the beds of glial cells (Fig. 8K,L).
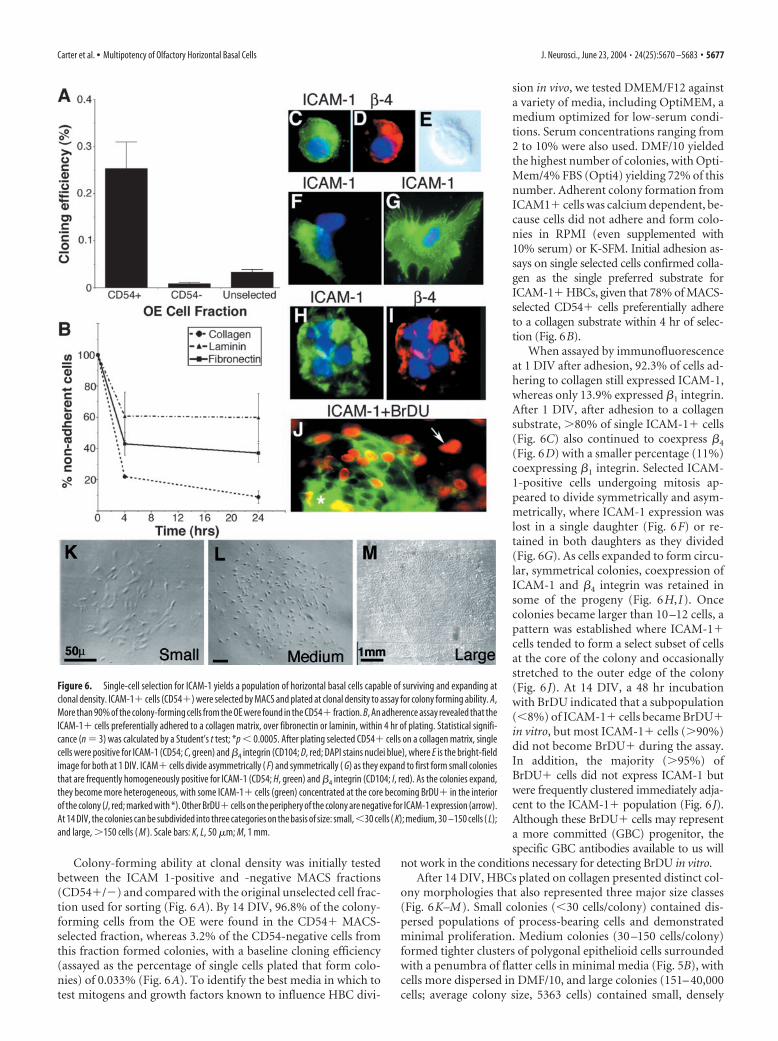
DiscussionIn this study, we identified a subpopulation of HBCs in vivo withan adhesion receptor expression profile similar to non-neuralstem cells that can be clonally selected in defined in vitro condi-tions mimicking the olfactory microenvironment and generatemultiple glial, neuronal, and progenitor phenotypes found in themouse olfactory mucosa.
After olfactory bulb removal and widespread mature ORNapoptosis, a highly zonal pattern of neurogenesis is initiated inadjacent basal regions of OE (Fig. 1) (Carr and Farbman, 1992;Huard et al., 1998; Schwob, 2002). This is likely because of highlylocalized changes in induction or repression signaling from apo-ptotic ORNs (Cowan et al., 2001; Bauer et al., 2003), combinedwith differential shifts in lateral inhibition from adjacent cells,collectively removing inhibitory signals that permit only a subsetof basal cells to respond to a mitotic stimulus (Shou et al., 2000;Morrison, 2001; Watt, 2001). Surprisingly, the contralateral OEalso demonstrates a delayed but significant increase in basal cellmitosis, suggestive of a contralateral feedback neurogenesis inresponse to the loss of ipsilateral ORN input into the CNS (Fig.1). At the peak of neurogenesis, most mitotic cells were presump-tive GBCs, not HBCs (Fig. 1), consistent with a demonstratedGBC contribution to ORN genesis (Caggiano et al., 1994; Huardand Schwob, 1995). However, the most pluripotent progenitorsof non-neural systems (true stem cells) are tightly regulated topreserve genomic integrity and divide rarely, opening the possi-bility that rarely dividing HBCs could still contain candidate po-tential OE stem cells.
However, HBCs lack expression of standard neural progenitormarkers (Calof et al., 1998) and, although located in a neuroepi-thelium, bear a closer antigenic resemblance to non-nervous sys-tem epithelial stem cells of the epidermis, prostate, and colon(Potten and Booth, 2002; Watt, 2002). HBCs express ICAM-1,
which regulates the mitosis of hematopoietic stem–progenitorcells in the bone marrow microenvironment (Arkin et al., 1991),and �1 and �4 integrins, which are restricted to the basal surfaceof many (but not all) HBCs, where complexes with �1, �3, or �6
integrin could form receptors for collagen, fibronectin, and lami-nin in the basal lamina (Fig. 2). ICAM-1 is coexpressed withcytokeratin in HBCs, but its overlap with either �1 or �4 integrinis more heterogeneous (Fig. 2), in accord with alternating patchesof OE that demonstrate high and low integrin expression (Fig. 3).Because basal cell mitosis is compartmentalized in similar spa-tially arranged zones (Fig. 1), differential �-integrin expressioncould delineate distinct territories of potential stem cells or pro-genitor subpopulations within the HBC population, directly par-alleling integrin-mediated regulation of progenitor proliferationand differentiation in the epidermis (Adams and Watt, 1991;Fuchs et al., 1997) and also the regulation of cerebellar progenitordifferentiation by a �-integrin–laminin-mediated signaling(Blaess et al., 2004). In the OE, the heterogeneity of �1 and �4
integrin distribution in HBCs may thus designate molecularboundaries of more active versus quiescent HBC zones of neuro-genesis (Graziadei and Graziadei, 1979a; Aiba et al., 1993; Getch-ell et al., 2000). Several of the HBC-based integrin signaling com-ponents reported here have also been highlighted as potentiallythe most highly conserved pathways in stem cell biology(Ramalho-Santos et al., 2002)
Apoptotic mature ORNs direct progenitor proliferation usinga directed program different from that induced when ORNs die anonapoptotic death, after detergent or MeBr ablation (Figs. 1, 3)(Roskams et al., 1998; Schwob, 2002; Jang et al., 2003). At thepeak of apoptosis-induced mitosis, HBCs adjacent to dividingHBCs and GBCs increase adhesion receptor expression, presum-ably enhancing their retention on the basal lamina, whereas theirmore mobile neighbors participate in epithelial remodeling andneurogenesis (Fig. 3). Does the basal lamina of the OE thuschange locally to inhibit or facilitate mitosis, or do extracellularsignals first downregulate adhesion receptor expression in HBCsand then shift them into a more promitotic state? In the epider-mis, a number of mechanisms [including localized secretion ofmatrix metalloproteases (MMPs)] locally alter the ECM niche,thus reducing integrin expression in progenitors (Watt, 2002).Similarly, in the OE, local ensheathing cells (which secrete basallamina ECM), are ideally situated to detect the loss of matureORN axons and remodel basal lamina via MMPs or ECM secre-tion in a highly localized manner (summarized in Fig. 9) (Au andRoskams, 2003; Tsukatani et al., 2003).
Consistent with combinatorial adhesion receptor expressionsuggestive of a progenitor-like capacity, HBCs expressingICAM-1 with �1 or �4 integrin generated �95% of the OE ad-herent colony-forming units at clonal density (Figs. 5–7), similarto heterogeneous colonies derived from �1 integrin-expressingputative stem cells of the epidermis (Jones and Watt, 1993). Im-mediately after adhesion in vitro, single cells coexpressed ICAM-1with either �1 or �4 integrin and expanded symmetrically andasymmetrically to form increasingly heterogeneous coloniescontaining expanded populations of morphologically similarBrDU-positive and negative ICAM-1� HBCs and also mitoticICAM-negative progeny (Fig. 6). The heterogeneity of ICAM-1�HBC-seeded colonies is similar to epidermal keratinocytes,where a continuum of colony-forming progenitors of varyingproliferative and differentiative capacities produce smaller colo-nies initiated by transit amplifying cells and larger coloniesseeded by cells with a more stem-like potential (Barrandon andGreen, 1987).
5680 • J. Neurosci., June 23, 2004 • 24(25):5670 –5683 Carter et al. • Multipotency of Olfactory Horizontal Basal Cells
After selection, the overall cloning efficiency of ICAM-1�HBCs was maximal on a mixed collagen-laminin matrix mostclosely mimicking OE basal lamina (Julliard and Hartmann,1998) (Fig. 7) that would also maximally stimulate the integrincombinations expressed on subsets of HBCs in vivo (Fig. 2).Laminin alone enhanced formation of small colonies that dem-onstrated a limited proliferative capacity and morphologicalcharacteristics similar to glial-restricted precursors (GRPs) (Raoet al., 1998) and primarily glial progeny. ICAM-1�/�1 integrin-positive FACS-isolated cells (Fig. 7) yielded almost exclusivelysmall colonies, suggesting that a laminin-�1 integrin pathwayappears to bias toward an HBC-derived glial-committed progen-itor phenotype. Medium colonies also produced glial progeny,but some colonies were neuronal, producing small populationsof immature NST-expressing cells closely resembling the short-lived neuronal progenitor colonies derived from NCAM-negative embryonic OE (Mumm et al., 1996).
Large colony production (cloning efficiency and expansion)was specifically enhanced on mixed collagen–laminin and con-tained the highest percentage of ICAM-1� cells after 14 DIV.
Expanded populations of HBCs coexpressing ICAM-1 with �4
integrin (Figs. 2, 3; Table 1) were found primarily in large colo-nies, the only colonies that could generate secondary and tertiarycolonies (Fig. 8). Again, primarily large colonies containedgrouped populations of GBC-2-positive GBCs, which, althoughpresumably generated from an ICAM-1-expressing founder cell,could themselves then contribute to the production of morecommitted progeny within the colony (Chen et al., 2004; Iwemaet al., 2004; McMillan Carr et al., 2004). We surmise that largecolonies were likely seeded by HBC-derived ICAM-1� cells ex-
pressing the highest levels of combinations of mixed � and �integrins (where �4 complexes increase response to mixed ma-trix), which in turn represent the more multipotent progenitors.
EGF and TGF� together most significantly enhanced thecloning efficiency and production of larger colonies fromICAM-1� HBCs, presumably via the HBC-expressed EGFreceptor (Krishna et al., 1996). Given that multiple progenitorphenotypes exist in the OE, EGF signaling may regulate a switchbetween more committed and less committed progenitors, as itdoes elsewhere in the nervous system (Doetsch et al., 2002). LIFdid not significantly enhance cloning efficiency but did increaseboth survival and size of large colonies obtained. Because apopto-tic (and not necrotic) ORNs upregulate both LIF (Getchell et al.,2002; Bauer et al., 2003) and nerve growth factor (Roskams et al.,1996), LIF could positively direct proliferation and survival viaLIF receptors (on GBC subpopulations), which could laterallyinhibit HBC division and differentiation and promote the reten-tion of a more stable stem-like HBC population (Oka et al.,2002). The differential lifespan, size, and passage-ability of thecolonies here closely parallels that seen in ependymal and sub-ependymal clones (Chiasson et al., 1999), whereas smaller, short-term, dispersed colonies displayed heterogeneous phenotypesconsistent with the short-term committed progenitors generatedfrom an NCAM-negative fraction of embryonic OE (Mumm etal., 1996), colony-forming restricted progenitors from the devel-oping retina (Cayouette et al., 2003), and glial-restricted precur-sors from the developing neural tube (Rao et al., 1998).
Fourteen days after initial colony formation, FBS stimulatedthe spontaneous generation of more highly heterogeneous differ-entiated cells (both glial and neuronal) from individual large col-onies (Fig. 8). The olfactory ACIII, Golf, and the OMP arose inrare (�2%) bipolar cells that usually migrated away from colo-nies, demonstrating that a small number of ORN-like cells werespontaneously generated. Each large colony examined demon-strated subpopulations of cells coexpressing the glial markersS100� with either p75 or GFAP in an expression pattern reminis-cent of OECs and developing Schwann cells (for review, seeRamon-Cueto and Avila, 1998). In addition to classic bipolarIRN-like cells, some multipolar cells expressing NST were gener-ated that did not resemble any cells yet reported in ORN cultures(Calof and Chikaraishi, 1989; Mahanthappa and Schwarting,1993; Farbman and Buchholz, 1996; Roskams et al., 1996). Thepresence of nonolfactory neuronal and glial lineages derivedfrom defined progenitors obtained from the OE basal cell layer invitro has not been previously reported, although alternative neu-ronal and glial lineages are generated from olfactory progenitorsin embryonic development (Wray et al., 1989). This suggests thatICAM-1�/�1-negative HBCs that seed large colonies have agreater degree of pluripotency than other previously reportedprogenitors from the OE (Mumm et al., 1996; Chen et al., 2004)that may be controlled in part by the ECM environment of theirlocation, at the interface between neuronal and glial environ-ments (Fig. 9). A model has thus emerged in which the OE con-tains multiple progenitor subtypes (Fig. 9A–D, inset), where largecolonies are comprised of A (HBCs), A* (mitotic HBCs), B(GBCs), and C (OEC-GRPs), medium colonies are initiated byA* and also contain either B or C, and small colonies are seededby A* cells, which transition immediately to B or C.
In conclusion, we examined the dynamics of quiescent andactivated OE progenitor populations in vivo and identified acharacteristic adhesion receptor signature of putative multipo-tent progenitors in HBCs of the OE. Our findings suggest thatconvergent integrin and primitive growth factor pathways regu-
Figure 9. Factors that regulate the interaction of progenitor subtypes in the olfactory epi-thelium. HBCs can self renew (size of curved arrow indicates capacity to divide–self-renew) andexist in a tightly adherent and loosely adherent (HBC*) mitotic phenotypes, which are differen-tiated by their expression levels of ICAM-1 (yellow) and � and � integrin complexes (orangearrows). A more restricted neuronal-sustentacular (SUS) progenitor is found in the GBC popu-lation, whereas a gliogenic precursor can also be derived from mitotic HBCs. ECM gradients forlaminin, collagen, and fibronectin are indicated, along with the factors that combine withmatrix stimulation to positively regulate the balance between progenitor subtypes and imma-ture and mature cells within the OE and lamina propria. Inset simplifies the relationship be-tween different OE progenitor subtypes, where B (GBC) and C (OEC-GRPs) reside in entirelydifferent ECM, cell– cell, and growth factor environments within the OE and lamina propria.
Carter et al. • Multipotency of Olfactory Horizontal Basal Cells J. Neurosci., June 23, 2004 • 24(25):5670 –5683 • 5681

late OE-derived progenitors in vivo and in vitro (Fig. 9). The HBCintegrin profile lead us to develop selective in vitro ECM andgrowth factor microenvironments that can promote retention ofan HBC phenotype in vitro. HBCs now emerge as a heteroge-neous population containing candidate progenitors that can gen-erate olfactory (and nonolfactory) neural lineages as well as glialcells and GBCs from single cells. These data suggest parallels torelated CNS-derived progenitor populations (Chiasson et al.,1999), where two adjacent OE basal cell populations contain twomain subpopulations of progenitors, one of which is more com-mitted to generate OE-based cells (ORNs, sustentacular cells)and the other (the HBC-derived population examined here) isneuroglial. These accessible OE-derived HBC progenitors maynot only hold potential for the development of autologous ther-apeutic approaches in animal models but also for probing theinterface of ECM and growth factor signaling in neuroglial pro-genitor regulation.
ReferencesAdams JC, Watt FM (1990) Changes in keratinocyte adhesion during ter-
minal differentiation: reduction in fibronectin binding precedes alpha 5beta 1 integrin loss from the cell surface. Cell 63:425– 435.
Adams JC, Watt FM (1991) Expression of beta 1, beta 3, beta 4, and beta 5integrins by human epidermal keratinocytes and non-differentiating ker-atinocytes. J Cell Biol 115:829 – 841.
Aiba T, Mori J, Nakai Y (1993) Nerve growth factor (NGF) and its receptorin rat olfactory epithelium. Acta Otolaryngol Suppl (Stockh) 506:37– 40.
Arkin S, Naprstek B, Guarini L, Ferrone S, Lipton JM (1991) Expression ofintercellular adhesion molecule-1 (CD54) on hematopoietic progenitors.Blood 77:948 –953.
Au E, Roskams AJ (2003) Olfactory ensheathing cells of the lamina propriain vivo and in vitro. Glia 41:224 –236.
Barrandon Y, Green H (1987) Three clonal types of keratinocyte with dif-ferent capacities for multiplication. Proc Natl Acad Sci USA84:2302–2306.
Bauer S, Rasika S, Han J, Mauduit C, Raccurt M, Morel G, Jourdan F,Benahmed M, Moyse E, Patterson PH (2003) Leukemia inhibitory fac-tor is a key signal for injury-induced neurogenesis in the adult mouseolfactory epithelium. J Neurosci 23:1792–1803.
Blaess S, Graus-Porta D, Belvindrah R, Radakovits R, Pons S, Littlewood-Evans A, Senften M, Guo H, Li Y, Miner JH, Reichardt LF, Muller U(2004) Beta1-integrins are critical for cerebellar granule cell precursorproliferation. J Neurosci 24:3402–3412.
Booth C, Potten CS (2000) Gut instincts: thoughts on intestinal epithelialstem cells. J Clin Invest 105:1493–1499.
Caggiano M, Kauer JS, Hunter DD (1994) Globose basal cells are neuronalprogenitors in the olfactory epithelium: a lineage analysis using areplication-incompetent retrovirus. Neuron 13:339 –352.
Calof AL, Chikaraishi DM (1989) Analysis of neurogenesis in a mammalianneuroepithelium: proliferation and differentiation of an olfactory neuronprecursor in vitro. Neuron 3:115–127.
Calof AL, Mumm JS, Rim PC, Shou J (1998) The neuronal stem cell of theolfactory epithelium. J Neurobiol 36:190 –205.
Carr VM, Farbman AI (1992) Ablation of the olfactory bulb up-regulatesthe rate of neurogenesis and induces precocious cell death in olfactoryepithelium. Exp Neurol 115:55–59.
Cayouette M, Barres BA, Raff M (2003) Importance of intrinsic mecha-nisms in cell fate decisions in the developing rat retina. Neuron40:897–904.
Chen X, Fang H, Schwob JE (2004) Multipotency of purified, transplantedglobose basal cells in olfactory epithelium. J Comp Neurol 469:457– 474.
Chiasson BJ, Tropepe V, Morshead CM, van der Kooy D (1999) Adultmammalian forebrain ependymal and subependymal cells demonstrateproliferative potential, but only subependymal cells have neural stem cellcharacteristics. J Neurosci 19:4462– 4471.
Costanzo RM, Graziadei PP (1983) A quantitative analysis of changes in theolfactory epithelium following bulbectomy in hamster. J Comp Neurol215:370 –381.
Cowan CM, Thai J, Krajewski S, Reed JC, Nicholson DW, Kaufmann SH,Roskams AJ (2001) Caspases 3 and 9 send a pro-apoptotic signal from
synapse to cell body in olfactory receptor neurons. J Neurosci21:7099 –7109.
DeHamer MK, Guevara JL, Hannon K, Olwin BB, Calof AL (1994) Genesisof olfactory receptor neurons in vitro: regulation of progenitor cell divi-sions by fibroblast growth factors. Neuron 13:1083–1097.
Doetsch F, Petreanu L, Caille I, Garcia-Verdugo JM, Alvarez-Buylla A (2002)EGF converts transit-amplifying neurogenic precursors in the adult braininto multipotent stem cells. Neuron 36:1021–1034.
Farbman AI (1990) Olfactory neurogenesis: genetic or environmental con-trols? Trends Neurosci 13:362–365.
Farbman AI, Buchholz JA (1996) Transforming growth factor-alpha andother growth factors stimulate cell division in olfactory epithelium invitro. J Neurobiol 30:267–280.
Farbman AI, Margolis FL (1980) Olfactory marker protein during ontog-eny: immunohistochemical localization. Dev Biol 74:205–215.
Frisch SM, Francis H (1994) Disruption of epithelial cell-matrix interac-tions induces apoptosis. J Cell Biol 124:619 – 626.
Fuchs E, Dowling J, Segre J, Lo SH, Yu QC (1997) Integrators of epidermalgrowth and differentiation: distinct functions for beta 1 and beta 4 inte-grins. Curr Opin Genet Dev 7:672– 682.
Gage FH (2000) Mammalian neural stem cells. Science 287:1433–1439.Getchell TV, Narla RK, Little S, Hyde JF, Getchell ML (2000) Horizontal
basal cell proliferation in the olfactory epithelium of transforming growthfactor-alpha transgenic mice. Cell Tissue Res 299:185–192.
Getchell TV, Shah DS, Partin JV, Subhedar NK, Getchell ML (2002) Leuke-mia inhibitory factor mRNA expression is upregulated in macrophagesand olfactory receptor neurons after target ablation. J Neurosci Res67:246 –254.
Goldstein BJ, Schwob JE (1996) Analysis of the globose basal cell compart-ment in rat olfactory epithelium using GBC-1, a new monoclonal anti-body against globose basal cells. J Neurosci 16:4005– 4016.
Graziadei GA, Graziadei PP (1979a) Neurogenesis and neuron regenerationin the olfactory system of mammals. II. Degeneration and reconstitutionof the olfactory sensory neurons after axotomy. J Neurocytol 8:197–213.
Graziadei PP, Graziadei GA (1979b) Neurogenesis and neuron regenerationin the olfactory system of mammals. I. Morphological aspects of differen-tiation and structural organization of the olfactory sensory neurons.J Neurocytol 8:1–18.
Huard JM, Schwob JE (1995) Cell cycle of globose basal cells in rat olfactoryepithelium. Dev Dyn 203:17–26.
Huard JM, Youngentob SL, Goldstein BJ, Luskin MB, Schwob JE (1998)Adult olfactory epithelium contains multipotent progenitors that give riseto neurons and non-neural cells. J Comp Neurol 400:469 – 486.
Hynes RO (1992) Integrins: versatility, modulation, and signaling in celladhesion. Cell 69:11–25.
Iwema CL, Fang H, Kurtz DB, Youngentob SL, Schwob JE (2004) Odorantreceptor expression patterns are restored in lesion-recovered rat olfactoryepithelium. J Neurosci 24:356 –369.
Jang W, Youngentob SL, Schwob JE (2003) Globose basal cells are requiredfor reconstitution of olfactory epithelium after methyl bromide lesion.J Comp Neurol 460:123–140.
Jones PH, Watt FM (1993) Separation of human epidermal stem cells fromtransit amplifying cells on the basis of differences in integrin function andexpression. Cell 73:713–724.
Julliard AK, Hartmann DJ (1998) Spatiotemporal patterns of expression ofextracellular matrix molecules in the developing and adult rat olfactorysystem. Neuroscience 84:1135–1150.
Krishna NS, Little SS, Getchell TV (1996) Epidermal growth factor receptormRNA and protein are expressed in progenitor cells of the olfactory epi-thelium. J Comp Neurol 373:297–307.
Luskin MB (1993) Restricted proliferation and migration of postnatallygenerated neurons derived from the forebrain subventricular zone. Neu-ron 11:173–189.
Mahanthappa NK, Schwarting GA (1993) Peptide growth factor control ofolfactory neurogenesis and neuron survival in vitro: roles of EGF andTGF-beta s. Neuron 10:293–305.
McKay R (2000) Stem cells and the cellular organization of the brain. J Neu-rosci Res 59:298 –300.
McMillan Carr V, Ring G, Youngentob SL, Schwob JE, Farbman AI (2004)Altered epithelial density and expansion of bulbar projections of a discreteHSP70 immunoreactive subpopulation of rat olfactory receptor neurons
5682 • J. Neurosci., June 23, 2004 • 24(25):5670 –5683 Carter et al. • Multipotency of Olfactory Horizontal Basal Cells

in reconstituting olfactory epithelium following exposure to methyl bro-mide. J Comp Neurol 469:475– 493.
Morrison SJ (2001) Neuronal potential and lineage determination by neuralstem cells. Curr Opin Cell Biol 13:666 – 672.
Mumm JS, Shou J, Calof AL (1996) Colony-forming progenitors frommouse olfactory epithelium: evidence for feedback regulation of neuronproduction. Proc Natl Acad Sci USA 93:11167–11172.
Oka M, Tagoku K, Russell TL, Nakano Y, Hamazaki T, Meyer EM, Yokota T,Terada N (2002) CD9 is associated with leukemia inhibitory factor-mediated maintenance of embryonic stem cells. Mol Biol Cell13:1274 –1281.
Potten CS, Booth C (2002) Keratinocyte stem cells: a commentary. J InvestDermatol 119:888 – 899.
Potten CS, Loeffler M (1990) Stem cells: attributes, cycles, spirals, pitfalls anduncertainties. Lessons for and from the crypt. Development 110:1001–1020.
Ramalho-Santos M, Yoon S, Matsuzaki Y, Mulligan RC, Melton DA (2002)“Stemness”: transcriptional profiling of embryonic and adult stem cells.Science 298:597– 600.
Ramon-Cueto A, Avila J (1998) Olfactory ensheathing glia: properties andfunction. Brain Res Bull 46:175–187.
Rao MS, Noble M, Mayer-Proschel M (1998) A tripotential glial precursorcell is present in the developing spinal cord. Proc Natl Acad Sci USA95:3996 – 4001.
Roskams AJ, Bethel MA, Hurt KJ, Ronnett GV (1996) Sequential expressionof Trks A, B, and C in the regenerating olfactory neuroepithelium. J Neu-rosci 16:1294 –1307.
Roskams AJ, Cai X, Ronnett GV (1998) Expression of neuron-specific beta-III tubulin during olfactory neurogenesis in the embryonic and adult rat.Neuroscience 83:191–200.
Sastry SK, Horwitz AF (1996) Adhesion-growth factor interactions duringdifferentiation: an integrated biological response. Dev Biol 180:455– 467.
Schwob JE (2002) Neural regeneration and the peripheral olfactory system.Anat Rec 269:33– 49.
Schwob JE, Szumowski KE, Stasky AA (1992) Olfactory sensory neurons aretrophically dependent on the olfactory bulb for their prolonged survival.J Neurosci 12:3896 –3919.
Schwob JE, Youngentob SL, Meiri KF (1994) On the formation of neuro-mata in the primary olfactory projection. J Comp Neurol 340:361–380.
Shou J, Rim PC, Calof AL (1999) BMPs inhibit neurogenesis by a mecha-nism involving degradation of a transcription factor. Nat Neurosci2:339 –345.
Shou J, Murray RC, Rim PC, Calof AL (2000) Opposing effects of bonemorphogenetic proteins on neuron production and survival in the olfac-tory receptor neuron lineage. Development 127:5403–5413.
Suzuki Y, Takeda M (1993) Basal cells in the mouse olfactory epitheliumduring development: immunohistochemical and electron-microscopicstudies. Brain Res Dev Brain Res 73:107–113.
Tsukatani T, Fillmore HL, Hamilton HR, Holbrook EH, Costanzo RM(2003) Matrix metalloproteinase expression in the olfactory epithelium.NeuroReport 14:1135–1140.
van der Kooy D, Weiss S (2000) Why stem cells? Science 287:1439 –1441.Watt FM (2001) Stem cell fate and patterning in mammalian epidermis.
Curr Opin Genet Dev 11:410 – 417.Watt FM (2002) Role of integrins in regulating epidermal adhesion, growth
and differentiation. EMBO J 21:3919 –3926.Weiler E, Farbman AI (1997) Proliferation in the rat olfactory epithelium:
age-dependent changes. J Neurosci 17:3610 –3622.Weiss S, van der Kooy D (1998) CNS stem cells: where’s the biology (a.k.a.
beef)? J Neurobiol 36:307–314.Wray S, Grant P, Gainer H (1989) Evidence that cells expressing luteinizing
hormone-releasing hormone mRNA in the mouse are derived from pro-genitor cells in the olfactory placode. Proc Natl Acad Sci USA86:8132– 8136.
Zhu AJ, Haase I, Watt FM (1999) Signaling via beta1 integrins and mitogen-activated protein kinase determines human epidermal stem cell fate invitro. Proc Natl Acad Sci USA 96:6728 – 6733.
Carter et al. • Multipotency of Olfactory Horizontal Basal Cells J. Neurosci., June 23, 2004 • 24(25):5670 –5683 • 5683

![Defects of Tyrosine Hydroxylase-Immunoreactive Neurons in ... · ventral thalamus [zona incerta (Zi)], hypothalamus (paraventricu- lar nucleus), olfactory bulb, and basal telencephalon](https://static.fdocuments.in/doc/165x107/5e030e51d9e2ea2f20418d21/defects-of-tyrosine-hydroxylase-immunoreactive-neurons-in-ventral-thalamus-zona.jpg)