Cellular Response to Membrane Phospholipid Imbalance, in ...
239
Cellular Response to Membrane Phospholipid Imbalance, in Yeast and in Human Disease Jason D Vevea Submitted in partial fulfillment of the requirements for the degree of Doctor of Philosophy under the Executive Committee of the Graduate School of Arts and Sciences COLUMBIA UNIVERSITY 2015
Transcript of Cellular Response to Membrane Phospholipid Imbalance, in ...

Cellular Response to Membrane Phospholipid Imbalance, in Yeast and in Human Disease
Jason D Vevea
Submitted in partial fulfillment of the requirements for the degree of
Doctor of Philosophy under the Executive Committee
of the Graduate School of Arts and Sciences
COLUMBIA UNIVERSITY
2015

© 2015 Jason D Vevea
All rights reserved

Abstract
Cellular Response to Membrane Phospholipid Imbalance, in Yeast and in Human Disease
Jason D Vevea Organelles sequester biological phenomena within the cell, and allow an additional layer
of complexity to life. The presence and maintenance of these organelles is crucial for cellular
function. Two of the most expansive and complex organelles are the mitochondria and
endoplasmic reticulum. These organelles contribute energy, protein folding and secretion,
lipids, calcium regulation, and various other metabolites to the biology of the cell. Importantly,
these organelles accumulate damage and cannot be derived de novo, therefore must be
inherited and maintained in a functioning state. The study of these organelle quality control
processes serves as the basis for my thesis.
We use the budding yeast as a model organism to uncover conserved pathways
affecting organelle, and ultimately cellular homeostasis. In yeast we find mitochondrial
inheritance is critical for cell survival. Furthermore, not only is inheritance critical, but
inheritance of a certain threshold of functional mitochondria appears critical in maintaining
normal lifespan in yeast, identifying mitochondria as an aging determinant.
By examining mutants that negatively affect mitochondrial inheritance in yeast, we
established a role for phosphatidylcholine biosynthesis in organelle maintenance and
inheritance. Glycerophospholipid biosynthesis plays a clear role not only in mitochondrial
inheritance but also in that of the endoplasmic reticulum. We use insights gained from yeast to
guide research into a human disease caused by similar glycerophospholipid biosynthetic
deficiency.

i
Table of Contents
LIST OF FIGURES AND TABLES .............................................................................................................. iii
ACKNOWLEDGEMENTS ............................................................................................................................. v
DEDICATION .............................................................................................................................................. vii
CHAPTER I - INTRODUCTION .................................................................................................................... 1
MITOCHONDRIAL STRUCTURE, MORPHOLOGY, AND DYNAMICS........................................................................ 2 ENDOPLASMIC RETICULUM STRUCTURE, MORPHOLOGY, AND DYNAMICS ......................................................... 4 MITOCHONDRIAL RESPIRATION, REDOX, AND REPAIR (QUALITY CONTROL) ...................................................... 6 ENDOPLASMIC RETICULUM PROTEIN BIOSYNTHESIS AND ER QUALITY CONTROL (ERQC) ................................ 9 ORGANELLE INHERITANCE DURING ASYMMETRIC CELL DIVISION ................................................................... 12 MITOCHONDRIAL INHERITANCE IN YEAST. ................................................................................................... 13 MITOCHONDRIAL MOTILITY DURING INHERITANCE IN BUDDING YEAST ............................................................ 14 ER INHERITANCE ....................................................................................................................................... 18 ER MOTILITY DURING INHERITANCE IN BUDDING YEAST ................................................................................ 18 ER INTERACTIONS WITH MITOCHONDRIA (MAM) ......................................................................................... 19 ANCHORAGE OF MITOCHONDRIA AND ER AT THE YEAST CELL CORTEX ......................................................... 21 MITOCHONDRIAL QUALITY CONTROL AND ITS EFFECT ON LIFESPAN: PROTEIN REPAIR AND COMPLEMENTATION
................................................................................................................................................................ 25 ER QUALITY CONTROL AND ITS EFFECT ON LIFESPAN: DIFFUSION BARRIERS PROMOTE ASYMMETRY OF
INTRACONNECTED ORGANELLES, SUCH AS THE ER. .................................................................................... 27 MITOCHONDRIAL QUANTITY CONTROL DURING CELL CYCLE PROGRESSION: A CELL CYCLE CHECKPOINT THAT
MONITORS MTDNA IN DAUGHTER CELLS ..................................................................................................... 29 MITOCHONDRIAL QUANTITY AND QUALITY CONTROL AS A MECHANISM FOR MOTHER-DAUGHTER AGE
ASYMMETRY .............................................................................................................................................. 31 SKELETAL MUSCLE STRUCTURE AND FUNCTION ........................................................................................... 32 EXCITATION CONTRACTION COUPLING ........................................................................................................ 34
CHAPTER II - MITOCHONDRIAL QUALITY CONTROL DURING INHERITANCE IS ASSOCIATED WITH LIFESPAN AND MOTHER-DAUGHTER AGE ASYMMETRY IN BUDDING YEAST .................... 35
Abstract .............................................................................................................................................. 36 Introduction ......................................................................................................................................... 37 Materials and Methods ....................................................................................................................... 39 Results ................................................................................................................................................ 45 Discussion .......................................................................................................................................... 59 Acknowledgements ............................................................................................................................ 64 Author Contributions ........................................................................................................................... 65 Supplemental Data ............................................................................................................................. 66
CHAPTER III - IDENTIFICATION OF NOVEL PROTEINS AND CELLULAR PROCESSES THAT AFFECT MITOCHONDRIAL INHERITANCE IN SACCHAROMYCES CEREVISIAE .............................. 70
Abstract .............................................................................................................................................. 71 Introduction ......................................................................................................................................... 72 Materials and Methods ....................................................................................................................... 74 Results and Discussion ...................................................................................................................... 76 Acknowledgements ............................................................................................................................ 81 Author Contributions ........................................................................................................................... 82
CHAPTER IV - GLYCEROPHOSPHOLIPID IMBALANCE AFFECTS MITOCHONDRIA AND ER HOMEOSTASIS WHILE LIPID DROPLET BIOGENESIS AND MICROLIPOPHAGY PROMOTE CELLULAR ADAPTATION TO THIS LIPID IMBALANCE IN YEAST ...................................................... 83
Abstract .............................................................................................................................................. 84

ii
Introduction ......................................................................................................................................... 85 Materials and Methods ....................................................................................................................... 87 Results ................................................................................................................................................ 96 Discussion ........................................................................................................................................ 122 Acknowledgments ............................................................................................................................ 127 Author Contributions ......................................................................................................................... 128 Supplemental Figures and Tables .................................................................................................... 129
CHAPTER V - IDENTIFICATION OF SARCOPLASMIC RETICULUM DYSFUNCTION IN A CONGENITAL MUSCULAR DYSTROPHY CAUSED BY GLYCEROPHOSPHOLIPID IMBALANCE .. 143
Abstract ............................................................................................................................................ 144 Introduction ....................................................................................................................................... 145 Materials and Methods ..................................................................................................................... 150 Results .............................................................................................................................................. 153 Discussion ........................................................................................................................................ 162 Acknowledgements .......................................................................................................................... 165 Author Contributions ......................................................................................................................... 166
CHAPTER VI - DISCUSSION ................................................................................................................... 167
MITOCHONDRIA CONTRIBUTE TO AGING AND LIFESPAN CONTROL IN SACCHAROMYCES CEREVISIAE. ............ 170 THE MITOCHONDRIAL NETWORK IN SACCHAROMYCES CEREVISIAE IS HETEROGENEOUS IN TERMS OF REDOX
POTENTIAL. ............................................................................................................................................. 171 IDENTIFICATION OF MFB1P AS A MOTHER SPECIFIC MITOCHONDRIAL RETENTION FACTOR ............................ 174 MEMBRANE GLYCEROPHOSPHOLIPIDS AND ORGANELLE HOMEOSTASIS ....................................................... 175 MITOCHONDRIA ARE AGGREGATED DURING GLYCEROPHOSPHOLIPID IMBALANCE ........................................ 176 IDENTIFICATION OF YLR312P AS A REGULATOR OF MICROLIPOPHAGY ......................................................... 177 ORGANELLE RETENTION IN THE MOTHER CELL AS A FORM OF QUALITY CONTROL DURING LIPID STRESS ........ 178 DEFECTS IN PC BIOSYNTHESIS LEAD TO A CONGENITAL MUSCULAR DYSTROPHY AND INTELLECTUAL DISABILITY
IN HUMANS, POTENTIALLY THROUGH EFFECTS ON RYR LEAKAGE ............................................................... 180
REFERENCES .......................................................................................................................................... 183
APPENDIX - RATIOMETRIC BIOSENSORS THAT MEASURE MITOCHONDRIAL REDOX STATE AND ATP IN LIVING YEAST CELLS................................................................................................................ 206
Abstract ............................................................................................................................................ 207 Introduction ....................................................................................................................................... 208 Procedure ......................................................................................................................................... 212 Results .............................................................................................................................................. 219 Discussion ........................................................................................................................................ 225 Acknowledgments ............................................................................................................................ 228 Author Contributions ......................................................................................................................... 229

iii
List of Figures and Tables
Chapter I
FIGURE 1. MITOCHONDRIA AND ER MORPHOLOGY AND DISTRIBUTION IN S. CEREVISIAE. ..................................... 4 FIGURE 2. THE DIVERSE FUNCTIONS OF THE ER. ............................................................................................. 12 FIGURE 3. THE MITOCHONDRIAL INHERITANCE CYCLE IN BUDDING YEAST. ......................................................... 14 FIGURE 4. MITOCHONDRIAL MOTILITY AND ANCHORAGE IN BUDDING YEAST. ...................................................... 24 FIGURE 5. SCHEMATIC REPRESENTING ACTION POTENTIALS AND DHPR-RYR INTERACTIONS. ........................... 33
Chapter II
FIGURE 1. INDIVIDUAL YEAST CELLS DISPLAY HETEROGENEITY IN MITOCHONDRIAL REDOX STATE AND ROS
LEVELS. ................................................................................................................................................ 46 FIGURE 2. MITOCHONDRIA IN THE MOTHER CELL ARE PHYSICALLY DISTINCT. ..................................................... 48 FIGURE 3. MITOCHONDRIA WITH HIGHER SUPEROXIDE LEVELS AND LOWER REDOX POTENTIAL ARE RETAINED IN
MOTHER CELLS IN YOUNG AND OLD YEAST CELLS. ................................................................................... 50 FIGURE 4. DELETION OF MMR1 AFFECTS MOTHER-DAUGHTER AGE ASYMMETRY. ............................................. 53 FIGURE 5. MITOCHONDRIAL FITNESS CORRELATES WITH LIFESPAN. .................................................................. 56 FIGURE 6. DAUGHTER CELL FITNESS AND MITOCHONDRIAL INHERITANCE IN MMR1∆ CELLS. ............................... 58 FIGURE S1. MEASUREMENT OF CELLULAR SUPEROXIDE AND REDOX STATE USING DHE AND MITOROGFP1. ...... 66 FIGURE S2. THE RLS AND MGT PHENOTYPES OBSERVED IN MMR1Δ CELLS ARE NOT A CONSEQUENCE OF
GENETIC BACKGROUND OR SYNCHRONIZATION. ...................................................................................... 67 FIGURE S3. SHORT-LIVED AND LONG-LIVED MMR1Δ CELLS CLUSTER IN DIFFERENT SECTIONS OF A PLOT OF RLS
VERSUS MEAN GENERATION TIME DURING THE FIRST TEN GENERATIONS. ................................................. 68 FIGURE S4. SHORT-LIVED MMR1Δ CELLS DISPLAY INCREASED GENERATION TIMES COMPARED TO WILD-TYPE
CELLS AND THEIR LONG-LIVED COUNTERPARTS DURING THE FIRST TEN GENERATIONS. ............................. 68 FIGURE S5. MMR1Δ CELLS IN THE W303 GENETIC BACKGROUND ALSO GIVE RISE TO SHORT- AND LONG-LIVED
CELLS. .................................................................................................................................................. 69 FIGURE S6. IDENTIFICATION OF AGED CELLS IN CULTURE. ................................................................................ 69 Chapter III
FIGURE 1. DISRUPTION OF GENES THAT GENETICALLY INTERACT WITH MMR1 RESULT IN AN ALTERED
MITOCHONDRIAL NETWORK .................................................................................................................... 78 FIGURE 2. MFB1P MEDIATES MITOCHONDRIAL ANCHORAGE IN THE MOTHER TIP (A) MFB1P-GFP LOCALIZES TO
MOTHER TIP MITOCHONDRIA. ................................................................................................................. 79 Chapter IV FIGURE 1. PHOSPHOLIPIDS AND NEUTRAL LIPIDS CHANGE IN RESPONSE TO PC BIOSYNTHETIC DEFECTS. ........... 98 FIGURE 2. LIPID IMBALANCE TRIGGERS MITOCHONDRIA AND ER MORPHOLOGY DEFECTS. ................................ 100 FIGURE 3. YEAST CELLS ADAPT TO THE LIPID STRESS ASSOCIATED WITH DECREASED PC BIOSYNTHESIS. ........ 104 FIGURE 4. LIPID DROPLETS BIOGENESIS OCCURS AT ER AGGREGATES AND IS REQUIRED FOR ADAPTATION TO LIPID
IMBALANCE ......................................................................................................................................... 108 FIGURE 5. STRESS INDUCED LIPID DROPLETS ARE DEGRADED IN THE VACUOLE IN A PROCESS THAT RESEMBLES
MICROAUTOPHAGY .............................................................................................................................. 111 FIGURE 6. DAMAGED PROTEINS ARE REMOVED FROM THE ER BY LDS (A) HSP104P EXPRESSION IS INCREASED
DURING LIPID IMBALANCE. .................................................................................................................... 114 FIGURE 7. STRESS INDUCED MICROAUTOPHAGY IS REGULATED BY THE ESCRT COMPLEX AND A PREVIOUSLY
UNCHARACTERIZED PROTEIN ............................................................................................................... 120 FIGURE S1. EFFECT OF ACUTE AND CHRONIC DEFECTS IN PC BIOSYNTHESIS ON PHOSPHOLIPID LEVELS. ......... 130 FIGURE S2. THE EFFECT OF ACUTE LIPID IMBALANCE ON MITOCHONDRIA REDOX STATE AND MOTILITY. ............. 132 FIGURE S3. MITOCHONDRIA AND ER ARE NORMAL IN WILD-TYPE CELLS AND IN CHO2∆ CELLS PROPAGATED IN THE
PRESENCE OF CHOLINE. ...................................................................................................................... 133
iv
FIGURE S4. LDS ACCUMULATE DURING LIPID IMBALANCE. .............................................................................. 134 FIGURE S5. ................................................................................................................................................. 136 FIGURE S6. HEAT-SHOCK AGGREGATES THAT FORM DURING HEAT STRESS AND LIPID STRESS ARE DIFFERENT. 137 FIGURE S7. RNASEQ REVEALS NUMEROUS STRESS RESPONSES ACTIVATED UPON GLYCEROPHOSPHOLIPID
IMBALANCE ......................................................................................................................................... 138 SUPPLEMENTAL TABLE 1.............................................................................................................................. 140 Chapter V
FIGURE 1. MITOCHONDRIA AND ER ARE MISLOCALIZED IN SKELETAL MUSCLE FROM RMD MICE AND CHKB CMD
PATIENTS. ........................................................................................................................................... 154 FIGURE 2. RYANODINE RECEPTOR IS DISORGANIZED IN SKELETAL MUSCLE FROM RMD MICE. ........................... 156 FIGURE 3. SHORT TERM TREATMENT OF C2C12 MYOTUBES WITH A CHOLINE KINASE INHIBITOR DO NOT HAVE
OBVIOUS DEFECTS. ............................................................................................................................. 158 FIGURE 4. INHIBITION OF PC BIOSYNTHESIS RESULTS IN CALCIUM SPARKS IN RESTING C2C12 MYOTUBES. ...... 159 FIGURE 5. INTACT SKELETAL MUSCLE FIBERS FROM RMD MICE EXHIBIT CALCIUM SPARKS. ................................ 161 Chapter VI FIGURE 1. MITOCHONDRIAL QUALITY CONTROL DURING INHERITANCE AND ANCHORAGE IN BUDDING YEAST. ..... 172 FIGURE 2. MITOCHONDRIAL POLARIZATION IN YEAST AND METAZOANS. ........................................................... 173 Appendix FIGURE 1. MITO-ROGFP1 DETECTS MITOCHONDRIAL REDOX STATE WITHOUT AFFECTING CELL GROWTH RATES OR
MITOCHONDRIAL MORPHOLOGY. .......................................................................................................... 219 FIGURE 2. MITO-ROGFP1 DETECTS CHANGES IN MITOCHONDRIAL REDOX STATE IN RESPONSE TO TREATMENT
WITH HYDROGEN PEROXIDE OR DITHIOTHREITOL. .................................................................................. 220 FIGURE 3. MITO-ROGFP1 OFFERS SUBCELLULAR RESOLUTION OF MITOCHONDRIAL REDOX STATE. ................. 221 FIGURE 4. HIGH-INTENSITY EXCITATION LEADS TO PHOTOCONVERSION AND ALTERED R/O MITO-ROGFP1 RATIOS.
.......................................................................................................................................................... 222 FIGURE 5. MITGO-ATEAM2 LOCALIZES TO MITOCHONDRIA IN YEAST AND DOES NOT AFFECT YEAST CELL GROWTH
RATES. ............................................................................................................................................... 223 FIGURE 6. MITGO-ATEAM2 MEASURES CHANGES IN ATP LEVELS IN YEAST MITOCHONDRIA AT SUBCELLULAR AND
SUBORGANELLAR RESOLUTION. ........................................................................................................... 224

v
Acknowledgements
I am sincerely grateful to my mentor Liza Pon. During my undergraduate work, I cursed
the chapters in biochemistry that dealt with mitochondria, specifically, respiration, lipid
biosynthesis, and obviously redox biochemistry. However after hearing one 30 min talk about
mitochondria as aging determinants and the glorious eukaryote Saccharromyces cerevisiae, I
was hooked and chased her down the hallway after the seminar to ask about a rotation spot.
Her door is always open and she has taken the time to not only guide me scientifically but just
as important, guide me in my presentation and writing skills, both needing substantial time and
effort on her part.
Theresa Swayne and Istvan Boldogh need their own book of recognition for their part in
my Ph.D. The number of ridiculous questions I lob at either one of these people on a daily basis
is enough to give anyone a headache. If it were not for Istvan I would still be vortexing my
PAGE mixture and wondering why it was not polymerizing. If it were not for Theresa I would
have spent countless hours drawing false conclusions from autofluorescence if I even got past
the setup phase without shining lasers into my eyes and blinding myself. Thank you both for
your help throughout these years.
I’d also like to thank everyone in the Pon lab and other labs I’ve worked closely with.
Everyone has always been extremely inviting and fun to talk and share experimental data with.
I’d like to especially thank Ricky for being an awesome mentor and allowing me to work with him
for a couple of years. Ricky, you are a great friend and fantastic doctor/scientist, my
enthusiasm for research is in part attributed directly to you. And to everyone in the Pon lab who
has made graduate school an unforgettable experience, thank you!
I need to thank my extraordinary Thesis Committee, Gil Di Paolo, Eric Schon, and
Michio Hirano. They have not only guided me during my growth as a researcher, but actively
have taken a part in it. They consistently challenge me in new ways and are supportive beyond

vi
belief. To this day, I cannot think of a better group to guide me during my graduate career.
These years have been an absolute pleasure.
I would be remiss if I did not thank those that contributed to my sanity outside of lab. To
my lifting partners over the years, Joe, Ryo, Fred, Tim, Wolf, you are all beasts and I hope I
push you as much as you push me to become stronger, mentally and physically. To my
drinking partners, to the people who can appreciate a nice dive bar on a Wednesday or
Thursday night. I’ll save you some time and not list everyone in this particular group.
Finally to my best friend, lifting partner, running partner, drinking buddy, and soon to be
wife, Ang. I would be an inarticulate, out of shape, drunken lout if it were not for you. You not
only support my academic pursuits, you constantly drive me to be a better person.

vii
Dedication
To the overlapping venn diagram of friends, family, and mentors, who without their
support I could not perform the simplest of tasks. And who have to put up with the irritableness
that arises from failed experiments and having to work during happy hour.

1
Chapter I
Introduction
Published, in part:
Vevea JD, Swayne TC, Boldogh IR, Pon LA. Inheritance of the fittest mitochondria in yeast.
Trends Cell Biol. 2013:1–8.

2
Mitochondrial structure, morphology, and dynamics
Mitochondrial ultrastructure is comprised of two separate membrane bilayers termed the
outer and inner mitochondrial membrane delineating the intermembrane space and matrix. This
is a conserved structure observed in all eukaryotes and by electron microscopy for over 60
years [1] [2]. The inner mitochondrial membrane is elaborated as a specialized expansive
membranous fold termed cristae. The cristae are the sites of electron transport, a critical
process in the production of energy (ATP), described in detail below. The highly folded nature
of the membrane, which defines the cristae, increases the amount of membrane and therefore
electron transport chain (ETC) components that will fit into a single mitochondrion [3]. The
molecular basis for this organization has only recently begun to be appreciated. Several groups
have identified proteins regulating mitochondrial cristae morphology [4] [5] [6] [7]. These
proteins comprise a single complex now termed MICOS “mitochondrial contact site and cristae
organizing system” [8]. MICOS is a conserved complex serving to maintain cristae junctions
and contact sites with the outer mitochondrial membrane, from yeast to humans.
In most cells, mitochondria exist as tubules forming a dynamic, interconnected network
spanning the entirety of the cell. In many eukaryotes, mitochondria are enriched at sites that
require energy (ATP), additional calcium buffering, or mitochondrial metabolites. In budding
yeast, mitochondrial tubules align along the mother-bud axis and accumulate at sites of polarity
(Fig 1). The mitochondrial network is maintained throughout the cell resulting from the
combination of motile vs anchorage events, and the balance between fusion and fission
processes. In yeast, mitochondria traffic along bundles of actin cables polarized along the
mother-bud axis [9]. This motility is dependent upon the actin polymerizing complex, Arp2/3 with
the specific adaptor Jsn1p, and the type V myosin motor Myo2p through an unknown adaptor
[10] [11]. Furthermore, in yeast, mitochondria are anchored to the cell cortex, are anchored and
accumulate in the bud tip, and the mother tip. General cortex anchorage is mediated through
Num1p forming a unique MECA complex (mitochondria-ER-cortex-anchor) [12]. While Mmr1p

3
anchors mitochondria to cortical ER (cER), specifically in the bud tip during mitochondrial
inheritance [13]. In metazoan cells, mitochondria traffic along microtubules and the actin
cytoskeleton [14]. While the motor mediating actin-dependent motility is currently unknown,
work has elucidated a mechanism of microtubule transport. Minus-end mitochondrial transport is
dependent upon dynein-dynactin but the nature of a mitochondrial specific adaptor protein is so
far unknown [15]. Recent data provide evidence for two Milton orthologues, Trak1/2, in the
bidirectional movement of mitochondria in neurons [16]. Plus end mitochondrial transport is
dependent upon Kinesins in conjunction with the adaptor protein Milton, and calcium sensitive
mitochondrial Rho-GTPase adaptor protein, Miro [17] [18].
Fusion and fission events play an important role in the mitochondrial network. Outer
mitochondrial membrane fusion is mediated by the conserved mitofusin GTPases, Fzo1p in
yeast [19] and Mfn1/2 in metazoans [20]. These proteins undergo homo/heterotypic tethering
and mediate fusion. Loss of mitochondrial fusion leads to cristae disorganization, and
fragmented mitochondria lacking mitochondrial DNA (mtDNA) in all eukaryotes examined [21]
[22]. Inner mitochondrial membrane fusion is mediated by the conserved GTPase Mgm1p in
yeast [23], or Opa1 in metazoans [24]. In yeast, Ugo1p serves as a link between Fzo1p and
Mgm1p to mediate proper mitochondrial fusion [25]. Mitochondrial fission is mediated by the
conserved dynamin related GTPases Dnm1p in yeast [26], and Drp1 in metazoans [27]. Loss of
fission leads to a completely connected network of mitochondria.

4
Figure 1. Mitochondria and ER morphology and distribution in S. cerevisiae. Single slice through the middle of the cell (Left panel) showing clear examples of two populations of ER (green), nuclear ER (nER) outlining the nucleus counterstained with DAPI (blue), and cortical ER (cER) aligned along the plasma membrane. Maximum projection of 3D z-stack (Right panel) highlighting the tubular morphology of mitochondria (red). These tubules are aligned along the mother-bud axis and accumulate at the mother and bud tips (sites of polarity). Scale bar 5 µm
Endoplasmic reticulum structure, morphology, and dynamics
The endoplasmic reticulum (ER) is a membranous network spanning the entire
eukaryotic cell making physical contacts with almost every cellular constituent. This reticulum
was described by electron microscopy as early as the 1940s [28]. There are two predominant
forms of ER. Nuclear ER (nER) is a component of the nuclear envelope and cortical ER (cER)
exists as a network of tubules and sheets throughout the cytoplasm and that underlie the
plasma membrane [29] [30]. In budding yeast, ER is resolved as nER and cER underlying the
plasma membrane; very little ER exists as free tubules in the cytoplasm (Fig 1). The ER,
although consisting of a single entity, takes on a very complex shape, with many planar
domains or areas of high curvature. These domains are regulated by scaffolding proteins. The
conserved family of reticulons (Rtn1p in yeast and Rtn4a in metazoan cells) work together with
Yop1p in yeast and possibly Reep1 in metazoans [31] to induce or stabilize cER tubules or
domains of high curvature [32]. Furthermore, in metazoan cells Climp63 has been postulated to
act to stabilize cER sheets [33].

5
In yeast, ER traffics along microtubules and polarized actin cables [34], however in
metazoans, ER appears to traffic primarily along acylated microtubules [35]. In yeast the actin-
dependent motors have been identified as the type V myosins Myo4p and Myo2p [36]. The
cytoskeletal motors and adaptor proteins in metazoan cells have not been identified [37],
however the ER specific Rab GTPase, Rab10, regulates the behavior of dynamic ER tips [38].
In yeast, cER is anchored to the plasma membrane (PM) via 6 conserved proteins, the vesicle
associated membrane protein-associated proteins (VAP) Scs2p and Scs22p, the extended
synaptotagmin family of tricalbin proteins (Tcb1/2/3p) and Ist2p from the TMEM16 ion channel
family [39]. Although these proteins are from conserved families, functional homologues have
yet to be described in metazoans. To date, only the junctophilin family has been described to
act as an ER-PM anchor, and only in excitable cells. In skeletal and cardiac muscle,
junctophilins (JP1/2/3) are components of the specialized triad and dyad structure respectively
linking the ER-PM. In neuronal tissue, JP3/4 are responsible for creating this connection,
termed the subsurface cistern [40] [41].
As with mitochondria, fusion and fission events play critical roles in maintaining the ER
network. ER fusion in yeast is mediated by the dynamin-like GTPase Sey1p [42] and in
metazoan cells by Atlastin [43]. Whether the ER undergoes fission events has been a source of
debate. The ER exists as a continuous reticulum, whereas organelles like mitochondria are
frequently observed separated from each other. A conserved novel regulator of ER structure
has recently been identified in yeast and termed Lnp1p from the lunapark family of proteins.
Lnp1 works antagonistically to Sey1p/Atlastin to balance ER network formation. The cER
network is composed of three-way junctions of cER tubules, Sey1p/Atlastin and Lnp1p residing
at these junctions and regulating their stability [44].

6
Mitochondrial respiration, redox, and repair (quality control)
Mitochondria are essential organelles for eukaryotes, in part to their ability to produce
massive amounts of energy in the form of adenosine triphosphate (ATP). Additionally,
mitochondria play important roles in cellular calcium homeostasis, biogenesis of iron-sulfur
clusters, phosphatidylethanolamine (PE), pyrimidines, and control the release of apoptotic
factors [45]. Mitochondria are unique in that electron flux through the electron transport chain
can also generate reactive oxygen species which leads to damage that can cause the death of
the cell. Mitochondria are essential but must be continually repaired from the damage that
results from oxidative phosphorylation.
Mitochondrial respiration refers to the complete process of aerobically converting
nutrients to usable cellular energy. Nutrients such as carbohydrates, lipids, and proteins are
metabolized to form a common respiratory intermediate, Acetyl-coenzyme A (acetyl-CoA).
Acetyl-CoA is oxidized through 10 successive reactions involving 8 enzymes comprising the
citric acid cycle. Briefly, each acetyl-CoA molecule produces 3 NADHs (reduced nicotinamide
adenine dinucleotide), 1 FADH2 (reduced flavin adenine dinucleotide), through the action of
isocitrate, α-ketoglutarate, succinate, and malate dehydrogenase reactions. One ATP
equivalent is also formed from the conservation of energy released from the formation of
succinate from succinyl-CoA (succinyl-CoA synthetase) [46].
The reduced molecules NADH and FADH2 are used to directly feed electrons into the
electron transport chain (ETC). The controlled oxidation of these molecules by the four protein
complexes of the ETC provide the energy needed to establish an electrochemical gradient used
by complex V (F1F0-ATPase) to produce ATP. Electrons from NADH enter the ETC at complex
I (NADH dehydrogenase) while electrons from FADH2, enter the ETC at complex II (FADH2
dehydrogenase). These first two complexes pass electrons to complex III (coenzyme
Q/cytochrome c oxidoreductase) via the essential cofactor coenzyme Q (CoQ) or ubiquinone.
Lastly, cytochrome c (cyt c) facilitates the transfer of electrons from complex III to complex IV

7
(cytochrome c oxidase). Complex IV terminates the electron transfer by reducing oxygen to
water. Complexes I, III, and IV use this sequential oxidation reduction to power the transfer of
protons across the inner mitochondrial membrane (IMM) establishing an electrochemical
gradient. Finally complex V (F1F0-ATPase) harnesses this electrochemical gradient to
phosphorylate ADP, creating ATP [46].
The redox state of mitochondria is determined by the levels of reducing and oxidizing
species in the organelle, including NAD+/NADH, FAD/FADH2, NADP+/NADPH,
glutathione/gluthathione disulfide (GSH/GSSG) and reactive oxygen species (ROS).
Conversely, the level of these molecules reflects mitochondrial metabolic activity and overall
fitness. For example, uncoupling mitochondria or hypoxia affect mitochondrial respiratory
activity and alter the ratio of NAD+ to NADH in the organelle. Moreover, ROS that are produced
from inefficient electron transfer between complexes of the electron transport chain in the inner
mitochondrial membrane and from the deamination of amines via monoamine oxidase in the
outer mitochondrial membrane [47], damage lipids, proteins and nucleic acids, which has been
linked to aging and age-associated neurodegenerative diseases [45] [48]. ROS also plays a
role in signal transduction in mitochondria, through oxidation of GSH. For example, NADH
dehydrogenase not only contributes to ROS production but is also regulated through
interactions with the glutathione pool [49] [50]. α-Ketoglutarate dehydrogenase and aconitase,
components of the citric acid cycle, exhibit reduced activity in oxidizing environments [51] [52].
Indeed, redox-dependent regulation of aconitase activity is conserved from bacteria to
mammalian cells [53] [54]. Thus, monitoring the redox state of mitochondria is crucial to
understanding its function.
Studies in mammalian cells and fungi have provided a foundation for understanding
mechanisms for mitochondrial quality control and how defects in these processes can lead to
neurodegenerative diseases and diabetes. These studies revealed two levels of control:
mitochondrial repair mechanisms and mechanisms to identify and eliminate mitochondria that

8
are beyond repair. Several repair mechanisms are active in mitochondrial quality control,
including mitochondrial fusion, which repairs low-functioning mitochondria by intraorganellar
complementation, molecular chaperones, which bind to and stabilize unfolded proteins and
proteases both within and outside the organelle that degrade damaged mitochondrial proteins
including the proteasome in the cytosol, and mitochondrial AAA+ proteases and Pim1/Lon [55-
57].
Mitophagy and mitochondrial fusion and fission have been implicated in elimination of
mitochondria that are beyond repair [58]. In pancreatic beta cells, mitochondria with low
membrane potential (∆ψ) are segregated from those with high ∆ψ. This segregation occurs, in
part, because mitochondria with low ∆ψ can undergo fission but cannot undergo fusion. These
low-functioning mitochondria are then eliminated by mitophagy [59].
Defects in mitochondrial quality control are well documented in Parkinson’s disease (PD)
[60] [58]. Pink1 (Pten-induced kinase) and Parkin (an E3 ubiquitin ligase) are central regulators
of mitochondrial homeostasis, especially in the substantia nigra, the area in the brain affected in
PD [61, 62]. According to a recent model for mitochondrial quality control in PD, Pink1 is
imported and degraded in functioning mitochondria, but not in mitochondria with no ∆ψ. Pink1
that accumulates on the surface of mitochondria with no ∆ψ recruits Parkin to the MOM.
Mitochondria-associated Parkin then ubiquitinates mitochondrial proteins, leading to mitophagic
elimination of the dysfunctional mitochondria [61, 63]. Recent studies indicate that the mitofusin
Mfn2 is a substrate and receptor for Parkin on mitochondria, which may serve to inhibit fusion of
poorly functioning mitochondria with other mitochondria in addition to being a signal to target
poor functioning mitochondria for mitophagy [64].
The function of cytoplasmic Parkin has been more elusive. Recently Shin et al showed
that Parkin catalyzes ubiquitination, which leads to degradation of PARIS (PARkin Interacting
Substrate), a zinc finger protein. PARIS represses the expression of PGC-1α, a transcriptional
co-activator involved in cellular energy homeostasis and mitochondrial biogenesis. These

9
observations support another mechanism for Parkin in PD: Parkin mutations may compromise
mitochondrial quality control by repressing biogenesis of new, fully functioning mitochondria.
Microvesicles produced from mitochondria are the basis of novel mechanisms for mitochondrial
quality control. Recent studies indicate that stress-induced mitochondria-derived microvesicles
contain oxidized proteins and are a selectively targeted to lysosomes or peroxisomes in yeast.
Interestingly, production of these microvesicles is independent of the fission GTPase DRP1 [65,
66]. Mitochondria-derived microvesicles can be a source of rejuvenation. Recent studies
documented connexin-dependent transfer of mitochondria-derived microvesicles from bone
marrow-derived stromal cells to alveolar epithelial cells during acute lung injury, which results in
increased alveolar ATP concentrations and reduced injury [67].
These studies revealed mechanisms for mitochondrial quality control and show how
failure of these systems can lead to disease. Indeed, defects in mitochondrial quality control
have been linked to neurodegenerative diseases, including Parkinson’s disease, spinocerebellar
ataxia, spastic paraplegia, peripheral neuropathies, and metabolic diseases, including type II
diabetes and non-alcoholic and alcoholic steatosis [68, 69].
Endoplasmic reticulum protein biosynthesis and ER quality control (ERQC)
The ER sustains the synthesis and secretion of proteins with disulfide bonds, N-
glycosylation, and membrane spanning elements, as well as contributing to calcium
homeostasis and cellular lipid biosynthesis in collaboration with mitochondria. Maintaining
functional ER is critical for cellular fitness and lifespan in yeast and metazoans.
As previously stated, ER exists as two major forms in the eukaryotic cell, an ER
membrane that makes physical contacts with the inner nuclear membrane and nuclear pores
termed the nER, and an ER membrane that is present in the cytoplasm, distinct from nER
termed cER. Cortical ER can further be subdivided into rough and smooth ER. ER was first

10
termed rough or smooth based on the presence and absence of ribosomes, respectively, and
the resulting appearance of each type of ER under an electron microscope [70]. Consistent with
the presence of ribosomes on rough ER (RER), this membrane is primarily responsible for
protein synthesis of luminal ER, transmembrane, or secreted proteins. Conversely, smooth ER
(SER) is involved with neutral lipid, phospholipid, and steroid biosynthesis [46].
There is no structural difference between cytosolic ribosomes and RER-bound
ribosomes, only in the proteins that they are translating. Their localization is dependent upon a
signal sequence at the N terminus of the translating peptide [71]. This signal sequence is
recognized by the signal recognition particle (SRP) and facilitates the localization to ER in
metazoans [72], and Kar2p in yeast [73]. The SRP is further recognized by the SRP receptor, in
complex with the translocon on RER [74]. The translocon is composed of a complex of proteins
identified as Sec61 components (Sec61α, β, and γ in metazoans and Sec61p, Sss1p, and
Sbh1p in yeast) [75]. After establishment of the ribosome-SRP-SRP receptor-translocon
interaction, SRP-SRP receptor dissociates and leaves a translating ribosome-translocon
complex. From here, the nascent polypeptide is created and starts to fold in the lumen of the
RER. Rough ER resident post-translational modifications and chaperones facilitate proper
protein folding. Proteins translated in the RER are translationally and post-translationally
modified by the attachment of carbohydrates to asparagine, arginine, or tryptophan (N-linked
glycosylation) and the formation of disulfide bonds between cysteines motifs (C5XC or C7XC).
Resident RER chaperones include BiP or Hsp70p which participate in general protein folding,
and calnexin and calreticulin which recognize improperly glycosylated proteins [46].
The critical cellular processes of the ER necessitate active cellular responses to
maintain homeostasis of this organelle; these are termed ER Quality Control (ERQC)
mechanisms. ERQC surrounding protein folding and protein secretion involve the Unfolded
Protein Response (UPR) and ER Associated Degradation (ERAD). The UPR and ERAD act in
concert to restore ER homeostasis [76]. UPR activation occurs through autophosphorylation of

11
inositol-requiring 1 protein (Ire1p) resulting from direct binding of unfolded proteins, which in turn
catalyzes the endonucleolytic cleavage of Hac1 (homologous to ATF/CREB1) mRNA in yeast
[77], and XBP1 (X-box binding protein-1) in metazoans [78]. Hac1p/XBP1 is then translated,
imported into the nucleus, where it activates a core set of stress response genes by interactions
with UPR response elements upstream of those genes [79]. The UPR is the primary ER quality
control mechanism in yeast. Metazoans contain additional pathways to handle ER stress. The
protein kinase RNA (PKR)-like ER kinase (PERK), phosphorylates and inactivates eIF2α [80].
This serves to globally decrease translation, possibly alleviating the continued delivery of
proteins to a stressed ER. Additionally, another ER transmembrane protein activating
transcription factor 6 (ATF6) senses ER stress [81]. ATF6 is then released to activate nuclear
stress response genes through cleavage by S1P and S2P [82].
The UPR also serves to increase protein folding and secretion capacity of the ER
through upregulation of chaperones and lipid biosynthetic genes, [83] as well as to pause
protein translation [84]. The UPR also increases the synthesis of proteins responsible for ERAD.
ERAD targets, and directs unfolded proteins to the proteasome, through retrotranslocation out
of the ER by AAA proteins (Cdc48p in yeast, and p97 in metazoans), ubiquitination by ubiquitin
ligases (Ssm4p, Hrd1p, and Doa10p in yeast, and HRD1 and gp78 in metazoans) and finally
proteosomal degradation [85]. Activation of ERAD serves to eliminate proteins that are not
folding, thus preventing a catastrophic feedback loop [86].
Increasing evidence indicates the UPR responds to altered ER membrane dynamics.
Altered phospholipid, saturation, and side chain length all lead to UPR activation from S.
cerevisiae to C. elegans [87-89], and activation is not dependent upon the unfolded protein
binding domain of Ire1p [90]. The UPR increases proteins responsible for lipid biosynthesis,
including phospholipids [91] and neutral lipids [92], possibly restoring membrane homeostasis.
The result of increased production of phospholipids expands the ER membrane, which is

12
thought to increase the capacity of ER protein folding function [93]. The function of increased
neutral lipids is still unclear.
Figure 2. The diverse functions of the ER. The endoplasmic reticulum is an interconnected membranous network spanning the entirety of the eukaryotic cell. It is a key site of protein and lipid synthesis as one-third of all cellular proteins and the majority of cellular lipids are synthesized here. The ER also houses quality control mechanisms (UPR) to respond to altered proteostasis. Furthermore, in metazoan cells, the ER is the principle site of calcium homeostasis.
In metazoans, the ER is also the primary calcium store in the cell. Calcium serves as an
important second messenger in the cytosol, regulates mitochondrial oxidative metabolism
through calcium sensitive matrix dehydrogenases, and apoptosis [94]. Additionally, calcium
content in the ER is critical for proper protein folding and secretion via calcium dependent
chaperones [95]. Calcium content in the ER is controlled through an uptake channel (SERCA),
and release channels (IP3R; RyR) [96]. Calcium depletion results in UPR activation and UPR
activation may result in further calcium loss. Interestingly this appears to be controlled through
the activity of GRP75 (BiP) and decides cellular fate during stress [97].
Organelle inheritance during asymmetric cell division
Cell polarization is achieved by the asymmetric distribution of cellular constituents along
a cellular axis. This process creates subcellular domains, such as the leading edge of motile
cells, apical and basolateral aspects of epithelial cells, and neurological and immunological

13
synapses. Cell polarization is also critical for asymmetric cell division, a process that underlies
diversity during development. Emerging studies have revealed mechanisms for controlling both
the amount and functional state of mitochondria in distinct subcellular domains in polarized
cells, which in turn affects cell fitness and function.
Model systems provide a foundation for understanding organelle quality and quantity
control during asymmetric cell division. At the onset of cell division in the budding yeast
Saccharomyces cerevisiae, a bud site is selected on the surface of the mother cell. The
cytoskeleton is then polarized towards that site, which leads to delivery of cellular constituents
to the bud for bud formation and growth. Organelle movements in mammalian cells depend on
both microtubules and actin filaments. However, in yeast most organelles move along actin
cables, bundles of actin filaments that align along the mother-bud axis [98].
Mitochondrial inheritance in yeast.
In the case of mitochondrial inheritance, the organelle aligns along polarized actin cables
during G1 phase [99]. During bud growth in S and G2 phases and through the end of the cell
division cycle, mitochondria undergo actin cable-dependent poleward movements, either toward
the bud (anterograde movement) or away from the bud (retrograde movement) [9]. In addition,
mitochondria accumulate and are immobilized at the mother cell tip (the pole opposite to the site
of bud emergence) and the bud tip [13, 100-102]. Finally, after cytokinesis, mitochondria are
released from the poles and redistributed throughout the cytoplasm [99]

14
Figure 3. The mitochondrial inheritance cycle in budding yeast. Since mitochondria (purple tubules) are essential organelles that must be produced from pre-existing mitochondria, there are mechanisms to ensure that daughter cells receive mitochondria. In budding yeast, segregation of mitochondria between mother and daughter cells occurs by cytoskeleton-dependent movements of the organelle that resemble those of chromosome movement: mitochondria undergo poleward movement toward the bud tip and the distal tip of the mother cell, followed by anchorage at the poles. These movements result in segregation of the organelle during cell division.
Mitochondrial motility during inheritance in budding yeast
A central player in mitochondrial function is a protein complex originally referred to as
the mitochore, which consists of Mdm10p, Mdm12p, and Mmm1p [103]. Mitochore subunits
were originally identified as proteins required for mitochondrial morphology and inheritance
[104]. Early studies also revealed a role for the mitochore in linking mitochondria to the actin
cytoskeleton for movements leading to inheritance [103, 105]. Later, Mdm34p was identified as
a member of the complex and additional roles were discovered, including linking mitochondria to

15
ER and mediating assembly of beta barrel proteins in the mitochondrial outer membrane (MOM)
[106-108]. This complex is also referred to as ERMES, for ER-mitochondria encounter structure
[106].
In yeast and mammalian cells, mitochondria-ER interactions are also critical for
phospholipid biosynthesis. Recent studies support a role for the mitochore/ERMES in
mitochondrial-ER interactions and phospholipid biosynthesis at that site. Mmm1p is a
glycoprotein that localizes to the ER, while Mdm10p, and Mdm34p are integral MOM proteins.
Survival of cells bearing a deletion in any one of these proteins is dependent upon expression of
a chimera that artificially tethers mitochondria to ER. Deletion of MDM10, MMM1, MDM12 or
MDM34 also results in slow growth and defects in conversion of phosphatidylserine (PS) to
phosphatidylcholine (PC) [106]. However, mitochore/ERMES mutants are still able to transport
PS from ER to mitochondria [109, 110]. Thus, while there is evidence for a role for the
mitochore/ERMES in PC biosynthesis at ER-mitochondrial contacts, its precise function in lipid
biosynthesis is complex. Interestingly, expression of an artificial ER-mitochondria tether restores
defects in mitochondrial morphology, cell growth and PS to PC conversion in some but not all
mitochore-ERMES mutants [106]. These findings indicate that the mitochore/ERMES functions
in other processes in addition to linking mitochondria to ER.
Other studies revealed that overexpression of a Rab-like protein Ypt11p (see below)
results in an increase in the amount of mitochondria in the bud, but does not restore
mitochondrial morphology in mitochore/ERMES mutants. This led to the proposal that the
primary function of the mitochore/ERMES is to control mitochondrial morphology and not link
mitochondria to the actin cytoskeleton [109]. On the other hand, mitochondria co-localize with
actin cables, bind to F-actin in cell-free systems and undergo bidirectional movement along
actin cables in living yeast cells. Moreover, deletion of mitochore/ERMES subunits results in
loss of mitochondrial motility in vivo and of binding of mitochondria to F-actin in vitro [103, 105].

16
Thus, another function of the mitochore/ERMES may be to link mitochondria to actin cables for
movements leading to inheritance.
Movement of mitochondria from the bud to the mother cell is driven by actin cable
dynamics. Actin cables, like actin bundles and networks in filopodia or the leading edge of
motile cells, undergo retrograde flow: continuous movement from the bud toward the mother cell
tip [111]. Mitochondria undergoing retrograde movement are associated with actin cables
undergoing retrograde flow. Moreover, mutations that inhibit retrograde actin cable flow also
inhibit retrograde mitochondrial movement. These findings support the model that mitochondria
bind to actin cables and use the force of retrograde actin cable flow to move from the bud
towards the mother cell [9]. To deliver mitochondria from mother cells to buds, anterograde
forces must be generated to overcome the opposing retrograde actin cable flow. The two force
generators for anterograde cargo movement in yeast are myosin motor proteins [112] and actin
polymerization mediated by the Arp2/3 complex [113]. In S. cerevisiae two class V myosins,
Myo2p and Myo4p, transport cargoes along actin cables towards the F-actin barbed ends.
Myo2p is the anterograde motor for secretory vesicles, vacuoles, peroxisomes, and late Golgi
vesicles, including those that recycle ER components from the Golgi to the ER. Myo4p
transports the cortical ER (cER) and mRNA into the bud [114]. Arp2/3 complex and actin
polymerization drives endosome movement [115].
The mechanism underlying mitochondrial movement during inheritance is controversial.
Here, we summarize findings obtained from analysis of mitochondrial movement in living yeast
cells and interactions of isolated mitochondria with actin. Mutations in Myo2p, including those in
the cargo-binding domain, result in defects in mitochondrial inheritance and reduced frequency
of movement of the organelle across the bud neck [11, 116, 117]. Consistent with this, Myo2p-
dependent actin binding activity is detected in isolated yeast mitochondria and Myo2p is
detected on isolated yeast mitochondria by immunoelectron microscopy [11, 116]. Moreover,
targeting of Myo2p as an artificial fusion protein to mitochondria promotes mitochondrial

17
inheritance in MYO2 mutants. Thus, mitochondria may utilize Myo2p for transport across the
bud neck [11].
Although Myo2p facilitates the transport of mitochondria across the bud neck, its role in
the mother cell is questionable. Mutations in MYO2 that eliminate its motor activity resulting in
defects in mitochondrial distribution, or inhibit association of Myo2p with mitochondria, have no
effect on the velocity of mitochondrial movement in mother cells [11, 100]. It is possible that
MYO2 affects the frequency and/or persistence of mitochondrial movement in mother cells
without affecting velocity. On the other hand, the frequency and velocity of anterograde
mitochondrial movement are severely diminished in yeast carrying mutations in the Arp2/3
complex as is mitochondrial inheritance [118]. Consistent with this, Arp2/3 complex protein and
activity localize to mitochondria in living yeast and are recovered with isolated yeast
mitochondria [118]. In addition, the H372R mutation in actin, which accelerates Arp2/3-
dependent actin polymerization, results in mitochondrial morphology defects and loss of mtDNA
[119]. Similarly, increasing the rate of Arp2/3-dependent actin polymerization in mating yeast
increases mitochondrial motility, while suppressing this polymerization, by deletion of the
ARC18 subunit, has the opposite effect [120]. Studies on Jsn1p indicate that the defect in
mitochondrial motility observed in Arp2/3 complex mutants is not a consequence of Arp2/3
complex function in actin organization and function. Jsn1p, a Pumilio family protein, localizes to
mitochondria, can bind to Arp2/3 complex, co-immunoprecipitates with mitochondria-associated
Arp2/3 complex and is required for localization of the Arp2/3 complex to mitochondria. Thus,
Jsn1p is a receptor for the Arp2/3 complex on yeast mitochondria. Deletion of JSN1 results in
defects in recruitment of Arp2/3 complex to mitochondria and defects in anterograde
mitochondrial movement, but has no major effect on actin cable abundance or polarity or on
association of mitochondria with actin cables [9, 10].
Therefore, what are the roles of Myo2p and Arp2/3 complex in mitochondrial
inheritance? One possibility is that they may act at specific locations. Anterograde movements

18
of mitochondria in the mother cell may depend on Arp2/3-dependent actin polymerization. In this
case, new actin filament branches produced by Arp2/3 complex on the mitochondrial surface
are bundled in parallel with the existing actin cables, which guide motility in the anterograde
direction along actin cables [9]. Transport across the bud neck may require Myo2p function
[117, 121]. Since the bud neck is a bottleneck for movement of all cargos in yeast, transport of
mitochondria across this site may require the more robust force-generating capabilities of a
myosin motor.
ER inheritance
ER is inherited as cortical ER (cER) and nuclear ER (nER) during bud growth. In yeast
cER is primarily aligned along the plasma membrane (PM) and is the first inherited organelle,
inheritance occurring during the G1 and early S phase of the cell cycle [34] [30]. Shortly after
bud emergence, a tubule of ER extends from the nER along the mother-bud axis and into the
bud. The tubule makes stable contact with the bud tip and then spreads around the cortex of the
bud forming cER at that site. Extension of the ER tubule into the bud is dependent upon the
actin cytoskeleton and the type V myosin motor protein Myo4p [36]. Unlike metazoan cells,
during cellular division in yeast, the nuclear envelope is maintained. Nuclear ER is inherited
during the G2 to M phase transition and relies on the microtubule cytoskeleton [34].
ER motility during inheritance in budding yeast
ER inheritance is a multistep process in budding yeast [122]. ER segregation structures
are detected in the bud tip during G1 and S phase and are anchored in the bud tip by Sec3p, a
component of the exocyst complex. As the cell cycle proceeds, more ER enters and is tethered
in the bud tip. Thereafter, this population of ER spreads across the bud cortex, presumably by
binding to the plasma membrane. This process is not well understood, but it is known to be
regulated by the type 2C serine/threonine protein phosphatase Ptc1p and the mitogen-activated

19
protein kinase Slt2p [123]. Slt2p inhibits ER spreading, potentially by regulating an ER
spreading mediator. Ptc1p inhibits Slt2p, which allows cER spreading to occur.
Movement of ER in buds requires the type V myosins Myo4p and Myo2p. Myo4p is
recovered with ER upon subcellular fractionation and is required for the inheritance of small cER
tubules early in the cell division cycle [36]. Myo2p contributes to ER membrane delivery to the
bud tip by binding to Ypt11p, a Rab-like protein that localizes to cER in the bud and Golgi.
Ypt11p also binds to Ret2p, a component of the COP1 complex of Golgi-derived vesicles and is
required for Myo2p-driven movement of COP1 vesicles to the bud [124]. These studies support
the model that Ypt11p is a cargo adapter that links Golgi-derived COP1 vesicles to Myo2p for
motor-driven movement of the cargo from mother cells to the bud. Since COP1 vesicles contain
ER components that are recycled from Golgi back to ER, Myo2p- and Ypt11p-dependent
transport leads to inheritance of cER in the bud tip. Indeed, deletion of YPT11 results in defects
in cER inheritance [13, 125].
ER interactions with mitochondria (MAM)
In the past, organelles were viewed as physically and functionally distinct entities. It is
now becoming clear that organelles interact with one another, and that these interactions are
necessary for normal organelle function. Mitochondria and ER share an intricate spatial and
functional relationship, this specialized domain is termed the mitochondria-associated
membrane (MAM) and serves many functions [126]. Interaction of mitochondria with cER has
multiple functions. Recent studies indicate that cER tubules mark sites of mitochondrial fission
and recruit fission mediators in yeast [127] and that newly polymerized actin that localizes to the
constriction site on mitochondria contributes to mitochondrial fission by constricting the
organelle and recruiting Dnm1p to that constriction site [128].
In yeast and mammalian cells, mitochondria and smooth ER function together during
lipid biosynthesis. The phospholipids phosphatidylserine (PS), phosphatidylethanolamine (PE),

20
and phosphatidylcholine (PC) comprise the majority of phospholipid species in eukaryotic cells
and contribute to membrane fluidity and dynamics, which in turn affect the folding of membrane-
bound and membrane-associated proteins [129]. PC biosynthesis in metazoans and S.
cerevisiae occur via two evolutionarily conserved pathways. One pathway, which will be
referred to as the PEMT pathway, occurs at sites of close contact between mitochondria and ER
[130] [131]. In this pathway, PS synthase (Cho1p in yeast, or PSS-1 in metazoans) catalyzes
the conversion of CDP-diacylglycerol and L-serine to PS in the ER [132]. PS is then transported
to the mitochondrial inner membrane, where it is decarboxylated, catalyzed by
phosphatidylserine decarboxylase (Psd1p in yeast, or PISD in metazoans) to generate PE
[133]. PE is then transported back to the ER, where it is converted to PC by three sequential
methylation reactions which are catalyzed by phosphatidylethanolamine N-methyltransferase
(Cho2p and Opi3p in yeast, or PEMT in metazoans) [134].
When choline and ethanolamine are available from the environment, PC is synthesized
using the Kennedy pathway. In this pathway, choline kinase (Cki1p in yeast, or CHK in
metazoans) catalyzes the phosphorylation of choline, which is converted to CDP-choline in
reactions catalyzed by Choline-phosphotransferase (Pct1p in yeast, or PCY1A in metazoans).
Finally, PC is synthesized from CDP-choline and DAG in reactions catalyzed by CDP-choline
DAG choline transferase (Cpt1p in yeast, or CEPT1 in metazoans) [135].
Deletion of the proteins that tether mitochondria to ER or that affect the morphology of
mitochondria or ER inhibit lipid biosynthesis and reduce the steady-state levels of specific lipids
[106] [136] [110]. In S. cerevisiae, phospholipid imbalance has been proposed to contribute to
cellular dysfunction in a variety of ways. The phospholipids PE and cardiolipin (CL) are crucial
for mitochondrial respiratory activity. Electron transport chain (ETC) complexes rely on these
non-bilayer forming phospholipids for proper folding and positioning in the mitochondrial
membrane [136]. PE may also influence mitochondrial morphology and fusion through
regulating Mgm1p activity [137]. Phospholipid imbalance is also a potent trigger of the unfolded

21
protein response (UPR), indicating normal phospholipid levels are important for proper ER
function [89]. Recently, the balance of saturated fatty acids to unsaturated fatty acids
(SFA/UFA) were also reported to activate the UPR and ER associated degradation (ERAD)
stress responses [88]. These data support the idea that general lipid membrane homeostasis is
crucial for organelle and total cellular function. In human disease, present research is finding
links between cholesterol and lipid metabolism in AD [138], hepatic phospholipid metabolism in
obesity and type 2 diabetes [139], and phospholipid biosynthesis in cancer [140].
Lipids and enzymes that regulate or modify lipids play a vital role in cellular fitness and
have been implicated in human diseases including Alzheimer’s disease (AD) [141], metabolic
disease [142], cancer, and inflammation [143]. However, of the four classes of organic
molecules that define cells and their function (nucleic acids, amino acids, carbohydrates, and
lipids), lipids and their role in cellular homeostasis have historically been investigated the least.
In chapter IV, I use the budding yeast, Saccharomyces ceresiae, as a model system to study
the consequences of lipid imbalance and mechanisms that allow cells to adapt to this
imbalance. These studies served to guide our exploration of a congenital muscular dystrophy
caused by mutations in the CHKβ locus. In humans, this mutation results in a similar
glycerophospholipid imbalance as seen in yeast. In chapter V, I will describe novel insights into
the pathobiology of this disease that may lead to treatment options.
Anchorage of mitochondria and ER at the yeast cell cortex
Localized anchorage of mitochondria promotes inheritance of the organelle in buds, and
retention of the organelle in mother cells. Since actin cables undergo retrograde flow,
anchorage of mitochondria in the bud tip ensures that the organelle is retained in buds. Other
studies indicate that mitochondria are also anchored at specific sites in the mother cell. Here, I
discuss region-specific anchorage of mitochondria in yeast and a role for mitochondrial-ER
interactions and specific proteins in these processes.

22
Recent studies indicate that mitochondria are anchored in the bud tip by interactions with
ER. Yeast cortical ER (cER) is a reticular network of ER that underlies and is anchored to the
plasma membrane [39]. Super-resolution light microscopy revealed that mitochondria in the
yeast bud tip are associated with cER sheets [13]. Electron microscopy revealed that
mitochondria can be deformed into thin tubular extensions from their point of contact with cER in
the bud tip, implying tension at the point of contact between the two organelles.
Recent studies also support a role for two proteins that bind to the Myo2p cargo-binding
domain, Mmr1p and Ypt11p, in bud tip anchorage of mitochondria in yeast. Mmr1p was
originally identified as a protein that can bind to mitochondria and Myo2p, localize to the bud tip,
and is required for normal mitochondrial distribution [144]. Indeed, yeast with mutations in
MMR1 and MYO2 exhibit similar defects in mitochondrial distribution. Mmr1p shows some
similarity to Dsl1p, which is part of a complex that tethers COPI vesicles to ER [145]. Moreover,
Mmr1p localizes to punctate structures between mitochondria and cER at the bud tip and can
be recovered with mitochondria and ER upon subcellular fractionation. Finally, deletion of
MMR1 results in defective immobilization of mitochondria in the bud tip, whereas its
overexpression causes excessive accumulation of mitochondria at that site [13, 144]. These
findings support the model that Mmr1p tethers mitochondria to cER in the bud tip, which results
in anchorage and accumulation of the organelle at that site. Since Mmr1p binds to Myo2p, and
requires this binding to localize to the bud tip, Myo2p may contribute to mitochondrial
distribution by mediating actin-dependent transport of Mmr1p to the bud tip.
Ypt11p is a Rab-like protein that can bind to the Myo2p cargo-binding domain and is
required for anchorage of mitochondria in the bud tip and for localization of cER in the bud [102,
125, 146]. Specifically, deletion of YPT11 results in defects in accumulation of mitochondria and
cER in the bud, while overexpression of YPT11 has the opposite effect [125, 146, 147]. While it
is clear that Ypt11p is required for accumulation and therefore anchorage of mitochondria in the
bud tip, a point of controversy is whether the primary target for Ypt11p is mitochondria or cER.
23
Because Ypt11p is not an abundant protein, its localization is not known. However, artificial
targeting of Ypt11p to mitochondria, but not to ER, can suppress the mitochondrial distribution
defects observed upon deletion of YPT11 [148]. Thus, Ypt11p may affect mitochondrial
distribution through interactions with mitochondria and not ER. On the other hand, Ypt11p
localizes to cER in the bud when overexpressed [125]. Moreover, deletion of YPT11 has no
effect on the velocity of mitochondrial movement. However, ypt11∆ exhibit defects in
accumulation of mitochondria in the bud tip and in cER inheritance [102, 125]. This raises the
possibility that Ypt11p affects mitochondrial anchorage in the bud tip through effects on
localization of cER in the bud. Indeed, other studies indicate that Ypt11p is a cargo adapter that
binds to Ret2p on COPI-containing late Golgi vesicles and links these vesicles to Myo2p for
transport to the bud tip [124]. Ret2p also localizes to Golgi-derived ER recycling vesicles, so it is
possible that Myo2p and Ypt11p transport these ER retrieval vesicles to the bud tip, and that
these in turn contribute to anchorage of mitochondria at that site.

24
Figure 4. Mitochondrial motility and anchorage in budding yeast. Mitochondria undergo movement from mother cells to buds using actin cables as tracks and force generation by Arp 2/3 complex and actin polymerization and by Myo2p, a type V myosin. In the yeast bud tip, mitochondria are anchored and accumulate on a cortical ER (cER) sheet. Anchorage of mitochondria to cER in the bud tip is dependent upon Mmr1p, a protein that undergoes Myo2p-dependent localization to the bud, where it is present at the interface between mitochondria and cER in the tip bud. Another mitochondrial anchorage complex consists of foci containing Num1p and Mdm36p. These foci are found at the cell cortex in mother cells and in large buds. Num1p directly interacts with the plasma membrane through its pleckstrin homology (PH) domains, and is also closely opposed to the cER [12].

25
To balance inheritance between mothers and buds, mitochondria are also tethered in the
tip and cortex of the mother cell. The mechanism underlying anchorage of mitochondria in the
mother cell tip is not well understood. Recent works indicate that Num1p and Mdm36p link
mitochondria to the mother cell cortex [12, 149, 150]. Num1 is a cortical protein that supports
the dynein-dependent migration of the nucleus into the bud [151] and maintains normal
mitochondrial morphology and distribution [152]. Cortical localization of Num1p is dependent on
its C-terminal pleckstrin homology domain, while the N-terminal coiled-coil domain is essential
for nuclear and mitochondrial functions [12, 153]. ER may also play a role in mitochondrial
tethering in the mother cell cortex, since ER-resident proteins co-purify with Num1p, and ER
was found in close proximity to Num1p-containing structures [12].
Tethering of mitochondria at strategic sites may also affect mitochondrial network
dynamics. It has been proposed that mitochondrial anchorage by Num1p complex, together with
cytoskeleton-dependent forces, provide tension for Dnm1-dependent mitochondrial fission [154].
Consistent with this, a subset of Dnm1p colocalizes with Num1p [12, 152], and deletion of
NUM1 and MDM36 results in mitochondrial fission defects [149, 152]. While only a small
decrease in mitochondrial fission activity was found in num1∆ cells, a growth defect in cells
lacking both mitochondrial network dynamics and the Num1p was detected, and could be
rescued by expression of a chimeric mitochondria-cortex tether. As described below, tethering
and fusion/fission machineries also exert mitochondrial quality control and contribute to the
lifespan of daughter cells.
Mitochondrial quality control and its effect on lifespan: Protein repair and
complementation
Yeast model two forms of eukaryotic cellular aging. Chronological lifespan (CLS), the
survival time of stationary-phase non-dividing yeast cells, is a model for stress resistance in
post-mitotic cells. Replicative lifespan (RLS), the number of times that a cell can divide prior to

26
senescence, is a model for aging of division-competent cells. One intuitive concept is that
babies are born young, independent of the age of their parents. This process, mother-daughter
age asymmetry, also occurs in budding yeast. Mother cells age with each budding cycle;
however, daughter cells for the most part are born young, with a full RLS.
General mechanisms for mitochondrial quality control in metazoans and yeast were
described previously. Here, I describe the role for two mechanisms for mitochondrial quality
control during aging in budding yeast, mitochondrial protein repair and fusion/fission.
Pim1p/Lon is a conserved ATP-dependent protease in the mitochondrial matrix with roles
including chaperone activity for respiratory complex assembly and turnover of misfolded
mitochondrial proteins and aggregates. Deletion of PIM1 decreases RLS in yeast and leads to
an oxidizing cytosolic environment, consistent with unrepaired damage to mitochondrial oxygen-
handling proteins that are a source of reactive oxygen species (ROS). Pim1p activity is also
decreased in aged yeast cells [155], suggesting that protein repair by Pim1p is a mechanism for
mitochondrial quality control during aging.
In addition to protein repair, mitochondria must also undergo proper fusion/fission events
to ensure mitochondrial quality control. The mitofusins, Fzo1p and Mgm1p, mediate outer and
inner membrane fusion, respectively, while Dnm1p drives mitochondrial fission. Inhibition of
inner membrane fusion shortens RLS and CLS and sensitizes cells to apoptosis in S. cerevisiae
[156]. Furthermore, inhibition of outer membrane fusion shortens the lifespan of the fungal
model Neurospora crassa [157] [158]. Conversely, inhibition of mitochondrial fission, by
deletion of DNM1, extends lifespan in S. cerevisiae and Podospora anserina [159]. These
studies support the model that maintaining mitochondria as a continuous reticulum promotes
longer lifespan, potentially by intraorganellar complementation of damaged mitochondrial
components.
In silico studies modeling mitochondrial network dynamics revealed conditions under
which mitochondrial fission and fusion can be harmful [160]. According to the “mitochondrial
27
infectious damage adaption” model, as cells age, the abundance of damaged mitochondria
increases beyond a level that can be repaired by intraorganellar complementation. Instead,
mixing of mitochondria can lead to propagation of mitochondrial damage to other mitochondria.
Thus, while mitochondrial fusion and fission can promote mitochondrial function, their function in
mitochondrial quality control may be more complex than previously appreciated.
ER quality control and its effect on lifespan: Diffusion barriers promote asymmetry of
intraconnected organelles, such as the ER.
The ER is inherited from the mother cell to the developing bud as cortical ER (cER)
tubules along the mother-bud axis [30, 34]. ER inheritance is dependent upon the type V
myosin motor complex Myo4-She3p [36]. cER inheritance to the bud tip, and spreading along
the plasma membrane, is regulated by the Type 2C protein phosphatase, Ptc1p, through
dephosphorylation of the MAP kinase Slt2p [123, 161]. This is a tightly regulated process and
may be a mechanism that contributes to or promotes ER asymmetry in the yeast cell. Indeed,
during ER stress, cER inheritance is compromised and the cell cycle is paused. This process is
dependent upon increased phosphorylation of Slt2p, through a novel action of Wsc1p separate
from Cell Wall Integrity (CWI) sensing. Furthermore, when Slt2 is absent and cER inheritance
proceeds during ER stress, buds inherit compromised ER, and both cells become jeopardized
and fail to grow [162]. This type of asymmetry may appear different when compared to other
aging factors that are retained in the mother cell and contribute to aging. However, due to the
incredible ability of the cell to reverse ER stress and ER dysfunction (UPR, ERAD), this
asymmetry actually allows the cell to repair ER prior to bud inheritance, ensuring inheritance of
a functional unit and survival of both cells.
Due to the continuous nature of the ER network, a way to establish asymmetry without
physical separation is to create diffusion barriers. These are easily demonstrated in yeast ER

28
using fluorescence lost in photobleaching (FLIP) experiments on fluorescent proteins targeted to
the lumen or membrane [163, 164]. These studies suggest that while the ER lumen appears to
be continuous, barriers exist at the ER membrane near the division neck [164]. Furthermore,
recent work has shown that misfolded ER/golgi proteins are retained in the mother cell and this
is dependent upon a diffusion barrier formed at the bud neck (Fig. 4)[163]. Production and
maintenance of the diffusion barrier is dependent on the concerted effort of several factors.
First, a septin ring is formed and recruits cell polarization proteins, including Bud5 and Bud1,
which activate polarisome proteins, such as Bud6 via Cdc24 and Cdc42. This then results in the
accumulation of sphingolipids at the bud neck, which acts as a lateral diffusion barrier in the
cortical ER, preventing content mixing between mother and daughter ER and thus promoting
asymmetry. Disruption of any of the members in this complex cascade disrupts the asymmetry,
allowing misfolded proteins to be inherited by the daughter cell [163]. How does the diffusion
promote asymmetric cell division? It is unlikely that the diffusion barrier can distinguish
damaged from undamaged proteins. In addition, because membrane proteins can move through
the diffusion barrier, albeit at a much slower rate, the ER diffusion barrier alone cannot maintain
asymmetry [164]. Therefore it is more plausible that protein synthesis occurs in the bud and the
diffusion barrier prevents the loss of newly synthesized, functional proteins from the bud back
into the mother. Indeed specific mRNAs, particularly those responsible for ER anchorage to the
PM (TCB2, and TCB3), and sphingolipid biosynthesis (LCB1), are found to localize to the bud
[165]. Furthermore, membrane proteins are enriched in this data set and these proteins can be
quickly translated, properly folded in the ER, and shipped to their designated site of action while
the diffusion barrier prevents their loss into the mother cell. Thus by preventing inheritance of
aged or misfolded proteins into the bud and preventing the loss of newly synthesized proteins to
the mother, the ER diffusion barrier promotes asymmetric cell division.
While the ER plays an essential role in quality control of proteins and cellular
homeostasis, its role in aging is still being investigated. As described, ER diffusion barriers

29
promote asymmetry of transmembrane proteins and misfolded proteins accumulate in the
mother cell to produce an immaculate daughter cell. Disruption of this asymmetry is expected to
extend mother lifespan by shuttling damaged proteins to the daughter and compromising
daughter cell lifespan. However, deletion of BUD1, one of the key players in diffusion barrier
formation decreases lifespan in budding yeast. Only under conditions of ER stress did disruption
of the diffusion barrier promote mother cell lifespan at the expense of the daughter cell [163].
These data suggest that the ER only plays a role in aging under stress conditions. More
investigation is necessary to tease out the direct and indirect role of the ER in aging. Recent
work examining the redox state of ER during stress, found it to be a more reducing environment
as a whole [166]. Excitingly, they were able to do this with a roGFP variant in living cells. This
makes it possible to use the oxidized status of ER as a marker for ER fitness and investigate
possible asymmetry during cellular division and over the course of aging.
Mitochondrial quantity control during cell cycle progression: A cell cycle checkpoint that
monitors mtDNA in daughter cells
Checkpoints ensure that critical processes at each phase of the cell cycle are correctly
completed before progression to the next phase. The best characterized checkpoints consist of
1) a sensor that monitors a specific cell division event, 2) a signal transduction pathway that
receives signals from the sensor, and 3) targets or effectors that arrest the cell cycle in
response to defects, repair of defects and/or trigger cell death when repair is not possible.
Below we describe mechanisms that monitor the presence and quantity of mitochondrial
membranes and DNA (mtDNA), and inhibit cell cycle progression in response to defects in
mitochondrial quantity control.
mtDNA encodes subunits of the electron transport chain and F1Fo-ATPase, and RNAs
required for mitochondrial protein synthesis. Mutations of human mtDNA have clinical
manifestations in the brain, heart, skeletal muscle, kidney, and endocrine system, and are linked

30
to aging and age-associated neurodegenerative diseases [167, 168]. Moreover, changes in
mtDNA copy number occur in a number of primary human cancers and correlate with cancer
progression [169, 170].
Recent studies revealed a mtDNA inheritance checkpoint in yeast, which inhibits
progression from G1 to S phase of the cell cycle in response to the absence of mtDNA in buds
[171]. Interestingly, this G1 to S transition defect is not a consequence of loss of mitochondrial
respiration or mtDNA-encoded respiratory chain components. Indeed, yeast that contain mtDNA
with no coding information exhibit wild-type G1 to S progression. Thus, the checkpoint
machinery monitors mtDNA itself, not genes encoded by mtDNA.
Previous studies revealed that DNA damage checkpoint proteins, including Rad53p
(mammalian Chk2), regulate mtDNA in yeast and mammalian cells. Deletion of RAD53 alters
mtDNA copy number in yeast [172-174]. Inhibition of ATM, an upstream activator of Chk2 and
site of mutation in the neurodegenerative disorder ataxia telangiectasia (A-T), results in a
reduction in mtDNA copy number in mammalians cells [175]. It was also shown that loss of
mtDNA activates the kinase activity of Rad53p, which was required for regulation of cell cycle
progression in response to mtDNA loss. These findings indicate that the mtDNA inheritance
checkpoint is regulated by a conserved checkpoint signaling pathway. Since proteins in the
DNA damage checkpoint also regulate mtDNA content in mammalian cells [175], it is possible
that this checkpoint is conserved. Other studies indicate that a decrease in mtDNA copy number
produced by deletion of Abf2p, a high mobility group mtDNA binding protein, results in a
delayed cell cycle progression [173]. Moreover, a delay in cell cycle progression produced by
mutation of RAD53 or growth on a non-fermentable carbon source, results in an increase in
mtDNA copy number [173]. Thus, it is possible that the rate of cell cycle progression is
regulated by the size of the pool of heritable mtDNA, and that complete loss of mtDNA results in
a complete block in the cell cycle.

31
Mitochondrial quantity and quality control as a mechanism for mother-daughter age
asymmetry
Mother-daughter age asymmetry is a consequence of asymmetric yeast cell division.
Aging determinants, including extrachromosomal rDNA circles, protein aggregates containing
oxidatively damaged or unfolded proteins, and lower-functioning organelles, including vacuoles
(similar to lysosomes), are selectively retained in mother cells [176-179]. Conversely,
rejuvenation determinants, including higher-functioning vacuoles and detoxification factors for
ROS, are preferentially inherited by daughter cells [165, 180].
Findings indicate that the machinery for mitochondrial inheritance can segregate
mitochondria during yeast cell division. Fluorescence photobleaching studies indicate that
mitochondria in the bud form a single continuous reticulum that is physically distinct from
mitochondria in mother cells, which do not form a continuous reticulum [13]. Furthermore,
emerging studies support the existence of mechanisms for mitochondrial quantity control during
inheritance in budding yeast [181]. Quantitative analysis of mitochondrial volume in living yeast
revealed that mitochondrial network size increases with increasing cell size in buds and
decreases with increasing age in mother cells. Interestingly, regardless of the mother's age or
mitochondrial content, all buds attained the same average ratio of mitochondrial volume to
daughter cell size.
Another example of cellular mitochondrial quantity control is a checkpoint that monitors
mitochondrial content in buds and blocks cell cycle progression at cytokinesis when daughter
cells fail to inherit mitochondria [171]. This mitochondrial inheritance checkpoint is controlled by
a conserved checkpoint signaling pathway, the mitotic exit network. The mechanism for
monitoring mitochondrial content in yeast daughter cells is not well understood. However, it is
possible that the mechanism that controls mitochondrial content in buds also serves as a sensor
for the mitochondrial inheritance checkpoint.

32
One goal of my work is to discern whether mitochondrial quality is regulated during
replication and aging. Mitochondria may utilize several quality control mechanisms to ensure
that the inherited mitochondria are functional. In chapter II, I describe a role for anchorage of
high functioning mitochondria in the bud tip as a mechanism of mitochondrial quality control in
yeast lifespan control and mother-daughter age asymmetry.
Skeletal muscle structure and function
Skeletal muscle is a highly ordered tissue consisting of repeating units of sarcomeres.
Sarcomeres are the contractile units of skeletal muscle. Each sarcomere is delineated by a
structure known as the Z disc, composed of the protein connectin. The Z disc and elastic
filaments serve to anchor the contractile unit (sarcomere) to the rest of the muscle fiber, both of
which are composed of connectin [182]. The sarcomere is composed of thick and thin filaments
made of bundles of myosin and F actin respectively. These filaments are the contractile
elements of the muscle. Thin filaments have the additional regulatory proteins tropomyosin and
troponin. Binding of these proteins to thin filaments regulates contraction [183].
The high degree of order in skeletal muscle tissue is not limited to the sarcomere. Triad
structures exist on either side of the sarcomere Z discs. Triads are composed of specialized
invaginations of sarcolemma (plasma membrane) called the transverse tubule or T-Tubule, and
specialized sarcoplasmic reticulum termed the terminal cisternae. A triad is the physical and
functional connection between a T-tubule and two terminal cisternae on either side (Fig. 5).
There are a number of proteins important for this interaction, from triadin to junctophillin,
however, one pair of proteins form a physical and functional link critical for muscle function; the
dihydropyridine receptor (DHPR or Cav1.1) and the ryanodine receptor (RyR). The DHPR is a
voltage sensitive L-type Ca2+ channel residing on the T-tubule membrane and making physical
contacts with RyR-1 throught the II-III loop domain [184]. RyR exists as three isoforms, in

33
skeletal muscle RyR-1 is the most abundant with smaller amounts of RyR-3 [185]. Ryanodine
isoform 3 is also present in the brain while RyR-2 is considered solely a cardiac isoform [186].
This is a slight misnomer as RyR’s are present in many different cell types in varying isoform
ratios. In skeletal muscle mitochondria reside in the areas on either side of the triads, making
physical contact with the SR [187]. Skeletal muscle fibers are innervated or otherwise
functionally connected to motor neurons. Each motor neuron makes connections to numerous
muscle fibers; this connectivity is termed the motor unit. When a motor neuron makes a
connection to a muscle fiber the resulting synapse is called a neuromuscular junction (NMJ).
These NMJs are insulated from outside influence by Schwann cells. Schwann cells cover the
motor end plate and synaptic cleft [188].
Figure 5. Schematic representing action potentials and DHPR-RyR interactions. The basis for excitation contraction coupling is the ability of the sarcolemmal membrane to potentiate an action potential. This action potential triggers a conformational change in the RyR through the DHPR, releasing calcium from SR stores and eliciting contraction.

34
Excitation contraction coupling
The NMJ is responsible for transmitting the neuronal action potential to the muscle fiber
leading to contraction. This is termed excitation-contraction coupling (EC coupling). A neuronal
action potential arrives at the NMJ stimulating Ca2+ ions to enter the neuron. These Ca2+ ions
cause the release of synaptic vesicles containing the neurotransmitter acetylcholine (ACh).
Acetylcholine crosses the synaptic cleft and binds to the motor endplate binding to ligand gated
ion channels. These ion channels are stimulated and allow ions to flow across the sarcolemma
creating an action potential in the muscle fiber. This action potential now travels across the T-
tubule membrane, causing a conformational change in DHPR. In skeletal muscle, this
conformational change in DHPR is relayed to RyR1 on the sarcoplasmic reticulum membrane
through physical contacts [184], passing this conformational change to the RyR1, opening the
channel and releasing Ca2+ to the cytoplasm (Fig. 4). Calcium now binds to troponin, removing
the inhibitory signal between myosin and actin of the thick and thin filaments allowing
contraction to occur if ATP is present. At this time, small amounts of Ca2+ are also taken up by
mitochondria, activating Ca2+ dependent matrix dehydrogenases of the citric acid cycle. This
ensures the production of ATP for not only future rounds of contraction, but also that ample ATP
is present for reabsorption of Ca2+ into the SR by the sarcoplasmic endoplasmic reticulum
calcium ATPase. During relaxation of the muscle fiber, calcium disassociates from troponin, is
reabsorbed into the SR and sequestered by calsequestrin [183].

35
Chapter II
Mitochondrial quality control during inheritance is associated with lifespan and mother-
daughter age asymmetry in budding yeast
Published:
McFaline-Figueroa JR*, Vevea JD*, Swayne TC, et al. Mitochondrial quality control during inheritance is associated with lifespan and mother-daughter age asymmetry in budding yeast. Aging Cell. 2011;10(5):1–11. *These authors contributed equally to this work

36
Abstract
Fluorescence loss in photobleaching experiments and analysis of mitochondrial function using
superoxide and redox potential biosensors revealed that mitochondria within individual yeast
cells are physically and functionally distinct. Mitochondria that are retained in mother cells
during yeast cell division have significantly lower redox potential and higher superoxide levels
compared to mitochondria in buds. Retention of mitochondria with lower redox potential in
mother cells occurs to the same extent in young and older cells, and can account for the age-
associated decline in total cellular mitochondrial redox potential in yeast as they age from 0-5
generations. Deletion of Mmr1p, a member of the DSL1 family of tethering proteins that
localizes to mitochondria at the bud tip and is required for normal mitochondrial inheritance,
produces defects in mitochondrial quality control and heterogeneity in replicative lifespan (RLS).
Long-lived mmr1∆ cells exhibit prolonged RLS, reduced mean generation times, increased
mitochondrial redox potential and lower mitochondrial superoxide levels compared to wild-type
cells. Short-lived mmr1∆ cells exhibit the opposite phenotypes. Moreover, short-lived cells give
rise exclusively to short-lived cells, while the majority of daughters of long-lived cells are long
lived. These findings support the model that the mitochondrial inheritance machinery promotes
retention of lower-functioning mitochondria in mother cells and that this process contributes to
both mother-daughter age asymmetry and age-associated declines in cellular fitness.

37
Introduction
An intuitive concept in human experience is that babies are born young, largely
independent of the age of their parents. The finding that a similar mother-daughter age
asymmetry also occurs in the budding yeast Saccharomyces cerevisiae gave rise to the model
that age determinants are asymmetrically distributed during yeast cell division, which allows for
continued aging of mother cells and rejuvenation of daughter cells [176, 189-191]. In support of
this, oxidatively-damaged proteins, mitochondria with low membrane potential (∆) and
extrachromosomal rDNA circles were identified as senescence factors that are retained in
mother cells [176, 192, 193]. Conversely, ROS has been linked to mother-daughter age
asymmetry, and the activity of cytosolic catalase, an antioxidant, is increased in daughter cells
after cytokinesis and separation from their mother cells [177, 192, 194-197]. Sir2p, the founding
member of the Sirtuin family of age-regulating proteins, is required for asymmetric distribution of
aging determinants and mother-daughter age asymmetry [192, 198, 199].
Segregation of mitochondria on the basis of ∆ and of an oxidatively damaged
mitochondrial protein has been linked to mother-daughter age asymmetry [178, 193]. Moreover,
there are links between mitochondrial ROS and aging in yeast and other cell types [178, 200-
203]. Deletion of the mitochondrial MnSOD SOD2 or CCCP treatment increase ROS and
decrease yeast chronological lifespan [204, 205], while reduction of mitochondrial ROS
production by overexpression of SOD2, deletion of the nuclear protein MRG19p or
manipulations that increase respiration result in increased chronological lifespan, RLS or both
[206-212].
While chronological lifespan extension by increased respiration is well documented,
analysis of the role of respiration for RLS extension by calorie restriction yielded conflicting
results [211, 213-215]. The role of mitochondrial metabolic activity in RLS in yeast is also a

38
matter of debate. Indeed, deletion of mitochondrial DNA, which encodes respiratory chain
components, has variable effects on lifespan in different yeast strains [196, 213, 216]. Similarly,
deletion of mitochondrial metabolic genes that have been implicated in lifespan control in C.
elegans has no effect on aging in yeast [217].
Here, we studied the role of mitochondrial inheritance in lifespan control and mother-
daughter age asymmetry in budding yeast. We find that mitochondria within individual yeast
cells are variable in superoxide levels and redox potential. In addition, we obtained evidence
that mitochondria with higher superoxide levels and lower redox potential are preferentially
retained in mother cells and that this process may contribute to the age-associated decline in
mother cell fitness. Finally, we find that a mutation that affects mitochondrial quality control
during inheritance compromises lifespan control and mother-daughter age asymmetry.

39
Materials and Methods
Yeast strains and growth conditions: All S. cerevisiae strains used in this study are
derivatives of the wild type BY4741 strain (MATa his3∆1 leu2∆0 met15∆0 ura3∆0). The mmr1∆
strain, 4139 (MATa his3∆1 leu2∆0 met15∆0 ura3∆0 mmr1∆::KANMX6), and the sir2∆ strain,
3738 (MATa his3∆1 leu2∆0 met15∆0 ura3∆0 sir21∆::KANMX6) have the MMR1 or SIR2 genes
replaced by KANMX6 cassettes, respectively. All three strains are from Open Biosystems
(Huntsville, AL). The strain RMY003 (MATa his3∆1 leu2∆0 met15∆0 ura3∆0 mmr1∆::leu2) has
the MMR1 gene replaced by the LEU2 gene in a BY4741 background. For labeling of
mitochondria, BY4741 and 4139 strains were transformed with a centromeric plasmid containing
the mitochondrial matrix targeting signal sequence of citrate synthase 1 (CIT1) fused to GFP
[218]. The resulting strains are TSY200: BY4741[pCIT1GFP:URA3] and TSY201:
4139[pCIT1GFP:URA3]. BY4741 cells expressing a Cit1p-GFP fusion protein from its genomic
locus, 95700-YNR001C, (MATa his3∆1 leu2∆0 met15∆0 ura3∆0 his5+ CIT1-GFP) are from the
Yeast GFP Clone Collection (Huh et al. Nature, 2003; Invitrogen, Eugene OR). The RMY015
strain (MATa his3∆1 leu2∆0 met15∆0 ura3∆0 his5+ CIT1-GFP mmr1∆::leu2) has the MMR1
gene replaced by the LEU2 gene in 95700-YNR001C. Yeast cells were cultivated and
manipulated as described previously [218].
To create the plasmid pmito-roGFP1, the mitochondrial-targeting signal sequence
(MTSS) of ATP9 was obtained by restriction enzyme digestion of plasmid ID# B1063 or
pTDT104 GAL1+preATP-9-RFP [218] with SpeI and XhoI (New England Biolabs, Ipswich, MA).
These constructs were gel purified and ligated with T4 ligase (NEB, Ipswich, MA) into the Spe1
and Xho1 sites in yeast shuttle vectors Plasmid ID# 1177 or p416 GPD (Addgene, Cambridge,
-competent bacterial cells (Invitrogen,
Carlsbad, CA). Plasmid clones were recovered and processed with a MiniPrep kit (Qiagen,
Valencia, CA). The roGFP1 insert was amplified using PCR and forward primers 5’-

40
AGATACGGATCCATGAGTAAAGGAGAAGAACTTTTCACTGGAG-3’ and reverse primers R 5’-
AGATACCTCGAGCCATGGTACCAGCTGCAGATCTC-3’ (IDT, Coralville, IA) from pRSETB
[219]. The roGFP1 PCR product and the new plasmid, which contained p416 GPD/ATP9
MTSS, were then digested with restriction enzymes XhoI and BamHI (NEB, Ipswich, MA).
competent bacterial cells. Plasmid clones were recovered and processed with a MiniPrep kit.
To verify proper plasmid construction, the pmito-roGFP1 plasmid was sequence verified with the
sequencing primer 5’-CAGCACGTGTCTTGTAGTTCCCG-3’.
Fluorescence microscopy: For visualization of mitochondria, cells were grown to mid-log
phase in synthetic complete (SC) medium with or without uracil at 30°C. Live cells were
mounted on glass slides, and used for no more than 20 mins for visualization. For labeling with
the superoxide indicator, dihydroethidium (DHE) (Invitrogen – Molecular Probes, Eugene,
Oregon), cells were incubated with 40 µM DHE (dissolved in DMSO) in fresh growth medium for
30 min at 30°C, then washed 1x with growth medium and visualized without fixation. For
determination of relative mitochondrial redox state we transformed yeast with a plasmid
containing the mitochondrial targeting sequence of ATP9 fused to roGFP1 (mito-roGFP1). Cells
were grown to mid-log phase in SC-Ura, concentrated and visualized without fixation.
All imaging was performed as described previously [218] on one of the following
microscope systems: an Axiovert 200M microscope with 100x/1.4 Plan-Apochromat objective
(Zeiss, Thornwood, NY) and Orca ER cooled charge-coupled device (CCD) camera
(Hamamatsu, Bridgewater, NJ); an Axioskop 2 microscope with 100x/1.4 Plan-Apochromat
objective (Zeiss, Thornwood, NY) and an Orca 1 cooled CCD camera (Hamamatsu) or an
Axiocam CCD camera (Zeiss, Thornwood, NY) with FITC and/or Rhodamine filter sets; an
inverted AxioObserver.Z1 microscope with a 100x/1.3 oil EC Plan-Neofluar objective (Zeiss,
Thornwood, NY) and Orca ER cooled charge-coupled device (CCD) camera (Hamamatsu,
Bridgewater, NJ), along with an LED Colibri system (Zeiss, Thornwood, NY) including LED

41
wavelengths at 365 and 470 nm. Hardware was controlled by Openlab, Volocity software
(Perkin-Elmer, Waltham, MA) and Axiovision software (Zeiss, Thornwood, NY), respectively.
Fluorescence loss in photobleaching (FLIP): FLIP experiments were performed on a Nikon
A1R-MP laser scanning confocal microscope. Wild-type yeast expressing mitochondrial matrix-
targeted GFP were mounted on agarose pads as described above. Bleaching was performed
with the 488-nm laser line on a spot 0.5 µm in diameter. A cycle consisting of 125 ms
photobleaching and 250 ms imaging was repeated for a total of 12 sec.
Quantitation of the fluorescence of GFP- or DHE-labeled mitochondria: Cells were
incubated with 40 µM DHE in growth medium for 30 min at 30°C, washed with growth medium,
and visualized without fixation. To quantify relative fluorescence of GFP and DHE in
mitochondria, wide-field z-series were collected through a beamsplitter (DualView,
Photometrics, Inc., Tucson, AZ) that simultaneously projects images of green and red
fluorescence on a CCD camera. The filters showed negligible crosstalk under the conditions
used for staining and imaging. Transmitted-light images were collected to indicate the location
and size of the bud and mother cell. Channel images were aligned in ImageJ using transmitted
light and cell background as guides and the Cairn Image Splitter plugin. The obtained images
were digitally deconvolved by iterative restoration (100% confidence limit, 40 iteration limit).
Relative mitochondrial volume was estimated by calculating integrated voxel intensity in
thresholded, deconvolved wide-field z-series of mitochondria-targeted GFP. Images were
deconvolved using a constrained iterative restoration algorithm (Volocity, Perkin-Elmer,
Waltham, MA). Voxels were identified and quantified using Volocity Quantitation software. Bud
size and zones of mother and bud were identified using corresponding transmitted-light images.
The distribution of mitochondrial superoxide relative to mitochondrial mass was
determined by calculating integrated voxel intensity (F) of DHE in deconvolved z-series. The
distribution of DHE or GFP in specific regions within the mother or bud was normalized as Fregion

42
of interest/Ftotal. The F values for DHE were compared to the corresponding F values for GFP in the
same region by calculating the DHE/GFP ratio. DHE/GFP ratio was calculated in cells in which
the bud length was over 0.50 times the mother cell length.
To test the dynamic range of DHE, we exposed yeast expressing Cit1p-GFP from its
chromosomal locus to 10mM H2O2 (Fisher Scientific, Pittsburgh, PA) or 50µM Tempol (Sigma-
Aldrich, St. Louis, MO) for 30 minutes in SC-Ura. Cultures were washed twice with 1 mL of
fresh media and visualized along with a control sample.
Quantitation of the fluorescence of reduced-to-oxidized mito-roGFP1: Yeast cells were
transformed with plasmid pmito-roGFP1 to measure mitochondrial redox state. The relative
redox state of mito-roGFP1 was determined by calculating the ratio of the integrated voxel
intensity in background-subtracted, thresholded, deconvolved wide field z-series of mito-roGFP1
at excitation 470nm and 365nm, reduced to oxidized, respectively. Images were deconvolved
using a constrained iterative restoration algorithm (Volocity, Perkin-Elmer, Waltham, MA).
Voxels were identified and quantified using Volocity Quantitation software. Bud size and zones
of mother and bud were identified using corresponding transmitted-light images.
To determine the ratio of reduced to oxidized mito-roGFP1, z-series were collected,
deconvolved, background-subtracted and thresholded using Volocity software (Perkin Elmer,
city, state). To calculate the reduced to oxidized ratio of mito-roGFP1, we divided the reduced
channel (λex=470nm, λem=525nm) by the intensity of the oxidized channel (λex =365nm, λem
=525nm). To test the dynamic range of mito-roGFP1, we incubated yeast expressing mito-
roGFP1 in 10mM H2O2 (Fisher Scientific, Pittsburgh, PA) or 10mM DTT (Fisher Scientific,
Pittsburgh, PA) for 30 minutes in SC-Ura. Cultures were washed twice with 1 mL of fresh
media and visualized along with a control sample using an inverted epifluorescence microscope
equipped with a Colibri LED system (Zeiss, Thornwood, NY) and Orca ER CCD camera
(Hamamatsu, Bridgewater, NJ).

43
Replicative Lifespan Determination: RLS measurements were performed as described
previously [195], with or without alpha-factor synchronization. Briefly, frozen yeast strain stocks
(stored at -80°C) were grown in rich, glucose based solid medium (YPD) at 30°C. Single
colonies of each yeast strain were suspended in liquid YPD and grown to mid-log phase at 30°C
with shaking and aeration. If synchronized, cultures were treated with alpha-factor (100 µg/ml,
Genemed Synthesis Inc) for 3 hrs, washed three times with water, and resuspended in water.
For unsynchronized and synchronized cultures, an aliquot of the cell suspension was applied to
YPD plates, small budded-cells or shmoos, respectively, were isolated and arranged in a matrix
using a micromanipulator mounted on a dissecting microscope (Zeiss, Thornwood, NY). These
small budded cells or shmoos were henceforth referred to as the mother cell. After their first
round of replication, mother cells were removed and discarded, and their daughter cells
renamed virgin mother cells. After each replication, the time and number of daughter cells
produced by each virgin daughter cell was recorded until all replication ceased.
ConA-594 labeling for determination of old cells in culture: Yeast cultures were grown to
mid-log phase and incubated with 100µM concanavalin A, Alexa Fluor-594 conjugate (Sigma-
Aldrich, St Louis, MO) for 30 min at 30°C, washed with growth medium, and propagated in fresh
medium. ConA fluorescence was used to identify old cells. Cell age was determined by
Calcofluor staining of bud scars. Because calcofluor staining interferes with mito-roGFP1
imaging, redox potential was measured in separate aliquots of cells that were not stained with
Calcofluor.
Statistical Methods
All p values were determined using a two-tailed Student’s t-test assuming unequal
variance. Probability plots for distribution fitting, with associated Anderson-Darling goodness-of-
fit statistics and p-values, were carried out using Minitab 14 statistical analysis software.

44
Other methods
Yeast cells were transformed using the lithium acetate method [218]. Budding index was
calculated by dividing the number of budding cells by the total number of cells in a mid-log
phase culture grown in YPD.
Viability was determined using the FUN 1 cell stain from the LIVE/DEAD Yeast Viability
Kit (Invitrogen – Molecular Probes, Eugene, OR) according to the manufacturer’s instructions.
Briefly, mid-log phase cells grown on YPD were diluted to a concentration of approximately 1 x
107 cells/ml, FUN 1 was added to a final concentration of 10 µM and samples were incubated at
30°C for 40 minutes with shaking. The conversion of FUN 1 by viable cells was quantified by
fluorescence microscopy. Cells with prominent fluorescent intravacuolar structures were scored
as viable. Cells that lacked these structures and had diffuse green or yellow cytosolic
fluorescence were scored as non-viable.
To determine the percent of cells that undergo cytokinesis in under 120 min, cells from
wild-type and mmr1∆ mid-log phase cultures were isolated and arranged in a matrix using a
micromanipulator mounted on a dissecting microscope (Zeiss, Thornwood, NY). Cytokinesis
was determined by assessing separation of daughter and mother cell with the micromanipulator
at 120 min.
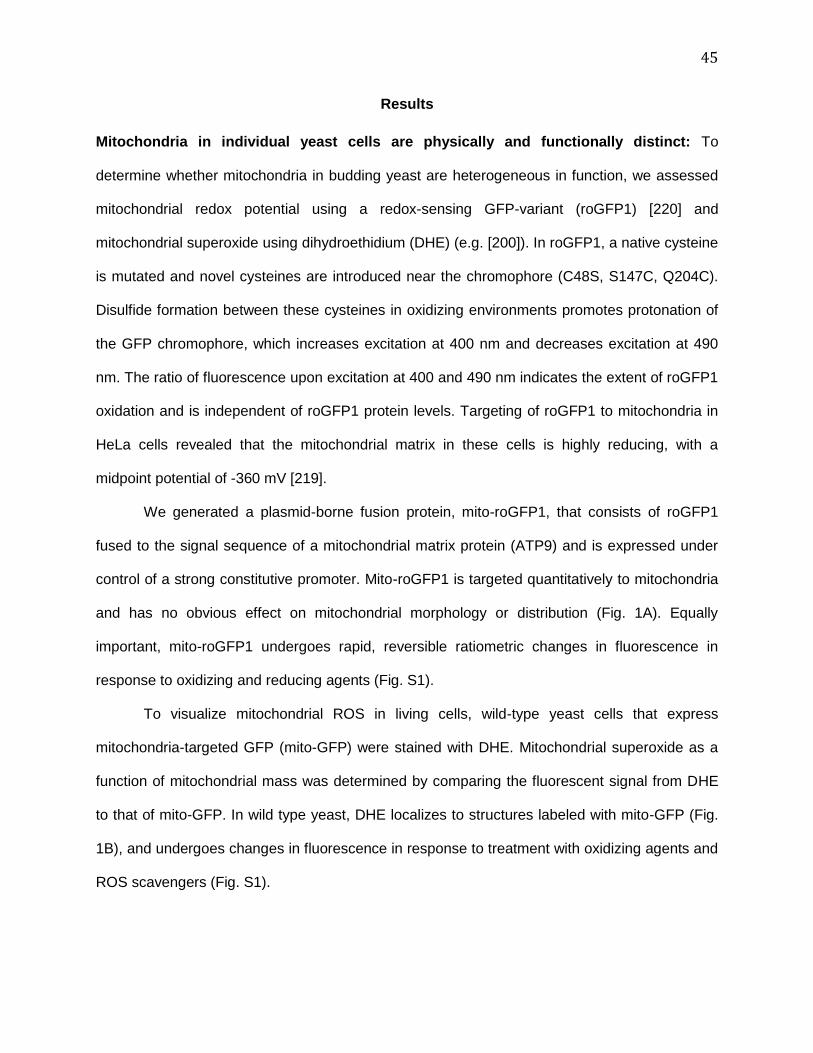
45
Results
Mitochondria in individual yeast cells are physically and functionally distinct: To
determine whether mitochondria in budding yeast are heterogeneous in function, we assessed
mitochondrial redox potential using a redox-sensing GFP-variant (roGFP1) [220] and
mitochondrial superoxide using dihydroethidium (DHE) (e.g. [200]). In roGFP1, a native cysteine
is mutated and novel cysteines are introduced near the chromophore (C48S, S147C, Q204C).
Disulfide formation between these cysteines in oxidizing environments promotes protonation of
the GFP chromophore, which increases excitation at 400 nm and decreases excitation at 490
nm. The ratio of fluorescence upon excitation at 400 and 490 nm indicates the extent of roGFP1
oxidation and is independent of roGFP1 protein levels. Targeting of roGFP1 to mitochondria in
HeLa cells revealed that the mitochondrial matrix in these cells is highly reducing, with a
midpoint potential of -360 mV [219].
We generated a plasmid-borne fusion protein, mito-roGFP1, that consists of roGFP1
fused to the signal sequence of a mitochondrial matrix protein (ATP9) and is expressed under
control of a strong constitutive promoter. Mito-roGFP1 is targeted quantitatively to mitochondria
and has no obvious effect on mitochondrial morphology or distribution (Fig. 1A). Equally
important, mito-roGFP1 undergoes rapid, reversible ratiometric changes in fluorescence in
response to oxidizing and reducing agents (Fig. S1).
To visualize mitochondrial ROS in living cells, wild-type yeast cells that express
mitochondria-targeted GFP (mito-GFP) were stained with DHE. Mitochondrial superoxide as a
function of mitochondrial mass was determined by comparing the fluorescent signal from DHE
to that of mito-GFP. In wild type yeast, DHE localizes to structures labeled with mito-GFP (Fig.
1B), and undergoes changes in fluorescence in response to treatment with oxidizing agents and
ROS scavengers (Fig. S1).
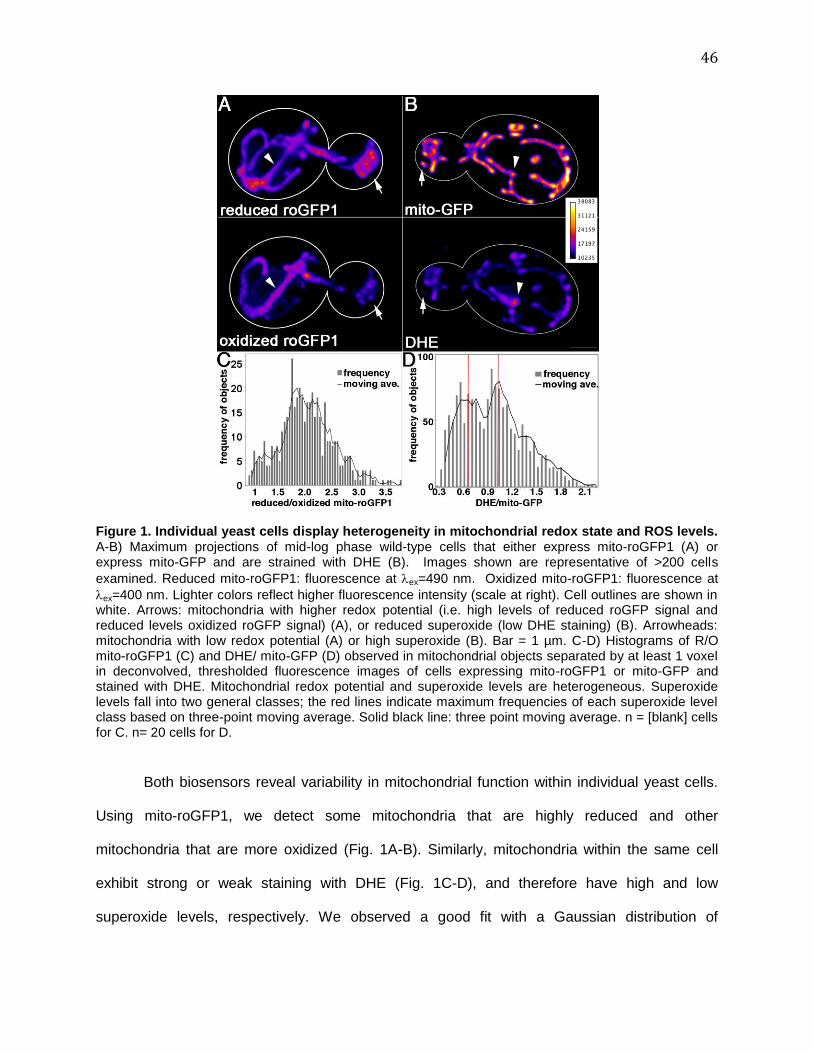
46
Figure 1. Individual yeast cells display heterogeneity in mitochondrial redox state and ROS levels. A-B) Maximum projections of mid-log phase wild-type cells that either express mito-roGFP1 (A) or express mito-GFP and are strained with DHE (B). Images shown are representative of >200 cells
examined. Reduced mito-roGFP1: fluorescence at ex=490 nm. Oxidized mito-roGFP1: fluorescence at
ex=400 nm. Lighter colors reflect higher fluorescence intensity (scale at right). Cell outlines are shown in white. Arrows: mitochondria with higher redox potential (i.e. high levels of reduced roGFP signal and reduced levels oxidized roGFP signal) (A), or reduced superoxide (low DHE staining) (B). Arrowheads: mitochondria with low redox potential (A) or high superoxide (B). Bar = 1 µm. C-D) Histograms of R/O mito-roGFP1 (C) and DHE/ mito-GFP (D) observed in mitochondrial objects separated by at least 1 voxel in deconvolved, thresholded fluorescence images of cells expressing mito-roGFP1 or mito-GFP and stained with DHE. Mitochondrial redox potential and superoxide levels are heterogeneous. Superoxide levels fall into two general classes; the red lines indicate maximum frequencies of each superoxide level class based on three-point moving average. Solid black line: three point moving average. n = [blank] cells for C. n= 20 cells for D.
Both biosensors reveal variability in mitochondrial function within individual yeast cells.
Using mito-roGFP1, we detect some mitochondria that are highly reduced and other
mitochondria that are more oxidized (Fig. 1A-B). Similarly, mitochondria within the same cell
exhibit strong or weak staining with DHE (Fig. 1C-D), and therefore have high and low
superoxide levels, respectively. We observed a good fit with a Gaussian distribution of

47
mitochondrial redox potential (Anderson-Darling goodness-of-fit statistic for a normal distribution
fit: 0.959, p value = 0.015). In contrast, analysis of the ratio of DHE to mito-GFP revealed an
apparent bimodal distribution of mitochondrial superoxide levels: mitochondria with higher
superoxide levels (DHE/mito-GFP ratio around 1.1) and mitochondria with lower superoxide
levels (DHE/mito-GFP ratio around 0.7) (Fig. 1B and 1D).
Mitochondria in the mother cell are physically distinct: If mitochondria within individual cells
are functionally distinct, they are expected to be physically distinct. We tested this using
fluorescence loss in photobleaching (FLIP) experiments on yeast in which GFP is targeted to
the mitochondrial matrix. In FLIP, a small area is photobleached repeatedly. As diffusion brings
fresh fluorophores into the targeted area and photobleached fluorophores out of the targeted
area, fluorescence is lost from all fluorophores that localize to the same membrane-bound com-
partment.
We repeatedly photobleached a 0.5 µm2 spot on mitochondria in the mother cell and
visualized GFP-labeled mitochondria by laser scanning confocal microscopy (Fig. 2). The
fluorescence of mito-GFP in the targeted area was lost within < 2 sec. Subsequently,
fluorescence was also lost from some mitochondria in the mother cell. However, fluorescence
persisted in other mitochondria in the mother cell and in all of the mitochondria within the bud.
These findings indicate that mitochondria in the mother cell can be discrete, physically distinct
entities. They also show that mitochondria in the bud are physically distinct from mitochondria in
the mother cell. Thus, mitochondria within individual yeast cells can be physically and
functionally distinct.

48
Figure. 2. Mitochondria in the mother cell are physically distinct. A 0.5 µm
2 area was photobleached
repeatedly in mitochondria in the mother cell of wild-type yeast expressing matrix-targeted mito-GFP. A cycle consisting of 125 ms photobleaching and 250 ms imaging was repeated for a total of 12 sec. A) Shaded volume projections of cells before (left) and after (right) photobleaching. PB: photobleached zone. ROI B1, ROI M1, ROI M2: regions of interest in the bud and the mother cell, respectively. B) Mean fluorescence intensity of mito-GFP as a function of time in the photobleached zone (PB area; red), a region of a mother cell mitochondrion that exhibits a loss of fluorescence (ROI-M2; blue), a region of a mother cell mitochondrion that does not exhibit loss of fluorescence (ROI-M1; black) and a region of mitochondria that accumulate in the bud tip and do not exhibit loss of fluorescence (ROI-B1; orange). Images and data are representative from analysis of >25 cells examined.
Mitochondria with lower redox potential are preferentially retained by mother cells: If
mitochondria are a mother-daughter age asymmetry determinant, then mitochondria that are
functionally distinct should be asymmetrically distributed during yeast cell division. Analysis of
DHE/mito-GFP ratios shows a small but statistically significant increase in the level of

49
mitochondrial ROS in mother cells compared to buds (Fig. 3A). Thus, mitochondria with lower
ROS are preferentially inherited by daughter cells and mitochondria with higher ROS are
retained in mother cells.
To determine whether mitochondria are also segregated on the basis of their redox
potential, we measured R/O mito-roGFP1 as a function of replicative age. Replicative lifespan
(RLS) is the cumulative number of mitotic divisions that a cell can undergo and is used as a
model for aging in cell division-competent cells that undergo reproductive senescence. We
developed a method to detect old cells in mid-log phase cultures by fluorescence microscopy,
based on a widely used biotinylation method (e.g. [200]). Mid-log phase cultures were pulse-
labeled with Alexa 594-Concanavalin A (ConA-594), which stains the cell wall, and propagated
in media without ConA-594. As a result, daughter cells produced after the ConA-594 pulse are
unstained, and older, ConA-594-stained cells are readily distinguished from young cells. Finally,
to determine the age of ConA-594 labeled cells as a function of time of growth, we used
Calcofluor white to visualize bud scars (Fig. 3B; Fig. S6).
We do not detect import of mito-roGFP into cells > 5 generations, presumably because
the mito-roGFP has high turnover rates in mitochondria and mitochondrial protein import
declines with age. Therefore, we measured mitochondrial redox potential in cells as they age
from 0-5 generations, about 23% of the mean RLS for our wild-type yeast cells. We find that
mitochondrial redox potential declines with age (Fig. 3C, n=73). This finding is consistent with a
recent report that age-associated increases in ROS levels are also detectable in young yeast
cells that are 5-7 generations in replicative age (Lam et al., 2011).

50
Figure. 3. Mitochondria with higher superoxide levels and lower redox potential are retained in mother cells in young and old yeast cells. A) Quantitation of DHE/mito-GFP of mitochondria in mother cells and buds of mid-log phase yeast cells (n= 57) were obtained as for Fig. 1. Asterisks denote significant differences. Mitochondrial superoxide levels were higher in mother cells compared to buds (p = 0.015). B) ConA-594-labeled cells were propagated in glucose-based media, and stained with Calcofluor white. Upper panels show a young cell at t = 1 hr of growth that has uniform ConA-594 labeling and one Calcofluor-labeled bud scar. Lower panels show an older cell at t = 17 hr of growth that has non-uniform ConA-594 labeling and several Calcofluor-labeled bud scars (arrows). Images shown are maximum projections of deconvolved z-series. C) Quantitation of R/O mito-roGFP1 in buds and mother cells at 0, 2 and 5 generations of replication (n = 35, 31 and 17, respectively) was carried out as for Fig. 1. Asterisks denote significant differences; *: p= 0.00025, **: p=0.003, ***: p=0.04. Old cells have lower mitochondrial redox potential compared to young cells. D) The decrease in mitochondrial redox state from 0-5 generations modeled by the equation (R/O)n=0.94
n(R/O)n=0. Grey: decline in mitochondrial redox potential
predicted by the model. Black: observed mitochondrial redox potential. Inset: decline of mitochondrial redox potential predicted by the model from 0 to 48 generations, the maximum RLS of the wild-type yeast strain. The red line marks theoretical mitochondrial redox state at 22 generations, the average RLS of the wild-type strain used.
We also detect a subtle but statistically significant decrease in the redox potential of
mitochondria in mother cells compared to buds as cells age from 0-5 generations of replicative
age. Though the difference in mitochondrial redox potential in mother cells and buds is small,
we obtained evidence that retention of mitochondria with lower redox potential in mother cells

51
can contribute to mother-daughter age asymmetry (Fig. 3D). We developed a mathematical
model for age-associated declines in mitochondrial redox potential based exclusively on the
retention of less fit mitochondria in mother cells as they age from 0-5 generations:
(R/O)n=0.94n(R/O)n=0, where R/O is R/O mito-roGFP1 and n is the number of cell divisions a cell
has undergone (Fig. 3D). The age-associated decline in total cellular mitochondrial redox
potential predicted by this model fits well with the observed decline in mitochondrial redox
potential in mother cells from 0-5 generations of replicative age. Moreover, extrapolation of the
model from young to old cells predicts a decline in mitochondrial redox potential that is
compatible with the RLS of the yeast strain used for these studies: the redox potential of wild-
type cells at mean (22 generations) and maximum (48 generations) RLS is 27.3% and 5.5% of
that observed in newborn cells, respectively (Fig. 3D, inset).
Together, our findings indicate that the machinery for mitochondrial inheritance has the
capacity to retain mitochondria with lower redox potential in mother cells. They also indicate that
retention of these lower functioning mitochondria in mother cells can be responsible for the
decline in mitochondrial redox potential that occurs as yeast cells age.
Deletion of MMR1 alters replicative lifespan and mother-daughter age asymmetry: If
mitochondrial quality control during inheritance affects cell fitness, then mutations that
compromise mitochondrial inheritance should affect lifespan. Many proteins are required for
normal mitochondrial inheritance in yeast. However, the vast majority of these proteins have
been implicated in other processes including actin dynamics and function, endocytosis, as well
as mitochondrial morphology, DNA maintenance, mRNA trafficking or protein assembly [221].
One exception is Mmr1p. Mmr1p is a member of the conserved family of DSL1 tethering
proteins. It localizes to mitochondria in the bud tip and is required for mitochondrial inheritance
to buds [144]. Indeed, mutation of Mmr1p together with Gem1p, a miro-like protein, results in

52
severe defects in mitochondrial inheritance and triggers a checkpoint that blocks cytokinesis
[218].
Deletion of SIR2 results in a decrease in mean RLS from 22 to 14 generations and
maximum RLS from 48 to 30 generations (n=76; p = 8.7 x 10⁻⁹ for mean RLS). Deletion of
MMR1 has a profound effect on RLS (Fig. 4A). mmr1∆ mutant clones give rise to two
subpopulations of cells (Fig. 4B); separating the subpopulations into two data sets suggests that
they are statistically different (p = 2.1 x 10⁻¹³). One subpopulation exhibits premature loss of
replicative capacity compared to wild-type cells (p = 1.0 x 10⁻³¹ for mean RLS). The majority of
these cells fail to produce offspring, and the few that do are replication-competent for a
maximum of 5 rounds of cell division (n=51). The other subpopulation exhibits a RLS that is
36% greater than that observed in wild-type cells (p = 0.004 for mean RLS), with a mean and
maximum RLS of 30 and 52 generations, respectively (n=51) (Fig. 4A). The observed alteration
in RLS in mmr1∆ mutants is not a consequence of genetic background, the method used for
generating synchronized cells before RLS measurement, or loss of metabolic activity (Fig. S2,
Table S1, Fig. S5). Thus, a mutation in MMR1 that inhibits accumulation of mitochondria in the
bud results in defects in lifespan determination and the production of cells with either shortened
or prolonged RLS.
Long- and short-lived mmr1∆ mutants also exhibit a phenotype associated with aging:
altered generation time. Early studies revealed that aging mother cells take increasingly longer
times to progress through the cell cycle compared to young cells [189, 191]. Under our growth
conditions, the mean generation time of wild-type cells is 90-110 min during generations 1-10,
and increases to 200 min during generations 21-30 (Fig. 4C). sir2∆ cells also exhibit an age-
associated increase in generation time. In contrast, the generation time of long-lived mmr1∆
cells is less than that of young wild-type cells. Moreover, it does not increase from generations
1-40, and exhibits a modest increase to 110 min only after 41-50 replications. This phenotype is
also not a consequence of genetic background or synchronization method (Fig. S2). Finally,

53
short-lived mmr1∆ cells exhibit a mean generation time that is 10-fold greater than that of wild-
type cells during the first 1-10 generations (Fig. S4). Thus, long-lived mmr1∆ cells exhibit a
delay in the increase in mean generation time as a function of age, a phenotype associated with
young cells, and short-lived mmr1∆ cells exhibit an increased mean generation time, a
phenotype associated with old cells.
Figure 4. Deletion of MMR1 affects mother-daughter age asymmetry. (A) Left panel: RLS of BY4741 (; n = 73), mmr1∆ ( ; n = 51) and sir2∆ (; n = 76) cells were measured as described in Materials and Methods, using pheromone treatment to distinguish virgin mother cells from their mothers. The data shown is pooled from 3 independent experiments. Right panel: RLS of wild-type cells () and the long-lived subpopulation of mmr1∆ ( ) cells. Short-lived mmr1∆ cells, which have a RLS < 5 generations, were removed on the basis of their lifespan distribution histogram (Fig. 4C). The remaining cells were corroborated to be long-lived by their clustering in a plot of RLS versus mean generation time from 0-10 generations (Fig. S3). B) Histogram of the RLS distribution of wild-type (black) and mmr1∆ (grey) cells. C) Mean generation time for wild-type (BY4741) (; n = 91), sir2∆ (; n = 55) and long-lived mmr1∆ cells ( ; n = 43) as a function of replicative age (generation). The data shown is pooled from 2 independent experiments. Generation time is the time from the last cell division to mother-bud separation, the latter of which was assessed by physically separating mothers from buds using a micromanipulator on a dissecting microscope. Generation time was averaged over 10 generations. Error bars: standard error of the mean. D) Percent of cells with RLS > 5 generations in mother cells (M) and their first (D1) and eight (D8) buds in wild-type and mmr1∆ cells. The data are pooled from 2 independent experiments, where n = 40 for each cell type studied in each experiment.

54
Next, we studied the effect of deletion of MMR1 on mother-daughter age asymmetry. A
widely used method to assess this process is to compare the mean RLS of daughter cells and
their mother cells [193, 222]. However, since mmr1∆ daughter cells have either long or short
RLS, the mean RLS does not provide information regarding short- or long-lived mmr1∆ cells.
Therefore, we assessed mother-daughter age asymmetry in mmr1∆ cells as the frequency of
producing short-lived daughter cells from the first (D1) and eighth (D8) daughter cells from virgin
mother cells (M) (Fig. 4D). Only 2-11% of wild-type D1 and D8 cells have RLS <5 generations
(n=75, 71 and 60, respectively). In contrast, there are significantly more short-lived cells in
mmr1∆ mother cells (24%, n = 77) and their D1 (50%, n = 66) and D8 (22%, n = 58) daughters
compared to wild-type cells. Moreover, the incidence of short-lived cells is higher in D1
daughters compared to their mothers and D8 daughters. This difference likely reflects the fact
that short-lived mmr1∆ cells do not produce D8 daughters and only produce short-lived
daughters (see below). Thus, deletion of MMR1 results in defects in mother-daughter age
asymmetry. In contrast to wild-type daughter cells, who are born with their full replicative
potential, the replicative potential of D1 daughter mmr1∆ cells is lower than that of their mothers.
mmr1∆ cells exhibit changes in mitochondrial quality control: To determine whether the
changes in lifespan and mother-daughter age asymmetry in mmr1∆ cells are linked to defects in
mitochondrial quality control during inheritance, we studied mitochondrial redox potential and
ROS in short- and long-lived mmr1∆ cells. As a first step, we found that unbudded cells in
mmr1∆ mid-log phase cultures exhibit characteristics of short-lived mmr1∆ cells (reproductive
incompetence and increased mean generation times) and budded mmr1∆ cells have mean
generation times consistent with long-lived mmr1∆ cells (Fig. 5A). Consistent with this, mmr1∆
cell cultures exhibit higher levels of unbudded cells (36%) compared to wild-type cell cultures
(18%) (Table S1). Cellular metabolic activity, as assessed using FUN-1, is similar in unbudded
55
and budded mmr1∆ and wild-type cells (Table S1). Thus, we identified methods to identify cell
fractions that are enriched in short- and long-lived mmr1∆ cells in mid-log phase yeast cultures.
The total cellular mitochondrial redox potential of unbudded and budded wild-type cells
are similar (Fig. 5B-C). In contrast, the mitochondrial redox potential of budded, largely long-
lived mmr1∆ cells is greater than that of unbudded, largely short-lived mmr1∆ cells. Moreover,
the mitochondrial redox potential of wild-type cells is greater than that of unbudded, largely
short-lived mid-log phase mmr1∆ cells. We obtained similar results upon analysis of
mitochondrial superoxide levels in WT and mmr1∆ cells (Fig. 5D-E). Superoxide levels of
budded, largely long-lived mmr1∆ cells are greater than those of wild-type cells and of
unbudded, largely short-lived mmr1∆ cells. Thus, mitochondrial fitness in mmr1∆ cells, as
assessed by redox potential and superoxide levels, correlates with cellular fitness and lifespan.

56
Figure 5. Mitochondrial fitness correlates with lifespan. A) Left panel: Percentage of unbudded wild type (black; n = 39) and mmr1∆ (grey; n = 40) cells that generate 5 or more offspring. Right panel: percentage of unbudded (U) and budded (B) wild-type (black; n = 157) and mmr1∆ (grey; n = 158) cells with a generation time < 120 min. B) Maximum projections of ratiometric images of R/O mito-roGFP1 in mid-log phase wild-type and mmr1∆ cells. Colors reflect the intensity of ratio of reduced-to-oxidized mito-roGFP1 (scale at lower left). Cell outlines are shown in white. Upper and lower panels: budded and unbudded cells, respectively. Images shown are representative from analysis of >400 cells. C) Quantitation of R/O mito-roGFP1 of mitochondria in unbudded (U) and budded (B) wild type (black; n = 243) and mmr1∆ (grey; n = 173) cells, measured as described in Fig. 2. Asterisks denote significant changes. Mitochondrial redox potential is higher in budded mmr1∆ cells compared to unbudded mmr1∆ cells and in budded wild type cells compared to unbudded mmr1∆ cells (**p = 0.0003, *p= 0.0113). D) Maximum projections of mito-GFP and DHE of budded (upper panels) and unbudded (lower panels) wild-type and mmr1∆ cells. Colors reflect the intensity of fluorescence (scale at lower right). Cell outlines are shown in white. Images shown are representative from analysis of >100 cells. E) Quantitation of DHE/mito-GFP of mitochondria in unbudded (U) and budded (B) wild-type (black, n=79) and mmr1∆ (grey, n=80) cells, measured as described in Fig. 2. Asterisks denote significant changes. Mitochondrial superoxide production is lower in budded compared to unbudded mmr1∆ cells, and lower in budded mmr1∆ cells compared to wild-type cells (**p = 0.007, *p= 8x10
-13).
Further characterization of mmr1∆ cells revealed a correlation between mitochondrial
superoxide levels and cell fitness in buds of long-lived mmr1∆ cells. First, we found that short-
lived mmr1∆ cells always give rise to short-lived cells (Fig. 6A). Conversely, although long-lived
mmr1∆ cells can give rise to short- and long-lived daughter cells, the majority of the daughter
cells produced from long-lived mmr1∆ cells are long-lived (Fig. 6A). These findings are

57
consistent with a non-genomic heritable cellular constituent(s) within mmr1∆ cells that affects
the RLS of their daughter cells.
In addition, we find that deletion of MMR1 results in defects in both the quantity and
quality control of mitochondrial inheritance. In contrast to wild-type cells, where daughter cells
inherit 40% of the total cellular mitochondria from mothers, daughter cells of largely long-lived
mmr1∆ cells inherit only 18% of the total cellular mitochondria (Fig. 6B). There is no significant
difference in redox potential among mother cells and buds in largely long-lived mmr1∆ cells
(data not shown). However, mitochondria that are inherited by daughters of largely long-lived
mmr1∆ cells have significantly lower superoxide levels compared to their mother cells and
compared to both mother cells and bud of wild type cells (Fig. 6C). These findings indicate that
one important non-genomic but heritable age determinant in mmr1∆ cells is mitochondria with
low superoxide levels.

58
Figure. 6. Daughter cell fitness and mitochondrial inheritance in mmr1∆ cells. A) The 1
st and 8
th daughter cells produced from the
same virgin mother cell were isolated, and the RLS of these cells and of the daughters produced from these cells was determined as for Fig. 4. Short-lived cells (SS) were identified as cells with RLSs < 5 generations, while long-lived cells (LL) were identified as cells with RLSs > 5 generations. The graph shows the percent SL or LL daughter cells produced from short- or long-lived D1 or D8 mother cells. Short-lived mmr1∆ cells give rise to only short-lived daughter cells while long-lived mmr1∆ cells give rise to short- or long-lived daughter cells. The data are pooled from 2 independent experiments, where n = 40 for each cell type studied in each experiment. B) Mitochondria were visualized using mitochondria-targeted GFP in wild-type cells (BY4741) and mmr1∆ cells, and the amount of GFP- label in mitochondria in mother cells and buds was measured in cells in which the bud is >60% of the size of the mother cell. The relative mitochondrial volume was determined by calculating integrated voxel intensity in thresholded, deconvolved wide-field z-series of mitochondria-targeted GFP. Deletion of MMR1 results in a decrease in the amount of mitochondria that are inherited by daughter cells (p = 1.3 x 10
-10). The data shown is
representative data from 3 experiments (n = 79). C) Quantitation of DHE/mito-GFP of mitochondria in the buds (B) and mother cells (M) of wild-type (WT) and long-lived mmr1∆ cells, measured as described in Fig. 1. While mitochondrial superoxide levels are lower in bud compared to mother cells in both cell types (*p = 0.02; **p = 4 x 10
-7), mitochondrial superoxide levels in the buds
of long-lived mmr1∆ cells is significantly lower than that observed in wild-type cells (***p = 0.001).
59
Discussion
Preferential retention of mitochondria with higher superoxide levels and lower redox
potential in mother cells as they age: Heterogeneity in mitochondrial ∆ has been detected in
yeast, cultured animal cells, neurons and pancreatic beta cells [193, 223, 224]. We obtained the
first evidence for heterogeneity in mitochondrial superoxide levels and redox potential within
individual yeast cells. Using DHE as a biosensor, we find that some mitochondria within yeast
contain low levels of superoxide, while others contain high levels of this ROS. Using mito-
roGFP1, we find that the mitochondrial matrix of budding yeast is a reducing environment.
Similar results were obtained using mito-roGFP1 in HeLa [219]. In addition, we detect
heterogeneity in mitochondrial redox potential within individual cells. Quantitative analysis of
DHE to mito-GFP ratios suggests that mitochondrial superoxide levels are not normally
distributed. Rather, we observed two general classes of mitochondrial superoxide levels.
Fluorescence recovery after photobleaching studies (FRAP) revealed that mitochondria
in HeLa cells are discontinuous, allowing them to have distinct functional properties [223]. Using
FLIP, we detect multiple, physically distinct mitochondria in budding yeast. Our studies also
reveal that mitochondria in the bud tip can be physically distinct from mitochondria in the mother
cell. This data provides a structural basis for the observed heterogeneity in mitochondrial
function. It is also direct evidence that mitochondria in budding yeast are not a continuous
reticulum. Recent studies indicate that mitochondria with extremely low ∆ exhibit defects in
mitochondrial fusion, which would allow this population of low-functioning mitochondria to
remain physically distinct from higher functioning mitochondria [59]. In light of the observed
heterogeneity in mitochondrial function, it is possible that there are mechanisms to ensure that
low-functioning mitochondria are separated from high-functioning mitochondria in yeast.
In addition, we find that mitochondria with lower redox potential and higher ROS are
preferentially retained in mother cells, and mitochondria with higher redox potential and lower
60
ROS are preferentially inherited by daughter cells. This segregation of higher- from lower-
functioning mitochondria during yeast cell division occurs at a constant rate as cells undergo
replicative aging from 0-5 generations. These findings are consistent with previous observations
that mitochondria with low ∆ and oxidatively damaged aconitase are preferentially retained in
mother cells [178, 193, 225]. Collectively, this data support the model that the machinery for
mitochondrial inheritance exercises mitochondrial quality control which results in segregation of
higher from lower functioning mitochondria among mother and daughter yeast cells.
Equally important, we developed a method to identify cells of known RLS in mid-log
phase cultures using fluorescent ConA to label the yeast cell wall, and find that mitochondrial
redox potential declines with replicative age and that this decline is evident even in young cells
from 0-5 generations of replicative age. This decline in mitochondrial function in relatively young
cells is consistent with the age-dependent increase in superoxide levels in young yeast cells
described recently [200]. Moreover, we obtained evidence that retention of mitochondria with
lower redox potential in mother cells can contribute to age-associated declines in mitochondrial
redox potential. Specifically, we developed a mathematical model for age-associated decline in
mitochondrial redox potential based on the observed decline in this process from 0-5
generations. Extrapolation of the model to old cells revealed a decline of mitochondrial redox
potential from maximum to minimum levels during a timeframe that is similar to the mean and
maximum RLS of the yeast strain used for these studies. Interestingly, this decline depends on
the initial redox state of mitochondria in a virgin mother cell. Together, these results are
consistent with a model that retention of lower functioning mitochondria in the mother cell results
in a mother cell-specific decline in mitochondrial function with age.
Although mitochondria that are in buds and therefore destined for inheritance by
daughter cells are higher-functioning compared to mitochondria in mother cells, mitochondria in
buds also exhibit a decline in redox potential with age. This raises an interesting question. How
are daughter cells born young if they inherit low-functioning mitochondria from their aging

61
mother cells? Recent studies, which indicate that repair mechanisms are preferentially activated
in daughter cells after they separate from mother cells, provide a possible explanation. Cytosolic
catalase of yeast, Ctt1p, has been implicated in detoxification of mitochondrial ROS and is
required for normal RLS [197, 226]. Erjavec and Nyström (2007) find that the Ctt1p activity
increases in daughter cells after they separate from mother cells. The superior ROS
management observed in newly formed daughter cells requires Sir2-dependent asymmetric
protein segregation during yeast cell division. Thus, mitochondria with high ROS and lower
redox potential that are inherited by daughters from aging mother cells may be repaired and
rejuvenated by Ctt1p that is activated after daughter cells separate from their mother cells.
Role for the mitochondrial inheritance machinery in mitochondrial quality control and
mother-daughter age asymmetry: Previous studies indicate that deletion of prohibitins,
mitochondrial inner membrane proteases that play a role in protein processing and
mitochondrial quality control, results in a decrease in yeast RLS and age-dependent
mitochondrial segregation defects [227, 228]. To further explore the role of mitochondrial quality
control in lifespan, we studied the effect of deletion of MMR1 on RLS and mitochondrial
function. Mmr1p localizes to mitochondria in the bud tip and is required for normal
mitochondrial inheritance [144] and for anchorage of newly inherited mitochondria in the bud tip
[13].
We find that deletion of MMR1 affects mitochondrial quality control and daughter cell
fitness and mother-daughter age asymmetry. In contrast to wild-type cells, where daughter cells
are born young, with their full replicative potential, mmr1∆ cells are either short-lived or long-
lived. The long-lived mmr1∆ cells exhibit phenotypes associated with longevity and fitness
(delay in the increase in mean generation time increase with age, reduced mitochondrial
superoxide levels and increased mitochondrial redox potential), while short-lived mmr1∆ cells
exhibit the opposite phenotypes. The slow growth of short-lived mmr1∆ is associated with

62
oxidative damage from elevated superoxide levels and low redox potential, and not likely due to
reduced mRNA translation observed in the slow-growing long-lived cells described by Delaney
et al. (2011). Furthermore, we observe a link between mitochondrial redox potential and
superoxide levels and cellular fitness: mmr1∆ cells with low redox potential and high superoxide
levels exhibit short RLS while mmr1∆ cells with higher redox potential and lower superoxide
levels exhibit long RLS. Finally, we find that all mmr1∆ daughter cells are not born young: the
replicative potential of a subset of daughter cells that develop from mother cells is lower than
that of their mothers.
Quantitative analysis of the heterogeneity of mitochondrial redox potential and
superoxide levels within individual yeast cells provides an explanation for the extraordinary
fitness and lack thereof of mitochondria in long- and short-lived mmr1∆ cells. In wild-type cells,
where 40-50% of total cellular mitochondria are inherited by daughter cells, daughter cells
inherit a combination of fit and less fit mitochondria, which are on average more fit than
mitochondria in mother cells. In contrast, mitochondrial inheritance and quality control are
compromised in mmr1∆ cells. Since daughter cells inherit only 18% of total cellular
mitochondria, they are more likely to inherit a disproportionate amount of a single functional
class of mitochondria (fit or less fit), which in turn affects cellular fitness and lifespan.
In the case of short-lived mmr1∆ cells, whose mitochondria have higher superoxide
levels compared to mitochondria in wild type cells, all daughter cells inherit less fit mitochondria.
As a result, they are less fit and have shortened RLS. In the case of long-lived mmr1∆ cells,
which are endowed with mitochondria with lower superoxide levels compared to those found in
wild-type cells, the probability of inheriting fitter mitochondria is greater. As a result, the majority
of the daughter cells derived from long-lived mmr1∆ cells are long-lived.
Overall, our studies indicate that the machinery for mitochondrial inheritance exercises
mitochondrial quality control and promotes inheritance of fitter mitochondria by daughter cells
and retention of less fit mitochondria in mother cells. They support the model that mitochondria

63
are aging determinants and that retention of mitochondria with higher ROS and lower redox
potential in mother cells contributes not just to mother-daughter age asymmetry but also to age-
associated declines in mitochondrial redox potential in yeast. Thus, we obtained evidence for a
novel mechanism for a decline in mitochondrial function with age. Ongoing studies are designed
to determine mechanisms underlying segregation of higher from lower functioning mitochondria
both within individual yeast cells and during yeast cell division.

64
Acknowledgements
We thank the members of the Pon laboratory and N. Erjavec for technical assistance and
valuable discussions, and L. Medina for expert statistical analysis. This work was supported by
grants from the National Institutes of Health (NIH) (GM45735 and GM45735S1) and the Ellison
Medical Foundation (AG-SS-2465-10) to LP and from the NIH (1 F31 AG034835) to JRMF. The
confocal microscope used for these studies was obtained using an NIH/NCRR shared
instrumentation grant (1S10RR025686) to LP, and supported in part through a NIH/NCI grant (5
P30 CA13696). GM45735S1, 1S10RR025686 and 1 F31 AG034835 were issued from the NIH
under the American Recovery and Reinvestment Act of 2009.

65
Author Contributions
The data in this chapter was contributed by McFaline‐Figueroa, JR”, Jason D Vevea, Theresa C. Swayne, Chun Zhou, Christopher Liu, Galen Leung, Istvan R. Boldogh, and Liza A. Pon as follows.
Figure 1 CZ, JRMF, and JDV
Figure 2 TCS and LAP
Figure 3 JDV and JRMF
Figure 4 JRMF
Figure 5 JDV and JRMF
Figure 6 JRMF
Table S1 JRMF
Figure S1 JDV and JRMF
Figure S2 JRMF
Figure S3 JRMF
Figure S4 JRMF
Figure S5 JRMF
Figure S6 JDV

66
Supplemental Data
Supplemental data includes one table and four figures.
WT mmr1∆
budding index 81 64 metabolic activity
unbudded cells 99 99 budded cells 100 99
Table S1
Figure S1. Measurement of cellular superoxide and redox state using DHE and mitoroGFP1. Superoxide levels were measured by staining mid-log phase wild-type yeast cells with DHE. Mitochondrial redox potential was measured in mid-log phase wild-type cells expressing mitochondria-targeted roGFP1 (mito-roGFP1). Growth and staining was carried out as for Fig. 1. To determine the dynamic range of DHE or mito-roGFP1, cells were treated with oxidizing and reducing agents for 30 min at 30°C. DHE-stained cells were treated with the superoxide scavenger tempol (50 -M, Sigma-Aldrich, St. Louis, MO), while mito-roGFP1 expressing cells were treated with DTT (10 mM). H2O2 (10 mM; Fisher Scientific, Pittsburgh, PA) was used as the oxidizing agent for both DHE-stained and mito-roGFP1 expressing cells. Mitochondria in the bud have a small, but detectable decrease in mitochondrial superoxide and increase in mitochondrial redox potential compared to mitochondria in the mother cell. DHE staining decreases upon treatment with tempol and increases upon treatment with H2O2. However, with H2O2 treatment, DHE staining localizes to nuclei and not mitochondria. This finding is consistent with published reports that DHE that is oxidized in the cytosol enters the nucleus and intercalates into DNA (Gu et al. 2006). Treatment of cells expressing mito-roGFP1 with DTT or H2O2 results in a readily detectable increase and decrease in the ratio of reduced to oxidized mito-roGFP1.

67
Figure S2. The RLS and MGT phenotypes observed in mmr1Δ cells are not a consequence of genetic background or synchronization. A) The yeast deletion collection was generated by sporulationdriven production of haploid cells from heterozygous diploid cells containing a deletion in one copy of the gene of interest. As a result, the wild-type strain provided with the deletion library (BY4741) may have subtle differences in genetic background compared to deletion strains. To confirm that the changes in RLS in mmr1Δ cells is not due to variations in genetic background, we deleted MMR1 in BY4741 cells (RMY003). Unbudded cells used for these measurements were obtained from midlog phase cells without alpha-factor synchronization. RLS measurement of wild-type cells (black), mmr1Δ (dark grey squares) and long-lived mmr1Δ cells (dark grey triangles). B) Mean generation time of wild-type cells (black), and mmr1Δ cells (dark grey) derived by deletion of MMR1 in a BY4741 strain (RMY003). Error bars denote standard error of the mean. We observe defects in lifespan control, mother-daughter age asymmetry and mean generation time in BY4741 cells bearing a deletion in MMR1.

68
Figure S3. Short-lived and long-lived mmr1Δ cells cluster in different sections of a plot of RLS versus mean generation time during the first ten generations. Mean generation time as a function of RLS in wild-type cells (black squares), mmr1Δ cells (dark grey squares) and sir2Δ cells (black crosses). (A) mmr1Δ cells from the MATa deletion set and (B) BY4741 cells bearing a deletion in MMR1 (RMY003). Wild-type and sir2Δ cells and mmr1Δ that have short RLS cells cluster in an area below generation times of 120 min. In contrast, mmr1Δ cells that have short RLS display generation times above 120 min or fail to divide (~50% of mmr1Δ cells vs. less than 5% of wild-type cells).
Figure S4. Short-lived mmr1Δ cells display increased generation times compared to wild-type cells and their long-lived counterparts during the first ten generations. Mean generation time in wild-type cells, long-lived and short-lived mmr1Δ cells. Error bars: standard error of the mean.

69
Figure S5. mmr1Δ cells in the W303 genetic background also give rise to short- and long-lived cells. To confirm that the changes in RLS in mmr1Δ cells are not due to variations in genetic background, we deleted MMR1 in the W303 genetic background and measured RLS for wild-type and mmr1Δ cells, as described above. A) Replicative lifespan curve for mmr1Δ cells (grey) and wild-type cells (black). n=60. B) Cells were categorized as either being short-lived or long-lived mmr1Δ cells according to their RLS. Grey: cells with RLS <5 generations. White: cells with RLS > 5 generations.
Figure S6. Identification of aged cells in culture. Cells were pulse-labeled with ConA-594 and propagated as for Fig. 3. To determine the mean RLS of ConA-labeled cells expressing mito-roGFP1 after 4, 6 or 8 hours of growth in liquid media, cells were stained with 25,M Calcofluor White M2R (Invitrogen; Eugene, OR) for 10 min at RT, and the number of Calcofluor-labeled bud scars
was determined as s function of time of growth.

70
Chapter III
Identification of novel proteins and cellular processes that affect mitochondrial
inheritance in Saccharomyces cerevisiae

71
Abstract
Mitochondria are essential eukaryotic organelles and contribute to cell viability. Moreover, in
polarized eukaryotic cells, proper mitochondrial cellular distribution contributes to cellular
function and viability. In the budding yeast, S. cerevisiae, mitochondria accumulate in the
developing bud during the cell cycle. Mitochondria also accumulate at specific sites within
polarized metazoan cells including neuronal, immune, and basal kidney epithelial cells. To
further understand mitochondrial distribution in polarized eukaryotic cells, we studied genes that
have positive or negative genetic interactions with a gene that encodes a protein (Mmr1p) that
mediates anchorage and accumulation of mitochondria in the yeast bud tip. This study
uncovered a novel mitochondrial retention factor termed Mfb1p, and a role for
phosphatidylcholine biosynthesis in mitochondrial distribution. Study of this factor and process
in yeast will yield insight into normal mitochondrial behavior and dysfunction in metazoan cells.

72
Introduction
Mitochondria are essential eukaryotic organelles and contribute to cellular function in a
variety of ways. Mitochondria not only provide ATP through oxidative phosphorylation, but are
important regulators of intracellular calcium, phospholipid biosynthesis, production of a variety of
metabolites, and control of apoptotic cell death [229]. Moreover, many of these mitochondrial
functions are regulated through contacts with other organelles and their effectiveness is
dependent upon the cellular distribution of this organelle. This is particularly pertinent for the
normal functioning of polarized eukaryotes. In hyperpolarized neuronal cells, mitochondria must
traffic long distances to and be immobilized at synapses, which are sites of high ATP utilization
and calcium regulation [230]. Loss of mitochondria at these sites leads to defective synaptic
transmission and synaptic plasticity [17]. In immune T-cells, mitochondria accumulate at the site
of contact between and antigen presenting cell (APC) and T-cell, the immunological synapse,
where they are required for T-cell activation [231]. Even in small cuboidal epithelial cells of the
proximal convoluted tubules of the kidney, mitochondria accumulate at the basolateral
membrane in close proximity to ATPases [232].
In the budding yeast, S. cerevisiae, mitochondria accumulate in the developing bud
during the cell cycle. Previous studies revealed that mitochondria are anchored to cER in the
yeast bud tip and role for Mmr1p, a member of the DSL family of tethering proteins, in that
process. Deletion of MMR1 results in loss of anchorage of mitochondria in the bud tip, while
overexpression of MMR1 results in increased accumulation of mitochondria in the bud tip.
Since Mmr1p has the capacity to bind to mitochondria and ER, and MMR1 protein and mRNA
localize to the yeast bud tip, it is likely that Mmr1p has a direct role in bud tip anchorage of
mitochondria [13].
To further understand polarized mitochondrial distribution in eukaryotic cells, we carried
out a survey of large scale screens in yeast to identify genes that have positive or negative

73
genetic interactions with Mmr1p. This study uncovered a novel mitochondrial retention factor
termed Mfb1p, and a role for phosphatidylcholine biosynthesis in mitochondrial distribution.
Study of this factor and process in yeast will yield insight into normal mitochondrial behavior and
dysfunction in metazoan cells.

74
Materials and Methods
Yeast strains and growth conditions: All S. cerevisiae strains used in this study are
derivatives of the wild type BY4741 strain (MATa his3∆1 leu2∆0 met15∆0 ura3∆0). The WT
strain, JVY063 (MATa CIT1-yEpolylinker-mCherry::hphMX4 PHO88-GFP(S65T)::KanMX), for
labeling mitochondria and ER, strains were transformed with a CIT1-mCherry and PHO88-GFP
tagging construct resulting in (CIT1-yEpolylinker-mCherry::hphMX4 PHO88-
GFP(S65T)::KanMX). The mfb1∆ strain, JVY056 (MATa mfb1∆::LEU2 CIT1-yEpolylinker-
mCherry::hphMX4 PHO88-GFP(S65T)::KanMX), and the cho2∆ strain, JVY064 (MATa
cho2∆::LEU2 CIT1-yEpolylinker-mCherry::hphMX4 PHO88-GFP(S65T)::KanMX) have the
MFB1 or CHO2 genes replaced by LEU2 cassettes, respectively. The mfb1∆ mmr1∆ strain,
JVY057 (MATa mfb1∆::leu2 mmr1∆::URA3 CIT1-yEpolylinker-mCherry::hphMX4 PHO88-
GFP(S65T)::KanMX). The primers were modified to use the pOM tagging series as a deletion
set, allowing the use of cre/lox for removal of auxotrophic markers after genes of interest were
deleted [233]. GFP and mCherry fusions were constructed using modules from the pFA6a
series [234] and pCY series [235], respectively. Strains were selected using dropout media or
addition of antibiotics (200 µg/ml G418, 300 µg/ml Hygromycin B), as needed. All strains were
grown on synthetic complete media (SC) media unless otherwise noted.
Fluorescent images were acquired on either an Axioskop 2 microscope with 100x/1.4 Plan-
Apochromat objective (Zeiss, Thornwood, NY) and an Orca-ER cooled CCD camera
(Hamamatsu) running NIS Elements 4.20 Lambda (Nikon, Melville, NY), AxioObserver.Z1
microscope equipped with a Colibri LED excitation source with an Orca ER camera running
Axiovision acquisition software (Zeiss, Thornwood, NY). channels were acquired using
(482/28ex and 525/36em) for GFP, (572/35ex and 632/60em) for mCherry, (350/15ex and
460/50em). Unless otherwise noted, Z-stacks were acquired using 0.5 micron Z spacing and a
total of 13 slices (6 microns). Samples were grown to mid-log phase and concentrated in a
75
tabletop centrifuge, and 2 µL were placed on glass slides and covered with a #1.5 coverslip. All
images and image series were imported into Volocity libraries (Perkin Elmer, Waltham, MA) for
deconvolution and quantitation.
Organelle Aggregation: During normal cell cycles, mitochondria and ER do not aggregate in
cytosolic clusters. The time that organelle aggregation occurred after removal of choline from
the media in WT and cho2∆ strains was determined by visual inspection of cells expressing
organelle targeted fluorescent proteins and time-lapse imaging.
Organelle Distribution: Distribution of mitochondria and ER was analyzed as sum
fluorescence in the mother or bud relative to total organelle fluorescence of the budding pair.
Deconvolved, fluorescent channels were thresholded and analyzed for integrated intensity in
ROIs outlining the mother, bud, or budding pair. All measurements and calculations were
imported and performed in Microsoft Excel (Seattle, WA).
Statistical methods and data representation: All data were evaluated for normal distribution
using the Anderson Darling test for normality. Based upon this, P-values were determined
using the Kruskal-Wallace test with pairwise comparisons and Bonferroni correction or with a
two-tailed Student’s t-test assuming unequal variance. The Analyze-it (Leeds, UK) plugin for
Microsoft Excel (Seattle, WA) was used for all statistical calculations and graph creation.
Graphs are bar graphs representing the mean and SEM (standard error of the mean).
Other methods:Yeast cells were transformed using the lithium acetate method [234]. All
chemicals and materials were obtained from Sigma-Aldrich (St. Louis, MO) unless otherwise
noted.

76
Results and Discussion
Synthetic genetic arrays (SGA) predict relationships between genes
Synthetic genetic array (SGA) technology allows synthetic genetic interactions to be
monitored on a limitless scale. Combined with the relative ease of S. cerevisiae genetics, SGA
technology promises to uncover genome wide genetic interactions of this model eukaryote. A
genetic interaction arises when the combination of two mutants produces a striking or
exaggerated phenotype based on what is known about either single mutant. The simplest and
fastest phenotype to measure is cellular growth rate. Genetic interactions can be positive,
negative, or lethal, corresponding to enhanced growth rate, decreased growth rate, and lethality
respectively.
Recently, we identified a protein that is solely responsible for mitochondrial anchorage in
the bud tip of yeast [13]. This protein, Mmr1p, when absent, leads to a complex aging
phenotype, but an overall decrease in population fitness [236]. Using published SGA data
covering approximately 30% of the yeast genome [237]; we examined the list of genetic
interactions arising from combination with MMR1 mutants. Mmr1p mediates mitochondrial bud
tip anchorage and does not affect mitochondrial trafficking into the bud or mitochondrial
anchorage in the mother cell. Because of this, we predict genetic interactions with MMR1 would
arise from genes involved with mitochondrial trafficking or anchorage in the mother cell (Fig.
1a). A gene that inhibits mitochondria from trafficking into the bud cell would represent a
negative genetic interaction with MMR1. In an mmr1∆ strain, mitochondria fail to anchor and
accumulate at the bud tip and instead over-accumulate at the normal anchorage site in the
mother tip, distal the bud. Therefore, a mutation in a gene that affects mitochondrial anchorage
in the mother tip may allow more mitochondria to traffic to the bud and rescue the growth
phenotype of mmr1∆ strains, representing a positive genetic interaction. We studied the

77
morphology and distribution of mitochondria and ER in cells lacking these positive and negative
genetic interactors.
Genetic interactions between phospholipid biosynthesis genes and MMR1
Genes involved with the production of PE and PC, (PSD1, CHO2, and OPI3) have
strong negative genetic interactions with MMR1. PSD1 is a phosphotidylserine (PS)
decarboxylase that localizes to the mitochondrial inner membrane and catalyzes the conversion
of PS to phosphatidylethanolamine. It also regulates mitochondrial fusion and morphology
through effects on the phospholipid composition of mitochondrial membranes and the ratio of
long and short forms of the mitochondrial fusion protein Mgm1p [137]. This suggests that
mitochondrial fusion is important for mitochondrial inheritance, and possibly for mitochondrial
accumulation at the bud tip anchorage site.
Cho2p (Pem1p), is a phosphatidylethanolamine methyltransferase (PEMT) which
catalyzes the first methylation of phosphatidylethanolamine (PE) during the biosynthesis of
phosphatidylcholine (PC). A second PEMT enzyme (Opi3p/Pem2p) catalyzes the second and
third methylation reactions, producing PC. Both genes had strong negative genetic interactions
with MMR1, which suggests a role for PC biosynthesis in inheritance of mitochondria. We
examined mitochondrial distribution in cho2∆ mutants and found mitochondria as large
aggregates that were confined to the mother cell (Fig. 1b (right); Chapter IV). Because of this
striking phenotype and so far unknown role of PC biosynthesis in mitochondrial inheritance and
morphology, we investigated the role of PC biosynthesis in mitochondrial inheritance and
morphology and will discuss these findings in detail in Chapter IV.

78
Figure 1. Disruption of genes that genetically interact with MMR1 result in an altered mitochondrial network (a) Model of budding yeast depicting mitochondrial inheritance and distribution (purple tubules) in wild type and theoretical positive and negative genetic interactions. (b) Live cell fluorescent data showing mitochondrial distribution of different mutants. Mitochondria in red (Cit1p-mCherry). Mitochondria in wild type cells exist as tubules aligned along the mother-bud axis and which accumulate at sites of polarity (the mother tip and bud tip) during development (Left). Mitochondrial distribution of mfb1∆ (Middle), and cho2∆ (Right) mutants. Images shown are maximum projections of 3-D Z-stacks. Cell outlines are shown in white. Bar: 5 µm.
MFB1 gene has a strong genetic interaction with MMR1
Deletion of the gene encoding Mfb1p results in a positive genetic interaction with
mmr1∆. Mfb1p is one of two, mitochondrially associated F-box proteins and thought to play a
role in mitochondrial network connectivity [238] [239]. The exact role of Mfb1p plays in
maintaining the mitochondrial network has been elusive. We found that mfb1∆ cells have a
marked decrease of mitochondrial mass in the mother tip (Fig. 1b (middle)), which raises the
possibility that Mfb1p mediates anchorage and accumulation of mitochondria in the mother tip
of budding yeast.

79
Figure 2. Mfb1p mediates mitochondrial anchorage in the mother tip (a) Mfb1p-GFP localizes to mother tip mitochondria. Graph examining the asymmetry of Mfb1p-GFP relative to Cit1p-mCherry. Ratios of Mfb1p-GFP to Cit1p-mCherry were calculated and compared between mother and bud. Representative image of live cell fluorescence showing Mfb1-GFP and Cit1p-mCherry. Image shown is maximum projections of 3-D Z-stacks. Bar: 5 µm. (b-c) Strains lacking both anchorage proteins exhibit normal mitochondrial distribution (b) Live cell fluorescence of mitochondria (Cit1p-mCherry)

80
distribution in wild type (Left), mfb1∆ (middle), and mfb1∆ mmr1∆ (Right). Images shown are maximum projections of 3-D Z-stacks. Cell outlines are shown in white. Bar: 5 µm (c) Quantitation of mitochondrial distribution of cells in (b). Wild type in blue, mfb1∆ in red, and mfb1∆ mmr1∆ in green.
We find that Mfb1p localizes to mother mitochondria in the mother tip (Fig. 2a), and there
is decreased accumulation of mitochondria in the mother tip in mfb1∆ cells (Fig. 2b-c). These
data support a role for Mfb1p in mitochondrial anchorage in the mother tip. We sought to
confirm the genetic interaction with MMR1, by examining mitochondrial distribution in the
mmr1∆ mfb1∆ double mutant. In contrast to mmr1∆ cells which have a lack of mitochondria in
the bud tip and an overabundance of mitochondria in the mother tip [13], and mfb1∆ single
mutants that lack mitochondria in the mother tip, mmr1∆ mfb1∆ double mutants have an even
distribution of mitochondria through the mother-bud pair (Fig. 3b-c). The distribution of
mitochondria in the double mutant is consistent with the published positive genetic interaction.
Future studies of mitochondrial redox, lifespan of mfb1∆, and mfb1∆ mmr1∆ double mutants will
provide further insight into how mitochondria are regulated and their effect on lifespan. It may
be possible, in using mfb1∆ and mmr1∆, to discern different effects on lifespan regarding
quantity versus quality. Current research in the lab is aimed at this topic.
Other MMR1-Interacting Genes
Other positive genetic interactions included genes encoding Num1p, another mother
mitochondrial specific anchor, and Dnm1p, a protein responsible for mitochondrial fission.
Interestingly, mutations in DNM1 cause an interconnected network mitochondrial network and a
reducing mitochondrial environment [159]. Mutations in DNM1 may positively affect
mitochondrial redox and prevent the increased amount of relatively oxidized mitochondria
observed in MMR1 mutants [236]. Furthermore, numerous negative genetic interactions were
documented, including those involved with the actin cytoskeleton and establishing polarity, and
those involved with mitochondrial morphology and motility MDM10 and GEM1.

81
Acknowledgements
We thank the members of the Pon laboratory for technical assistance and valuable discussions.
This work was supported by grants from the National Institutes of Health (NIH) (GM45735 and
GM45735S1) and the Ellison Medical Foundation (AG-SS-2465-10) to LP.

82
Author Contributions
The data in this chapter was contributed by Vevea, Jason D, and Pon, Liza A as follows.
Figure 1 JDV
Figure 2 JDV

83
Chapter IV
Glycerophospholipid imbalance affects mitochondria and ER homeostasis while lipid
droplet biogenesis and microlipophagy promote cellular adaptation to this lipid
imbalance in yeast

84
Abstract
The immediate response to inhibited PC biosynthesis in yeast is altered phospholipid levels,
reduced cell growth, and defects in the morphology and localization of ER and mitochondria.
With chronic lipid imbalance, yeast adapt. Lipid droplet (LD) biogenesis and conversion of
phospholipids to triacylglyerol are required for reducing some phospholipids toward wild-type
levels. We confirmed that the Unfolded Protein Response is activated by this lipid stress and
found that Hsp104p is recruited to ER aggregates. We also found that LDs form at ER
aggregates, contain polyubiquitinated proteins and an ER chaperone (Kar2p), and are degraded
in the vacuole by a process that resembles microautophagy. This process, microlipophagy, is
required for restoration of organelle morphology and distribution during adaptation to lipid
stress. Microlipophagy does not require ATG7. It requires ESCRT components and a newly
identified protein that localizes to nER, is up-regulated by lipid imbalance and is a class E VPS
protein.
85
Introduction
Defects in the biosynthesis of complex phospholipids is linked to 14 disorders which
affect the central and peripheral nervous systems, as well as cardiac and skeletal muscle [240].
Recently, a megaconial muscular dystrophy was identified that is due to mutation of the beta
isoform of choline kinase, the enzyme that catalyzes the first step in phosphatidylcholine (PC)
biosynthesis [241]. Patients with this disease exhibit muscle wasting and weakness from early
infancy, ambulatory delays, cognitive disabilities and cardiomyopathy. The mechanisms
underlying defects in skeletal, cardiac and neurological systems in this disease are not
understood. We used the budding yeast, Saccharomyces cerevisiae, to study the cellular
response to defects in the synthesis of PC.
PC biosynthesis occurs via two conserved pathways. One pathway, the
phosphatidylethanolamine N-methyltransferase (PEMT) pathway, occurs at sites of close
contact between mitochondria and ER [130, 131]. In this pathway, phosphatidylserine (PS) is
created from CDP-diacylglycerol and L-serine in the ER [132] and transported to mitochondria,
where it is decarboxylated to form phosphatidylethanolamine (PE) [133]. PE is then transported
back to the ER and methylated three times, converting it to PC [134]. When choline is available,
PC is synthesized through the Kennedy pathway. In this pathway, phosphocholine is added to
diacylglycerol in a cytidylyltransferase-catalyzed reaction [135].
Previous studies support a link between PC biosynthesis and ER and mitochondria. For
example, one of the hallmarks of megaconical muscular dystrophy is a defect in mitochondrial
morphology and distribution in skeletal muscle fibers [241]. Perturbation of PC biosynthesis
results in defects in ER morphology in CHO cells [242]. PC biosynthetic and lipid saturation
defects also result in up-regulation of the unfolded protein response (UPR) in yeast, a pathway
that is activated by accumulation of unfolded proteins in the ER lumen, and promotes cell
survival by inhibiting protein synthesis and promoting refolding or degradation of misfolded

86
proteins [88, 89]. Interestingly, the UPR regulator that localizes to the ER, Ire1p, responds to
lipid membrane composition through direct interactions with its transmembrane domain [90].
Finally, there are negative genetic interactions between the PC biosynthetic genes (CHO2 and
OPI3) and genes involved in mitochondrial inheritance (MMR1, NUM1) or ER protein folding
and stress response (EMC complex, GET complex, ERAD proteins and HAC1) in yeast [6, 88,
237].
Here, we describe profound defects in yeast growth and organelle organization in
response to acute lipid imbalance resulting from defects in PC biosynthesis. We obtained
evidence that yeast adapt to lipid imbalance, and a role for lipid droplets (LDs) in that process.
LDs consist of a neutral lipid core surrounded by a protein-containing phospholipid monolayer
and are produced at ER membranes [243]. We find that LD biogenesis and selective autophagy
contribute to the adaptive response by removing excess lipids and damaged proteins from the
ER. We also identified a role for a previously uncharacterized open reading frame in regulating
LD autophagy.

87
Materials and Methods
Yeast strains and growth conditions
All S. cerevisiae strains used in this study are derivatives of the wild-type BY4741 strain (MATa
his3Δ1 leu2Δ0 met15Δ0 ura3Δ0) and described in Supplemental Table 3. All gene knockouts
were created using primers described in Supplemental Table 1. The primers were modified to
use the pOM tagging series as a deletion set, allowing the use of cre/lox for removal of
auxotrophic markers after genes of interest were deleted [233]. GFP and mCherry fusions were
constructed using modules from the pFA6a series [234] and pCY series [235], respectively.
Strains were selected using dropout media or addition of antibiotics (200 µg/ml G418, 300 µg/ml
Hygromycin B), as needed. All strains were grown on synthetic complete (SC) media unless
otherwise noted. Choline was added to SC media at a final concentration of 1mM to suppress
lipid imbalance in WT and cho2∆ strains. For galactose induction, synthetic complete media
was used with galactose 2% replacing glucose. Over expression constructs were created from
p413GAL1 [244]. For induction of UPR, strains were grown in synthetic complete media, diluted
to 0.1-0.2 OD600 and incubated for 3 to 4 hrs with DMSO (control), tunicamycin (TM) (2 µg/ml) or
dithiolthreitol (DTT) (2 mM) treatment. For induction of macroautophagy, strains were grown in
synthetic complete media, diluted to 0.5 OD600 and incubated for 4 hrs, 1, 3, or 5 days in
synthetic complete media lacking a nitrogen source.
Growth rates
Growth curves were measured using an automated plate reader (Tecan; Infinite M200,
Research Triangle Park, NC). Each strain was grown to mid-log phase in SC with 1 mM choline
and diluted to an OD600 of 0.07 (2.0 x 10⁶ cells/ml). 10 µl of each of the diluted strains was
added wells containing 200 µl SC in a 96-well plate. Cells were propagated at 30 °C, and optical
density measurements (OD600) were made every 20 min for 72 hrs. Each strain was plated in
quintuplicate and the growth curves averaged or maximum growth rate (slope) calculated using
88
the greatest change in OD600 over a 240 min interval in 72 hrs. Growth rates were estimated
using linear regression.
Vacuole Staining
Mid-log phase growing yeast were resuspended in YPD and stained with 4 µM FM 4-64 ( (N-(3-
Triethylammoniumpropyl)-4-(6-(4-(Diethylamino) Phenyl) Hexatrienyl) Pyridinium Dibromide))
(Life Technologies, Carlsbad, CA; T-3166), shaking for 30 minutes at 30OC, washed once and
grown for an additional 45 minutes, shaking at 30OC. Cells were then concentrated for
immediate imaging. Mid-log phase growing yeast were stained with 10 µM CMAC ((7-amino-4-
chloromethylcoumarin) (Life Technologies, Carlsbad, CA; C2110) shaking for 30 minutes at
30OC, washed once, and immediately imaged.
Lipid Droplet Staining
Mid-log phase growing yeast were stained with 50 µM monodansylpentane (MDH) (Abgent
Biotech, San Diego, CA) for 15 min at RT in SC media. Cells were then concentrated for
immediate imaging. Mid-log phase growing yeast were stained with 0.5 µg/mL Nile Red for 15
min at RT in SC media. Cells were washed 3 times and concentrated immediately before
imaging.
Western Blots
Western blot analysis was performed using standard procedures on PVDF (Immobilon-FL; EMD
Millipore, Billerica MA). Briefly, total protein was collected from 0.5 OD600 of relevant cultures in
150 µL lysis buffer containing 50 mM imidazole pH 7.4, 10 mM EDTA, 1% triton X-100, 2 mM
PMSF, and protease inhibitor cocktails (pepstatin A, chymostatin, antipain, leupeptin, aprotinin,
benzamidine, and phenanthroline). Samples were vortexed with 100 µL of glass beads for 5
min. Samples were then incubated at 100°C for 5 min with the addition of 50 µL SSB (SDS
Sample Buffer). For protein detection, 40 µL of protein lysate was loaded onto a 10% SDS-
PAGE gel. Before the transfer of proteins, the gel was incubated with (4.5:4.5:1) mix of

89
water:methanol:trichloroethanol) (TCE) for 5 min. After SDS PAGE, the TCE was activated to
crosslink to proteins in the gel by exposure to UV light (300 nm) for 2.5 min. Cross-linked
proteins were detected by 2.0 sec exposure to 300 nm illumination, and used as a protein load
control [245]. The gel was then transferred to a PVDF membrane. After transfer, the PVDF
membrane was rinsed and dried for 1 hr prior blocking, and incubation with primary and
secondary antibodies. Primary antibodies used include mouse monoclonal anti-GFP (Roche,
Indianapolis, IN; #11 814 460 001), mouse monoclonal anti-mCherry (Abcam, Cambridge, MA;
#ab125096), anti-Ubiquitin (EMD Millipore, Billerica, MA; #mab1510) and rat monoclonal anti-
tubulin YOL 1/34 (Abcam, Cambridge, MA; #ab6161). Western blots were imaged using
Luminata Forte Western HRP substrate (EMD Millipore, Billerica, MA) and the BIORAD
Chemidoc MP imaging system (BIORAD, Hercules, CA)
Electron Microscopy
Electron Microscopy was used to visualize the ultra structure of cells. We used a glutaraldehyde
fixation with osmium-thiocarbohydrazide-osmium staining procedure as described
previously[246]. Briefly, 50 OD600 were collected for analysis, all strains were grown to
approximately 0.5 OD600 in SC media, WT, WT +2 mM DTT, cho2∆+C, cho2∆-C1, and cho2∆-C7 at
30 OC with 225 rpm shaking. Cultures were collected, resuspended in fixation buffer (3%
glutaraldehyde, 0.1 M Na-Cacodylate pH 7.4, 5 mM CaCl2, 5 mM MgCl2, 2.5% sucrose) and
fixed for 1 hour at 25 OC with gentle agitation. Cells were washed with 100 mM Cacodylate pH
7.4, then buffer TDES. Cells were resuspended in TDES and incubated at RT for 10 min,
washed with 1 ml 0.1 M phosphocitrate/1 M sorbitol and incubated with zymolyase solution (0.5
ml phosphocitrate/sorbitol, 50 µl B-glucuronidase, 25 µl of 10 mg/ml zymolyase. Cultures were
incubated in this solution for 30 min at 30OC with gentle agitation. Cultures were then washed
with 0.1 M cacodylate/5 mM CaCl2/1 M sorbitol and embedded in 2% low temperature agarose.
Blocks were then post fixed with 1%OsO4/1% K ferrocyanide in 0.1M cacodylate/5mM CaCl2,
pH 6.8 and incubated at RT for 30 min. Blocks were washed 4x in ddH2O and transferred to 1%

90
thiocarbohydrazide at RT for 5 min, then washed 4x with ddH2O. Blocks were then stained with
Kellenberger’s Uranyl Acetate overnight. Cultures were dehydrated through a graded series of
ethanol (50% to 100% on ice), and transferred to 1:1 ethanol/propylene oxide for 10 min, and
100% propylene oxide 2 x 5 min. Blocks were then transferred to 1:1 propylene oxide/Spurr
resin for overnight incubation under vacuum. Blocks were then transferred to fresh Spurr resin
for 4-6 hours before being transferred to beem capsules and polymerize in fresh Spurr resin
overnight, section, and post stained with lead and uranyl acetate.
RNA Sequencing
RNA was extracted from mid-log phase yeast cells using the RNeasy kit (Qiagen, Germantown,
MD). RNA was analyzed for degradation and RNA Integrity Number scores were satisfactory
(RIN>9). RNA-seq was performed on an Illumina HiSeq2000 generating 200m 100 bp Single
End reads per lane, with 10 samples multiplexed per lane (average 20m raw reads per sample)
by the Columbia Genome Center. Data was analyzed using Tophat and Cufflinks protocol as
described [247]. Differentially expressed genes were then analyzed using DAVID functional
annotation tool [248] to group the large sets of up-regulated and down-regulated genes into
gene ontology (GO) terms, and REVIGO [249] to remove redundant GO terms and group-
related GO terms in semantic similarity-based scatterplots.
Lipidomics
Yeast lipid extracts were prepared using a modified Bligh/Dyer procedure (Bligh and Dyer
1959), spiked with appropriate internal standards, and analyzed using a 6490 Triple Quadrupole
LC/MS system (Agilent Technologies, Santa Clara, CA). Glycerophospholipids and
sphingolipids were separated with normal-phase HPLC as described before (Chan et al, 2012),
with a few changes. An Agilent Zorbax Rx-Sil column (inner diameter 2.1 x 100 mm) was used
under the following conditions: mobile phase A (chloroform:methanol:1 M ammonium hydroxide,
89.9:10:0.1, v/v) and mobile phase B (chloroform:methanol:water:ammonium hydroxide,
55:39.9:5:0.1, v/v); 95% A for 2 min, linear gradient to 30% A over 18 min and held for 3 min,

91
and linear gradient to 95% A over 2 min and held for 6 min. Sterols and glycerolipids were
separated with reverse-phase HPLC using an isocratic mobile phase as before (Chan et al,
2012) except with an Agilent Zorbax Eclipse XDB-C18 column (4.6 x 100 mm).
Quantification of lipid species was accomplished using multiple reaction monitoring
(MRM) transitions (Chan et al, 2012; Guan et al 2010) in conjunction with referencing of
appropriate internal standards: PA 17:0/14:1, PC 17:0/20:4, PE 17:0/14:1, PG 17:0/20:4, PI
17:0/20:4, PS 17:0/14:1, LPC 17:0, LPE 14:0, Cer d18:0/17:0, D7-cholesterol, cholesteryl ester
(CE) 17:0, 4ME 16:0 diether DG, and D5-TG 16:0/18:0/16:0 (Avanti Polar Lipids, Alabaster, AL).
Lipid droplet isolation
Lipid droplets were isolated according to the procedure developed by G. Daum (Leber and
Daum et al 1994). Briefly, 2 liters of cultures were grown over night to 0.5 OD/mL. Cells were
collected, washed with water, and incubated in softening buffer (SP-A) for 10 minutes at 30OC.
Cells were then resuspended in spheroplasting buffer (SP-B+zymolyase) and incubated for 1
hour at 30OC. Pellets were washed in SP-B twice and resuspended in douncing buffer (LP-A).
Pellets were dounced with a loose fitting pestle for 3 minutes. Cell debris was removed and
pellet was redounced. Dounced fractions were collected and overlayed with equal volume LP-A
before ultra centrifugation (100,000g for 1 hour) on a table top ultracentrifuge. The top crude
lipid droplet layer was collected and rehomogenized. This new sample was loaded and overlaid
with buffer LP-B for another round of ultra centrifugation. Sample was collected, dounced, and
loaded into the bottom of an ultra centrifuge tube using a needle. The last ultra centrifugation
step (100,000g for 1 hour) results in a highly pure top layer of lipid particles/droplets.
Fluorescence microscopy
Fluorescent images were acquired on either an Axioskop 2 microscope with 100x/1.4 Plan-
Apochromat objective (Zeiss, Thornwood, NY) and an Orca-ER cooled CCD camera
(Hamamatsu) running NIS Elements 4.20 Lambda (Nikon, Melville, NY), AxioObserver.Z1
microscope equipped with a Colibri LED excitation source with an Orca ER camera running

92
Axiovision acquisition software (Zeiss, Thornwood, NY), a Nikon A1R MP confocal microscope
with an Evolve EMCCD (Photometrics, Tuscon, AZ) camera and 100x/1.45 CFI Plan Apo
Lambda objective running NIS Elements 4.20 (Nikon, Melville, NY), or Nikon eclipse Ti with an
Evolve EMCCD (Photometrics, Tuscon, AZ) camera and 100x 1.45 CFI Apo TIRF objective
running NIS Elements (Nikon, Melville, NY). Fluorescent channels were acquired using
(482/28ex and 525/36em) for GFP, (572/35ex and 632/60em) for mCherry, (350/15ex and
460/50em) for DAPI and MDH, roGFP as described in [250], and Nile red using the GFP and
mCherry channels. Unless otherwise noted, Z-stacks were acquired using 0.5 micron Z spacing
and a total of 13 slices (6 microns). Samples were grown to mid-log phase and concentrated in
a tabletop centrifuge, and 2 µL were placed on glass slides and covered with a #1.5 coverslip.
For extended time-lapse imaging (>15 min), cells were loaded into a CellASIC (EMD Millipore,
Billerica, MA) Y04 imaging plate. Cells were loaded and perfused with SC media at 2.0 psi for
the duration of the experiment. All images and image series were imported into Volocity libraries
(Perkin Elmer, Waltham, MA) for deconvolution and quantitation.
Image Quantitation
Organelle Aggregation: During normal cell cycles, mitochondria and ER do not aggregate in
cytosolic clusters. The time that organelle aggregation occurred after removal of choline from
the media in WT and cho2∆ strains was determined by visual inspection of cells expressing
organelle targeted fluorescent proteins and time-lapse imaging.
Organelle Distribution: Distribution of mitochondria and ER was analyzed as sum
fluorescence in the mother or bud relative to total organelle fluorescence of the budding pair.
Deconvolved, fluorescent channels were thresholded and analyzed for integrated intensity in
ROIs outlining the mother, bud, or budding pair. All measurements and calculations were
imported and performed in Microsoft Excel (Seattle, WA).
Total Mitochondrial Motility: Mitochondrial motility was assayed on a method described by
[251]. Mitochondria were imaged using Cit1p-mCherry, collected as 6 µm Z-stacks with 1 µm Z-

93
spacing, and acquired every 30 sec for 7.5 min. Z-stacks were deconvolved in Volocity and
exported to ImageJ (NIH). Stacks were compressed to a hyperstack using the “Stack to
Hyperstack” command and made into maximum projections using the “Z Project” command.
Contrast was automatically enhanced using the “Enhance Contrast” command and registry
corrected using the “StackReg” command. Images were then thresholded manually and the
background was changed to “not a number” (NaN) using the “NaN Background” command.
Stacks were made into binary images using the “Make Binary” command and the “Total Motility”
plugin was run to generate the percent motile mitochondria. Results were copied to Microsoft
Excel (Seattle, WA), and each time point was subtracted from the previous (n+1)-(n) to obtain
the number of pixels that had changed positions (during mitochondrial movement). To calculate
the percentage of mitochondrial motility, the number of pixels that changed position was divided
by the total number of pixels. All results were averaged for each strain and represented in a
histogram bar graph as the mean +/- SEM.
Mitochondrial Redox: Mitochondrial redox was assayed as described in [250].
The Velocity of Mitochondrial Movement: Mitochondria were imaged using Cit1p-mCherry,
collected as 6 µm Z-stacks with 1 µm Z-spacing, acquired every sec for 1 min. Z-stacks were
deconvolved in using Volocity software (Perkin Elmer, Inc., Waltham MA). Directed events were
defined as those that exhibited linear movement for 3 consecutive time points. The velocity was
measured as a change in the position of a moving mitochondrion as a function of time.
Colocalization analysis: Colocalization was analyzed in Volocity software (Perkin Elmer, Inc.,
Waltham MA), and represented as the overlap coefficient (R).
Multibudded Cell Analysis: Multibudded cells were defined as cells with 2 or more buds. The
numbers of multibudded cells were compared to total number of single budded cells to obtain
percentage of budded cell that were multibudded.

94
UPR Organelle Aggregation Assay: Aggregates of ER and mitochondria were defined as
organelle clumps, typically in the vicinity of the nucleus. Numbers of affected cells were
compared to total number of cells (single and budding cells).
MDH Fluorescence: Raw images (non-deconvolved), were assayed for total MDH
fluorescence. ROI were drawn around budding cells and the MDH channel was thresholded and
analyzed for integrated intensity. Results were imported to and quantified in Microsoft Excel
(Seattle, WA).
Analysis of GFP-Atg8p-labeled PAS: Z-stacks of yeast cells expressing GFP-Atg8p were
recorded and deconvolved in Volocity software (Perkin Elmer, Inc., Waltham MA). Budding cells
were analyzed for punctate or circular structures representing PAS and autophagosomes
respectively. These structures were manually counted on a cell-by-cell basis in Volocity and
recorded in Microsoft Excel (Seattle, WA).
Analysis of Hsp104p-mCh aggregates: Z-stacks of yeast cells expressing Hsp104p-mCherry
were recorded and deconvolved in Volocity software (Perkin Elmer, Inc., Waltham MA). Budding
cells were analyzed for punctate or aggregate structures representing protein aggregates.
These structures were manually counted on a cell-by-cell basis in Volocity and recorded in
Microsoft Excel (Seattle, WA).
Statistical methods and data representation
All data were evaluated for normal distribution using the Anderson Darling test for normality.
Based upon this, P-values were determined using the Kruskal-Wallace test with pairwise
comparisons and Bonferroni correction or with a two-tailed Student’s t-test assuming unequal
variance. The Analyze-it (Leeds, UK) plugin for Microsoft Excel (Seattle, WA) was used for all
statistical calculations and graph creation. Graphs are bar graphs representing the mean and
SEM (standard error of the mean), or outlier notched box plots representing the median,
quartiles, and 95% confidence interval, along with individual observations overlaid as dots
(hollow circles).

95
Area under the peak was normalized to internal standard area to calculate molar lipid
concentrations, which were then normalized to total across all species for each sample, with
final data are presented as mean mol %. All lipid species and subclasses analyzed were found
to have equal variance (data not shown) then analyzed with two-way ANOVA followed by a post
hoc Dunnett’s test. In all cases, *, p ≤ 0.05; **, p ≤ 0.01; ***, p ≤ 0.001.
Other methods
Yeast cells were transformed using the lithium acetate method [234]. All chemicals and
materials were obtained from Sigma-Aldrich (St. Louis, MO) unless otherwise noted.

96
Results
Yeast remodel their lipidome in response to defects in PC biosynthesis
Cho2p catalyzes the first step in the conversion of PE to PC in the PEMT pathway for
PC biosynthesis [134]. Yeast cho2∆ cells can produce PC by the Kennedy pathway when
choline is available [252]. We took advantage of this redundancy to examine the effect of short-
and long-term PC deficiency in eukaryotic cells. We propagated wild-type and cho2∆ cells in the
presence of choline and compared the effects of acute and chronic defects of PC biosynthesis
by shifting cho2∆ cells to choline-free media for 1 and 7 days, respectively (Fig. 1, SFig. 1,
Table S1).
The lipid subclass profiles of wild-type and choline-supplemented cho2∆ cells are
similar. Propagation of cho2∆ cells in the absence of choline for 1 day (acute imbalance) results
decreased levels of PC, phosphatidic acid (PA) and PS, with elevated levels of PE,
phosphatidylglycerol (PG), phosphotidylinositol (PI), and ceramide compared to wild-type cells
(Fig. 1a; SFig. 1b). It also results in an overall increase in the length of fatty acid side chains and
monounsaturated side chains compared to wild-type cells (Fig. 1b-c; SFig.1c-d). While
imbalance in PG and PC persisted in acute and chronic lipid stress, the levels of phytoceramide,
PE, PI, PA and PS were either partially or completely restored to wild-type levels in cho2∆ cells
undergoing chronic defects in PC biosynthesis (Fig. 1a, 1d). Moreover, total cellular levels of
triacylglycerols (TG) and ergosteryl esters (EE), major components of LDs, were largely
unaffected during acute lipid imbalance, but increased significantly during prolonged lipid
imbalance (Fig. 1a, 1d; SFig. 1b). Thus, PC biosynthetic defects lead to an imbalance in many
lipid species and yeast remodel their lipidome to adapt to the stress associated with this lipid
imbalance.

97
98
Figure 1. Phospholipids and neutral lipids change in response to PC biosynthetic defects. The lipidome of mid-log phase yeast was assessed under three conditions: WT and cho2∆ cells propagated in the presence of 1 mM choline (+C) or in the absence of choline for 1 day (-C1) or 7 days (-C7). Heat maps shown are for significant changes using two-way ANOVA followed by post hoc Dunnett's test in (a) lipid subclasses, (b) total fatty acyl/alkyl chain length, (c) unsaturation in phospholipids and DG, and (d) individual lipid species. The color scale indicates log2-transformed fold change of cho2∆ cells vs. WT cells in each condition.
PC imbalance triggers defects in mitochondria and ER and in cell growth rates
Next, we studied the effect of PC imbalance on the morphology and distribution of
mitochondria and ER, the organelles where PC biosynthesis via the PEMT pathway occur,
using fluorescently tagged mitochondrial and ER marker proteins (citrate synthase (Cit1p) and
Pho88p). In wild-type cells, mitochondria are resolved as tubular structures that align along the
mother-bud axis and accumulate in the bud tip and tip of the mother cell distal to the bud [13].
ER is present as the outer membrane of the nuclear envelope (nuclear ER, nER). It also
consists of ER sheets and tubules in the cytosol, as well as cortical ER (cER), a fenestrated
network of sheets and tubules that lie beneath and are anchored to the plasma membrane (PM)
(Fig. 2a) [39].
Upon withdrawal of choline and induction of phospholipid imbalance, there are severe
defects in mitochondria and ER in cho2∆ cells (Fig. 2a-b). The normal morphology of both
organelles is lost: there are no tubular mitochondria or ER tubules or sheets. Polarized
localization and normal interactions of mitochondria and ER with each other and at the cell
periphery are also lost: nER fluorescent signal is only weakly present while there is almost no
detectable cER, and almost no anchorage of mitochondria to the bud tip or mother cell tip.
Instead, mitochondria and ER form abnormal fragmented structures that aggregate near each
other. Further investigation of ER by expression of Sec63p-mCh and Pho88p-GFP in cho2∆
cells undergoing acute lipid imbalance revealed some differences in the distribution of each
fluorescently tagged protein within ER aggregates (Fig 2b). This finding provides additional
evidence that lipid imbalance results in defects in ER morphology and raises the possibility that

99
integral ER membrane proteins can segregate under these lipid stress conditions.
Ultrastructural analysis of cho2∆ cells during acute lipid imbalance confirms results obtained by
fluorescence microscopy (Fig. 2c). We detect abnormal ER-like membrane aggregates in close
proximity to the nucleus and to aggregates of mitochondria.
In wild-type cells, mitochondria and ER are continually transferred into and inherited by
buds as they grow, and the amount of both organelles that are present in buds is proportional to
bud size [30, 181]. In cho2∆ cells undergoing acute lipid imbalance, aggregated mitochondria
and ER are absent or present in very low levels in buds. Thus, there are also defects in the
inheritance of both organelles by developing buds (Fig. 2a and 3b). We also observe a
decrease in the velocity of mitochondrial movement (SFig. 2a); however, mitochondria retain
mtDNA and have a more reducing matrix relative to control cells (SFig. 2b-c,d). Thus, acute lipid
imbalance affects the morphology, localization, motility and inheritance of mitochondria but does
not have a negative impact on maintenance of its genome or redox state.
Previous studies revealed that severe defects in the inheritance of mitochondria or cER
trigger a checkpoint that blocks cell cycle progression at cytokinesis [162, 253]. Moreover,
elevated ceramide levels in ER stressed yeast results in reduced growth rates and loss of cell
viability [254]. Therefore, we studied cell growth and cell cycle progression through cytokinesis
in cho2∆ cells after 1 day of choline depletion. We found that the initial response to defects in
PC biosynthesis is a severe defect in cell growth rate (Fig. 2d) and cytokinesis (SFig. 2d).
However, we do not detect a significant loss of cell viability or failure of cells to grow (data not
shown).

100
Figure 2. Lipid imbalance triggers mitochondria and ER morphology defects. Wild-type and cho2∆ cells were grown to mid-log phase in choline-containing medium and then transferred to and propagated in choline-free SC medium. (a) Representative fluorescent images. Mitochondria (red), nuclear and cortical ER (nER and cER) (green), and DNA (blue) were visualized using Cit1p-mCherry, Pho88p-GFP, and DAPI, respectively. Images shown are maximum projections of 3-D Z-stacks. Cell outlines are shown
101
in white. Bar: 5 µm. (b) ER morphological defects. Representative fluorescent images of Sec63p-mCh (red) and Pho88p-GFP (green). Top row showing a single slice through the middle of the cell to illustrate nuclear ER. Bottom row showing maximum projections and overlay. (c) Ultrastructural analysis of organelle morphology defects during acute lipid imbalance. Representative transmission electron micrographs of wild-type (WT) (left panel) and cho2∆ cells during acute lipid imbalance (right panel). N: nucleus. M: mitochondrion. V: vacuole. The asterisk marks abnormal membrane aggregates that accumulate in the perinuclear region in cells undergoing acute lipid imbalance. Bar: 1 µm. (d) Acute lipid imbalance results in severe growth defects. Growth rates of WT cells and cho2∆ cells undergoing acute lipid imbalance were measured in a plate reader in which optical density at 600 nm was measured every 20 min over 3 days. One representative trial is shown from 3 independent trials with 5 replicates for each trial. (e) ER morphology defects appear prior to mitochondrial defects during acute lipid imbalance. cho2∆ cells were grown to mid-log phase in choline-containing media, immobilized in a microfluidic chamber and perfused with choline-free media. Time-lapse images of Cit1-mCherry-labeled mitochondria (red) and Pho88-GFP-labeled ER (green) in cho2∆ cells were obtained every 30 min for 24 hr. Images shown are maximum projections of 3-D Z-stacks from the time-lapse series. Arrows point to abnormal ER aggregates. Bar: 5 µm (f) Timing of the onset of defects in the morphology of ER and mitochondria. The bar graph shows the time of organelle aggregation (mean +/- SEM). P-values were calculated using the Student’s t-test. One representative trial is shown from 3 independent trials, n>10 for each trial.
Next, we used long-term time-lapse imaging to assess the sensitivity of mitochondria
and ER to the stress of acute lipid imbalance (Fig. 2e; SFig. 2e; Smov. 1-2). On average, ER
begins to aggregate 8 hrs after choline removal from cho2∆ cells, with ER aggregation occurring
first near the nucleus and later at the cell cortex. In contrast, aggregation of mitochondria is not
evident until choline has been removed from the medium for 12 hrs (Fig. 2f). Most of the
mitochondrial aggregation occurs in close proximity to pre-existing ER aggregates. Thus, ER is
more sensitive to the lipid imbalance associated with defects in PC biosynthesis compared to
mitochondria.
Yeast cells adapt to lipid imbalance produced by defects in PC biosynthesis
Surprisingly, given the extent to which mitochondria and ER are perturbed, we observe
partial restoration of normal organelle morphology, localization, interactions and inheritance of
cho2∆ cells with chronic lipid imbalance. To characterize this adaptation to lipid imbalance, we
analyzed the morphology and inheritance of mitochondria and ER, the velocity and extent of
mitochondrial movement, cell growth rates and cell cycle progression through cytokinesis. WT
and cho2∆ cells propagated in choline-containing medium have no defects in any of these
parameters (SFig. 3a-d). However, during acute lipid imbalance, 100% of the cells analyzed

102
exhibit severe defects in the morphology of mitochondria and ER. With chronic lipid imbalance,
we find that normal morphology of both organelles is restored in 80% of the cells analyzed. In
the remaining 20%, mitochondria and ER morphology are largely similar to those observed in
wild-type cells. However, there are some aggregates of tubular mitochondria and ER in the
perinuclear region (Fig. 3a).

103
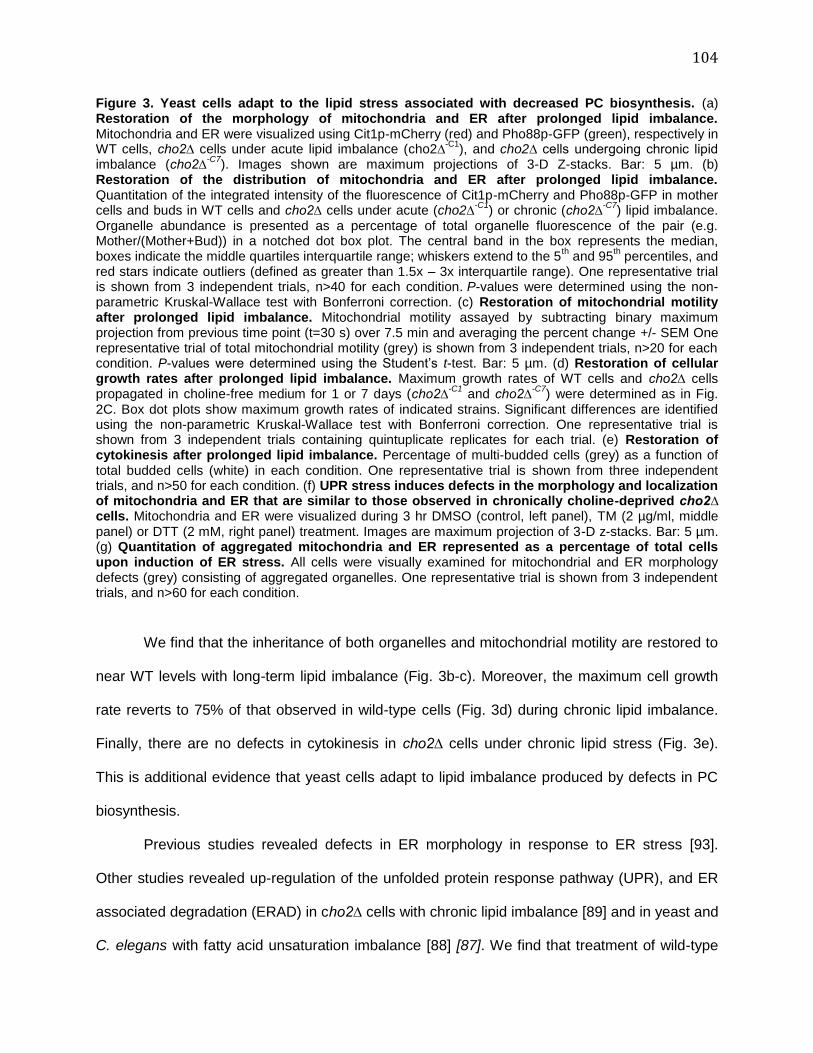
104
Figure 3. Yeast cells adapt to the lipid stress associated with decreased PC biosynthesis. (a) Restoration of the morphology of mitochondria and ER after prolonged lipid imbalance. Mitochondria and ER were visualized using Cit1p-mCherry (red) and Pho88p-GFP (green), respectively in WT cells, cho2∆ cells under acute lipid imbalance (cho2∆
-C1), and cho2∆ cells undergoing chronic lipid
imbalance (cho2∆-C7
). Images shown are maximum projections of 3-D Z-stacks. Bar: 5 µm. (b) Restoration of the distribution of mitochondria and ER after prolonged lipid imbalance. Quantitation of the integrated intensity of the fluorescence of Cit1p-mCherry and Pho88p-GFP in mother cells and buds in WT cells and cho2∆ cells under acute (cho2∆
-C1) or chronic (cho2∆
-C7) lipid imbalance.
Organelle abundance is presented as a percentage of total organelle fluorescence of the pair (e.g. Mother/(Mother+Bud)) in a notched dot box plot. The central band in the box represents the median, boxes indicate the middle quartiles interquartile range; whiskers extend to the 5
th and 95
th percentiles, and
red stars indicate outliers (defined as greater than 1.5x – 3x interquartile range). One representative trial is shown from 3 independent trials, n>40 for each condition. P-values were determined using the non-parametric Kruskal-Wallace test with Bonferroni correction. (c) Restoration of mitochondrial motility after prolonged lipid imbalance. Mitochondrial motility assayed by subtracting binary maximum projection from previous time point (t=30 s) over 7.5 min and averaging the percent change +/- SEM One representative trial of total mitochondrial motility (grey) is shown from 3 independent trials, n>20 for each condition. P-values were determined using the Student’s t-test. Bar: 5 µm. (d) Restoration of cellular growth rates after prolonged lipid imbalance. Maximum growth rates of WT cells and cho2∆ cells propagated in choline-free medium for 1 or 7 days (cho2∆
-C1 and cho2∆
-C7) were determined as in Fig.
2C. Box dot plots show maximum growth rates of indicated strains. Significant differences are identified using the non-parametric Kruskal-Wallace test with Bonferroni correction. One representative trial is shown from 3 independent trials containing quintuplicate replicates for each trial. (e) Restoration of cytokinesis after prolonged lipid imbalance. Percentage of multi-budded cells (grey) as a function of total budded cells (white) in each condition. One representative trial is shown from three independent trials, and n>50 for each condition. (f) UPR stress induces defects in the morphology and localization of mitochondria and ER that are similar to those observed in chronically choline-deprived cho2∆ cells. Mitochondria and ER were visualized during 3 hr DMSO (control, left panel), TM (2 µg/ml, middle panel) or DTT (2 mM, right panel) treatment. Images are maximum projection of 3-D z-stacks. Bar: 5 µm. (g) Quantitation of aggregated mitochondria and ER represented as a percentage of total cells upon induction of ER stress. All cells were visually examined for mitochondrial and ER morphology defects (grey) consisting of aggregated organelles. One representative trial is shown from 3 independent trials, and n>60 for each condition.
We find that the inheritance of both organelles and mitochondrial motility are restored to
near WT levels with long-term lipid imbalance (Fig. 3b-c). Moreover, the maximum cell growth
rate reverts to 75% of that observed in wild-type cells (Fig. 3d) during chronic lipid imbalance.
Finally, there are no defects in cytokinesis in cho2∆ cells under chronic lipid stress (Fig. 3e).
This is additional evidence that yeast cells adapt to lipid imbalance produced by defects in PC
biosynthesis.
Previous studies revealed defects in ER morphology in response to ER stress [93].
Other studies revealed up-regulation of the unfolded protein response pathway (UPR), and ER
associated degradation (ERAD) in cho2∆ cells with chronic lipid imbalance [89] and in yeast and
C. elegans with fatty acid unsaturation imbalance [88] [87]. We find that treatment of wild-type

105
cells with dithiothreitol (DTT) and tunicamycin (TM), two potent activators of the UPR, results in
defects in mitochondria and ER that are similar those observed in cho2∆ cells with chronic lipid
imbalance: aggregation of tubular mitochondria and ER in the perinuclear region (Fig. 3f and
SFig. 3e). We also observe a similarity in the penetrance of phenotype: defects in organelle
morphology are present in 20% of the DTT or TM-treated wild-type cells and in 20-30% of
cho2∆ cells with chronic lipid imbalance (Fig. 3g).
Lipid droplets biogenesis occurs at ER aggregates and is required for adaptation to lipid
imbalance
TG and EE, neutral lipids in the LD core, increase during chronic, but not acute, lipid
imbalance produced by defects in PC biosynthesis (Fig. 1). Therefore, we studied the effect of
lipid imbalance on LDs. We found that monodansylpentane (MDH), a blue neutral lipid stain that
has been used to detect LDs in mammalian cells, [255] labels LDs in yeast (Fig. S4a-b). We
also confirmed that wild-type cells contain 5-15 LDs per cell in close proximity to the nucleus
(Fig. 4a) [256]. Acute lipid imbalance does not have a major effect on LD size. However, it
results in an increase in both the number and the fluorescence of MDH-stained LDs. During
chronic lipid imbalance, there is an additional increase in both the fluorescence of MDH-stained
LDs and LD size compared to those seen with acute lipid imbalance (Fig 4b-c). Thus, LDs are
produced in response to acute and chronic PC biosynthetic defects.
Double label imaging experiments using Pho88p-GFP (an ER marker) and Erg6p-
mCherry (a LD marker), revealed a close relationship between LDs and the ER. In cho2∆-C1
cells, LDs are frequently observed in close proximity to ER aggregates. In cho2∆-C7 cells, in
which the majority of the ER structure is rescued to WT morphology and localization, residual
ER aggregates that are present are often associated with large LDs (Fig. 4d and Fig. S4c).
Ultrastructural analysis confirmed that LDs were frequently associated with nER, and with
membrane aggregates, which are presumably cER (Fig. 4e-f and Fig S4d). In some cases,

106
surfaces at the interface between LDs and membranes have different staining properties
compared to those of either organelle, suggesting that there is a specialized structure at that
site. Moreover, using time-lapse imaging, we obtained evidence that LDs form, enlarge and
remain associated with developing ER aggregates in cho2∆ cells during acute lipid imbalance
(Fig. 4g; Smov. 3-4).
We observe an increase in MDH-stained LD but no obvious increase in TG or EE during
acute lipid imbalance in cho2∆ cells. To reconcile these observations, we isolated LD fractions
from wild type yeast, and cho2∆ cells propagated in the presence of choline or in the absence of
choline for 1 or 7 days. Our lipid profiling studies revealed that TG species are the most
abundant phospholipids in LDs isolated from all cells studied. In addition, we detected a 2-fold
increase in TG in LDs isolated cho2∆ cells exposed to acute or chronic lipid imbalance
compared to wild-type or cho2∆ that are not undergoing lipid stress (Fig. 4h). Thus, TG level in
LDs are elevated, but total cellular TG levels are not elevated in cho2∆ cells undergoing acute
lipid imbalance. This indicates that TG in LDs during acute lipid imbalance are not produced by
increased TG synthesis, but are pre-existing TG that are redistributed to LD. In contrast, TG in
LDs in yeast undergoing chronic lipid imbalance are newly synthesized.

107

108
Figure 4. Lipid droplets biogenesis occurs at ER aggregates and is required for adaptation to lipid imbalance (a) Localization of LDs in wild-type cells. Representative fluorescent images of ER and LDs in WT cells expressing Pho88p-GFP (green) and Erg6p-mCherry (red) respectively. Cells were grown to mid log in SC media. Arrow heads point to areas near the nucleus where LDs accumulate. Images are maximum projections of 3-D Z-stack. Bar: 5 µm (b) Acute and chronic lipid imbalance results in an increase in LDs. Representative fluorescent images showing MDH-stained LDs in WT cells and in cho2∆ cells propagated in the presence of choline (cho2∆
+C), or in the absence of choline for 1
(cho2∆-C1
) or 7 (cho2∆-C7
) days. Images are maximum projections of 3-D Z-stacks. Bar: 5 µm. (c) Quantification of MDH fluorescence intensity. Quantitation of the fluorescence of MDH-stained LDs in in WT cells and in cho2∆ cells propagated in the presence of choline (cho2∆
+C), or in the absence of
choline for 1 (cho2∆-C1
) or 7 (cho2∆-C7
) days. The data are presented in notched dot box plots identifying medians, quartiles, and outliers. Significant differences are identified using the non-parametric Kruskal-Wallace test with Bonferroni correction. One of three representative trials shown, and n>25 for each condition. (d) LDs and ER are in close proximity to each other during lipid imbalance. Representative images of ER and LDs in cells expressing Pho88p-GFP (green) and Erg6p-mCherry (red) during lipid imbalance. WT, cho2∆
+, cho2∆
-C1, and cho2∆
-C7 cells grown in SC media with and without
choline. Images are maximum projections from 3-D z-stacks. Bar: 5µm. (e-f) Ultrastructural analysis of LDs during lipid imbalance. Transmission electron micrographs of a cho2∆ cells propagated in choline-free media for 1 (cho2∆
-C1) or 7 (cho2∆
-C7) days. N: nucleus. LD: lipid droplet. V: Vacuole. LDs have a
characteristic “donut” staining pattern as the contrasting stain for EM does not fully penetrate the LD. The asterisk marks abnormal membrane aggregates that accumulate in the perinuclear region in cells with lipid imbalance. Top panels are whole cell images, while bottom panels are magnified sections of the cell in the upper panel. Bar: 1 µm (d-e top), 200 nm (d bottom), 500 nm (e bottom). (g) LDs form at sites of ER aggregation. Representative still frames from a time-lapse series of ER (Pho88p-GFP, green) and LDs (Erg6p-mCherry, red) in cho2∆ cell at various times after transfer to choline-free medium Fluorescent z-stacks were obtained every 30 min for 24 hours of cells immobilized in a microfluidic chamber. Arrow points to an area near the nucleus where LDs have already grown in size. Arrow heads point to the same spot in all images where cortical ER begins to aggregate and gives rise to a large LD over the course of 7.5 hours. Images are maximum projections of 3-D z-stacks. Bar: 5 µm. (h) Lipid droplets sequester triacylglycerol in response to phospholipid imbalance. Strains were grown as described in Fig. 1. Lipid droplets were isolation through differential gradient centrifugation as described in methods. WT, cho2∆
+, cho2∆
-C1, and cho2∆
-C7 lipids were then analyzed as in Fig. 1. (i) LD biogenesis is not critical in
cells that are not exposed to lipid stress. Dot assay of serially diluted (1:10) (top) WT and dga1∆ lro1∆ strains on SC media. Dot assay of serially diluted (1:10) (bottom) WT, cho2∆, dga1∆ lro1∆, and cho2∆ dga1∆ lro1∆ strains on SC supplemented with 1 mM choline. Strains were grown to mid-log phase in SC media in the present or absence of choline prior to plating. Strains are shown after 2 and 6 days of growth at 30
oC. (j) Formation of LDs is critical for adaptation to lipid imbalance. Dot assay of serially diluted
(1:10) WT, cho2∆, and cho2∆ dga1∆ lro1∆ strains that were grown to mid-log phase in choline-containing media and then on choline-free solid media. Strains are shown after 6 days of growth at 30
oC.
As described above, PE, PG, and PI increase during acute loss of PC biosynthesis.
However, during chronic loss of PC biosynthesis, when TG levels increase, the levels of these
phospholipids decrease. This raises the possibility that excess lipids are converted to TG and
removed from membranes as LDs. To test this hypothesis, we studied the effect on deletion of
enzymes that convert phospholipids to TG and are required for LD biogenesis on adaptation to
lipid stress associated with defects in PC biosynthesis. Lro1p catalyzes direct esterification of
diacylglycerol using the sn-2 acyl group from phospholipids to generate TG [257]. Acyl groups

109
from phospholipids can also be transferred to CoA in phospholipase and acyl-CoA synthetase,
which then serve as an acyl donor for TG production by DGA1 [258]. Deletion of DGA1 and
LRO1 blocks TG biosynthesis and decreases LDs [259].
All stains examined (WT, cho2∆, dga1∆ lro1∆ and cho2∆ dga1∆ lro1∆ yeast) exhibit
similar growth rate upon propagation on choline-supplemented solid media (Fig. 4i). Moreover,
we find that removal of choline from the medium of dga1∆ lro1∆ cells does not affect their
growth rate (Fig. S4e). However, the growth of cho2∆ dga1∆ lro1∆ yeast on choline-free media
is severely compromised compared to wild-type and cho2∆ cells (Fig. 4j). Thus, Dga1p and
Lro1p are required for viability and adaptation to lipid imbalance resulting from defects in PC
synthesis, presumably for their function in conversion of excess phospholipids to TG, which are
ultimately removed from membranes in LDs.
Stress induced lipid droplets are degraded in the vacuole in a process that resembles
microautophagy
Microautophagy is an autophagic pathway mediated by direct engulfment by the vacuole
or lysosome [260]. Our ultrastructural and live cell fluorescent studies revealed that LDs
undergo delivery the vacuole during lipid stress in a process resembling microautophagy (Fig.
5a-b). Specifically, we detect association of LDs with vacuoles, invagination of the vacuolar
membrane at sites of contact with LDs and LDs within vacuoles in cho2∆ cells with acute and
chronic lipid imbalance. We also observe changes in the appearance of membranes at the site
of contact between LDs and vacuoles, which suggests that a unique structure is formed at that
site.
To further characterize lipid stress-induced lipophagy and determine whether other organelles
are targeted to the vacuole for degradation under these conditions, we tagged Cit1p, Pho88p
and Erg6p, marker proteins for mitochondria, ER and LDs, respectively, with mCherry and
assessed targeting of those proteins to the vacuole by analysis of the degradation of tagged

110
proteins to free mCherry, a well established assay for autophagy [261]. We confirmed previous
findings that nitrogen starvation induces degradation of the markers for mitochondria, ER and
LDs (Fig. S5a). Equally important, we find that lipid stress induces degradation of the LD marker
but not markers for mitochondria and ER (Fig. 5c).
To determine whether LD degradation requires autophagosome formation, we studied
Atg8p, a small membrane bound ubiquitin-like protein localizes to pre-autophagosomes and
autophagosomes and is required for efficient autophagosome formation [262] [263]. We
confirmed that GFP-Atg8p localizes to punctuate structures, the phagophore assembly site
(PAS), in 1 out of 4 mid-log phase wild-type yeast, and that nitrogen starvation results in
autophagosome formation and targeting of Atg8p to the vacuole (Fig. 5d) and monitoring the
degradation of GFP-tagged Atg8p to free GFP (Fig. 5e). In addition, we found that Atg8p
localization and expression is similar in wild-type cells and cho2∆ cells supplemented with
choline, and that acute and chronic lipid imbalance results in a 4-fold increase in steady state
levels of GFP-Atg8p and GFP-Atg8p-labelled PAS (Fig 5d-e, Fig. S5b). Equally important, we
do not observe Atg8p in autophagosomes, delivery of Atg8p to the vacuole, or degradation of
Atg8p-GFP to free GFP in cho2∆ cells undergoing acute or chronic lipid imbalance. Thus, lipid
imbalance does not induce measureable amounts of macroautophagy of the markers studied or
of GFP-Atg8p. Moreover, we find that lipid imbalance induces LD degradation in the vacuole,
but no obvious association of LDs with autophagosomes. This provides evidence that LD
degradation occurs by a process that resembles microautophagy.
The localization of Atg8p in yeast with lipid imbalance is similar to that observed in yeast
undergoing ER stress [93]. Indeed, we found that induction of ER stress by treatment with DTT
or TM results in an increase in the number of PAS (Fig. S5c-d), and increased steady state
levels of GFP-Atg8p (Fig. S5e). Moreover, during ER stress, as in lipid stress, PAS structures
do not mature into autophagosomes and are not delivered to the vacuole.

111
Figure 5. Stress induced lipid droplets are degraded in the vacuole in a process that resembles microautophagy (a) Ultrastructure of LD uptake by vacuoles during lipid imbalance. TEMs of cho2∆ cells propagated in the presence of choline (cho2∆
+) or in the absence of choline for 1 (cho2∆
-C1) or 7
(cho2∆-C7
) days showing interactions of LDs and vacuoles. Bars: cho2∆+c
: 2 µm; and cho2∆-C1
and cho2∆-
C7: 1 µm. N: nucleus. LD: lipid droplet. M: mitochondria. V: vacuole. (b) Live cell fluorescence of LD
uptake by vacuoles during lipid imbalance. Representative image of cho2∆-C1
cells expressing Erg6p-mCh (LD) and stained with the blue vital CMAC (7-amino-4-chloromethylcoumarin) dye. Images are single slices taken from 3-D z-stacks. Bar: 5 µm. (c) LDs are preferentially targeted for degradation during lipid imbalance. Wild-type or cho2∆ cells expressing Cit1p-mCherry (a mitochondrial marker),

112
Pho88p-mCherry (an ER marker) or Erg6-mCherry (an LD marker) were constructed. WT cells were propagated in SC medium. cho2∆ cells propagated in the presence of choline (cho2∆
+) or in the absence
of choline for 1 (cho2∆-C1
) or 7 (cho2∆-C7
) days. Protein lysate corresponding to 0.1 OD600 of cell culture were analyzed by western blot analysis using an antibody that recognizes mCherry and TCE as a load control. A representative trial is shown from 3 independent trials. (d) PAS structures increase during lipid imbalance. Representative images of GFP-Atg8p. WT cells, cho2∆ cells propagated in the presence of choline (cho2∆
+) or in the absence of choline for 1 (cho2∆
-C1) or 7 (cho2∆
-C7) days and wild-
type cells propagated under nitrogen limited conditions for 1 day (WT-N for 1 day). Images are maximum projections from 3-D z-stack. Bar: 5 µm. (e) Atg8p expression is increased during lipid imbalance. Western blots of GFP-Atg8p, using trichloroethanol (TCE) staining of total protein as load controls. Cells and culture conditions were as in (d). Protein lysate corresponding to 0.1 OD600 of cell culture was loaded in each lane. Free GFP (~28kD) was detected only under nitrogen starvation. A representative trial is shown from 3 independent trials. (f) LDs are delivered to the vacuole during lipid imbalance independent of macroautophagy machinery. Wild-type, cho2∆, cho2∆ atg7∆, cho2∆ pep4∆, cells expressing Erg6p-mCherry (LD marker) were constructed. WT, cho2∆
+, cho2∆
-C1, and double mutant cells
were grown as previously described (a). Protein lysate corresponding to 0.1 OD600 of cell culture were analyzed by western blot analysis using an antibody that recognizes mCherry and TCE as a load control. A representative trial is shown from 3 independent trials.
Since lipid stress induces ER stress, we tested whether TM- or DTT-induced ER stress,
is sufficient to induce LD biogenesis and microlipophagy. We find that either treatment results in
an increase in LD abundance (Fig. 5f) and [92]. Light and electron microscopy revealed that
LDs induced by ER stress (DTT) are associated with perinuclear ER aggregates (Fig. 5f and
Fig. S5f). Here too, ultrastructural analysis revealed structures at the interface between LDs and
membrane aggregates that are distinct in appearance compared to those of either organelle,
suggesting that there is a specialized structure at that site (Fig. S5f). Our ultrastructural studies
revealed that LDs are also taken up into the vacuole by a process that resembles
microautophagy during ER stress (Fig. 5g). We also detect degradation of Erg6p-mCh, a LD
marker protein, with no obvious vacuolar degradation of ER marker proteins (Fig. 5h and Fig.
S5g). These findings indicate that ER stress also induces LD biogenesis and microlipophagy,
and raises the possibility that the LD biogenesis and microlipophagy observed in cho2∆ cells
undergoing acute lipid stress are due to lipid stress-induced ER stress.
Finally, to determine whether degradation of LDs requires the machinery for
macroautophagy, we studied the effect of deletion of ATG7 in cho2∆ cells during lipid stress.
Atg7p is a dual specificity E1 ubiquitin-ligase protein that is required for activating Atg8p for

113
multiple autophagic pathways including microlipophagy in yeast that are transferred from
nitrogen starvation to nutrient rich conditions [264]. Deletion of ATG7 or ATG8 in cho2∆
prevents these cells from adapting their organelle morphology (Fig. S5h), and cho2∆ atg7∆
double mutants appear to accumulate LD when imaged with MDH (Fig. S5i-j). Surprisingly
though, we find that lipid stress induced LD autophagy does not require ATG7 (Fig. 5i). Indeed,
although LD levels are higher in cho2∆ atg7∆ double mutants relative to cho2∆ cells under
chronic lipid stress (Fig. S5i-j), LD autophagy occurs to a greater extent in atg7∆ cho2∆-C1
compared to cho2∆-C1 cells (Fig. 5i). Finally, we confirmed that the LD marker was not degraded
in cells lacking the principle vacuolar protease Pep4p (vacuolar protease Proteinase A) (Fig. 5i).
These data verify vacuole dependent degradation, independent of macroautophagy. Thus, we
identify stress induced LD microautophagy as a unique form of specific autophagy that does not
require ATG7. In light of these findings, we refer to this LD autophagy as stress induced
microlipophagy.
Damaged proteins are removed from the ER by LDs
Previous studies revealed that lipid stress in cho2∆ cells results in activation of the UPR
and ERAD [89]. Other studies suggest a functional connection between ER stress and the
cytosolic heat shock proteins [265] [266]. Therefore, we studied the localization of tagged
Hsp104p, a cytosolic oligomeric ATPase from the HSP100 family of proteins [267] that binds to
and mediates refolding of misfolded proteins [268]. Hsp104p localizes to cytosolic
compartments that contain misfolded proteins including IPOD (Insoluble Protein Deposit) and
JUNQ (Juxta Nuclear Quality control compartment) [269], and Q-bodies [270].
We confirmed that Hsp104p localizes to small punctuate structures in 1 out of 2 mid-log
phase wild-type yeast, and that heat shock results in an increase in the number of Hsp104p-
containing small punctate structures (Fig. S6a-b). In addition, we found that Hsp104p levels and
distribution are similar in wild-type and cho2∆ cells supplemented with choline (Fig 6a-b, Fig.

114
S6c). In contrast, in cho2∆ yeast undergoing acute lipid imbalance, Hsp104p levels increase
(Fig. 6a), and Hsp104p localizes to large aggregates (Fig. 6b, Fig. S6c). In cho2∆ cells
undergoing chronic lipid imbalance, Hsp104p levels are elevated; however, the protein does not
localize to large aggregates (Fig. 4d).
Figure 6. Damaged proteins are removed from the ER by LDs (a) Hsp104p expression is increased during lipid imbalance. Western blots of Hsp104p-mCh, using trichloroethanol (TCE) staining of total protein as load controls. WT cells grown with or without choline (WT
+ and WT), cho2∆ cells propagated in
the presence of choline (cho2∆+) or in the absence of choline for 1 (cho2∆
-C1) or 7 (cho2∆
-C7) days.
Protein lysate corresponding to 0.1 OD600 of cell culture was loaded in each lane. A representative trial is shown from 3 independent trials. (b) Protein aggregates increase during lipid imbalance. Representative images of Hsp104-mCh in strains as described in (a). Images are maximum projections from 3-D z-stack. Bar: 5 µm. (c) Hsp104p aggregates colocalize with ER aggregates in cho2∆
-C1
cells. Representative fluorescent images of Pho88p-GFP (ER) and Hsp104-mCh (protein aggregates) in WT cells, cho2∆ cells propagated in the presence of choline (cho2∆
+) or in the absence of choline for 1
(cho2∆-C1
) or 7 (cho2∆-C7
) days). Images are maximum projections created from 3-D z-stacks. Bar: 5 µm. (d) Quantitation of colocalization between ER and protein aggregate signal using Mander’s overlap
115
coefficient (R). The data are presented in notched dot box plots identifying medians, quartiles, and outliers. Significant differences are identified using the non-parametric Kruskal-Wallace test with Bonferroni correction. One of three representative trials shown, and n>50 for each condition. (e) Organelle and protein aggregates make close contact with LDs. Representative fluorescent images of ER (green), Hsp104p (red) and LDs (blue) in cho2∆
-C1 cells. Here, ER, Hsp104p and LDs were
visualized using Pho88p-GFP, Hsp104p-mCherry, and MDH staining. Images are maximum projections of 3-D z-stacks. Bar: 5 µm. (f) Poly-ubiquitinated proteins associate with lipid droplets in cho2∆
-C1
cells. The same isolated LD fractions as in (4h) were subject to western blot analysis. WT isolations did not recover enough material for WB and cho2∆
+ fractions were used as a control instead. Erg6p-mCh was
used as a loading control. Kar2p was also visualized as an internal ER chaperone. Representative blot is shown from 3 independent trials.
In light of these findings, we studied the spatial relationship between ER and Hsp104p.
We find that the Hsp104p aggregates observed in cho2∆ cells undergoing acute lipid imbalance
are enriched at, and co-localize with ER aggregates. In cho2∆-C7 cells, Hsp104p abundance and
localization resemble those observed in wild-type cells (Fig. 6c-d). Furthermore, triple label, live
cell imaging revealed that ER aggregates are enriched with Hsp104p and are in close proximity
to LDs (Fig. 6e). Thus, unfolding of ER proteins occurs during acute lipid imbalance produced
by inhibition of PC biosynthesis, and is restored in yeast that have adapted to lipid imbalance.
Moreover, since Hsp104p localizes to ER and does not localize to other membranes in cell
(data not shown) with acute lipid imbalance, the primary site for protein unfolding is the ER.
Since LDs are generally considered inert, it is surprising that microlipophagy occurs in
yeast with lipid imbalance. In light of this, and the finding that lipid imbalance leads to protein
misfolding in the ER, we tested whether damaged ER proteins are removed from the ER by LDs
and microlipophagy. Damaged proteins are marked for degradation by poly-ubiquitination [271].
Moreover, Kar2p is a chaperone that binds to unfolded proteins in the ER lumen [272]. To test
whether damaged ER proteins are removed from the organelle by LDs, we tested whether LDs
isolated from yeast with lipid imbalance contains poly-ubiquitination proteins and Kar2p. We find
that Kar2p is associated with LDs isolated form cho2∆ cells under acute and chronic lipid
imbalance. However, Kar2p is enriched in LDs isolated from cho2∆ cells with acute lipid stress.
We also find that poly-ubiquitinated proteins associated only in LDs isolated from cho2∆ cells
under acute lipid stress (Fig. 6f-g). Thus, LDs from cho2∆ cells under acute and chronic lipid
116
stress have similar lipidome profiles, but different protein associations. These findings are
consistent with the model that ER proteins that are damaged by the lipid imbalance produced by
defects in PC biosynthesis are poly-ubiquitinated and removed from ER by LDs.
Stress induced microlipophagy is regulated by the ESCRT complex and a previously
uncharacterized protein
We used next-generation RNA-sequencing (RNAseq) to assess changes in gene
expression associated with acute lipid imbalance in cho2∆ cells. Using 1.5 log2 fold differences
as a cut-off for changes in gene expression, we detect changes in the expression of hundreds of
genes. We grouped gene ontology (GO) terms related to transcripts that are elevated or
reduced in response to acute lipid stress using the Revigo protocol (Fig. 7a, SFig. 7a, Table S2)
[249]. Lipid imbalance results in up-regulation of stress processes, including chaperones linked
to heat and abiotic stress, catabolism of lipids, proteins, and carbohydrates, autophagy,
vacuolar proteases and carbohydrate transporter genes. Groups of GO terms also clustered
around oxidation-reduction related terms, mainly involving mitochondrial homeostasis. Indeed,
the vast majority of the genes that encode autophagy proteins or heat shock proteins are up-
regulated (Fig. S7b-c). Transcripts that were down-regulated in response to acute defects in PC
biosynthesis were almost exclusively related to cytosolic translation, ribosomal proteins, and
nucleolar proteins which contribute to ribosome assembly (SFig. 7a).
Many of the genes which exhibited changes in expression could not be grouped
according to their GO terms because they were previously uncharacterized or because their GO
terms were either not enriched or were not well annotated. We confirmed that genes involved in
the ER-UPR are up-regulated in response to acute lipid imbalance [89]; however, since all of
these genes have a number of roles or are not principally GO annotated for the UPR, they are
not shown in our analysis. Other gene products like Ire1p, which rely on post-translational

117
regulation, show dampened transcriptional regulation relative to genes whose primary regulation
is through mRNA abundance.
Our transcriptome analysis revealed several previously uncharacterized open reading
frames (ORFs) that are up-regulated in response to lipid stress. One of these ORFs, YLR312c
is up-regulated during acute lipid stress by over 32-fold. This ORF contains two repeats of a
stress response element (STRE) ~ 500 bp upstream of the promoter, suggesting a role in a
stress response. Moreover, the protein contains a putative transmembrane domain, an amino
terminal region that is acidic, and a C-terminal region that is basic, like many proteins in the ER
lumen, and contains cysteine groups that can form 2 disulfide bridges (Fig. 7b). On the basis of
isoelectric points, the amino terminus is predicted to face the cytosol and the C-terminal is
predicted to be in the ER lumen [273].
We confirmed that the protein encoded by YLR312c is up-regulated during lipid stress in
cho2∆ cells. Moreover, we found that YLR312c protein is present in higher levels in cho2∆ cells
with acute compared to chronic lipid stress and up-regulated during TM, DTT, and nitrogen
starvation conditions (Fig. 7c). We tagged YLR312c at its chromosomal locus by insertion of
GFP into the C-terminus of the protein. Yeast expressed GFP-tagged YLR312c had no obvious
defect in growth rates, or in the morphology of ER or mitochondria. We found GFP-tagged
YLR312c localizes to the nER and to some but not all cER (Fig. 7d).
Equally important, we find that adaptation, i.e. restoration of organelle morphology and
distribution; do not occur in cho2∆ ylr312c∆ incubated in choline-free media for 7 days (Fig. 7e).
Furthermore, up-regulation of Atg8p-containing PAS and microlipophagy do not occur in cho2∆
ylr312c∆ yeast exposed to acute lipid imbalance (Fig. 7f and 7i). Interestingly, YLR312c is up-
regulated during DTT- or TM-induced ER stress and nitrogen starvation, however, deletion of
YLR312c does not affect PAS/autophagosome levels or delivery of autophagosomes to the
vacuole under nitrogen starvation conditions (Fig. 7g-h). On the other hand, deletion of
YLR312c decreases PAS number during ER stress (Fig. 7g-h).

118
Together, these findings indicate that YLR312c is required for PAS formation during lipid
and ER stress and for the lipid stress induced microlipophagy. Furthermore, YLR312c-
dependent microlipophagy is required for adaptation to lipid imbalance produced by inhibition of
PC biosynthesis.

119
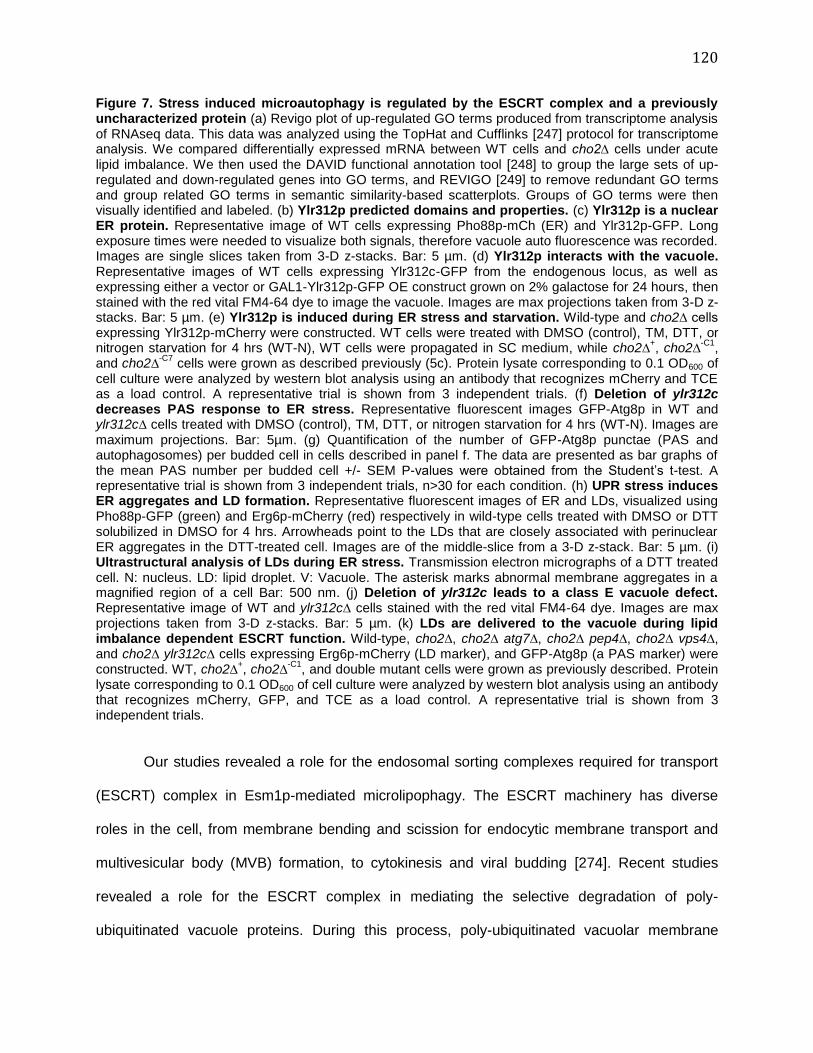
120
Figure 7. Stress induced microautophagy is regulated by the ESCRT complex and a previously uncharacterized protein (a) Revigo plot of up-regulated GO terms produced from transcriptome analysis of RNAseq data. This data was analyzed using the TopHat and Cufflinks [247] protocol for transcriptome analysis. We compared differentially expressed mRNA between WT cells and cho2∆ cells under acute lipid imbalance. We then used the DAVID functional annotation tool [248] to group the large sets of up-regulated and down-regulated genes into GO terms, and REVIGO [249] to remove redundant GO terms and group related GO terms in semantic similarity-based scatterplots. Groups of GO terms were then visually identified and labeled. (b) Ylr312p predicted domains and properties. (c) Ylr312p is a nuclear ER protein. Representative image of WT cells expressing Pho88p-mCh (ER) and Ylr312p-GFP. Long exposure times were needed to visualize both signals, therefore vacuole auto fluorescence was recorded. Images are single slices taken from 3-D z-stacks. Bar: 5 µm. (d) Ylr312p interacts with the vacuole. Representative images of WT cells expressing Ylr312c-GFP from the endogenous locus, as well as expressing either a vector or GAL1-Ylr312p-GFP OE construct grown on 2% galactose for 24 hours, then stained with the red vital FM4-64 dye to image the vacuole. Images are max projections taken from 3-D z-stacks. Bar: 5 µm. (e) Ylr312p is induced during ER stress and starvation. Wild-type and cho2∆ cells expressing Ylr312p-mCherry were constructed. WT cells were treated with DMSO (control), TM, DTT, or nitrogen starvation for 4 hrs (WT-N), WT cells were propagated in SC medium, while cho2∆
+, cho2∆
-C1,
and cho2∆-C7
cells were grown as described previously (5c). Protein lysate corresponding to 0.1 OD600 of cell culture were analyzed by western blot analysis using an antibody that recognizes mCherry and TCE as a load control. A representative trial is shown from 3 independent trials. (f) Deletion of ylr312c decreases PAS response to ER stress. Representative fluorescent images GFP-Atg8p in WT and ylr312c∆ cells treated with DMSO (control), TM, DTT, or nitrogen starvation for 4 hrs (WT-N). Images are maximum projections. Bar: 5µm. (g) Quantification of the number of GFP-Atg8p punctae (PAS and autophagosomes) per budded cell in cells described in panel f. The data are presented as bar graphs of the mean PAS number per budded cell +/- SEM P-values were obtained from the Student’s t-test. A representative trial is shown from 3 independent trials, n>30 for each condition. (h) UPR stress induces ER aggregates and LD formation. Representative fluorescent images of ER and LDs, visualized using Pho88p-GFP (green) and Erg6p-mCherry (red) respectively in wild-type cells treated with DMSO or DTT solubilized in DMSO for 4 hrs. Arrowheads point to the LDs that are closely associated with perinuclear ER aggregates in the DTT-treated cell. Images are of the middle-slice from a 3-D z-stack. Bar: 5 µm. (i) Ultrastructural analysis of LDs during ER stress. Transmission electron micrographs of a DTT treated cell. N: nucleus. LD: lipid droplet. V: Vacuole. The asterisk marks abnormal membrane aggregates in a magnified region of a cell Bar: 500 nm. (j) Deletion of ylr312c leads to a class E vacuole defect. Representative image of WT and ylr312c∆ cells stained with the red vital FM4-64 dye. Images are max projections taken from 3-D z-stacks. Bar: 5 µm. (k) LDs are delivered to the vacuole during lipid imbalance dependent ESCRT function. Wild-type, cho2∆, cho2∆ atg7∆, cho2∆ pep4∆, cho2∆ vps4∆, and cho2∆ ylr312c∆ cells expressing Erg6p-mCherry (LD marker), and GFP-Atg8p (a PAS marker) were constructed. WT, cho2∆
+, cho2∆
-C1, and double mutant cells were grown as previously described. Protein
lysate corresponding to 0.1 OD600 of cell culture were analyzed by western blot analysis using an antibody that recognizes mCherry, GFP, and TCE as a load control. A representative trial is shown from 3 independent trials.
Our studies revealed a role for the endosomal sorting complexes required for transport
(ESCRT) complex in Esm1p-mediated microlipophagy. The ESCRT machinery has diverse
roles in the cell, from membrane bending and scission for endocytic membrane transport and
multivesicular body (MVB) formation, to cytokinesis and viral budding [274]. Recent studies
revealed a role for the ESCRT complex in mediating the selective degradation of poly-
ubiquitinated vacuole proteins. During this process, poly-ubiquitinated vacuolar membrane

121
proteins undergo MVB-dependent, ATG-gene independent targeting to the vacuole for
degradation [275].
We find that over-expressed Ylr312p-GFP localizes to protrusions that extend from the
nER and accumulates at sites of close contact between nER and the vacuole (Fig. 7j; Fig. S7d).
Moreover, we find that over-expression of the untagged version of Ylr312p resulted in defects in
the morphology of mitochondria and ER in 100% of cells assayed (Fig. S7e). Conversely, we
find that ylr312c∆ mutants display a class E vacuole morphology defect that is characteristic of
ESCRT dysfunction: accumulation of an enlarged MVB adjacent to the vacuole (Fig. 7k) [276].
The cho2∆ ylr312c∆ double mutant fails to deliver stress-induced LDs to the vacuole for
degradation during acute lipid stress (Fig. 7i). These studies suggest a role for YLR312c in lipid-
and ER-stress induced microlipophagy but not starvation-induced macroautophagy. In light of
this, we will refer to the YLR312c gene as ESM1 for ER stress induced microlipophagy.
Finally to determine if ESCRT is required for adaptation to lipid stress, we studied this
process in yeast bearing deletions in VPS4, which catalyzes the final step in ESCRT maturation.
We found that VPS4 is required for lipid stress-induced microlipophagy (Fig. 7i). Overall, these
studies support a role for microlipophagy in the clearance of damaged ER protein LDs through a
novel mechanism that requires the ESCRT machinery and a newly identified gene ESM1
(YLR312c) that regulates the class E compartment in yeast.

122
Discussion
Here, we describe profound defects in yeast growth and membrane organization in
response to acute lipid imbalance resulting from defects in PC biosynthesis and novel
adaptation mechanisms to overcome effects of this glycerophospholipid imbalance which relies
on LD biogenesis and microlipophagy for removal of excess phospholipids and damaged
proteins from the ER. The microlipophagy observed in these studies has features not observed
previously. It is specific for LDs, does not require autophagosome formation or ATG7, occurs by
direct interaction of LDs with the vacuole and requires a previously uncharacterized ER protein
(Esm1p) and the ESCRT machinery.
Cho2p localizes to the ER and catalyzes the first methylation of PE during the
conversion of PE to PC. Within 24 hrs of acute lipid imbalance in cho2∆ cells, we observe lipid
imbalance including reduced levels of PC, PA and PS, and elevated levels of PE, PG, PI and
ceramide. We also observe severe defects in cell growth and in the morphology, distribution,
and inheritance of ER and mitochondria. Moreover, we find that ER is more sensitive to lipid
imbalance compared to mitochondria. Defects in ER morphology are detectable within 8 hrs of
exposure of cho2∆ cells to lipid imbalance, conditions where there are no obvious defects in
mitochondria. Additionally, Hsp104p, a heat shock protein that binds to and reactivates
denatured, aggregated proteins, is recruited to the ER and not to mitochondria during acute lipid
imbalance. Thus, we identified defects in organelle organization that were not previously
detected during acute lipid imbalance in yeast.
Interestingly, yeast can adapt to lipid imbalance. Within 7 days after loss of Cho2p
function, cell growth rates, morphology and distribution of mitochondria and ER, and the
balance of some, but not all phospholipids are restored. Under these conditions, the imbalance
in PC and PG persists. However, PE, PA, PS, PI, and ceramide decrease or return to wild-type
levels. The adaptation may be a consequence of the restoration of one or all of the

123
phospholipids. PE is an abundant, conical phospholipid that assembles into reversed
nonlamellar structures and can generate negative curvature and membrane stress [277].
Moreover, shortening and increasing the saturation of acyl side chains of PE reduces negative
curvature membrane stress. Therefore, we favor the interpretation that the adaptations that are
critical for restoration of ER and mitochondrial organization, which in turn affects cell growth, are
those that reduce negative membrane curvature.
Equally important, we obtained evidence for a role of LD biogenesis in adaptation to lipid
imbalance by removing excess lipids from the ER. We observe an increase in LD abundance in
cho2∆ cells during acute and chronic lipid imbalance. These LDs form at sites of ER
aggregation, and remain associated with ER aggregates as they increase in size. We also
observe an increase in the levels of the major lipids of LDs (TG and EE) and of LDs in cho2∆
yeast under conditions of chronic lipid imbalance. Moreover, we find that LDs isolated from
yeast exposed to this lipid stress condition have 2 fold more TG compared to LDs found in wild
type yeast. Finally, we find that Lro1p and Dga1p, two enzymes that mediate conversion of
phospholipids to TG, are required for adaptation to lipid imbalance in cho2∆ yeast. These
findings support the model that excess lipids that accumulate in ER in cho2∆ yeast undergoing
chronic lipid imbalance are converted to TG, which is then removed from the ER in LDs.
Our studies revealed a second function for LDs in adaptation to lipid imbalance: removal
of damaged proteins from the ER. Ploegh (2007) proposed that LDs that form at ER may serve
as “escape hatches” for removal of damaged ER proteins from the organelle. However, there
has been little evidence for this model. Our finding that Hsp104p is recruited to ER and not other
organelles in cho2∆ cells under conditions of acute lipid imbalance indicates that one
consequence of lipid imbalance is unfolding of ER proteins. Moreover, we find that LDs isolated
from cho2∆ undergoing acute lipid imbalance are associated with polyubiquitinated proteins and
Kar2p (BiP in metazoans), an ER luminal chaperone. These findings support the model that ER

124
proteins that are unfolded or misfolded in response to lipid imbalance are removed from ER in
LDs that form at sites of ER aggregation.
While LDs were believed to be inert bodies, recent studies indicate they can be toxic and
must be eliminated by lipophagy in mammalian systems. Specifically, inhibition of autophagy
results in LD accumulation in hepatocytes and an increased incidence of fatty liver in mice [278,
279]. Other studies indicate that LDs undergo a specific form of autophagy in yeast that
transferred from starvation to nutrient-rich conditions. During this process, LDs are not
encapsulated by autophagosomal membranes and are taken up into the vacuole by a process
that resembles microautophagy. This LD autophagy requires core autophagy genes including
ATG7 and ATG8, but not ATG11 or ATG20 [264].
We find that LDs, but not ER or mitochondrial marker proteins, are targeted for
degradation in the vacuole in cho2∆ yeast during lipid imbalance and that LD degradation
occurs by a process that resembles microautophagy. Interestingly, LD autophagy observed
under lipid stress does not require ATG7. Finally, we find that this specific form of LD
microautophagy also occurs in yeast exposed to DTT- or TM-induced ER stress. Thus, we
identified a specific form of LD autophagy that induced by lipid or ER stress and is
distinguishable from LD autophagy induced by recovery from starvation. We will refer to this
specific autophagy as stress induced microlipophagy.
Beyond this, we find that microlipophagy is regulated by a newly identified, stress
response factor, which we refer to as ER stress induced microlipophagy protein 1 (Esm1p).
ESM1 (YLR312c) is a previously uncharacterized open reading frame that contains two stress
response elements 500 bp upstream from its promoter and a putative transmembrane domain.
We find that EMS1 is up-regulated by nitrogen starvation and by lipid or ER stress. However, it
is not required for nitrogen starvation-induced macroautophagy. On the other hand, it localizes
to the nER, and is required for 1) stress-induced increases in PAS structures, 2)

125
microlipophagy, and 3) for recovery of the morphology and distribution of mitochondria and ER
produced by loss of Cho2p/choline.
Damaged ER proteins can be toxic. Moreover, removal of damaged ER proteins in LDs
and defects in organelle morphology occur during the acute stage of lipid imbalance. Finally,
Esm1p-dependent microlipophagy is required for recovery of organelle morphology and cell
growth in cho2∆ exposed to chronic lipid imbalance. In light of this, we propose that
microlipophagy is required for elimination of LDs containing damaged ER proteins in yeast with
lipid stress. Since Esm1p is also induced by DTT- or TM-induced ER stress, and LD biogenesis
and microlipophagy also occur during ER stress, it is possible that proteins that are damaged by
ER stress are also removed from the organelle by LD biogenesis, and eliminated by
microlipophagy. Finally, we do not detect vacuolar degradation of Pho88p under lipid or ER
stress conditions. However, we find that Pho88p and Sec63p, two integral ER membrane
proteins, segregate to some extent within ER aggregates during lipid stress. Therefore, it is
possible that the proteins that are removed from lipid-stressed membranes are a distinct class
of ER proteins that are either not readily removed from the organelle by ERAD or are more
sensitive to lipid stress compared to Pho88p.
Finally, recent studies revealed a role for the ESCRT complex in degradation of poly-
ubiquitinated vacuole proteins that is not dependent upon ATG genes [275]. Our studies also
support a role for the ESCRT complex in Esm1p-regulated microlipophagy. Specifically, we find
that deletion of ESM1 results in class E vacuolar morphology defects that are characteristic of
ESCRT dysfunction, and that deletion of VPS4 and the associated defects in ESCRT assembly
results in failure to induce microlipophagy in cho2∆ yeast undergoing acute lipid imbalance. We
do not detect multivescular bodies or Esm1p in association with LDs in lipid stressed yeast.
Therefore, mechanism underlying Esm1p and ESCRT function in microlipophagy remains to be
determined.

126
Overall, our studies revealed a role for LDs in removal of excess lipids in yeast with
defects in PC biosynthesis. This provides additional support for a role for LDs in storage of
excess lipids. Equally important, our studies provide the first direct evidence for a role for LDs in
the removal of damaged ER proteins from the organelle under lipid stress conditions, a novel
form of stress-induced microlipophagy, that may be critical for elimination of LDs containing
damaged ER proteins, and a role for the ESCRT machinery and a newly identified protein,
Esm1p, in microlipophagy. Finally, we find that LD biogenesis and microlipophagy are critical
for adaptation of yeast to lipid imbalance produced by defects in PC biosynthesis. Since defects
in PC biosynthesis affect the morphology and distribution of ER and/or mitochondria in cell
culture and human disease, it is possible that these adaptive mechanisms are conserved and
critical for the response to lipid imbalance in other eukaryotes.
127
Acknowledgments
This work was supported by awards from HHMI 56006760 to JDV, NIH R01 NS056049 to GDP,
from NIH-NCRR, 1S10RR023454-01 to JMM and from the Ellison Medical Foundation (AG-SS-
2465) and the NIH (GM45735, GM45735S1 and GM096445) to LAP. GM45735S1 was issued
from the NIH under the American Recovery and Reinvestment Act of 2009. The microscopes
used for these studies were supported in part through a NIH ⁄ NCI grant (5 P30 CA13696) and
obtained using funds from the NIH-NCRR (1S10OD014584) to LAP.

128
Author Contributions
The data in this chapter was contributed by Vevea, Jason D, Chan, Robin B, Zhou, Bowen, Schultz. Mei, Di Paolo, Gilbert, McCaffery, J Michael, and Pon, Liza A as follows.
Figure 1 RBC and BZ
Figure 2 JDV and JMM
Figure 3 JDV and JMM
Figure 4 JDV and JMM and RBC and BZ
Figure 5 JDV and JMM
Figure 6 JDV
Figure 7 JDV
Figure S1 RBC and BZ
Figure S2 JDV
Figure S3 JDV
Figure S4 JDV
Figure S5 JDV and JMM
Figure S6 JDV and JMM
Figure S7 JDV

129
Supplemental Figures and Tables

130
Figure S1. Effect of acute and chronic defects in PC biosynthesis on phospholipid levels. (a) Experimental outline followed for lipid imbalance studies. Wild-type cells were grown in synthetic complete (SC) media supplemented with 1 mM choline (WT
+C). The CHO2 gene was replaced with an
auxotrophic marker and selected on appropriate dropout media supplemented with 1 mM choline (cho2Δ
+C). These cells were then grown to mid-log phase in SC media containing 1 mM choline and
propagated in fresh choline-free SC medium for 1 (cho2Δ-C1
) or 7 days (cho2Δ-C7
). (b) Levels of total measured lipid grouped by subclass. (c) Levels of side chain length grouped by side chain. (d) Levels of unsaturated carbons of all phospholipids grouped by number.

131

132
Figure S2. The effect of acute lipid imbalance on mitochondria redox state and motility. (a) ER morphology defects appear prior to mitochondrial defects during acute lipid imbalance. Time-lapse images of a group of cho2∆ cells grown to mid-log phase in choline-containing media, immobilized in a microfluidic chamber and perfused with choline-free media. Time-lapse images of Cit1-mCherry-labeled mitochondria (red) and Pho88-GFP-labeled ER (green) in cho2∆ cells were obtained every 30 min for 24 hr. Images shown are maximum projections of 3-D Z-stacks from the time-lapse series. Green arrowheads point to abnormal ER aggregates, and red arrowheads point to mitochondrial aggregates. Bar: 5 µm. (b-c) Mitochondria are more reduced during acute lipid imbalance. Representative fluorescent images of WT and cho2∆ cells grown to mid-log phase with (b) and without (c) choline. Mitochondrial matrix redox state was probed using mitochondria-targeted redox-sensitive GFP (mit-roGFP1). The bar graph shows the average cellular mitochondrial redox ratio of reduced to oxidized mito-roGFP (mean +/- SEM). P-values were calculated using the Student’s t-test. One representative trial is shown from 3 independent trials, n>30 for each trial. Images shown are maximum projections of 3-D Z-stacks. Bar: 5 µm. (d) cho2∆
-C1 cells become multi-budded. Example of a multi-budded cho2∆ cell
counterstained with DAPI to show cellular and mitochondrial DNA (blue). Nuclear DNA is clearly visible in each bud while mtDNA is restricted to the mother cell. The image is maximum projection of 3-D z-stacks. Bar: 5 µm. (e) The velocity of mitochondrial movement decreases during acute lipid stress. Mitochondrial movement was assessed by 4D imaging (3D reconstruction combined with time-lapse imaging) in cho2∆ cells that express Cit1p-mCherry and were exposed to acute lipid stress. Z-stacks were obtained at 1 sec intervals. Directed movement was defined as those that were linear over 3 consecutive still frames during the time-lapse series. The bar graph shows the average velocity of mitochondria movement (mean +/- SEM). P-values were calculated using the Student’s t-test. One representative trial is shown from 2 independent trials, n>30 for each trial. The number of directed movements also decreased, three times as many cells had to be assayed for mitochondrial movement in the cho2∆
-C1
condition.

133
Figure S3. Mitochondria and ER are normal in wild-type cells and in cho2∆ cells propagated in the presence of choline. (a) Mitochondria and ER have wild-type morphology with choline supplementation. Representative fluorescent images of mitochondria and ER, visualized with Cit1p-mCherry (red) and Pho88p-GFP (green) respectively. Images are maximum projections of 3-D Z-stacks of WT and cho2∆ cells grown in the presence of 1 mM choline. Bar: 5 µm. (b) Mitochondria and ER have wild-type distribution with choline supplementation. Distribution data was obtained and quantified as in Figure 3b. One representative trial is shown from 3 independent trials, and n>40 cells for each condition. (c) Mitochondrial motility is normal with choline supplementation. Representative images of total motility (grey). Bar: 5 µm. Mitochondrial motility was assayed as in Figure 3c. One representative trial is shown from 3 independent trials, and n>20 for each condition. P-values were determined using the Student’s t-test. (d) Cell growth rates are at wild-type levels with choline supplementation. Box plot representing maximum growth rates of strains grown in SC with choline supplementation. Data obtained as in Figure 3d. One representative trial is shown from 3 independent trials, and n=5. (e) Mitochondria and ER morphology during prolonged lipid stress is similar to UPR-induced stress. Representative fluorescent maximum projections of untreated wild-type cells (WT), wild-type cells treated with TM and cho2∆ cells under chronic lipid imbalance (cho2∆
-C7). Mitochondria and ER are visualized using Cit1p-
mCherry (red) and Pho88p-GFP (green). Arrowheads point to ER/mitochondrial aggregates seen during UPR-induced stress and lipid stress. Bar: 5 µm.

134
Figure S4. LDs accumulate during lipid imbalance. (a) MDH labels LDs in yeast. Representative fluorescent images of WT cells grown to mid-log phase in SC media and stained with Nile red (red and green) and MDH (cyan). Nile red stains all cellular lipids and LDs. However, the wavelength of its emitted fluorescence varies depending on the structures stained. Red: total cellular lipids. Green: Lipid droplets. MDH labeling co-localizes with Nile Red-stained LDs. Images are maximum projections of 3-D z-stacks.
135
Bar: 5 µm. MDH staining is bright and photostable. (b) It also has no obvious bleed-through to red and green channels and is therefore compatible with fluorophores including GFP and mCherry. (c) Additional examples of cho2∆ cells during lipid imbalance. Representative TEM images of cho2∆ cells propagated in the presence of choline (cho2∆
+) or in the absence of choline for 1 (cho2∆
-C1) or 7 (cho2∆
-
C7) days. Bars: cho2∆
+ and cho2∆
-C1: 1 µm; cho2∆
-C7: 2 µm. N: nucleus. LD: lipid droplet. V: vacuole. (d)
LDs and ER are in close proximity to each other during lipid imbalance. Representative images of ER and LDs in cells expressing Pho88p-GFP (green) and Erg6p-mCherry (red) during lipid imbalance. WT, cho2∆
+, cho2∆
-C1, and cho2∆
-C7 cells grown in SC media with and without choline. Images are
maximum projections from 3-D z-stacks. Bar: 5µm. (e) LD biogenesis is not critical in cells that are not exposed to lipid stress. Dot assay of serially diluted (1:10) WT and dga1∆ lro1∆ strains on SC media without choline. Strains were grown to mid-log phase in SC media in the presence of choline prior to plating. Strains are shown after 2 days of growth at 30
oC.

136
Figure S5. (a) Mitochondria, ER, and LDs are delivered to the vacuole during starvation. Wild-type or cho2∆ cells expressing Cit1p-mCherry (a mitochondrial marker), Pho88p-mCherry (an ER marker) or Erg6-mCherry (an LD marker) were constructed. Cells were propagated in SC media or under nitrogen starvation conditions for 3 or 5 days. Protein lysate corresponding to 0.1 OD600 of cell culture were analyzed by western blot analysis using an antibody that recognizes mCherry and TCE as a load control. A representative trial is shown from 3 independent trials. (b) PAS structures increase during lipid

137
imbalance. Quantification of GFP-Atg8p punctae (PAS and autophagosomes) number per budded cell during control, lipid imbalance, and nitrogen starvation conditions. The data are presented as bar graphs of the mean PAS structure per budded cell +/- SEM P-values were obtained from student’s t-test. One representative trial is shown from three independent trials, n>30 for each condition. (c) PAS structures increase during ER stress. Representative fluorescent images GFP-Atg8p in WT cells treated with DMSO (control), TM, DTT, or nitrogen starvation for 4 hrs (WT-N). Images are maximum projections. Bar: 5µm. (d) Quantification of the number of GFP-Atg8p punctae (PAS and autophagosomes) per budded cell in cells described in panel f. The data are presented as bar graphs of the mean PAS number per budded cell +/- SEM P-values were obtained from the Student’s t-test. A representative trial is shown from 3 independent trials, n>30 for each condition. (e) Atg8p expression is increased during ER stress. Western blots of GFP-Atg8p and TCE as load control. Cells and culture conditions were as in (c-d). Protein lysate corresponding to 0.1 OD600 of cell culture was loaded in each lane. A representative trial is shown from 3 independent trials. (f) Ultrastructural analysis of LDs during ER stress. Transmission electron micrographs of a DTT treated cell. N: nucleus. LD: lipid droplet. V: Vacuole. The asterisk marks abnormal membrane aggregates in a magnified region of a cell Bar: 500 nm. (g) ER is not degraded during ER stress. WT cells expressing Pho88p-GFP (ER) were grown to mid log phase in SC media. Cells were then treated with DMSO, 2µg/mL TM, 2mM DTT or nitrogen starvation for 4 hrs (SD-N). Protein lysate corresponding to 0.01 OD600 of cell culture were analyzed using Western blots and antibodies that recognize GFP. Representative trial is shown from 3 independent experiments. (h) Macroautophagy is required for adaptation to the lipid imbalance produced by defects in PC biosynthesis. cho2∆, cho2∆ atg7∆ or cho2∆ atg8∆ cells were propagated in choline-free media for 7 days. Wild-type cells (WT) propagated in SC media were used as a control. Maximum projections of illustrating severe defects in the morphology of ER (Pho88p-GFP; green) and mitochondria (Cit1p-mCherry; red) of cho2∆ atg7∆ or cho2∆ atg8∆ cells under chronic lipid stress. Bar: 5µm. (i-j) LDs accumulate during chronic lipid imbalance in autophagy mutants. (i) Maximum projections of MDH-stained LDs in cho2∆ and cho2∆ atg7∆ cells propagated in choline-free media for 7 days. Bar: 5 µm. (j) Quantitation of MDH-stained LD fluorescence of cells described panel b. Data is represented using skeletal notched dot box plots showing medians, quartiles, and outliers. P-values were calculated using the non-parametric Mann-Whitney test. A representative trial is shown from 3 independent trials, n>25 for each condition.
Figure S6. Heat-Shock aggregates that form during heat stress and lipid stress are different. (a-b) Hsp104p protein aggregates increase drastically during heat shock. Representative fluorescent images showing Hsp104p-mCh labeled protein aggregates in otherwise WT cells before and after 30 minute heat shock at 42 degrees Celsius. Images are maximum projections. Bar: 5µm. (b) Quantification of the number of Hsp104p-mCh aggregate number per budded cell during conditions described in d. The data are presented as bar graphs of the mean protein aggregate number per budded cell +/- SEM P-values were obtained from the Student’s t-test. A representative trial is shown from 3 independent trials, n>30 for each condition. (c) Protein aggregates increase during lipid imbalance. Quantification of Hsp104p-mCh aggregate number per budded cell during conditions described in Fig 4d. The data are presented as bar graphs of the mean Hsp104-mCh aggregate per budded cell +/- SEM P-values were obtained from student’s t-test. One representative trial is shown from three independent trials, n>30 for each condition.

138
Figure S7. RNAseq reveals numerous stress responses activated upon glycerophospholipid imbalance (a) Down regulated RNA transcripts during lipid stress are related to protein synthesis. Revigo plot of GO terms that are down-regulated during acute lipid stress. Data was analyzed as described in Figure 5. (b) Heat shock and protein chaperone related transcripts are up regulated during lipid imbalance. Heatmap showing log2 fold change of autophagy-related transcripts. (c) Autophagy related transcripts are up regulated during lipid imbalance. Heatmap showing log2 fold change of autophagy-related transcripts. (d) Additional example, as in Fig. 7i. (e) Ylr312p OE deforms mitochondria and ER. Representative images of WT cells expressing Pho88p-GFP (ER) and Cit1p-mCh (mitochondria) along with either a vector or GAL1-Ylr312p (untagged) OE construct grown on 2% galactose for 24 hours. Images are max projections taken from 3-D z-stacks. Bar: 5 µm.
139
Supplemental Movie legends Smov. 1. and Smov. 2. ER morphology defects appear prior to mitochondrial defects during acute lipid imbalance. WT (Smov. 1) and cho2∆ (Smov. 2) cells were grown to mid-log phase in choline-containing media, immobilized in a microfluidic chamber and perfused with choline-free SC media. Time-lapse images of Cit1p-mCherry-labeled mitochondria (red) and Pho88p-GFP-labeled ER (green) in WT and cho2∆ cells were obtained every 30 min for 24 hr. Movies shown are representative time-lapse images of maximum projections. Smov. 3. and Smov. 4. LDs form at sites of ER aggregation. WT (Smov. 3) and cho2∆ (Smov. 4) cells were grown to mid-log phase in choline-containing media, immobilized in a microfluidic chamber and perfused with choline-free SC media. Time-lapse images of Erg6p-mCherry-labeled LD (red) and Pho88p-GFP-labeled ER (green) in WT and cho2∆ cells were obtained every 30 min for 24 hr. Movies shown are representative time-lapse images of maximum projections.
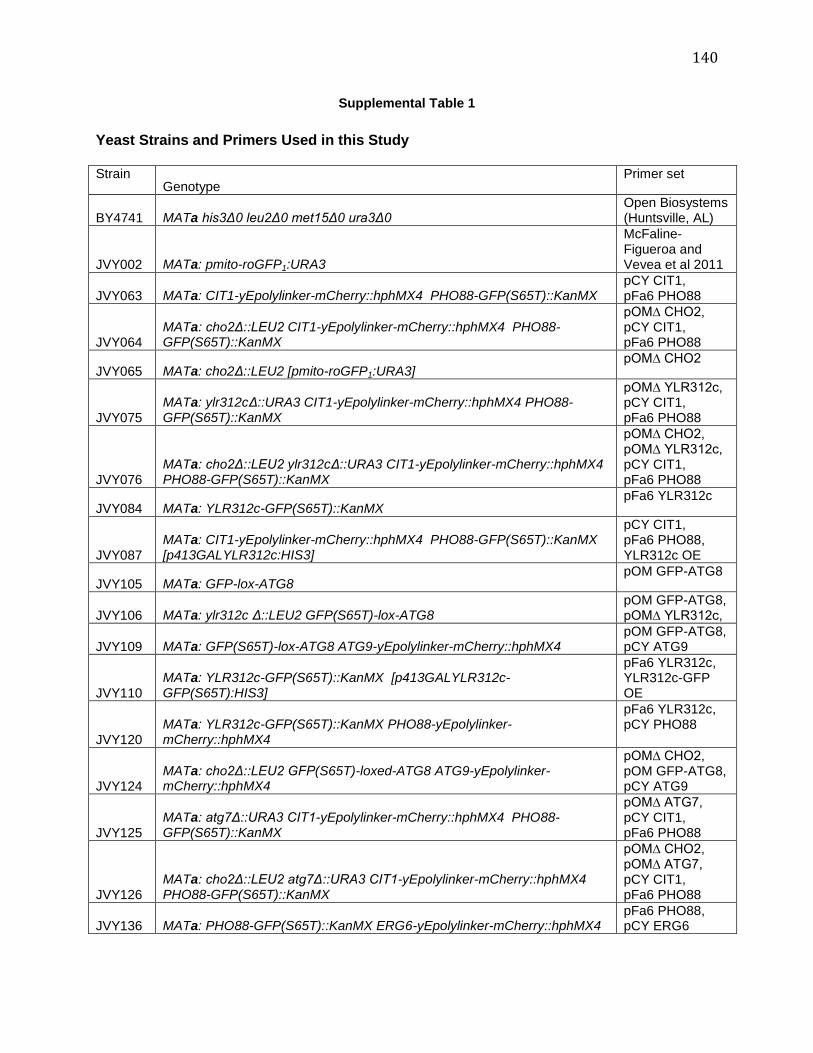
140
Supplemental Table 1
Yeast Strains and Primers Used in this Study Strain
Genotype Primer set
BY4741 MATa his3Δ0 leu2Δ0 met15Δ0 ura3Δ0 Open Biosystems (Huntsville, AL)
JVY002 MATa: pmito-roGFP1:URA3
McFaline-Figueroa and Vevea et al 2011
JVY063 MATa: CIT1-yEpolylinker-mCherry::hphMX4 PHO88-GFP(S65T)::KanMX pCY CIT1, pFa6 PHO88
JVY064 MATa: cho2Δ::LEU2 CIT1-yEpolylinker-mCherry::hphMX4 PHO88-GFP(S65T)::KanMX
pOM∆ CHO2, pCY CIT1, pFa6 PHO88
JVY065 MATa: cho2Δ::LEU2 [pmito-roGFP1:URA3] pOM∆ CHO2
JVY075
MATa: ylr312cΔ::URA3 CIT1-yEpolylinker-mCherry::hphMX4 PHO88-GFP(S65T)::KanMX
pOM∆ YLR312c, pCY CIT1, pFa6 PHO88
JVY076
MATa: cho2Δ::LEU2 ylr312cΔ::URA3 CIT1-yEpolylinker-mCherry::hphMX4 PHO88-GFP(S65T)::KanMX
pOM∆ CHO2, pOM∆ YLR312c, pCY CIT1, pFa6 PHO88
JVY084 MATa: YLR312c-GFP(S65T)::KanMX pFa6 YLR312c
JVY087
MATa: CIT1-yEpolylinker-mCherry::hphMX4 PHO88-GFP(S65T)::KanMX [p413GALYLR312c:HIS3]
pCY CIT1, pFa6 PHO88, YLR312c OE
JVY105 MATa: GFP-lox-ATG8 pOM GFP-ATG8
JVY106 MATa: ylr312c Δ::LEU2 GFP(S65T)-lox-ATG8 pOM GFP-ATG8, pOM∆ YLR312c,
JVY109 MATa: GFP(S65T)-lox-ATG8 ATG9-yEpolylinker-mCherry::hphMX4 pOM GFP-ATG8, pCY ATG9
JVY110 MATa: YLR312c-GFP(S65T)::KanMX [p413GALYLR312c-GFP(S65T):HIS3]
pFa6 YLR312c, YLR312c-GFP OE
JVY120
MATa: YLR312c-GFP(S65T)::KanMX PHO88-yEpolylinker-mCherry::hphMX4
pFa6 YLR312c, pCY PHO88
JVY124 MATa: cho2Δ::LEU2 GFP(S65T)-loxed-ATG8 ATG9-yEpolylinker-mCherry::hphMX4
pOM∆ CHO2, pOM GFP-ATG8, pCY ATG9
JVY125 MATa: atg7Δ::URA3 CIT1-yEpolylinker-mCherry::hphMX4 PHO88-GFP(S65T)::KanMX
pOM∆ ATG7, pCY CIT1, pFa6 PHO88
JVY126 MATa: cho2Δ::LEU2 atg7Δ::URA3 CIT1-yEpolylinker-mCherry::hphMX4 PHO88-GFP(S65T)::KanMX
pOM∆ CHO2, pOM∆ ATG7, pCY CIT1, pFa6 PHO88
JVY136 MATa: PHO88-GFP(S65T)::KanMX ERG6-yEpolylinker-mCherry::hphMX4 pFa6 PHO88, pCY ERG6

141
JVY137 MATa: cho2Δ::LEU2 PHO88-GFP(S65T)::KanMX ERG6-yEpolylinker-mCherry::hphMX4
pOM∆ CHO2, pFa6 PHO88, pCY ERG6
JVY141 MATa: GFP(S65T)-lox-ATG8 CIT1-yEpolylinker-mCherry::hphMX4 pOM GFP-ATG8, pCY CIT1
JVY142 MATa: GFP(S65T)-lox-ATG8 PHO88-yEpolylinker-mCherry::hphMX4 pOM GFP-ATG8, pCY PHO88
JVY143 MATa: GFP(S65T)-lox-ATG8 ERG6-yEpolylinker-mCherry::hphMX4 pOM GFP-ATG8, pCY ERG6
JVY144 MATa: cho2Δ::LEU2 GFP(S65T)-lox-ATG8 CIT1-yEpolylinker-mCherry::hphMX4
pOM∆ CHO2, pOM GFP-ATG8, pCY CIT1
JVY145 MATa: cho2Δ::LEU2 GFP-lox-ATG8 PHO88-yEpolylinker-mCherry::hphMX4
pOM∆ CHO2, pOM GFP-ATG8, pCY PHO88
JVY146 MATa: cho2Δ::LEU2 GFP(S65T)-lox-ATG8 ERG6-yEpolylinker-mCherry::hphMX4
pOM∆ CHO2, pOM GFP-ATG8, pCY ERG6
JVY147 MATa: ylr312c Δ::LEU2 GFP(S65T)-lox-ATG8 ERG6-yEpolylinker-mCherry::hphMX4
pOM∆ YLR312c, pOM GFP-ATG8, pCY ERG6
JVY152 MATa: cho2Δ::LEU2 lro1Δ::LOX dga1Δ::URA3 CIT1-yEpolylinker-mCherry::hphMX4 PHO88-GFP(S65T)::KanMX
pCY CIT1, pFa6 PHO88, pOM∆ CHO2, pOM∆ LRO1, pOM∆ DGA1,
JVY153 MATa: dga1Δ::LEU2 lro1Δ::URA3 CIT1-yEpolylinker-mCherry::hphMX4 PHO88-GFP(S65T)::KanMX
pCY CIT1, pFa6 PHO88, pOM∆ LRO1, pOM∆ DGA1,
JVY160 MATa: HSP104-yEpolylinker-mCherry::hphMX4 PHO88-GFP(S65T)::KanMX
pCY HSP104, pFa6 PHO88
JVY162 MATa: cho2Δ::LEU2 HSP104-yEpolylinker-mCherry::hphMX4 PHO88-GFP(S65T)::KanMX
pOM∆ CHO2, pCY HSP104, pCY PHO88
JVY178 MATa: cho2Δ::LEU2 atg7Δ::URA3 GFP(S65T)-lox-ATG8 ERG6-yEpolylinker-mCherry::hphMX4
pOM∆ CHO2, pOM∆ ATG7, pOM GFP-ATG8, pCY ERG6
JVY179 MATa: cho2Δ::LEU2 pep4Δ::URA3 GFP(S65T)-lox-ATG8 ERG6-yEpolylinker-mCherry::hphMX4
pOM∆ CHO2, pOM∆ PEP4, pOM GFP-ATG8, pCY ERG6
JVY180 MATa: cho2Δ::LEU2 vps4Δ::URA3 GFP(S65T)-lox-ATG8 ERG6-yEpolylinker-mCherry::hphMX4
pOM∆ CHO2, pOM∆ VPS4, pOM GFP-ATG8, pCY ERG6

142
Primer pair name
Forward Reverse
pCY CIT1 ACCGAAAAATACAAGGAGTTGGTAAAGAAAATCGAAAGTAAGAACGGTGACGGTGCTGGTTTA
ATAAACTACTCATTCGTATATGAAAATACGTGTTTGAATAGTCGCATCGATGAATTCGAGCTCG
pFa6 PHO88 AGAAGCTGAAAGAGCCGGTAACGCTGGTGTTAAGGCTGAACGGATCCCCGGGTTAATTAA
AAAACTAGGAAAAAAAAATACTTCGCTTTTGATCGAATCAGAATTCGAGCTCGTTTAAAC
pOM∆ CHO2 CCGCCCTGAATATTTCGAGTGATTTTCTTAGTGACAAAGCTGCAGGTCGACAACCCTTAAT
TAACTACTTCTATTCAAAATGTTAACTTGAATCCTAGTACGCAGCGTACGGATATCACCTA
pOM GFP-ATG8
TAATTGTAAAGTTGAGAAAATCATAATAAAATAATTACTAGAGACATGTGCAGGTCGACAACCCTTAAT
CGCCTTCCTTTTTTCAAATGGATATTCAGACTTAAATGTAGACTTGCGGCCGCATAGGCCACT
pCY ATG9 TTAGGACTTGTTAAAGAGTATTACAAGAAGTCTGACGTCGGAAGAGGTGACGGTGCTGGTTTA
GAATAATATATGCATTTAGGTAAATACGAAAAAGAAAGGAAACAGATCGATGAATTCGAGCTCG
pOM∆ ATG7 GATAACTAAAGTTCATTATATTTCAACAAATATAAGATAATCAAGTGCAGGTCGACAACCCTTAAT
ATTACGGAAAGTGGCACCACAATATGTACCAATGCTATTATATGCGCAGCGTACGGATATCACCTA
pCY ERG6 GAAAACGCCGAAACCCCCTCCCAAACTTCCCAAGAAGCAACTCAAGGTGACGGTGCTGGTTTA
ATCTGCATATATAGGAAAATAGGTATATATCGTGCGCTTTATTTGATCGATGAATTCGAGCTCG
pCY PHO88 AGAAGCTGAAAGAGCCGGTAACGCTGGTGTTAAGGCTGAAGGTGACGGTGCTGGTTTA
AAAACTAGGAAAAAAAAATACTTCGCTTTTGATCGAATCAATCGATGAATTCGAGCTCG
pOM∆ LRO1 GCCATTACAAAAGGTTCTCTACCAACGAATTCGGCGACAATCGAGTGCAGGTCGACAACCCTTAAT
CTTTTCGCTCTTTGAAATAATACACGGATGGATAGTGAGTCAATGGCAGCGTACGGATATCACCTA
pOM∆ DGA1 ACATATACATAAGGAAACGCAGAGGCATACAGTTTGAACAGTCACTGCAGGTCGACAACCCTTAAT
AAATCCTTATTTATTCTAACATATTTTGTGTTTTCCAATGAATTCGCAGCGTACGGATATCACCTA
pOM∆ YLR312c
CATCATGCTATTTTCCATGTTTCCGAGCTTGTCTACTCTTTGCAGGTCGACAACCCTTAAT
TTCTTTTGTTAATTTCATTCTTCATGCTGGGTTTTGGATGGCAGCGTACGGATATCACCTA
YLR312c OE GCGCACTAGTATGTCAGAAGAAGACGATCATTGG
GCGCCTCGAGCTAGTGTTTGCACTTAAAATAATTTTTTTTC
YLR312c-GFP OE
GCGCACTAGTATGTCAGAAGAAGACGATCATTGG
CCGGCTCGAGCTATTTGTATAGTTCATCCATGCCATGTG
pFa6 YLR312c GTCAGAATGCAGGAAAAAAAATTATTTTAAGTGCAAACACCGGATCCCCGGGTTAATTAA
ATTTAAAGGAGGGATATATGACACTCCTACTAAGCAGTCGGAATTCGAGCTCGTTTAAAC
pCY YLR312c GTCAGAATGCAGGAAAAAAAATTATTTTAAGTGCAAACACGGTGACGGTGCTGGTTTA
ATTTAAAGGAGGGATATATGACACTCCTACTAAGCAGTCGATCGATGAATTCGAGCTCG
pCY HSP104 CGATAATGAGGACAGTATGGAAATTGATGATGACCTAGATGGTGACGGTGCTGGTTTA
TATTATATTACTGATTCTTGTTCGAAAGTTTTTAAAAATCATCGATGAATTCGAGCTCG
pOM PEP4 CTAGTATTTAATCCAAATAAAATTCAAACAAAAACCAAAACTAACTGCAGGTCGACAACCCTTAAT
TAGATGGCAGAAAAGGATAGGGCGGAGAAGTAAGAAAAGTTTAGCGCAGCGTACGGATATCACCTA
pOM VPS4 GGAAGACAAAAATAAAGCAGCATAGAGTGCCTATAGTAGATGGGGTGCAGGTCGACAACCCTTAAT
TTTTTATTTTCATGTACACAAGAAATCTACATTAGCACGTTAATCGCAGCGTACGGATATCACCTA

143
Chapter V
Identification of sarcoplasmic reticulum dysfunction in a congenital muscular dystrophy
caused by glycerophospholipid imbalance

144
Abstract
Congenital muscular dystrophies (CMD) present at birth with hypotonia and weakness and
many have neurological components. These are a diverse group of dystrophies almost
exclusively inherited in recessive fashion. A newly identified CMD results from loss of function
choline kinase β (CHKB). This dystrophy presents at birth and develops as skeletal muscle
weakness, intellectual disability, with death as early as 2 years of age from advanced
cardiomyopathy. Here, we identify sarcoplasmic reticulum (SR) dysfunction in the form of
elevated calcium sparks in skeletal muscle as a result of leakage of the Ryanodine Receptor
(RyR), the Ca2+ channel that releases Ca2+ from the SR during muscle contraction. Specifically,
we detect calcium sparks during short-term treatment with a choline kinase inhibitor in C2C12
myotubes and early in disease progression in intact skeletal muscle fibers in a mouse model for
the disease. These studies raise the possibility of using ryanodine receptor stabilizing
compounds as a therapeutic intervention.

145
Introduction
During skeletal muscle contraction, depolarization of the sarcolemma gives rise to an
action potential, which propagates in all directions at the surface of a muscle fiber and within
muscle fibers at T-tubules, invaginations of the sarcolemma at the A- and I-band interface. The
action potential activates the voltage sensitive L-type Ca2+ channel (Dihydropyridine receptor
(DHPR)). In skeletal muscle, ryanodine receptors (RyRs) are in physical contact with DHPRs
and activation of DHPR results in activation of RyRs, which leads to RyR-mediated release Ca2+
from the SR. The resulting increase in cytosolic Ca2+ levels leads to Ca2+ binding to troponin-C,
which results in binding of myosin to actin and force generation that shortens the sarcomere and
causes muscle contraction. RyR mediated release of Ca2+ terminates after the action potential
ceases. The sarcoplasmic reticulum (SR) Ca2+ transport ATPase (SERCA) then pumps Ca2+
back into SR, which returns myoplasmic Ca2+ to resting levels and inhibits force generation by
actin and myosin.
Muscular dystrophies and myopathies consist of a varied collection of diseases affecting
the normal function of striated muscle, and in many cases, of neurons. These diseases are
caused by diverse groups of genetic lesions. Muscular dystrophies consist of mutations that
primarily affect the membranes and supporting protein complexes of striated muscle. These
include mutations in the dystrophin glycoprotein complex (DGC) which links the cytoskeleton to
the extracellular matrix in muscle [280, 281], the sarcoglycan complex which is a subcomplex in
the DGC, nuclear laminins, which affects nuclear envelope architecture [282], and many others
[283]. These mutations, and others, cause forms of congenital muscular dystrophy (CMD),
Duchenne’s and Becker’s muscular dystrophy (DMD/BMD), limb-girdle muscular dystrophy
(LGMD), Emery Dreifuss muscular dystrophy (EDMD), myotonic dystrophy (DM1 or DM2), and
fascioscapulohumeral muscular dystrophy (FSMD) [284]. Dystrophies can present at any age
and result in muscle weakness and degeneration.

146
Myopathies are produced by mutations that primarily affect the contractile apparatus of
striated muscle [285], but are also caused by mutations in the ryanodine receptor (RyR1) [286].
One myopathy that is caused by mutations in the RyR isoform that is abundant in skeletal
muscle (RyR1) is central core myopathy or disease (CCD). It is characterized by a central core
within muscle fibers where mitochondria and SR are depleted [287]. This myopathy often
presents in childhood with hypotonia and delayed motor milestones, which varies in severity.
However, it also may present later in life with proximal or generalized weakness [288].
Studies from the Nishino laboratory revealed a novel form of CMD in 4 patients from
unrelated families [289]. Dystrophin, α-sarcoglycan, β-dystrophin and merosin (laminin α 2)
were not affected in these individuals. However, all patients had muscle weakness and
hypotonia from early infancy, dystrophic changes in skeletal muscle, cardiac myopathy, and
severe intellectual disability. One feature that distinguishes this CMD is a defect in
mitochondrial distribution. Mitochondria in skeletal muscle of CMD patients are abnormally
enlarged, and mislocalized to the periphery of the muscle fiber, depleting them from the center
of the muscle fiber. Interestingly, mitochondrial respiration and DNA are not severely
compromised. However, muscular dystrophy, as evidenced by variability in fiber diameter,
endomysial fibrosis, and internalized nuclei, occurs primarily in cells with defects in
mitochondrial morphology and distribution. Thus, muscular dystrophy is linked to defects in
mitochondrial distribution. The genetic cause of this newly identified CMD went unknown for
eight years.
Later studies from the Cox laboratory at the Jackson Laboratory revealed that this novel
CMD is due to a defect in PC biosynthesis [290]. They found that mutation of choline kinase β
(CHKB), the protein that catalyzes the initial step in de novo PC biosynthesis, resulted in a novel
muscular dystrophy they termed rostral-to-caudal muscular dystrophy (rmd). Although the
pattern of affected tissue is different in mice than it is in humans, due to differences in isoform

147
expression, the histopathology of affected muscle is strikingly similar to that of the CMD patients
described by Dr. Nishino, primarily the characteristic mitochondrial abnormalities.
This finding prompted Nishino and colleagues to screen for mutations in CHKB in 15
CMD patients. They found that CHKB was mutated in all cases [241]. Consistent with this,
CHKB activity is lost and PC is depleted in skeletal muscle of these CMD patients. Thus,
Nishino and colleagues identified the first CMD that is linked to an imbalance in phospholipid
biosynthesis. I refer to this disease as CHKB CMD. Recently, a CHKB CMD patient was
identified in the United States [291].
Although there is a clear link between mutation of CHKB and CMD, it is not clear how
loss of CHKB could lead to muscular dystrophy or defects in mitochondrial morphology and
distribution. Furthermore, it is unclear why or how mitochondria mislocalize, why mitochondria
function is not impaired, how mitochondria contribute to this CMD, and if mitochondria are a
viable therapeutic target.
To guide research into this CMD, we used the studies carried out in budding yeast
carrying a mutation in CHO2, one of the yeast homologues of PEMT, which catalyzes the
conversion of PE to PC (Chapters III and IV). Deletion of CHO2 results in phospholipid
imbalance that is similar to that observed in rmd mice and CHKB CMD patients. In skeletal
muscle from rmd mice and CHKB CMD patients, there is a decrease in PC and altered PC to
PE ratios [241] [292]. When cho2∆ yeast are propagated on medium supplemented with
choline, they synthesize PC by the Kennedy pathway and exhibit lipid profiles that are similar to
those of wild type cells. However, transfer of cho2∆ cells to choline-free medium results
inhibition of PC biosynthesis, a decrease in PC, and altered PC to PE ratios.
We observe defects in mitochondrial morphology and distribution in PC-deficient cho2∆
yeast. In wild type yeast, mitochondria are long tubular structures that align along the mother-
bud axis and accumulate in the bud tip. Mitochondria in PC-deficient cho2∆ cells are large
spherical structures that exhibit abnormal accumulation in the mother cell. Thus, defects in PC

148
biosynthesis results in defects in the morphology and distribution of mitochondria in yeast, the
rmd mouse model for CHKB CMD and CHKB CMD patients.
Interestingly, mitochondria are not the only organelles that are compromised when PC
synthesis is disrupted. PC-deficient cho2∆ yeast also exhibit defects in the morphology and
distribution of ER. In wild type yeast, ER exists in two structures. Cortical ER (cER) is an ER
reticulum that underlies the plasma membrane. Nuclear ER (nER) is ER that compromises the
outer nuclear envelope. ER becomes abnormally enlarged, spherical structures that aggregate
with mitochondria in PC-deficient cho2∆ yeast. Furthermore, long-term time-lapse imaging of
mitochondria and ER in PC deficient cho2∆ cells revealed that ER begins to aggregate 8 hours
after inhibition of PC biosynthesis, with ER aggregation occurring first near the nucleus and later
at the cell cortex. Aggregation of mitochondria is evident within 12 hours after PC biosynthesis
is perturbed. Most of the mitochondrial aggregation occurs in close proximity to pre-existing ER
aggregates. Thus, ER is more sensitive to the lipid imbalance produced by defects in PC
biosynthesis compared to mitochondria. This raises the possibility that the primary defect in
CHKB CMD is in ER and/or ER proteins in CHKB CMD.
Calcium sparks are the smallest detectable local calcium events, which are due to
release of calcium into the myoplasm by opening of one or more RyRs in resting muscle fibers
[293]. This is caused by RyR dysfunction and post-translational modifications of RyR which
inhibit its interaction with calstabin, a protein that stabilizes the RyR in the closed state.
Although calcium sparks are critical for signal transduction during heart development, elevated
levels of calcium sparks occur in muscular dystrophies (e.g. Duchenne Muscular Dystrophy;
CCD and Multi-mini core Disease), ageing, and cardiomyopathy (e.g. sudden cardiac death)
[294] [295] [296].
We found that mitochondria are not the only organelles that are mislocalized in CHKB
CMD. Using different ER and SR markers; I find that the ER and SR are mislocalized and
disorganized in skeletal muscle from the rmd mouse model for CHKB CMD and from CHKB
149
CMD patients. Super-resolution imaging revealed broad disorganization of the RyR, indicating
SR dysfunction. We found that treatment of resting C2C12 myotubes with a choline kinase
inhibitor results in calcium transients under conditions where mitochondria are unaffected.
Furthermore, our preliminary data revealed elevated levels of calcium sparks in intact skeletal
muscle fibers isolated from rmd mice. These studies support a new model for CHKB CMD
disease which includes SR dysfunction in disease progression. Moreover, they identify the RyR
as a possible therapeutic target.

150
Materials and Methods
Culture conditions
C2C12 cells were grown in growth media (40% DMEM, 40% F10, 20% FBS, 100U/mL
penicillin/streptomycin, and FgF (2.5 ng/ml). Once cells reached confluence on MatTek 35MM
glass-bottomed Petri dishes (MatTek corp, Ashland, MA), growth media was switched to fusion
media (48% DMEM, 48% F10, 2% FBS, and 100U/mL penicillin/streptomycin) to differentiate
the C2C12 myoblasts into myotubes. After 5 days in fusion media, myotubes were easily
observable. To induce lipid imbalance, differentiated myotubes were incubated with CK37 (EMD
Millipore) at 25 µM for 2 hours prior to Fluo-4 AM loading.
Intact gastrocnemius muscle fibers were surgically removed and placed in a dissection solution
containing 0.2% type IV collagenase for 45 min at 37 °C. After two washes, muscle fibers were
gently dissociated by several passages through a series of Pasteur pipettes of gradually
decreasing diameter. Individual FDB muscle fibres were plated onto MatTek 35MM glass-
bottomed Petri dishes (MatTek corp, Ashland, MA), containing an isotonic Tyrode sol.
Immunofluorescence
Frozen muscle samples were obtained from Dr. Gregory Cox (mouse) or Dr. Ichizo Nishino
(human). These samples were sectioned to 5 microns on slides by in house histopatholgy
services. Our immunofluorescence protocol is based off that of Dr. Kurenai Tanji. Sections were
allowed to dry at room temperature for 30 minutes before fixing in 3.7% formaldehyde + CaCl
pH 7.2 fixative. Slides were then washed in modified PBST (pH 7.4) for 8 min 2x and serially
dehydrated with ethanol at concentrations of 50%, 70%, 80%, 95%, and 100%. And washed 2x
again. Slides were then incubated in blocking solution (1:1 TBST:NGS) for one hour at room
temperature, and washed 2x again. Primary antibodies were prepared in solution with TBST-
NGS and incubated overnight at 4OC. Slides were washed 2x again, incubated with secondary
Alexa/TBST-NGS for an hour at room temperature away from light. Slides were washed 2x

151
again and mounting solution was added and the slide was sealed with cover slip and clear nail
polish before imaging.
Reagents
Antibodies used were, RyR antibody clone 5029y rabbit (1:200) (Gift from Dr. A Marks lab),
DHPR antibody, mouse (1:100) (Abcam, Eugene, OR #ab2864), Tom20 (F10) antibody, mouse
(1:10) (santa cruz biotech., Santa Cruz, CA #sc-17764), Sec61 (H-296) antibody rabbit (1:10)
(santa cruz biotech., Santa Cruz, CA #sc-25553). Secondary antibodies included Alexa Fluor
647 anti mouse (Life Technologies, Carlsbad, CA), and Alexa Fluor 594 anti rabbit (Life
Technologies, Carlsbad, CA). Chemicals used were Ryanodine (Tocris, Minneapolis, MN;
#1329), CK37 (N-(3,5-dimethyl-dimethylphenyl)-2-[[5-(4-ethylphenyl)-1H-1,2,4-triazol-3-
yl]sulfanyl]acetamide) (EMD Millipore, Billerica, MA; CAS 1001478-90-5), and Caffeine (Sigma-
Aldrich, St Louis, MO; C0750), Fluo-4 AM (Life Technologies, Carlsbad, CA; F-14201),
MitoTracker Red (Life Technologies, Carlsbad, CA; M-7512).
Analysis of calcium release
Calcium loading
C2C12 cells were loaded with 1µM Fluo-4 AM and 50 nM MitoTracker Red in Tyrode solution at
room temperature for 30 minutes. Cells were washed once with Tyrode solution and incubated
at room temperature for 30 minutes in phenol free DMEM +2% FBS +Pen/Strep. Intact mouse
muscle fibers were loaded with the same protocol but at 37OC and 5% CO2.
Calcium release
To directly stimulate calcium release from the SR 10 mM caffeine was added to Fluo-4 AM
loaded cells. To simulate E-C coupling, the sarcolemma was depolarized by the addition of 60
mM KCl. Calcium sparks were recorded by line scan as described below, without stimulating
C2C12 or intact muscle fibers. To inhibit Ryanodine receptor mediated calcium release,
Ryanodine (Tocris, Minneapolis, MN) was added to cells at 100 µM.
Imaging conditions

152
For mitotracker red imaging, cells were imaged using 561 nm excitation acquiring either a single
slice by a scanning confocal, or a Z-stack acquired by spinning disk confocal. To measure
whole cell calcium transients stimulated by KCl or Caffeine, images were collected on a
spinning disk using a 488 nm excitation. Single slices were obtained on average every 75
milliseconds. The Nikon A1 confocal was used in line scan mode to measure un-stimulated
calcium sparks in C2C12 cells. A 200 micron line scan was acquired at 500 Hz for 10 seconds.
For calcium spark measurements in intact muscle fibers, the inverted Leica SP2 microscope at
Jackson Labs in Bar Harbor ME was used. Here, variable line lengths were acquired at 400 Hz
for 10 seconds.
Microscopes
Fluorescent images were acquired on either an inverted Nikon Ti Eclipse A1 or spinning disk
confocal microscope with an Evolve EMCCD (Photometrics, Tuscon, AZ) camera and 40x/0.75
or 20x/0.75 Plan Apo Lambda objective running NIS Elements 4.20 (Nikon, Melville, NY).
Stimulated calcium release was quantified using NIS elements software, calcium spark data
was analyzed using SparkMaster plugin for ImageJ (NIH, Bethesda, MA). MitoTracker images
were imported into Volocity libraries (Perkin Elmer, Waltham, MA) for deconvolution and
quantitation. Additionally, an inverted Leica SP2 microscope 20x/0.7 objective, at Jackson Labs
in Bar Harbor ME was used. Structured Illumination images were acquired on a Nikon Ti-E with
Perfect Focus System and SIM Illuminator with SIM Microscope Enclosure with an EM-CCD
Camera iXon DU897 (Andor) and Apo TIRF 100X/1.49 objective.
Images were collected and/or image processing and analysis for this work was performed in the
Confocal and Specialized Microscopy Shared Resource of the Herbert Irving Comprehensive
Cancer Center at Columbia University, supported by NIH grant #P30 CA013696 (National
Cancer Institute).

153
Results
Defects in the morphology of mitochondria and ER in a mouse model for CHKB CMD and
skeletal muscle from CHKB CMD patients.
The rmd mice harbor a loss of function mutation in the murine homologue of CHKB.
These mice exhibit defects in mitochondrial morphology and distribution similar to those
observed in CHKB CMD patients. We confirmed that loss of CHKB activity results in defects in
the morphology and localization of mitochondria in rmd mouse hindlimb muscle. In addition, we
find that there are defects in ER from rmd mice (Fig. 1a-b).
Cross sections of skeletal muscle from rmd mice, revealed that the mitochondria and ER
are excluded from the center of muscle fibers. These defects in localization of ER and mito-
chondria are not due to defects in the sarcomere: EM studies in rmd mice and CHKB patients
reveal that sarcomere structure is preserved [290] [241]. Rather, these data indicate that defects
in PC biosynthesis result in defects in the morphology of not only mitochondria, but also SR in
skeletal muscle of the rmd mouse model for CHKB CMD.
The defects observed in the rmd mouse are also observed in the human disease. We
observed defects in the localization of mitochondria and ER in skeletal muscle sections from a
CHKB CMD patient. This patient is a Japanese woman who carries complex heterozygous
mutations in CHKB and was 28 years old at the last follow-up. She was floppy at birth,
experienced developmental delays, intellectual disability and seizures, and has muscle
pathologies, including necrotic fibers, regenerative fibers, endomysial fibrosis, along with
documented mitochondrial morphology defects [241].

154
Figure 1. Mitochondria and ER are mislocalized in skeletal muscle from rmd mice and CHKB CMD patients. (a-c) Immunofluorescence of 5 micron skeletal muscle sections using antibodies directed against mitochondria (Tom20) and ER (Sec61α). (a) Homogenous and even staining of mitochondria and ER. Skeletal muscle section of gastrocnemius from 55 day old female littermate control. (b) Aggregated and mislocalized staining of mitochondria and ER. Skeletal muscle section of gastrocnemius from 55 day old female rmd mouse. (c) Homogenous and even staining of mitochondria and ER. Skeletal muscle section of unknown muscle from 41 yr old male human control. (d) Aggregated and mislocalized staining of mitochondria and ER. Skeletal muscle section of soleus from 8 yr old female CHKB CMD patient (patient 3; Mitsuhashi et al Am J Hum Gen 2011). (a and b) Scale bar 15 µm (c and D) Scale bar 30 µm
155
Our analysis of a soleus muscle biopsy taken when the patient was 8 years old revealed
defects in the localization of mitochondria and ER similar to those observed in the rmd mouse
(Fig. 1c-d). In a cross section of soleus muscle from an unaffected individual, mitochondria and
ER are resolved as small punctate structures that are uniformly distributed in the muscle fiber.
Consistent with previously published reports, mitochondria are enlarged punctate structures that
are depleted in the center of muscle fibers from the CHKB CMD patient. In addition, ER is
abnormal in the CHKB CMD patient: it is resolved as abnormally large punctate structures that
co-localize with the large punctate mitochondria and are depleted in the center of the muscle
fiber. Thus, we obtained preliminary data that the defects in localization of mitochondria and ER
observed in yeast and mouse models for CHKB CMD also occurs in a CHKB CMD patient.
Defects in the localization of the ryanodine receptor implicates SR dysfunction in a
mouse model for CHKB CMD
We chose to investigate the localization of the Ryanodine receptor (RyR), an ion
channel that is critical for muscle contraction. We chose this because RyRs are large integral
SR membrane proteins that may be sensitive to phospholipid imbalance, mutations in RyR that
cause CCD, produce similar defects in organelle morphology and distribution and muscle
dysfunction that are characteristic of CHKB CMD, and finally, mutations in RyR affect all of the
organ systems that are compromised in CHKB CMD. In cross sections of healthy skeletal
muscle RyR immunofluorescence is resolved as a fenestrated network spanning the entirety of
the muscle fiber. We examined RyR localization in skeletal muscle from rmd and littermate
control mice aged 55 days. In littermate control mice, traditional laser scanning confocal
microscopy revealed an intricate network of SR in cross sections of skeletal muscle (Fig. 2a).
We took advantage of new super resolution microscopy (N-SIM) and were able to observe the
three dimensional structure of this network in unprecedented detail (Fig. 2b). In rmd mice
however, this network is disrupted (Fig. 2c-d). Using traditional confocal microscopy, we

156
observed not only a disrupted network, but an enlargement and apparent clumping or
aggregating of SR in most muscle fibers. Super resolution techniques confirmed this and
allowed us to examine these aggregates in three dimensions.
Figure 2. Ryanodine receptor is disorganized in skeletal muscle from rmd mice. (a-d) Immunofluorescence of 5 micron skeletal muscle sections using polyclonal antibodies directed against ryanodine receptor (RyR1/2/3). (a-b) Ryanodine receptor IF reveals fenestrated network of SR in healthy skeletal muscle. (a) Skeletal muscle section of gastrocnemius from 55 day old female littermate control acquired using conventional confocal microscopy. (b) Skeletal muscle as in (a), but acquired using Nikon Super Resolution Microscopy (N-SIM). (c-d) Ryanodine receptor IF reveals loss of the healthy fenestrated network of SR normally present in healthy skeletal muscle. (c) Skeletal muscle section of gastrocnemius from 55 day old female rmd mouse acquired using conventional confocal microscopy. (d) Skeletal muscle as in (c), but acquired using Nikon Super Resolution Microscopy (N-SIM). (a and c) Scale bars
12 µm (b and d) Scale bars 6 µm.
Short-term inhibition of PC biosynthesis results in Ca2+ sparks in C2C12 myotubes.
To determine whether RyR may be the underlying cause of CHKB CMD, we tested the
effect of short-term inhibition of PC biosynthesis in the C2C12 muscle cell line using CK37.
CK37 was identified as a competitive inhibitor for choline kinase α using an in silico screen for

157
small molecules that interact with the choline binding domain of choline kinase. It inhibits
purified recombinant choline kinase α and reduces the steady state levels of phosphocholine
and PC in HeLa cells at micromolar concentrations [297].
CK37 treatment can trigger apoptosis, as cells require choline kinase activity. We
treated C2C12 myotubes with CK37 25 µM for two hours, conditions that do not disrupt C2C12
myotube morphology as assessed by transmitted light microscopy. We first assessed
mitochondrial morphology, distribution and membrane potential (∆ψ) in CK-37 treated and
untreated C2C12 myotubes using MitoTracker Red, a red fluorescent, membrane permeable
dye that stains mitochondria in living cells and accumulates in the organelle in a ∆ψ-dependent
manner (Fig. 3a-b). Mitochondria in C2C12 myotubes are punctate structures and tubules that
are excluded from the nucleus and align along the long axis of the myotube. Short-term
treatment with the choline kinase inhibitor has no obvious effect on mitochondrial morphology or
staining of mitochondria by MitoTracker Red (Fig. 3a-b). Thus, short term inhibition of choline
kinase, does not produce global defects in mitochondrial morphology or distribution, or loss of
mitochondrial ∆ψ.
There is a functional coupling of RyR and DHPR in C2C12 myotubes [298]. Therefore,
we tested the effect of CK37 treatment on Ca2+ release and re-uptake in C2C12 myotubes using
Fluo-4 AM and confocal microscopy. We confirmed that treatment with caffeine (which
stimulates RyRs) or KCl (which stimulates depolarization of the sarcolemma) results in rapid
increases and decreases in cytosolic Ca2+ levels in C2C12 myotubes. Moreover, we find that
short-term CK37 treatment does not affect caffeine- or KCl-induced Ca2+ release and re-uptake.
Similar results were obtained with carbachol treatment, which stimulates IP3 receptors (data not
shown). Since short-term inhibition of PC biosynthesis does not inhibit stimulated release and
re-uptake of Ca2+ in C2C12 myotubes, it is clear that the conditions used do not result in global
defects in the RyR, SERCA, or interaction of RyR with the DHPR.

158
Figure 3. Short term treatment of C2C12 myotubes with a choline kinase inhibitor do not have obvious defects. (a-b) Mitochondrial morphology and membrane potential is unchanged. (a) MitoTracker Red stained cultures of DMSO (left) and CK37 (right) treated myotubes after 5 days of differentiation. Scale bars 10 µm. (b) Quantitation of MitoTracker Red fluorescence intensity showing no change. (c-f) Stimulated calcium release from the SR is unchanged. (c) Change in fluo-4 AM intensity of DMSO treated myotubes when stimulated with caffeine. (d) Change in fluo-4 AM intensity of Ck37 treated myotubes when stimulated with caffeine. (e) Change in fluo-4 AM intensity of DMSO treated myotubes when stimulated with KCl. (f) Change in fluo-4 AM intensity of Ck37 treated myotubes when stimulated with KCl.
Short-term inhibition of PC biosynthesis results in Ca2+ sparks in C2C12 myotubes
We tested the effect of short-term inhibition of PC biosynthesis results in RyR leakage
in resting C2C12 myotubes using Fluo-4 AM (a cell permeable molecule that exhibits increased

159
green fluorescence upon binding to Ca2+) and confocal line scanning (Fig. 4a). In untreated
C2C12 cells, we detect transient increases in cytosolic Ca2+ levels (sparks), which have
amplitudes and durations that are similar to those described previously [299]. Moreover, we find
that treatment with the choline kinase inhibitor CK37 results in a 4-fold increase in Ca2+ sparks
and an increase in the amplitude of the Ca2+ sparks without affecting the duration or width of the
Ca2+ sparks (Fig. 4b-d).
Figure 4. Inhibition of PC biosynthesis results in calcium sparks in resting C2C12 myotubes. (a) Ryanodine dependent Ca
2+ sparks increase upon PC defects. Kymographs of line scans of Fluo-4 AM
measured cytosolic Ca2+
levels in C2C12 myotubes that were incubated in the presence or absence of CK37 either in the presence or absence of ryanodine (100 µM). (b-d) Treated myotubes have an increase number and intensity of Ca
2+ sparks. The amplitude, full width and duration of Ca
2+ sparks in
untreated (black bars) or CK-37-treated (green bars) C2C12 myotubes.
To determine whether the Ca2+ transients are due to leakage at RyRs, we treated
C2C12 myotubes with ryanodine, an alkaloid that binds to RyRs with high affinity and closes
RyR channels upon treatment at micromolar concentrations [300]. We found that ryanodine
treatment blocks the Ca2+ sparks (Fig. 4a). Thus, we obtained evidence that short-term inhibition
of PC biosynthesis in C2C12 myotubes results in RyR leakage, under conditions where
160
mitochondrial morphology, distribution, or ∆ψ are unaffected, and caffeine- or KCl-induced Ca2+
release by RyR, and Ca2+ uptake by SERCA were not affected. Thus, RyR leakage is the first
phenotype observed upon inhibition of PC biosynthesis in cultured myotubes.
RyR leaks in skeletal muscle fibers from the rmd mouse model for CHKB CMD.
We tested whether RyRs are leaky in dissociated intact muscle fibers from the rmd
mice and unaffected littermate controls. Previous studies indicated that mitochondria are
severely compromised in skeletal muscle of 8-week old rmd mice. At this stage in disease
progression, mitochondrial respiratory activity, ATP synthesis, coenzyme Q levels are
decreased and mitochondrial ROS production is increased. Moreover, mitochondria are
damaged beyond repair and targeted for degradation by mitophagy [301].
To identify early events in disease progression, which are more likely to be the cause
of disease, we studied RyR function in intact muscle fibers obtained from 4-week old rmd mice
and littermates. At this stage in disease progression, early histological changes including central
nuclei and defects in mitochondrial morphology are evident. However, there is no loss of motor
control or muscle fiber loss [290]. To assess mitochondrial morphology, distribution and
membrane potential (∆ψ), we stained isolated muscle fibers from rmd mice and unaffected
littermates with MitoTracker Red (Fig. 5a). The fluorescence intensity of MitoTracker Red-
stained mitochondria was similar in skeletal muscle fibers from 4-week old rmd mice and their
littermates. Thus, at this stage of disease progression, the ∆ψ of the organelle, which is an
indicator of mitochondrial function, is not severely affected. However, mitochondrial morphology
and distribution are affected: mitochondria in intact muscle fibers from the rmd mouse are long
tubular structures that align along the long axis of the muscle fiber not at their normal
localization on either side of the triad.
We tested for RyR leakage in muscle fibers from 4-week old rmd mice using Fluo-4
AM and confocal line scanning. We confirmed previous findings that Ca2+ sparks are absent in

161
healthy, intact skeletal muscle fibers, due to tight regulation of RyRs by DHPR [302]. In addition,
our preliminary results indicate that muscle fibers from the rmd mouse exhibit elevated cytosolic
Ca2+ levels and elevated Ca2+ spark levels (Fig. 5b). Thus, we obtained evidence for RyR leaks
and defects in Ca2+ homeostasis in the rmd mouse model for CHKB CMD at an early stage in
disease progression, which raises the possibility that RyR leakage may be the basis for CHKB
CMD.
Figure 5. Intact skeletal muscle fibers from rmd mice exhibit calcium sparks. (a) Mitochondrial morphology is negatively affected in 30 day old rmd mice. MitoTracker Red staining of littermate (top) and rmd (bottom) intact skeletal muscle fibers isolated from gastrocnemius. (b) Calcium sparks are present in 30 day old rmd mice. Fluo-4 AM fluorescence intensity along a collected line scan revealing sparks in rmd tissue (red) but not littermate control (green).

162
Discussion
Congenital muscular dystrophy (CMD) is one of the most frequent dystrophies of
childhood, and is characterized by neonatal muscle hypotonia, muscle weakness, stiff or frozen
joints of variable severity and delayed motor milestones. Merosin-deficient CMD is a severe
form of CMD that is linked to a mutation in laminin 2, and usually does not involve the central
nervous system. A novel form of merosin-positive, autosomal recessive CMD was identified,
which has severe intellectual disability, in addition to all of the symptoms associated with
merosin-positive CMD [289]. Recent studies indicate that this CMD is due to mutation of choline
kinase beta (CHKB), the enzyme that catalyzes the initial step in phosphatidylcholine (PC)
biosynthesis in the Kennedy pathway [241].
One of the hallmarks of CHKB CMD is a defect in mitochondrial distribution. In cross-
sections of skeletal muscle in unaffected individuals, mitochondria are small punctuate,
uniformly-distributed structures. In CHKB CMD patients, mitochondria are enlarged and localize
to the muscle fiber periphery. Myofibrillar degeneration occurs predominantly in areas where
mitochondria are depleted. Thus, there is a link between muscle fiber necrosis and defects in
mitochondrial morphology and distribution.
We find that mitochondria are not the only organelle affected by the lipid imbalance. We
observe defects in the morphology and localization of ER, and an abnormal aggregation of
mitochondria and SR in skeletal muscle from a murine model for CHKB CMD and from a CHKB
CMD patient. We also found that the first phenotype observed upon inhibition of PC synthesis in
C2C12 myotubes is a defect in SR function in Ca2+ homeostasis. Specifically, short-term
treatment with a choline kinase inhibitor results in an increase of Ca2+ transients (sparks) in the
resting C2C12 myotubes. These Ca2+ spikes are a result of dysfunctional ryanodine receptors
(RyRs), channels in terminal cisternae that release Ca2+ from SR during muscle contraction. We
also detect Ca2+ sparks, and elevated cytosolic Ca2+ in intact skeletal fibers isolated from the

163
mouse model for CHKB CMD.
Previous studies indicate that RyR leakage in skeletal muscle is sufficient to produce
defects in organelle morphology, muscular dystrophy and clinical consequences that occur in
CHKB CMD. Central Core Disease (CCD) and Multi-mini Core Disease (MmD) are CMDs
caused by mutations in the muscle isoform of RyR and RyR leakage. The histological hallmarks
of CCD and MmD are similar to those of CHKB CMD: central or multiple cores within muscle
fibers where mitochondria and SR are depleted. Muscular defects in CCD and MmD are also
similar to those observed in CHKB CMD: patients are floppy at birth, with muscle weakness and
ambulatory delays from early infancy [303].
Other studies reveal that RyR leakage can produce the muscle defects and dystrophy
that occur in CHKB CMD. Elevated cytosolic Ca2+ resulting from RyR leakage activates Ca2+-
dependent proteases and alters Ca2+ signaling [304]. It also results in Ca2+ overload within
mitochondria, a decrease in mitochondrial membrane potential (∆Ψ) and increased
mitochondrial ROS production and oxidative damage [296]. Indeed, Ca2+ overload in
mitochondria is sufficient to produce defects in mitochondrial distribution, and clinical
consequences similar to those observed in CHKB CMD. Specifically, mutation of MICU1, a
component of the mitochondrial Ca2+ channel, results in Ca2+ overload in mitochondria,
depletion of mitochondria in the center of skeletal muscle fibers, muscular dystrophy, as well as
movement and cognitive disorders in humans [305],
These studies support a molecular mechanism underlying CHKB CMD whereby defects
in PC biosynthesis and the associated lipid imbalance directly or indirectly results in
destabilization of RyRs. The resulting elevated cytosolic Ca2+ levels leads to Ca2+ overload in
mitochondria, which disrupts the function and morphology of the organelle and results in
elevated mitochondrial ROS production, which in turn compromises muscle function and
integrity.
Ryanodine receptor dysfunction arises from destabilization of RyR interactions with

164
calstabin, promoting channel opening and calcium leak. S107 is a benzothiazepine derivative
that enhances RyR-calstabin interactions, stabilizing the closed state of RyR. Unlike other RyR-
stabilizing small molecules (e.g. JTV519), S107 is highly specific for RyR and has no effect on
hundreds of enzymes, ion channels and signal transduction molecules [295]. Oral administration
of S107 reduces skeletal muscle defects in mice subjected to severe exercise, muscular
dystrophy models, and advanced age. It also reduces cardiomyopathy in stress-induced
ventricular arrhythmias, and decreases seizures and deficits in learning, memory and LTP in
mice with mutations in RyR and a mouse model for RyR-associated stress-induced cognitive
dysfunction. In all cases, S107 treatment promotes binding of RyR to calstabin, reduces RyR
leakage and reduces post-translational modifications of RyRs that either lead to or are produced
by changes in Ca2+ homeostasis and elevated oxidative stress [295] [306] [307] [294] [308].
Thus, S107 treatment may promote function in skeletal muscle and other organ systems that
are compromised in CHKB CMD.
Finally, because RyRs are present and critical for cellular function in cardiac muscle, and
the cortical and hippocampal regions of the brain, these studies may serve as a foundation for
understanding and treating the intellectual disability and cardiomyopathy that are associated
with CHKB CMD. Specifically, mutations in RyRs result in cardiac muscle dysfunction and
cardiomyopathies including exercise-induced sudden cardiac death, heart failure and
arrhythmias [309]. Similarly, blocking RyRs with ryanodine blocks the induction of long-term
potentiation (LTP), the long-lasting enhancement in signal transmission between neurons and a
major component underlying learning and memory. Conversely, treatment with caffeine, a RyR
agonist, facilitates LTP induction [310] [311] [312]. Moreover, mutations in RyRs result in stress-
induced cognitive dysfunction [308] and RyR control of Ca2+ release has been linked to defects
in LTP in mouse models for Alzheimer’s Disease [313] [314]. Thus, RyR dysfunction may lead
to the cardiomyopathy and intellectual disability in CHKB CMD. Treatments that promote RyR
function may prevent or reduce declines in heart and cognitive function in CHKB CMD patients.

165
Acknowledgements
We thank the members of the Pon laboratory for technical assistance and valuable discussions.
This work was supported by awards from the HHMI (56006760) to JDV and from the National
Institutes of Health (NIH) (GM045735, GM045735S1 and GM096445) and the Ellison Medical
Foundation (AG-SS-2465-10) to LP. GM45735S1 was issued from the NIH under the American
Recovery and Reinvestment Act of 2009.

166
Author Contributions
The data in this chapter was contributed by Vevea, Jason D, Sayed, Ambreen, James, Annie Sosamma-Thomas, Cox, Greg, and Pon, Liza A as follows.
Figure 1 JDV and ASTJ
Figure 2 JDV
Figure 3 JDV
Figure 4 JDV and ASTJ
Figure 5 JDV and AS

167
Chapter VI
Discussion

168
Cells use and are comprised of 4 main classes of biologically active organic molecules:
nucleic acids, amino acids, carbohydrates, and lipids. Of these, lipids and their role in
maintaining cellular fitness has received the least attention. Lipids are not only are used for
energy, energy storage, and signaling molecules; they constitute the structural elements of
membranes. In eukaryotic cells, the endoplasmic reticulum (ER) and mitochondria are the
largest organelles spanning the entirety of the cell. These organelles contribute unique
chemistry to the cell and are vital for cellular functions. The ER is principally concerned with
protein folding, protein secretion, Ca2+ homeostasis, and lipid biosynthesis. Whereas
mitochondria contribute energy in the form of adenosine triphosphate (ATP) and various
metabolites, including Fe-S cluster formation and pyrimidines, they also play a role in Ca2+
homeostasis and lipid biosynthesis in conjunction with the ER. If either of these organelles are
lost or somehow compromised in function, the cell as a whole is at a disadvantage for survival.
If and/or how membrane lipids affect organelle homeostasis is not completely understood.
In chapter II, I presented data supporting a role for mitochondrial docking and anchorage
in the developing bud tip of S. cerevisiae in cellular fitness and lifespan control. I obtained
evidence that mitochondria are heterogeneous in redox potential and that mitochondria that are
more reduced and have less ROS are preferentially retained in the bud during development. I
also obtained evidence that inheritance of fitter mitochondria by buds contributes to cell viability
and aging of the future bud. Mitochondrial anchorage in the bud tip is mediated through the
tethering function of Mmr1p [13]. Loss of mitochondrial anchorage leads to a complex aging
phenotype where a group of cells exhibit premature aging (short-lived or SL), while others an
extension (long-lived or LL).
In chapter III, I used the information from chapter II to examine published synthetic
genetic arrays (SGA) and identify novel regulators of mitochondrial and ER morphology and
inheritance. Because mmr1∆ populations have an overall decrease in cellular fitness, genetic
interactions that exacerbate or rescue this growth phenotype will lead to a greater

169
understanding of the cellular pathways that contribute to mitochondrial inheritance. I identified
positive and negative genetic interactions with MMR1, consisting of MFB1 and CHO2
respectively. Mfb1p is one of two yeast mitochondrial F-box associated proteins with an
unknown function. Cho2p is a PE methyltransferase (PEMT) enzyme responsible for catalyzing
the first methylation of PE and therefore critical for PC biosynthesis.
In chapter IV, I examined in detail how deficiency in phosphatidylcholine (PC)
biosynthesis contributes to organelle and cellular dysfunction. Deletion of CHO2 results in
broad defects in ER and mitochondrial morphology, motility, and inheritance to the developing
bud. These defects result in a severe growth rate decrease as these are essential organelles.
Inhibition of PC biosynthesis creates cellular stress centered on misfolded membrane-
associated proteins caused by broad lipid imbalance. The cell overcomes this stress by
packaging toxic misfolded proteins and excess lipids into developing LDs within the ER, and
degrading LDs in a newly identified specific form of autophagy, that does not require canonical
autophagy genes and that we term microlipophagy.
In chapter V, I used the observations and insights from budding yeast to study a
congenital muscular dystrophy (CMD) caused by similar defects in PC biosynthesis. In yeast, I
found the primary site of cellular dysfunction in response to lipid imbalance to be the ER. Other
organelles like mitochondria are affected, but do not seem to be the primary site of dysfunction.
I used this information to guide the examination of the sarcoplasmic reticulum (SR) and SR
resident calcium channel, the ryanodine receptor (RyR), in a congenital muscular dystrophy
(CMD) resulting from loss of choline kinase activity. I found that the SR is broadly affected in
this dystrophy. Furthermore, I obtained evidence that calcium homeostatic defects may be an
early event in disease progression. I found that RyRs are leaky in resting muscle cells
undergoing lipid imbalance and this defect in calcium homeostasis may be the main determinant
of the disease. This raises the possibility that RyR stabilizing compounds, which decrease RyR
leakage, may be used to treat the muscular dystrophy.

170
Mitochondria contribute to aging and lifespan control in Saccharomyces cerevisiae.
Budding yeast must inherit mitochondria to survive. As described above, I found that
anchorage and accumulation of mitochondria is an important aging determinant. The lifespan
regulation of yeast by mitochondrial inheritance gives us insight into how essential mitochondrial
trafficking and anchorage is in metazoan cells. Recent work in the field has revealed that
mitochondrial inheritance in yeast buds is a highly regulated phenomenon, as observed by a
stable ratio of mitochondrial mass to bud volume [181]. Thus, mitochondrial inheritance during
bud development is critical for cellular survival, and mitochondrial mass is regulated as a
function of bud size (development) in yeast. In light of this, mitochondrial trafficking to, and
accumulation at specific sites within, cells may be regulated in other polarized cells like neurons,
or cells that undergo asymmetric cell division, like stem cells. Since calcium is an important
regulator of mitochondrial motility in neurons, it will be exciting to see if calcium regulates
mitochondrial motility, immobilization, or mass control in these polarized cells.
Why do mmr1∆ strains exhibit shortened and extended lifespan? When mitochondrial
anchorage and therefore, accumulation of mitochondria are compromised, as in the mmr1∆
strain, mitochondrial inheritance is dependent upon mitochondrial motility. In yeast,
mitochondria travel on actin cables and constantly exhibit anterograde and retrograde
movement. Without anchorage, even when mitochondria are inherited to the bud, they are
trafficked right back to the mother cell. I propose that the complex aging phenotype and
correlative mitochondrial redox is dependent upon this, now, stochastic nature of mitochondria
being present in the bud at the time of cytokinesis. Buds that do not inherit a certain mass
threshold of mitochondria are not able to maintain cell viability. The small amount of
mitochondria that is inherited in mmr1∆ strains may, on average, be at the limit needed for
viability. These mitochondria may not be able to support the demands of the newly budded cell
and mitochondria suffer from overuse, which leads to increased oxidizing environments,

171
damage, and premature aging. To assess this idea, long term fluorescent imaging of
mitochondrial inheritance and replication should be carried out in mmr1∆ strains. This is now
possible will commercially available microfluidic chambers. Cells would only need to be
observed for a few generations because SL cells tend to either not bud at all or bud once or
twice. A high correlation between mitochondrial mass in the bud at time of cytokinesis and
viability would be strong evidence of a mitochondrial mass threshold. Furthermore, it is possible
that the determining factor is not mass but instead mitochondrial quality. These studies would
be more difficult but may be possible using infrequently recorded roGFP measurements or
perfusion of DHE into the chamber. Future experiments are aimed at answering this question.
The mitochondrial network in Saccharomyces cerevisiae is heterogeneous in terms of
redox potential.
We find that mitochondria anchored in the mother and bud tip have lower levels of
superoxide and are more reducing. We refer to these mitochondria as “fit”. This is particularly
intriguing because budding yeast are small cells. This suggests the mechanisms that underlie
mitochondrial heterogeneity do not rely exclusively on physical distances to create biochemical
heterogeneity and that these processes may be tightly regulated. It will be interesting to see if
region-specific heterogeneity in mitochondrial function occurs in other cells including neurons,
and where defects in region-specific mitochondrial quality control is linked to diseases [315].
Just as mitochondrial inheritance and accumulation is important for normal replicative
lifespan control in yeast, mitochondrial retention in the mother may be important as well. During
our studies, we found that mitochondria in the mother tip and bud tip are fitter than the
mitochondria that seem to be cortically anchored or passively retained in the mother cell. These
mitochondria were very oxidizing as observed by DHE and roGFP, and consistently skewed the
total mother redox state towards an oxidizing potential relative to the bud. This suggests that

172
mitochondria are important aging factors for mother cells in yeast and potentially in other
polarized or asymmetrically dividing cells.
Figure 1. Mitochondrial quality control during inheritance and anchorage in budding yeast. Healthier mitochondria (dark purple tubules) are preferentially retained at the cell poles. Mitochondria that are anchored and accumulate at these poles have less superoxide and are more reducing than mitochondria elsewhere in the cell. It is currently unclear what mechanisms regulate this quality control; however, it is clear that mitochondrial ROS levels affect lifespan and mother-daughter age asymmetry. Old mother cells accumulate aging factors, including mitochondria with high ROS.
In polarized metazoan cells, there exist mechanisms to traffic and anchor mitochondria
to specific intracellular sites. For example, neuronal cells must traffic and immobilize
mitochondria at synapses to support local ATP and metabolite production, as well as contribute
to calcium homeostasis [230]. Mitochondria must also traffic to the immunological synapse that
forms between and antigen presenting cell (APC) and a T-cell [231] (Fig. 6-2). Loss of
mitochondria at these sites leads to synaptic dysfunction and muted T-cell responses. It will be

173
interesting to see if these sites have functionally distinct mitochondria as yeast do and whether
interventions that affect mitochondrial redox status could affect these cellular processes.
Figure 2. Mitochondrial polarization in yeast and metazoans. Mitochondrial distribution in polarized cells. Budding yeast (left), hyperpolarized neuronal cell (middle), and T-cells becoming activated by antigen presenting cells (right). Asterisks (*) indicate sites of polarized anchorage
Yet to be determined is how the machinery for mitochondrial inheritance exerts
mitochondrial quality control. Since mitochondria must actively overcome the opposing force of
retrograde actin cable flow (RACF) to be transported from mother cell to bud, this actin flow may
serve as a filter to prevent less fit mitochondria from entering the bud. It is also possible that the
anchorage machinery in the bud tip preferentially binds to fitter organelles, while the cortical
anchorage machinery in the mother cell may preferentially bind to less fit organelles. These
models are not mutually exclusive. Finally, recent evidence indicates that other organelles
influence mitochondrial fitness and overall cell aging in S. cerevisiae [179]. As mother cells age,

174
vacuolar acidity decreases while daughter cells from aging mother cells contain acidic vacuoles.
Interestingly, the decrease in vacuolar acidity correlates with loss of mitochondrial membrane
potential and normal morphology. Thus, multiple factors, including inheritance and interaction
with other organelles, influence mitochondrial quality control, ultimately affecting lifespan.
Mitochondrial quality and quantity control contribute to age-associated disorders
including neurodegenerative and metabolic diseases. In addition, mtDNA mutations or changes
in copy number are implicated in disease and aging [167-170]. Several important aspects of
mitochondrial biology have been elucidated in budding yeast, including fission/fusion factors,
mitochondrial biogenesis, mitophagy and protein import. However, several important questions
remain to be answered regarding mitochondrial quality and quantity control, which will lead to a
greater understanding of mitochondria during both cellular homeostasis and age-associated
deterioration, and will provide a foundation for understanding quality and quantity control of
other organelles. Although yeast produce a bud whereas many mammalian cells undergo
symmetric cell division, the mechanisms underlying segregation of mitochondria during yeast
cell division may serve as models for understanding asymmetric cell division events during
development, oogenesis and stem cell division. They also provide a foundation for
understanding the asymmetric localization of mitochondria in polarized cells, such as those
forming the neuronal and immunological synapses. Thus, the lessons learned from the budding
yeast system will inspire further studies in mammalian cells, and will suggest potential targets
for development of therapeutics for diseases associated with defects in mitochondrial function.
Identification of Mfb1p as a mother specific mitochondrial retention factor
I identified Mfb1p as a candidate for mediating mother tip mitochondrial anchorage and
accumulation. Mitochondrial distribution in mfb1∆ strains is shifted to the mother neck and bud
tip. Mitochondrial distribution in mmr1∆ mfb1∆ double mutant is near wild type. This raises a
fundamental question: why do yeast need machineries for anchorage of mitochondria in mother

175
cells and buds? Do the anchorage sites play any role in mitochondrial respiration, homeostasis
or quality control or in cellular fitness and aging? Finally, it will be important to know the full
complement of anchorage proteins in yeast, and how each of those proteins affect mitochondrial
motility and network formation.
Membrane glycerophospholipids and organelle homeostasis
PC and PE are the most abundant phospholipids in biological membranes and
represent 60-70% of total cellular phosphoplipids. PC is a cylindrical phospholipid that
spontaneously assembles into lipid bilayers, while PE is a conical phospholipid that does not
spontaneously form bilayers. While it is clear that defects in PC biosynthesis and the
associated PC/PE imbalance results in defects in the morphology and organization of
mitochondria and ER, our expectation is that the primary defect produced by a PC/PE
imbalance will be in the function of integral membrane protein(s) in ER, since ER is more
sensitive to lipid imbalance compared to mitochondria in yeast. Altered PC to PE ratios can
affect the activity of integral membrane proteins by one of two mechanisms. It can produce
negative membrane curvature, which creates lateral stress on integral membrane proteins [316].
Alternatively, studies using EPR to analyze spin-labeled lipids indicate that lipids can modify the
ways that transmembrane α-helices pack by penetrating between helices and by binding to
clefts between helices, and that these effects on helix packing can affect the activity of
membrane proteins [317]. If this were true, larger proteins with more transmembrane domains
should be particularly sensitive to membrane lipid imbalance and proteins that function as
transmembrane channels or whose catalytic activity resides in the membrane would be
outstandingly sensitive.
Indeed, lipid imbalance produced by defects in PC biosynthesis results in ER stress,
misfolding of ER proteins, and targeted degradation of those proteins by ERAD (ER associated
protein degradation) in yeast [89]. Consistent with this, the activities the Ca2+ ATPase, an

176
integral SR membrane protein, is lower in lipid bilayers of PE compared to PC [318]. The
activities of the multidrug transporter LmrP and the mechanosensitive conductance channel
MscL are also different in PC compared to PE bilayers [319] [320] [321]. To identify proteins
sensitive to lipid imbalance, studies are being planned to isolate large amounts of LD from
cho2∆ strains, precipitate and identify, not only the full complement of stress-induced LD
proteome, but identify damaged (polyubiquitinated) proteins or other post translationally
modified proteins. Our hypothesis is that this will uncover a certain class of sensitive ER
proteins and allow us to identify, perhaps, a sensitivity motif of sorts.
Mitochondria are aggregated during glycerophospholipid imbalance
I began studies of glycerophospholipid imbalance by identifying a role for phospholipid
biosynthesis in the inheritance of mitochondria. I found mitochondria were aggregated, and
confirmed they were retained in the mother cell suggesting dysfunction. In contrast to
dysfunctional mitochondria, I found mitochondria retained mtDNA and actually had a more
reducing matrix relative to WT cells. These results however, do not explain why mitochondria
aggregate, and why they aggregate to ER. I hypothesize two scenarios that may explain the
observed behavior.
Mitochondria and ER contact sites are regions of lipid and metabolite exchange [322]. It
is conceivable that the organelles are increasing the amount of contact in a compensatory
fashion in order to increase biosynthetic lipid flux. The cellular regulatory process that controls
the amount of contact between mitochondria and ER may respond to altered phospholipid levels
and increase these contacts as a compensatory mechanism. Conversely, the close apposition
of these organelles serves to increase catabolic metabolite, or catabolic lipid flux. In our
transcriptome analysis, we observed the up-regulation of a large number of mitochondrial genes
involved with respiration and alternative carbon (non glucose) utilization. This suggests that
cells going through glycerophospholipid imbalance utilize non-glucose carbon source even in

177
the presence of ample glucose. One hypothesis is that cells are metabolizing fatty acids from
excess phospholipids for energy in mitochondria. The primary sites of β-oxidation in yeast are
the peroxisomes. It would be interesting to see if persoxosomal biogenesis is affected during
lipid imbalance, and where and how peroxisomes localize.
Identification of Ylr312p as a regulator of microlipophagy
Transcriptome analysis of cho2∆ cells during lipid imbalance revealed activation of
cellular stress responses with protein folding and general catabolic molecular functions.
Interestingly, of the top 300 up-regulated transcripts during lipid imbalance, almost 40% of these
were unidentified open reading frames, this is in contrast to the entire genome in S. cerevisiae,
where approximately 20% of genes still have unidentified functions. This suggests that many of
these yet to be identified ORFs have something to do with the eukaryotic cellular stress
response to altered lipid homeostasis. I identified the ORF YLR312c as having a role in the
stress response to lipid imbalance. Moreover, I identified stress induced LD delivery to the
vacuole that is independent of known autophagy proteins but dependent upon ESCRT and ORF
YLR312c, we term this stress induced microlipophagy.
During ER stress, stress induced microlipophagy occurs in conjunction with the
appearance of multiple phagophore assembly sites (PAS) structures, but does not colocalize, or
rely on known protein regulators of the PAS, to take place. Yet to be determined is the purpose
of these multiple PAS structures during ER stress. Are these miniature autophagosomes? Do
they serve as a signaling platform for a yet to be identified alternative form of autophagy? Are
these multiple PAS a sign of incomplete autophagosome formation? Additionally, what cargos
besides LDs are delivered to the vacuole? Mitochondria and ER do not seem to be delivered
there during lipid stress. The exact mechanism regarding ESCRT mediated LD delivery to the
vacuole remains elusive. Indeed many contradictory reports involve either macroautophagy
inhibition or activation when ESCRT function is compromised [323].

178
I also found that deletion of YLR312c had a negative effect on PAS formation during ER
stress, but not that of starvation induced autophagosome formation or degradation. YLR312c is
regulated by at least two promoter elements termed stress response elements (STREs). I
confirmed these STREs are 500bp before the start site of YLR312c. Furthermore, the
regulation of YLR312c by Msn2/4p was experimentally validated, and found to rapidly respond
to a variety of stress stimuli [324]. Additionally, analysis of published microarray data, found a
small group of genes consistently negatively associated with ribosome biogenesis (stress
responders). YLR312c was included in this short list, as were ATG8 and HSP104 [325]. These,
along with my observations, strongly suggest YLR312c plays an important role in the eukaryotic
cellular stress response to not only lipid stress, but a variety of stressors.
Organelle retention in the mother cell as a form of quality control during lipid stress
During acute lipid stress in cho2∆ cells, mitochondria and ER were retained in the
mother cell by an unidentified mechanism. Was this retention purposeful or a byproduct of
altered organelle morphology? Frequently, organelle morphology mutants inhibit inheritance
and trafficking mutants lead to altered organelle morphology. During lipid stress, mitochondria
and ER displayed morphology defects that are similar to mutants that primarily affect organelle
morphology, so it is possible this trafficking observation is a side effect of altered morphology.
However, it is interesting to speculate that there is an entire quality control process that monitors
membrane phospholipids and actively prevents organelle inheritance during altered membrane
lipid balance.
Recent data suggest this may be true. The master ER-UPR regulator Ire1p senses
unfolded proteins via hydrophobic interactions at its luminal domain [326]. Deletion of this
domain inhibits UPR signaling during stress with unfolded proteins, however this truncated Ire1p
still responds to changes in membrane phospholipids [90]. Based on these observations, this
stress response would serve to recognize membrane dysfunction, retain organelles in the

179
mother preventing damaged organelles from being inherited, and allow the cell time to repair
organelles prior to inheritance.
In eukaryotic cells, damage to DNA and proteins accumulate with age. In yeast,
extrachromosomal rDNA circles, protein aggregates containing oxidized proteins, and oxidized
mitochondria increase in the mother cell as a function of age [176-179, 236]. These are the
result of normal cellular chemistry over time and the cell has evolved many cellular quality
control responses to compensate. It is completely unknown if there is similar lipid quality control
byproduct that accumulates with age, and houses damaged lipids. A promising candidate for
this lipid quality control body is the lipid droplet. In yeast, interventions that prevent the
accumulation of rDNA circles and protein aggregates increase cellular fitness and extend
lifespan.
In cho2∆ cells undergoing acute lipid imbalance, organelle defects and lipid droplet
biogenesis and microlipophagy was observed in every cell examined. During examination of
the chronic or adapted phase of cho2∆ cells grown without choline, most cells showed WT
organelle morphology, but a small and consistent population exhibited moderate organelle
aggregates and had the most LD. In all cases, organelle aggregates were present in mother
cells and not in buds and tended to be in relatively older mother cells discerned by calcofluor
staining. I propose that organelle aggregation persists in cho2∆-C7 cells, and that selective
retention of aggregated organelles in mother cells is a quality control mechanism to insure that
daughter cells are born young, with a full replicative lifespan. In this model, aggregated
organelles will accumulate in mother cells as they age, and these cells will have a shortened
lifespan. This model could be tested by analysis of the replicative lifespan and mother-daughter
age asymmetry in adapted cho2∆ yeast, and by visualization of organelle morphology as a
function of age in adapted cho2∆ yeast using long term imaging techniques now available.
It would also be fascinating to study the lipidome as a function of yeast replicative
lifespan in wild-type yeast. Published reports already show examples of a flexible yeast
180
lipidome, reliably changing in response to temperature, carbon source, and phase of growth
[327]. If there is membrane lipid quality control in a normal aging cell, it would make sense that
this process would break down as a function of age as with DNA damage and protein
aggregates. Moreover, interventions that increase PC and decrease PE in yeast mitochondria
extend lifespan in yeast [328]. It will also be interesting to determine if LDs are involved with the
cellular machinery that is responsible for maintaining normal membrane lipid balance and if
interventions that promote LD biogenesis or microlipophagy affect lifespan.
Defects in PC biosynthesis lead to a congenital muscular dystrophy and intellectual
disability in humans, potentially through effects on RyR leakage
In 1998 a small group of patients presenting with a congenital muscular dystrophy were
identified in Japan. These patients were grouped based on similar dystrophic features, marked
neurological impairment, and mitochondrial morphological defects in skeletal muscle fibers. In
2006 researchers from the Jackson Laboratories identified a mutation in mice that caused
dystrophy and similar histopathological features. This mutation was in a gene encoding a
choline kinase isoform, critical for PC production in the Kennedy pathway. The original, and
additionally identified patients, were sequenced at this locus and all were found to have lesions
in the choline kinase β (CHKB) locus [241]. All mutations cause a loss of function and are
inherited in a recessive manner. Loss of choline kinase activity leads to decreased production
of PC and altered ratios of PC/PE in biological tissue.
Our studies in yeast implicated not only mitochondria, but also ER and the RyR in
organelle dysfunction associated with altered membrane phospholipids. Ryanodine receptor
channels are the largest known ion channels at 2.3 megadaltons and are responsible for Ca2+
release from the SR [329]. In skeletal muscle RyR make physical contacts with DHPR ion
channels on the sarcolemmal membrane, this physical contact regulates the open or closed
state of the channel and is the basis for excitation contraction coupling (EC coupling). RyRs are

181
further regulated by physical interactions with Calstabin, a protein that stabilizes the closed state
of RyR channels. Bound Calstabin ensures the fidelity of the RyR channel and prevents
calcium leak from the SR. Stress induced post translational modifications to RyR inhibit RyR-
Calstabin interactions and lead to transient Ca2+ leaks termed Ca2+ sparks. Our finding that
Ca2+ sparks are present during lipid stress directly implicates not only SR dysfunction but
specifically the RyR.
Future studies are planned to isolate the RyR from skeletal muscle of rmd and littermate
control mice to determine if there are post-translational modifications on RyR and the nature of
those modifications. During lipid stress and resulting membrane lipid imbalance, post
translational modification may not be necessary to inhibit RyR-Calstabin interactions. Local
deformations in the membrane caused by an altered PC/PE ratio, may be enough to destabilize
and cause conformational changes of the largest known ion channel; thus preventing
endogenous regulation by Calstabin. Whatever the outcome, RyR are implicated in CHKB
CMD. Immediate goals are to continue our experiments in the rmd mouse. Continue to isolate
muscle fibers from rmd and littermates in order to increase our observations and to investigate
the use of S107 in these isolated muscle fibers. Future studies are being planned to deliver
S107 to whole rmd mice. The drug will be delivered to the heterozygote mothers and newborns
will be administered S107 via intraperitoneal injection. Progression of mice administered S107
will be compared to the natural progression of the disease. Histopathological feature will be
assessed as well as functional tests, including grip test and voluntary exercise.
Finally, RyRs present an attractive target for this disease because all tissues that are
affected rely on proper RyR function. It is currently unknown what causes the intellectual
disability in CHKB CMD. As explained previously, RyRs are critical for skeletal and cardiac
muscle function, but also neuronal function. In neurons, RyR mediate the release of Ca2+
important for synaptic maintenance and transmission. If RyRs are drivers of human disease
associated with altered PC/PE balance, novel therapeutics are actively being developed and

182
present an attractive option for treatment. An open question in this disease is tissue specificity.
RyRs are implicated and may give an elegant explanation for excitatory tissue involvement. It
should be noted that the tissues affecting in CHKB CMD are also all post mitotic. Coupled with
the observation that yeast adapt to glycerophospholipid imbalance only after many divisions,
one could postulate that non-dividing eukaryotic cells have somehow a different requirement of
membrane phospholipids or are somehow otherwise more sensitive to lipid imbalance. This
may simply be through the need of post-mitotic cells to build stable, long term organelle
structure that are not amenable to the repair mechanisms needed to overcome lipid imbalance.
One additional aim may be to examine the cell biology of growing metazoan cells relative to
post-mitotic cells. If metazoans cope with lipid imbalance the same way budding yeast do,
involving the complete rearrangement of ER for the production of LD, this may be a case of the
cellular repair response being worse than the underlying dysfunction as per post-mitotic cells
and their stable organelle arrangements.
Ultimately, treatment affecting the underlying genetic lesion or activation of the
alternative PC biosynthetic pathway in CHKB CMD patients is optimal. However, barring
advancements in gene delivery techniques and identification of conditions that activate the
PEMT pathway in human tissue, small molecule palliative therapy is an attractive option. This
option is of course treatment with compounds that stabilize RyR function (S107), reducing
calcium leak.
183
References
1. Palade, G.E., The fine structure of mitochondria. Anat Rec, 1952. 114(3): p. 427-51.
2. Palade, G.E., An electron microscope study of the mitochondrial structure. J Histochem Cytochem, 1953. 1(4): p. 188-211.
3. Wittig, I. and H. Schagger, Supramolecular organization of ATP synthase and respiratory chain in mitochondrial membranes. Biochim Biophys Acta, 2009. 1787(6): p. 672-80.
4. Xie, J., et al., The mitochondrial inner membrane protein mitofilin exists as a complex with SAM50, metaxins 1 and 2, coiled-coil-helix coiled-coil-helix domain-containing protein 3 and 6 and DnaJC11. FEBS Lett, 2007. 581(18): p. 3545-9.
5. Rabl, R., et al., Formation of cristae and crista junctions in mitochondria depends on antagonism between Fcj1 and Su e/g. J Cell Biol, 2009. 185(6): p. 1047-63.
6. Hoppins, S., et al., A mitochondrial-focused genetic interaction map reveals a scaffold-like complex required for inner membrane organization in mitochondria. The Journal of cell biology, 2011. 195(2): p. 323-40.
7. von der Malsburg, K., et al., Dual role of mitofilin in mitochondrial membrane organization and protein biogenesis. Dev Cell, 2011. 21(4): p. 694-707.
8. Pfanner, N., et al., Uniform nomenclature for the mitochondrial contact site and cristae organizing system. J Cell Biol, 2014. 204(7): p. 1083-6.
9. Fehrenbacher, K.L., et al., Live cell imaging of mitochondrial movement along actin cables in budding yeast. Curr Biol, 2004. 14(22): p. 1996-2004.
10. Fehrenbacher, K.L., I.R. Boldogh, and L.A. Pon, A role for Jsn1p in recruiting the Arp2/3 complex to mitochondria in budding yeast. Mol Biol Cell, 2005. 16(11): p. 5094-102.
11. Fortsch, J., et al., The myosin-related motor protein Myo2 is an essential mediator of bud-directed mitochondrial movement in yeast. The Journal of cell biology, 2011. 194(3): p. 473-88.
12. Lackner, L.L., et al., Endoplasmic reticulum-associated mitochondria-cortex tether functions in the distribution and inheritance of mitochondria. Proceedings of the National Academy of Sciences of the United States of America, 2013. 110(6): p. E458-E467.
13. Swayne, T.C., et al., Role for cER and Mmr1p in Anchorage of Mitochondria at Sites of Polarized Surface Growth in Budding Yeast. Current Biology, 2011. 21(23): p. 1994-1999.
14. Sokac, A.M. and W.M. Bement, Regulation and expression of metazoan unconventional myosins. Int Rev Cytol, 2000. 200: p. 197-304.
15. Boldogh, I.R. and L.A. Pon, Mitochondria on the move. Trends Cell Biol, 2007. 17(10): p. 502-10.

184
16. Brickley, K. and F.A. Stephenson, Trafficking kinesin protein (TRAK)-mediated transport of mitochondria in axons of hippocampal neurons. J Biol Chem, 2011. 286(20): p. 18079-92.
17. Stowers, R.S., et al., Axonal transport of mitochondria to synapses depends on milton, a novel Drosophila protein. Neuron, 2002. 36(6): p. 1063-77.
18. Wang, X. and T.L. Schwarz, The mechanism of Ca2+ -dependent regulation of kinesin-mediated mitochondrial motility. Cell, 2009. 136(1): p. 163-74.
19. Hermann, G.J., et al., Mitochondrial fusion in yeast requires the transmembrane GTPase Fzo1p. J Cell Biol, 1998. 143(2): p. 359-73.
20. Chen, H., et al., Mitofusins Mfn1 and Mfn2 coordinately regulate mitochondrial fusion and are essential for embryonic development. J Cell Biol, 2003. 160(2): p. 189-200.
21. Rapaport, D., et al., Fzo1p is a mitochondrial outer membrane protein essential for the biogenesis of functional mitochondria in Saccharomyces cerevisiae. J Biol Chem, 1998. 273(32): p. 20150-5.
22. Koshiba, T., et al., Structural basis of mitochondrial tethering by mitofusin complexes. Science, 2004. 305(5685): p. 858-62.
23. Wong, E.D., et al., The intramitochondrial dynamin-related GTPase, Mgm1p, is a component of a protein complex that mediates mitochondrial fusion. J Cell Biol, 2003. 160(3): p. 303-11.
24. Cipolat, S., et al., OPA1 requires mitofusin 1 to promote mitochondrial fusion. Proc Natl Acad Sci U S A, 2004. 101(45): p. 15927-32.
25. Sesaki, H. and R.E. Jensen, Ugo1p links the Fzo1p and Mgm1p GTPases for mitochondrial fusion. J Biol Chem, 2004. 279(27): p. 28298-303.
26. Bleazard, W., et al., The dynamin-related GTPase Dnm1 regulates mitochondrial fission in yeast. Nat Cell Biol, 1999. 1(5): p. 298-304.
27. Smirnova, E., et al., Dynamin-related protein Drp1 is required for mitochondrial division in mammalian cells. Mol Biol Cell, 2001. 12(8): p. 2245-56.
28. Porter, K.R., A. Claude, and E.F. Fullam, A Study of Tissue Culture Cells by Electron Microscopy : Methods and Preliminary Observations. J Exp Med, 1945. 81(3): p. 233-46.
29. Voeltz, G.K., M.M. Rolls, and T.A. Rapoport, Structural organization of the endoplasmic reticulum. EMBO reports, 2002. 3(10): p. 944-50.
30. West, M., et al., A 3D analysis of yeast ER structure reveals how ER domains are organized by membrane curvature. The Journal of Cell Biology, 2011. 193(2): p. 333-346.

185
31. Park, S.H., et al., Hereditary spastic paraplegia proteins REEP1, spastin, and atlastin-1 coordinate microtubule interactions with the tubular ER network. J Clin Invest, 2010. 120(4): p. 1097-110.
32. Voeltz, G.K., et al., A class of membrane proteins shaping the tubular endoplasmic reticulum. Cell, 2006. 124(3): p. 573-86.
33. Shibata, Y., et al., The reticulon and DP1/Yop1p proteins form immobile oligomers in the tubular endoplasmic reticulum. J Biol Chem, 2008. 283(27): p. 18892-904.
34. Fehrenbacher, K.L., et al., Endoplasmic reticulum dynamics, inheritance, and cytoskeletal interactions in budding yeast. Mol Biol Cell, 2002. 13(3): p. 854-65.
35. Friedman, J.R., et al., ER sliding dynamics and ER-mitochondrial contacts occur on acetylated microtubules. J Cell Biol, 2010. 190(3): p. 363-75.
36. Estrada, P., et al., Myo4p and She3p are required for cortical ER inheritance in Saccharomyces cerevisiae. J Cell Biol, 2003. 163(6): p. 1255-66.
37. Hu, J., W.A. Prinz, and T.A. Rapoport, Weaving the web of ER tubules. Cell, 2011. 147(6): p. 1226-31.
38. English, A.R. and G.K. Voeltz, Rab10 GTPase regulates ER dynamics and morphology. Nat Cell Biol, 2013. 15(2): p. 169-78.
39. Manford, A.G., et al., ER-to-Plasma Membrane Tethering Proteins Regulate Cell Signaling and ER Morphology. Developmental cell, 2012. 23(6): p. 1129-40.
40. Takeshima, H., et al., Junctophilins: a novel family of junctional membrane complex proteins. Mol Cell, 2000. 6(1): p. 11-22.
41. Nishi, M., et al., Coexpression of junctophilin type 3 and type 4 in brain. Brain Res Mol Brain Res, 2003. 118(1-2): p. 102-10.
42. Anwar, K., et al., The dynamin-like GTPase Sey1p mediates homotypic ER fusion in S. cerevisiae. J Cell Biol, 2012. 197(2): p. 209-17.
43. Orso, G., et al., Homotypic fusion of ER membranes requires the dynamin-like GTPase atlastin. Nature, 2009. 460(7258): p. 978-83.
44. Chen, S., P. Novick, and S. Ferro-Novick, ER network formation requires a balance of the dynamin-like GTPase Sey1p and the Lunapark family member Lnp1p. Nat Cell Biol, 2012. 14(7): p. 707-16.
45. Nunnari, J. and A. Suomalainen, Mitochondria: in sickness and in health. Cell, 2012. 148(6): p. 1145-59.
46. Voet, D. and J.G. Voet, Biochemistry. 3rd ed. 2004, Danvers, MA: Wiley Inernational. 1591.
47. Cadenas, E. and K.J. Davies, Mitochondrial free radical generation, oxidative stress, and aging. Free Radic Biol Med, 2000. 29(3-4): p. 222-30.

186
48. Hamilton, M.L., et al., Does oxidative damage to DNA increase with age? Proc Natl Acad Sci U S A, 2001. 98(18): p. 10469-74.
49. Taylor, E.R., et al., Reversible glutathionylation of complex I increases mitochondrial superoxide formation. J Biol Chem, 2003. 278(22): p. 19603-10.
50. Beer, S.M., et al., Glutaredoxin 2 catalyzes the reversible oxidation and glutathionylation of mitochondrial membrane thiol proteins: implications for mitochondrial redox regulation and antioxidant DEFENSE. J Biol Chem, 2004. 279(46): p. 47939-51.
51. Tretter, L. and V. Adam-Vizi, Inhibition of Krebs cycle enzymes by hydrogen peroxide: A key role of [alpha]-ketoglutarate dehydrogenase in limiting NADH production under oxidative stress. J Neurosci, 2000. 20(24): p. 8972-9.
52. Nulton-Persson, A.C. and L.I. Szweda, Modulation of mitochondrial function by hydrogen peroxide. J Biol Chem, 2001. 276(26): p. 23357-61.
53. Gardner, P.R. and I. Fridovich, Effect of glutathione on aconitase in Escherichia coli. Arch Biochem Biophys, 1993. 301(1): p. 98-102.
54. Gardner, P.R., et al., Superoxide radical and iron modulate aconitase activity in mammalian cells. J Biol Chem, 1995. 270(22): p. 13399-405.
55. Luce, K. and H.D. Osiewacz, Increasing organismal healthspan by enhancing mitochondrial protein quality control. Nature cell biology, 2009. 11(7): p. 852-8.
56. Weil, A., et al., Unmasking a temperature-dependent effect of the P. anserina i-AAA protease on aging and development. Cell cycle, 2011. 10(24): p. 4280-90.
57. Voos, W., Chaperone-protease networks in mitochondrial protein homeostasis. Biochimica et biophysica acta, 2013. 1833(2): p. 388-99.
58. Youle, R.J. and a.M. van der Bliek, Mitochondrial Fission, Fusion, and Stress. Science, 2012. 337(6098): p. 1062-1065.
59. Twig, G., et al., Fission and selective fusion govern mitochondrial segregation and elimination by autophagy. EMBO J, 2008. 27(2): p. 433-46.
60. Vives-Bauza, C. and S. Przedborski, Mitophagy: the latest problem for Parkinson's disease. Trends Mol Med, 2011. 17(3): p. 158-65.
61. Narendra, D.P. and R.J. Youle, Targeting mitochondrial dysfunction: role for PINK1 and Parkin in mitochondrial quality control. Antioxidants & redox signaling, 2011. 14(10): p. 1929-38.
62. Shin, J.H., et al., PARIS (ZNF746) repression of PGC-1alpha contributes to neurodegeneration in Parkinson's disease. Cell, 2011. 144(5): p. 689-702.
63. Ziviani, E., R.N. Tao, and A.J. Whitworth, Drosophila parkin requires PINK1 for mitochondrial translocation and ubiquitinates mitofusin. Proceedings of the National Academy of Sciences of the United States of America, 2010. 107(11): p. 5018-23.

187
64. Chen, Y. and G.W. Dorn, 2nd, PINK1-phosphorylated mitofusin 2 is a Parkin receptor for culling damaged mitochondria. Science, 2013. 340(6131): p. 471-5.
65. Soubannier, V., et al., A vesicular transport pathway shuttles cargo from mitochondria to lysosomes. Curr Biol, 2012. 22(2): p. 135-41.
66. Soubannier, V., et al., Reconstitution of mitochondria derived vesicle formation demonstrates selective enrichment of oxidized cargo. PLoS One, 2012. 7(12): p. e52830.
67. Islam, M.N., et al., Mitochondrial transfer from bone-marrow-derived stromal cells to pulmonary alveoli protects against acute lung injury. Nat Med, 2012. 18(5): p. 759-65.
68. Rugarli, E.I. and T. Langer, Mitochondrial quality control: a matter of life and death for neurons. The EMBO journal, 2012. 31(6): p. 1336-49.
69. Mitchell, T., et al., Convergent mechanisms for dysregulation of mitochondrial quality control in metabolic disease: implications for mitochondrial therapeutics. Biochemical Society transactions, 2013. 41(1): p. 127-33.
70. Sabatini, D.D., K. Bensch, and R.J. Barrnett, Cytochemistry and electron microscopy. The preservation of cellular ultrastructure and enzymatic activity by aldehyde fixation. J Cell Biol, 1963. 17: p. 19-58.
71. Hessa, T., et al., Recognition of transmembrane helices by the endoplasmic reticulum translocon. Nature, 2005. 433(7024): p. 377-81.
72. Kurzchalia, T.V., et al., The signal sequence of nascent preprolactin interacts with the 54K polypeptide of the signal recognition particle. Nature, 1986. 320(6063): p. 634-6.
73. Panzner, S., et al., Posttranslational protein transport in yeast reconstituted with a purified complex of Sec proteins and Kar2p. Cell, 1995. 81(4): p. 561-70.
74. Meyer, D.I., E. Krause, and B. Dobberstein, Secretory protein translocation across membranes-the role of the "docking protein'. Nature, 1982. 297(5868): p. 647-50.
75. Romisch, K., Surfing the Sec61 channel: bidirectional protein translocation across the ER membrane. J Cell Sci, 1999. 112 ( Pt 23): p. 4185-91.
76. Travers, K.J., et al., Functional and genomic analyses reveal an essential coordination between the unfolded protein response and ER-associated degradation. Cell, 2000. 101(3): p. 249-58.
77. Mori, K., et al., Signalling from endoplasmic reticulum to nucleus: transcription factor with a basic-leucine zipper motif is required for the unfolded protein-response pathway. Genes Cells, 1996. 1(9): p. 803-17.
78. Calfon, M., et al., IRE1 couples endoplasmic reticulum load to secretory capacity by processing the XBP-1 mRNA. Nature, 2002. 415(6867): p. 92-6.

188
79. Mori, K., et al., Palindrome with spacer of one nucleotide is characteristic of the cis-acting unfolded protein response element in Saccharomyces cerevisiae. J Biol Chem, 1998. 273(16): p. 9912-20.
80. Harding, H.P., Y. Zhang, and D. Ron, Protein translation and folding are coupled by an endoplasmic-reticulum-resident kinase. Nature, 1999. 397(6716): p. 271-4.
81. Haze, K., et al., Mammalian transcription factor ATF6 is synthesized as a transmembrane protein and activated by proteolysis in response to endoplasmic reticulum stress. Mol Biol Cell, 1999. 10(11): p. 3787-99.
82. Ye, J., et al., ER stress induces cleavage of membrane-bound ATF6 by the same proteases that process SREBPs. Mol Cell, 2000. 6(6): p. 1355-64.
83. Ron, D. and P. Walter, Signal integration in the endoplasmic reticulum unfolded protein response. Nat Rev Mol Cell Biol, 2007. 8(7): p. 519-29.
84. Ma, Y. and L.M. Hendershot, Delineation of a negative feedback regulatory loop that controls protein translation during endoplasmic reticulum stress. J Biol Chem, 2003. 278(37): p. 34864-73.
85. Brodsky, J.L., Cleaning up: ER-associated degradation to the rescue. Cell, 2012. 151(6): p. 1163-7.
86. Walter, P. and D. Ron, The unfolded protein response: from stress pathway to homeostatic regulation. Science, 2011. 334(6059): p. 1081-6.
87. Hou, N.S., et al., Activation of the endoplasmic reticulum unfolded protein response by lipid disequilibrium without disturbed proteostasis in vivo. Proceedings of the National Academy of Sciences of the United States of America, 2014.
88. Surma, M.a., et al., A Lipid E-MAP Identifies Ubonvox2 as a Criticalsyss Regulatdddor of Lipid Saturation and Lipid Bilayer Stress. Molecular cell, 2013. 51(4): p. 519-30.
89. Thibault, G., et al., The Membrane Stress Response Buffers Lethal Effects of Lipid Disequilibrium by Reprogramming the Protein Homeostasis Network. Molecular cell, 2012. 48(1): p. 16-27.
90. Volmer, R., K. van der Ploeg, and D. Ron, Membrane lipid saturation activates endoplasmic reticulum unfolded protein response transducers through their transmembrane domains. Proc Natl Acad Sci U S A, 2013. 110(12): p. 4628-33.
91. Schuck, S., et al., Membrane expansion alleviates endoplasmic reticulum stress independently of the unfolded protein response. The Journal of cell biology, 2009. 187(4): p. 525-36.
92. Fei, W., et al., Conditions of endoplasmic reticulum stress stimulate lipid droplet formation in Saccharomyces cerevisiae. Biochem J, 2009. 424(1): p. 61-7.

189
93. Bernales, S., K.L. McDonald, and P. Walter, Autophagy counterbalances endoplasmic reticulum expansion during the unfolded protein response. PLoS biology, 2006. 4(12): p. e423-e423.
94. Csordas, G. and G. Hajnoczky, SR/ER-mitochondrial local communication: calcium and ROS. Biochim Biophys Acta, 2009. 1787(11): p. 1352-62.
95. Corbett, E.F., et al., The conformation of calreticulin is influenced by the endoplasmic reticulum luminal environment. J Biol Chem, 2000. 275(35): p. 27177-85.
96. Berridge, M.J., The endoplasmic reticulum: a multifunctional signaling organelle. Cell Calcium, 2002. 32(5-6): p. 235-49.
97. Hammadi, M., et al., Modulation of ER stress and apoptosis by endoplasmic reticulum calcium leak via translocon during unfolded protein response: involvement of GRP78. FASEB J, 2013. 27(4): p. 1600-9.
98. Moseley, J.B. and B.L. Goode, The yeast actin cytoskeleton: from cellular function to biochemical mechanism. Microbiol Mol Biol Rev, 2006. 70(3): p. 605-45.
99. Simon, V.R., S.L. Karmon, and L.A. Pon, Mitochondrial inheritance: cell cycle and actin cable dependence of polarized mitochondrial movements in Saccharomyces cerevisiae. Cell Motil Cytoskeleton, 1997. 37(3): p. 199-210.
100. Simon, V.R., T.C. Swayne, and L.A. Pon, Actin-dependent mitochondrial motility in mitotic yeast and cell-free systems: identification of a motor activity on the mitochondrial surface. J Cell Biol, 1995. 130(2): p. 345-54.
101. Yang, H.C., et al., A retention mechanism for distribution of mitochondria during cell division in budding yeast. Curr Biol, 1999. 9(19): p. 1111-4.
102. Boldogh, I.R., et al., A type V myosin (Myo2p) and a Rab-like G-protein (Ypt11p) are required for retention of newly inherited mitochondria in yeast cells during cell division. Mol Biol Cell, 2004. 15(9): p. 3994-4002.
103. Boldogh, I.R., et al., A protein complex containing Mdm10p, Mdm12p, and Mmm1p links mitochondrial membranes and DNA to the cytoskeleton-based segregation machinery. Mol Biol Cell, 2003. 14(11): p. 4618-27.
104. Okamoto, K. and J.M. Shaw, Mitochondrial morphology and dynamics in yeast and multicellular eukaryotes. Annu Rev Genet, 2005. 39: p. 503-36.
105. Boldogh, I.R. and L.A. Pon, Interactions of mitochondria with the actin cytoskeleton. Biochim Biophys Acta, 2006. 1763(5-6): p. 450-62.
106. Kornmann, B., et al., An ER-mitochondria tethering complex revealed by a synthetic biology screen. Science, 2009. 325(5939): p. 477-81.
107. Meisinger, C., et al., The morphology proteins Mdm12/Mmm1 function in the major beta-barrel assembly pathway of mitochondria. The EMBO journal, 2007. 26(9): p. 2229-39.

190
108. Meisinger, C., et al., The mitochondrial morphology protein Mdm10 functions in assembly of the preprotein translocase of the outer membrane. Dev Cell, 2004. 7(1): p. 61-71.
109. Nguyen, T.T., et al., Gem1 and ERMES do not directly affect phosphatidylserine transport from ER to mitochondria or mitochondrial inheritance. Traffic, 2012. 13(6): p. 880-90.
110. Voss, C., et al., ER-shaping proteins facilitate lipid exchange between the ER and mitochondria in S. cerevisiae. J Cell Sci, 2012. 125(Pt 20): p. 4791-9.
111. Yang, H.C. and L.A. Pon, Actin cable dynamics in budding yeast. Proc Natl Acad Sci U S A, 2002. 99(2): p. 751-6.
112. Hartman, M.A. and J.A. Spudich, The myosin superfamily at a glance. Journal of cell science, 2012. 125(Pt 7): p. 1627-32.
113. Campellone, K.G. and M.D. Welch, A nucleator arms race: cellular control of actin assembly. Nature reviews. Molecular cell biology, 2010. 11(4): p. 237-51.
114. Hammer, J.A., 3rd and J.R. Sellers, Walking to work: roles for class V myosins as cargo transporters. Nature reviews. Molecular cell biology, 2012. 13(1): p. 13-26.
115. Robertson, A.S., E. Smythe, and K.R. Ayscough, Functions of actin in endocytosis. Cell Mol Life Sci, 2009. 66(13): p. 2049-65.
116. Altmann, K., et al., The class V myosin motor protein, Myo2, plays a major role in mitochondrial motility in Saccharomyces cerevisiae. J Cell Biol, 2008. 181(1): p. 119-30.
117. Eves, P.T., et al., Overlap of cargo binding sites on myosin V coordinates the inheritance of diverse cargoes. The Journal of cell biology, 2012. 198(1): p. 69-85.
118. Boldogh, I.R., et al., Arp2/3 complex and actin dynamics are required for actin-based mitochondrial motility in yeast. Proc Natl Acad Sci U S A, 2001. 98(6): p. 3162-7.
119. McKane, M., et al., A mammalian actin substitution in yeast actin (H372R) causes a suppressible mitochondria/vacuole phenotype. J Biol Chem, 2005. 280(43): p. 36494-501.
120. Senning, E.N. and A.H. Marcus, Actin polymerization driven mitochondrial transport in mating S. cerevisiae. Proc Natl Acad Sci U S A, 2010. 107(2): p. 721-5.
121. McBride, H.M., Mitochondrial-ER tethering: the inheritance of a functional unit. Current biology : CB, 2011. 21(23): p. R949-51.
122. Estrada de Martin, P., et al., Ice2p is important for the distribution and structure of the cortical ER network in Saccharomyces cerevisiae. J Cell Sci, 2005. 118(Pt 1): p. 65-77.
123. Li, X., et al., Activation of the mitogen-activated protein kinase, Slt2p, at bud tips blocks a late stage of endoplasmic reticulum inheritance in Saccharomyces cerevisiae. Mol Biol Cell, 2010. 21(10): p. 1772-82.

191
124. Arai, S., et al., Ypt11 functions in bud-directed transport of the Golgi by linking Myo2 to the coatomer subunit Ret2. Curr Biol, 2008. 18(13): p. 987-91.
125. Buvelot Frei, S., et al., Bioinformatic and comparative localization of Rab proteins reveals functional insights into the uncharacterized GTPases Ypt10p and Ypt11p. Mol Cell Biol, 2006. 26(19): p. 7299-317.
126. Rowland, A.A. and G.K. Voeltz, Endoplasmic reticulum-mitochondria contacts: function of the junction. Nat Rev Mol Cell Biol, 2012. 13(10): p. 607-25.
127. Friedman, J.R., et al., ER tubules mark sites of mitochondrial division. Science, 2011. 334(6054): p. 358-62.
128. Korobova, F., V. Ramabhadran, and H.N. Higgs, An actin-dependent step in mitochondrial fission mediated by the ER-associated formin INF2. Science, 2013. 339(6118): p. 464-7.
129. van Meer, G., D.R. Voelker, and G.W. Feigenson, Membrane lipids: where they are and how they behave. Nature reviews. Molecular cell biology, 2008. 9(2): p. 112-24.
130. Rusinol, A.E., et al., A unique mitochondria-associated membrane fraction from rat liver has a high capacity for lipid synthesis and contains pre-Golgi secretory proteins including nascent. Journal of Biological Chemistry, 1994. 269(44): p. 27494-27502.
131. Gaigg, B., et al., Characterization of a microsomal subfraction associated with. Yeast, 1995. 1234: p. 214-220.
132. Vance, J.E. and R. Steenbergen, Metabolism and functions of phosphatidylserine. Progress in lipid research, 2005. 44(4): p. 207-34.
133. Voelker, D.R., Phosphatidylserine decarboxylase. Biochimica et biophysica acta, 1997. 1348(1-2): p. 236-44.
134. Kanipes, M.I. and S.a. Henry, The phospholipid methyltransferases in yeast. Biochimica et biophysica acta, 1997. 1348(1-2): p. 134-41.
135. Gibellini, F. and T.K. Smith, The Kennedy pathway--De novo synthesis of phosphatidylethanolamine and phosphatidylcholine. IUBMB life, 2010. 62(6): p. 414-28.
136. Osman, C., D.R. Voelker, and T. Langer, Making heads or tails of phospholipids in mitochondria. The Journal of cell biology, 2011. 192(1): p. 7-16.
137. Chan, E.Y. and G.A. McQuibban, Phosphatidylserine decarboxylase 1 (Psd1) promotes mitochondrial fusion by regulating the biophysical properties of the mitochondrial membrane and alternative topogenesis of mitochondrial genome maintenance protein 1 (Mgm1). J Biol Chem, 2012. 287(48): p. 40131-9.
138. Area-Gomez, E., et al., Upregulated function of mitochondria-associated ER membranes in Alzheimer disease. The EMBO journal, 2012(January): p. 1-18.

192
139. Fu, S., et al., Aberrant lipid metabolism disrupts calcium homeostasis causing liver endoplasmic reticulum stress in obesity. Nature, 2011. 473(7348): p. 528-31.
140. Gallego-Ortega, D., et al., Differential role of human choline kinase alpha and beta enzymes in lipid metabolism: implications in cancer onset and treatment. PloS one, 2009. 4(11): p. e7819-e7819.
141. Di Paolo, G. and T.-W. Kim, Linking lipids to Alzheimer's disease: cholesterol and beyond. Nature reviews. Neuroscience, 2011. 12(5): p. 284-96.
142. Glatz, J.F.C., J. Luiken, and A. Bonen, Membrane fatty acid transporters as regulators of lipid metabolism: implications for metabolic disease. Physiological reviews, 2010: p. 367-417.
143. Hirsch, H.a., et al., A transcriptional signature and common gene networks link cancer with lipid metabolism and diverse human diseases. Cancer cell, 2010. 17(4): p. 348-61.
144. Itoh, T., E.A. Toh, and Y. Matsui, Mmr1p is a mitochondrial factor for Myo2p-dependent inheritance of mitochondria in the budding yeast. EMBO J, 2004. 23(13): p. 2520-30.
145. Ren, Y., et al., A structure-based mechanism for vesicle capture by the multisubunit tethering complex Dsl1. Cell, 2009. 139(6): p. 1119-29.
146. Itoh, T., et al., Complex formation with Ypt11p, a rab-type small GTPase, is essential to facilitate the function of Myo2p, a class V myosin, in mitochondrial distribution in Saccharomyces cerevisiae. Mol Cell Biol, 2002. 22(22): p. 7744-57.
147. Frederick, R.L., K. Okamoto, and J.M. Shaw, Multiple pathways influence mitochondrial inheritance in budding yeast. Genetics, 2008. 178(2): p. 825-37.
148. Lewandowska, A., J. Macfarlane, and J.M. Shaw, Mitochondrial association, protein phosphorylation and degradation regulate the availability of the active Rab GTPase, Ypt11, for mitochondrial inheritance. Molecular biology of the cell, 2013. DOI 10.1091/mbc.E12-12-0848: p. http://www.molbiolcell.org/.
149. Hammermeister, M., K. Schodel, and B. Westermann, Mdm36 is a mitochondrial fission-promoting protein in Saccharomyces cerevisiae. Mol Biol Cell, 2010. 21(14): p. 2443-52.
150. Klecker, T., et al., The yeast cell cortical protein Num1 integrates mitochondrial dynamics into cellular architecture. J Cell Sci, 2013. 126(Pt 13): p. 2924-30.
151. Yamamoto, A. and Y. Hiraoka, Cytoplasmic dynein in fungi: insights from nuclear migration. J Cell Sci, 2003. 116(Pt 22): p. 4501-12.
152. Cerveny, K.L., et al., Yeast mitochondrial division and distribution require the cortical num1 protein. Dev Cell, 2007. 12(3): p. 363-75.
153. Tang, X., B.S. Germain, and W.L. Lee, A novel patch assembly domain in Num1 mediates dynein anchoring at the cortex during spindle positioning. J Cell Biol, 2012. 196(6): p. 743-56.
193
154. Schauss, A.C. and H.M. McBride, Mitochondrial fission: a non-nuclear role for Num1p. Curr Biol, 2007. 17(12): p. R467-70.
155. Erjavec, N., et al., Deletion of the mitochondrial Pim1/Lon protease in yeast results in accelerated aging and impairment of the proteasome. Free radical biology & medicine, 2013. 56: p. 9-16.
156. Scheckhuber, C.Q., et al., Unopposed mitochondrial fission leads to severe lifespan shortening. Cell cycle, 2011. 10(18): p. 3105-10.
157. Kurashima, K., et al., A uvs-5 Strain Is Deficient for a Mitofusin Gene Homologue, fzo1, Involved in Maintenance of Long Life Span in Neurospora crassa. Eukaryotic cell, 2013. 12(2): p. 233-43.
158. Kato, A., et al., Deletion of a novel F-box protein, MUS-10, in Neurospora crassa leads to altered mitochondrial morphology, instability of mtDNA and senescence. Genetics, 2010. 185(4): p. 1257-69.
159. Scheckhuber, C.Q., et al., Reducing mitochondrial fission results in increased life span and fitness of two fungal ageing models. Nat Cell Biol, 2007. 9(1): p. 99-105.
160. Figge, M.T., et al., Deceleration of fusion-fission cycles improves mitochondrial quality control during aging. PLoS computational biology, 2012. 8(6): p. e1002576.
161. Du, Y., et al., Ptc1p regulates cortical ER inheritance via Slt2p. EMBO J, 2006. 25(19): p. 4413-22.
162. Babour, A., et al., A surveillance pathway monitors the fitness of the endoplasmic reticulum to control its inheritance. Cell, 2010. 142(2): p. 256-69.
163. Clay, L., et al., A sphingolipid-dependent diffusion barrier confines ER stress to the yeast mother cell. Elife, 2014. 3: p. e01883.
164. Luedeke, C., et al., Septin-dependent compartmentalization of the endoplasmic reticulum during yeast polarized growth. J Cell Biol, 2005. 169(6): p. 897-908.
165. Shepard, K.A., et al., Widespread cytoplasmic mRNA transport in yeast: identification of 22 bud-localized transcripts using DNA microarray analysis. Proc Natl Acad Sci U S A, 2003. 100(20): p. 11429-34.
166. Merksamer, P.I., A. Trusina, and F.R. Papa, Real-time redox measurements during endoplasmic reticulum stress reveal interlinked protein folding functions. Cell, 2008. 135(5): p. 933-47.
167. Wallace, D.C., A mitochondrial paradigm of metabolic and degenerative diseases, aging, and cancer: a dawn for evolutionary medicine. Annu Rev Genet, 2005. 39: p. 359-407.
168. Park, C.B. and N.G. Larsson, Mitochondrial DNA mutations in disease and aging. The Journal of cell biology, 2011. 193(5): p. 809-18.

194
169. Yu, M., Generation, function and diagnostic value of mitochondrial DNA copy number alterations in human cancers. Life sciences, 2011. 89(3-4): p. 65-71.
170. Cook, C.C. and M. Higuchi, The awakening of an advanced malignant cancer: an insult to the mitochondrial genome. Biochimica et biophysica acta, 2012. 1820(5): p. 652-62.
171. Crider, D.G., et al., Rad53 is essential for a mitochondrial DNA inheritance checkpoint regulating G1 to S progression. The Journal of cell biology, 2012. 198(5): p. 793-8.
172. Taylor, S.D., et al., The conserved Mec1/Rad53 nuclear checkpoint pathway regulates mitochondrial DNA copy number in Saccharomyces cerevisiae. Molecular biology of the cell, 2005. 16(6): p. 3010-8.
173. Lebedeva, M.A. and G.S. Shadel, Cell cycle- and ribonucleotide reductase-driven changes in mtDNA copy number influence mtDNA Inheritance without compromising mitochondrial gene expression. Cell Cycle, 2007. 6(16): p. 2048-57.
174. Reinhardt, H.C. and M.B. Yaffe, Kinases that control the cell cycle in response to DNA damage: Chk1, Chk2, and MK2. Curr Opin Cell Biol, 2009. 21(2): p. 245-55.
175. Eaton, J.S., et al., Ataxia-telangiectasia mutated kinase regulates ribonucleotide reductase and mitochondrial homeostasis. J Clin Invest, 2007. 117(9): p. 2723-34.
176. Sinclair, D.A. and L. Guarente, Extrachromosomal rDNA circles--a cause of aging in yeast. Cell, 1997. 91(7): p. 1033-42.
177. Erjavec, N. and T. Nyström, Sir2p-dependent protein segregation gives rise to a superior reactive oxygen species management in the progeny of Saccharomyces cerevisiae. Proc Natl Acad Sci U S A, 2007. 104: p. 10877-10881.
178. Klinger, H., et al., Quantitation of (a)symmetric inheritance of functional and of oxidatively damaged mitochondrial aconitase in the cell division of old yeast mother cells. Experimental gerontology, 2010. 45(7-8): p. 533-42.
179. Hughes, A.L. and D.E. Gottschling, An early age increase in vacuolar pH limits mitochondrial function and lifespan in yeast. Nature, 2012.
180. Spokoini, R., et al., Confinement to organelle-associated inclusion structures mediates asymmetric inheritance of aggregated protein in budding yeast. Cell reports, 2012. 2(4): p. 738-47.
181. Rafelski, S.M., et al., Mitochondrial network size scaling in budding yeast. Science, 2012. 338(6108): p. 822-4.
182. Young, P., et al., Molecular structure of the sarcomeric Z-disk: two types of titin interactions lead to an asymmetrical sorting of alpha-actinin. EMBO J, 1998. 17(6): p. 1614-24.
183. Saladin, K.S., Anatomy and Physiology: The Unity of Form and Function. 3rd ed. 2004, New York, NY: McGraw-Hill. 1120.

195
184. Grabner, M., et al., The II-III loop of the skeletal muscle dihydropyridine receptor is responsible for the Bi-directional coupling with the ryanodine receptor. J Biol Chem, 1999. 274(31): p. 21913-9.
185. Flucher, B.E., et al., Type 3 and type 1 ryanodine receptors are localized in triads of the same mammalian skeletal muscle fibers. J Cell Biol, 1999. 146(3): p. 621-30.
186. Van Petegem, F., Ryanodine receptors: structure and function. J Biol Chem, 2012. 287(38): p. 31624-32.
187. Garcia-Perez, C., et al., Alignment of sarcoplasmic reticulum-mitochondrial junctions with mitochondrial contact points. Am J Physiol Heart Circ Physiol, 2011. 301(5): p. H1907-15.
188. Sanes, J.R. and J.W. Lichtman, Development of the vertebrate neuromuscular junction. Annu Rev Neurosci, 1999. 22: p. 389-442.
189. Egilmez, N.K. and S.M. Jazwinski, Evidence for the involvement of a cytoplasmic factor in the aging of the yeast Saccharomyces cerevisiae. J Bacteriol, 1989. 171(1): p. 37-42.
190. Kennedy, B.K., N.R. Austriaco, and L. Guarente, Daughter cells of Saccharomyces cerevisiae from old mothers display a reduced life span. J Cell Biol, 1994. 127(6 Pt 2): p. 1985-93.
191. Mortimer, R.K. and J.R. Johnston, Life span of individual yeast cells. Nature, 1959. 183(4677): p. 1751-2.
192. Aguilaniu, H., et al., Asymmetric inheritance of oxidatively damaged proteins during cytokinesis. Science, 2003. 299(5613): p. 1751-3.
193. Lai, C.Y., et al., A mutation in the ATP2 gene abrogates the age asymmetry between mother and daughter cells of the yeast Saccharomyces cerevisiae. Genetics, 2002. 162(1): p. 73-87.
194. Eisenberg, T., et al., Induction of autophagy by spermidine promotes longevity. Nat Cell Biol, 2009. 11(11): p. 1305-14.
195. Erjavec, N., et al., Selective benefits of damage partitioning in unicellular systems and its effects on aging. Proc Natl Acad Sci USA, 2008. 105(48): p. 18764-9.
196. Heeren, G., et al., The role of respiration, reactive oxygen species and oxidative stress in mother cell-specific ageing of yeast strains defective in the RAS signalling pathway. FEMS Yeast Res, 2004. 5(2): p. 157-67.
197. Nestelbacher, R., et al., The influence of oxygen toxicity on yeast mother cell-specific aging. Exp Gerontol, 2000. 35(1): p. 63-70.
198. Erjavec, N., et al., Accelerated aging and failure to segregate damaged proteins in Sir2 mutants can be suppressed by overproducing the protein aggregation-remodeling factor Hsp104p. Genes Dev, 2007. 21(19): p. 2410-21.

196
199. Kaeberlein, M., M. McVey, and L. Guarente, The SIR2/3/4 complex and SIR2 alone promote longevity in Saccharomyces cerevisiae by two different mechanisms. Genes Dev, 1999. 13(19): p. 2570-80.
200. Lam, Y.T., et al., Changes in reactive oxygen species begin early during replicative aging of Saccharomyces cerevisiae cells, in Free Radic Biol Med. 2011. p. 963-70.
201. Miquel, J. and A.C. Economos, Favorable effects of the antioxidants sodium and magnesium thiazolidine carboxylate on the vitality and life span of Drosophila and mice. Exp Gerontol, 1979. 14(5): p. 279-85.
202. Schriner, S.E., et al., Extension of murine life span by overexpression of catalase targeted to mitochondria. Science, 2005. 308(5730): p. 1909-11.
203. Sun, J. and J. Tower, FLP recombinase-mediated induction of Cu/Zn-superoxide dismutase transgene expression can extend the life span of adult Drosophila melanogaster flies. Mol Cell Biol, 1999. 19(1): p. 216-28.
204. Longo, V.D., E.B. Gralla, and J.S. Valentine, Superoxide dismutase activity is essential for stationary phase survival in Saccharomyces cerevisiae. Mitochondrial production of toxic oxygen species in vivo, in J Biol Chem. 1996. p. 12275-80.
205. Stöckl, P., et al., Partial uncoupling of oxidative phosphorylation induces premature senescence in human fibroblasts and yeast mother cells, in Free Radic Biol Med. 2007. p. 947-58.
206. Barros, M.H., et al., Higher respiratory activity decreases mitochondrial reactive oxygen release and increases life span in Saccharomyces cerevisiae, in J Biol Chem. 2004. p. 49883-8.
207. Bonawitz, N.D., et al., Reduced TOR signaling extends chronological life span via increased respiration and upregulation of mitochondrial gene expression. Cell metabolism, 2007. 5(4): p. 265-277.
208. Fabrizio, P., et al., SOD2 functions downstream of Sch9 to extend longevity in yeast, in Genetics. 2003. p. 35-46.
209. Harris, N., et al., Mnsod overexpression extends the yeast chronological (G(0)) life span but acts independently of Sir2p histone deacetylase to shorten the replicative life span of dividing cells, in Free Radic Biol Med. 2003. p. 1599-606.
210. Jiang, J.C., et al., An intervention resembling caloric restriction prolongs life span and retards aging in yeast, in FASEB J. 2000. p. 2135-7.
211. Lavoie, H. and M. Whiteway, Increased respiration in the sch9Delta mutant is required for increasing chronological life span but not replicative life span. Eukaryotic cell, 2008. 7(7): p. 1127-1135.
212. Mittal, N., M.M. Babu, and N. Roy, The efficiency of mitochondrial electron transport chain is increased in the long-lived mrg19 Saccharomyces cerevisiae, in Aging Cell. 2009. p. 643-53.

197
213. Kaeberlein, M., et al., Increased life span due to calorie restriction in respiratory-deficient yeast. PLoS Genet, 2005. 1(5): p. e69.
214. Lin, S.-J., et al., Calorie restriction extends yeast life span by lowering the level of NADH. Genes & Development, 2004. 18(1): p. 12-16.
215. Lin, S.-J., et al., Calorie restriction extends Saccharomyces cerevisiae lifespan by increasing respiration. Nature, 2002. 418(6895): p. 344-348.
216. Kirchman, P.A., et al., Interorganelle signaling is a determinant of longevity in Saccharomyces cerevisiae. Genetics, 1999. 152(1): p. 179-90.
217. Smith, E.D., et al., Quantitative evidence for conserved longevity pathways between divergent eukaryotic species. Genome Res, 2008. 18(4): p. 564-70.
218. Garcia-Rodriguez, L.J., et al., Mitochondrial inheritance is required for MEN-regulated cytokinesis in budding yeast. Curr Biol, 2009. 19(20): p. 1730-5.
219. Dooley, C.T., et al., Imaging dynamic redox changes in mammalian cells with green fluorescent protein indicators. J Biol Chem, 2004. 279(21): p. 22284-93.
220. Hanson, G.T., et al., Investigating mitochondrial redox potential with redox-sensitive green fluorescent protein indicators. J Biol Chem, 2004. 279(13): p. 13044-53.
221. Peraza-Reyes, L., D.G. Crider, and L.A. Pon, Mitochondrial manoeuvres: latest insights and hypotheses on mitochondrial partitioning during mitosis in Saccharomyces cerevisiae. Bioessays, 2010. 32(12): p. 1040-9.
222. Shcheprova, Z., et al., A mechanism for asymmetric segregation of age during yeast budding. Nature, 2008. 454(7205): p. 728-34.
223. Collins, T.J., et al., Mitochondria are morphologically and functionally heterogeneous within cells. EMBO J, 2002. 21(7): p. 1616-27.
224. Wikstrom, J.D., et al., beta-Cell mitochondria exhibit membrane potential heterogeneity that can be altered by stimulatory or toxic fuel levels. Diabetes, 2007. 56(10): p. 2569-78.
225. Laun, P., et al., Aged mother cells of Saccharomyces cerevisiae show markers of oxidative stress and apoptosis, in Mol Microbiol. 2001. p. 1166-73.
226. Van Zandycke, S.M., P.J. Sohier, and K.A. Smart, The impact of catalase expression on the replicative lifespan of Saccharomyces cerevisiae. Mech Ageing Dev, 2002. 123(4): p. 365-73.
227. Kirchman, P.A., et al., Prohibitins and Ras2 protein cooperate in the maintenance of mitochondrial function during yeast aging, in Acta Biochim Pol. 2003. p. 1039-56.
228. Piper, P.W., et al., The shortened replicative life span of prohibitin mutants of yeast appears to be due to defective mitochondrial segregation in old mother cells, in Aging Cell. 2002. p. 149-57.
198
229. Lackner, L.L., Shaping the dynamic mitochondrial network. BMC Biol, 2014. 12: p. 35.
230. Sheng, Z.H., Mitochondrial trafficking and anchoring in neurons: New insight and implications. J Cell Biol, 2014. 204(7): p. 1087-98.
231. Quintana, A. and M. Hoth, Mitochondrial dynamics and their impact on T cell function. Cell Calcium, 2012. 52(1): p. 57-63.
232. Hollenbeck, P.J. and W.M. Saxton, The axonal transport of mitochondria. J Cell Sci, 2005. 118(Pt 23): p. 5411-9.
233. Gauss, R., et al., New modules for the repeated internal and N-terminal epitope tagging of genes in Saccharomyces cerevisiae. Yeast (Chichester, England), 2005. 22(1): p. 1-12.
234. Longtine, M.S., et al., Additional modules for versatile and economical PCR-based gene deletion and modification in Saccharomyces cerevisiae. Yeast (Chichester, England), 1998. 14(10): p. 953-61.
235. Young, C.L., D.L. Raden, and J.L. Caplan, Cassette series designed for live‐cell
imaging of proteins and high‐resolution techniques in yeast. Yeast, 2012: p. 119-136.
236. McFaline-Figueroa, J.R., et al., Mitochondrial quality control during inheritance is associated with lifespan and mother-daughter age asymmetry in budding yeast. Aging cell, 2011. 10(5): p. 885-95.
237. Costanzo, M., et al., The genetic landscape of a cell. Science (New York, N.Y.), 2010. 327(5964): p. 425-31.
238. Kondo-Okamoto, N., et al., The novel F-box protein Mfb1p regulates mitochondrial connectivity and exhibits asymmetric localization in yeast. Mol Biol Cell, 2006. 17(9): p. 3756-67.
239. Durr, M., et al., Nonredundant roles of mitochondria-associated F-box proteins Mfb1 and Mdm30 in maintenance of mitochondrial morphology in yeast. Mol Biol Cell, 2006. 17(9): p. 3745-55.
240. Lamari, F., et al., Disorders of phospholipids, sphingolipids and fatty acids biosynthesis: toward a new category of inherited metabolic diseases. J Inherit Metab Dis, 2013. 36(3): p. 411-25.
241. Mitsuhashi, S., et al., A congenital muscular dystrophy with mitochondrial structural abnormalities caused by defective de novo phosphatidylcholine biosynthesis. American journal of human genetics, 2011. 88(6): p. 845-51.
242. Testerink, N., et al., Depletion of phosphatidylcholine affects endoplasmic reticulum morphology and protein traffic at the Golgi complex. Journal of lipid research, 2009. 50(11): p. 2182-92.
243. Walther, T.C. and R.V. Farese, The life of lipid droplets. Biochimica et biophysica acta, 2009. 1791(6): p. 459-66.

199
244. Mumberg, D., R. Muller, and M. Funk, Yeast vectors for the controlled expression of heterologous proteins in different genetic backgrounds. Gene, 1995. 156(1): p. 119-22.
245. Ladner, C.L., et al., Visible fluorescent detection of proteins in polyacrylamide gels without staining. Analytical biochemistry, 2004. 326(1): p. 13-20.
246. Perkins, E.M. and J.M. McCaffery, Conventional and immunoelectron microscopy of mitochondria. Methods Mol Biol, 2007. 372: p. 467-83.
247. Trapnell, C., et al., Differential gene and transcript expression analysis of RNA-seq experiments with TopHat and Cufflinks. Nature Protocols, 2012. 7(3): p. 562-578.
248. Huang, D.W., B.T. Sherman, and R.a. Lempicki, Systematic and integrative analysis of large gene lists using DAVID bioinformatics resources. Nature protocols, 2009. 4(1): p. 44-57.
249. Supek, F., et al., REVIGO summarizes and visualizes long lists of gene ontology terms. PloS one, 2011. 6(7): p. e21800-e21800.
250. Vevea, J.D., et al., Ratiometric biosensors that measure mitochondrial redox state and ATP in living yeast cells. J Vis Exp, 2013(77).
251. De Vos, K.J. and M.P. Sheetz, Visualization and quantification of mitochondrial dynamics in living animal cells. Methods in cell biology, 2007. 80(06): p. 627-82.
252. Carman, G.M. and S.a. Henry, Phospholipid biosynthesis in the yeast Saccharomyces cerevisiae and interrelationship with other metabolic processes. Progress in lipid research, 1999. 38(5-6): p. 361-99.
253. García-Rodríguez, L.J., et al., Mitochondrial inheritance is required for MEN-regulated cytokinesis in budding yeast. Current biology : CB, 2009. 19(20): p. 1730-5.
254. Mousley, C.J., K. Tyeryar, and K.E. Ile, Trans-Golgi network and endosome dynamics connect ceramide homeostasis with regulation of the unfolded protein response and TOR signaling in yeast. Molecular biology of …, 2008. 19(November): p. 4785-4803.
255. Yang, H.-J., et al., Monodansylpentane as a blue-fluorescent lipid-droplet marker for multi-color live-cell imaging. PloS one, 2012. 7(3): p. e32693-e32693.
256. Fei, W., et al., Fld1p, a functional homologue of human seipin, regulates the size of lipid droplets in yeast. J Cell Biol, 2008. 180(3): p. 473-82.
257. Dahlqvist, A., et al., Phospholipid:diacylglycerol acyltransferase: an enzyme that catalyzes the acyl-CoA-independent formation of triacylglycerol in yeast and plants. Proc Natl Acad Sci U S A, 2000. 97(12): p. 6487-92.
258. Oelkers, P., et al., The DGA1 gene determines a second triglyceride synthetic pathway in yeast. J Biol Chem, 2002. 277(11): p. 8877-81.

200
259. Jacquier, N., et al., Lipid droplets are functionally connected to the endoplasmic reticulum in Saccharomyces cerevisiae. Journal of cell science, 2011. 124(Pt 14): p. 2424-37.
260. Li, W.W., J. Li, and J.K. Bao, Microautophagy: lesser-known self-eating. Cell Mol Life Sci, 2012. 69(7): p. 1125-36.
261. Klionsky, D.J., et al., Guidelines for the use and interpretation of assays for monitoring autophagy. Autophagy, 2012. 8(4): p. 445-544.
262. Kirisako, T., et al., Formation process of autophagosome is traced with Apg8/Aut7p in yeast. J Cell Biol, 1999. 147(2): p. 435-46.
263. Suzuki, K., et al., The pre-autophagosomal structure organized by concerted functions of APG genes is essential for autophagosome formation. EMBO J, 2001. 20(21): p. 5971-81.
264. van Zutphen, T., et al., Lipid droplet autophagy in the yeast Saccharomyces cerevisiae. Molecular biology of the cell, 2014. 25(2): p. 290-301.
265. Schroder, M., R. Clark, and R.J. Kaufman, IRE1- and HAC1-independent transcriptional regulation in the unfolded protein response of yeast. Mol Microbiol, 2003. 49(3): p. 591-606.
266. Liu, Y. and A. Chang, Heat shock response relieves ER stress. EMBO J, 2008. 27(7): p. 1049-59.
267. Schirmer, E.C., et al., HSP100/Clp proteins: a common mechanism explains diverse functions. Trends Biochem Sci, 1996. 21(8): p. 289-96.
268. Glover, J.R. and S. Lindquist, Hsp104, Hsp70, and Hsp40: a novel chaperone system that rescues previously aggregated proteins. Cell, 1998. 94(1): p. 73-82.
269. Kaganovich, D., R. Kopito, and J. Frydman, Misfolded proteins partition between two distinct quality control compartments. Nature, 2008. 454(7208): p. 1088-95.
270. Escusa-Toret, S., W.I. Vonk, and J. Frydman, Spatial sequestration of misfolded proteins by a dynamic chaperone pathway enhances cellular fitness during stress. Nat Cell Biol, 2013. 15(10): p. 1231-43.
271. Vembar, S.S. and J.L. Brodsky, One step at a time: endoplasmic reticulum-associated degradation. Nat Rev Mol Cell Biol, 2008. 9(12): p. 944-57.
272. Normington, K., et al., S. cerevisiae encodes an essential protein homologous in sequence and function to mammalian BiP. Cell, 1989. 57(7): p. 1223-36.
273. Kall, L., A. Krogh, and E.L. Sonnhammer, A combined transmembrane topology and signal peptide prediction method. J Mol Biol, 2004. 338(5): p. 1027-36.
274. Schuh, A.L. and A. Audhya, The ESCRT machinery: from the plasma membrane to endosomes and back again. Crit Rev Biochem Mol Biol, 2014. 49(3): p. 242-61.

201
275. Li, M., et al., Ubiquitin-dependent lysosomal membrane protein sorting and degradation. Mol Cell, 2015. 57(3): p. 467-78.
276. Raymond, C.K., et al., Morphological classification of the yeast vacuolar protein sorting mutants: evidence for a prevacuolar compartment in class E vps mutants. Mol Biol Cell, 1992. 3(12): p. 1389-402.
277. Gruner, S.M., Intrinsic curvature hypothesis for biomembrane lipid composition: a role for nonbilayer lipids. Proceedings of the National Academy of Sciences of the United States of America, 1985. 82(11): p. 3665-9.
278. Singh, R., et al., Autophagy regulates lipid metabolism. Nature, 2009. 458(7242): p. 1131-5.
279. Dall'Armi, C., Kelly A. Devereaux, and G. Di Paolo, The Role of Lipids in the Control of Autophagy. Current Biology, 2013. 23(1): p. R33-R45.
280. Hoffman, E.P., R.H. Brown, Jr., and L.M. Kunkel, Dystrophin: the protein product of the Duchenne muscular dystrophy locus. Cell, 1987. 51(6): p. 919-28.
281. Hoffman, E.P., et al., Subcellular fractionation of dystrophin to the triads of skeletal muscle. Nature, 1987. 330(6150): p. 754-8.
282. Worman, H.J. and G. Bonne, "Laminopathies": a wide spectrum of human diseases. Exp Cell Res, 2007. 313(10): p. 2121-33.
283. Cardamone, M., B.T. Darras, and M.M. Ryan, Inherited myopathies and muscular dystrophies. Semin Neurol, 2008. 28(2): p. 250-9.
284. McNally, E.M. and P. Pytel, Muscle diseases: the muscular dystrophies. Annu Rev Pathol, 2007. 2: p. 87-109.
285. Clarkson, E., C.F. Costa, and L.M. Machesky, Congenital myopathies: diseases of the actin cytoskeleton. J Pathol, 2004. 204(4): p. 407-17.
286. Zhang, Y., et al., A mutation in the human ryanodine receptor gene associated with central core disease. Nat Genet, 1993. 5(1): p. 46-50.
287. Dubowitz, V. and M. Platts, Central core disease of muscle with focal wasting. J Neurol Neurosurg Psychiatry, 1965. 28(5): p. 432-7.
288. Taratuto, A.L., Congenital myopathies and related disorders. Curr Opin Neurol, 2002. 15(5): p. 553-61.
289. Nishino, I., et al., A new congenital muscular dystrophy with mitochondrial structural abnormalities. Muscle Nerve, 1998. 21(1): p. 40-7.
290. Sher, R.B., et al., A rostrocaudal muscular dystrophy caused by a defect in choline kinase beta, the first enzyme in phosphatidylcholine biosynthesis. The Journal of biological chemistry, 2006. 281(8): p. 4938-48.
202
291. Gutierrez Rios, P., et al., Congenital megaconial myopathy due to a novel defect in the choline kinase Beta gene. Arch Neurol, 2012. 69(5): p. 657-61.
292. Kodaki, T. and S. Yamashita, Characterization of the methyltransferases in the yeast phosphatidylethanolamine methylation pathway by selective gene disruption. Eur J Biochem, 1989. 185(2): p. 243-51.
293. Cheng, H., W.J. Lederer, and M.B. Cannell, Calcium sparks: elementary events underlying excitation-contraction coupling in heart muscle. Science, 1993. 262(5134): p. 740-4.
294. Lehnart, S.E., et al., Leaky Ca2+ release channel/ryanodine receptor 2 causes seizures and sudden cardiac death in mice. J Clin Invest, 2008. 118(6): p. 2230-45.
295. Bellinger, A.M., et al., Hypernitrosylated ryanodine receptor calcium release channels are leaky in dystrophic muscle. Nat Med, 2009. 15(3): p. 325-30.
296. Andersson, D.C., et al., Ryanodine receptor oxidation causes intracellular calcium leak and muscle weakness in aging. Cell Metab, 2011. 14(2): p. 196-207.
297. Clem, B.F., et al., A novel small molecule antagonist of choline kinase-alpha that simultaneously suppresses MAPK and PI3K/AKT signaling. Oncogene, 2011. 30(30): p. 3370-80.
298. Gyorke, I. and S. Gyorke, Adaptive control of intracellular Ca2+ release in C2C12 mouse myotubes. Pflugers Arch, 1996. 431(6): p. 838-43.
299. Lorenzon, P., et al., Spontaneous and repetitive calcium transients in C2C12 mouse myotubes during in vitro myogenesis. Eur J Neurosci, 1997. 9(4): p. 800-8.
300. Sutko, J.L., K. Ito, and J.L. Kenyon, Ryanodine: a modifier of sarcoplasmic reticulum calcium release in striated muscle. Fed Proc, 1985. 44(15): p. 2984-8.
301. Mitsuhashi, S., et al., Muscle choline kinase beta defect causes mitochondrial dysfunction and increased mitophagy. Hum Mol Genet, 2011. 20(19): p. 3841-51.
302. Eltit, J.M., et al., Orthograde dihydropyridine receptor signal regulates ryanodine receptor passive leak. Proc Natl Acad Sci U S A, 2011. 108(17): p. 7046-51.
303. Guerrero-Hernandez, A., G. Avila, and A. Rueda, Ryanodine receptors as leak channels. Eur J Pharmacol, 2014. 739: p. 26-38.
304. Zalk, R., S.E. Lehnart, and A.R. Marks, Modulation of the ryanodine receptor and intracellular calcium. Annu Rev Biochem, 2007. 76: p. 367-85.
305. Logan, C.V., et al., Loss-of-function mutations in MICU1 cause a brain and muscle disorder linked to primary alterations in mitochondrial calcium signaling. Nat Genet, 2014. 46(2): p. 188-93.
306. Lehnart, S.E., et al., Phosphodiesterase 4D deficiency in the ryanodine-receptor complex promotes heart failure and arrhythmias. Cell, 2005. 123(1): p. 25-35.

203
307. Lehnart, S.E., et al., Stabilization of cardiac ryanodine receptor prevents intracellular calcium leak and arrhythmias. Proc Natl Acad Sci U S A, 2006. 103(20): p. 7906-10.
308. Liu, X., et al., Role of leaky neuronal ryanodine receptors in stress-induced cognitive dysfunction. Cell, 2012. 150(5): p. 1055-67.
309. Marks, A.R., Calcium cycling proteins and heart failure: mechanisms and therapeutics. J Clin Invest, 2013. 123(1): p. 46-52.
310. Goussakov, I., S. Chakroborty, and G.E. Stutzmann, Generation of dendritic Ca2+ oscillations as a consequence of altered ryanodine receptor function in AD neurons. Channels (Austin), 2011. 5(1): p. 9-13.
311. Sajikumar, S., et al., Priming of short-term potentiation and synaptic tagging/capture mechanisms by ryanodine receptor activation in rat hippocampal CA1. Learn Mem, 2009. 16(3): p. 178-86.
312. Del Prete, D., F. Checler, and M. Chami, Ryanodine receptors: physiological function and deregulation in Alzheimer disease. Mol Neurodegener, 2014. 9: p. 21.
313. Parent, A., et al., Synaptic transmission and hippocampal long-term potentiation in transgenic mice expressing FAD-linked presenilin 1. Neurobiol Dis, 1999. 6(1): p. 56-62.
314. Chakroborty, S., et al., Deviant ryanodine receptor-mediated calcium release resets synaptic homeostasis in presymptomatic 3xTg-AD mice. J Neurosci, 2009. 29(30): p. 9458-70.
315. Breckwoldt, M.O., et al., Multiparametric optical analysis of mitochondrial redox signals during neuronal physiology and pathology in vivo. Nat Med, 2014. 20(5): p. 555-60.
316. van den Brink-van der Laan, E., J.A. Killian, and B. de Kruijff, Nonbilayer lipids affect peripheral and integral membrane proteins via changes in the lateral pressure profile. Biochim Biophys Acta, 2004. 1666(1-2): p. 275-88.
317. Lee, A.G., Biological membranes: the importance of molecular detail. Trends Biochem Sci, 2011. 36(9): p. 493-500.
318. Starling, A.P., et al., Effects of phosphatidylethanolamines on the activity of the Ca(2+)-ATPase of sarcoplasmic reticulum. Biochem J, 1996. 320 ( Pt 1): p. 309-14.
319. Powl, A.M., J.M. East, and A.G. Lee, Anionic phospholipids affect the rate and extent of flux through the mechanosensitive channel of large conductance MscL. Biochemistry, 2008. 47(14): p. 4317-28.
320. Powl, A.M., J.M. East, and A.G. Lee, Importance of direct interactions with lipids for the function of the mechanosensitive channel MscL. Biochemistry, 2008. 47(46): p. 12175-84.
321. Hakizimana, P., et al., Interactions between phosphatidylethanolamine headgroup and LmrP, a multidrug transporter: a conserved mechanism for proton gradient sensing? J Biol Chem, 2008. 283(14): p. 9369-76.
204
322. Kornmann, B., The molecular hug between the ER and the mitochondria. Curr Opin Cell Biol, 2013. 25(4): p. 443-8.
323. Fader, C.M. and M.I. Colombo, Autophagy and multivesicular bodies: two closely related partners. Cell Death Differ, 2009. 16(1): p. 70-8.
324. Hao, N. and E.K. O'Shea, Signal-dependent dynamics of transcription factor translocation controls gene expression. Nat Struct Mol Biol, 2012. 19(1): p. 31-9.
325. Abu-Jamous, B., et al., Comprehensive analysis of forty yeast microarray datasets reveals a novel subset of genes (APha-RiB) consistently negatively associated with ribosome biogenesis. BMC Bioinformatics, 2014. 15: p. 322.
326. Gardner, B.M. and P. Walter, Unfolded proteins are Ire1-activating ligands that directly induce the unfolded protein response. Science, 2011. 333(6051): p. 1891-4.
327. Klose, C., et al., Flexibility of a eukaryotic lipidome--insights from yeast lipidomics. PLoS One, 2012. 7(4): p. e35063.
328. Beach, A., et al., Mitochondrial membrane lipidome defines yeast longevity. Aging (Albany NY), 2013. 5(7): p. 551-74.
329. Zalk, R., et al., Structure of a mammalian ryanodine receptor. Nature, 2015. 517(7532): p. 44-9.
330. Rizzuto, R., et al., Mitochondria as sensors and regulators of calcium signalling. Nat Rev Mol Cell Biol, 2012. 13(9): p. 566-78.
331. Mammucari, C. and R. Rizzuto, Signaling pathways in mitochondrial dysfunction and aging. Mech Ageing Dev, 2010. 131(7-8): p. 536-43.
332. Lin, M.T. and M.F. Beal, Mitochondrial dysfunction and oxidative stress in neurodegenerative diseases. Nature, 2006. 443(7113): p. 787-95.
333. Schon, E.A. and S. Przedborski, Mitochondria: the next (neurode)generation. Neuron, 2011. 70(6): p. 1033-53.
334. Schafer, F.Q. and G.R. Buettner, Redox environment of the cell as viewed through the redox state of the glutathione disulfide/glutathione couple. Free Radic Biol Med, 2001. 30(11): p. 1191-212.
335. Maechler, P., H. Wang, and C.B. Wollheim, Continuous monitoring of ATP levels in living insulin secreting cells expressing cytosolic firefly luciferase. FEBS Lett, 1998. 422(3): p. 328-32.
336. Ouhabi, R., M. Boue-Grabot, and J.P. Mazat, Mitochondrial ATP synthesis in permeabilized cells: assessment of the ATP/O values in situ. Anal Biochem, 1998. 263(2): p. 169-75.

205
337. Strehler, B.L. and J.R. Totter, Firefly luminescence in the study of energy transfer mechanisms. I. Substrate and enzyme determination. Arch Biochem Biophys, 1952. 40(1): p. 28-41.
338. Lemasters, J.J. and C.E. Hackenbrock, Adenosine triphosphate: continuous measurement in mitochondrial suspension by firefly luciferase luminescence. Biochem Biophys Res Commun, 1973. 55(4): p. 1262-70.
339. Wibom, R., A. Lundin, and E. Hultman, A sensitive method for measuring ATP-formation in rat muscle mitochondria. Scand J Clin Lab Invest, 1990. 50(2): p. 143-52.
340. Manfredi, G., et al., Assay of mitochondrial ATP synthesis in animal cells. Methods Cell Biol, 2001. 65: p. 133-45.
341. Deluca, M., Firefly luciferase. Adv Enzymol Relat Areas Mol Biol, 1976. 44: p. 37-68.
342. Atamna, H. and W.H. Frey, 2nd, Mechanisms of mitochondrial dysfunction and energy deficiency in Alzheimer's disease. Mitochondrion, 2007. 7(5): p. 297-310.
343. Schwarzlander, M., et al., Confocal imaging of glutathione redox potential in living plant cells. J Microsc, 2008. 231(2): p. 299-316.
344. Nakano, M., et al., Ca(2)(+) regulation of mitochondrial ATP synthesis visualized at the single cell level. ACS Chem Biol, 2011. 6(7): p. 709-15.
345. Berg, J., Y.P. Hung, and G. Yellen, A genetically encoded fluorescent reporter of ATP:ADP ratio. Nat Methods, 2009. 6(2): p. 161-6.
346. Schneider, C.A., W.S. Rasband, and K.W. Eliceiri, NIH Image to ImageJ: 25 years of image analysis. Nat Methods, 2012. 9(7): p. 671-5.
347. Patterson, G.H. and J. Lippincott-Schwartz, A photoactivatable GFP for selective photolabeling of proteins and cells. Science, 2002. 297(5588): p. 1873-7.

206
Appendix
Ratiometric biosensors that measure mitochondrial redox state and ATP in living yeast
cells
Published:
Vevea JD*, Wolken DMA*, Swayne TC, White AB, Pon LA. Ratiometric biosensors that
measure mitochondrial redox state and ATP in living yeast cells. J. Vis. Exp. 2013;(77):1–12.
*These authors contributed equally to this work

207
Abstract
Mitochondria have roles in many cellular processes, from energy metabolism and calcium
homeostasis to control of cellular lifespan and programmed cell death. These processes affect
and are affected by the redox status of and ATP production by mitochondria. Here, we describe
the use of two ratiometric, genetically encoded biosensors that can detect mitochondrial redox
state and ATP levels at subcellular resolution in living yeast cells. Mitochondrial redox state is
measured using redox-sensitive Green Fluorescent Protein (roGFP) that is targeted to the
mitochondrial matrix. Mito-roGFP contains cysteines at positions 147 and 204 of GFP, which
undergo reversible and environment-dependent oxidation and reduction, which in turn alter the
excitation spectrum of the protein. MitGO-ATeam is a Förster resonance energy transfer (FRET)
probe in which the ε subunit of the FoF1-ATP synthase is sandwiched between FRET donor and
acceptor fluorescent proteins. Binding of ATP to the ε subunit results in conformation changes
in the protein that bring the FRET donor and acceptor in close proximity and allow for
fluorescence resonance energy transfer from the donor to acceptor.

208
Introduction
Mitochondria are essential organelles for ATP production, biosynthesis of amino acids,
fatty acids, heme, iron sulfur clusters and pyrimidines. Mitochondria also play pivotal roles in
calcium homeostasis, and in regulation of apoptosis [330]. Increasing evidence links
mitochondria to aging and age-related diseases including Parkinson's disease, Alzheimer's
disease, amyotrophic lateral sclerosis, and Huntington's disease [45]. While individuals live
their entire lives with mutations in mitochondrial proteins that are associated with
neurodegenerative diseases, the disease symptoms occur only later in life. This indicates that
changes occur in mitochondria with age that allow disease pathology to emerge. Indeed,
mitochondrial fitness is correlated with overall cell health and lifespan in yeast and mammalian
cells [236] [48]. Here, we describe how to use genetically encoded, ratiometric fluorescent
biosensors to assess two critical features of mitochondria in living yeast cells: redox state and
ATP levels.
Mitochondrial function in aerobic energy mobilization is well established. Mitochondrial
redox state is a product of reducing and oxidizing species in the organelle, including
NAD+/NADH, FAD/FADH2, NADP+/NADPH, glutathione/glutathione disulfide (GSH/GSSG) and
reactive oxygen species (ROS). Uncoupling mitochondria or hypoxia affects mitochondrial
respiratory activity and alters the ratio of NAD+ to NADH in the organelle. ROS, which are
produced from inefficient electron transfer between complexes of the electron transport chain in
the inner mitochondrial membrane, as well as from the deamination of amines via monoamine
oxidase in the outer mitochondrial membrane [47], damage lipids, proteins and nucleic acids
and have been linked to aging and age-associated neurodegenerative diseases [331] [332]
[333]. ROS also play a role in signal transduction in mitochondria, through oxidation of GSH. For
example, NADH dehydrogenase not only contributes to ROS production but also is regulated
through interactions with the glutathione pool [49] [50]. α-Ketoglutarate dehydrogenase and

209
aconitase, components of the TCA cycle, exhibit reduced activity in oxidizing environments [51]
[52]. Indeed, redox-dependent regulation of aconitase activity is conserved from bacteria to
mammals [53] [54]. Thus, monitoring the redox state and ATP levels of mitochondria is crucial
to understanding their function and role in disease pathology.
Biochemical methods have been used to assess the redox state or ATP levels of whole
cells or isolated mitochondria. Widely used methods to assess the redox state of whole cells or
isolated mitochondria are based on measuring the levels of the redox pair GSH/GSSG [334].
The luciferin-luciferase system is commonly used to measure mitochondrial ATP levels in either
permeabilized whole cells or isolated mitochondria [335] [336] [337] [338] [339]. In this assay,
luciferase binds to ATP and catalyzes the oxidation of and chemiluminescence from luciferin
[340]. The intensity of the emitted light is proportional to the amount of ATP in the reaction
mixture [341].
These methods have revealed fundamental information regarding mitochondrial function,
including the finding that patients with neurodegenerative diseases, such as Alzheimer’s
disease, have abnormally low ATP levels [342]. However, they cannot be used to image living,
intact cells. Moreover, methods based on whole-cell analysis provide an average of redox state
or ATP levels in all compartments of the cell. Measurements in isolated organelles are
potentially problematic because mitochondrial redox state or ATP levels may change during
subcellular fractionation. Finally, recent studies from our laboratory and others indicate that
mitochondria within individual cells are heterogeneous in function, which in turn affects the
lifespan of mother and daughter cells [236]. Thus, there is a need to measure mitochondrial
ATP levels and redox state in living cells with subcellular resolution.
The biosensors for mitochondrial function described here are both based on GFP.
Redox-sensitive GFP (roGFP) [220] [219] is a GFP variant in which surface-exposed cysteines
are added to the molecule. roGFP, like wild-type GFP, has two excitation peaks (at ~400 nm
and ~480 nm) and one emission peak at ~510 nm. Oxidation of the cysteine residues in roGFP

210
results in an increase in excitation at ~400 nm. Reduction of those cysteines favors excitation at
~480 nm. Thus, the ratio of 510 nm emission upon excitation of roGFP at 480 and 400 nm
reveals the relative amount of reduced and oxidized roGFP, which reflects the redox state of the
fluorophore’s environment.
Two versions of roGFP are widely used: roGFP1 and roGFP2. Both contain the same
cysteine insertions. roGFP1 is based on wild-type GFP and roGFP2 is based on S65T GFP,
which has more efficient excitation at 480 nm and less efficient excitation at 400 nm compared
to wt GFP [220] roGFP1 is less pH sensitive than roGFP2 and its dynamic range extends further
into the reduced range. Thus, roGFP1 may be more useful for monitoring more reducing
compartments such as mitochondria or the cytosol, and compartments with variable pH, such as
endosomes. roGFP2 offers brighter signal and, in some studies, a greater dynamic range than
roGFP1 [220] [343]. Studies in Arabidopsis thaliana indicate that the time required for response
to changes in redox state is similar for both sensors (t1/2 for oxidation, 65 and 95 sec and t1/2 for
reduction, 272 and 206 sec, for roGFP1 and roGFP2, respectively) [343].
MitGO-ATeam2 is a minimally invasive, reliable sensor that measures mitochondrial
ATP in the budding yeast Saccharomyces cerevisiae. GO-ATeam is a Förster resonance
energy transfer (FRET) probe that consists of the ε subunit of the FoF1-ATP synthase
sandwiched between FRET donor and acceptor fluorescent proteins (GFP and orange
fluorescent protein (OFP), respectively) [344]. Binding of ATP to the ε subunit results in
conformational changes in the protein that bring the FRET donor in close proximity to the
acceptor and allow for energy transfer from donor to acceptor. There are two variants of GO-
ATeam, GO-ATeam1 and GO-ATeam2. GO-ATeam2 has a higher affinity for MgATP than GO-
ATeam1, making it more suitable for measuring the typically lower [ATP] in mitochondria
compared to the cytosol [344].
To probe mitochondrial redox state, we constructed a fusion protein (mito-roGFP1)
consisting of roGFP1 fused to the ATP9 leader sequence and expressed from a centromere-

211
based (low copy number) yeast expression plasmid under control of the strong glyceraldehyde-
3-phosphate dehydrogenase (GPD) promoter (p416GPD, Addgene). We used roGFP1 to probe
the redox status of mitochondria in the context of aging of the model fungus Saccharomyces
cerevisiae1. We find that roGFP1 can detect changes in mitochondrial redox state that occur
during aging and in response to nutrient availability but has no apparent detrimental effect on
yeast cells. We also see variability in the redox state of mitochondria within individual living
yeast cells, a finding that underscores the importance of a biosensor with subcellular spatial
resolution.
MitGO-ATeam2 is a variant of GO-ATeam2, which has the mitochondrial signal
sequence of cytochrome c oxidase subunit VIIIA inserted at the amino terminus of GO-ATeam2
[344]. We modified the mitGO-ATeam2 probe (kindly provided by the laboratory of H. Noji,
Institute of Scientific and Industrial Research, Osaka University, Japan) for use in yeast by
subcloning it, via Xba1 and HindIII sites, into the yeast expression vector pAG415GPD-ccdB
(Addgene, Cambridge, MA, USA), which is a low-copy plasmid containing the strong constitutive
GPD promoter. We expressed mitGO-ATeam2 in budding yeast, and find, by counterstaining
with the DNA-binding dye DAPI, that it localizes exclusively to mitochondria, where it serves as
an effective probe to measure physiological changes in mitochondrial ATP levels.
roGFP and GO-ATeam are both genetically encoded. As a result, they can be
introduced and stably maintained in intact cells, and provide information on redox state or ATP
levels in individual, living cells. Moreover, both biosensors monitor changes in redox state or
ATP levels that occur under physiological conditions [345]. Both probes are also ratiometric.
As a result, measurements made with these probes are not affected by changes in biosensor
concentration or sample illumination or thickness. Finally, both biosensors provide subcellular
spatial resolution. Indeed, roGFP has been targeted to mitochondria, ER, endosomes and
peroxisomes [220], and can detect changes in redox state of each of these organelles, largely
independent of pH.

212
Procedure
1. Transformation of yeast cells with the biosensors
1.1 Transform the desired yeast strain with plasmid bearing mito-roGFP or mitGO-ATeam2
using the lithium acetate method.
1.2 To confirm transformation with the plasmid-borne biosensor and to prevent loss of the
plasmid, select and maintain transformants on the appropriate selective synthetic complete
medium (SC-Ura for mito-roGFP, or SC-Leu for mitGo-ATeam2). If the fluorescent probe has
been subcloned in a different plasmid than those described here, use the appropriate selective
medium. Visualize transformants by fluorescence microscopy to confirm that they express the
fluorescent biosensor and exhibit normal mitochondrial morphology.
2. Growth of cells and preparation for imaging
Cell function and response to drug treatment are highly dependent on cell density and metabolic
activity. Best results are obtained when cells are actively dividing (mid-log phase, ~0.5 – 1 x 10⁷
cells/ml). The most reliable way to generate mid-log phase cultures of consistent density is to
inoculate from a stationary-phase pre-culture.
2.1 Prepare a stationary-phase pre-culture: pick a single colony of transformed cells from a
plate and inoculate selective liquid media (5 ml in a 50 ml conical-bottom tube). Grow at
30°C with shaking at 225 rpm until the optical density of the culture at 600 nm (OD600)
has reached a plateau (24-48 hr).
2.2 Prepare a mid-log phase culture for observation: use the appropriate volume of pre-
culture to inoculate 5 ml of selective media in a 50 ml conical-bottom tube. YPD media is
autofluorescent and should not be used for these studies. Use synthetic complete,
glucose based, dropout (SC-Ura) media. Grow cells at 30°C, shaking at 225 rpm, for 4–

213
16 hr, until they reach mid-log phase (~0.5 – 1 x 10⁷ cells/ml). Cell density can be
determined by measuring OD600; calibrate the spectrophotometer to determine the
correct OD600 reading. On our Beckman DU530 (Beckman Coulter, Indianapolis, IN),
mid-log phase corresponds to an OD600 of 0.1-0.3.
Mito-roGFP1 senses fluctuations in the organelle in response to metabolic changes. For
example, in this assay mitochondrial redox state changes when yeast grow on
fermentable carbon sources (e.g. glucose, as in SC media) versus non-fermentable
carbon sources (e.g. glycerol, as in SGlyc media), and even in different batches of the
same media. Therefore, use the same batch of media for all experiments.
2.3 Cells are ready for concentration (see step 2.4) and imaging if no treatment is being
performed. If cells are being treated, incubate cells with the appropriate treatment and
continue to the next step.
2.4 Concentrate 1 ml of culture by centrifugation at 6,000 x g for 15 sec and resuspension of
the cell pellet in 20 µl of media. These conditions maximize the number of
distinguishable cells in the field of view.
2.5 Apply 2 µl of the resuspended cells to a slide. Cover with a coverslip (No. 1.5, preferably
high-performance 170±5 µm thickness), and seal the edges of the coverslip with clear
nail polish or valap (see Reagents). To seal with valap, melt a small amount on a metal
spatula by holding it over a Bunsen burner flame, then spread a small amount along the
edges of the coverslip.
2.6 Maintain cells at 30°C during imaging. An objective heater on the 100x oil immersion
lens used for imaging works well for this application. Under these conditions,
mitochondrial morphology, redox state and ATP levels remain unchanged during
imaging for 10-15 min
3. Imaging setup
3.1 Setup for imaging mito-roGFP1 on a wide-field fluorescence microscope

214
The steps here are tailored to the AxioObserver.Z1 microscope equipped with a Colibri
LED excitation source, a wide-field Orca ER camera and Axiovision acquisition software.
Photobleaching of both channels and photoconversion of oxidized mito-roGFP1 is reduced
significantly using LED illumination compared to mercury arc lamp illumination (see below).
To maximize signal and resolution, use the highest numerical aperture possible in the
objective, and the lowest magnification that provides sufficient spatial resolution. In addition, for
mito-roGFP imaging, verify that the objective transmits well at 365 nm. The 100x/1.3NA EC
PlanNeofluar objective (Zeiss) works well for this application.
Configure the acquisition software to capture the oxidized and reduced mito-roGFP1
species. We use the following conditions.
3.1.1 Configure the channel for oxidized mito-roGFP to use excitation at 365 nm (100% LED
power) and an emission filter suitable for GFP, such as the 38 HE filter set (Zeiss), with
the included excitation filter removed from the cube. Removal of the excitation filter
allows excitation at both 365 nm and 470 nm without the need to switch filters, thus
increasing achievable time resolution.
3.1.2 Configure the channel for reduced mito-roGFP to use excitation at 470 nm (100% LED
power) and, as mentioned above, the same emission filter cube used for the oxidized
mito-roGFP.
Set the camera to 1x1 binning to optimize spatial resolution.
3.1.3 Set software to acquire a z stack consisting of 11 slices with 0.5 µm spacing, collecting
both channels at each z position. This mode of acquisition is slower than acquiring each
z stack in turn, but it prevents artifacts arising from mitochondrial motion between
acquisition of the oxidized and reduced channels.
3.1.4 Image several cells to determine an appropriate exposure time, producing a strong but
not saturating signal. It is important to maintain the ratio of exposure times for oxidized

215
and reduced mito-roGFP1 for all experiments. For example, if the exposure times for
oxidized and reduced mito-roGFP1 are 300 and 100 ms, respectively, then the exposure
time for oxidized mito-roGFP1 should be 3 times that for reduced mito-roGFP for all
experiments.
3.2 Setup for imaging mitGO-ATeam2 on a spectral confocal microscope
To quantify ATP levels using mitGO-ATeam2, the fluorescence from GFP (emission
maximum 510 nm) must be distinguished from that from OFP (emission maximum 560 nm).
There are fluorescence filter sets that resolve the fluorescence emitted from these fluorophores.
However, we find that a spectral detector, available on many laser scanning confocal
microscopes, works best for this application. A spectral detector separates the fluorescence
emission into many components (typically 32 or more) according to wavelength. Several
adjacent wavelength bands can be combined into one image channel. The wavelengths to be
combined are selected empirically so as to maximize signal from GFP and OFP while avoiding
crossover of signal that would confound the FRET measurement. Use the highest numerical
aperture lens available. We use a 100x/1.49 or 60x/1.49 Apo-TIRF lens. We use the Nikon A1R
confocal microscope running NIS Elements software. Configure the acquisition software to
capture the ATP-bound and ATP-unbound mitGO-ATeam2 species. We use the following
conditions.
3.2.1 Set pinhole to 1.0 Airy units (AU), which on our system corresponds to a z resolution of
about 0.42 µm.
3.2.2 Set scan zoom to approach the Nyquist sampling limit, which will maximize spatial
information in the image. On our system the pixel size is 0.12 µm.
3.2.3 Because mitochondria may move during imaging, it can be helpful to increase imaging
speed by cropping the field to 512 x 256 pixels. The total time required to image one

216
frame in our system is 1.0 s, including a 2-fold scan average. Depending on desired
spatial resolution, the field can be further cropped to increase time resolution.
3.2.4 Excite at 488 nm, and collect emission from 500 - 520 nm for GFP, and from 550 - 580
nm for OFP. Actual optimal values may vary with characteristics of the imaging system.
3.2.5 The optimal laser power for our system is between 6.0 and 6.4%. The optimal laser
power will vary for each microscope system, but will ideally be as low as possible while
still producing an interpretable image. Use an internal or external power meter to
monitor changes in the laser power, which occur normally over time in any optical
system.
3.2.6 Adjust detector gain and illumination light intensity to maximize the detected range of
pixel values but avoid saturating the signal, for as many cells as possible. Do not
analyze any cells containing more than 1% saturated pixels. Image all samples using
the same objective, laser power, scan zoom, pixel size, gain, and offset.
4. Image acquisition
4.1 Locate the focal plane of cells of interest using transmitted light to minimize bleaching
the fluorescent probe.
4.2 After locating one or more cells of interest, collect a z-series through the whole depth of
a typical cell (approx. 7 µm) using a step size of 0.5 µm.
4.3 Image other cells of interest on the slide, but do not image a single slide for longer than
15 min. After 15 min on the slide, cells lose viability.
5. Analysis
Mitochondrial ATP level is determined by measuring the ratio of the mitGO-ATeam2
emission at 560 nm to that at 510 nm. The redox state of the organelle is measured as the
reduced to oxidized (R/O) ratio of mito-roGFP; i.e., emission at 510 nm upon excitation at 365
nm divided by emission at 510 nm upon excitation at 470 nm. Before calculating the ratio, we

217
subtract background and determine a threshold value for pixels belonging to the fluorescent
mitochondria.
Public domain (e.g. ImageJ) [346] or commercially available (e.g. Volocity, Perkin-Elmer)
software can be used for analysis of mito-roGFP1 or mitGO-ATeam2. Depending on the
software used for image acquisition and for analysis, the images may first need to be converted
to another format, such as TIFF, before opening them in the analysis software. If images are
converted, it is essential to verify that pixel values are not changed during the conversion.
Analysis of mito-roGFP1 data, using both programs is described below. Program menus and
options to select within each menu are highlighted in bold italics.
5.1 ImageJ analysis
5.1.1 Open images and change type to 32 bit: Image Type 32 bit.
5.1.2 Draw a region of interest (ROI) in an area where there are no cells. Calculate the mean
intensity in this ROI: Analyze Measure.
5.1.3 Subtract the calculated mean background from the stack: Process Math
Subtract.
5.1.4 Using the subtracted z-stack, find the middle slice and threshold on mitochondria:
Image Adjust Threshold and click Apply on the Threshold window. Apply to all
slices in the stack. Check Set background pixels to NaN.
5.1.5 Create the ratio z stack: Process Image Calculator Divide the reduced stack by the
oxidized z stack for mito-roGFP1 analysis. Divide the 560 nm (ATP bound) image by the
510 nm (ATP unbound) image for mitGO-ATeam2 analysis.
5.1.6 Draw an ROI around the area of interest. Choose Analyze Tools ROI Manager,
and click Add to record the ROI. Multiple regions may be stored in the manager. In ROI
Manager, select all ROIs, then choose More Multi-Measure to measure all stack
slices. Export data to a spreadsheet for analysis.

218
5.2 Volocity analysis
5.2.1 Import images into a Volocity library and create an image sequence with 2 channels.
5.2.2 Draw a region of interest (ROI) in an area where there are no cells. Choose: Tools
Ratio.
5.2.3 Use Volocity to calculate the background: Get From ROI.
5.2.4 Adjust the threshold to include mitochondrial structures.
5.2.5 Check the option to apply a rainbow LUT to the ratio channel. The intensity-modulated
channel may produce a less noisy image for presentation, but it should not be used for
quantitation of average ratio.
5.2.6 Select the Measurement tab, select the ratio channel and draw an ROI around the area
of interest. Measure the ratio channel, excluding zero values. Multiple regions may be
selected and measured at the same time. Export data to a spreadsheet for analysis.

219
Results
Measuring mitochondrial redox state with mito-roGFP
Here, we show that mito-roGFP1 has the dynamic range to detect changes in
mitochondrial redox state from fully oxidized to reduced in living yeast cells, without affecting
yeast cell growth or mitochondrial morphology. First, we find cells expressing mitochondria-
targeted GFP and roGFP1 grow at normal rates (Fig. 1A). The maximum growth rate, as
measured by maximum slope of the growth curve during log-phase growth and the time to reach
maximum growth rate, is similar in cells expressing mito-GFP and mito-roGFP1. Furthermore,
mitochondria in yeast expressing mito-roGFP1 exhibit wild-type morphology (Fig. 1B).
Specifically, they are tubular, align along the mother-bud axis, and accumulate at the tips of
mother and daughter cells. Since mitochondrial dysfunction often induces fragmentation, this
normal morphology supports the idea that mito-roGFP1 does not perturb mitochondrial function.
Figure 1. Mito-roGFP1 detects mitochondrial redox state without affecting cell growth rates or mitochondrial morphology. (A) Growth of yeast that express mitochondria-targeted GFP or ro-GFP1 was measured as change in optical density at 600 nm as a function of time of growth in SC-Ura liquid medium at 30°C. (B) Upper panels: Normal mitochondrial morphology and localization channel in raw images. Lower panels: Ratio images show the reduced channel divided by the oxidized channel (color reference at right). The images show the effect of threshold choice on results. The optimal threshold includes mitochondrial structures and excludes background.
To assess the dynamic range of mito-roGFP1, we treated mid-log phase wild-type yeast
cells with hydrogen peroxide (H2O2) and dithiothreitol (DTT), respectively, and measured the
mean mitochondrial R/O ratio to assess mitochondrial redox state (Fig. 2). Titration with H2O2 or

220
DTT from 0 to 10 mM results in a dose-dependent change in mean cellular R/O ratio with a
measured range from 0.6 (under oxidizing conditions) to 1.23 (under reducing conditions). Thus,
mito-roGFP1 is an effective biosensor for analysis of mitochondrial redox state in living cells.
Figure 2. Mito-roGFP1 detects changes in mitochondrial redox state in response to treatment with hydrogen peroxide or dithiothreitol. (A-B) Mid-log phase yeast cells expressing mito-roGFP1 were incubated in SC-Ura media with no treatment (0) or with the indicated concentrations of H2O2 or DTT for 20 min at 30°C. (A) Maximum intensity projections of the R/O mito-roGFP1 ratio images are superimposed on transmitted light images, which show cell outlines. The color reference for mito-roGFP1 is shown at upper right. Bar: 5 µM. (B) Quantitation of R/O mito-roGFP1 ratio under each experimental condition. Error bars are standard error of the mean. Results were obtained from at least 20 cells under each condition.
Mito-roGFP1 also offers subcellular resolution of mitochondrial redox state. This
subcellular resolution reveals that mitochondria within individual yeast cells differ in relative
redox state. If mitochondria within a single yeast cell are functionally distinct, it is possible that
they are passively or actively segregated (Fig. 3). Such segregation could contribute to mother-
daughter age asymmetry and the rejuvenation of daughter cells. This finding underscores the
need for a biosensor with subcellular resolution of mitochondrial redox state.

221
Figure 3. Mito-roGFP1 offers subcellular resolution of mitochondrial redox state. A maximum intensity projection of the R/O mito-roGFP1 ratio channel is superimposed on a transmitted-light image. The color reference for mito-roGFP1 is shown at upper right. Bar: 5 µM. This particular cell has a mean R/O mito-roGFP1 ratio of 0.88. However, individual mitochondria within this cell show different redox states. The numbers shown are the calculated R/O mito-roGFP1 ratio for different mitochondrial regions.
Exposure to excitation light can induce changes in the GFP chromophore [347]. Upon
exposure to high intensity 400 nm light, roGFP1 undergoes photoconversion to a species with a
different emission spectrum [343]. When photoconversion occurs, there is a decrease in green
emission from oxidized mito-roGFP1 and an increase in green emission upon excitation of
reduced mito-roGFP1, which alters the ratio of R/O mito-roGFP1 (Fig. 4B). Using low-intensity
excitation (e.g. illumination at 40% using the 400 nm LED in the Colibri light source), there is no
significant photoconversion during the period analyzed (Fig. 4C). The preferred way to reduce
photoconversion is to excite the oxidized form of roGFP at 365 nm (see Discussion).

222
Figure 4. High-intensity excitation leads to photoconversion and altered R/O mito-roGFP1 ratios. Mid-log phase yeast expressing mito-roGFP1 were illuminated with 400 nm light at 40% (A) or 100% (B) power from a LED light source, and the fluorescence from reduced and oxidized mito-roGFP1 was captured every 4 sec. Images shown are maximum projections in which colors represent the R/O ratio of mito-roGFP1 (see color scale in lower right). Bar: 5 µM. (C) The R/O ratio of mito-roGFP1 remained constant over the imaging period upon illumination at 40% LED power. However, upon illumination at 100% LED power, we observe a time-dependent change in R/O ratio of mito-roGFP1, which reflects photoswitching of the fluorophore. Black squares, 40% LED power; gray diamonds, 100% LED power
Measuring mitochondrial ATP with mitGO-ATeam2
MitGO-ATeam2 localizes to mitochondria when expressed in mammalian cells [344].
We find that mitGO-ATeam2 colocalizes with DAPI-stained mitochondrial DNA in yeast, and is
found in tubular structures typical of wild-type yeast mitochondria (Fig. 5A). Thus, we verified
that the mitochondrial targeting sequence from the mammalian cytochrome c oxidase subunit
VIIIA localizes the probe to mitochondria in yeast without disrupting mitochondrial morphology.

223
Additionally, we find that the growth rate of cells expressing mitGO-ATeam2 is similar to that of
cells expressing mitochondria-targeted GFP in both glucose and glycerol media (Fig. 5B).
Thus, expression of mitGO-ATeam2 does not appear deleterious to the cell or mitochondria.
Figure 5. MitGO-ATeam2 localizes to mitochondria in yeast and does not affect yeast cell growth rates. (A) Yeast cells expressing mitGO-ATeam2 were grown to mid-log phase, fixed using paraformaldehyde and stained with the DNA-binding dye DAPI, as described previously.
19 Images shown are
maximum-intensity projections of deconvolved z-series. For simplicity, the mitGO-ATeam2 images were obtained using a conventional GFP filter, so they represent only the population unbound to ATP. Cell outlines are shown in white. N: nuclear DNA. mtDNA: mitochondrial DNA. Bar: 1 µm. (B) Growth curves of wild-type yeast cells expressing mitochondria-targeted GFP or mitGO-ATeam2 in glucose-based (SC) and glycerol-based (SGlyc) liquid media at 30°C. This data is the average of quadruplicates for each strain at each time point, and is representative of two independent experiments.
Next, we tested whether the mitGO-ATeam2 FRET responds to changes in
mitochondrial ATP levels. To do so, we treated cells with antimycin A, an agent that binds to
cytochrome c reductase, inhibits oxidation of ubiquinol in the electron transport chain, disrupts
the proton gradient, and inhibits mitochondrial ATP production [339]. The median FRET ratio
decreases in cells treated with Antimycin A (Fig. 6C).
Given evidence that mitGO-ATeam2 is an effective biosensor for mitochondrial ATP, we
used this probe to monitor mitochondrial ATP levels in yeast that were propagated using a
fermentable or non-fermentable carbon source (Fig. 6A,B). The reduction in the total fluorescent
area in glucose-grown cells confirmed that glucose repression results in a decrease in

224
mitochondrial abundance. We note cell-to-cell variation in the level of mitGO-ATeam2. Equally
important, we detect differences in ATP levels not just in different mitochondria within the same
cell, but also in what appear to be different regions within the same mitochondrion (Fig. 6D).
Figure 6. MitGO-ATeam2 measures changes in ATP levels in yeast mitochondria at subcellular and suborganellar resolution. (A-B) Emission of mitGO-ATeam2 from GFP (510 nm) and OFP (560 nm), and quantitation of the 560/510 nm emission ratio of yeast cells grown overnight in glucose-based (SC) (A) or glycerol-based (SGlyc) (B) media. The color reference for the 560/510 ratio channel is shown at lower right. Bar: 1 µm. (C) Quantitation of the 560/510 ratio for cells propagated in SGlyc media with or without antimycin A (2 µg/ml) for 1 hr at 30°C. The decrease in ATP levels upon antimycin A treatment is statistically significant (Kruskal-Wallis significance test). (D) 560 nm/510 nm ratio of mitGO-ATeam2 of a mid-log phase wild-type cell propagated on SC media. The color reference for the 560/510 ratio channel is shown at lower right. The cell outline is shown in white. The mean 560/510 nm ratio for the entire cell is 0.43. The numbers shown are the 560/510 nm ratios of specific regions within mitochondria. Bar: 1 µm.

225
Discussion
Here, we describe methods to use mito-roGFP1 and mitGO-ATeam2 as biosensors to
assess mitochondrial redox state and ATP levels in living yeast cells. We find that expression of
plasmid-borne mito-roGFP1 or mitGO-ATeam results in quantitative targeting to mitochondria,
without any obvious effect on mitochondrial morphology or distribution or on cellular growth
rates [236]. Mito-roGFP1 can detect changes in mitochondrial redox state from highly oxidized
to highly reduced states. Similarly, mitGO-ATeam can measure changes in mitochondrial ATP
levels that occur in yeast undergoing respiration-driven growth and yeast treated with a
respiration inhibitor. Moreover, since both biosensors offer subcellular resolution, they can
detect heterogeneity in the redox state or ATP levels of mitochondria within individual cells.
Finally, since both biosensors are ratiometric probes, they are not affected by changes in
concentration or variability in sample thickness or illumination. These probes provide a
minimally invasive approach to studying mitochondrial function with subcellular resolution in
living cells.
To successfully apply this method, images should be acquired with the maximum
possible signal-to-noise ratio. An important first step is to examine cells from 10–20
transformant colonies under the microscope and select those with robust fluorescence and
normal mitochondrial morphology and growth rates. Next, imaging conditions should be
optimized to produce high, but not saturating, intensities without causing photodamage to the
fluorescent protein or the cells. A few cells in a population (<1 %) may have unusually high or
low overall fluorescence due to variation in plasmid copy number; these can be disregarded in
favor of capturing interpretable images of the majority of cells.
While the benefits of mito-roGFP are clear, it is also important to be aware of potential
pitfalls. We detect differences in mitochondrial redox potential not just with carbon source-
induced differences in cell metabolism, but also upon propagation of yeast in different batches

226
of the same medium. Thus, care must be taken when selecting cell growth media for
mitochondrial redox measurements. Moreover, although mito-roGFP offers unprecedented
spatial resolution of mitochondrial redox state, temporal resolution of roGFP is not sufficient to
detect bursts of ROS that are associated with ROS signal transduction31. Finally, care must be
taken when choosing the excitation wavelength and intensity for the oxidized form of roGFP.
Illumination at 400 nm optimally excites the oxidized species of roGFP. However, it also excites
reduced roGFP to a greater extent compared to excitation at 365 nm. This leads to reduced
sensitivity in measuring mitochondrial redox state. Furthermore, exposure of mito-roGFP1 to
high-intensity illumination at 400 nm leads to photoconversion of the protein to a species with
altered spectral properties. We have not seen photoconversion upon high-intensity illumination
at 365 nm. Therefore, we recommend excitation using 365 nm if possible.
MitGO-ATeam2 also has limitations. For example, since mitGO-ATeam2 is itself a
protein it can be damaged by cellular insults including reactive oxygen species, which may
impair its biosensor activity. Additionally, GFP and OFP emission wavelengths (510 and 560
nm) must be resolved for FRET analysis, which may be difficult on conventional fluorescence
microscopes.
Unlike in vitro enzyme assays, these live-cell assays report relative changes in
mitochondrial ATP or redox state, and do not measure the absolute concentration of ATP or
reduced cysteine. Although a standard curve could theoretically be generated by measuring the
response of sensor proteins in solution, this might not apply to the different molecular
environment within mitochondria. Therefore, these assays provide a means of comparing cells
under different conditions. In addition, imaging conditions vary, so the exact ratio values
acquired on one imaging setup may not be replicated on another.
These techniques for ratio imaging can be adapted for other ratiometric indicators,
including other roGFP or GO-ATeam isoforms and other functional probes. The choice of wide-
field or confocal microscopy will depend on the probe and the spatial resolution required. The
227
wide-field method was used here for mito-roGFP because it allows excitation at 365 nm, which
improves sensitivity and stability of the sensor. The confocal method with a spectral detector, as
used here for mitGO-Ateam, provides a convenient way to eliminate emission crossover by
adjusting the spectral detection windows. However, it is possible to perform similar experiments
in wide-field microscopy by using custom filters or eliminating crossover computationally.
The most common difficulty in this type of imaging experiment is insufficient signal.
Imaging hardware (especially the objective lens and detector) is critical for collecting enough
signal to interpret the data.
The thresholding steps have great influence on the results, as the inclusion of
background pixels can dampen any trends in the ratios obtained. Automatic methods are
preferable, but due to limited signal, manual thresholding is often the best available method. If
manual thresholds are used, the criteria used should be articulated as well as possible, and
analysis may need to be performed blind or by different experimenters to demonstrate
reproducibility. Control experiments with antimycin A (for mitGO-Ateam2) and H2O2 or DTT (for
mito-roGFP) can be used to confirm the predicted changes in fluorescence ratios.
Mito-roGFP and mitGO-ATeam2 are non-invasive, ratiometric probes for monitoring
mitochondrial fitness in living yeast cells. The ratiometric sensors used here were targeted to
mitochondria by fusion of mitochondria-specific signal sequences. Other cellular compartments
could be studied with the addition of appropriate targeting sequences to the original sensors. In
addition, it is possible to combine either of these sensors with complementary fluorescent
markers (e.g. for organelles or signaling factors) or sensors (e.g. for calcium) to simultaneously
measure multiple processes in living cells.

228
Acknowledgments
This work was supported by awards from HHMI 56006760 to JDV, the National Institutes of
Health (NIH) (2 TL1 RR 24158-6) to DMAW, and from the Ellison Medical Foundation (AG-SS-
2465) and the NIH (GM45735, GM45735S1 and GM096445) to LP. GM45735S1 was issued
from the NIH under the American Recovery and Reinvestment Act of 2009. The microscopes
used for these studies were supported in part through a NIH ⁄ NCI grant (5 P30 CA13696).

229
Author Contributions
The data in this chapter was contributed by Vevea JD*, Wolken DMA*, Swayne TC, White AB,
Pon LA. as follows
Figure 1 JDV
Figure 2 JDV
Figure 3 JDV
Figure 4 JDV
Figure 5 DMAW
Figure 6 DMAW