cells are formed from pre-existing cells ” (Mazzarello, 1999).
81
1 CHAPTER ONE: INTRODUCTION 1.1 Cell Cell is the structural, functional and biological unit of living organisms. Robert Hooke, in 1665 described cells as the microscopic units that made up the structure of a splice of cork and coined the term cell. With the invention of microscope by Antoni van Leeuwenhoek at the beginning of seventeenth century, it became possible to witness a live cell. The idea of cell being the basic component of living organisms emerged from cell theory, the most important generalization in biology made by Rudolf Virchow, Matthias Jakob Schleiden, and Theodor Schwann in 1938. According to cell theory, “cell is the basic unit of life; all living organisms are made of cells and their products; and new cells are formed from pre-existing cells ” (Mazzarello, 1999). All living cells are divided into two groups: prokaryotic cells and eukaryotic cells. Prokaryotes are single celled organisms that do not have a nucleus and other membrane bound organelles. The key difference between prokaryotes and eukaryotes is the eukaryotes have their DNA well organized into nucleus surrounded by nuclear envelope. 1.1.1 Cell division Cell division is the fundamental process by which cells multiply during the growth of tissues and organs in higher eukaryotes. It is the terminal stage of cell cycle that brings unparalleled visible changes within the nucleus and cytoplasm. In prokaryotes, it occurs by simple fission where the parent cell divides into daughter cells. In eukaryotes, cell division involves karyokinesis (division of nucleus) followed by
Transcript of cells are formed from pre-existing cells ” (Mazzarello, 1999).

1
CHAPTER ONE: INTRODUCTION
1.1 Cell
Cell is the structural, functional and biological unit of living organisms. Robert
Hooke, in 1665 described cells as the microscopic units that made up the structure of a
splice of cork and coined the term cell. With the invention of microscope by Antoni van
Leeuwenhoek at the beginning of seventeenth century, it became possible to witness a
live cell. The idea of cell being the basic component of living organisms emerged from
cell theory, the most important generalization in biology made by Rudolf Virchow,
Matthias Jakob Schleiden, and Theodor Schwann in 1938. According to cell theory, “cell
is the basic unit of life; all living organisms are made of cells and their products; and new
cells are formed from pre-existing cells ” (Mazzarello, 1999).
All living cells are divided into two groups: prokaryotic cells and eukaryotic cells.
Prokaryotes are single celled organisms that do not have a nucleus and other membrane
bound organelles. The key difference between prokaryotes and eukaryotes is the
eukaryotes have their DNA well organized into nucleus surrounded by nuclear envelope.
1.1.1 Cell division
Cell division is the fundamental process by which cells multiply during the
growth of tissues and organs in higher eukaryotes. It is the terminal stage of cell cycle
that brings unparalleled visible changes within the nucleus and cytoplasm. In
prokaryotes, it occurs by simple fission where the parent cell divides into daughter cells.
In eukaryotes, cell division involves karyokinesis (division of nucleus) followed by

2
cytokinesis (division of cytoplasm of the cell). Cell division is considered to be the
source of tissue repair in multicellular organisms (Kinfield, 1999).
Prokaryotes such as bacteria and simpler eukaryotes such as yeast use a relatively
simple form of asexual reproduction called binary fission, a process of cell division. It is
characterized by the replication of DNA followed by splitting of the parent cell into two
daughter cells (Weiss, 2004). In eukaryotes, cell division can also occur through either
mitosis or meiosis. Mitosis or somatic cell division is required for growth and asexual
reproduction whereas, meiosis is required for sexual reproduction. Eukaryotic cell
division is characterized by the formation of bipolar spindle to segregate the replicated
genetic material into separate nuclei. The spindle divides the nuclei, and ensures the
formation of cell plate for the partition of cytoplasm into two daughter cells (Pines and
Rieder, 2001). In mitosis, chromosomes separate and form into two identical sets of
daughter nuclei followed by cytokinesis. In other words, in mitosis the parent cell divides
into two genetically identical daughter cells. Unlike mitosis, meiosis is a process of
reductional cell division in which the diploid chromosome number is reduced to haploid
and is essential for sexual reproduction (Kleckner, 1996).
1.2 Stem cells
Stem cells (SCs) are defined as clonogenic cells that have the ability to perpetuate
themselves through self-renewal and differentiate into specialized cells (Sylvester and
Longaker, 2004). They are considered as units in evolution by natural selection as they
have remarkable potential to develop into different cell types in the body during early life

3
and during growth of an organism. SCs represent natural units of embryonic development
and tissue regeneration (Weissman, 2000).
1.2.1 Biological role and properties of stem cells
Stem cells are different from other kinds of cells in the body. The essential
characteristics that a cell must demonstrate for being considered as stem cell are: it must
be capable of asymmetrical cell division, produce an exact multipotent replica cell, and
form an additional progeny cell that can perform a more specialized function (Weissman,
et al., 2001). All stem cells regardless of their source have two general properties
including, self-renewal capability by cell division and ability to differentiate into tissue-
or organ-specific cells.
1.2.1.1 Stem cells are self-renewing
Most specialized cells like muscle, blood and nerve cells do not replicate by
themselves and hence their supply is maintained by stem cells. Thus, cells are
continuously replenished as they die. Based on the self-renewal interval, SCs are divided
into long-term subset (capable of indefinite self-renewal) and short-term subsets (having
definite self –renewal interval) (Weissman, 2000). They help in maintaining the process
of homeostasis, where cells die, either by natural death or injury, and they are replenished
with new cells (Fuchs and Segre, 2000).
1.2.1.2 Stem cells are unspecialized and differentiate into more specialized cells
One of the characteristic properties of stem cells is that they do not perform all
functions associated with differentiated cells. For instance, a stem cell cannot perform the

4
function of a heart muscle cell or red blood cell. However, they can give rise to
specialized cells including nerve or blood or heart muscle cells by the process of
differentiation. Differentiation is the process by which a less specialized cell becomes a
more specialized cell and this ability of a SC is called as potency. SC can be either
totipotent, or pluripotent, or multipotent. The term totipotent suggests that their potency
is total and they can differentiate into every cell type of the body to form an entire
organism. Pluripotent SCs such as embryonic stem cells are capable of differentiating
into all cell types of the body except placenta. Multipotent SCs can give rise only to a
limited number of cell types (Mitalipov and Wolf, 2009).
1.2.2 Origin of stem cells
During embryogenesis, a single fertilized oocyte, formed by the union of sperm
and egg, gives rise to a multicellular organism with differentiated cells and tissues to
perform specified functions. Totipotent stem cells occur at the earliest stage of embryonic
development as the fertilized oocyte remodels into a totipotent zygote (Stitzel and
Seydoux, 2007). The totipotent zygote undergoes differentiation to form a hollow sphere
of cells called blastocyst, with an outer layer of cells and an inner cell mass (ICM) inside
the sphere. The outer layer forms the placenta and other supporting tissues during fetal
development and the ICM gives rise to progenitor/ somatic and primitive germ-line SCs.
1.2.3 Types of stem cells
In vertebrates, stem cells are traditionally characterized into two groups. They are
pluripotent embryonic stem (ES) cells and multipotent stem cells, which are generated
from ES cells (Figure 1). The first group namely, ES cells, derived from inner cell mass

5
of the blastocyst are capable of generating all differentiated cell types in the body. The
second group viz., multipotent stem cells, are organ- or tissue-specific stem cells that are
capable of generating the cell types comprising particular tissue in embryos and in some
cases, adults. These are intermediate stem cells that are restricted to the lineage of a
particular organ. Conventional examples of multipotent stem cells include hematopoietic
stem cells (HSC) that generate cell types of blood and immune system, and neural stem
cells (NSC) (Anderson, et al., 2001).
Figure 1 Stem cell hierarchy
Fertilization of oocyte leads to the formation of a totipotent zygote. By repeated cell division, zygote proceeds onto totipotent morula and further onto pluripotent blastocyst stage. Blastocyst is characterized by the outer layer of cells that surround an inner cell mass (ICM). Only ICM retain the capacity to build up all three primary germ layers, (endoderm, mesoderm, and ectoderm) and the primordial germ cells (PGC) that produces

6
male and female gametes. The multipotent and progenitor cells formed from the three germ layers replace lost or injured cells in adult tissues and organs (Wobus and Boheler, 2005).
1.3 Embryonic stem cells
During fertilization, when a sperm fertilizes an egg, the resulting single celled
zygote begins to divide and multiply at a rate much faster than that observed in somatic
cells. These primordial embryonic cells have potential to form into a complete organism.
Hence, they are referred to as totipotent stem cells. Within few days of fertilization, these
rapidly dividing cells form a hollow sphere, called as blastocyst. The stem cells derived
from the ICM of totipotent blastocyst stage are known as ES cells. They differentiate into
all somatic cell lineages as well as into male and female germ cells (Figure 1).
Pluripotency is one of the characteristic features of ES cells that differentiate them from
adult stem cells. ES cells are essentially immortal and can indefinitely produce fully
operational ES daughter cells (Wobus and Boheler, 2005).
The essential properties of ES cells include derivation from the pre-implantation
embryo, prolonged undifferentiated proliferation and stable developmental potential to
form all the three embryonic germ layers (ectoderm, endoderm, and mesoderm). The
characteristics that are essential to differentiate ES cells from embryonic carcinomal (EC)
cells include: normal diploid karyotype, ability to colonize without causing tumors and
developmental anomalies, and formation of normal gametes when differentiated into the
germ-line (Suda, et al., 1987).
ES cells can differentiate into any cell type in the body while, adult SC are
multipotent and can differentiate into only limited number of cell types. Under controlled

7
conditions, ES cells can be propagated in-vitro, thus allowing them to be potential tools
in research and regenerative medicine.
1.4 Multipotent stem cells
Adult stem cells are found in specialized organs and adult tissues. They occur in
mature tissues such as bone marrow, brain, and gut. For example, bone marrow contains
two kinds of stem cells, one population called hematopoietic stem cells (HSC), that form
all types of blood cells in body and second population called mesenchymal stem cells
(MSCs), that form cells such as, osteoblasts, chondrocytes and adipocytes (Colter, et al.,
2001). The main function of adult SCs is to replenish cells in the specific organs and
tissues in which they are found and maintain stable state of specialized tissues. In order to
replace lost cells, they generate intermediate cells called progenitor or precursor cells that
undergo divisions coupled with maturation to form fully specialized cells.
1.4.1 Neural stem cells
Neural stem cells (NSCs) are self-renewing, multipotent cells that have the ability
to differentiate into all the major cell types of adult central nervous system (Kennea and
Mehmet, 2002). The existence of stem cells in central nervous system (CNS) was
reported in early 1990s. They were first isolated from the embryonic CNS and peripheral
nervous system (PNS). After the discovery of embryonic NSCs, adult NSCs were isolated
from adult neurogenic regions, the hippocampus, the subventricular zone (SVZ), and in
non-neurogenic regions including spinal cord (Lois and Alvarez-Buylla, 1993).
However, they were reported to have limited differentiation potential compared to ES
cells (Price and Williams, 2001). To be considered as SC in CNS, the cells must have the

8
potential to differentiate into neurons, astrocytes, and oligodendrocytes and to self renew
to provide sufficient numbers of cells in the brain.
Neural differentiation occurs soon after germ layer differentiation and all the
neural tissues are formed from ectoderm germ layer. The tissues of CNS are derived from
neural plate formed during neurulation, a process of formation of dorsal nerve cord and
eventual formation of CNS.
1.5 Stem cells in therapy and research
The potential of stem cell biology lies in its promising advancement towards
regenerative medicine. Exploiting the self-renewal and differentiation properties of ES
cells has made the prospect of tissue regeneration a potential clinical reality (Sylvester
and Longaker, 2004). It is cardinal to channel multipotent SCs with high proliferative
capacity into specified differentiation programs within the body. NSCs remain as a hot
area of research as they have great potential to treat neurodegenerative disorders such as
Alzheimer’s, multiple sclerosis, spinal cord injuries, and Parkinson’s disease (Fuchs and
Segre, 2000).
ESC derived NSCs can be manipulated by cell culture conditions to generate
different types of neurons and glial cells which makes NSCs useful for transplantation.
Commonly encountered neurological disorders including Parkinson’s disease (PD) and
amyotrophic lateral sclerosis (ALS) are characterized by selective loss of dopaminergic
(DA) and cholinergic neurons respectively. One way of exploiting the replacement
strategy of NSCs is to generate these neurons in sufficient quantities in them (Bithell and
Williams, 2005). Lee et al reported the increase in number if DA and serotonergic

9
neurons with the addition of ascorbic acid (AA), Shh (sonic hedgehog) and FGF8 (Lee, et
al., 2000).
1.6 Neurotransmitters involved in stem cell development
Neurotransmitters are the chemical substances that transmit signals from one
neuron to the next across synapses. Acetylcholine is the first neurotransmitter to be
discovered in fertilized sea urchin eggs in 1953. The neurotransmitters such as serotonin,
dopamine, noradrenaline, adrenaline, acetylcholine and gamma-amino butyric acid are
shown to be involved in developmental processes of animal species. These substances
play a crucial role throughout the development of an organism, including stages prior to
development of nervous system. Hence, they are referred to as “prenervous”
neurotransmitters. Buznikov et al substantiated the role of neurotransmitters as
“morphogens” during the development. Morphogens are the developmental signals that
exert specific effects on cell receptors (Buznikov, et al., 1996). Neurotransmitters act as
morphogens to exert their effects through receptors and signal transduction mechanisms
similar to those in adult nervous system. This suggests the possibility of specialized roles
played by neurotransmitters in synaptic transmission to have evolved during course of
development. Serotonin (5-hydroxytryptamine, 5-HT) is one well-known
neurotransmitter that might play a major role in the stem cell development. In vitro
studies reveal that serotonin signaling participates in the regulation of development even
before onset of neurogenesis (Buznikov, et al., 2001).

10
1.7 Gene regulation
In cells, the gene expression process is dynamic and its regulation is the most
important event involved in avoiding abnormal gene expression. Gene regulation governs
all the essential biological processes and used to control the transformation of
information in genes into gene products. Hence, impairment of gene regulation can lead
to many diseases.
Gene regulation at the transcriptional level plays a crucial role in any biological
process because it controls many events such as gene expression initiation, elongation
and termination events. In this process, the cell receives signals from either external or
internal environment and mediates the gene regulation machinery accordingly. This
process is very common in both prokaryotes and eukaryotes; however the mechanisms of
gene regulation are different.
In prokaryotes, the gene expression depends on the availability of nutrients,
physicochemical properties in the surrounding environment. Prokaryotes that live in
varying niches have to develop highly efficient regulatory mechanism to survive in those
environments whereas endosymbiontic bacteria living in habitats that do not vary a lot
have very simple regulatory mechanisms. The complexity of gene regulation increases
with the variability of the habitat (Silva-Rocha and de Lorenzo, 2010). Prokaryotes
adopted a typical regulatory mechanism called as “operon” in which a set of genes is
controlled by a common promoter and common operator. The sigma unit of RNA
polymerase initiates the transcription and the core sub unit of RNA polymerase elongates
the transcription. In addition to RNA polymerase activity, binding of activators in the

11
promoter or catabolite gene activator protein (CAP) region and repressor binding in the
operator region facilitate transcriptional regulation (Choudhuri, 2004; Silva-Rocha and de
Lorenzo, 2008; Zhou and Yang, 2006).
In eukaryotes, a very small number of genes are expressed at any given point of
time. The rate of gene expression depends on the cell requirement for a specific protein.
However, abnormal gene expression causes several diseases including cancer and hence
regulation of gene expression is very crucial in many biological process. In eukaryotes,
most of the gene regulation occurs at the level of transcription and for gene expression
regulation, eukaryotes employ diverse mechanisms such as chromatin condensation,
DNA methylation, transcriptional initiation, alternative splicing of RNA, mRNA
stability, translational controls, several forms of post-translational modification,
intracellular trafficking, and protein degradation. Among these mechanisms, transcription
initiation is the most common controlling mechanism (Wray, et al., 2003). In eukaryotes,
the transcription process is dependent on accessibility of chromatin to the transcription
machinery. Hence, these organisms have adopted different chemical mechanisms such as
methylation, acetylation and phosphorylation to alter the chromatin structure and to
provide favorable environment to transcription (Lauria and Rossi, 2011; Luco, et al.,
2011).
The components involved in the transcriptional regulation are known as
regulatory components. There are five types of regulatory components that regulate the
transcription by RNA polymerase including specificity factors, repressors, activators,
transcription factors and enhancers (Austin and Dixon, 1992). Among these, specificity
factors such as sigma factor are commonly used by prokaryotes whereas enhancers and a

12
variety of transcription factors are used by eukaryotes than by prokaryotes (Austin and
Dixon, 1992; Choudhuri, 2004). During transcription, very limited chromatin is exposed
to transcription machinery and specifically, in eukaryotes, a group of components work in
various combinations and regulate the gene expression (Weake and Workman, 2010).
The regulatory regions in higher eukaryotes exist either adjacent to 5’ end of the
gene, called as promoter region, or sometimes very far away from transcription start site
(TSS) known as enhancers that bind to enhancer regions of the genes (Abnizova and
Gilks, 2006). Mostly, these regulatory components are small DNA binding proteins often
referred as transcription factors (TFs) that will bind to promoter regions of genes and
guide the RNA polymerase for transcription. Depending upon the signal received by cell,
these TFs are either act as activators or repressors or enhancers (Silva-Rocha and de
Lorenzo, 2008).
TFs are sequence specific and will bind to specific regions called transcription
factor binding sites (TFBSs). These TFBSs could be located anywhere in the genome
however, they are mostly located in the upstream regions of transcriptional start site
(TSS). Once the TF is bound to its TFBS, it recruits transcriptional basal complex near
the TSS and controls transcription (Narlikar and Ovcharenko, 2009).
Transcription regulation studies are complex in higher eukaryotes because of the
huge genome size and identification of regulatory components is often very difficult
(Noonan and McCallion, 2010). Moreover, sparse and uneven distribution of TFBS in the
genome, and short and imprecise location of TFBS makes it very difficult to identify in
the genome (Wray, et al., 2003).

13
Generally, in eukaryotes, a number of TFs act in combination to get the desired
gene expression. These combinations of TFs and their corresponding TFBSs are called as
regulatory modules. A regulatory module that contains homotypic (with same TFs) and
heterotypic (with different TFs) clusters of TFs are termed as cis-regulatory module
(Gupta and Liu, 2005).
1.8 Trends and challenges in transcriptional regulation
Transcriptional regulation studies are indeed complex processes as it involves
myriad of TFs that cross communicate with each other and drives the biological
processes. Furthermore, the length of human genome, lack of universal structural feature
of promoters, TFs binding specificity, and TFBS uneven distribution makes these studies
more complex.
Many techniques have been implemented to identify the DNA-protein interactions
viz., nitrocellulose-binding assay, electrophoretic mobility shift (EMSA), enzyme-linked
immunosorbent assay (ELISA), DNase I footprinting, and DNA-protein cross linking
(DPC), chromatin immunoprecipitation (ChIP) (Narlikar and Ovcharenko, 2009). These
biochemical assays give the quantitative measurement of the interactions.
Conventionally, the effects of regulatory components on gene regulation are studied by
knocking down the respective gene, or TF that is the gene, or TF is silenced/removed
from the genome; followed by the measurement of phenotypic changes (Bogarad, et al.,
1998; Cox, et al., 2006; Tuoc, et al., 2009). Most of the earlier studies were focused on
single macromolecule such as a gene or TF. However, focusing on a single component
may not give the best solution for a given hypothesis since biological processes occur at

14
systems level and each process involves more than a single component. Hence, this has
led to a trend-shift towards high-throughput techniques.
In high-throughput methods thousands of genes are tested in a single experiment.
Transcriptional regulation often involves multiple components and hence the use of high-
throughput techniques would be a better choice. Many high-throughput techniques have
been proposed and implemented to identify regulatory components at genomic scale
(Balaji, et al., 2008; Hudson and Snyder, 2006). Recently, high-throughput techniques
such as microarray, ChIP-chip, and ChIP-seq are widely used techniques in
transcriptional regulation studies (Narlikar and Ovcharenko, 2009). Large amounts of
data are generated as a result of these experiments and manual inspection or analysis of
this data is almost impossible. Hence, the best way to deal with this problem is the use of
computational methods. Latest advances in computer technology and the cheaper cost of
computational resources helped researchers to develop highly efficient and powerful
algorithms to handle and analyze this high-throughput data. Databases such as Genbank,
European Molecular Biology Laboratory (EMBL), UCSC genome browsers, Ensembl,
and Pubmed are commonly used to store and retrieve the biological data across the globe
(Stein, 2008).
1.9 Transcriptional regulation studies
The study of the molecular mechanisms regulating gene transcription aids in
understanding the differential expression of genes. The next step after identifying the
thousands of gene signatures in the various genome projects is to dissect the
transcriptional control regions and regulatory mechanisms. Understanding the

15
transcriptional regulation of approximately 30,000-40,000 mammalian genes is one of the
central goals of gene expression studies (Antequera and Bird, 1993). During the
mammalian ES cell development, 200 unique cell types are formed from single totipotent
cell. Hence, fundamental understanding of the transcriptional regulatory circuitry
responsible for pluripotency and self-renewal in ES cells is critical to explore the
therapeutic potential of these cells (Pera and Trounson, 2004).
Characterizing the transcription factor binding sites (TFBSs) is the key to
understand gene regulation. Regulatory regions in eukaryotes are divided into promoters
(that are close to 5’ end of gene) and enhancers or cis-regulatory modules (CRMs)
(Abnizova and Gilks, 2006). The biological phenomena underlying the various methods
to recognize regulatory regions are mainly based on the facts that: transcription factors
(TFs) tend to regulate gene activity in distinct regulatory modules, individual TFs have
multiple binding sites within a regulatory module and binding sites within a regulatory
module tend to be spatially clustered.
The methods for identification of regulatory regions of DNA are briefly divided
into six groups: recognition of regulatory DNA regions based on statistics of known
TFBS, based on evolutionary conservation by phylogenetic footprinting, content based
methods, motif recognition and discovery, combination of experimental information with
statistics of DNA sequence (Abnizova and Gilks, 2006). The first method based on
statistics of known TFBS exploits the clustering of known TFs from major sources of
TFBS such as TRANSFAC, JASPAR etc. Phylogenetic footprinting assume that
regulatory regions are highly conserved across evolutionarily related genomes
(Dermitzakis and Clark, 2002). However, the performance of this method depends on the

16
evolutionary distance between species being concerned and is not widely used. Content-
based methods are based on the difference of local nucleotide composition between
regulatory and non-regulatory DNA regions. This difference in nucleotide composition is
attributed to the multiple TFBS in the regulatory regions (Abnizova and Gilks, 2006).
Motif recognition and discovery method of regulatory region recognition is
mainly divided into two large categories: supervised or de novo method and unsupervised
or ab initio method. Supervised methods are based on known TFBS and constitute
screening of a set of DNA against precompiled library of motifs to find statistically
significant motifs in the given sequences. On the other hand, there is no prior knowledge
of TFBS sequences in unsupervised methods and these methods search for recurrent
patterns of any kind. Combining the experimental information with the computational
approach helps in filling the uncertainty of whether the predicted CRM possess the
expected function. Of all the methods, combined experimental and statistical approaches
are most promising ways to increase the precision of the identified regulatory regions
(Abnizova and Gilks, 2006).
1.10 Techniques in functional genomics studies
The complete sequencing of several genomes, including that of the human, has
signaled the beginning of a new era in which scientists are becoming increasingly
interested in functional genomics; that is, uncovering both the functional roles of
different genes, and how these genes interact with, and/or influence, each other.
Functional genomics is an important aspect of genomics that refers to the development
and application of global (genome-wide or system-wide) experimental approaches to

17
understand the function of genes and other parts of the genome. Even though the Human
Genome Project identified all the approximate 20,000-25,000 genes in human DNA,
many questions such as the function of most of the genes still remain unanswered. The
rate at which biological information is acquired depends on the research techniques
employed. Various techniques starting at the level of DNA, RNA and protein aid in
understanding the function of the organism’s genes and its products. The techniques
include: microarray experiments, knockout experiments, and the most recent deep DNA
sequencing techniques such as ChIP-seq and RNA-seq (Wold and Myers, 2008).
Microarrays offer the promise of rapid accurate measurement of gene expression
under many experimental conditions. Analysis of microarray gene expression data
reveals differentially regulated genes. Development of microarrays has permitted global
analysis of gene expression at the transcript level and provided a glimpse into the
coordinated control and interactions between genes (Schulze and Downward, 2001).
Microarray is a 2D array on a solid substrate that assays large amounts of biological
material using high throughput screening methods. Different types of microarrays include
DNA microarrays, protein microarrays, tissue microarrays, cellular microarrays, chemical
compound microarrays, antibody microarrays, and carbohydrate arrays. They facilitate
the parallel execution of experiments on a large number of genes simultaneously (Butte,
2002). Various microarray platforms include: Affymetrix, Illumina, Agilent, AlphaGene,
Ciphergen Protein Chip Products. The principle of microarray experiment is that mRNA
from a given cell or tissue is used to generate a labeled sample, referred to as ‘target’,
which is hybridized in parallel to a large number of DNA sequences, immobilized on a
solid surface in a microarray (Schena, et al., 1995). The microarray is then scanned and

18
the expression levels are measured. Microarray data analysis is conducted using
bioinformatics tools and image processing softwares (Kerr and Churchill, 2007).
With the advent of next-generation sequencing technologies in 2005, there had
been a tremendous impact on the field of functional genomics (Morozova and Marra,
2008). The basic next-generation techniques include conventional ChIP experiments,
RNA seq, and GRO-seq (global run-on sequencing) etc. Hence, whole-genome
microarrays and ultra-high-throughput sequencing techniques are mostly used in gene
regulation studies (Birney, et al., 2007; Wold and Myers, 2008).
Global pattern of protein-DNA interactions can be discovered either by ChIP-chip
or by ChIP-seq (Lieb, 2003; Valouev, et al., 2008). Chromatin immunoprecipitation
(ChIP) is an important assay to study protein-DNA interactions and gene regulation. It is
an experimental method to determine the TFBS in the genomic sequence. In a typical
ChIP experiment, the DNA is sheared into short fragments. The antibody specific to the
TF of interest is added to the sheared DNA fragments followed by separation of the DNA
fragments that have TFBS of interest. In ChIP-chip, immunoprecipitation (IP) step is
followed by microarray hybridization whereas, in ChIP-seq, IP is followed by sequencing
of millions of DNA fragments (Ho, et al., 2011). However, ChIP-chip is being replaced
by ChIP-seq as the former has various disadvantages such as low resolution, high noise
etc (Johnson, et al., 2008). Other techniques include, RNA-seq, one of the recently
developed approaches that provide far more precise measurement of transcripts and aid in
identification of in a cell.

19
1.11 Computational advances in transcriptional regulation
Deeper knowledge of gene regulation is indispensable for better understanding of
almost all life processes. Despite the global interest in elucidating the mechanisms of
transcriptional regulation, a comprehensive source of strategic, conceptual, and technical
information is not very well outlined. Identification of regulatory regions is desirable but
very difficult because of lack of known properties of DNA, degeneracy of TFBS, lack of
evolutionary understanding of transcriptional regulation and complicated structure of
regulatory regions. Furthermore, major portion of human genome constitutes non-coding
regions, which act as TFBS contributing to false positives in the results. Hence, finding
the motifs in regulatory regions is described as “finding a needle in a haystack”. The
bioinformatics algorithms developed lately accelerated the identification of regulatory
regions. Various databases are being developed to order the published data on eukaryotic
gene transcription regulation making the data available for gene regulation studies. They
include TRANSFAC, TRANSCompel, JASPAR, GeneSigDB, List of lists-annotated
(LOLA), MSigDB, and Transcriptional regulatory element database (TRED) etc.
TRANSFAC is a database on transcription factors, their binding sites, nucleotide
distribution matrices and regulated genes. TRANSCompel has composite elements of the
genes. The information in them is extracted from experimentally curated data (Matys, et
al., 2003; Matys, et al., 2006). JASPAR is an open access database of annotated, high
quality, matrix based TFBS profiles. It offers significant advantages over other resources.
TRANSFAC contains a redundant set of binding profiles of diverse quality where as
JASPAR is a non-redundant collection of reliable binding profiles (Bryne, et al., 2008;
Portales-Casamar, et al., 2010; Sandelin, et al., 2004; Vlieghe, et al., 2006).

20
MSigDB is one of the largest collections of gene signatures. It has curated gene
signatures from 344 publications and provides them as annotated lists of genes
(Subramanian, et al., 2005). LOLA database contains 47 gene lists and gene list input
format is limited to Entrezgene or Affymetrix probeset identifiers (Cahan, et al., 2005).
GeneSigDB is a manually curated database of gene expression signatures. It has more
than 575 transcribed gene signatures that are manually extracted from more than 850
publications and is focused on cancer and stem cells gene signatures (Culhane, et al.,
2010). TRED is a collection of cis- and trans-regulatory elements and its distinguishing
features include: it uses an automated pipeline and curation to map the gene transcription
start site (TSS) and core promoters of human, mouse and rat genomes (Jiang, et al., 2007;
Zhao, et al., 2005).
In this study, we performed transcriptional regulation analysis using the high-
throughput microarray data to understand the role of serotonin in ES cells. This study
attempts to identify key regulatory components and regulatory modules that drive the
regulation of serotonin responsive genes involved in ES cells differentiation.

21
CHAPTER TWO: BACKGROUND
2.1 Role of serotonin in ES cell differentiation
Serotonin (5-HT) is a monoamine neurotransmitter that is synthesized from the
amino acid L-tryptophan in serotonergic neurons and stored in vesicles of central nervous
system. It is primarily found in gastrointestinal tract, platelets and in the CNS of animals
(Lauder, et al., 1981). During the early stages of embryo, the presence of 5HT can be
attributed either due to its synthesis from tryptophan in the presence of the enzymes
tryptophan hydroxylase, aromatic amino acid decarboxylase or by uptake from
surroundings. Basu et al confirmed the presence of serotonin in pre-implantation embryos
and reported that it is localized to the mitochondria (Basu, et al., 2008). Even before its
role as a neurotransmitter in mature brain was discovered, 5-HT has been shown to play
an important role in regulating brain development. Monoamine neurotransmitter systems,
in particular, serotonin is present relatively early during the development of mammalian
brain (Lauder and Krebs, 1978). In fact, studies on the development of serotonin
containing neurons in various species such as rat, chick, non-human primates and humans
revealed that the levels of serotonin are higher in early development rather than in adult
systems (Lauder, 1990). The early appearance of serotonin in target regions, ahead of
other monoamines might be involved in the regulation and development of other
monoamines, in particular dopamine (Whitaker-Azmitia, 2001).
2.2 Serotonin in early development
5-HT is reported to regulate early cleavage divisions in rodent embryo (Burden
and Lawrence, 1973). The level of 5-HT (exogenous or endogenous) in pre-implantation

22
embryo plays an important role in autocrine and paracrine regulations of mouse embryo
development (Il'kova, et al., 2004). In another study, 5-HT was added to whole embryo
culture followed by anti-5-HT treatment to detect the serotonin uptake in mouse embryo.
It was reported that there is a transient expression of 5-HT uptake sites during the early
stages of gestation in craniofacial epithelia, hindbrain and myocardium (Buznikov, et al.,
1996). Serotonin appears to auto regulate development of serotonergic neurons and can
initiate and autoamplify its own synthesis in hypothalamus. It plays an important role in
neurogenesis, neuronal differentiation, axon myelination and synaptogenesis. In vivo
studies on Drosophila mutants and adult snails depleted of 5-HT, resulted in aberrant
growth of serotonergic and other axons (Baker, et al., 1993; Budnik, et al., 1989). These
studies suggest that altered levels of 5-HT may affect the development of serotonergic
system in vertebrate and invertebrate embryos (Buznikov, et al., 1996). Removal of
serotonin during the early fetal development in rats resulted in reduction of number of
neurons in adult brain (Brezun and Daszuta, 1999; Lauder and Krebs, 1976). Fukumoto
et al reported the presence of 5HT in early chick and frog embryos and observed its role
in embryonic patterning (Fukumoto, et al., 2005). They also suggested that serotonergic
signaling which might be responsible for regulating left-right patterning in vertebrate
embryos.
Tryptophan hydroxylase (TPH) is the only known 5-HT synthesizing enzyme in
adult neuronal and endocrine cells. Administration of para-chlorophenylalanine (PCPA),
an inhibitor of TPH in pregnant mice, resulted in the arrest of cytokinesis at zygote stage.
From this, it is deduced that 5-HT is of extraordinary importance in the first steps of
mammalian embryonic development. In later stages of pregnancy, depletion of 5-HT due

23
to PCPA administration resulted in abnormal organogenesis affecting development of
brain, eyes, vascular system and jaws (Khozhai, et al., 1995). This suggests that 5-HT is
required during different phases of development from gametes over fertilized eggs and
cleavage divisions to gastrulation and neurulation.
Walther et al reported that ES cell extracts contain easily detectable amounts of 5-
HT (Walther and Bader, 1999). From their study, they concluded that ES cells could be
used as model cell line for early embryogenesis with respect to the expression of genes in
serotonergic system. Hence, ES cells are appropriate models for identification of gene
products of neurotransmission systems and thus can be used for detailed study of
neurotransmitter actions in prenervous ontogenesis (Walther and Bader, 1999). These
studies also focus on the importance of monitoring the prescription of drugs during
pregnancy as, several compounds intervene with the serotonergic systems and other
neurotransmitters leading to improper development of embryo.
It is evident that serotonin plays a cardinal role in the development of mammalian
brain. It is also evident that serotonin plays a role in early mammalian development
before the nervous system appears. Hence, exploring the transcriptional regulatory
elements and understanding the genes that govern the special properties of ES cells is
interesting and of importance.
2.3 High throughput studies in ES cells
Various high throughput studies have been carried out in ES cells to explore the
genes that contribute to ‘stemness’ of these cells. These studies were carried out in ES
cells, neuronal precursor cells, embryonic fibroblasts or hematopoietic stem cells.

24
Mikkelson et al performed a microarray to study the expression profiles of murine ES
cells along with neuronal precursors, embryonic fibroblasts (Mikkelsen, et al., 2007). The
data is publicly available under GSE8024 record for detailed analysis of the differentially
expressed genes in ES cells over other lineages. Ramalho-Santos et al reported 1676
genes that were enriched in ES cells compares to neural and hematopoietic SCs. They
also reported 133 genes to be enriched in all the three SCs suggesting the possible role of
these genes in contributing the ‘stemness’ of these cells (Ramalho-Santos, et al., 2002).
Other studies on ES cells include Ivanova et al, Sperger et al, and Fortune et al (Fortunel,
et al., 2003; Ivanova, et al., 2002; Sperger, et al., 2003) and reported genes enriched in ES
cells. Roma et al compared Ramalho-Santos et al, Fortune et al, and Ivanova et al studies
on gene expression profiling in ES cells and reported 332 genes common to these studied
that were enriched in ES cells (Roma, et al., 2007). However, there are no functional
genomic studies on exploring the role of serotonin in ES cells.
2.4 Knowledge gap and motivation
Most of the ESCs studies are focused on the knock-down or addition of single
component such as a receptor or gene or chemical and the corresponding phenotypic
changes. However recently, the functional genomic studies have begun to focus on whole
genome as well since each biological process is mediated by more than a single
component. High-throughput techniques such as microarrays and deep-sequencing
methods provide a new approach to look at multiple components and their levels and
roles. Very few high-throughput studies have been reported in the ESCs arena and their
differentiation (Fortunel, et al., 2003; Ivanova, et al., 2002; Roma, et al., 2007; Sperger,
et al., 2003).

25
Furthermore, the data generated from these high-throughput methods is huge in
amount and hence robust computational methods have become necessary and offer a
great potential to handle such data. Many computational methods have been developed
and are being widely used in transcriptional regulation studies however very few ESCs
studies have implemented these in silico methods to interpret the results.
It has become recently evident that serotonin plays a cardinal role in ES cells.
There is a lack of knowledge about the downstream and transcriptional target genes that
are regulated by serotonin. Hence, exploring the transcriptional regulatory elements and
understanding the genes that govern the special properties of stem cells is quite essential.
In this study, we implemented a data-driven approach to identify transcriptional
regulatory elements that regulate gene expression patterns of 5HT responsive genes.
2.5 Goals and objectives
The main goal of our study was to understand the role of serotonin in ES cells. In
order to achieve this goal, we formulated four objectives:
1. To identify differentially expressed gene signatures using stringent statistical
techniques.
2. To identify and analyze transcriptional regulatory elements associated with 5-HT
involved ES cell differentiation.
3. To compare our dataset with public domain data and perform further literature
validation.
4. Perform functional annotation of differentially expressed 5-HT responsive genes.

26
CHAPTER THREE: METHODS
We propose to explore the transcriptomic signatures that are regulated by
serotonin in ES cells. To prove that the TF binding motifs identified from computational
approaches are associated with the role of 5-HT in ES cells, we implemented an in silico
experimentation protocol (Figure 2). The sections in this chapter describe the various
stems illustrated in this flow chart. The datasets used in this study and different
experimental methods and algorithms are also described.
3.1 Microarray experiment
Considerable homology exists between mouse and human genes and hence we
used mouse ES cells in our study. The microarray used in our study were done by
Genotypic and has duplicates of four samples viz., control, 5-HT treated, P+C treated,
and P+C+5HT. The samples from each treatment were prepared, RNA was isolated and
cDNA was generated, biotinylated and hybridized to the Agilent microarray platform.
Parachlorophenylalanine (P) and Carbidopa (C) inhibit the biosynthesis of 5-HT.
Parachlorophenylalanine inhibits tryptophan hydroxylase, the rate-limiting enzyme in the
biosynthesis of serotonin. It hydroxylates tryptophan to 5-hydorxytraptophan. Carbidopa
inhibits the next step in the biosynthesis of 5-HT by inhibiting the decarboxylation of 5-
hydroxytryptophan by aromatic acid decarboxylase or DOPA decarboxylase. Together,
they should sharply decrease the endogenous levels of serotonin in ES cells.
The ES cells that were not treated with 5-HT or P and C were considered as
control, viz., sample 1. The second sample included the ES cells that are treated with the
exogenous addition of 5-HT (denoted as 5-HT). The third sample had the murine ES cells

27
treated with P and C to block the synthesis of endogenous 5-HT (denoted as P+C) and
fourth sample was treated with inhibitors of endogenous 5-HT synthesis (P, C) followed
by the treatment of exogenous 5-HT (denoted as P+C+5HT).
The second sample, viz., 5-HT treated, helps in identifying the genes that are
regulated by both exogenous and endogenous 5-HT. In third sample, P+C, we are
blocking the synthesis of endogenous serotonin and observing changes in gene
expression patterns. This sample will give us the genes that are differentially expressed
by blocking the endogenous 5-HT. In sample 4, P+C+5HT, we have blocked endogenous
5-HT synthesis and then added serotonin exogenously to identify the genes that would be
strictly regulated by exogenously added 5-HT.

28
Figure 2: Workflow of experimental analysis to understand the role of serotonin responsive genes in ES cell differentiation.
The raw Agilent data was preprocessed and MA plots, box plots were used to determine the quality of the data and to monitor the effect of normalization. After preprocessing, stringent filtering strategies (One way ANOVA, volcano plots and Genotypic analysis) were implemented to find differentially expressed genes. We considered the genes that were 1.5 fold up and down regulated, and p-value less than 0.05 in control/5HT and P+C/P+C+5HT conditions as 5HT induced, 5HT suppressed genes respectively (shown in box in middle right, outlined with dotted line). Gene ontology analysis was performed to explore the functional annotation of differentially expressed 5HT responsive genes. Motif prediction analysis was performed on the filtered genes and random sequences using MEME and MotifScanner. The results were further validated by comparing with Public domain data and by literature validation.

29
3.2 Quality assessment
The quality of the chip was assessed in the R programming environment
(Gentleman, et al., 2004; Team., 2007), bioconductor software and GeneSpring by using
raw data as input. Bioconductor is free and open source software based on the statistical
R programming language for comprehensive analysis of genomic data. Limma (Linear
models for microarray data) is one of the bioconductor software packages used for the
analysis of gene expression microarray data (Gentleman, et al., 2004). The data files from
Agilent contain data from image analysis of scanned arrays and can be either one-colored
or two-colored based on number of samples hybridized to every array (number of
fluorescent dyes used). The dataset used in our study is a one-colored and the data file
contains only one channel (green or red channel). Determining the quality of the dataset
is a crucial step before proceeding to quantitative analysis. The exploratory data analysis
is the commonly used method for quality assessment.
3.2.1 Exploratory data analysis
For Agilent one-color arrays there are two very commonly used quality control
tools, namely box plot and MA plot. It is always better to produce quality control plots
before and after normalization of data in order to monitor the effect of normalization.
3.2.1.1 Box Plots
Box plots of the data before and after normalization help in observing whether
normalization applied had intended effects. The standard box plot has every single array
represented by one box. It reflects the differences between populations without making
assumptions of underlying statistical distribution. The medians of each box are marked

30
within the horizontal bars inside the boxes. If the median line within the box is not
equidistant from the hinges, then the data is skewed. Using the box plots, one can quickly
compare the data samples, and have information on the data’s symmetry, normality,
median level and skewness.
3.2.1.2 MA Plots
MA plots give a quick overview of the distribution of the data. It is a plot of
distribution of log expression intensities ratio (M) versus the average log intensities (A)
of the microarray data (Bolstad, et al., 2003). It visualizes the modified red and green
intensities against each other. After normalization, MA plots should not contain any
visible non-linearities.
3.3 Normalization of the data
Systemic variations in DNA microarray experiments affect the measured gene
expression levels. After the quality control check, the microarray data has to be
normalized prior to the selection of differentially expressed genes. Normalization is the
process by which the spot intensities are adjusted to take into account the variability
across different experiments and platforms (Allison, et al., 2006). It removes the non-
biological variations and systemic biases in microarray experiments. To measure the gene
expression changes more accurately and precisely, random and systematic variations
must be taken into account. Biases associated with the fluorescent dyes used in
microarray experiment can be considered as an example for need of normalization (Yang,
et al., 2002).

31
Agilent data normalization typically consists of two phases, background
correction and normalization. The simplest method of background correction is
subtraction of background intensities from the spot (foreground) intensities followed by
addition of the offset. Offset is the number added to the spot intensity in the background
correction. In our study, we used quantile normalization and the data is log2-transformed.
3.4 Selection of differentially expressed genes
After the quality assessment and normalization of data, the genes that are
differentially expressed are to be filtered. Microarray data analysis is used to discover
genes that are differentially expressed across the treatment conditions. In our study, the
experiment is done across four samples control, 5-HT, P+C and P+C+5HT treatments.
There are 15208 probesets in the Agilent platform we used. The noise inherent in the raw
expression data and the dimensionality issue are significant challenges to analyze the
data. A wide range of methods for selecting the differentially expressed genes includes
simple fold change technique, classic t-test statistic and moderate t-statistics (Jeffery, et
al., 2006). The choice of method used for selecting differentially expressed genes greatly
affects the resultant gene lists identified. The preliminary filtering is based on flag values
namely present, marginal and absent flags. The order of importance of flag values is
present > marginal > absent. A present flag implies that the feature on the array is
positive, significant, uniform, above background, not saturated and is not a population
outlier and vice versa. The genes with flag values of present and marginal are filtered
(poor quality probes are removed).

32
After eliminating poor quality probes, fold change and p value filtering strategy
was used. Fold change (FC) is a metric used for comparing a gene’s expression between
two experimental conditions (Allison, et al., 2006). It is one of the earliest approaches
used for the selection of differentially expressed genes because of its easy interpretation
and simplicity. The FC for each probe is calculated as the ratio of mean control and mean
treatment observations. In our analysis, we considered the genes that differ by more than
one and half fold expression value. In other words, the genes whose expression value in
one condition is 1.5 fold more or less than that under the other condition were selected.
In addition to fold change, we also used the Student’s t-test to determine
statistically significant differences between two conditions by looking at the difference
between two independent means. The significance of the difference in the gene
expression between test and control samples was estimated using the t-test. The null
hypothesis is that there is no difference in the expression between control and test
samples. The t-test compares the consistency in the expression values between test and
control samples; and gives the significance value. If this significance value (p-value) is
less than 0.05, it implies that the null hypothesis is not true and the difference in the
expression between test and control samples is significant. In our study, a gene is
considered to be upregulated by the 5HT treatment (exogenous 5HT) if the ratio of its
average expression values in 5HT to control and P+C+5HT to P+C is > 1.5 and has a t-
test p value <0.05 in each of these comparisons. In addition, a gene is considered to be
down regulated by the 5HT treatment (exogenous 5HT) if the ratio of its average
expression values in 5HT to control and P+C+5HT to P+C is < 1.5 and has a t-test p

33
value <0.05 in each of these comparisons. Based on the p value from t-test and the fold
change, volcano plots were generated to highlight the statistically significant results.
To avoid inclusion of false positives, we also used one-way ANOVA to test for
differential expression across conditions defined by one treatment parameter. In order to
control the type I error, we used Welch method in one-way ANOVA to detect the
differences among the conditions. The genes filtered from one-way ANOVA are those
that are differentially expressed in at least one of the conditions with significant p-value.
We further filtered the genes that were differentially expressed in both control VS 5HT
and P+C Vs P+C+5HT. We also used the results from Genotypic software analysis and
performed Excel analysis to identify differentially expressed genes using the fold change
and p value filter. The 1.5 fold upregulated and down regulated genes with p value < 0.05
were filtered out from Genotypic results.
We separated the differentially regulated genes into 4 gene lists namely: Genelists
1 and 2 have the combined results of one-way ANOVA and volcano plots. Genelists 3
and 4 have the results from the Genotypic analysis. The 5-HT induced genes from
combined ANOVA & volcano plots and Genotypic analysis are listed in genelists 1, 3
respectively. The genelists 2, 4 have the 5-HT suppressed genes from combined ANOVA
& volcano plots and Genotypic analysis respectively.
3.5 Sequence retrieval and repeat masking
In general, the regulatory modules are located in the upstream regions of the gene,
near the promoter (Blanchette, et al., 2006). Hence, we retrieved the -1000 to +100 region
with respect to transcription start site (TSS) for all the gene lists and also for random

34
genes. The sequences were retrieved from the regulatory sequence analysis tool (RSAT)
(Thomas-Chollier, et al., 2008). These sequences contain stretches of highly repetitive
regions such as, simple repeats, tandem repeats, segmental duplications, and interspersed
repeats. Approximately 50% of the human genome is repetitive in nature. In order to
avoid this problem, we used RepeatMasker program to mask the repeats (Smit AFA,
1996-2010).
RepeatMasker, through a cross-match program that uses the Smith-Waterman-
Gotoh algorithm screens the input DNA sequences for any repeats, low complexity
regions and replaces the nucleotides in the repeats with the alphabet ‘N’ or lower case
letters. The resulting output shows all the input sequences whose repeat regions are
masked and it has the same length of sequence as the input file. Along with the repeat
masked file, summary of query sequences and annotations of masked sequence is also
provided.
3.6 Identification of TFBS
The expression of genes is regulated at transcriptional level by binding of the TFs
to the regulatory elements of the genes. The identification and characterization of these
TFBS is an important and challenging task. Motif discovery is one of the first steps in
computational analysis of gene-regulation. We used both the de novo and ab initio TFBS
prediction tools such as MEME (Bailey, et al., 2009) followed by STAMP analysis, and
MotifScanner (Aerts, et al., 2003) respectively in our study. The repeat masked gene
sequences were given as input to MEME whereas for MotifScanner, the input sequences
along with curated position weight matrices (PWMs) of TFs are provided. We performed

35
this analysis on our four gene lists (foreground, FG) as well as on random sets of genes
(background, BG) to find enrichment of TFs in input sequences.
3.6.1 MEME
MEME is a tool used for de novo method of discovering motifs or patterns in a
group of related DNA sequences. It is an unsupervised learning algorithm that uses a
multiple sequence alignment approach to find statistically significant motifs in the input
set of sequences. It uses PWMs to represent the probability of a nucleotide to be present
at each position in the patterns (Bailey, et al., 2009; Bailey and Elkan, 1995).
MEME is available as a both web server application and a command line version
(Bailey, et al., 2006). The web version of MEME can execute the sequence files
containing less than 60000 characters only. The web interface allows users to perform
four types of motif analysis: motif discovery, motif-motif database searching, motif-
sequence database searching and assignment of function. The web server is more user
friendly where, the input parameters can be specified directly. If the input sequence file
contains more than 60000 characters, the command line version of MEME has to be
installed in a local server. The sample command of MEME used in the command line
version:
(>meme sequences in FASTA format -sf <filename.txt> <-dna or –protein> -mod
<zoops or oops or anr> -nmotifs <Number of motifs> -minw <minimum width> -maxw
<maximum width> <other parameters (optional))

36
If the optional parameters are not specified, default values are considered for the
prediction. To get reliable results, the low complexity regions and repeats must be
removed by using tools such as RepeatMasker. Thus, MEME takes input DNA or protein
sequences and predicts the occurrence of as many motifs as requested in the input
sequences. The parameters used in our study are: number of motifs (20), minimum width
(6), maximum width (15), and mode of motif distribution (zero or one per sequence,
zoops). Revcomp parameter was also used additionally to search for the motif in both
strands of DNA.
The output results from MEME include an overview of all discovered motifs,
detailed information of each motif predicted by MEME, combined block diagram
showing the tiling of the motifs in the input sequences, and command line summary.
Summary of the motifs predicted includes: E-value (statistical significance of motif),
width of the motif, number of sites of occurrence in input sequences, log likelihood ratio
of motif, information content (IC) and relative entropy. In addition to this, the output also
has a sequence logo of the predicted patterns. The output has embedded links to submit
the predicted motifs to other databases such as MAST, FIMO, TOMTOM, GOMO, and
BLOCKS for further analysis. The output from MEME can be downloaded in html, xml
and text format.
The MEME output is analyzed to find the significant motifs that have high IC
(measure of motif strength in terms of conserved position viz., more the motif is
conserved, higher its information content) and number of occurrences. In general, the
motifs that have 70% IC and that occur in 10% of input sequences are considered for
further analysis. The selected motifs predicted by MEME were provided to STAMP.

37
3.6.2 STAMP
Most of the de novo motif prediction tools report the predicted motifs in the form
of frequency matrices such as PWMs that are stored in TF databases such as JASPAR
and TRANSFAC. The interpretation of these outputs is very challenging. STAMP is a
web tool for alignment, similarity and database matching for DNA motifs (Mahony and
Benos, 2007). It uses scoring metrics, pairwise alignment methods, gap penalties,
multiple alignment strategies and tree building algorithms. STAMP supports various
motif databases such as JASPAR, TRANSFAC, Saccharomyces cerevisiae regulatory
code motifs, Drosophila motifs, Escherichia coli motifs, and RegTransBase prokaryotic
motifs. After uploading the input motifs to STAMP, once can choose the above
parameters. We can also directly submit the output from the de novo motif finding
algorithms to STAMP for interpreting the results (Mahony and Benos, 2007).
In our study, the output from MEME is provided as input to STAMP and the
option of finding 10 best matches in JASPAR v2010 database to each of the motifs in the
input sequences are selected. Other parameters such as, Pearson correlation coefficient
for comparison of input matrices, ungapped Smith-Waterman algorithm for alignment,
iterative refinement multiple alignment strategy, UPGMA tree building algorithm, and
the input sequences submitted are left to be default (Mahony, et al., 2007; Mahony, et al.,
2005).
The output from STAMP can be exported either as a webpage or as a pdf file. The
output contains, a ‘familial binding profile’ based on the final multiple alignments, a tree
showing the similarity between the input motifs and its best match from TF database, and

38
detailed TF matches from database for each input motif. The alignment between the input
motif and the match is represented as a consensus sequence along with the e-value of the
alignment.
3.6.3 MotifScanner
MotifScanner is an algorithm implemented in C++ that is used to screen DNA
sequences with precompiled TFBS. It is an integrated part of TOUCAN, which is a
workbench for regulatory sequence analysis. MotifScanner is probabilistic sequence
based model in which the motif is assumed to be hidden in a noisy background sequence.
It scans the input DNA sequences with the PWMs of the TFs to look for TFBS. Instead of
using a predefined threshold, motif scanner uses a probabilistic model to estimate the
number of instances a motif is likely to occur in a specific sequence, given the
background and motif model. Thereby, choosing the appropriate background model
reduces the number of false positives and estimating the number of motif instances
instead of using a threshold helps in picking the stronger sites rather than weaker sites
(Aerts, et al., 2003; Aerts, et al., 2005).
This algorithm is available as both a command line version as well as a web
interface. The PWMs of the TF of interest (motif model), input sequences in FASTA
format, suitable background model are the required parameters to be given as input to
MotifScanner. The optional arguments include: single stranded motif search (0) or double
stranded search (1), prior value that indicates stringency level viz., lower the prior value
higher the stringency and it is proportional to length of the input sequence (Aerts, et al.,
2003). In general, prior value of 0.1-0.2 is given for sequences smaller than 300 bp and

39
0.9 for sequences larger than 1500 bp. The following is the command line code for
executing MotifScanner:
(./MotifScanner –f <path to input sequences in fasta format> -b <background model> -m
<motif model description> -p <prior value> -s <0/1> -o <output file>)
In our study, the length of the input sequences used was 1100bp and hence, we
used the prior probability value of 0.6 and s value of 1 to look for the motif in both
strands of DNA. We used all the non-redundant vertebrate motifs (130), reported in
JASPAR database as the motif file. The output from MotifScanner is in the form of GFF
(Sanger’s General Feature Format). It has the motif instances information such as name,
start, end, confidence score, and strand in which it is present. Perl scripts were used to
tabulate the number of instances a particular motif is enriched in each input sequence, to
calculate fold change enrichment with respect to background and a z-value.
3.6.4 Motif enrichment analysis
To validate our results, both MEME and MotifScanner were performed on mouse
genome random sequences generated from RSAT (regulatory sequence analysis tool)
(Thomas-Chollier, et al., 2008). For MEME, the same number of random sequences as
the number of sequences in serotonin responsive genes sets was retrieved. The sequences
were masked with repeat masker as mentioned in Methods section 3.5. On the other hand,
for MotifScanner, 25000 sequences of length 1100bp that were collected randomly from
mouse genome. Then these sequences were masked using Repeat Masker. From this pool
of masked sequences, we randomly sampled 1000 sets each of size that is same as the
number of sequences as in the serotonin responsive genes sets. Hence, 1000 random sets

40
were generated for each of the four lists that were selected as differentially expressed
genes. MotifScanner was performed on all of these random sets. The MEME and
MotifScanner results of actual selected gene lists (foreground) and their respective
random gene lists (background) were compared.
3.7 Literature validation and comparison with public domain data
The results from our study were compared to two public domain microarray
datasets to demonstrate the validity and accuracy of the study. Mikkelsen et al performed
a microarray to study the expression profiles of murine ES cells, neuronal precursors
(NPC), and embryonic fibroblasts (MEF) (Mikkelsen, et al., 2007). The samples were
prepared from each group and cDNA was generated, biotinylated and hybridized to
Affymetrix Mouse Genome 430 2.0 Array platform. The microarray data is available in
NCBI-GEO database under GSE8024 record (PDD1). All the cel files, and sample
records were downloaded and analyzed using affy package (Gautier, et al., 2004). Robust
multiarray average (RMA) method was used for preprocessing and normalization of the
cel files. After normalization, the cel files were converted into expression files that were
used for further analysis. The average expression value of each probe across the
replicates and the fold change enrichment of ES cells over NPC and MEF were
calculated. The probes that were 1.5 fold enriched (both 1.5 up and 1.5 down) in ES cells
were filtered for comparison with the results from our dataset.
Ramalho-Santos et al compared the transcriptional profiles of murine ES cells,
neural SC, and hematopoietic SCs (Ramalho-Santos, et al., 2002). The samples were
isolated and the mRNAs hybridized to Affymetrix U74Av2 DNA microarray and the

41
arrays were analyzed using dChip and Affymetrix microarray suite. They reported 1676
genes (PDD2) that were enriched in ES cells. We used the list of these genes to compare
with our dataset.
As a part of literature validation, we also compared the 5-HT responsive genes
identified in our study to various studies in stemness and ES cells (Fortunel, et al., 2003;
Ivanova, et al., 2002; Ramalho-Santos, et al., 2002; Roma, et al., 2007; Sperger, et al.,
2003).
3.8 Functional annotation of 5-HT responsive genes
We used gene ontology (GO) analysis to explore the biology behind the 5-HT
responsive genes. GO analysis shows the ontology categories and functional annotations
that are highly represented in the data. It characterizes the functions of genes based on
biological processes, molecular functions, and cellular components. We used Gene
ontology for functional annotation (GOFFA) (Sun, et al., 2006) and GO-Proxy (Martin, et
al., 2004) for functional annotation of 5-HT responsive genes identified in our study.
GOFFA is a FDA based gene ontology tool, which ranks the GO terms for a list
of genes based on statistical significance. It is a Java based platform integrated with
ArrayTrack software and uses an ORACLE database, which has GO project data and
gene identifiers from the NCBI Entrez gene database (Sun, et al., 2006). GO-Proxy is a
GO-based clustering tool, which is used for grouping the functionally related genes
together. It calculates the annotation-based distance between genes based on
Czekanowski-Dice formula and forms a functional classification tree using this distance
matrix, defines the classes and statistical relevance of terms associated with each class

42
(Martin, et al., 2004). The GO categories enriched in the 5HT induced and suppressed
genelists were analyzed.

43
CHAPTER FOUR: RESULTS
4.1 Exploratory data analysis
Determining the quality of the dataset is an important step in microarray analysis.
The quality of the dataset was assessed by exploratory data analysis. It uses statistical
techniques to identify hidden patterns in the dataset. In our study, we used box plots and
MA plots to assess the quality of Agilent one-color data and the results are shown in
Figures 3, 4, and 5 respectively.
A box plot also known as a whisker plot is often used in exploratory data analysis
to summarize and compare groups of data. It conveys information about the sample’s
range, median level, normality and skewness of distribution of data. Figure 3 shows the
box plot of the datasets used in this study after normalization.
The horizontal line inside the box is the median, which is the middle value of each
sample. The position of the median line indicates the skewness of the distribution. In all
the samples, the median line is present at the center of the box, thereby indicating that the
data is not skewed. The two lines extending from the box are called as whiskers. The
position of the box within the whiskers indicates the normality of the sample distribution.
It is observed that the boxes are equidistant from the whiskers, which indicates that the
data is normally distributed and there is no skewness in the data. The size of the box
indicates the kurtosis or peakedness of the data. Smaller the size of the box relative to
whiskers, thinner the peak is and vice versa. It is observed in figure 3, that the size of the
box is proportionate to the whiskers and hence the data is free from kurtosis. Kurtosis is
used to measure peakedness or flatness of data relative to normal distribution.

44
Figure 3: Box plot of the four normalized samples.
The X-axis represents 5HT treated, control, P+C treated, and P+C+5HT treated and the Y-axis has the normalized intensity values. The box plot shows the distribution of the data, reflects the range, normality, median level, and skewness of the data. After normalization of the data, the box plot was generated for all the four samples. The medians of all the samples appear to be at same level, which indicates that the normalization has been effectively done.
A MA plot gives an overview of the overall distribution of the data. It is the plot
of log intensity ratios Vs log intensity averages. They are generally useful to monitor the
efficacy of normalization. PlotMA3by2 function of bioconductor was used to generate
MA plots for all the samples in the dataset including the replicates.

45
Figure 4: MA plot of the duplicates of four samples before normalization.
As a part of the exploratory data analysis, MA plots were generated before normalization using the PlotMA3by2 () function in bioconductor. The conditions: control, 5HT, P+C, P+C+5HT are labeled as sample 1-4. There are two replicates for each sample. Hence, sample 1_1 represents first replicate of sample 1 and so on. The plots reveal that the raw data is non-linear and noisy.
Figures 4 and 5 show the MA plots for all the samples before and after
normalization respectively. The MA plots before the normalization (figure 4) was plotted
directly by importing the raw data files into the bioconductor package. The plots are non-
linear and noisy indicating that the data has to be normalized.

46
Figure 5: MA plot for normalized samples.
After normalization, the MA plots were generated to monitor the effect of normalization. The log intensity ratios (M) are plotted along Y-axis and average log intensities (A) are plotted along X-axis. The plots across the replicates of the samples are linear and do not have noise.
After monitoring the quality of the raw data in Figure 4, the data was normalized
using quantile method of normalization and MA plots were generated with the
normalized data. Figure 5 demonstrates that normalization has been effective, as the MA
plots do not show any non-linearities.
Thus, exploratory data analysis was performed to ensure the quality of the data
before proceeding on to the quantitative data analysis.

47
4.2 Selection of differentially expressed 5-HT responsive genes
To identify the differentially expressed 5-HT responsive genes, we filtered out the
genes based on volcano plots, one-way ANOVA, and Genotypic analysis (i.e. the
commercial provider’s analysis) using fold change criteria, and p –value from student’s t-
test. The comparison of the samples that aid in filtering the 5-HT responsive genes are
namely: control vs 5HT and P+C vs P+C+5HT. Initially, the microarray dataset consisted
of 15,208 probes. A total of 10,918 probes remained after employing the present,
marginal flag filtering criteria as mentioned in the Methods section.
One-way ANOVA with unequal variance using Welch test was performed on
these 10,918 probes. Out of the 565 probes filtered from one-way ANOVA, 468 probes
showed 1.5-fold enrichment. As one-way ANOVA gives the genes that are differentially
expressed in at least one of the conditions with significant p-value, we filtered the list
further based on the 1.5 fold enrichment in the control vs 5HT and P+C vs P+C+5HT
comparisons alone. Out of the 468 probes from one-way ANOVA, 276 and 192 probes
were 1.5 fold up and down regulated respectively in the control vs 5HT comparison. On
the other hand, 295 and 173 probes were up and down regulated respectively in the P+C
vs P+C+5HT comparison. There were 10 genes that are 1.5 fold upregulated and 14
genes that were 1.5 fold down regulated common to both the comparisons (Table 1).

48
Table 1: Summary of ANOVA results
ANOVA No. of genes in Ctrl Vs 5HT
No. of genes in PC Vs PC5HT
No. of genes common to both comparisons
5HT induced genelist 276 295 10
5HT suppressed genelist 192 173 14
Figure 5 shows the volcano plots, where the gene expression data was plotted as
significance (p-value) versus the fold change. Volcano plots gives both statistically
significant genes and differentially expressed genes based on fold change.
Figure 6: Volcano plots of Control Vs 5HT and P+C Vs P+C+5HT comparisons.
The logarithm of base 2 of fold change and log base 10 of p value of the data set were plotted along X and Y axis respectively. The green lines represent the separation of the data by imposing fold change and p value cut offs. The points that are 1.5 fold enriched and p value less than 0.05 are highlighted in red.

49
The volcano plots were generated using the 10,918 probes as seed. Out of these,
361 and 336 probes showed significant (p < 0.05) 1.5 fold up and down regulation
respectively (Figure 5). Out of the 351 probes, 207 were up regulated in control vs 5HT
condition and 154 were up regulated in P+C vs P+C+5HT condition. Of the 336 1.5 fold
down regulated probes, 159 and 177 probes are down regulated in control vs 5HT and
P+C vs P+C+5HT respectively. There were only 10, and 3 genes that were 1.5 fold up
and down regulated common in both the comparisons respectively (Table 2).
Table 2: Summary of Volcano plot results
Volcano plots No. of genes with
p-value <0.05, 1.5fold enriched
No. of genes in Ctrl Vs 5HT
No. of genes in PC Vs PC5HT
No. of genes common to both
comparisons 5HT induced
genelist 361 207 154 10 5HT suppressed
genelist 336 159 177 3
At this stage, we combined the ANOVA and volcano plot results to identify 5-HT
responsive genes. The probes that were 1.5 fold upregulated were denoted as 5-HT
induced genes (genelist1) and 1.5 fold down regulated were denoted as 5-HT suppressed
genes (genelist2) in both control/5HT and P+C/P+C+5HT conditions. Thus, genelist1 has
10 genes from ANOVA and 10 genes from volcano plots (total 20) that showed
significant 1.5 fold up regulation in both control/5HT and P+C/P+C+5HT. Similarly,
genelist2 has 14 genes from ANOVA and 3 genes from volcano plots (total 17) that
showed significant 1.5 fold down regulation in both the conditions.
The results from Genotypic analysis were further filtered based on the fold change
and p value using basic Excel analysis. The genes that were 1.5 fold enriched (up-

50
regulated and down-regulated), and with p value less than 0.05 were filtered. A total of
1307 genes were 1.5 fold up-regulated in both control/5HT and P+C/P+C+5HT
conditions, out of which, 24 genes had significant p value (p < 0.05). There were 628
genes that were down regulated in both the conditions and 12 genes among them had
significant p value. These 24 and 12 genes were reported as genelist3, and 4 respectively.
Thus, the genelists 1, 3 have 1.5 fold up-regulated genes; hence considered as 5-
HT induced genelists and genelists 2,4 have 1.5 fold down-regulated genes; hence
considered as 5-HT suppressed gene lists (Table 3). Thus, we get 20, 17, 24, and 12
differentially expressed 5-HT responsive genes based on our stringent filtering paradigms
(Table 4).
Table 3: Summary of differentially expressed 5-HT responsive genelists
Final Genelists Comparison
Results from one-way ANOVA and Volcano plots:
Genelist1 Up-regulated 5-HT induced genelist
Genelist2 Down-regulated 5-HT suppressed genelist
Results from Genotypic analysis:
Genelist3 Up-regulated 5-HT induced genelist
Genelist4 Down-regulated 5-HT suppressed genelist
Table 4: List of differentially expressed 5HT induced and suppressed genes after stringent filtering
Genelist1 Genelist2 Genelist3 Genelist4
Cldn14 Zfyve26 Cyp4f14 Hoxb1 Slc38a5
Irak3 Tnfrsf11b Prmt3 Galc Mtap6
Acpp Bysl Ccnd2 Cdc23 Cxcl9
Rnf216 Abcc1 Asb8 Gdf1 Lace1

51
Adrb1 Car4 Pitpnc1 Eif2s1 Gtf2h4 Creb3l1 Rbbp9 Nkd2 Rgs14 Rnd2 Dnajc16 Bhlhb8 Ank3 Barx2 Doc2a
Sqrdl Polk Adam3 Frem2 Nsg1 Ch25h Olfr406 Igsf1 Thbs1 Fas Rbl2 4932417H02Rik
Dgkg Dst Gjb3 Kdr Lifr Ltbr Ly6c1 Mid1 Mras Ncor1 Olfr1312 Olfr606 Pcdhb17 Ppp3r2 Rhoq Slc5a1 Snca Syne1 Tnfrsf11b
Mak Nptxr Plin Ppp1r16b Rgs11 Rnf130 Rpn1
4.3 Identification of TFBS using motif prediction tools
Understanding the cause and effect relation between transcriptional regulation and
gene expression is very crucial as it reveals the regulatory components associated with a
particular gene expression pattern. In order to correlate gene expression with
transcriptional regulation, we identified characteristic TF-TFBS interactions that are
unique to the 5-HT responsive genes. As mentioned in the Methods section, the
sequences of upstream regions for the 4 genelists were retrieved and repeat masked. We
used MEME (de novo approach), and MotifScanner (Ab initio approach) for identifying
regulatory regions in the upstream of the selected genes.
The input gene sequences were given to MEME, and the parameters for de novo
motif prediction were given as explained in the Methods section. The output from MEME
contains a list of motifs defined by user parameters such as number of motifs, their

52
sequence logos, E-value, information content, number of sites, PWMs, block diagrams
etc. The MEME output was stored as a .txt file and given as input to STAMP.
STAMP compares PWMs of MEME predicted motifs and searches for the profile
TFs against TF databases such as JASPAR and TRANSFAC. In addition, it outputs a
motif tree with the input motifs and the best-matched TF in the JASPAR database.
Moreover it also lists top matched TFs for each motif ranked by E-value. The STAMP
results for some of the MEME motifs of 5-HT induced and suppressed genes are shown
in figures 7 and 8.
Figure 7: Stamp results for MEME motifs enriched in 5HT induced gene sequences
The input motifs to STAMP (Left) and the corresponding JASPAR match along with the E-value (Right) in the 5HT induced genelists (genelist1, 3) are shown. The motifs predicted by MEME that were in concordance with the MotifScanner are shown here.
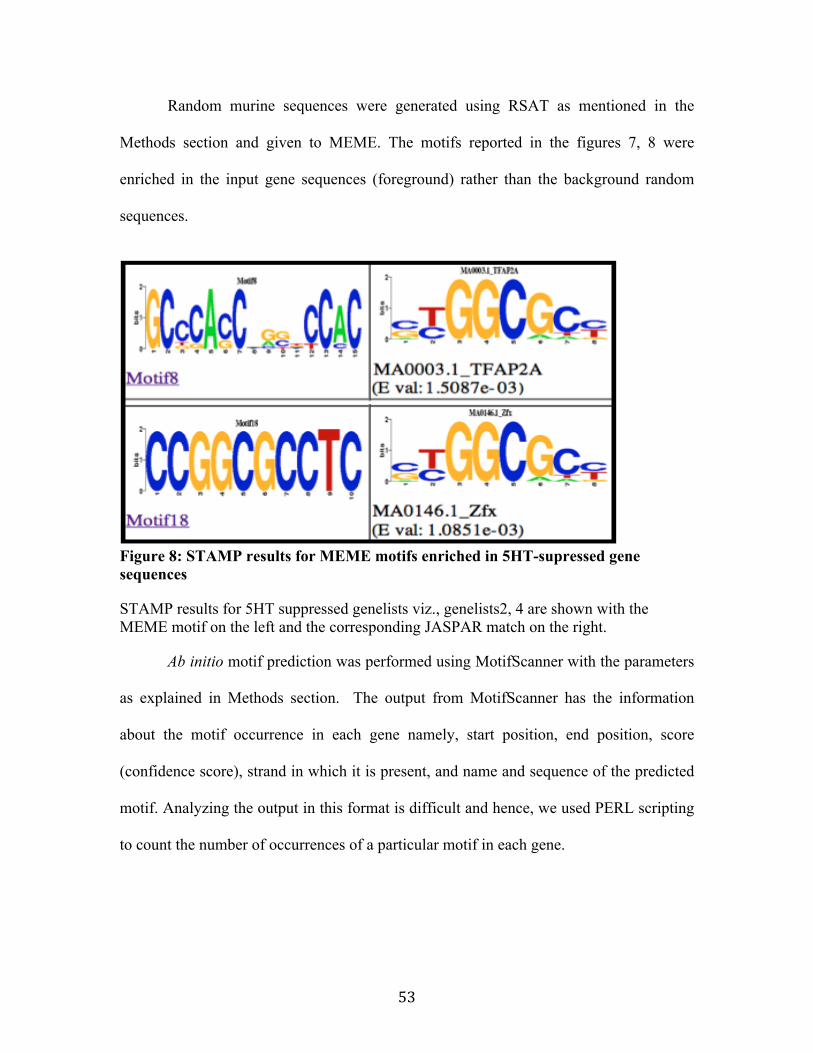
53
Random murine sequences were generated using RSAT as mentioned in the
Methods section and given to MEME. The motifs reported in the figures 7, 8 were
enriched in the input gene sequences (foreground) rather than the background random
sequences.
Figure 8: STAMP results for MEME motifs enriched in 5HT-supressed gene sequences
STAMP results for 5HT suppressed genelists viz., genelists2, 4 are shown with the MEME motif on the left and the corresponding JASPAR match on the right.
Ab initio motif prediction was performed using MotifScanner with the parameters
as explained in Methods section. The output from MotifScanner has the information
about the motif occurrence in each gene namely, start position, end position, score
(confidence score), strand in which it is present, and name and sequence of the predicted
motif. Analyzing the output in this format is difficult and hence, we used PERL scripting
to count the number of occurrences of a particular motif in each gene.

54
4.4 Motif enrichment analysis
After compiling the MotifScanner results, motif enrichment analysis was
performed to find the motifs enriched in foreground (FG) compared to background (BG).
In order to characterize transcriptional regulatory elements specifically controlling
serotonin responsive genes as supposed to house keeping genes, we employed a stringent
strategy to pick random sequences viz., randomly selected 1000 sets of 1100bp length
from a set of 25000 masked random sequences. MotifScanner was performed on the
random sets and PERL script was used to calculate the total number of occurrences of the
motifs. The significant motifs should be enriched in the foreground (FG, 5HT responsive
genes) compared to the background (BG, random sets).
We calculated the mean and standard deviation for number of occurrences in
random sets. Based on these values, fold change, z-value, and p-value were calculated.
The fold change is the ratio of number of sites in FG to the number of sites in BG. The
statistical Z-value is calculated using the formula (X-µ)/σ where X is the number of sites
in FG, µ is the mean number of sites in BG and σ is the standard deviation of the
distribution of number of sites in BG. P- value is the probability that the normally
distributed sites in BG will be greater than the no. of sites in FG. Higher the Z-value and
lower the p-value, greater is the significance of enrichment of a motif and vice-versa. The
top 15 hits from MotifScanner with the number of occurrences in FG and BG, fold
change, z-value, p-value for 5HT induced genes (genelists 1 and 3) are shown in the
tables 5 and 6.

55
Table 5: List of top 15 hits from MotifScanner for genelist1 sequences
TF No. of sites in
FG No. of sites in
BG Fold change Z-value P-value
TFAP2A 59 34 1.74 7.719 6E-15
SP1 53 31 1.71 5.471 2E-08
Egr1 13 5 2.60 4.124 2E-05
INSM1 15 7 2.14 3.228 0.001 Myf 10 4 2.50 2.792 0.003
Pax5 18 10 1.80 2.787 0.003
MZF1_5-13 33 24 1.38 2.406 0.008
Klf4 25 17 1.47 2.194 0.014
MZF1_1-4 44 37 1.19 2.046 0.020
Tcfcp2l1 22 15 1.47 1.955 0.025
NHLH1 15 9 1.67 1.753 0.040
Spz1 14 10 1.40 1.538 0.062
Zfx 15 10 1.50 1.524 0.064
CTCF 7 4 1.75 1.431 0.076
HIF1A::ARNT 13 9 1.44 1.369 0.085
* Genes that are significantly enriched in foreground (FG) when compared to background (BG) are highlighted in red (p value <0.05). The TFs common to both the 5-HT induced genelists (1,3) are highlighted in red.
Table 6: List of top 15 hits from MotifScanner for genelist3 sequences
TF No. of sites
in FG No. of sites in
BG FC Z-value P-value
TFAP2A 56 40 1.40 4.137 2E-05
Arnt 22 11 2.00 3.054 0.001
INSM1 16 8 2.00 2.913 0.002
USF1 20 10 2.00 2.670 0.004
SP1 48 37 1.30 2.613 0.004
HIF1A::ARNT 18 11 1.64 2.334 0.010
CTCF 10 5 2.00 2.262 0.012

56
MAX 13 7 1.86 2.097 0.018
Klf4 28 21 1.33 1.919 0.027
IRF1 10 6 1.67 1.898 0.029
Pax5 16 12 1.33 1.317 0.094
Nr2e3 19 13 1.46 1.290 0.098
Mycn 13 9 1.44 1.077 0.141
Myc 13 10 1.30 1.024 0.153
Zfx 15 12 1.25 0.786 0.216
* Genes that are significantly enriched in foreground (FG) when compared to background (BG) are highlighted in red (p value <0.05). The TFs common to both the 5-HT induced genelists (1,3) are highlighted in red.
We identified four TFs viz., TFAP2A, INSM1, SP1, and Klf4 common to 5-HT
induced genes (genelists 1,3) that were significantly enriched in FG when compared to
BG with p-value <0.05.
Tables 7, 8 show the top 15 hits from MotifScanner for the 5HT suppressed genes
(genelists 2,4). We identified two TFs viz., TFAP2A and Zfx that were common to both
the genelists. These two TFs were significantly enriched in FG when compared to BG
with a significant p-value.
Table 7: Top 15 hits from MotifScanner for genelist2 sequences
TF No. of sites
in FG No. of sites in
BG FC Z-value P-value
Myf 10 4 2.50 3.304 0.0005
PLAG1 4 1 4.00 3.212 0.0007
Zfx 17 9 1.89 3.046 0.0012
TFAP2A 36 28 1.29 2.487 0.0064
Egr1 7 4 1.75 1.433 0.0759
Arnt 11 8 1.38 1.085 0.1389
Mafb 27 24 1.13 1.052 0.1464

57
Pax5 11 8 1.38 0.999 0.1589
Arnt::Ahr 12 10 1.20 0.953 0.1703
Evi1 3 2 1.50 0.922 0.1784
Zfp423 2 1 2.00 0.918 0.1793
NF-kappaB 11 9 1.22 0.801 0.2115
NFKB1 6 5 1.20 0.613 0.2698
HIF1A::ARNT 9 7 1.29 0.589 0.2778
USF1 9 7 1.29 0.576 0.2822
* Genes that are significantly enriched in foreground (FG) when compared to background (BG) are highlighted in red (p value <0.05). The TFs common to both the 5-HT suppressed genelists (2,4) are highlighted in red.
Table 8: Top 15 hits from MotifScanner for genelist4 sequences
TF No. of sites in
FG No. of sites in
BG FC Z-value P-value
TFAP2A 32 20 1.60 4.644 2E-06
Zfx 13 6 2.17 2.895 0.0019
Esrrb 8 5 1.60 1.335 0.0910
Mafb 20 17 1.18 1.300 0.0969
HIF1A::ARNT 8 5 1.60 1.192 0.1165
ZEB1 20 17 1.18 1.169 0.1212
REST 2 1 2.00 1.119 0.1316
INSM1 6 4 1.50 0.969 0.1663
NHLH1 8 6 1.33 0.911 0.1811
Klf4 12 10 1.20 0.659 0.2550
SRF 2 1 2.00 0.615 0.2692
SP1 20 18 1.11 0.533 0.2971
EBF1 14 13 1.08 0.312 0.3775
RXR::RAR_DR5 3 3 1.00 0.241 0.4048
PPARG::RXRA 14 14 1 0.171 0.4320
* Genes that are significantly enriched in foreground (FG) when compared to background (BG) are highlighted in red (p value <0.05). The TFs common to both the 5-HT suppressed genelists (2,4) are highlighted in red.

58
Thus, MotifScanner results showed enrichment of 4 TFs (TFAP2A, INSM1, SP1,
Klf4) in 5HT induced genelists and 2 TFs (TFAP2A, Zfx) in 5HT suppressed genelists.
Further study on these TFs will provide insight into understanding the role of 5HT in ES
cells. From the MotifScanner results, we went back to get the genes that have the binding
sites to these enriched TFs. The list of 5-HT induced and suppressed genes that have
significant TFBS predicted by MotifScanner are listed in tables 9, and 10 respectively.
Table 9: List of 5HT induced genes having TFBS predicted by MotifScanner
TF Genelist1 Genelist3
TFAP2A, SP1 Creb3l1, Rbbp9, Nkd2, Rgs14, Rnd2, Ank3, Barx2, Doc2a, Cldn14, Zfyve26, Cyp4f14,
Hoxb1, Slc38a5, Adrb1, Car4, Pitpnc1, Gtf2h4, Bhlhb8
Acpp, Bysl, Ccnd2, Cdc23, Cxcl9, Dgkg, Dst, Kdr, Lifr, Ltbr, Mras,
Ncor1, Ppp3r2, Rhoq, Slc5a1, Snca, Tnfrsf11b, Ly6c1, Pitpnc1
Klf4 Creb3l1, Nkd2, Rgs14, Rnd2, Dnajc16, Barx2, Doc2a, Cyp4f14, Hoxb1, Slc38a5,
Adrb1, Car4, Bhlhb8
Acpp, Bysl, Ccnd2, Cdc23, Dgkg, Dst, Gjb3, Kdr, Ltbr, Pcdhb17, Ppp3r2,
Rhoq, Slc5a1, Snca, Ly6c1
INSM1 Nkd2, Ank3, Barx2, Doc2a, Cldn14, Zfyve26, Cyp4f14, Hoxb1, Slc38a5, Car4,
Q8K4R4-2
Acpp, Ccnd2, Cxcl9, Dgkg, Dst, Kdr, Pcdhb17, Ppp3r2, Rhoq, Snca, Syne1,
Ly6c1
Table 10: List of 5-HT suppressed genes having the enriched TFs predicted by MotifScanner
TF Genelist2 Genelist4
TFAP2A Irak3, Tnfrsf11b, Prmt3, Galc, Mtap6, Sqrdl, Adam3, Frem2, Nsg1, Ch25h, Thbs1, Fas, Rbl2, 4932417H02Rik
Abcc1, Lace1, Mak, Nptxr, Plin, Ppp1r16b, Rgs11, Rnf130, Rpn1, Gdf1
Zfx Irak3, Prmt3, Mtap6, Sqrdl, Adam3, Nsg1, Fas, Rbl2, 4932417H02Rik
Abcc1, Lace1, Ppp1r16b, Rgs11, Rnf130, Gdf1
The distribution of the enriched TFs in the 5HT induced and suppressed gene sets
are shown in Figure 9. The frequency ratio of the enriched TFs in the corresponding

59
genelists was calculated from the number of genes in the genelist in which the TF is
enriched and total number of genes.
Figure 9: MotifScanner results of enriched TFs in 5HT responsive genes
The distribution of the enriched TFs in both the 5-HT induced and suppressed gene lists is shown. The TFs enriched in 5-HT responsive genelists and frequency ratio are plotted along X and Y-axis.
We identified that the transcription factor TFAP2A is enriched in both 5-HT
induced and suppressed gene lists. This might suggest the cardinal role of this TF in
regulation of 5HT responsive genes. Hence, we focused our attention to look at the
enrichment of TFAP2A TF in all the genelists and BG random sets. We used R to plot the
distribution of TFAP2A in the FG and in the1000 random sets generated for each
genelist. In general, the distribution of number of TFBS in random sequences follows
normal distribution. For a TF to be enriched in the sequence of interest, the number of
sites of TF in it should fall outside this random distribution. Figure 10 shows the
distribution of TFAP2A in FG of 5-HT induced genelists and BG.

60
Figure 10: Enrichment of TFAP2A in FG of 5-HT induced gene lists
MotifScanner results were used to plot this figure. The average number of TFAP2A sites in BG for genelist 1 and 3 (34 and 40) is shown in blue. The number of TFAP2A sites in genelists 1, and 3 (59 and 56) is shown in red.
The distribution of number of TFAP2A sites in the random sets (BG) and 5-HT
suppressed genelists is shown in the Figure 11. Thus, from the figures 10, and 11, it is
evident that the number of sites in 5-HT induced and suppressed genes falls outside the
distribution of random sets. This clearly suggests that the transcription factor, TFAP2A is
significantly enriched in 5-HT responsive genelists when compared to the BG sequences.
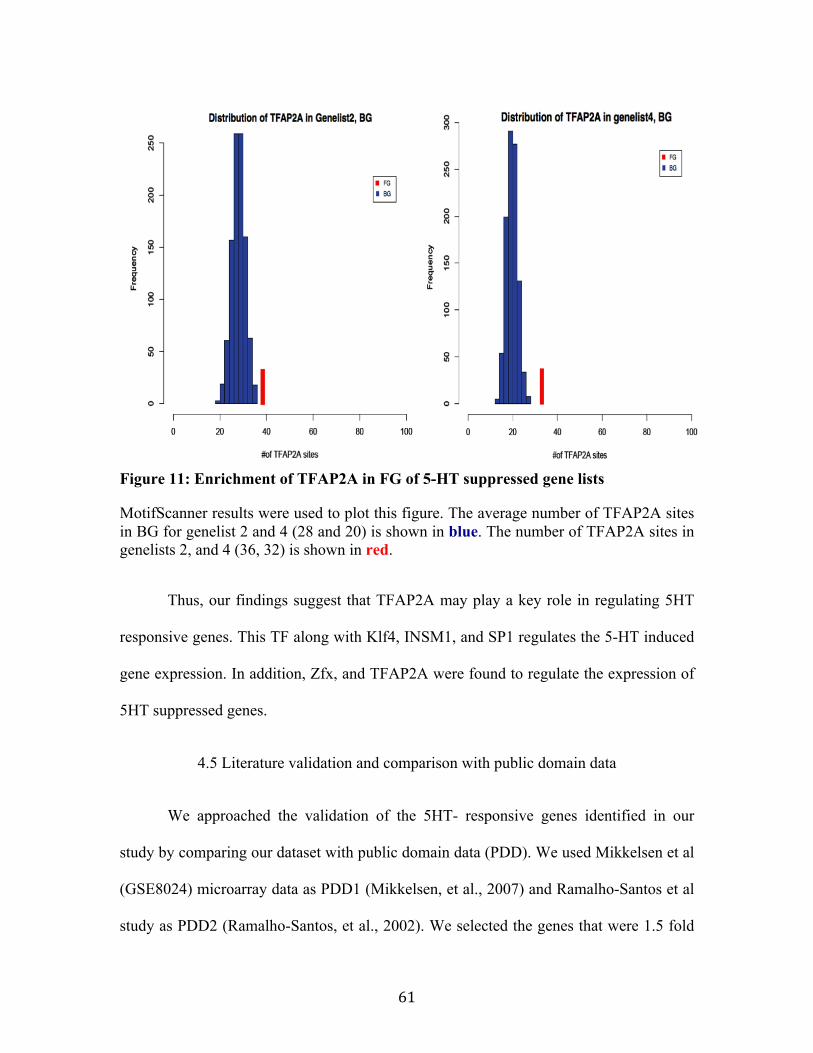
61
Figure 11: Enrichment of TFAP2A in FG of 5-HT suppressed gene lists
MotifScanner results were used to plot this figure. The average number of TFAP2A sites in BG for genelist 2 and 4 (28 and 20) is shown in blue. The number of TFAP2A sites in genelists 2, and 4 (36, 32) is shown in red.
Thus, our findings suggest that TFAP2A may play a key role in regulating 5HT
responsive genes. This TF along with Klf4, INSM1, and SP1 regulates the 5-HT induced
gene expression. In addition, Zfx, and TFAP2A were found to regulate the expression of
5HT suppressed genes.
4.5 Literature validation and comparison with public domain data
We approached the validation of the 5HT- responsive genes identified in our
study by comparing our dataset with public domain data (PDD). We used Mikkelsen et al
(GSE8024) microarray data as PDD1 (Mikkelsen, et al., 2007) and Ramalho-Santos et al
study as PDD2 (Ramalho-Santos, et al., 2002). We selected the genes that were 1.5 fold

62
up-regulated and down regulated in PDD1 and compared with the genes that were 1.5
fold up and down regulated in the Genotypic analysis (p-value was not considered).
Based on the fold change analysis, we identified, 1307 and 476 genes that were 1.5 fold
up-regulated in our Genotypic analysis dataset and PDD1 respectively (figure 12a).
Figure 12: Comparison of 1.5 fold enriched genes in our dataset and Mikkelsen et al study
Venn diagram showing numbers of genes common to the Genotypic analysis and PDD1. The numbers next to the gene categories are the total number of genes that are 1.5 fold enriched in our dataset and PDD1. Part (a) shows the comparison of 1.5 fold up regulated genes and part (b) shows the comparison of 1.5 fold down regulated genes.
We also identified 703 and 631 genes that were 1.5 fold down-regulated in
Genotypic analysis and PDD1 respectively. Figure 12(b) shows that 25 genes are
common to both the lists. Thus, we found a potential list of 37 5HT-induced, 25 5HT-
suppressed genes common to our analysis and PDD1.
Ramalho-Santos et al reported 1676 genes that were enriched in ES cells. Hence,
we also compared our data with their results. Figure 13 shows the comparison between

63
the list of 1307 5HT-induced genes from the Genotypic analysis and 1676 genes in PDD2
dataset. A total of 85 genes from our dataset are reported to be enriched in ES cells by
Ramalho-Santos et al.
Figure 13: Comparison between 1.5 fold up regulated genes from our results and the Ramalho-Santos et al study
Venn diagram showing numbers of genes common to the Genotypic analysis and PDD2. The numbers next to the gene categories are the total number of genes that are 1.5 fold up regulated in the Genotypic analysis and PDD2.
We found 8 5-HT induced genes common between the Genotypic analysis
(without considering p-value), PDD1, and PDD2. The list of these genes is shown in
Table 11.
Figure 14: Venn diagram comparing the common genes across our Genotypic analysis, PDD1, and PDD2.

64
Venn diagram showing the numbers of genes common to all the three datasets. We compared the 37 genes from Figure 12 (a) and 85 genes from Figure 13. The highlighted section represents the common genes found in the comparison and are listed in table 11.
Table 11: List of genes common in our dataset, PDD1 and PDD2.
Gene Symbol Nanog Gria2 Ggta1
Serpine1 Sema3e Tcfcp2l1 Timp1 Spint1
Sperger et al compared the expression profiles of human ES cell lines, germ cell
tumor cell lines and tumor samples, somatic cell lines, and testicular tissue samples and
reported that five independent human ES cell lines clustered together with highly similar
expression profiles (Sperger, et al., 2003). They performed significance analysis of
microarrays (SAM analysis) between ES cell lines versus somatic cell lines and normal
testis expression data. They reported 1760 positively and 1028 negatively significant
genes. A total of 50% and 63% of genes in our 5-HT induced genes (genelist1, 3
respectively) and 52% and 50% of genes in our 5-HT suppressed genes (genelist2, 4
respectively) were identified to be among the 1760 positively and 1028 negatively
significant genes in their study.
4.6 Gene Ontology analysis
We performed gene ontology (GO) analysis on the 5-HT responsive genes using
GOFFA and GO-Proxy. The GO terms with higher granularity viz., deeper levels in the
GO hierarchy were selected to avoid redundancy in results. Among the 5-HT induced

65
genelists (1,3) the GO terms, namely regulation of translation in response to stress,
energy derivation by oxidation of organic compounds, and mitochondrial ATP synthesis
are enriched. These GO categories support the findings of the Basu et al study which
suggests that 5-HT is localized in mitochondria of ES cells (Basu, et al., 2008). Other GO
terms common between 5-HT induced genelists (1&3) include G- protein signaling
pathway, regulation of cytoskeleton organization, regulation of transcription, regulation
of dopamine secretion, and synaptic transmission. The genes from 5-HT suppressed
genelists (2&4) were enriched with the GO terms, namely apoptosis, and regulation of
transcription factor activity. The GO terms enriched in the 5-HT responsive genes are
shown in Table 12.
Table 12: Functional annotation of 5-HT responsive genes Genes Enriched GO terms
5-HT induced genes
Genelist1
Regulation of translation in response to stress, regulation of transcription and DNA-dependent, autonomic nervous system development, parasympathetic nervous system development, pre-ganglionic parasympathetic nervous system development, regulation G-protein signaling pathway, positive regulation of transcription.
Genelist3
Cellular response to oxidative stress, energy derivation by oxidation of organic compounds, regulation of dopamine secretion, regulation of cytoskeleton organization, positive regulation of transmission of nerve impulse, ATP synthesis coupled electron transport, G-protein coupled receptor protein signaling pathway.
5-HT suppressed genes
Genelist2
Apoptosis, induction of apoptosis via death domain receptors, negative regulation of innate immune response, binding of sperm to zona pellucida (cell adhesion), positive regulation of TF activity, negative regulation of cytokine mediated signaling pathway.
Genelist4 Apoptosis, Cellular protein metabolic process, proteolysis.

66
CHAPTER FIVE: DISCUSSION
Understanding the role of serotonin in ES cells is very interesting and important.
A lot of research carried out in the late 90’s suggested some roles for serotonin in ES
cells. Various studies on 5-HT report that the prime role of serotonin in regulating early
cleavage divisions, neurogenesis and development is in ES cells (Khozhai, et al., 1995).
However, these studies did not attempt to identify any global TF-TFBS interactions that
explains the transcriptional signatures responsible for the distinction of 5-HT induced and
suppressed genes. Hence, transcriptional regulation studies help in understanding the 5-
HT responsive genes that govern the special properties of stem cells and provide insight
to understand the ES cell biology.
This study aimed to explore the transcriptomic signatures of serotonin in ES cells.
We performed functional genomics study to identify the 5-HT responsive genes (induced,
suppressed) by using a stringent filtering strategy. We have identified 44 genes in 5-HT
induced genelists and 29 genes in 5-HT suppressed genelists. We employed pattern
search algorithms such as MEME and MotifScanner on these genes followed by
literature-based validation. Motif prediction analysis was performed using the upstream
sequences of these genes to identify the TFBS and their profile TFs. We found four TFs
viz., TFAP2A, Klf4, SP1, INSM1 regulating the expression of 5-HT induced genes and
two TFs viz., TFAP2A, Zfx regulating the expression of 5-HT suppressed genes.
Previous studies on the transcription factor TFAP2A reveal that it plays an
important role in differentiation of neural crest from stem cells (Barrallo-Gimeno, et al.,
2004). It was observed that in the absence of TFAP2A, the neural crest progenitors fail to

67
differentiate and die by apoptosis. This suggests that TFAP2A plays a critical role in
regulating the target genes mediated in ES cell differentiation.
Ramalho-Santos et al in their study compared the enrichment of genes in
hematopoietic SCs, ES cells, neural SCs. They reported 1787 genes that were enriched in
ES cells and 216 genes that were enriched across all the three SCs. The comparison
between these genes and our dataset showed 85 genes common with their 1787 genes.
Some of the genes from our final genelists (1-4) belonging to Bysl, Ccnd, DnaJ, Adam,
Slc, and Cdc gene families are reported to be enriched in all the three SCs and more
specifically in ES cells respectively.
Bysl, bystin like gene, commonly expressed in ES cells, NPC, and HSC cells is
essential for cell adhesion, embryo implantation and embryo survival (Adachi, et al.,
2007). Aoki et al in their study, reported that Bysl plays an important role in
differentiation of ES cells (Aoki, et al., 2006). Another study claimed that Ccnd2 is a D-
type cyclin, which is enriched in all the three SCs and is associated with cell
proliferation, and regulation of cell cycle. It is an important target in Wnt signaling and is
reported to be more involved in developmental process rather than cell proliferation
(Shin, et al., 2007). Similarly, Dnajc16 reported in our genelist1 and Adam3 listed in
genelist2, belong to the DnaJ family of co-chaperones and Adam family of genes are
found to be essential for placental development and sperm-egg adhesion respectively
(Glassey and Civetta, 2004; Hunter, et al., 1999).
Roma et al compared different studies reporting on gene expression profiling in
ES cells (Roma, et al., 2007). The comparison of results from Ramalho-Santos et al,

68
Fortune et al, and Ivanova et al revealed that there were 332 genes enriched in ES cells
that were common to three studies. The genes belonging to the family Cdc (Cdc23), Gdf
(Gdf1) Slc(Slc5a1), Eif(Eif2s1), Rnf(Rnf130,216) were found to be common between our
4 genelists and the 332 genes common in the above mentioned three studies.
Among the 44 genes in our 5-HT induced genelist, 14 genes were reported in
literature to be associated with ES cells (Cldn14, Zfyve26, Hoxb1, Slc38a5, Car4, Eif2s1,
Rbbp9, Dnajc16, Bysl, Ccnd2, Cdc23, Kdr, Ltbr, Slc5a1). It was also reported that the
gene Cldn14 from genelist1 might have an additional role in cell-cell adhesion and
embryonic development (Ben-Yosef, et al., 2003). Zfyve26 is suggested to play a role in
embryonic development (Hanein, et al., 2008) and Hoxb1 plays an important role in
specification of neural progenitor cells from ES cells (Gouti and Gavalas, 2008).
Furthermore, Slc38a5 gene belongs to the solute carrier family of genes that are reported
to be highly expressed in ES cells (Zeng, et al., 2004). Yap et al, in their study, observed
genes from our lists such as the ones from the cytochrome P450 family (Cyp4f14),
growth differentiation factor family (Gdf1), Car4, Kdr, and tumor necrosis factor receptor
family (Tnfrs11b) are being differentially expressed between ES cells and their
differentiating counterparts (Yap, et al., 2007).
Generally, cellular processes are regulated by the binding of TFs to the TFBS
resulting in activation/repression of their target genes. We have identified transcriptional
regulatory networks where, the transcription factors such as TFAP2A regulate the
expression of 5-HT induced (Creb3l1, Rbbp9, Rgs14, Rnd2, Ank3, Barx2, Cldn14,
Cyp4f14, Hoxb1, Slc38a5, Car4, Bysl, Ccnd2, Cdc23, Cxcl9, Ltbr, Ncor1, Ppp3r2,
Slc5a1, Tnfrsf11b, Ly6c1) and suppressed genes (Tnfrsf11b, Prmt3, Mtap6, Sqrdl,

69
Adam3, Ppp1r16b, Rnf130). GO functional annotation of these genes reveals that some
of them belong to transcriptional regulation which implies that, these genes regulate
expression of other genes and form a typical transcriptional regulatory network.
The GOFFA and GO-Proxy analysis of the genelists helped in comparing the
gene ontology of the genes across as well as within the 5-HT induced and 5-HT
suppressed genelists. The GO categories that were enriched in 5-HT induced genelists
include translation in response to stress (Creb3l1, Gtf2h4 and Eif2s1), and energy
derivation by oxidation. These categories support the observation that 5-HT is localized
in mitochondria of pre-implantation embryos (Basu, et al., 2008). Similarly, GO terms
namely, parasympathetic nervous system development and cranial nerve development,
suggest the role for 5-HT in the development of nervous system (or development of NPC
from ESCs). In addition, the regulation of dopamine secretion term enriched in 5-HT
induced genelists supports the Whitaker-Azmitia et al study that the early appearance of
serotonin ahead of other monoamines might be involved in the regulation and
development of other monoamines, in particular dopamine (Whitaker-Azmitia, 2001). In
5-HT suppressed genes, the enrichment of the apoptosis gene ontology term suggests that
5-HT is required for proper cell growth.
Few genes from the 5-HT suppressed lists namely Sqrl, Polk, Asb8, Ppp1r16b
and Fas were reported as negatively significant genes in the Sperger et al study (Sperger,
et al., 2003). Some of the 5-HT induced genes in ES cells viz., Cldn14, Cyp4f14, Hoxb1,
Slc38a5, Car4, Eif2s1, Rgs14, Rnd2, Dnajc16, Barx2, Ccnd2, Cdc23, Cxcl9, Gjb3,
Ly6c1, Olfr1312, Olfr606, Pcdhb17, Ppp3r2, Slc5a1, Tnfrsf11b were novel genes
identified in our study. However, few of the family members of these genes are reported

70
to be enriched in ES cells (Sperger, et al., 2003). One of the characteristic features of SCs
is their ability to continuously perpetuate thus forming new cells and maintaining
homeostasis. The biological process GO term ‘homeostasis’ that was enriched in the 5-
HT responsive genes is responsible for one of the characteristic features of SCs viz., the
ability to continuously perpetuate thus forming new cells.
One limitation of our study is that we identified very few number of genes in all
the four genelist because of the following reasons: the replicates in our microarray study
showed greater variability and we used stringent filtering such as one-way ANOVA,
volcano plots, 1.5 fold enrichment and p value less than 0.05. As a result, we might have
missed some of the false negatives. However, our analysis showed significant results that
are essential for understanding the role of serotonin in ES cells.

71
CHAPTER SIX: CONCLUSION
This study is useful in understanding transcriptional regulatory mechanisms of 5-
HT responsive genes in ES cells. By combining gene expression data with motif
prediction algorithms, literature validation and comparison with public domain data, we
have identified the gene specific to endogenous or exogenous 5-HT in ES cells and TFs
governing the expression of these genes. The methodology adopted in this study provided
strong basis for identifying regulatory components that facilitate expression of 5-HT
responsive genes in ES cells. With this in silico approach, we have identified 44 5-HT
induced and 29 5-HT suppressed genes. Furthermore, by comparing our dataset with
published expression profiles in ES cells, we observed a number of common 5-HT
responsive target genes showing differential expression in ES cells. Both de novo and ab
initio motif prediction analysis on these identified differentially expressed genes revealed
that 4 TFs such as TFAP2A, KLF4, INSM1, SP1 and 2 TFs such as TFAP2A, Zfx
regulate 5-HT induced and 5-HT suppressed genes respectively. Among these TFs,
TFAP2A play a key role in regulating the expression of 5-HT responsive genes.
Functional annotation of the 5-HT responsive genes shows the enrichment of gene
ontology term regulation of translation in response to stress. The enrichment of other
functional categories such as development of various parts of nervous system in 5-HT
induced target genes and cell adhesion, apoptosis in 5-HT suppressed genes addresses
that 5-HT plays a key role in ES cell differentiation. One of the limitations of our study is
that we identified very a few number of genes after differential gene selection because of
the stringent conditions and cut off values we implemented in our approach. Even though
we identified important regulators of 5-HT responsive genes, one useful future direction

72
would be gene set enrichment analysis, and pathway analysis to give more insights for
understanding biology behind role of 5-HT in ES cells. We also intend to perform
biological validation of some of the genes identified in our study such as Creb3l1, Gtf2h4
and Eif2s1 in our further study. Thus, our study implemented new combinatorial
approach for identifying gene regulatory mechanisms involved in 5-HT responsive genes
and its role in ES cells, which is the goal of this study.

73
REFERENCES Abnizova, I. and Gilks, W.R. (2006) Studying statistical properties of regulatory DNA sequences, and their use in predicting regulatory regions in the eukaryotic genomes, Brief Bioinform, 7, 48-‐54. Adachi, K., et al. (2007) Crucial role of Bysl in mammalian preimplantation development as an integral factor for 40S ribosome biogenesis, Mol Cell Biol, 27, 2202-‐2214. Aerts, S., et al. (2003) Toucan: deciphering the cis-‐regulatory logic of coregulated genes, Nucleic Acids Res, 31, 1753-‐1764. Aerts, S., et al. (2005) TOUCAN 2: the all-‐inclusive open source workbench for regulatory sequence analysis, Nucleic Acids Res, 33, W393-‐396. Allison, D.B., et al. (2006) Microarray data analysis: from disarray to consolidation and consensus, Nat Rev Genet, 7, 55-‐65. Anderson, D.J., Gage, F.H. and Weissman, I.L. (2001) Can stem cells cross lineage boundaries?, Nat Med, 7, 393-‐395. Antequera, F. and Bird, A. (1993) Number of CpG islands and genes in human and mouse, Proc Natl Acad Sci U S A, 90, 11995-‐11999. Aoki, R., et al. (2006) The Bysl gene product, bystin, is essential for survival of mouse embryos, FEBS Lett, 580, 6062-‐6068. Austin, S. and Dixon, R. (1992) The prokaryotic enhancer binding protein NTRC has an ATPase activity which is phosphorylation and DNA dependent, EMBO J, 11, 2219-‐2228. Bailey, T.L., et al. (2009) MEME SUITE: tools for motif discovery and searching, Nucleic Acids Res, 37, W202-‐208. Bailey, T.L. and Elkan, C. (1995) The value of prior knowledge in discovering motifs with MEME, Proc Int Conf Intell Syst Mol Biol, 3, 21-‐29. Bailey, T.L., et al. (2006) MEME: discovering and analyzing DNA and protein sequence motifs, Nucleic Acids Res, 34, W369-‐373. Baker, M.W., Vohra, M.M. and Croll, R.P. (1993) Serotonin depletors, 5,7-‐dihydroxytryptamine and p-‐chlorophenylalanine, cause sprouting in the CNS of the adult snail, Brain Res, 623, 311-‐315. Balaji, S., et al. (2008) Comparison of transcription regulatory interactions inferred from high-‐throughput methods: what do they reveal?, Trends Genet, 24, 319-‐323. Barrallo-‐Gimeno, A., et al. (2004) Neural crest survival and differentiation in zebrafish depends on mont blanc/tfap2a gene function, Development, 131, 1463-‐1477.

74
Basu, B., et al. (2008) Serotonin in pre-‐implantation mouse embryos is localized to the mitochondria and can modulate mitochondrial potential, Reproduction, 135, 657-‐669. Ben-‐Yosef, T., et al. (2003) Claudin 14 knockout mice, a model for autosomal recessive deafness DFNB29, are deaf due to cochlear hair cell degeneration, Hum Mol Genet, 12, 2049-‐2061. Birney, E., et al. (2007) Identification and analysis of functional elements in 1% of the human genome by the ENCODE pilot project, Nature, 447, 799-‐816. Bithell, A. and Williams, B.P. (2005) Neural stem cells and cell replacement therapy: making the right cells, Clin Sci (Lond), 108, 13-‐22. Blanchette, M., et al. (2006) Genome-‐wide computational prediction of transcriptional regulatory modules reveals new insights into human gene expression, Genome Res, 16, 656-‐668. Bogarad, L.D., et al. (1998) Interference with gene regulation in living sea urchin embryos: transcription factor knock out (TKO), a genetically controlled vector for blockade of specific transcription factors, Proc Natl Acad Sci U S A, 95, 14827-‐14832. Bolstad, B.M., et al. (2003) A comparison of normalization methods for high density oligonucleotide array data based on variance and bias, Bioinformatics, 19, 185-‐193. Brezun, J.M. and Daszuta, A. (1999) Depletion in serotonin decreases neurogenesis in the dentate gyrus and the subventricular zone of adult rats, Neuroscience, 89, 999-‐1002. Bryne, J.C., et al. (2008) JASPAR, the open access database of transcription factor-‐binding profiles: new content and tools in the 2008 update, Nucleic Acids Res, 36, D102-‐106. Budnik, V., Wu, C.F. and White, K. (1989) Altered branching of serotonin-‐containing neurons in Drosophila mutants unable to synthesize serotonin and dopamine, J Neurosci, 9, 2866-‐2877. Burden, H.W. and Lawrence, I.E., Jr. (1973) Presence of biogenic amines in early rat development, Am J Anat, 136, 251-‐257. Butte, A. (2002) The use and analysis of microarray data, Nat Rev Drug Discov, 1, 951-‐960. Buznikov, G.A., Lambert, H.W. and Lauder, J.M. (2001) Serotonin and serotonin-‐like substances as regulators of early embryogenesis and morphogenesis, Cell Tissue Res, 305, 177-‐186. Buznikov, G.A., Shmukler, Y.B. and Lauder, J.M. (1996) From oocyte to neuron: do neurotransmitters function in the same way throughout development?, Cell Mol Neurobiol, 16, 537-‐559. Cahan, P., et al. (2005) List of lists-‐annotated (LOLA): a database for annotation and comparison of published microarray gene lists, Gene, 360, 78-‐82.

75
Choudhuri, S. (2004) Gene regulation and molecular toxicology, Toxicol Mech Methods, 15, 1-‐23. Colter, D.C., Sekiya, I. and Prockop, D.J. (2001) Identification of a subpopulation of rapidly self-‐renewing and multipotential adult stem cells in colonies of human marrow stromal cells, Proc Natl Acad Sci U S A, 98, 7841-‐7845. Cox, E., et al. (2006) Regulation of FGF10 by POU transcription factor Brn3a in the developing trigeminal ganglion, J Neurobiol, 66, 1075-‐1083. Culhane, A.C., et al. (2010) GeneSigDB-‐-‐a curated database of gene expression signatures, Nucleic Acids Res, 38, D716-‐725. Dermitzakis, E.T. and Clark, A.G. (2002) Evolution of transcription factor binding sites in Mammalian gene regulatory regions: conservation and turnover, Mol Biol Evol, 19, 1114-‐1121. Fortunel, N.O., et al. (2003) Comment on " 'Stemness': transcriptional profiling of embryonic and adult stem cells" and "a stem cell molecular signature", Science, 302, 393; author reply 393. Fuchs, E. and Segre, J.A. (2000) Stem cells: a new lease on life, Cell, 100, 143-‐155. Fukumoto, T., Kema, I.P. and Levin, M. (2005) Serotonin signaling is a very early step in patterning of the left-‐right axis in chick and frog embryos, Curr Biol, 15, 794-‐803. Gautier, L., et al. (2004) affy-‐-‐analysis of Affymetrix GeneChip data at the probe level, Bioinformatics, 20, 307-‐315. Gentleman, R.C., et al. (2004) Bioconductor: open software development for computational biology and bioinformatics, Genome Biol, 5, R80. Glassey, B. and Civetta, A. (2004) Positive selection at reproductive ADAM genes with potential intercellular binding activity, Mol Biol Evol, 21, 851-‐859. Gouti, M. and Gavalas, A. (2008) Hoxb1 controls cell fate specification and proliferative capacity of neural stem and progenitor cells, Stem Cells, 26, 1985-‐1997. Gupta, M. and Liu, J.S. (2005) De novo cis-‐regulatory module elicitation for eukaryotic genomes, Proc Natl Acad Sci U S A, 102, 7079-‐7084. Hanein, S., et al. (2008) Identification of the SPG15 gene, encoding spastizin, as a frequent cause of complicated autosomal-‐recessive spastic paraplegia, including Kjellin syndrome, Am J Hum Genet, 82, 992-‐1002. Ho, J.W., et al. (2011) ChIP-‐chip versus ChIP-‐seq: Lessons for experimental design and data analysis, BMC Genomics, 12, 134. Hudson, M.E. and Snyder, M. (2006) High-‐throughput methods of regulatory element discovery, Biotechniques, 41, 673, 675, 677 passim. Hunter, P.J., et al. (1999) Mrj encodes a DnaJ-‐related co-‐chaperone that is essential for murine placental development, Development, 126, 1247-‐1258.

76
Il'kova, G., et al. (2004) Serotonin localization and its functional significance during mouse preimplantation embryo development, Zygote, 12, 205-‐213. Ivanova, N.B., et al. (2002) A stem cell molecular signature, Science, 298, 601-‐604. Jeffery, I.B., Higgins, D.G. and Culhane, A.C. (2006) Comparison and evaluation of methods for generating differentially expressed gene lists from microarray data, BMC Bioinformatics, 7, 359. Jiang, C., et al. (2007) TRED: a transcriptional regulatory element database, new entries and other development, Nucleic Acids Res, 35, D137-‐140. Johnson, D.S., et al. (2008) Systematic evaluation of variability in ChIP-‐chip experiments using predefined DNA targets, Genome Res, 18, 393-‐403. Kennea, N.L. and Mehmet, H. (2002) Neural stem cells, J Pathol, 197, 536-‐550. Kerr, M.K. and Churchill, G.A. (2007) Statistical design and the analysis of gene expression microarray data, Genet Res, 89, 509-‐514. Khozhai, L.I., Puchkov, V.F. and Otellin, V.A. (1995) [The effect of a serotonin deficiency on mammalian embryonic development], Ontogenez, 26, 350-‐355. Kinfield, M.U.S.a.A.C.H. (1999) Teaching Cell Divison: Basics & Recommendations, The American biology teacher, 61, 366-‐371. Kleckner, N. (1996) Meiosis: how could it work?, Proc Natl Acad Sci U S A, 93, 8167-‐8174. Lauder, J.M. (1990) Ontogeny of the serotonergic system in the rat: serotonin as a developmental signal, Ann N Y Acad Sci, 600, 297-‐313; discussion 314. Lauder, J.M. and Krebs, H. (1976) Effects of p-‐chlorophenylalanine on time of neuronal origin during embryogenesis in the rat, Brain Res, 107, 638-‐644. Lauder, J.M. and Krebs, H. (1978) Serotonin as a differentiation signal in early neurogenesis, Dev Neurosci, 1, 15-‐30. Lauder, J.M., Wallace, J.A. and Krebs, H. (1981) Roles for serotonin in neuroembryogenesis, Adv Exp Med Biol, 133, 477-‐506. Lauria, M. and Rossi, V. (2011) Epigenetic control of gene regulation in plants, Biochim Biophys Acta. Lee, S.H., et al. (2000) Efficient generation of midbrain and hindbrain neurons from mouse embryonic stem cells, Nat Biotechnol, 18, 675-‐679. Lieb, J.D. (2003) Genome-‐wide mapping of protein-‐DNA interactions by chromatin immunoprecipitation and DNA microarray hybridization, Methods Mol Biol, 224, 99-‐109. Lois, C. and Alvarez-‐Buylla, A. (1993) Proliferating subventricular zone cells in the adult mammalian forebrain can differentiate into neurons and glia, Proc Natl Acad Sci U S A, 90, 2074-‐2077.

77
Luco, R.F., et al. (2011) Epigenetics in alternative pre-‐mRNA splicing, Cell, 144, 16-‐26. Mahony, S., Auron, P.E. and Benos, P.V. (2007) DNA familial binding profiles made easy: comparison of various motif alignment and clustering strategies, PLoS Comput Biol, 3, e61. Mahony, S. and Benos, P.V. (2007) STAMP: a web tool for exploring DNA-‐binding motif similarities, Nucleic Acids Res, 35, W253-‐258. Mahony, S., et al. (2005) Improved detection of DNA motifs using a self-‐organized clustering of familial binding profiles, Bioinformatics, 21 Suppl 1, i283-‐291. Martin, D., et al. (2004) GOToolBox: functional analysis of gene datasets based on Gene Ontology, Genome Biol, 5, R101. Matys, V., et al. (2003) TRANSFAC: transcriptional regulation, from patterns to profiles, Nucleic Acids Res, 31, 374-‐378. Matys, V., et al. (2006) TRANSFAC and its module TRANSCompel: transcriptional gene regulation in eukaryotes, Nucleic Acids Res, 34, D108-‐110. Mazzarello, P. (1999) A unifying concept: the history of cell theory, Nat Cell Biol, 1, E13-‐15. Mikkelsen, T.S., et al. (2007) Genome-‐wide maps of chromatin state in pluripotent and lineage-‐committed cells, Nature, 448, 553-‐560. Mitalipov, S. and Wolf, D. (2009) Totipotency, pluripotency and nuclear reprogramming, Adv Biochem Eng Biotechnol, 114, 185-‐199. Morozova, O. and Marra, M.A. (2008) Applications of next-‐generation sequencing technologies in functional genomics, Genomics, 92, 255-‐264. Narlikar, L. and Ovcharenko, I. (2009) Identifying regulatory elements in eukaryotic genomes, Brief Funct Genomic Proteomic, 8, 215-‐230. Noonan, J.P. and McCallion, A.S. (2010) Genomics of long-‐range regulatory elements, Annu Rev Genomics Hum Genet, 11, 1-‐23. Pera, M.F. and Trounson, A.O. (2004) Human embryonic stem cells: prospects for development, Development, 131, 5515-‐5525. Pines, J. and Rieder, C.L. (2001) Re-‐staging mitosis: a contemporary view of mitotic progression, Nat Cell Biol, 3, E3-‐6. Portales-‐Casamar, E., et al. (2010) JASPAR 2010: the greatly expanded open-‐access database of transcription factor binding profiles, Nucleic Acids Res, 38, D105-‐110. Price, J. and Williams, B.P. (2001) Neural stem cells, Curr Opin Neurobiol, 11, 564-‐567. Ramalho-‐Santos, M., et al. (2002) "Stemness": transcriptional profiling of embryonic and adult stem cells, Science, 298, 597-‐600.

78
Roma, G., et al. (2007) A novel view of the transcriptome revealed from gene trapping in mouse embryonic stem cells, Genome Res, 17, 1051-‐1060. Sandelin, A., et al. (2004) JASPAR: an open-‐access database for eukaryotic transcription factor binding profiles, Nucleic Acids Res, 32, D91-‐94. Schena, M., et al. (1995) Quantitative monitoring of gene expression patterns with a complementary DNA microarray, Science, 270, 467-‐470. Schulze, A. and Downward, J. (2001) Navigating gene expression using microarrays-‐-‐a technology review, Nat Cell Biol, 3, E190-‐195. Shin, S., et al. (2007) Whole genome analysis of human neural stem cells derived from embryonic stem cells and stem and progenitor cells isolated from fetal tissue, Stem Cells, 25, 1298-‐1306. Silva-‐Rocha, R. and de Lorenzo, V. (2008) Mining logic gates in prokaryotic transcriptional regulation networks, FEBS Lett, 582, 1237-‐1244. Silva-‐Rocha, R. and de Lorenzo, V. (2010) Noise and robustness in prokaryotic regulatory networks, Annu Rev Microbiol, 64, 257-‐275. Smit AFA, Hubley R, Green P: RepeatMasker Open-‐3.0. 1996-‐2010. [http:// repeatmasker.org]. Sperger, J.M., et al. (2003) Gene expression patterns in human embryonic stem cells and human pluripotent germ cell tumors, Proc Natl Acad Sci U S A, 100, 13350-‐13355. Stein, L.D. (2008) Towards a cyberinfrastructure for the biological sciences: progress, visions and challenges, Nat Rev Genet, 9, 678-‐688. Stitzel, M.L. and Seydoux, G. (2007) Regulation of the oocyte-‐to-‐zygote transition, Science, 316, 407-‐408. Subramanian, A., et al. (2005) Gene set enrichment analysis: a knowledge-‐based approach for interpreting genome-‐wide expression profiles, Proc Natl Acad Sci U S A, 102, 15545-‐15550. Suda, Y., et al. (1987) Mouse embryonic stem cells exhibit indefinite proliferative potential, J Cell Physiol, 133, 197-‐201. Sun, H., et al. (2006) GOFFA: gene ontology for functional analysis-‐-‐a FDA gene ontology tool for analysis of genomic and proteomic data, BMC Bioinformatics, 7 Suppl 2, S23. Sylvester, K.G. and Longaker, M.T. (2004) Stem cells: review and update, Arch Surg, 139, 93-‐99. Team., R.D.C. (2007) R: A language and environment for statistical computing, R Foundation for Statistical Computing. Thomas-‐Chollier, M., et al. (2008) RSAT: regulatory sequence analysis tools, Nucleic Acids Res, 36, W119-‐127.

79
Tuoc, T.C., et al. (2009) Selective cortical layering abnormalities and behavioral deficits in cortex-‐specific Pax6 knock-‐out mice, J Neurosci, 29, 8335-‐8349. Valouev, A., et al. (2008) Genome-‐wide analysis of transcription factor binding sites based on ChIP-‐Seq data, Nat Methods, 5, 829-‐834. Vlieghe, D., et al. (2006) A new generation of JASPAR, the open-‐access repository for transcription factor binding site profiles, Nucleic Acids Res, 34, D95-‐97. Walther, D.J. and Bader, M. (1999) Serotonin synthesis in murine embryonic stem cells, Brain Res Mol Brain Res, 68, 55-‐63. Weake, V.M. and Workman, J.L. (2010) Inducible gene expression: diverse regulatory mechanisms, Nat Rev Genet, 11, 426-‐437. Weiss, D.S. (2004) Bacterial cell division and the septal ring, Mol Microbiol, 54, 588-‐597. Weissman, I.L. (2000) Stem cells: units of development, units of regeneration, and units in evolution, Cell, 100, 157-‐168. Weissman, I.L., Anderson, D.J. and Gage, F. (2001) Stem and progenitor cells: origins, phenotypes, lineage commitments, and transdifferentiations, Annu Rev Cell Dev Biol, 17, 387-‐403. Whitaker-‐Azmitia, P.M. (2001) Serotonin and brain development: role in human developmental diseases, Brain Res Bull, 56, 479-‐485. Wobus, A.M. and Boheler, K.R. (2005) Embryonic stem cells: prospects for developmental biology and cell therapy, Physiol Rev, 85, 635-‐678. Wold, B. and Myers, R.M. (2008) Sequence census methods for functional genomics, Nat Methods, 5, 19-‐21. Wray, G.A., et al. (2003) The evolution of transcriptional regulation in eukaryotes, Mol Biol Evol, 20, 1377-‐1419. Yang, Y.H., et al. (2002) Normalization for cDNA microarray data: a robust composite method addressing single and multiple slide systematic variation, Nucleic Acids Res, 30, e15. Yap, D.Y., et al. (2007) Using biomarker signature patterns for an mRNA molecular diagnostic of mouse embryonic stem cell differentiation state, BMC Genomics, 8, 210. Zeng, X., et al. (2004) Properties of pluripotent human embryonic stem cells BG01 and BG02, Stem Cells, 22, 292-‐312. Zhao, F., et al. (2005) TRED: a Transcriptional Regulatory Element Database and a platform for in silico gene regulation studies, Nucleic Acids Res, 33, D103-‐107. Zhou, D. and Yang, R. (2006) Global analysis of gene transcription regulation in prokaryotes, Cell Mol Life Sci, 63, 2260-‐2290.

80
ANUSHA NAGARI ♦ 4048 Willow Bend Dr, Apt D, Beech Grove - 46107 ♦Ph: 812-371-1214 ♦
CAREER PROFILE A growth-‐oriented, hard working, motivated and organized professional in bioinformatics with 2 years research experience in gene regulation and strong background in programming and biology Job Skills:
• Adroit at different Bioinformatics tools usage, PERL scripting, network visualization softwares, R and Bioconductor
• Proficient in high-‐throughput data analysis and next generation sequencing analysis including ChIP-‐chip data, and ChIP-‐seq data
• Sound knowledge in various domains of Biology like, Genetics, Cell and Molecular biology, Microbiology
• Analytical thinking, decision making and problem solving skills • Excellent communication and interpersonal skills with the ability to quickly learn
new technologies
EDUCATION Master of Science, Bio-Informatics June 2011
Indiana University Purdue University Indianapolis, IN Current GPA: 3.92
Bachelor of Engineering, Biotechnology June 2009 Vinayaka Missions University, India GPA: 3.9
TECHNICAL SKILL SET Transcription Factor Binding Site prediction tools: MEME, Weeder, RSAT, TOUCAN, Patser Microarray analysis: MeV, SAM, Array track, GSEA, Bioconductor, dChip ChIP-seq analysis: MACS, Cis-genome Languages: Perl, BioPerl, R, Python, C++ Databases: PL/SQL, SQL, Oracle Aqua Data Studio, Oracle SQL Developer Platforms: UNIX, Oracle, MS-DOS, Macintosh, Windows XP/vista/2000
Statistical packages: R, SPSS, Bioconductor Visualization tools: Cytoscape, MetaCore, Integrated Genome Browser, STAMP Other Bioinformatics tools: Haploview, ID conversion tools like, David, bioDBnet, Array
track, Conservation analysis tools like UCSC Genome browser, ECR browser; Gene-ontology tools like GOstat, GOmapper, WebGestalt, Weka, Eclipse

81
HONORS • Recipient of ‘University Dean’s award at IUPUI’ for the years 2009-2011 • University Rank holder, Vinayaka Missions University, 2009 • Received ‘Certificate of Appreciation’ from VMKV Engineering College for academic
excellence in 2006-2007 • Honored with ‘Academic Excellence Award’ at VMKV Engineering College for
academic excellence, 2005-06 • Selected for ‘PRATHIBHA’ award (prestigious award given by the Government of
Andhra Pradesh) for academic excellence in Intermediate Education (secured 96%) in the year 2005
• Received Gold medal for paper presentation on Biomedicines and Uses in National Children’s Science Congress, conducted by Government of Andhra Pradesh at Chennai, Dec 1998
ACTIVITIES • Poster presentation on “Co-‐localization of Stat4-‐mediated epigenetic and
transcriptional regulatory elements controlling Th1 genes” for 14th International Congress Of Immunology, Kobe, Japan 2010
• Received first prize in paper presentation on “ Recent innovations in Biotechnology” conducted at VMKV Engineering College, 2008-‐09
• Poster presentation on “Degradation of Polyamide-‐6 by Lignolytic Fungi -‐ Bjerkandera Adusta” at Arunai Engineering college, Tamilnadu, India