Cell, Volume 138 · Cell, Volume 138 Supplemental Data ... Alessio Zippo, Riccardo Serafini, Marina...
24
1 Cell, Volume 138 Supplemental Data Histone Crosstalk between H3S10ph and H4K16ac Generates a Histone Code that Mediates Transcription Elongation Alessio Zippo, Riccardo Serafini, Marina Rocchigiani, Susanna Pennacchini, Anna Krepelova, and Salvatore Oliviero SUPPLEMENTAL EXPERIMENTAL PROCEDURES DNA constructs cDNA corresponding the human MOF and BRD4 were cloned into a Flag-containing pcDNA5/FRT/TO (Invitrogen) vector, which drives the expression of the cloned cDNA under the control of the CMV/TetO2 tetracycline inducible promoter. The vector coding for Xenopus leavis histones (kindly provided by Dr. R. Mantovani, Milan, Italy) were expressed and purified as previously described (Caretti et al., 1999). H3-YFP and H4-YFP cDNA constructs were kindly provided by Dr. M. Bianchi (Milan, Italy). Human BRD4 cDNA construct was kindly provided by Dr. J. You (Harvard Medical School, Boston) (depositated in Addgene as p14441) and human BRD2 cDNA was a generous gift of Dr. G. LeRoy (Department of Molecular Biology, Princeton University). BRD4 deletion mutants were generated as previously described (Maruyama et al., 2002). 14-3-3 ε and ζ shRNA constructs were purchased by Santacruz Biotechnology (sc-29588-SH and sc-29583-SH); MOF shRNA constructs were obtained by Open Biosystem (TRCN0000034874); PIM1 shRNA constructs were previously described (Zippo et al., 2007).
Transcript of Cell, Volume 138 · Cell, Volume 138 Supplemental Data ... Alessio Zippo, Riccardo Serafini, Marina...

1
Cell, Volume 138
Supplemental Data
Histone Crosstalk between H3S10ph
and H4K16ac Generates a Histone Code
that Mediates Transcription Elongation Alessio Zippo, Riccardo Serafini, Marina Rocchigiani, Susanna Pennacchini, Anna Krepelova,
and Salvatore Oliviero
SUPPLEMENTAL EXPERIMENTAL PROCEDURES
DNA constructs
cDNA corresponding the human MOF and BRD4 were cloned into a Flag-containing
pcDNA5/FRT/TO (Invitrogen) vector, which drives the expression of the cloned cDNA under the
control of the CMV/TetO2 tetracycline inducible promoter. The vector coding for Xenopus leavis
histones (kindly provided by Dr. R. Mantovani, Milan, Italy) were expressed and purified as
previously described (Caretti et al., 1999). H3-YFP and H4-YFP cDNA constructs were kindly
provided by Dr. M. Bianchi (Milan, Italy). Human BRD4 cDNA construct was kindly provided
by Dr. J. You (Harvard Medical School, Boston) (depositated in Addgene as p14441) and human
BRD2 cDNA was a generous gift of Dr. G. LeRoy (Department of Molecular Biology, Princeton
University). BRD4 deletion mutants were generated as previously described (Maruyama et al.,
2002).
14-3-3 ε and ζ shRNA constructs were purchased by Santacruz Biotechnology (sc-29588-SH and
sc-29583-SH); MOF shRNA constructs were obtained by Open Biosystem (TRCN0000034874);
PIM1 shRNA constructs were previously described (Zippo et al., 2007).

2
The recombinant GST-PIM1 construct was obtained by cloning the PIM1 WT and PIM1-K67M
cDNA into the bacterial expression vector pGEX-4T and the fused protein was expressed and
purified using the standard protocol.
For FRET and FRAP assay, recombinant human histones H3 and H4 were cloned in pEYFP-C1
(Clontech) vector, positioning the fluorescence tags at N terminal. BRD4 and BRD2 were cloned
into a CFP-containing pcDNA5/FRT (Invitrogen) vector. Mutagenesis (H3S10A, H3K9G,
H4K16G, H4K12G) was performed by using Quick change site-directed mutagenesis kit
(Stratagene).
Cell culture condition
To perform time course experiments 293 cells were synchronized and then treated with 50%
serum shock as described (Balsalobre et al., 1998). NIH3T3 fibroblast were transfected and then
starved for 48 hours with 1% fetal bovine serum, and induced with 10% of FBS for 2 hours.
Nucleosome core particles (NCPs) reconstitution and Protein iinteraction and assays
Nucleosome core particles (NCPs) reconstitution: recombinant histones either expressed and
purified in the lab or purchased (Upstate) were mixed in an equimolar ratio and dialysed
overnight at 4oC against the folding buffer (20mM TrisHCl pH 7.5, 1mM EDTA, 5mM β-
mercaptoethanol, 2M NaCl). The day after, histones were mixed in different W/W ratios (raging
from 0.7:1 to 1.3:1) with a 270bp biotinylated PCR amplified DNA fragment in the folding buffer
containing 100 µg/ml BSA. The nucleosome reconstitution was performed by successive dialysis
against decreasing salt concentration buffers. The reconstituted NCPs were analyzed by EMSA

3
on a 4.5% non-denaturing acrylamide-bisacrylamide (29:1) gel. Finally the NCPs were purified
from free DNA on 5%-30% sucrose gradient and dialysed against TE buffer. Nucleosome
mapping on chromatin and on NCPs was performed by LM-PCR essentially as described by
(Fragoso et al., 1995).
Protein interaction assay: 1mg of protein extracts (derived from chromatin fractions) were
incubated with nucleosome core particles that were previously bound to steptavidin magnetic
beads. To allow specific interactions, proteins were incubated in Interaction buffer (20mM Hepes
pH 7.9, 100mM KCl, 5mM DTT, 0,1mM EGTA, Glycerol 20%, 2mM MnCl, inhibitor protease
cocktail and inhibitor mix) for 2 hours at 4°C in presence or absence of 0.1mM acetyl-CoA and
0.1μM ATP. Unbound proteins were eliminated by 3 washes with the same buffer. Interacting
proteins were eluted by incubating with 0.4M NaCl TE buffer while biotin-bound NCPs were
eluted by boiling the samples.
FRET acceptor photobleaching
A 40mW argon laser line of 458 nm was used to excite CFP-fusion proteins (PMT window 465 -
510) and a line of 514 nm was used to excite YFP-fusion proteins (PMT window 555 - 630).
Selective excitation of the donor was achieved through CFP and YFP filters without crosstalk
between donor and acceptor. Acquisition parameters also include image size of 512 x 512 pixels,
400Hz line scanning-rate, zoom 8x.
In the photobleaching procedure, cells were bleached using a 514 nm laser beam at 100%
intensity until the acceptor is photobleached down to ~10% of its initial value. The bleach time
ranged from 2-5 s. We selected the entire nuclei as region of interest (ROI) such that all acceptor
fluorescence was destroyed after bleaching. The FRET efficiency (%) in single cells was

4
calculated by normalizing the difference of the donor (D) post- and pre-bleach intensity by the
post-bleach intensity according to the equation:
Dpost – Dpre
FRETeff = for all Dpost > Dpre
Dpost
Data were collected from at least three independent experiments.
Nuclear run-on
Nuclear run-on assays were performed as previously described (Greenberg and Bender, 2007).
PCR-amplified DNA fragments spanning the FOSL1 gene were purified with a QiaQuick PCR
purification kit (Qiagen) and dot blotted to Hybond-XL positively charged nylon membranes (GE
Healthcare) at 2 µg of DNA per dot. The radio-labelled RNAs were obtained from nuclei isolated
from 293 cells expressing either a control shRNA or PIM1 shRNA by performing in vitro run-on
transcription. Labeled samples were hybridized for 36 hours at 65C° in TES/NaCl solution. The
membranes were washed twice with 2X SSC buffer and exposed to X-ray films. The signal
intensity was measured by densitometry and the median of three independent experiments was
represented.
Chromosome conformation capture (3C) assay
5
3C assay was performed essentially as previously described (Dekker et al., 2002). Nuclei were
isolated from 2% formaldeide-crosslinked cells and then digested overnight with a combination
of BglI and PstI restriction enzymes (400U respectively). Intramolecular ligation was favoured by
diluting the samples 15 times with 1X standard ligation buffer and incubating for 4 hours at 16°C
in presence of T4 DNA Ligase (100U). DNA Crosslinking was reversed and samples purified by
phenol-chloroform extraction. The crosslinking frequency was quantified as described (Dekker et
al., 2002).
Antibodies
The antibodies used in this work are purchased by Santa Cruz Biotechnology (anti-PIM1 sc-7856
for ChIP and experiments; anti-PIM1 sc-13513 for Western blot analysis; anti-MYC sc-764 for
ChIP experiments and anti-MYC sc-40 for Western blot analysis; anti-MAX sc-197 and sc-765;
anti-SP1 sc-59; anti-Pol II sc-899; anti-14-3-3ε sc-1020 for ChIP experiments and sc-23957 for
Western blot analysis; anti-14-3-3ζ sc-1019; anti-CDK9 sc-8338; anti-BRD4 sc-48772; anti-
HBO1 sc-25379; anti-Tip60 sc-5725), by Covance anti Pol II Ser2 H5, by Upstate (anti-histone
H3 06-755; anti-acetyl histone H3 06-599; anti-phospho (Ser10)-histone H3 05-817; anti-acetyl
histone H4 Lys16 06-762; anti-acetyl histone H4 Lys12 07-595; anti-acetyl histone H4 Lys8 07-
328; anti-acetyl histone H4 Lys507-327; anti-acetyl histone H4 06-598; anti-trimethyl-histone H3
Lys4 07-473), by Abcam (anti-histone H4 ab7311; anti-acetyl histone H3 Lys9 ab10812; anti-
acetyl histone H3 Lys14 ab52946 anti-phospho (Ser10)-acetyl (Lys9)-histone H3 Ab 12181-50)
and by Bethyl laboratories anti-MOF A300-994A.

6
Probe 1 frw GCTTCGTGGAGTGAGGTCTTTCCACT Probe 1 rev GTGACGCGCGCCTGTAGTCCCA Probe 2 frw CACCATGTATGGGCAGCTACGTCAGG Probe 2 rev CACGGCTGCTGGGTTCTGACTCACC Probe 3 frw GCCCCAGGGCCCGGATGACTCC Probe 3 rev GGTGAGTCAGAACCCAGCAGCCGTG Probe 4 frw GTGATGAGCTGATCTGCGGATCTCAGC Probe 4 rev CAAAGAATTTGTCCAAGGTCATGCAGTGAG GAPDH1 frw GTCTACGAGCCTTGCGGGCTCCG
Run-on
GAPDH2 rev GCGTCCCCCACCTAGGGGTCCG Promoter frw TGTATGGGCAGCTACGTCAGG Promoter rev GCCTCCCCAAGTCCG Enhancer frw GGTGCCCATTTCCTGTCG Enhancer rev GACTCGGCGGAACG Coding frw CATTGCAGTGGTTCCG Coding rev CCCTCCTAAGCCTGTGCTCTC TSS frw GTGGTTCAGCCCGAGAACTT TSS rev AGTCTCGGAACATGCCCG 1kb frw CTGTCGAGGGGCTGCG 1kb rev CCGTGACTCGGCGGAAC 3kb frw AACAGTTCCTGGCAGTTTGTGC 3kb rev GTGGCTTTGGGGCAGGTC 4kb frw GAGCAAGGATGGAGGCG 4kb rev TGCATGTCAGCAGGTGGAGA 5kb frw GGTCTCCAGGTAGGGCTGTG 5kb rev CAGGCCAGATGAGAGAGACCA 6kb frw GGAGGGTTAGGGTTTGCG 6kb rev CTGAGGCGCTGTCTGCTTTG 7kb frw AATCCCGGAAGGAGCCAAGG 7kb rev GGAGATACAAGGTACAGGGCG 8kb frw CTGTGATGAGCTGATCTGCG
ChIP
8kb rev GAGGCTTGGATTCCCTGGAG FOSL1 frw CGGAGACTGACAAACTGG FOSL1 rev CTCAGGTTCAAGCACAGG GAPDH3 frw GAAGGTGAAGGTCGGAGTC
qRT-PCR
GAPDH4 rev GAAGATGGTGATGGGATTTC Table S1. Oligonucleotides used for Run-on, ChIP, and qRT-PCR.

7
F1 AGCCGGACTTGGGGAGGCG R2 CCTGTCGACAGCTGCTCGCAG R3 CTCGCCTCACTGCAACCTCCAC R4 GTGGGGGGCTGTACTGAGGGT R5 AGGGGGAGTCACCACAGC R6 TGCGGTGGGCTTCCAGCACC R7 GAAGGCACTGCTTCCTCCACGC F2 GGCAATCTGGACTTCCTGGCTC R1 GACTCACCCGCGCCGTGCG F3 AGCCGGGTGTGGTGGCAG R8 GCTCCGGACTCCGGGCAG F4 GGCTCGCGCCCTCCTGC
3C assay
R9 GCCCAGGCTCGTGGAAGTTCAG Table S2. Oligonucleotides used for Chromosome Conformational capture assay.

8
SUPPLEMENTAL REFERENCES
Balsalobre, A., Damiola, F., and Schibler, U. (1998). A serum shock induces circadian gene
expression in mammalian tissue culture cells. Cell 93, 929-937.
Caretti, G., Motta, M. C., and Mantovani, R. (1999). NF-Y associates with H3-H4 tetramers and
octamers by multiple mechanisms. Mol Cell Biol 19, 8591-8603.
Dekker, J., Rippe, K., Dekker, M., and Kleckner, N. (2002). Capturing chromosome
conformation. Science 295, 1306-1311.
Fragoso, G., John, S., Roberts, M. S., and Hager, G. L. (1995). Nucleosome positioning on the MMTV
LTR results from the frequency-biased occupancy of multiple frames. Genes Dev 9, 1933-1947.
Greenberg, M. E., and Bender, T. P. (2007). Identification of newly transcribed RNA. Curr Protoc
Mol Biol Chapter 4, Unit 4 10.
Maruyama, T., Farina, A., Dey, A., Cheong, J., Bermudez, V. P., Tamura, T., Sciortino, S.,
Shuman, J., Hurwitz, J., and Ozato, K. (2002). A Mammalian bromodomain protein, brd4,
interacts with replication factor C and inhibits progression to S phase. Mol Cell Biol 22, 6509-
6520.
Zippo, A., De Robertis, A., Serafini, R., and Oliviero, S. (2007). PIM1-dependent
phosphorylation of histone H3 at serine 10 is required for MYC-dependent transcriptional
activation and oncogenic transformation. Nat Cell Biol 9, 932-944.

9

10
Figure S1. Function of H3S10ph at the FOSL1 enhancer
YFP-H3 or YFP-H3 S10A mutant proteins were expressed at low level in 293 cells (A-J) and
incorporated into nucleosomes. Mononucleosomes containing H3-YFP proteins were enriched by
chromatin immunoprecipitation using antibody against GFP ensuring that the immunoprecipitated
nucleosomes contain at least one H3 mutant (A-J). The protein expression level was measured as
in panel (A). The enriched samples (input material) were used for Re-ChIP experiments by using
antibodies recognizing BRD4 (A), CDK9 (B), RNA Polymerase II (C), RNA Polymerase II
phosphorylated on CTD at serine 2 (D), H3 (E), H3S10ph (F), H4K16ac (G), H4K12ac (H), MOF
(I), 14-3-3 (K). Error bars represent the relative standard deviations of ChIP data.
(J) The efficiency of the different antibodies was calculated from the data obtained by
immunoprecipitating with the same antibody in the first and second IP. Using these values, the
data obtained from the Re-ChIP experiments were normalized to 100% of Re-ChIP efficiency in
panels A-K and represented as % of YFP-chromatin sample.
11

12
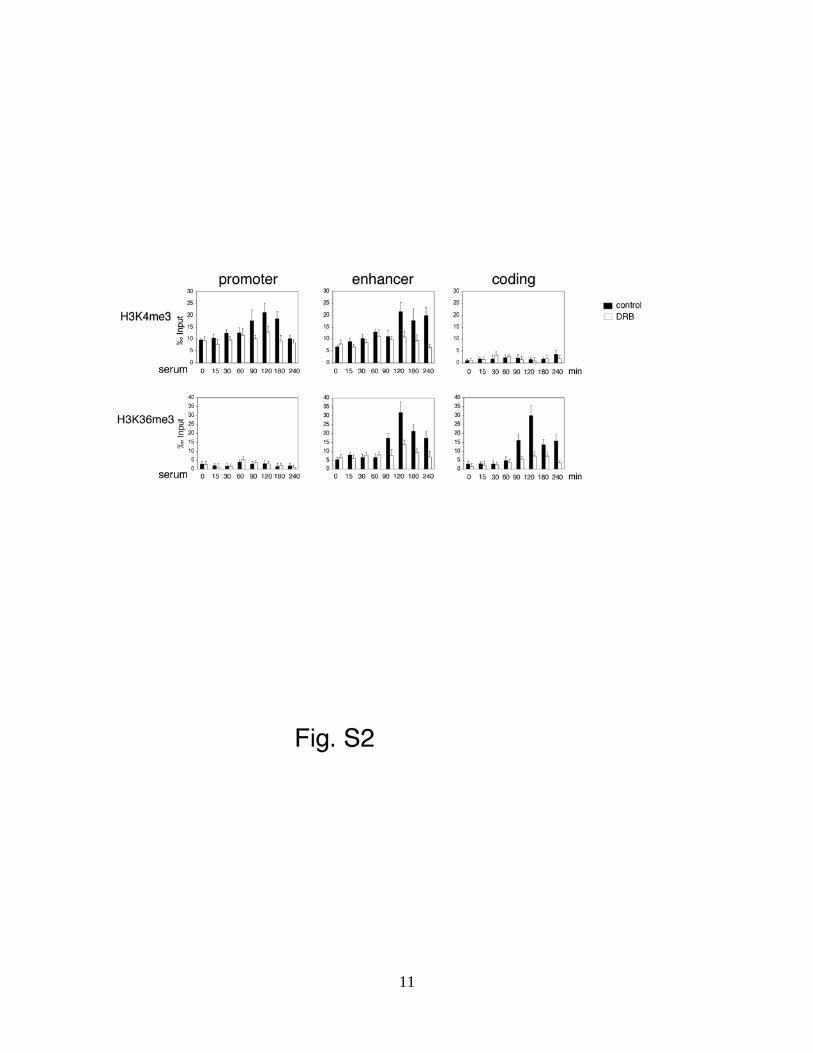
Figure S2. Cross talk between H3S10ph and H3 methylation
Time course analyses by ChIP assays were performed by using antibodies recognizing H3K4me3
or H3K36me3 as specified from 293 cells pre-treated with either DMSO (control) or with DRB
(25ng/ml) for 10 minutes. A representative experiment is shown. The data represent triplicate
real-time quantitative PCR measurements of the immunoprecipitated DNA and are expressed as
1/1000 (‰) of the DNA inputs. Error bars represent the relative standard deviations of ChIP data.

13

14
Figure S3. PIM1, 14-3-3 and MOF knockdown
(A) Chromatin proteins were extracted from 293 cells expressing either a control scramble
shRNA control or PIM1 shRNA. The protein expression level was measured by immunostaining
(IB) analysis by using the indicated antibodies.
(B) Chromatin proteins were extracted from 293 cells expressing either scramble control or 14-3-
3ε and 14-3-3ζ shRNAs.
(C) Chromatin proteins were extracted from 293 cells expressing either scramble control or MOF
shRNA.
(D) ChIP analysis was performed by using antibodies recognizing RNA polymerase II from 293
cells expressing either a scrambled short hairpin RNA (shRNA) as control or 14-3-3 shRNA
(sh14-3-3). The association of RNAP was analyzed in untreated (0 min) and serum treated cells
(80 min) on the promoter region and across the gene as indicated. The RNAP stalling index was
measured as the ratio between the maximum enrichment at the transcription start site (TSS) and
the median enrichment of the amplicons distributed across the gene.
(E) ChIP analysis as in panel D in control cells and cells silenced for MOF (shMOF). Error bars
represent the relative standard deviations of ChIP data.

15

16
Figure S4. BRD4 binds the acetylated nucleosome through bromodomains 1 and 2.
(A) Immunoprecipitation of chromatin extracts obtained from cells expressing different YFP-H3
or YFP-H4 fusion contructs were performed by using antibodies recognizing H3K3me3 or
H3K27me3. Western blot analysis of the expression levels of the endogenous BRD4, H3, H4, and
the ectopically expressed CFP-BRD4 revealed by immunoblotting the immunoprecipitated
samples with antibodies recognizing BRD4 (upper panel), YFP-fusion (middle panels) and H3 or
H4 (lower panels).
(B) Nuclear distribution of CFP-BRD4, YFP-H3 or YFP-H4 constructs; scale bar 6 μm.
(C) Nuclear distribution of CFP-BRD4, CFP-BRD4ΔBD1, CFP-BRD4ΔBD2, or CFP-
BRD4ΔBD1/2; scale bar 6 μm.
(D) FRET efficiency occurring when CFP-BRD4 and the relative mutants are co-expressed with
the indicated YFP-constructs. The scale bar represents the colours range of FRET efficiency.
(E-F) FRET efficiency was calculated as described in the experimental procedure and the data are
represented as the mean and the relative standard deviation are obtained by analyzing 10 different
samples in three independent biological replicas. The T-student test was applied to determine the
probability that FRET efficiency between histones and the corresponding BRD4 mutants is
statistically significant (*= p<0.005 **= p<0.001). The expression of the CFP-BRD4 alone
showed that photo-conversion was not occurring in our experimental conditions (data not shown).
The maximum level of apFRET obtained in our imaging conditions by measuring the apFRET
efficiency using the YFP-CFP fusion protein corresponded to 25.9 ± 4.3 % (not shown). Error
bars represent the relative standard deviations.

17

18
Figure S5. BRD2 binds the nucleosome throught acetyl groups on histone H4
(A) Time-laps imaging of CFP-BRD2 before and after photobleaching in 3T3 cells co-expressing
the indicated constructs. The white circle highlights the areas were the bleach and the following
recovery occurred. The bleached area corresponds to a circle with a diameter of 2 μm.
(B) FRAP analysis of CFP-BRD2 in 3T3 cells co-expressing YFP-H4 (black line), YFP-H4
K12G (blue line) and YFP-H4 K16G (red line). CFP-BRD2 showed a high mobility within the
chromatin context and it recovered the 80% of the initial level (t80) in 35.9 ± 0.1 sec. The
expression of histone H4 K12G mutant significantly increased the kinetics of BRD2 to a t80 of
18.5 ± 0.05 seconds with respect to the wild type YFP-H4 (n=14 p< 0.001). This increase of
mobility was not observed when we co-expressed BRD2 with the H4 K16G mutant, thus
indicating that the assay used efficiently measured the interaction of BRD proteins with the
different histone mutants. Error bars represent the relative standard deviations.
(C) FRET efficiency occurring when CFP-BRD2 is co-expressed with the indicated YFP-
constructs. The scale bar represents the colour range of FRET efficiency.
(D) FRET efficiency was calculated as described in the experimental procedure and the data are
represented as the mean and the relative standard deviation are obtained by analyzing 12 different
samples in three independent biological replicas. The T-student test was applied to determine the
probability that FRET efficiency between H4 wild type and the corresponding mutant is
statistically significant (**= p<0.001). BRD2 interacted with histone H4 with a FRET efficiency
of 7.8 ± 2.1%. This interaction was dependent on the acetylation of H4 on lysine 12: while the
YFP-H4 K16G mutant behaved like the wild type construct which FRET efficiency of 7.2 ± 2.8,
the FRET efficiency of the BRD-H4 K12G pair was 1.01 ± 0.8% with a significant decrease of
efficiency. Error bars represent the relative standard deviations.
19
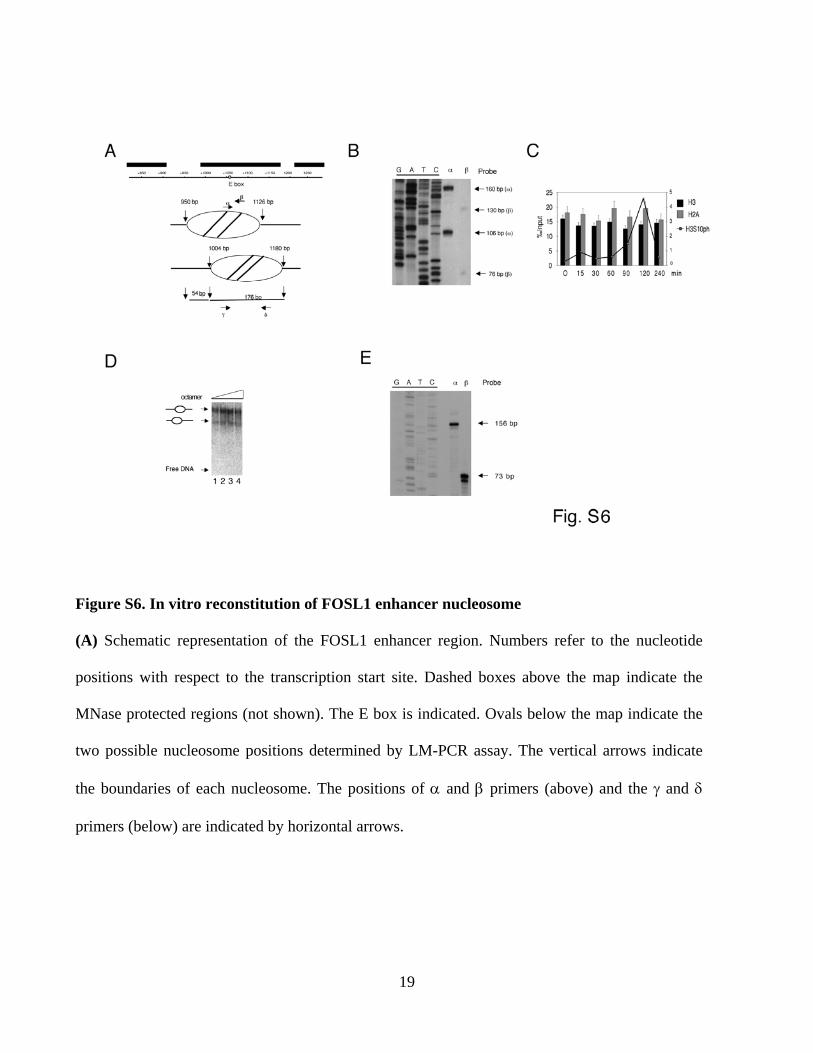
Figure S6. In vitro reconstitution of FOSL1 enhancer nucleosome
(A) Schematic representation of the FOSL1 enhancer region. Numbers refer to the nucleotide
positions with respect to the transcription start site. Dashed boxes above the map indicate the
MNase protected regions (not shown). The E box is indicated. Ovals below the map indicate the
two possible nucleosome positions determined by LM-PCR assay. The vertical arrows indicate
the boundaries of each nucleosome. The positions of α and β primers (above) and the γ and δ
primers (below) are indicated by horizontal arrows.

20
(B) Nucleosome boundaries fine mapping in vivo. Mononucleosomal-size DNA was subjected to
LM-PCR. The LM-PCR products of α and β primer extension elongations are indicated. The
elongation products were separated on acrylamide denaturing gel.
(C) Mononucleosome ChIP assay on serum-induced 293 cells. Chromatin digested to
mononucleosomes with MNase was precipitated using antibodies recognizing H2A, H3, or
H3S10ph and the purified DNA fragments were quantified by quantitative PCR by using
nucleosome internal primers γ and δ. The relative values were normalized on un-digested
genomic DNA and represented as percentage input either for H2A and H3 on the left scale (high
bars) or for the H3S10ph on the right scale (line). Error bars represent the relative standard
deviations.
(D) In vitro nucleosome assembly. Increasing concentrations of octamer were incubated with the
biotin-PCR fragment spanning from +928/+1208 of FOSL1 gene and the reconstituted
nucleaosomes were analyzed by EMSA. Octamer DNA ratios: lane 1 0.85:1; lane 2 1:1; lane 3
1,15:1; lane 4 1.3:1.
(E) In vitro nucleosome mapping. Boundaries of the nucleosome assembled at the FOSL1
enhancer were analyzed by LM-PCR using the α and β primers. The elongation products were
separated on acrylamide denaturing gel.
21
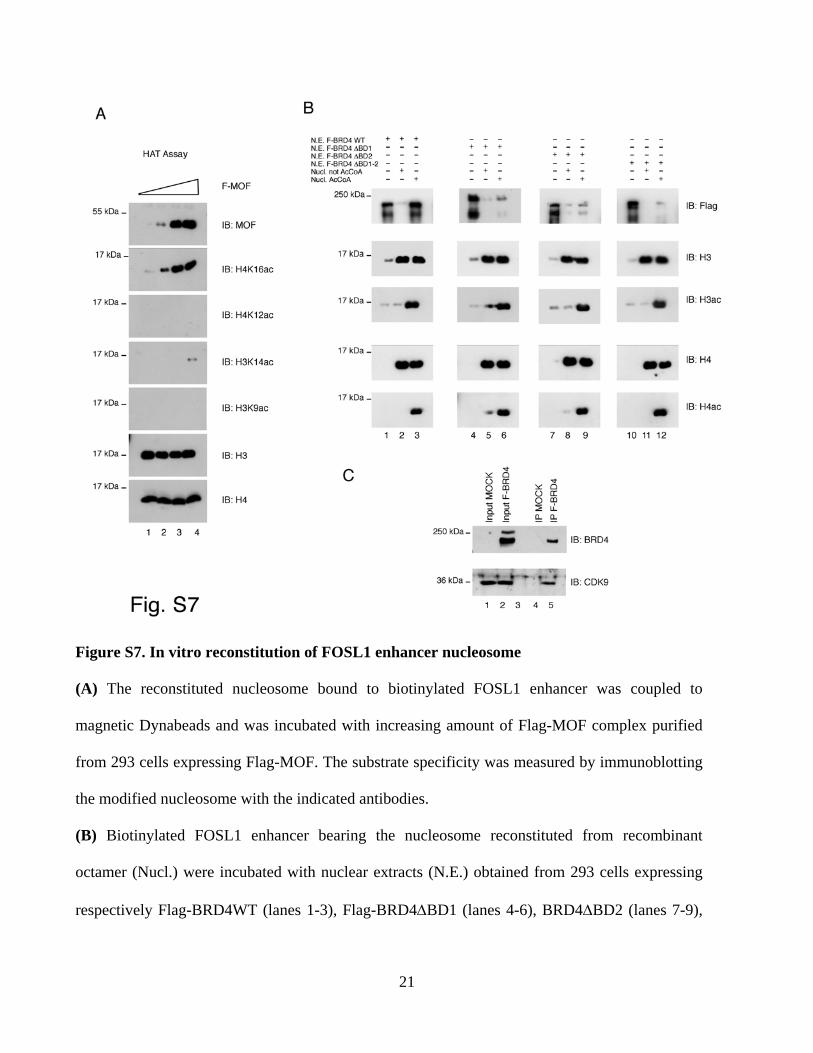
Figure S7. In vitro reconstitution of FOSL1 enhancer nucleosome
(A) The reconstituted nucleosome bound to biotinylated FOSL1 enhancer was coupled to
magnetic Dynabeads and was incubated with increasing amount of Flag-MOF complex purified
from 293 cells expressing Flag-MOF. The substrate specificity was measured by immunoblotting
the modified nucleosome with the indicated antibodies.
(B) Biotinylated FOSL1 enhancer bearing the nucleosome reconstituted from recombinant
octamer (Nucl.) were incubated with nuclear extracts (N.E.) obtained from 293 cells expressing
respectively Flag-BRD4WT (lanes 1-3), Flag-BRD4ΔBD1 (lanes 4-6), BRD4ΔBD2 (lanes 7-9),

22
and BRD4ΔBD1/2 (lanes 10-12) in the absence or presence of Acetyl CoA as indicated. The
modified histones and the interacting proteins were visualized by immunoblotting by using
specific antibodies as indicated.
(C) BRD4/CDK9 complex was purified from 293 cells expressing either Flag- or Flag-BRD4
proteins (lane 1, 2). Flag-eluted complex was analysed by immunoblotting (lane 4, 5).

23
Figure S8. Chromatin looping analysed by 3C assay.
(A) Schematic representation of the genomic region containing FOSL1 and CCDC85B on human
chromosome 11 and the region containing PLAU/UPA gene on chromosome 10. Exons are
represented as gray squares within the gene and black at 5’UTR and 3’UTR, the enhancer is
indicated as a circle. The position of forward and reverse primers used in this analysis are
indicated by arrows. PstI and BglI were used together after the crosslinking, their positions are
indicated as red vertical bars.
(B) Formation of ligation products was strictly dependent on both ligation and crosslinking.
Amplicon R2 (obtained using primers F1 and R2) was used to detect ligetion products on various

24
templates. Lane 2 contains the the BAC clone containing the FOSL1 gene as positive control.
Lane 3 same as lane 2 but amplified with the divergent primers R1 and R2. Lanes 4 and 5
contains genomic purified DNA untreated or treated with formaldehyde before ligation. Lanes 6
and 10 contain nuclei treated with increasing concentration of formaldehyde before ligation.
Lanes 11-17 as in lanes 4-10 after ligation.
(C) Determination of the crosslinking frequency of the amplicon R2 obtained with the F1 and R2
primers. The linear range for the quantitative PCR reaction was determined by titrating the
crosslinked BAC clone containing the FOSL1 gene (Control template) and the cross linked nuclei
(Crosslinked sample).
(D) Efficiency of PCR amplifications of each set of primers used in this study obtained
amplifying BAC control templates and the products were visualized on agarose gels. Each
amplicon is indicated with the reverse primer used.
(E) Crosslinking frequency of the different amplicons was obtaind by PCR amplification of
samples obtained from control or PIM1 silenced cells untreated (0 min) or serum treated ( 90
min).
(F) Densitometric quantification of the PCR amplification obtained from control and PIM1
silenced cells untreated or serum treated as indicated. Each amplicon is indicated with the reverse
primer used. Error bars represent the relative standard deviations.