Celebrating Rural Georgia
24
your urban forest - learn it, grow it, maintain it, enjoy it! Celebrating Rural Georgia Georgia Forestry Commission August 2006 Susan Reisch Urban & Community Forestry
description
Celebrating Rural Georgia. Georgia Forestry Commission August 2006 Susan Reisch Urban & Community Forestry Coordinator. Urban & Community Forestry. All trees, vegetation, watersheds and wildlife in urban areas, developed areas or communities. - PowerPoint PPT Presentation
Transcript of Celebrating Rural Georgia

It’s your urban forest - learn it, grow it, maintain it, enjoy it!
Celebrating Rural Georgia
Georgia Forestry CommissionAugust 2006
Susan ReischUrban & Community Forestry Coordinator

Urban & Community Forestry
• All trees, vegetation, watersheds and wildlife in urban areas, developed areas or communities.
• State and local govt. highway rights-of-way, greenspace, undeveloped forests, parks, private and commercial land.
• Management of these resources.

Community Forestry Partners
• USDA Forest Service• Georgia Urban Forest
Council• State and local govt’s.• Utilities• Tree care companies• Contractors and
landscapers• Tree groups• Sierra Club
• Cooperative Extension• Georgia Conservancy• Master Gardeners and
Garden Clubs• RC&Ds• RDCs• Land Trusts• NRCS• Developers/Homebuilders

Benefits of Urban Trees
• Environmental• Social • Economic• Health

Did you know?
• Surgical patients heal faster with a view of trees• Shoppers spend up to 10% more in tree-lined
business districts• Trees lure people outdoors to walk, bike and hike
leading to an increase in physical activity• Children with ADHD are better able to concentrate
after activities in green settings
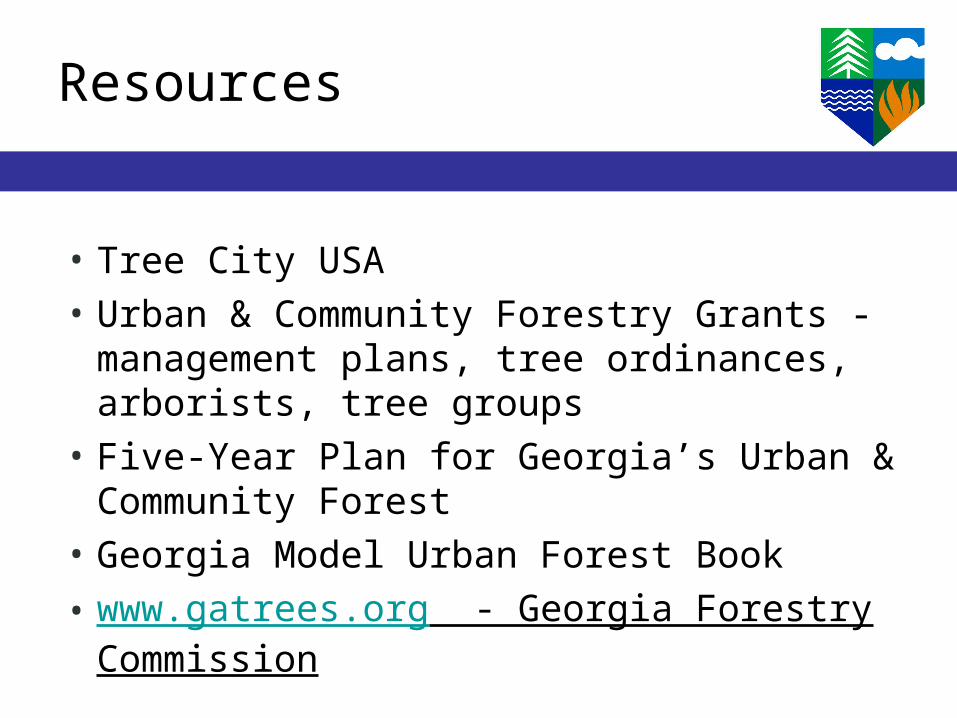
Resources
• Tree City USA• Urban & Community Forestry Grants - management
plans, tree ordinances, arborists, tree groups• Five-Year Plan for Georgia’s Urban & Community
Forest• Georgia Model Urban Forest Book• www.gatrees.org - Georgia Forestry Commission

It’s your urban forest - learn it, grow it, maintain it, enjoy it!
Celebrating Rural Georgia
Georgia Forestry CommissionAugust 2006
Larry MorrisSustainable Community Forestry Program
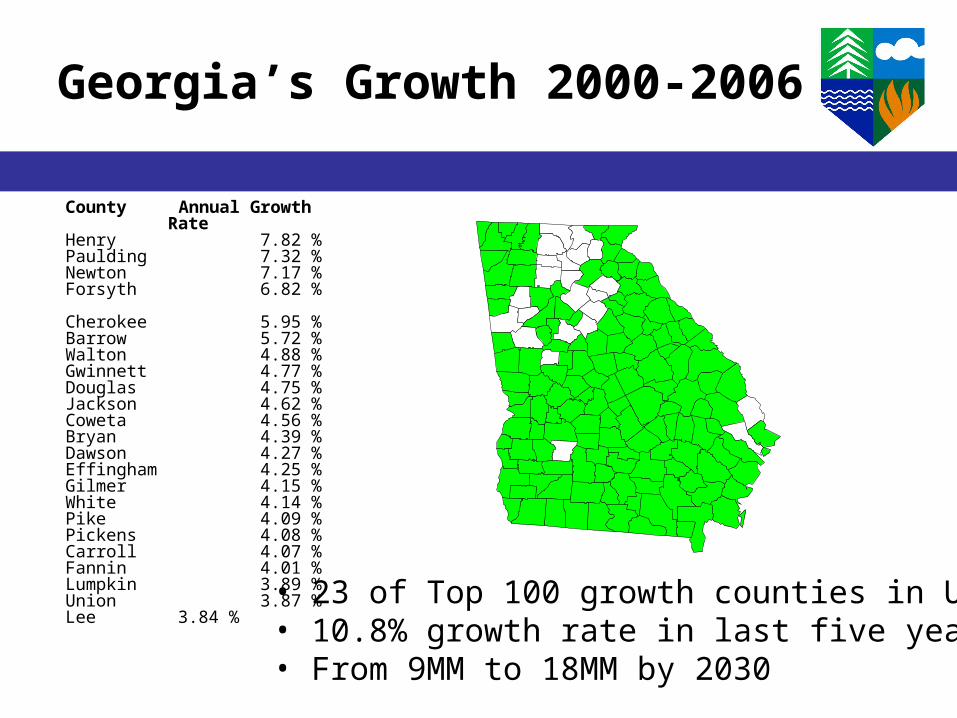
Georgia’s Growth 2000-2006
County Annual Growth
RateHenry 7.82 %Paulding 7.32 %Newton 7.17 %Forsyth 6.82 % Cherokee 5.95 %Barrow 5.72 %Walton 4.88 %Gwinnett 4.77 %Douglas 4.75 %Jackson 4.62 %Coweta 4.56 %Bryan 4.39 %Dawson 4.27 %Effingham 4.25 %Gilmer 4.15 %White 4.14 %Pike
4.09 %Pickens 4.08 %Carroll 4.07 %Fannin 4.01 %Lumpkin 3.89 %Union 3.87 %Lee 3.84 %
• 23 of Top 100 growth counties in US• 10.8% growth rate in last five years• From 9MM to 18MM by 2030

More than 50% of Georgia homes are currently in the wildland-urban interface areas.
Georgia Housing Density

So What? Who Cares? Why Trees?
• Water • Air • Economics • Fragmentation/Development

Trees and Water
• Water Quality/Quantity Drought & water wars 1,000 more miles impaired streams Watershed issues
• Impaired Waters In 2002, Georgia had 447 impaired waters 554 causes of impairment
Riparian Buffers
• BMPs and Streamside Management Zones
• Riparian Buffers Stream health rating of “good” strongly
correlated to less than 10% impervious surface and more than 60% riparian forest cover (Goetz, 2003).

Trees and Air
• Air Quality
Non-attainment growth PM 2.5 & prescribed burning
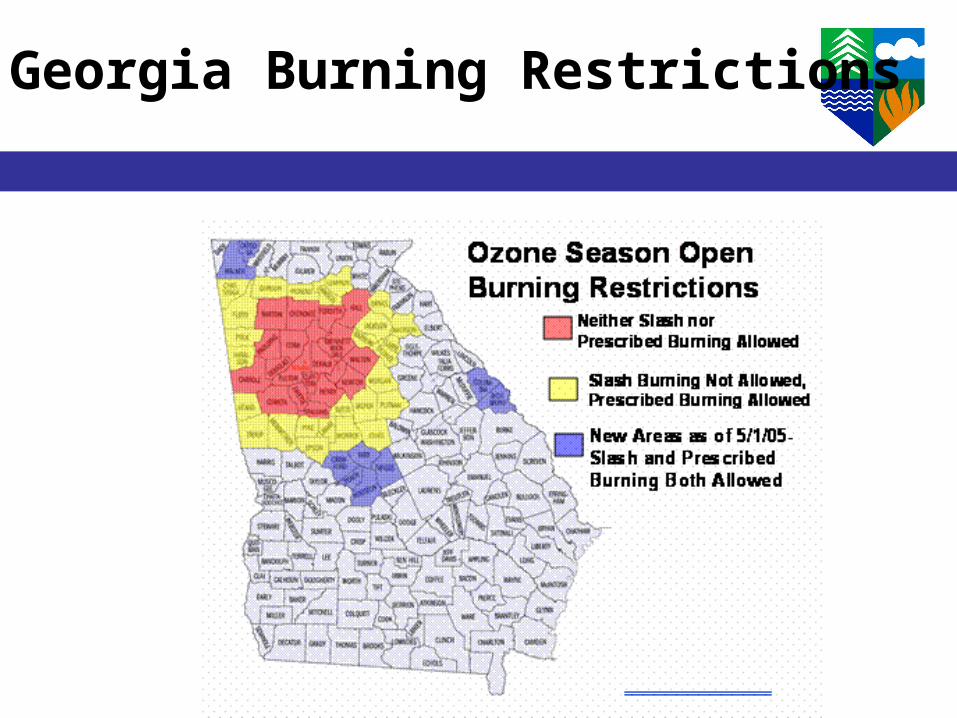
Georgia Burning Restrictions

Why Trees?
• Atlanta: Trees removed 1,196 metric tons of air pollution in 1994 – estimated value of service $6.5 million (Nowak, 1994.)
• Atlanta: A 20% loss of forest canopy due to urbanization has led to a 14% increase in ozone concentrations (Nowak, 2005.)

Trees and Local Economics
• Land divestitures
Property taxDevelopment and Growth

Industrial Timberland Tax Change1999 - 2003

Metro Atlanta – Forest Canopy

54 acres of forest canopy are lost each day in the Atlanta region
0
1
2
3
4
5
6
7
8
9
10
Acr
esForest Canopy 1992-2001Loss per day

Metro Atlanta – Impervious Surface

0
1
2
3
4
5
6
Acr
es
28 acres of impervious surface is added to the Atlanta region each day
Impervious Surface 1992-2001Increase per day

The Next Step
• 2006: Statewide canopy loss and impervious surface gain (2002-2005 - metro areas)
• 2007: Remainder of the state (2002 – 2005)

Other Steps
• Tree Ordinances• Conservation Easements

It’s your urban forest - learn it, grow it, maintain it, enjoy it!
It’s your urban forest - learn it, grow it, maintain it, enjoy it!
Georgia Forestry CommissionP.O. Box 819
Macon, GA 31202-0819
1-800-GA-TREESwww.gatrees.org