CEI Economic Forum November 2009 - Central European Initiative RICHTER ppt.pdf · 0 10 20 30 40 50...
36
Ewa Korczyc and Kaspar Richter Ewa Korczyc and Kaspar Richter [email protected] [email protected] CEI Economic Forum November 2009
Transcript of CEI Economic Forum November 2009 - Central European Initiative RICHTER ppt.pdf · 0 10 20 30 40 50...

Ewa Korczyc and Kaspar RichterEwa Korczyc and Kaspar Richter
[email protected]@worldbank.org
CEI Economic Forum
November 2009

�� CEI countriesCEI countries
�� What we have seenWhat we have seen–– Stabilization Stabilization
�� Why countries are differentWhy countries are different–– Initial conditions, market size, depreciation and f iscal Initial conditions, market size, depreciation and f iscal
stimulusstimulus
�� What we can expectWhat we can expect–– Slow recoverySlow recovery
OverviewOverview
CEI countriesCEI countries
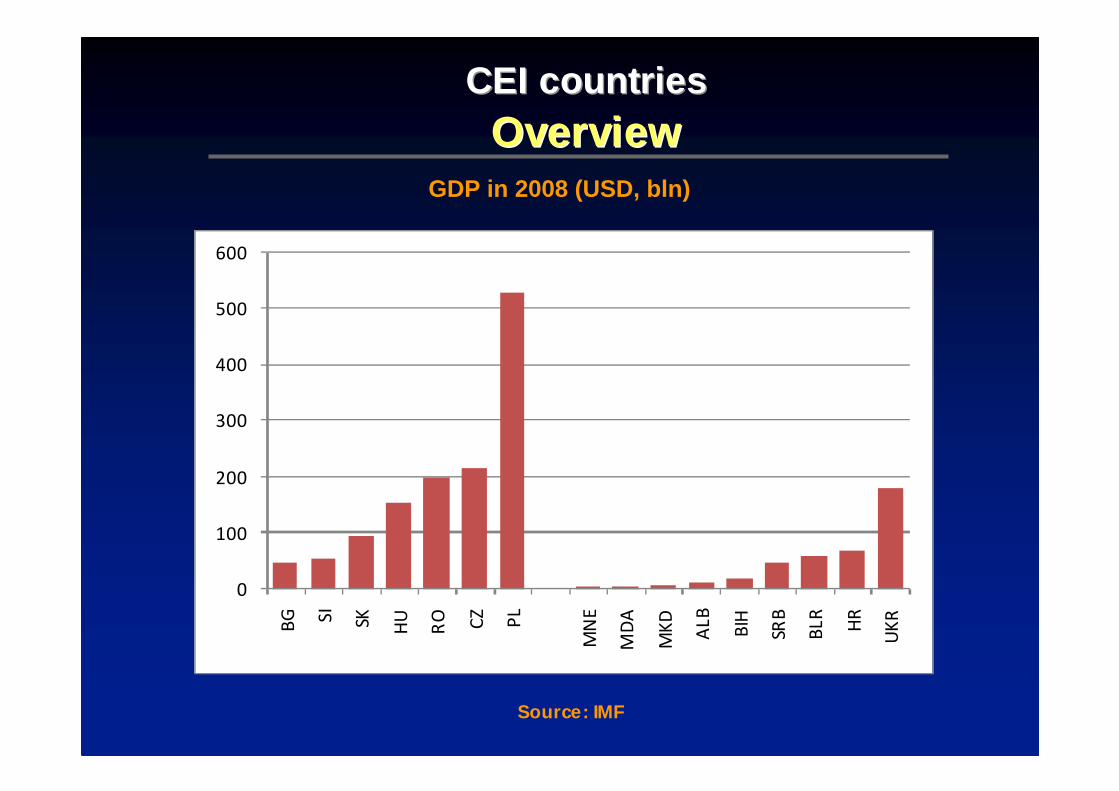
CEI countriesCEI countriesOverviewOverview
GDP in 2008 (USD, bln)
Source: IMF
0
100
200
300
400
500
600
BG SI
SK HU
RO CZ
PL
MN
E
MD
A
MK
D
AL
B
BIH
SRB
BL
R
HR
UK
R
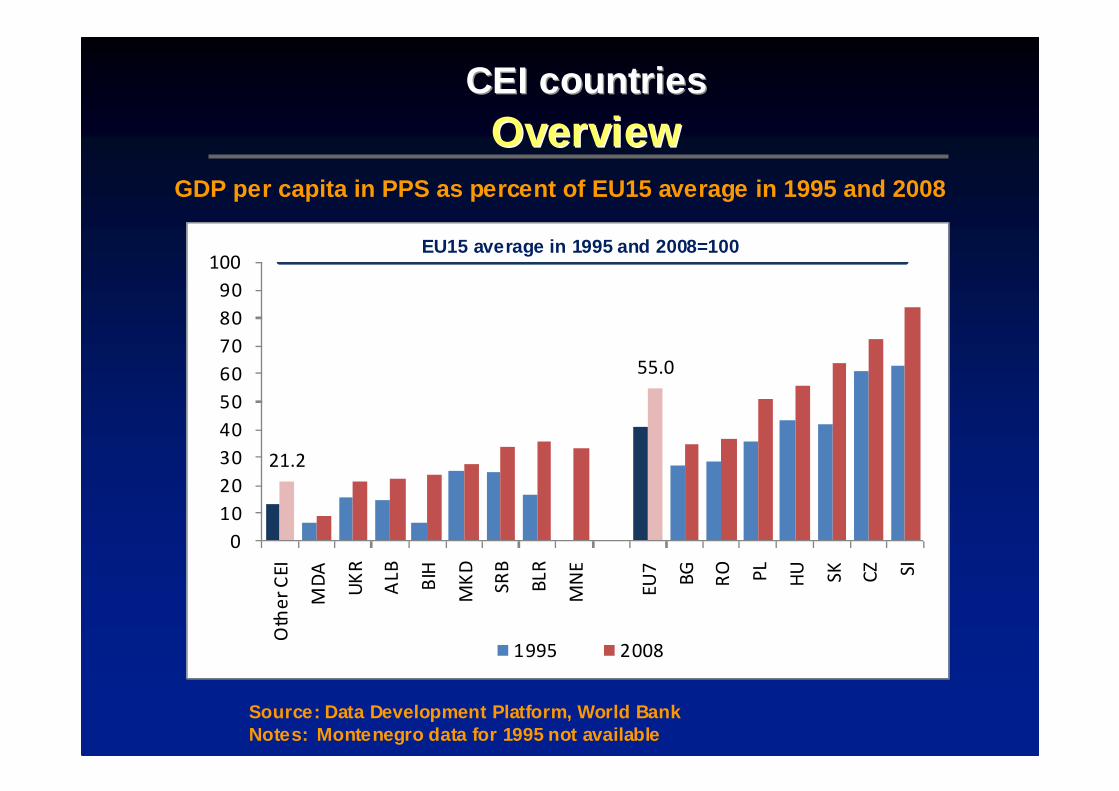
CEI countriesCEI countriesOverviewOverview
GDP per capita in PPS as percent of EU15 average in 1995 and 2008
Source: Data Development Platform, World BankNotes: Montenegro data for 1995 not available
EU15 average in 1995 and 2008=100
21.2
55.0
0
10
20
30
40
50
60
70
80
90
100O
the
r C
EI
MD
A
UK
R
AL
B
BIH
MK
D
SR
B
BL
R
MN
E
EU
7
BG
RO PL
HU SK
CZ SI
1995 2008
EU15 average in 1995 and 2008=100

What we have seenWhat we have seen
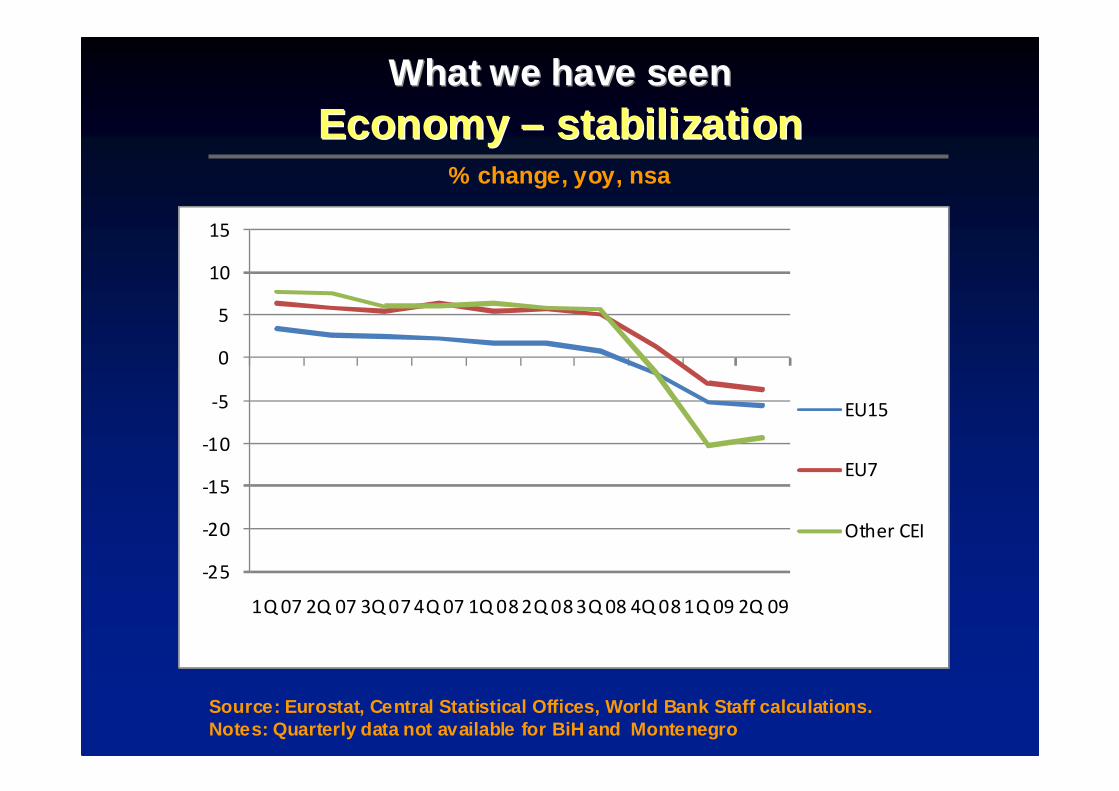
What we have seenWhat we have seenEconomy Economy –– stabilizationstabilization
% change, yoy, nsa
Source: Eurostat, Central Statistical Offices, Worl d Bank Staff calculations.Notes: Quarterly data not available for BiH and Mo ntenegro
-25
-20
-15
-10
-5
0
5
10
15
1Q 07 2Q 07 3Q 07 4Q 07 1Q 08 2Q 08 3Q 08 4Q 08 1Q 09 2Q 09
EU15
EU7
Other CEI

What we have seenWhat we have seenEconomy Economy –– stabilizationstabilization
% change, yoy, nsa
Source: Eurostat, Central Statistical Offices, Worl d Bank Staff calculations.
-25
-20
-15
-10
-5
0
5
10
15
1Q 07 2Q 07 3Q 07 4Q 07 1Q 08 2Q 08 3Q 08 4Q 08 1Q 09 2Q 09
ALB
BLR
MKD
MDA
SRB
UKR
HR
EU7 Other CEI
-25
-20
-15
-10
-5
0
5
10
15
1Q 07 2Q 07 3Q 07 4Q 07 1Q 08 2Q 08 3Q 08 4Q 08 1Q 09 2Q 09
BG
CZ
HU
PL
RO
SI
SK
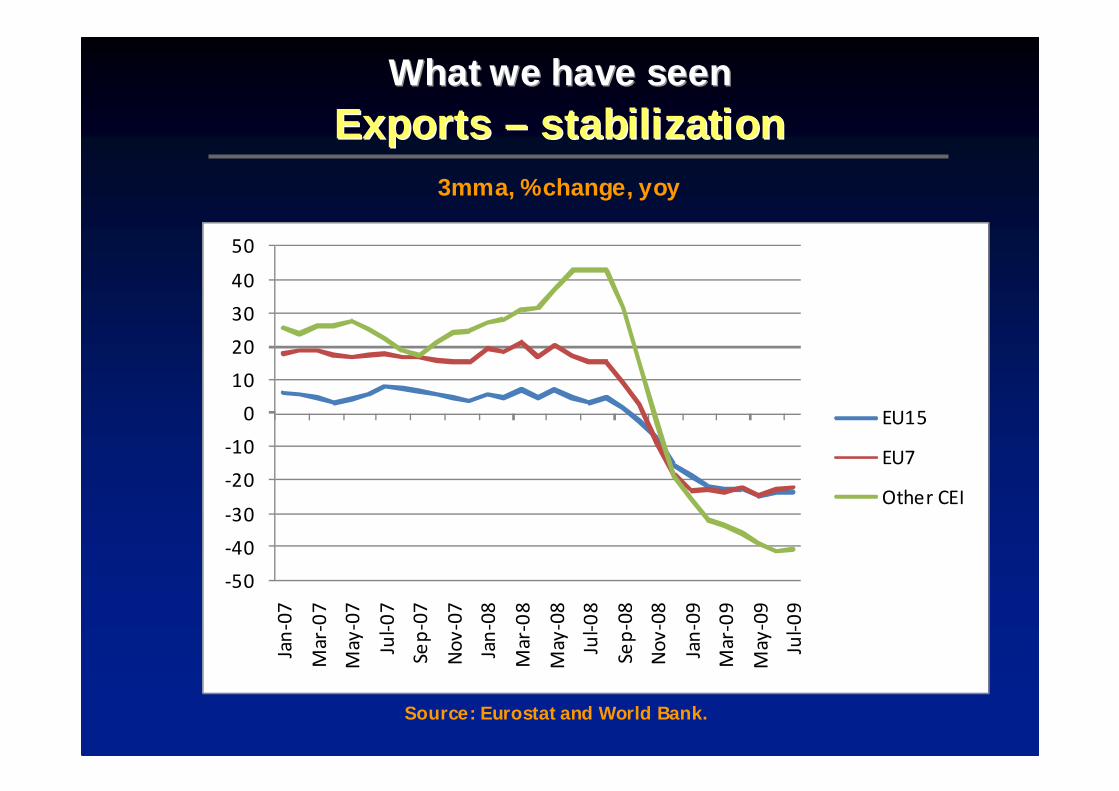
What we have seenWhat we have seenExports Exports –– stabilizationstabilization
3mma, %change, yoy
Source: Eurostat and World Bank.
-50
-40
-30
-20
-10
0
10
20
30
40
50
Jan
-07
Mar-
07
May
-07
Jul-
07
Se
p-0
7
No
v-0
7
Jan
-08
Mar-
08
May
-08
Jul-
08
Se
p-0
8
No
v-0
8
Jan
-09
Mar-
09
May
-09
Jul-
09
EU15
EU7
Other CEI

What we have seenWhat we have seenExports Exports –– stabilizationstabilization
3mma, %change, yoy
Source: Eurostat and World Bank.
-60
-50
-40
-30
-20
-10
0
10
20
30
40
50
60
70
Jan
-07
Mar
-07
Ma
y-0
7
Jul-
07
Se
p-0
7
No
v-0
7
Jan
-08
Mar
-08
Ma
y-0
8
Jul-
08
Se
p-0
8
No
v-0
8
Jan
-09
Mar
-09
Ma
y-0
9
Jul-
09
BG
CZ
HU
PL
RO
SI
SK -60
-50
-40
-30
-20
-10
0
10
20
30
40
50
60
70
Jan
-07
Mar
-07
Ma
y-0
7
Jul-
07
Se
p-0
7
No
v-0
7
Jan
-08
Mar
-08
Ma
y-0
8
Jul-
08
Se
p-0
8
No
v-0
8
Jan
-09
Mar
-09
Ma
y-0
9
Jul-
09
ALB
BLR
BIH
MKD
MDA
MNE
SRB
UKR
HR
EU7 Other CEI

What we have seenWhat we have seenImports Imports –– stabilizationstabilization
3mma, %change, yoy
Source: Eurostat and World Bank.
-50
-40
-30
-20
-10
0
10
20
30
40
50Ja
n-0
7
Ma
r-0
7
May
-07
Jul-
07
Se
p-0
7
No
v-0
7
Jan
-08
Ma
r-0
8
May
-08
Jul-
08
Se
p-0
8
No
v-0
8
Jan
-09
Ma
r-0
9
May
-09
Jul-
09
EU15
EU7
Other CEI

What we have seenWhat we have seenImports Imports –– stabilizationstabilization
3mma, %change, yoy
Source: Eurostat and World Bank.
-60
-50
-40
-30
-20
-10
0
10
20
30
40
50
60
70
Jan
-07
Mar
-07
Ma
y-0
7
Jul-
07
Se
p-0
7
No
v-0
7
Jan
-08
Mar
-08
Ma
y-0
8
Jul-
08
Se
p-0
8
No
v-0
8
Jan
-09
Mar
-09
Ma
y-0
9
Jul-
09
BG
CZ
HU
PL
RO
SI
SK -60
-50
-40
-30
-20
-10
0
10
20
30
40
50
60
70
Jan
-07
Mar
-07
Ma
y-0
7
Jul-
07
Se
p-0
7
No
v-0
7
Jan
-08
Mar
-08
Ma
y-0
8
Jul-
08
Se
p-0
8
No
v-0
8
Jan
-09
Mar
-09
Ma
y-0
9
Jul-
09
ALB
BLR
BIH
MKD
MDA
MNE
SRB
UKR
HR
EU7 Other CEI

What we have seenWhat we have seenIndustrial production Industrial production –– reboundrebound
3mma, wda, %change, yoy
Source: Eurostat, statistical Offices, and World Ba nk.Notes: Other CEI without BiH and Albania
-40
-30
-20
-10
0
10
20
Jan
-07
Mar-
07
May
-07
Jul-
07
Se
p-0
7
No
v-0
7
Jan
-08
Mar-
08
May
-08
Jul-
08
Se
p-0
8
No
v-0
8
Jan
-09
Mar-
09
May
-09
Jul-
09
EU15
EU10
Other CEI

What we have seenWhat we have seenIndustrial production Industrial production –– reboundrebound
3mma, %change, yoy
Source: Eurostat, Statistical Offices, and World B ank.
-50
-40
-30
-20
-10
0
10
20
Jan
-07
Mar
-07
Ma
y-0
7
Jul-
07
Se
p-0
7
No
v-0
7
Jan
-08
Mar
-08
Ma
y-0
8
Jul-
08
Se
p-0
8
No
v-0
8
Jan
-09
Mar
-09
Ma
y-0
9
Jul-
09
BG
CZ
HU
PL
RO
SI
SK
EU7 Other CEI
-50
-40
-30
-20
-10
0
10
20
Jan
-07
Mar
-07
Ma
y-0
7
Jul-
07
Se
p-0
7
No
v-0
7
Jan
-08
Mar
-08
Ma
y-0
8
Jul-
08
Se
p-0
8
No
v-0
8
Jan
-09
Mar
-09
Ma
y-0
9
Jul-
09
ALB
BLR
BIH
MKD
MDA
MNE
SRB
UKR
HR
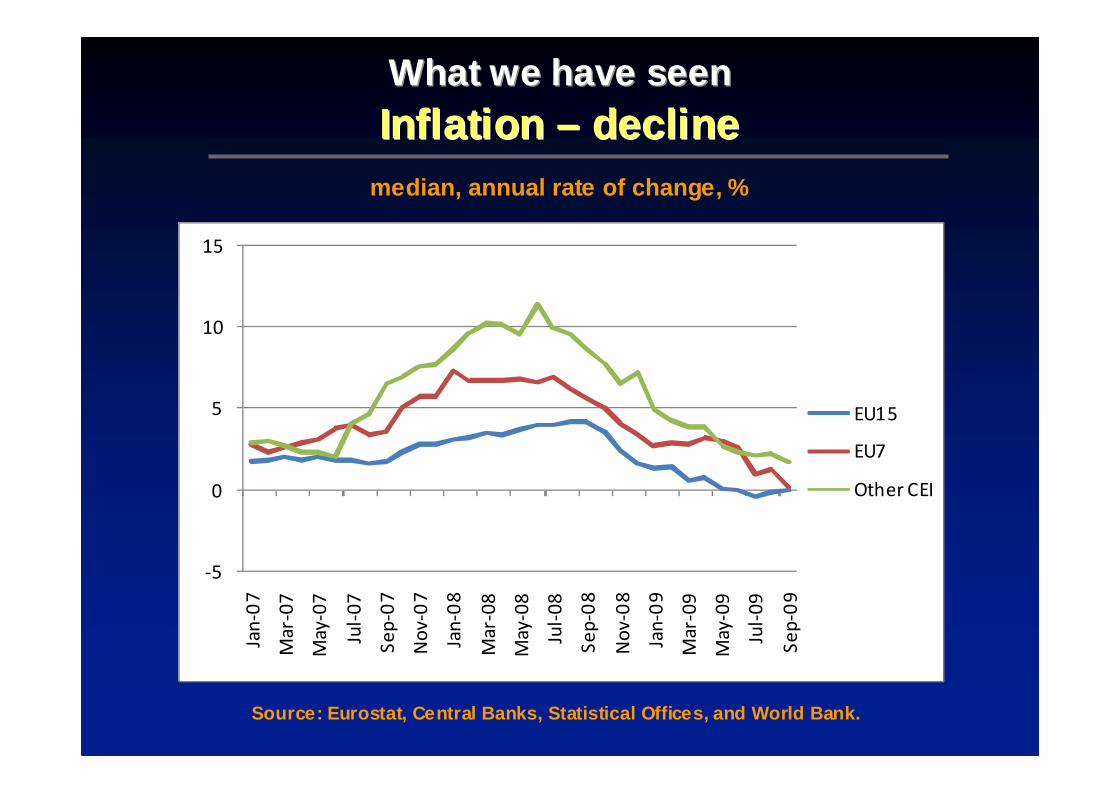
What we have seenWhat we have seenInflation Inflation –– declinedecline
median, annual rate of change, %
Source: Eurostat, Central Banks, Statistical Office s, and World Bank.
-5
0
5
10
15Ja
n-0
7
Mar-
07
May-0
7
Jul-
07
Se
p-0
7
No
v-0
7
Jan
-08
Mar-
08
May-0
8
Jul-
08
Se
p-0
8
No
v-0
8
Jan
-09
Mar-
09
May-0
9
Jul-
09
Se
p-0
9
EU15
EU7
Other CEI
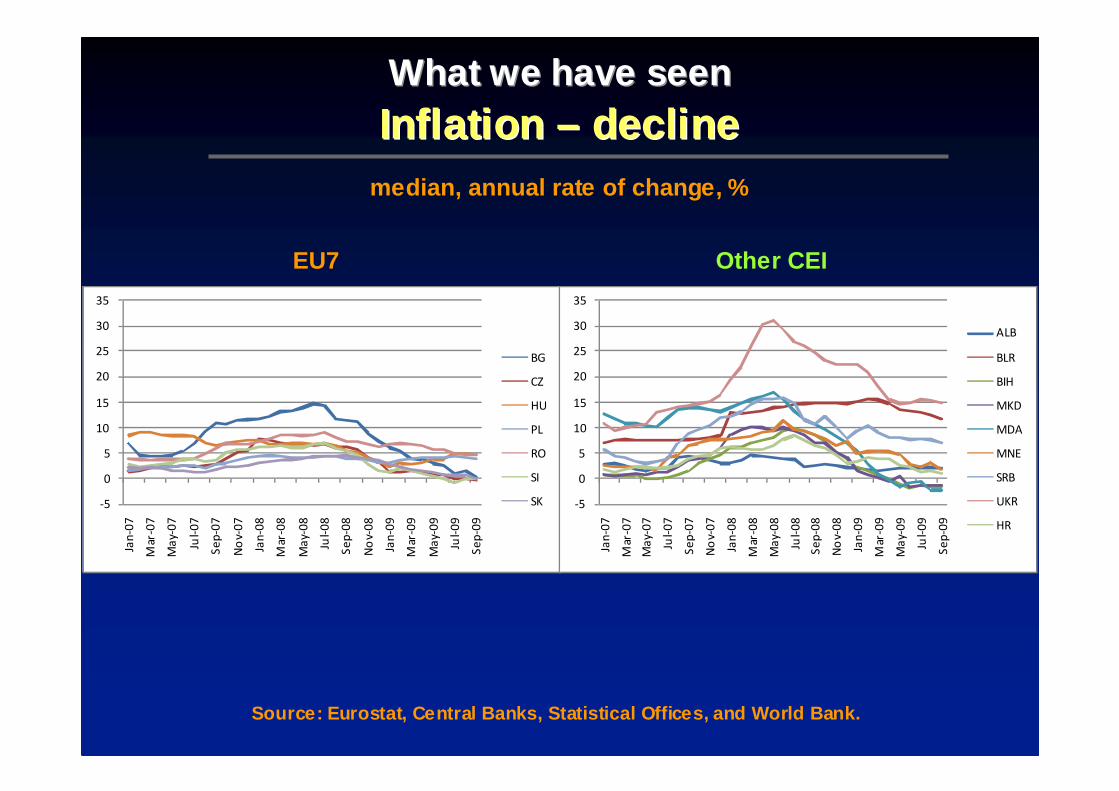
What we have seenWhat we have seenInflation Inflation –– declinedecline
median, annual rate of change, %
Source: Eurostat, Central Banks, Statistical Office s, and World Bank.
-5
0
5
10
15
20
25
30
35
Jan
-07
Mar
-07
Ma
y-0
7
Jul-
07
Se
p-0
7
No
v-0
7
Jan
-08
Mar
-08
Ma
y-0
8
Jul-
08
Se
p-0
8
No
v-0
8
Jan
-09
Mar
-09
Ma
y-0
9
Jul-
09
Se
p-0
9
BG
CZ
HU
PL
RO
SI
SK -5
0
5
10
15
20
25
30
35
Jan
-07
Mar
-07
Ma
y-0
7
Jul-
07
Se
p-0
7
No
v-0
7
Jan
-08
Mar
-08
Ma
y-0
8
Jul-
08
Se
p-0
8
No
v-0
8
Jan
-09
Mar
-09
Ma
y-0
9
Jul-
09
Se
p-0
9
ALB
BLR
BIH
MKD
MDA
MNE
SRB
UKR
HR
EU7 Other CEI

What we have seenWhat we have seenCapital flows Capital flows –– strong bond issuance in EU7, no recovery in Other C EIstrong bond issuance in EU7, no recovery in Other C EI
Gross capital inflows to EU7 and Other CEI (US$ billion)
Source: World Bank Global Prospect Group, World Ban k Staff calculations.Notes: EU7* does not include Slovenia, Other CEI** is without Albania, BiH and Montenegro
EU7* Other CEI**
0
5
10
15
20
25
1Q
07
2Q
07
3Q
07
4Q
07
1Q
08
2Q
08
3Q
08
4Q
08
1Q
09
2Q
09
3Q
09
Banks
Equity
Bonds
0
5
10
15
20
25
1Q
07
2Q
07
3Q
07
4Q
07
1Q
08
2Q
08
3Q
08
4Q
08
1Q
09
2Q
09
3Q
09
Banks
Equity
Bonds

What we have seenWhat we have seenSovereign bonds Sovereign bonds –– easing of CDS in EU7easing of CDS in EU7
5-Year Credit Default Swaps (%)
Source: World Bank Global Prospect
Group, World Bank Staff calculations.
0
1 00
2 00
3 00
4 00
5 00
6 00
7 00
8 00
Jan
-07
Ap
r-0
7
Jul-
07
Oc
t-0
7
Jan
-08
Ap
r-0
8
Jul-
08
Oc
t-0
8
Jan
-09
Ap
r-0
9
Jul-
09
Oc
t-0
9
BG
CZ
HU
PL
RO
SI
SK0
100 0
200 0
300 0
400 0
500 0
600 0
Jan
-07
Ap
r-0
7
Jul-
07
Oc
t-0
7
Jan
-08
Ap
r-0
8
Jul-
08
Oc
t-0
8
Jan
-09
Ap
r-0
9
Jul-
09
Oc
t-0
9
UKR
HR
0
100
200
300
400
500
600
700
800
Jan
-07
Ap
r-0
7
Jul-
07
Oc
t-0
7
Jan
-08
Ap
r-0
8
Jul-
08
Oc
t-0
8
Jan
-09
Ap
r-0
9
Jul-
09
Oc
t-0
9
IT
GR
DE
ES

What we have seenWhat we have seenStock market Stock market –– recoveryrecovery
Stock Market Indices (January 2008=100)
Source: Reuters, World Bank Staff Calculations
0
20
40
60
80
100
120
Jan
-08
Ma
r-0
8
Ma
y-0
8
Jul-
08
Se
p-0
8
No
v-0
8
Jan
-09
Ma
r-0
9
Ma
y-0
9
Jul-
09
Se
p-0
9
EURO
STOXX
IT
DE
Source: Reuters, World Bank Staff
calculations.
0
20
40
60
80
100
120
Jan
-08
Ma
r-0
8
May
-08
Jul-
08
Sep
-08
No
v-0
8
Jan
-09
Ma
r-0
9
May
-09
Jul-
09
Sep
-09
BG
CZ
HU
PL
RO
SI
SK0
20
40
60
80
1 00
1 20
Jan
-08
Mar
-08
Ma
y-0
8
Jul-
08
Se
p-0
8
No
v-0
8
Jan
-09
Mar
-09
Ma
y-0
9
Jul-
09
Se
p-0
9
BIH
MKD
MNE
SRB
UKR
HR

What we have seenWhat we have seenBanks Banks –– interbank rates down, spreads persistentinterbank rates down, spreads persistent
Interbank rates (3 months)
Source: World Bank Global Prospect Group, World Ban k Staff calculations.
Interbank rate spreads over Libor
0
5
10
15
20
25
30
35
40
Jan
-08
Mar
-08
Ma
y-0
8
Jul-
08
Se
p-0
8
No
v-0
8
Jan
-09
Mar
-09
Ma
y-0
9
Jul-
09
Se
p-0
9
BG
CZ
HU
PL
RO
SI
SK
SRB
UKR
IT
AT
-50 0
0
50 0
1 000
1 500
2 000
2 500
3 000
3 500
IT SI AT CZ SK PL BG HU RO SRB UKR
average June
20 08
average Feb
20 09
average 1H
Oct 2009

What we have seenWhat we have seenParent banks Parent banks –– easing of CDSeasing of CDS
European Banks’ 5-year CDS (bps)
Source: Bloomberg, Datastream, World Bank Staff cal culations.
0
100
200
300
400
500
600Ja
n-0
8
Mar-
08
May-0
8
Jul-
08
Se
p-0
8
No
v-0
8
Jan
-09
Mar-
09
May-0
9
Jul-
09
Se
p-0
9
Raiffeisen
Deutsche Bank
Soc Generale
Unicredit
Intesa
ERSTE
SEB Bank
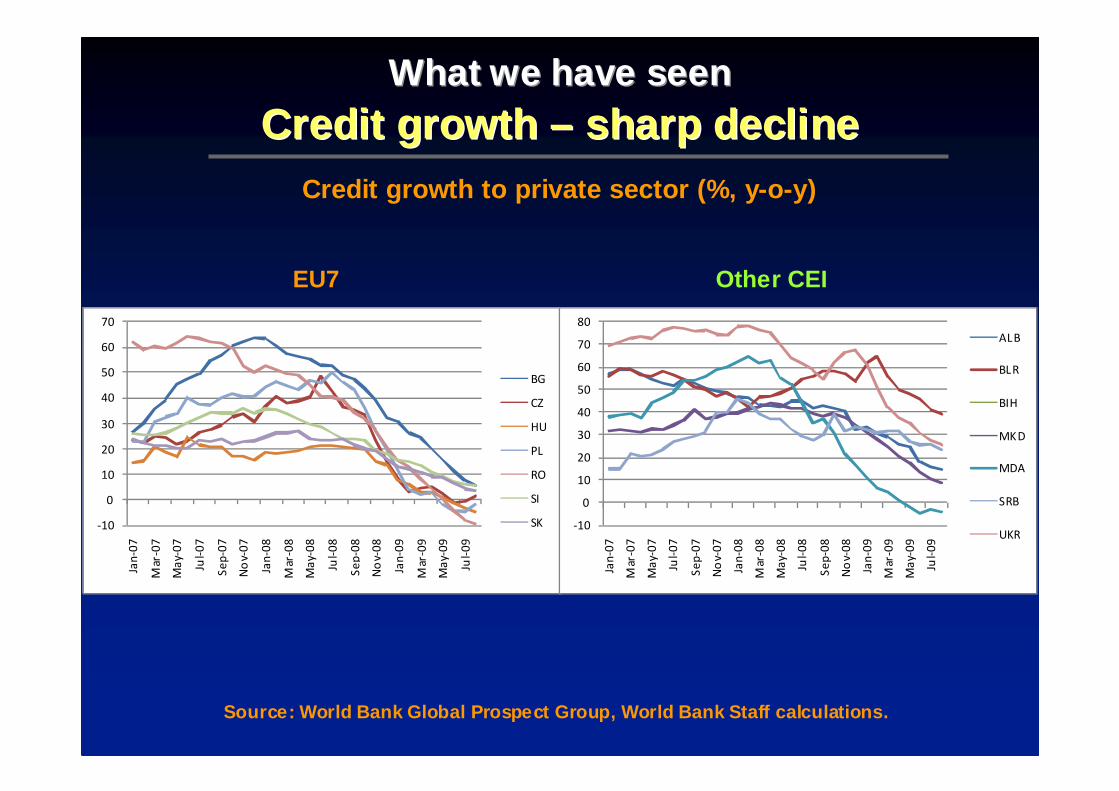
What we have seenWhat we have seenCredit growth Credit growth –– sharp declinesharp decline
Credit growth to private sector (%, y-o-y)
Source: World Bank Global Prospect Group, World Ban k Staff calculations.
-10
0
10
20
30
40
50
60
70
Jan
-07
Mar
-07
Ma
y-0
7
Jul-
07
Se
p-0
7
No
v-0
7
Jan
-08
Mar
-08
Ma
y-0
8
Jul-
08
Se
p-0
8
No
v-0
8
Jan
-09
Mar
-09
Ma
y-0
9
Jul-
09
BG
CZ
HU
PL
RO
SI
SK -10
0
10
20
30
40
50
60
70
80
Jan
-07
Mar
-07
Ma
y-0
7
Jul-
07
Se
p-0
7
No
v-0
7
Jan
-08
Mar
-08
Ma
y-0
8
Jul-
08
Se
p-0
8
No
v-0
8
Jan
-09
Mar
-09
Ma
y-0
9
Jul-
09
ALB
BLR
BIH
MKD
MDA
SRB
UKR
EU7 Other CEI
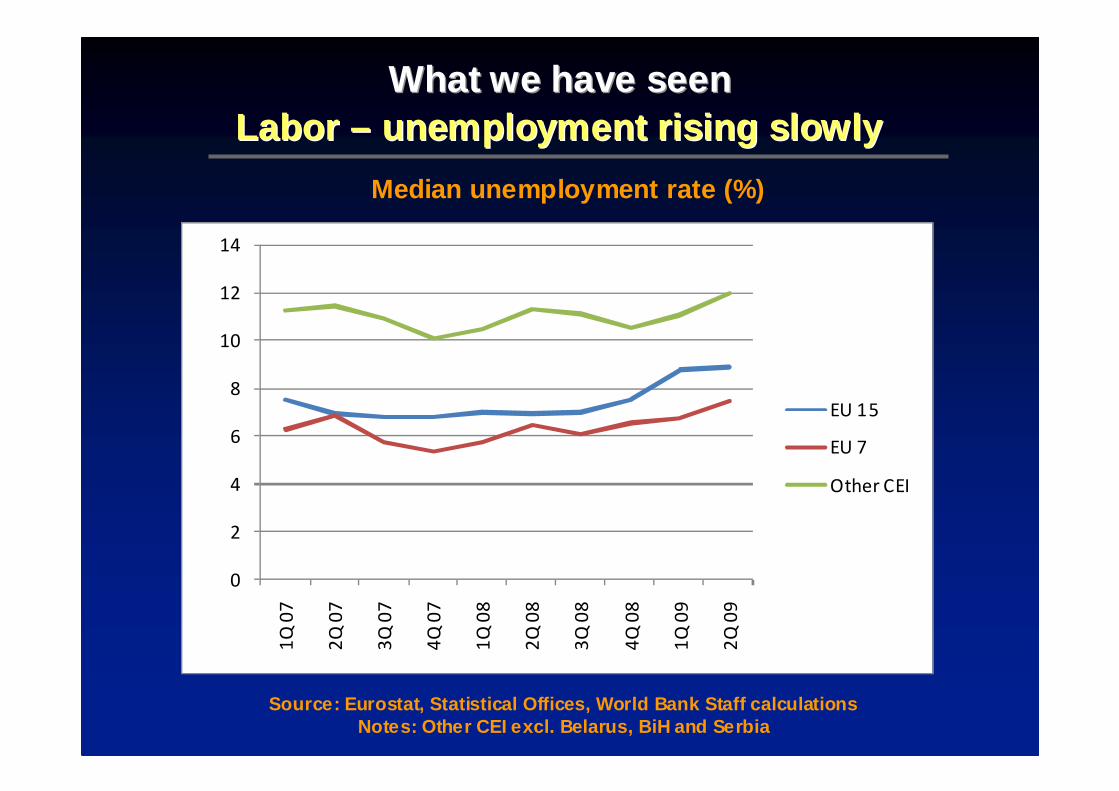
What we have seenWhat we have seenLabor Labor –– unemployment rising slowlyunemployment rising slowly
Source: Eurostat, Statistical Offices, World Bank S taff calculationsNotes: Other CEI excl. Belarus, BiH and Serbia
Median unemployment rate (%)
0
2
4
6
8
10
12
14
1Q
07
2Q
07
3Q
07
4Q
07
1Q
08
2Q
08
3Q
08
4Q
08
1Q
09
2Q
09
EU 15
EU 7
Other CEI

Why countries are differentWhy countries are different

Why countries are differentWhy countries are differentProjected downturn increases with initial macro imb alancesProjected downturn increases with initial macro imb alances
Cumulative output drop 2008-10 vs. bank-related cap ital inflows in 2Q 07-1Q 08
Source: IMF, World Bank, DEC PG, World Bank Staff c alculations
BG
CZ
HU
PL
RO
SI
SK
IT
AT
BLR
MKD
MDA
SRB
UKR
HR
-12
-10
-8
-6
-4
-2
0
2
4
0 1 2 3 4 5 6 7 8
Cu
mu
lati
ve
ou
tpu
t d
rop
20
08
-10
Bank related capital inflows in 2Q 07-1Q 08 as percent of 2008 GDP
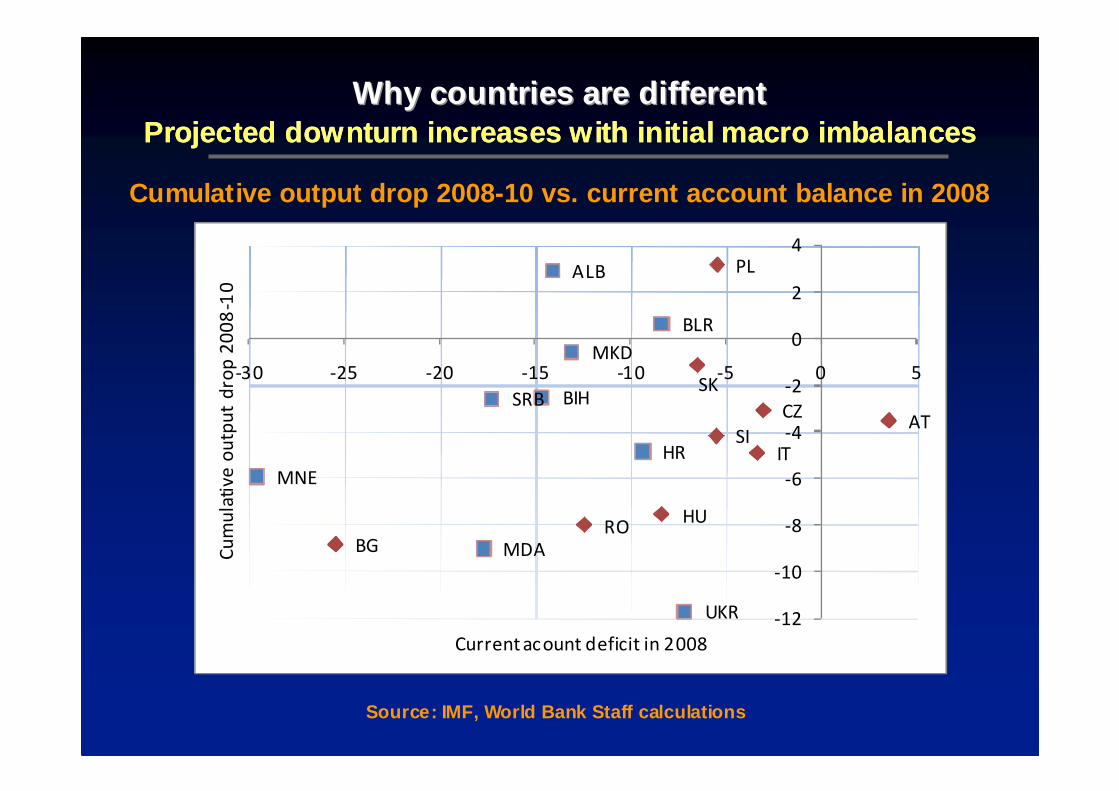
Why countries are different Why countries are different Projected downturn increases with initial macro imb alancesProjected downturn increases with initial macro imb alances
Cumulative output drop 2008-10 vs. current account balance in 2008
Source: IMF, World Bank Staff calculations
BG
CZ
HU
PL
RO
SI
SK
IT
AT
ALB
BLR
BIH
MKD
MDA
MNE
SRB
UKR
HR
-12
-10
-8
-6
-4
-2
0
2
4
-30 -25 -20 -15 -10 -5 0 5
Cu
mu
lati
ve
ou
tpu
t d
rop
20
08
-10
Current acount deficit in 2008

Why countries are different Why countries are different Projected downturn increases with initial macro imb alancesProjected downturn increases with initial macro imb alances
Cumulative output drop 2008-10 vs. inflation rate i n 2008
Source: IMF, World Bank Staff calculations
BG
CZ
HU
PL
RO
SI
SK
IT
AT
ALB
BLR
BIH
MKD
MDA
MNE
SRB
UKR
HR
-12
-10
-8
-6
-4
-2
0
2
4
0 5 10 15 20 25 30
Cu
mu
lati
ve
ou
tpu
t d
rop
20
08
-10
Inflation rate in 2008

Why countries are different Why countries are different Size of domestic marketSize of domestic market
Merchandise Exports as % of GDP in 2008
Source: IMF IFS, IMF, World Bank
0
10
20
30
40
50
60
70
80R
O PL
BG SI
CZ
HU SK IT AT
ALB
MD
A
UK
R
MK
D
BLR

Why countries are different Why countries are different Monetary policyMonetary policy
Exchange Rates vs. Euro(Aug08 = 100)
Source: ECB. Reuters, World Bank Staff Calculations
80
90
100
110
120
130
140
150
160
170
180
Au
g-0
8
Sep
-08
Oct
-08
No
v-0
8
De
c-0
8
Jan
-09
Feb
-09
Ma
r-0
9
Ap
r-0
9
May
-09
Jun
-09
Jul-
09
Au
g-0
9
Sep
-09
Oct
-09
ALB
BLR
MDA
SRB
UKR
80
90
100
110
120
130
140
150
160
170
180
Au
g-0
8
Sep
-08
Oct
-08
No
v-0
8
De
c-0
8
Jan
-09
Feb
-09
Ma
r-0
9
Ap
r-0
9
May
-09
Jun
-09
Jul-
09
Au
g-0
9
Sep
-09
Oct
-09
CZ
HU
RO
PL
EU7 Other CEI

Why countries are different Why countries are different Monetary policyMonetary policy
Source: ECB. World Bank Staff Calculations
Real Effective Exchange Rates (Aug08 = 100)
70
80
90
100
110
120
Au
g-0
8
Sep
-08
Oct
-08
No
v-0
8
De
c-0
8
Jan
-09
Feb
-09
Ma
r-0
9
Ap
r-0
9
May
-09
Jun
-09
Jul-
09
MKD
HR
UKR
MDA

Why countries are different Why countries are different Fiscal policyFiscal policy
General Government Balance Percent of GDP
Source: IMF WEO
-10
-8
-6
-4
-2
0
2
4
EU
15
EU
7
Oth
er C
EI
BG CZ
HU PL
RO S
I
SK
ALB
BLR
BIH
MK
D
MD
A
MN
E
SR
B
UK
R
HR
2008
2009
2010
EU7 Other CEI

What we can expectWhat we can expect

What we can expectWhat we can expectGrowth Growth –– slow recoveryslow recovery
Source: IIMF WEO
-10
-8
-6
-4
-2
0
2
4
6
8
10
2005 2006 2007 2008 2009 2010 2011 2012 2013 2014
EU7
EU15
Other CEI

What we can expectWhat we can expectCurrent account balance Current account balance –– improvingimproving
Percent of GDP
Source: IMF WEO
-35
-30
-25
-20
-15
-10
-5
0
5
10
BG CZ
HU PL
RO S
I
SK IT AT
AL
B
BLR
BIH
MK
D
MD
A
MN
E
SR
B
UK
R
HR
2008 2009 2010

What we can expectWhat we can expect
Poverty and vulnerabilityPoverty and vulnerabilityPercentage Point Change in Poverty and Vulnerabilit y 2010
(In percent of the population; most recent versus p re-crisis growth projection)
Source: The Crisis Hits Home - Stress Testing Househ olds in Europe and Central Asia, World Bank

THANK YOU!THANK YOU!