CEGA ResearchRetreat2011 Fernald Presentation
44
Effect of Ecuador’s Cash Transfer Program on Child Development : A Randomized Effec/veness Trial Lia C. H. Fernald, PhD, MBA Associate Professor, School of Public Health, UCB Coauthor: Melissa Hidrobo, PhD, IFPRI Presenta)on at CEGA, University of California, Berkeley, October 28, 2011
Transcript of CEGA ResearchRetreat2011 Fernald Presentation

Effect of Ecuador’s Cash Transfer Program on Child Development :
A Randomized Effec/veness Trial
Lia C. H. Fernald, PhD, MBA Associate Professor, School of Public Health, UCB
Coauthor: Melissa Hidrobo, PhD, IFPRI
Presenta)on at CEGA,
University of California, Berkeley, October 28, 2011

Today’s presentaAon
• Introduc/on: Early child development in developing countries, CCTs and UCTs
• Describing Ecuador’s UCT program (BDH) and evalua/on of program
• Effects of BDH on child development outcomes
• PuKng BDH results into context • Conclusions and next ques/ons

>10 million child deaths/year
Worldwide distribution of child deaths (Each dot represents 5,000 deaths per year). Black et al, Lancet (2003)

>200 million disadvantaged children
Percentage of disadvantaged children under 5 years old by country in 2004 Grantham-McGregor et al., Lancet (2007)

Child malnutrition, death and disability
Inadequate Disease/ Diet Infection
Insufficient access to food
Inadequate maternal and
child care
Poor water/ sanitation inadequate health
services
Causes of poor child development
POVERTY UNICEF, 1997
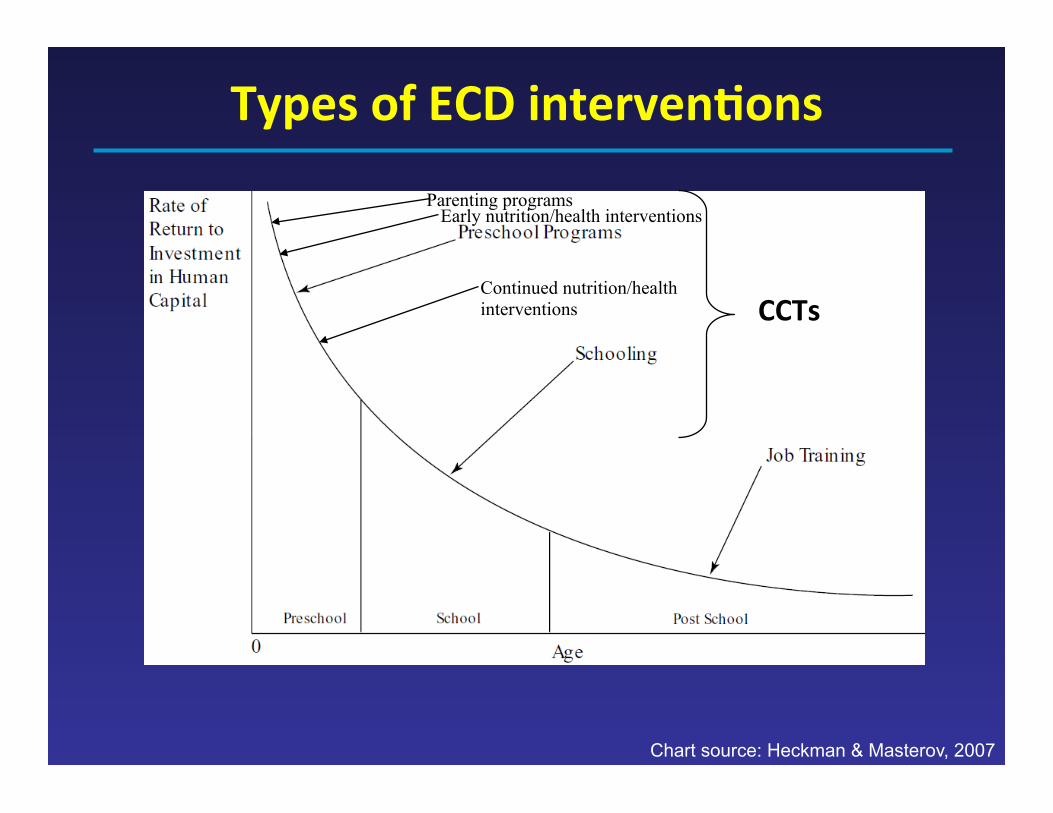
Chart source: Heckman & Masterov, 2007
Types of ECD intervenAons
Parenting programs
CCTs
Early nutrition/health interventions
Continued nutrition/health interventions

ExisAng Cash transfer programs
• Condi/onal cash transfer programs – Ecuador (Bono de Desarrollo Humano) – Mexico (Oportunidades) – Brazil (Bolsa Alimentação) – Nicaragua (Red de Protección Social) – Honduras (Programa de Asignación Familiar) – Colombia (Familias en Acción) – Chile (Subsidio Unico Familiar) – Jamaica (Program of Advancement through Health and Educa)on)

How CCTs/UCTs work
Family with low SES
Services
Direct provision of food, medical care,
education
Cash transfers
Potential increase in spending on nutritious food,
medicine, supplies, other goods
IMPROVED OUTCOMES:
Growth, health, school achievement,
Possible CCT/UCT mechanisms
SES
Education Occupation
Income
FAMILY INVESTMENT MODEL Increased parental investments in children
FAMILY STRESS MODEL Decreased emotional stress and/or depression
Provision of basic needs (e.g. food, shelter, medicine) Investments in child’s future (e.g. schooling, assets) Nurturing, responsive and involved parenting
Improved child
outcomes (physical, emotional, cognitive,
behavioral)
Adapted from Adler & Ostrove, 1999 and Conger & Donnellan, 2007
Ability to focus more exclusively on child, due to fewer time constraints
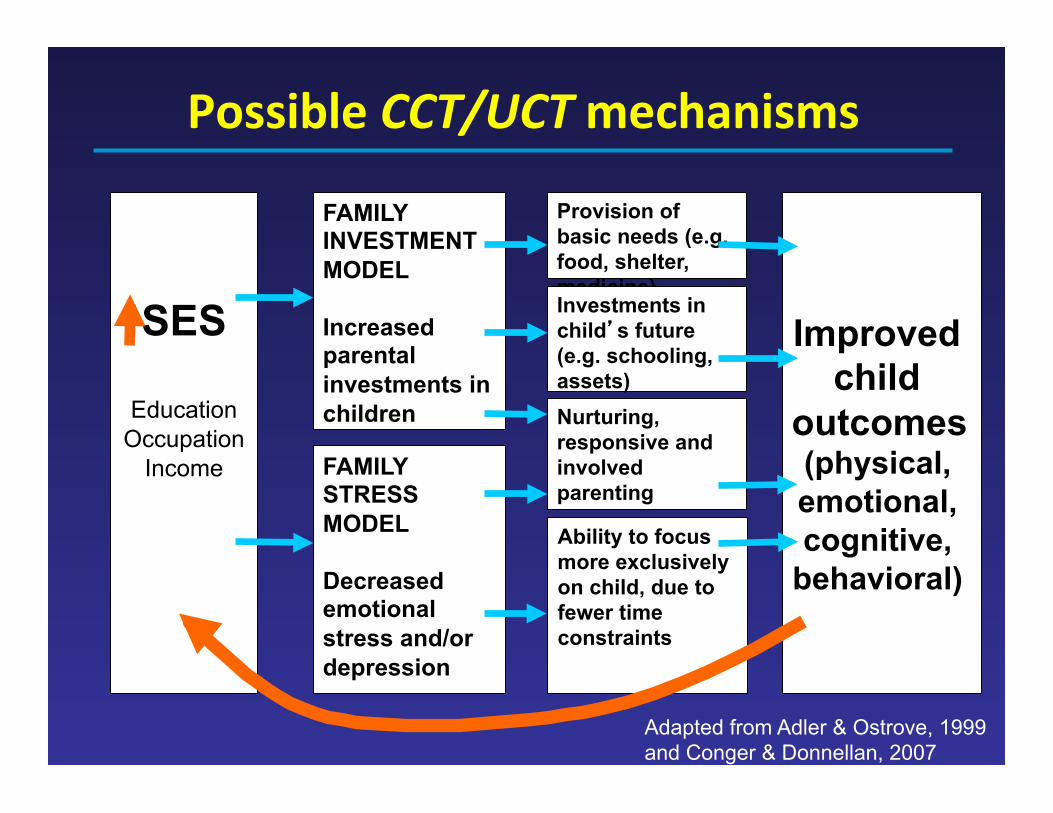
CCT/UCTs and child height
• Improvements in height – Rural Mexico (Behrman & HoddinoS, 2005; Fernald, Gertler, & Neufeld, 2009; Rivera, Sotres-‐Alvarez, Habicht, Shamah, Villalpando, 2004; Gertler, 2004)
– Urban Mexico (Leroy et al., 2008) – Nicaragua (Maluccio & Flores, 2005) – Colombia (ASanasio, BaKs/n, Fitzsimons, Mesnard & Vera-‐Hernández, 2005)
– South Africa [UCT] (Agüero, Carter, & Woolard, 2010)
• No improvements in height – Brazil (Morris, Olinto, Flores, Nilson, & Figueiró, 2004) – Honduras (Moore, 2008).

CCTs and child development Country & program Main findings
Mexico: Wide range in cash transferred to households (~$25-‐250 per month); Condi/ons strongly enforced
Cogni/on/language: No program effect, but posi/ve associa/on between outcomes and cumula/ve cash received by household [Fernald et al. 2009 & Fernald et al. 2008] Behavior: Main effect of program (10% reduc/on in behavior problems) and of cumula/ve cash [Fernald et al. 2009] School enrolment: Small (1%) reduc/ons in age entering school [Behrman et al. 2009]
Ecuador: Small cash transfer ($15/month); Condi/ons not enforced
Cogni/on/language/behavior: Small program effect in composite measure, in rural areas, in children (36-‐72 months) whose hhs are in boSom income quin/le [Paxson, Schady 2009]
Nicaragua: Small cash transfer ($35-‐70/month); Condi/ons enforced
Cogni/on/language/behavior: Program effect for 0-‐83 months in two areas (language and social development); larger in older children. [Macours et al. 2008]
Colombia: Variable size of transfer; not many program requirements
School enrolment: Very small (1-‐3%) increase in school enrolment for younger children. [ASanasio et al. 2009]

Study quesAons
• Use a randomized effec/veness trial in Ecuador (Bono de Desarrollo Humano, BDH) to ask: – Do young children (12-‐35 months old) benefit in health outcomes or language development if their families receive a cash transfer?
– Are there different effects of treatment in rural and urban areas (because of rural/urban differences in take-‐up rates, /ming of the interven/on, access to health facili/es, and livelihoods)?
– Through what pathways is the BDH opera/ng?
Today’s presentaAon
• Introduc/on: Early child development in developing countries, CCTs and UCTs
• Describing Ecuador’s UCT program (BDH) and evalua/on of program
• Effects of BDH on child development outcomes
• PuKng BDH results into context • Conclusions and next ques/ons

Overview of BDH
• Year started: 2003 • Target popula/on: Households with children 0-‐16 years old in the poorest 2 quin/les
• Targe/ng method: Proxy means tes/ng • Coverage: 40% of popula/on • Benefit structure: $15 per month per family • Payee: Women • Payment method: Can be collected at any branch office from largest network of private banks
• Payment frequency: Monthly
Source: Fiszbein & Schady, The World Bank, 2009
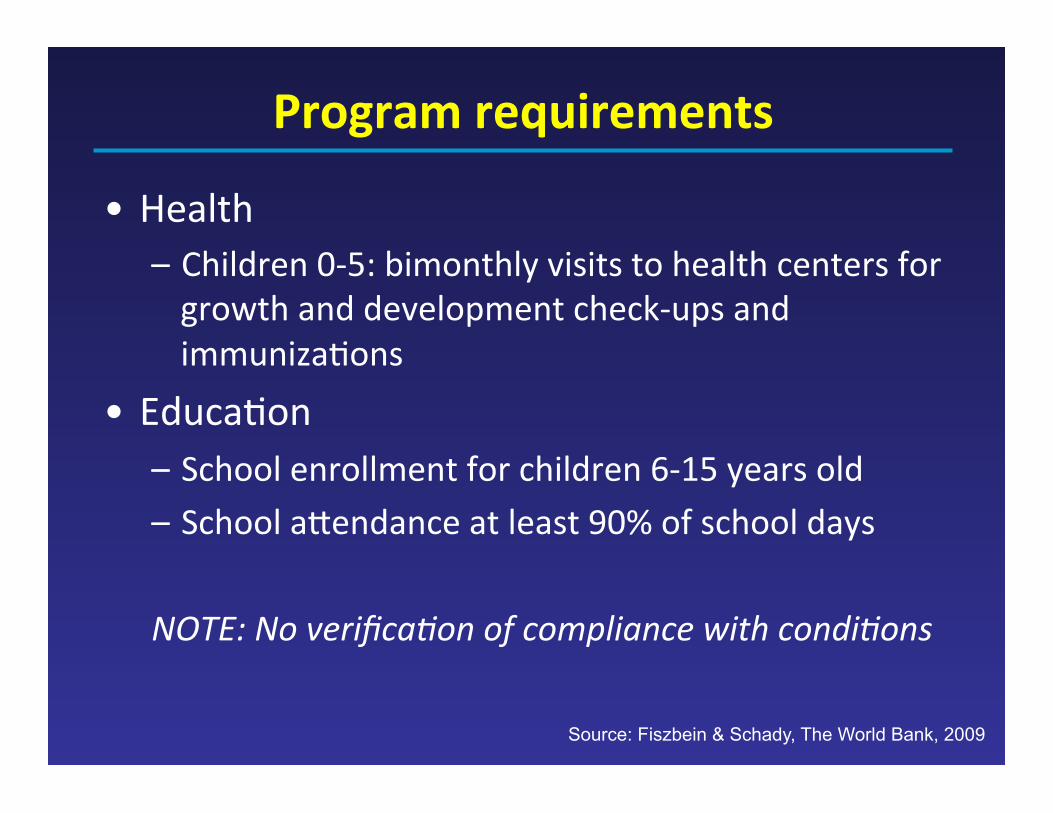
Program requirements
• Health – Children 0-‐5: bimonthly visits to health centers for growth and development check-‐ups and immuniza/ons
• Educa/on – School enrollment for children 6-‐15 years old – School aSendance at least 90% of school days
NOTE: No verifica)on of compliance with condi)ons
Source: Fiszbein & Schady, The World Bank, 2009
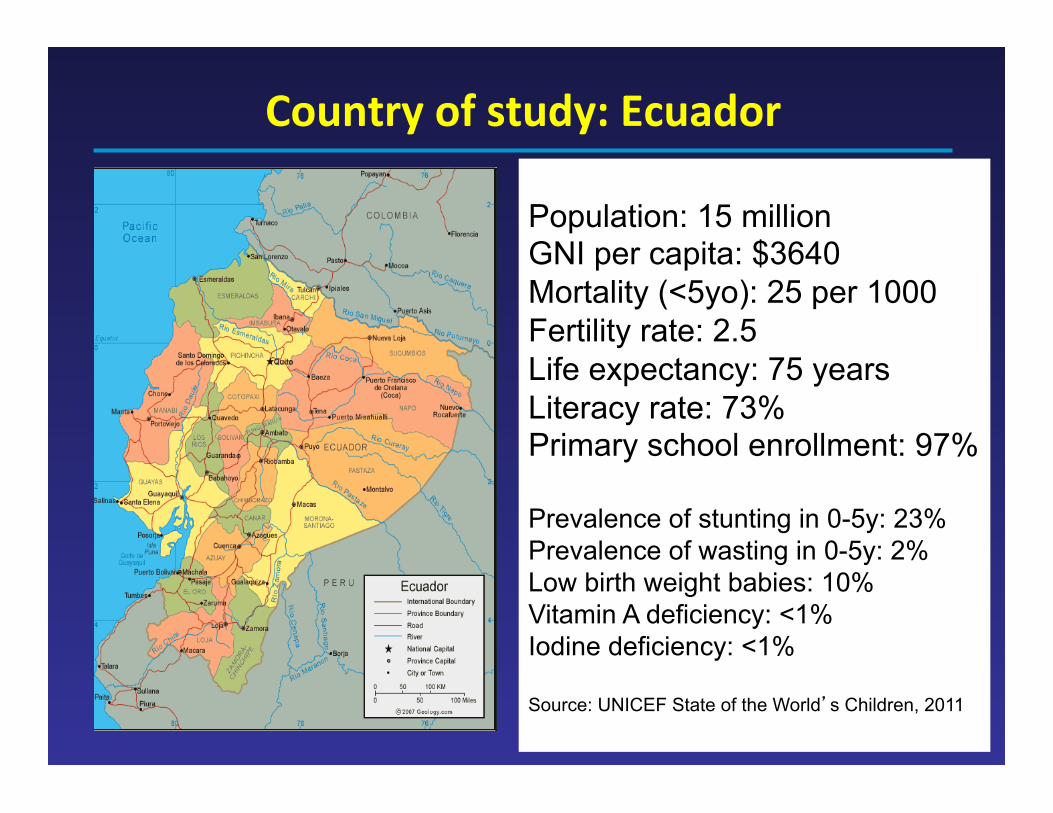
Country of study: Ecuador
Population: 15 million GNI per capita: $3640 Mortality (<5yo): 25 per 1000 Fertility rate: 2.5 Life expectancy: 75 years Literacy rate: 73% Primary school enrollment: 97% Prevalence of stunting in 0-5y: 23% Prevalence of wasting in 0-5y: 2% Low birth weight babies: 10% Vitamin A deficiency: <1% Iodine deficiency: <1% Source: UNICEF State of the World’s Children, 2011
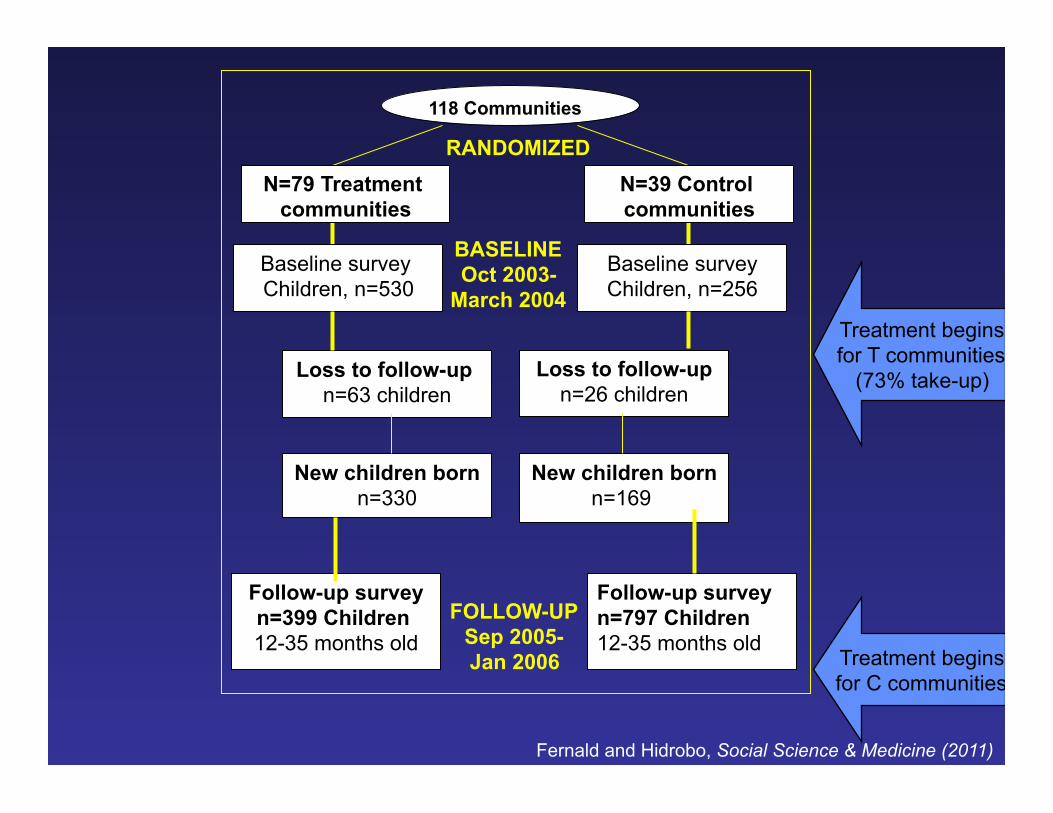
118 Communities
Baseline survey Children, n=530
Baseline survey Children, n=256
Loss to follow-up n=63 children
New children born n=330
Loss to follow-up n=26 children
Follow-up survey n=399 Children 12-35 months old
RANDOMIZED
BASELINE Oct 2003-
March 2004
N=79 Treatment communities
N=39 Control communities
FOLLOW-UP Sep 2005- Jan 2006
New children born n=169
Follow-up survey n=797 Children 12-35 months old
Fernald and Hidrobo, Social Science & Medicine (2011)
Treatment begins for T communities
(73% take-up)
Treatment begins for C communities

House to house interviews in 2005-‐6

Child outcomes
• Growth – Height-‐for-‐age z score (HAZ)
• Health – Anemia / hemoglobin (finger prick with Hemocue)

Child language tesAng
Language: MacArthur-Bates Communicative Inventory (CDI) for infants and toddlers (older children also assessed with Test de Vocabulario de Imagenes Peabody (spanish PPVT)

MacArthur Inventory
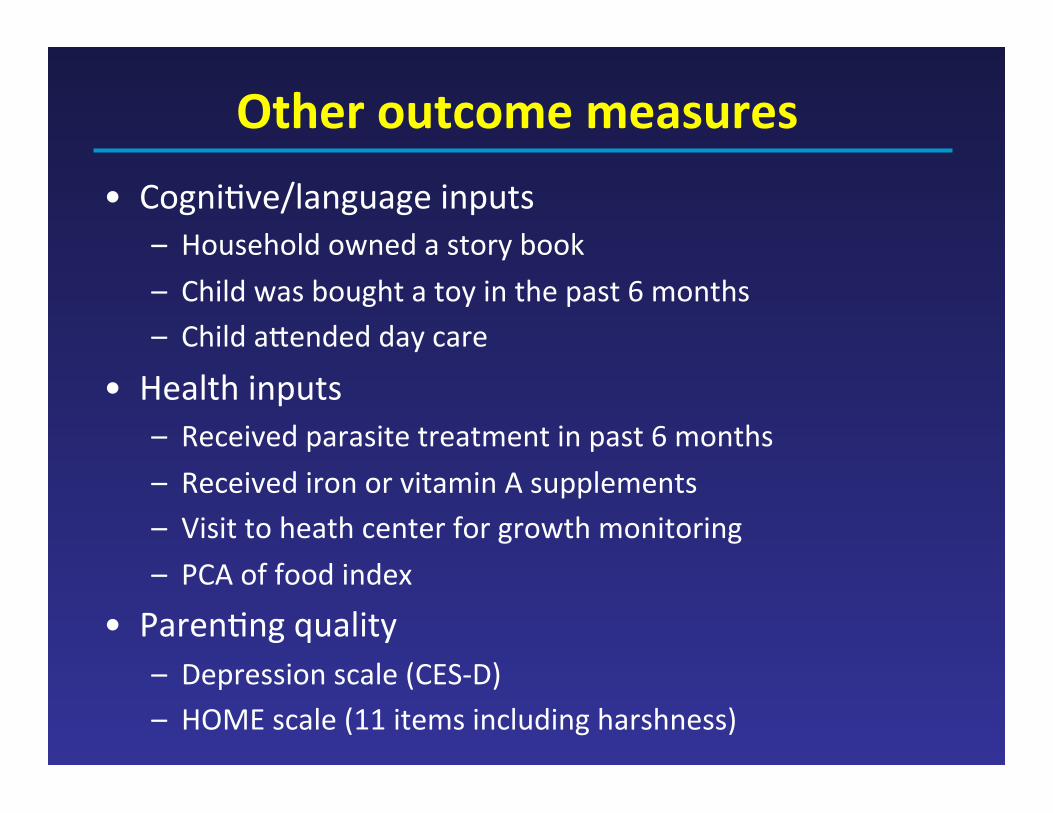
Other outcome measures • Cogni/ve/language inputs
– Household owned a story book – Child was bought a toy in the past 6 months – Child aSended day care
• Health inputs – Received parasite treatment in past 6 months – Received iron or vitamin A supplements – Visit to heath center for growth monitoring – PCA of food index
• Paren/ng quality – Depression scale (CES-‐D) – HOME scale (11 items including harshness)

Covariates: child, mom, household
• Child’s age and sex • Mother’s age • Mom’s marital status • Mom’s years of educa/on • Household asset index • Whether mother speaks indigenous language • Number of children 0-‐5 years old living in the household

Today’s presentaAon
• Introduc/on: Early child development in developing countries, CCTs and UCTs
• Describing Ecuador’s UCT program (BDH) and evalua/on of program
• Effects of BDH on child development outcomes
• PuKng BDH results into context • Conclusions and next ques/ons

Loss at follow-‐up Included (N=697)
Lost at follow-‐up (N=89)
p value*
Mother’s age 22.8 (3.9) 22.3 (3.1) 0.26
Mother’s educaAon 7.0 (2.8) 7.1 (3.3) 0.92
Mother has spouse 83% 80% 0.5
Indigenous language 2% 2% 0.96
No. children 0-‐5y 2.4 (0.7) 2.5 (0.8) 0.28
Urban 47% 52% 0.41
Asset index 0.1 (2.3) -‐0.2 (2.3) 0.60
Child is male 52% 56% 0.43
Child height-‐for-‐age -‐0.6 (2.1) -‐0.3 (2.1) 0.32
Child hemoglobin 9.6 (1.4) 9.8 (1.8) 0.55
* p values for cluster-adjusted t test or chi squared tests of independence Fernald and Hidrobo (2011)

Balance at Baseline Comparison (n=399)
Treatment (n=797)
p value*
Mother’s age 22.5 (3.5) 22.7 (4.0) 0.45
Mother’s educaAon 6.8 (3.0) 7.0 (2.8) 0.70
Mother has spouse 84% 83% 0.47
Indigenous language 4% 2% 0.52
No. children 0-‐5y 2.1 (0.9) 2.1 (0.8) 0.84
Urban 44% 46% 0.64
Asset index 0.01 (2.34) -‐0.01 (2.27) 0.96
Had a child a_er baseline 42% 41% 0.75
Mother’s hemoglobin levels 11.2 (1.5) 11.4 (1.5) 0.43
* p values for cluster-adjusted t test or chi squared tests of independence ** Asset index includes: blender, refrigerator, gas heater, hot-water heater, radio, stereo, TV, video, washer, fan, car, and van.. Fernald and Hidrobo (2011)
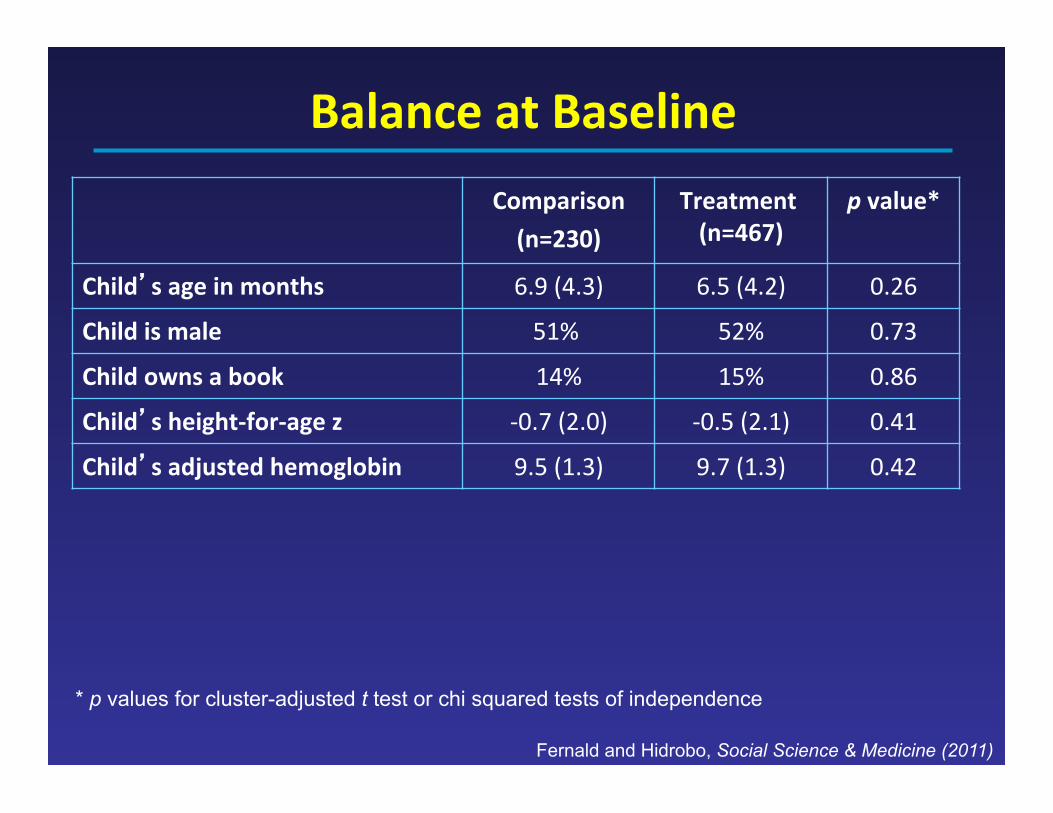
Balance at Baseline Comparison (n=230)
Treatment (n=467)
p value*
Child’s age in months 6.9 (4.3) 6.5 (4.2) 0.26
Child is male 51% 52% 0.73
Child owns a book 14% 15% 0.86
Child’s height-‐for-‐age z -‐0.7 (2.0) -‐0.5 (2.1) 0.41
Child’s adjusted hemoglobin 9.5 (1.3) 9.7 (1.3) 0.42
* p values for cluster-adjusted t test or chi squared tests of independence
Fernald and Hidrobo, Social Science & Medicine (2011)

Effect of BDH on child outcomes Total sample Rural sample Urban sample
Language score (Macarthur IDHC-‐B)
2.4 (-‐1.0, 5.9) 5.2* (1.3, 9.2) -‐0.9 (-‐6.8, 5)
Probability that child combines words
0.08 (-‐0.02, 0.2) 0.1* (0.02, 0.3) 0 (-‐0.1, 0.1)
Height-‐for-‐age z score
0.01 (-‐0.2, 0.2) -‐0.09 (-‐0.4, 0.2) 0.1 (-‐0.1, 0.4)
Hemoglobin levels
0.04 (-‐0.2, 0.3) 0.1 (-‐0.3, 0.5) -‐0.1 (-‐0.4, 0.2)
Robust standard errors clustered at the parish level. *p < 0.05. All specifica/ons control for a child’s age and sex, mother’s age, marital status, years of educa/on, an indicator for whether the mother speaks an indigenous language, the number of children younger than 5 years old, and a household’s asset index. OLS regressions conducted for language score (IDHC-‐B), HAZ, and hemoglobin level outcomes. Probit regression conducted for combining words outcome.
Fernald and Hidrobo (2011)

Effect of BDH on mediaAng variables Total sample Rural sample Urban sample
Bought toy 0.06 0.09* 0.03
Own book -‐0.06 -‐0.07 -‐0.01
Day care 0.03 0.05 0.01
Growth check-‐up 0.02 0.07+ -‐0.05
Vitamin A or iron 0.04 0.11** -‐0.04
Parasite tmt 0 0.01 -‐0.02
Food index 0.09 0.2 -‐0.03
Harsh paren/ng 0.21 -‐0.5 1.06
Mom depress 0.71 0.26 1.16 Robust standard errors clustered at the parish level. **p < 0.01, *p < 0.05, +p < 0.1. All specifica/ons control for a child’s age and sex, mother’s age, marital status, years of educa/on, an indicator for whether the mother speaks an indigenous language, the number of children younger than 5 years old, and a household’s asset index. OLS regressions conducted for language score (IDHC-‐B), HAZ, and hemoglobin level outcomes. Probit regression conducted for combining words outcome.
Fernald and Hidrobo (2011)
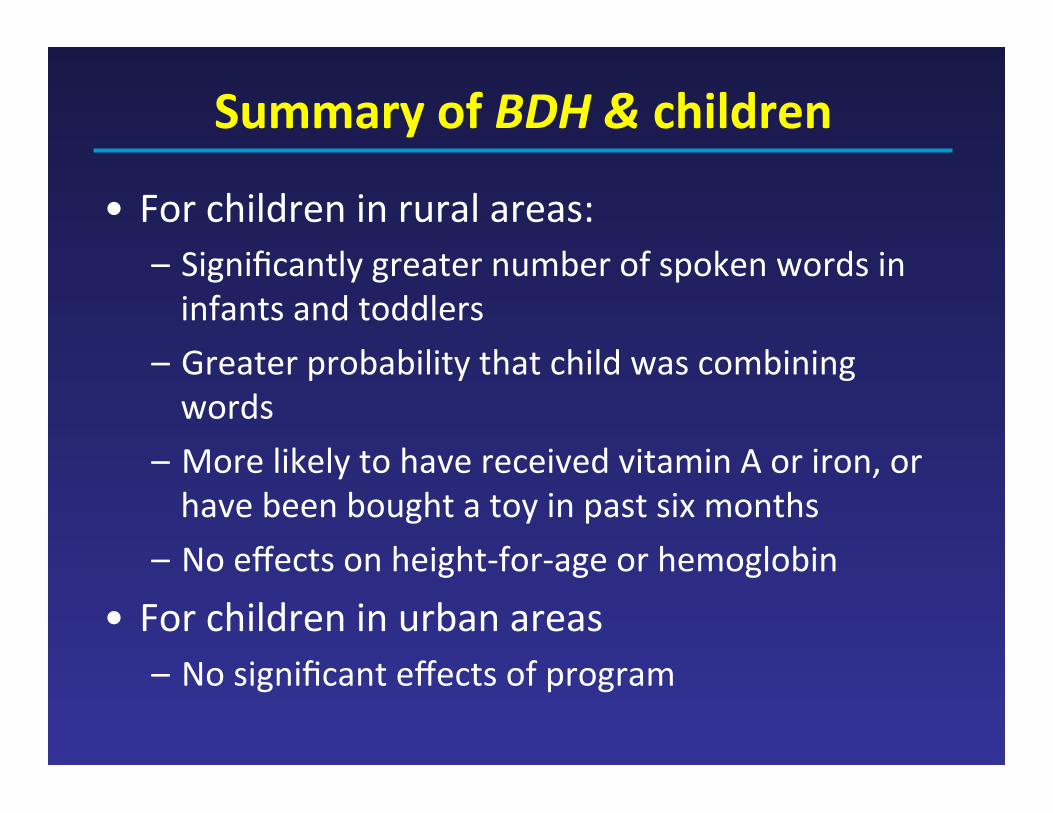
Summary of BDH & children
• For children in rural areas: – Significantly greater number of spoken words in infants and toddlers
– Greater probability that child was combining words
– More likely to have received vitamin A or iron, or have been bought a toy in past six months
– No effects on height-‐for-‐age or hemoglobin
• For children in urban areas – No significant effects of program

Today’s presentaAon
• Introduc/on: Early child development in developing countries, CCTs and UCTs
• Describing Ecuador’s UCT program (BDH) and evalua/on of program
• Effects of BDH on child development outcomes
• PuKng BDH results into context • Conclusions and next ques/ons

Why only effects in rural areas?
• Program take-‐up higher in rural areas – 85% take-‐up in rural v. 59% take-‐up in urban
• Rural received program 5 months before urban – Mean amount received: $336 (rural) v. $225 (urban)
• Rural households poorer than urban – Asset index: -‐0.53 in rural v. 0.64 in urban
• Mother’s educa/on lower in rural – Rural v. Urban (69% v. 52%) have no educa/on. – In rural areas the treatment effect was even bigger for moms with less then 7 years of schooling

Why are effects so small?
• Ecuador’s program has lowest cash transfer amount (6-‐10% baseline income) when compared with Mexico’s Oportunidades (22%) or Nicaragua’s Red de Protecion Social (29%)
• Considered “condi/onal” by only 25% of popula/on – When analyzed effect of BDH by belief of condi/onality, there was a significant effect of program on height-‐for-‐age
• Program not focused on improving early child development

Today’s presentaAon
• Introduc/on: Early child development in developing countries, CCTs and UCTs
• Describing Ecuador’s UCT program (BDH) and evalua/on of program
• Effects of BDH on child development outcomes
• PuKng BDH results into context • Conclusions and next ques/ons

How do we make effects bigger for BDH?
• Increase parental involvement and engagement during early childhood
• Encourage investment and par/cipa/on in paren/ng programs
• Make preschool par/cipa/on part of package of condi/onali/es
• Increase cash transfer

Only 1-3 activities with children in past 3 days for poorer income quintiles
Mother
Father 0-1 activities with children in past 3 days for poorer income quintiles
Engle, Fernald et al, The Lancet (2011)
Parental involvement

• Interven/ons can: – Promote parent-‐child interac/ons
– Improve responsive feeding
– Increase aSachment – Encourage learning, book reading, play ac/vi/es
– Encourage posi/ve discipline
– Promote beSer problem solving related to child development
ParenAng programs: summary
Engle, Fernald et al, The Lancet (2011)

• Preschool aSendance was associated with: – Higher scores on one or more measures of child development (e.g. literacy, vocabulary, mathema/cs, quan/ta/ve reasoning, behavior)
Center based intervenAons: summary
Engle, Fernald et al, The Lancet (2011)

Evidence about importance of cash -.
4-.
20
.2.4
Pop
ulat
ion-
stan
dard
ized
z-s
core
s
0 50000 100000 150000Accumulated cash transfers (Mexican pesos)
Verbal sub-scale (WASI) Cognitive sub-scale (WASI)Behavior problems (SDQ)
Fernald, Gertler, Neufeld, The Lancet (2009)

Future research quesAons • How can condi/onal cash transfer programs be most effec/vely combined with other programs (e.g. paren/ng or preschool) to support a young child’s development and nutri/on?
• What possibili/es exist for enhancing CCT programs with the use of media, such as television, radio, and mobile telephones for improving paren/ng and child outcomes?
• What are the key differences in effec/veness when comparing a CCT with a “pure” cash transfer?
• What is the best size of the cash transfer in a CCT program to maximize child outcomes?
• How can the most vulnerable children in a household and/or community be targeted in a CCT?

Acknowledgements • We gratefully acknowledge the collabora/on and
contribu/ons of: – Norbert Schady and Caridad Araujo, both formerly at the World Bank
and now at the Inter-‐American Development Bank; – Chris/na Paxson (Princeton University) – Rekha Balu, Ryo Shiba, and Lisa Vura-‐Weis for research assistance; – Virginia Marchman for assistance with the language acquisi/on
instrument. • We are grateful to our Ecuadorian collaborators at the
Programa de Proteccion Social (formally Secretaría Técnica del Frente Social) in Ecuador, and thank: – San/ago Izquierdo – Mauricio León – Ruth Lucio – Juan Ponce – José Rosero – Yajaira Vázquez.
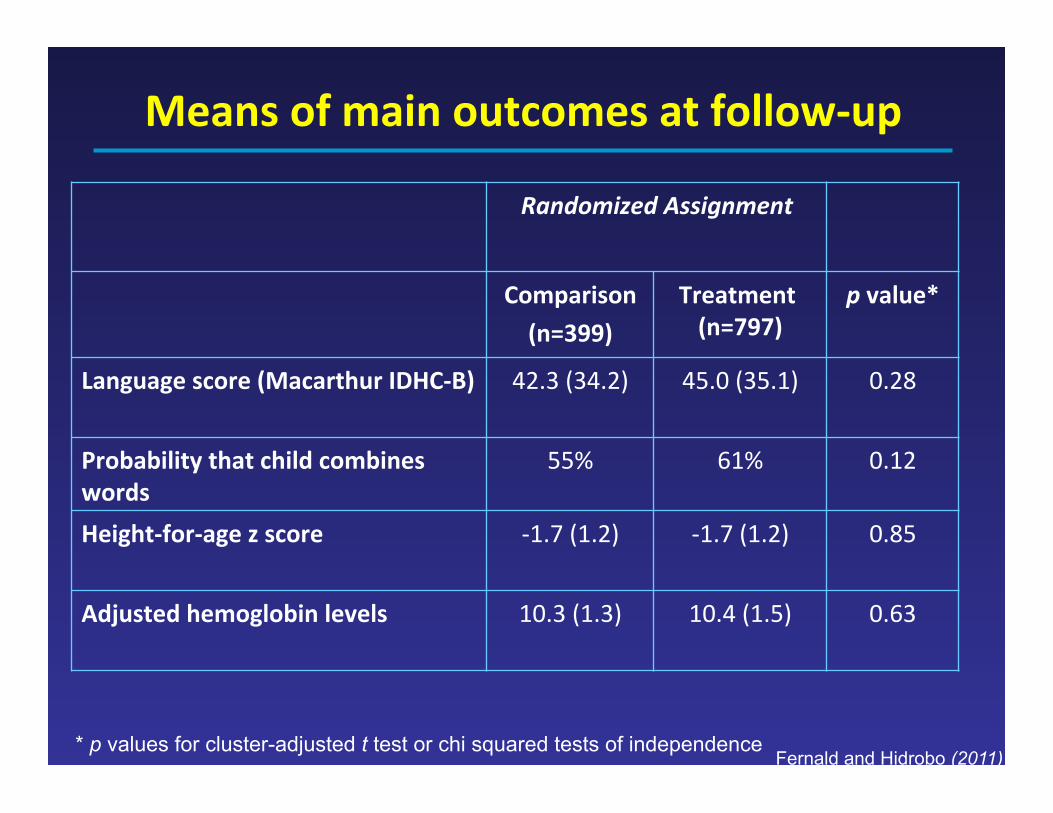
Means of main outcomes at follow-‐up
Randomized Assignment
Comparison (n=399)
Treatment (n=797)
p value*
Language score (Macarthur IDHC-‐B)
42.3 (34.2) 45.0 (35.1) 0.28
Probability that child combines words
55% 61% 0.12
Height-‐for-‐age z score
-‐1.7 (1.2) -‐1.7 (1.2) 0.85
Adjusted hemoglobin levels
10.3 (1.3) 10.4 (1.5) 0.63
* p values for cluster-adjusted t test or chi squared tests of independence Fernald and Hidrobo (2011)

Means of mediaAng variables at follow-‐up
Randomized Assignment
Comparison (n=399)
Treatment (n=797)
p value*
Child was bought toy (6 mo) 42% 48% 0.17
Hh owns children’s book 38% 32% 0.22
Child aSended day care 30% 33% 0.60
Child had growth check-‐up 49% 51% 0.66
Child received vitamin A or iron 34% 38% 0.36
Child had parasite treatment 45% 45% 0.98
Food index -‐0.1 (1.5) 0.0 (1.5) 0.62
Harsh paren/ng HOME score 2.5 (2.4) 2.7 (2.6) 0.56
Maternal depressive symptoms 18.9 (10.6) 19.6 (11.1) 0.44
* p values for cluster-adjusted t test or chi squared tests of independence Fernald and Hidrobo (2011)