CDSB Framework Application guidance for biodiversity ...
94
November 2021 cdsb.net/biodiversity CDSB Framework Application guidance for biodiversity-related disclosures
Transcript of CDSB Framework Application guidance for biodiversity ...

November 2021cdsb.net/biodiversity
CDSB Framework
Application guidance for biodiversity-related disclosures

About the Climate Disclosure Standards Board

3 CDSB Framework 3 CDSB Framework | Application guidance for biodiversity-related disclosures
The Climate Disclosure Standards Board (CDSB) is an international consortium of business and environmental NGOs. We are committed to advancing and aligning the global mainstream corporate reporting model to equate natural and social capital with financial capital.
We do this by offering companies a framework for reporting environmental and social information with the same rigour as financial information. In turn this helps them to provide investors with decision-useful environmental information via the mainstream corporate report, enhancing the efficient allocation of capital. Regulators have also benefited from CDSB’s compliance-ready materials.
Copyright © 2021 Climate Disclosure Standards Board (CDSB) and CDP Worldwide. All rights reserved.
Dissemination of the contents of this report is encouraged. Please give full acknowledgement of the source when reproducing extracts in other published work. All information in this report is provided without warranty of any kind, express or implied. The authors disclaim any responsibility for the information or conclusions in this report. The authors accept no liability for any loss arising from any action taken or refrained from being taken as a result of information contained in this report.
Recognising that information about natural, social and financial capital is equally essential for an understanding of corporate performance, our work builds trust and transparency needed to foster resilient capital markets. Collectively, we aim to contribute to more sustainable economic, social and environmental systems.
For more information, visit cdsb.net, follow us on Twitter, LinkedIn and YouTube and subscribe to our newsletter. Visit the TCFD Knowledge Hub for free e-learning online courses.
We welcome your input and discussions. If you would like to comment on this document, please contact us at [email protected].

4 CDSB Framework 4 CDSB Framework | Application guidance for biodiversity-related disclosures
CDSB would like to thank the members of the CDSB Technical Working Group on Biodiversity-related disclosures for their guidance and feedback on the content of this publication.
• Robert Adamczyk, European Bank for Reconstruction and Development (EBRD)
• Jonas Aechter, WWF
• Louise Amand, Capitals Coalition
• Alexandra Antsuga, European Bank for Reconstruction and Development (EBRD)
• Simon Armstrong, Simon Armstrong and Associates
• Faye Bennett-Hart, Rio ESG
• Scarlett Benson, SYSTEMIQ/Food and Land Use Coalition
• Sam Bower, Balfour Beatty
• Lyndall Bull, PhD, Independent
• Maria Ana Campos, WBCSD
• Rodrigo Cassola, UNEP-WCMC
• Siobhan Cleary, Science Based Targets Network (SBTN)
• Celia Cole, Sainsbury’s
• James Dalton, PhD, IUCN
• Paul Dhillon, NetZero Globe Ltd
• Charlie Dixon, Vivid Economics
• Rosie Dunscombe, Independent
• Rob Evans, Earth Active
• John Finisdore, Point Advisory
• Charlotte Gardes, Paris II-Assas University
• Marcelo Gonçalves de Lima, Independent
• Mark Gough, Capitals Coalition
• Annelisa Grigg, Global Balance
• Stephanie Hime, PhD, Little Blue Research
• Joel Robert Houdet, Endangered Wildlife Trust
• Andre Jakobs, ABN AMRO
• Gemma James, UN PRI
• Johan Lammerant, Arcadis
• Joanne Lee, WWF International
• Linda Lowson, Esq., Global ESG Financial Regulatory Institute
• Thomas Maddox, CDP
• Nadine McCormick, WBCSD
• Samantha McCraine, Science Based Targets Network
• Emily McKenzie, Independent Dasgupta Review team
• Rebecca Nohl, PhD. SYSTEMIQ
• Amy O’Dwyer, Davy
• Matt Orsagh , CFA Institute
• Ellen Osborne, Rio ESG
• Jo Paisley, Global Association of Risk Professionals
• Rajat Panwar, PhD, Appalachian State University
• Nicole Pasricha, Deep Science Ventures
• Tim Polaszek, Capitals Coalition
• Juliette Pugliesi, Science Based Targets Network
• Jonas Rooze, BloombergNEF
• Oscar Sabag, Science Based Targets Network
• Leah Samberg, Rainforest Alliance
• Marta Santamaria, Capitals Coalition
• Kim Schumacher, PhD, Tokyo Institute of Technology
• Robyn Seetal, IkTaar Sustainability
• Viera Ukropcova, CDP
• Gabriel Thoumi, CFA, FRM, Certified Ecologist, Planet Tracker
• Caroline van Leenders, The Netherlands Enterprise Agency
• Varun Vats, Syngenta Group
• Yann Verstraeten, ICF
• Thomas Viegas, Independent
• Ellie Walshe, Davy Horizons
• Lucy Watkinson, HM Treasury, UK
CDSB would also like to thank the organisations and individuals that responded to the public consultation.

ContentsAbout the Climate Disclosure Standards Board 03
Chapter 1 About this guidance
1. Structure of the Biodiversity Application Guidance 08
2. The CDSB Framework and background to the Biodiversity Application Guidance 09
2.1 CDSB Framework 09
2.2 Background to the Biodiversity Application Guidance 09
3. Mainstreaming biodiversity reporting 10
Chapter 2 Biodiversity and business 1. The importance of biodiversity to business and society 14
2. Business and biodiversity interactions 17
2.1 Impact and dependencies 17
2.2 Risks and opportunities 18
3. Key Characteristics 20
Chapter 3 Application guidance for biodiversity-related disclosures 1. Reporting expectations and important considerations 24
1.1 Applying materiality 24
1.2 Providing contextualised and business-specific biodiversity-related information 25
1.3 Disclosing information in a changing landscape 26
1.4 Reporting boundaries and period 26
1.5 Using existing disclosures and resources, and ensuring connectivity 27
2. Roadmap and checklist for biodiversity-related disclosures 27
3. Biodiversity Application Guidance 30
REQ-01 Governance 30
1. Governance arrangements and rationale 30
2. Information flows and oversight 30
3. Stakeholder engagement and cooperation 31
4. Incentivisation 32
5. Specificity of bioversity governance 32
REQ-02 Management’s environmental policies, strategy and targets 33
1. Providing the context for biodiversity policy, strategy, and targets 33
2. Policies and strategies 39
3. Management responses 40
4. Targets and timelines 43
5. Resourcing 44

REQ-03 Risks and opportunities 48
1. Detailing risks and opportunities 52
2. Quantification of financial risks and opportunities 53
3. Connecting information 54
REQ-04 Sources of environmental impact 57
1. Indicators and metrics 57
2. Contextualising biodiversity-related metrics 64
3. Decision-useful information 64
4. Disaggregation and categorisation 64
5. Rationale of selection and methodological details 65
REQ-05 Performance and comparative analysis 68
REQ-06 Outlook 71
1. Scenario analysis 72
2. Methods, assumptions and uncertainties 72
3. Iteration and learning 73
4. Basis for conclusions 74
Chapter 4 Appendices 1. CDSB Framework – Guiding principles and reporting requirements 76
2. CDSB materiality approach 77
3. Mapping the CDSB requirements to TCFD and biodiversity reporting standards 79
4. Definitions 80
5. Key CDSB resources 82
6. Common examples of biodiversity impacts drivers and changes to the state of biodiversity 83
7. Key initiatives 84
8. Tools, models and frameworks supporting the assessment and quantification of biodiversity impacts 86
9. Databases that may be useful for identifying risk areas (REQ-03), measuring impact (REQ-04) or monitoring performance (REQ-05) 88
10. Mapping the Pathway approach and DPSIR framework 88

About this guidance
Chapter 1

8 CDSB Framework 8 CDSB Framework | Application guidance for biodiversity-related disclosures
The CDSB Framework application guidance for biodiversity-related disclosures (the Biodiversity Application Guidance) has been produced by CDSB to assist companies in the disclosure of the material information about the risks and opportunities that biodiversity presents to an organisation’s strategy, financial performance and condition within the mainstream report (biodiversity-related financial disclosure).i It is designed to supplement the CDSB Framework for reporting environmental and climate change information to investors (CDSB Framework)1 (see Appendix 1).
1. Structure of the Biodiversity Application GuidanceThe Biodiversity Application Guidance is designed around the first six reporting requirements of the CDSB Framework (App. 1):
• REQ-01 Governance
• REQ-02 Management’s environmental policies, strategies and targets
• REQ-03 Risks and opportunities
• REQ-04 Sources of environmental impact
• REQ-05 Performance and comparative analysis
• REQ-06 Outlook
The first six reporting requirements set out the key content elements for reporting material environmental information in the mainstream report. For each of the reporting requirements, the Biodiversity Application Guidance provides:
• A checklist including suggestions for effective biodiversity-related disclosures;
• Detailed reporting suggestions and guidance in relation to biodiversity-related issues to complement the CDSB reporting requirements;
• A selection of external resources to assist companies in developing their mainstream biodiversity reporting (see Useful Resources under each requirement and Appendices 5-9); and
• Explained examples of good practice in mainstream biodiversity reporting.
In addition, the Biodiversity Application Guidance provides an overview of the significance of biodiversity to business, explaining the importance of biodiversity-related business risks and opportunities, and highlighting the key characteristics of biodiversity and their importance to corporate reporting (see Business and Biodiversity).
To ensure connectedness and coherence between the Biodiversity Application Guidance and existing reporting frameworks and standards, it is important to align to widely accepted definitions for key concepts and terms. The following definitions apply throughout the Guidance:
• Biodiversity: The diversity of life in all its forms, including the diversity of species, genetic variations within species, and of ecosystems.2
• Species: A group of individuals that actually or potentially interbreed and produce fertile offspring.3
• Ecosystem: A dynamic complex of plants, animals, and microorganisms, and their non-living environment.4
• Ecosystem services: The flows of benefits ecosystems provide to people.5 See Box 1 for further discussion of the definition of ecosystem services, including final ecosystem services.
• Natural Capital: The stock of renewable and non-renewable natural resources (e.g. plants, animals, air, water, soils, minerals) that combine to yield a flow of benefits to people (ecosystem services).6
• Biodiversity impact: a change in the diversity of ecosystems and/or species that may take place because of business activities. Changes to the state of ecosystems (e.g. extent and condition/integrity) and species (e.g. habitat, population size) can be used to signal changes in biodiversity.
• Biodiversity dependency: a reliance on or use of biodiversity, including biological resources (e.g. materials, liquids, genetic resources) from both
i Mainstream reports (e.g. general purpose financial report and mainstream financial report) are the annual reporting packages in which companies are required to deliver their audited financial results under the corporate, compliance or securities laws of the country in which they operate, e.g. the annual report in the UK and the 10-K in the USA.

9 CDSB Framework 9 CDSB Framework | Application guidance for biodiversity-related disclosures
revised CDSB Framework currently under consultation does not substantively amend the reporting principles and requirements and nor is it expected the final version will. This application guidance should therefore remain wholly complementary with any potential amendments to the CDSB Framework.
The CDSB Framework represented one of the main resources from which the recommendations of the Task Force on Climate-related Financial Disclosure (TCFD),8 published in 2017, were drawn. Therefore, the CDSB Framework and its reporting principles and requirements (Appendix 1) are aligned with the TCFD recommendations (Appendix 3). TCFD has advanced the narrative on organisational board-level financial and risk management considerations of environmental impacts to the business, particularly those likely to result from climate change.
2.2 Background to the Biodiversity Application GuidanceThe Biodiversity Application Guidance is part of a series of CDSB Framework application guidance, which aims to extend the TCFD recommendations and its core elements to nature. It is designed to support the intended users in applying the CDSB Framework to the natural capital elements of climate change, water, and biodiversity. Following the guidance on climate-related and water-related disclosures, the Biodiversity Application Guidance is the third CDSB Framework supplementary application guidance document that is designed to enhance the quality of disclosures for such significant matters. Working in conjunction with the reporting principles and requirements of the CDSB Framework, each application guidance assists companies to develop clear, concise, consistent, and comparable (inter-period comparability of the same entity and inter-entity comparability) disclosures, enhancing the decision-usefulness of their mainstream reporting on sustainability-related financial matters to investors. Given the interconnected nature of environmental topics, the application guidance documents are complementary with some overlapping sub-topics (Figure 1).
species and interactions with various ecosystem processes and services (e.g. pollination, water filtration, crop pest/disease control or water flow regulation).7
• Value chain: An organisation’s direct operations, upstream activities and downstream activities. Direct operations cover activities over which the organisation has direct control, upstream activities cover the activities of suppliers and downstream activities are those linked to the purchase, use, re-use, recovery, recycling and final disposal of the organisation’s products and services.ii
Appendix 4 contains the full list of definitions of the key terms used throughout the Biodiversity Application Guidance.
2. The CDSB Framework and background to the Biodiversity Application Guidance
2.1 CDSB FrameworkThe CDSB Framework is focused on reporting material environmental information (see Appendix 2) in mainstream reports to investors. This builds directly on the International Accounting Standard Board’s (IASB’s) Conceptual Framework, applying financial reporting principles to environmental and climate change information. CDSB’s Framework has evolved over time, with the first version, the Climate Change Reporting Framework, released in 2010, focused on the risks and opportunities that climate change presents to an organisation’s strategy, financial performance, and condition. In 2013, CDSB’s Board agreed to expand the scope of the Framework beyond climate change and Greenhouse Gas (GHG) emissions to encompass environmental information and natural capital, with this revision published in 2015. At the time of writing, CDSB is working to further expand the scope of the Framework to cover both environmental and social information. The
The Biodiversity Application Guidance considers terrestrial and aquatic biodiversity at the speciesiii and ecosystem levels, as well as the ecosystem services underpinned by biodiversity.
ii Adapted from: Capitals Coalition (2016) Natural Capital Protocol. Available from: https://naturalcapitalcoalition.org/natural-capital-protocol/
iii Including both diversity within (genetic) and among species

10 CDSB Framework 10 CDSB Framework | Application guidance for biodiversity-related disclosures
The objective of the Biodiversity Application Guidance is to support organisations in preparing high-quality disclosures that enable users of mainstream reports to assess material biodiversity-related financial information. By ensuring that investors are receiving the material biodiversity-related information
3. Mainstreaming biodiversity reportingWith a growing understanding of the significant risks that changes to natural capital can pose to the stability of the financial system and to broader society, an increasing number of regulators are prioritising environmental disclosure.iv Whilst most literature on financial risks related to natural capital has focused on
climate change, there is a growing awareness of the risks associated with other aspects of natural capital, such as water stress and the loss of biodiversity.9, 10, 11
The risks resulting from a loss of nature have the potential to disrupt both society and the stability of the financial system, with more than 50% of global gross domestic product (USD 44 trillion) being moderately or highly dependent
Figure 1. The relationship of the CDSB Framework for reporting environmental and climate change information, the Biodiversity Application Guidance and other guidance in the series. The dashed lines between Application Guidance documents illustrate their interconnected nature and the presence of overlapping topics.
(Appendix 2) needed for effective capital allocation, the Biodiversity Application Guidance aims to assist in driving the transition to a sustainable and resilient economy. The intended users are organisations, both single companies and corporate groups, and those responsible for financial, governance and sustainability reporting.
iv For example, EU initiatives related to the Corporate Sustainability Reporting Directive, to the EU Taxonomy Regulation, and to the Sustainable Finance Disclosure Regulation, the announcement of mandatory adoption of TCFD by national regulators (e.g. New Zealand, UK, Hong Kong, Switzerland), or developments and publications by the IFRS and FASB.
Biodiversity-climate nexus
(e.g. habitat loss due to deforestation and related GHG emissions; changes in migration routes and timing due
changes in temperatures)
Biodiversity-water nexus
(e.g. impacts on biodiversity due to water scarcity, pollution, or higher
water temperatures)
Climate-water nexus
(e.g. physical risks - water scarcity and sea level rise)
CDSB Framework for reporting environmental & climate change information
Application guidance for climate-related disclosures
Application guidance for biodiversity-related disclosures
Application guidance for water-related disclosures
CDSB Framework
11 CDSB Framework 11 CDSB Framework | Application guidance for biodiversity-related disclosures
on nature and the goods and services it provides and over 2.1 billion jobs relying on effective management and sustainability of ecosystems.12, 13 For example, the documented decline in insect populations puts at risk the USD 235 – 577 billion of crop production that is dependent on pollination;14 and deforestation and land degradation cost as much as USD 6.3 trillion a year through their impact on forest and agricultural productivity.15 As the Dasgupta Review on the Economics of Biodiversity makes clear, all human activity ultimately depends on ecosystems; our economies are embedded in nature, not external to it.16
The finance sector is indirectly exposed to business biodiversity-related risks through loans, investments, and underwriting activities,17, 18 yet it also plays a key and growing role in achieving biodiversity targets through catalysing behaviour changes and influencing economic pathways, business models and practices.19 Reacting to this, investors are increasingly engaging with investees on biodiversity-related risks.20, 21 For example, many banks have enhanced due diligence processes when financing assets located in protected or sensitive areas, financial institutions are exploring how to measure the biodiversity impact of their portfolios22, 23, 24, 25 and rating agencies increasingly consider environmental concerns and companies’ risk management capabilities. As a result, corporate biodiversity reporting is necessary to monitor performance and demonstrate ecological credentials to investors.
It has been demonstrated that disclosure on biodiversity is currently far less prevalent than other environmental topics, most notably climate. CDSB’s review of 50 large European companies’ reporting in 2020 under the European Union (EU) Non-Financial Reporting Directive (NFRD)26 found that 46% of companies provided some information on biodiversity in their reports, as compared to 100% of companies for climate change. Where disclosures were provided, they often lacked the relative specificity and maturity of climate-related disclosure, containing generic management approaches and high-level commitments. Additionally, only 10% of companies reported metrics on biodiversity,
compared to 100% for GHG emissions, and 90% for water. Similar analyses have echoed these findings,27, 28 for example, KPMG’s 2020 survey of sustainability reporting found that less than one quarter of “at-risk” companies worldwide report risks from the loss of biodiversity.29
Biodiversity-related corporate reporting is a fast-moving, developing area, and there is ongoing work to create harmonisation, particularly related to measurement and disclosure. For example, the Science Based Targets Network (SBTN) has issued initial guidance for nature prior to publishing integrated science based targets for all aspects of nature, including biodiversity (expected in 2022), the Align project aims to support businesses and other stakeholders in developing a standardised approach to biodiversity measurement and the Transparent project is developing a standardised natural capital accounting and valuation methodology. The Taskforce on Nature-related Financial Disclosures (TNFD) seeks to provide specific sector agnostic recommendations for mainstream reports like the TCFD recommendations do for climate-related financial risks and opportunities but is not due to be published until 2023. The International Financial Reporting Standards (IFRS) Foundation, in November 2021, announced the formation of a new International Sustainability Standards Board (ISSB) to develop a comprehensive global baseline of high-quality disclosure standards, on climate and other sustainability issues, to meet investors’ information needs, building on the work of existing investor-focused reporting initiatives. In light of this announcement we expect increased focus by the IFRS Foundation and its constituent boards on driving complete, consistent and comprehensive disclosure of material sustainability-related information across the mainstream report, including the financial statements.
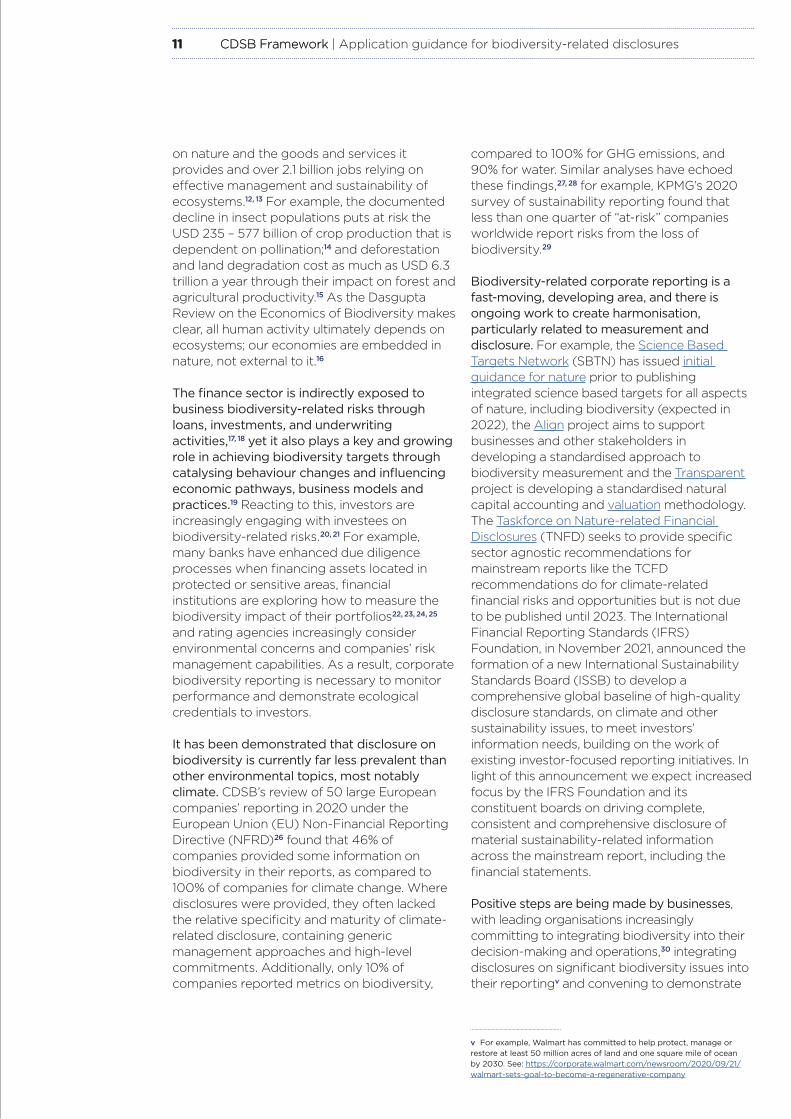
Positive steps are being made by businesses, with leading organisations increasingly committing to integrating biodiversity into their decision-making and operations,30 integrating disclosures on significant biodiversity issues into their reportingv and convening to demonstrate
v For example, Walmart has committed to help protect, manage or restore at least 50 million acres of land and one square mile of ocean by 2030. See: https://corporate.walmart.com/newsroom/2020/09/21/walmart-sets-goal-to-become-a-regenerative-company

12 CDSB Framework 12 CDSB Framework | Application guidance for biodiversity-related disclosures
and share ambition.vi However, more work is needed to ensure that reporting on material information about biodiversity-related issues in mainstream reports is of sufficient quality and detail to support decision-making by investors and other stakeholders, as the TCFD recommendations illustrate for climate. Additionally, given ongoing policy, stakeholder and industry initiatives on the interactions between business and natural capital and the required related corporate disclosure,vii there is clear momentum for an increase in policy response in the shape of mandatory corporate disclosure, including biodiversity as a core
vi For example, the more than 900 businesses of the Business for Nature initiative (with combined revenue of $4.3 trillion) are urging governments to adopt policies on how to reverse nature loss in this decade. See: https://www.businessfornature.org/advocate
vii For example: International Sustainability Standards Board (ISSB) of the IFRS Foundation, EU Corporate Sustainability Reporting Directive and EU sustainability reporting standards, TNFD, and Science-Based Target Network.
element and increasing standardised assessment and reporting.31
This Guidance aims to fill the current information gap and assist in preparing companies for new regulations and investor demands. By illustrating how the CDSB Framework can be applied to biodiversity-related reporting in mainstream reports through the integration of elements from existing biodiversity reporting standards and frameworks (Appendix 3) and alignment with the TCFD recommendations, it is envisioned that this guidance will contribute to the work of the IFRS Foundation via the establishment of the ISSB.

Biodiversity and business
Chapter 2

14 CDSB Framework 14 CDSB Framework | Application guidance for biodiversity-related disclosures
1. The importance of biodiversity to business and societyInternational initiatives, such as the Sustainable Development Goals32 (SDGs) and Planetary Boundaries,33 as well as The Dasgupta Review,34 highlight biodiversity as essential for the sustainability of natural and socio-economic systems. Direct biodiversity-related considerations related to the SDGs include (but are not limited to) life below water (SDG 14) and life on land (SDG 15). In addition, biodiversity underpins many actions needed to meet the other SDGs, for example playing a pivotal role in tackling hunger (SDG 2), good health and well-being (SDG 3), promoting responsible consumption and production (SDG
12) and climate action (SDG 13). Biodiversity is integral to the planetary boundary of biosphere integrity, as well as adaptation to climate-change, land-system change and ocean acidification.35
Biodiversity has both business and societal value. It is integral to businesses, economies, and wider society, being the living component of natural capital and underpinning the ecosystem services people receive from nature (see Box 1 and Figure 2). For example, biodiversity is essential for preserving ecosystem integrity and the supply of services such as providing essential resources, providing resilience to floods and droughts and supporting fundamental processes such as carbon cycles, water cycles and soil formation, which are necessary to sustain living conditions on earth.36, 37
Figure 2. Relationship between biodiversity and natural capital stocks, flows, and values. Adapted from Capitals Coalition and Cambridge Conservation Initiative. 2020. Integrating biodiversity in natural capital assessments. Available from: https://capitalscoalition.org/wp-content/uploads/2020/10/Biodiversity-Guidance_COMBINED_single-page.pdf
FLOWS Ecosystem and abiotic services
STOCKS Natural Capital
VALUE Benefits to business & society

15 CDSB Framework 15 CDSB Framework | Application guidance for biodiversity-related disclosures
Box 1: Ecosystem services and biodiversity
Ecosystem services refer to the flows of benefits that ecosystems make to people (e.g. timber, fibre, pollination, water regulation, climate regulation, recreation, mental health benefits),38 enabling human activities which include the operation of businesses. Ecosystem services result from ecosystem function, i.e. the flow of energy and materials from ecosystems to humans and other ecosystems.39 There are multiple definitions and classifications of ecosystem services,viii including the common categorisation into types, for example:40
• Provisioning services, such as the provision of timber, food, fibres, energy and freshwater that can be used for the supply of products or within business operations;
• Regulating/maintenance services, including the moderation and/or regulation of natural phenomena, e.g. air filtration, water purification, soil erosion control and flood control; and
• Cultural services, such as recreational, spiritual and religious, aesthetic, cultural heritage and tourism service.
Some also use the term nature’s contribution to people41, 42 (e.g. in the Intergovernmental Science-Policy Platform on Biodiversity and Ecosystem Services (IPBES) Global Assessment and in the post-2020 global biodiversity framework), which has a similar meaning to ecosystem services.43
When an ecological end-product transitions to being either an economic benefit or something that can be directly used or appreciated by people, it is defined as a final ecosystem service.44, 45 For example, nursery fish population services (an ecological function that is sometimes called an intermediary ecosystem service) are generally required for the stock of fish to be available to a fisher (final ecosystem service).
Biodiversity influences the functioning and productivity of ecosystems,46 acting as an enabling asset that is essential for and underpins final ecosystem services.47 Greater biodiversity generally results in higher quality, quantity and resilience of ecosystems and the services they provide.48 For example, species abundance, diversity, or the presence of key species in a given ecosystem can help maintain the ecosystem functioning and resilience, and the related provision of ecosystem services.49, 50, 51, 52 The Dasgupta Review distinguishes three features of diversity that are significant: richness (the number of unique life forms); the flatness of the distribution of life forms (evenness); and dissimilarities in the life forms (heterogeneity).53
For corporate assessment and reporting purposes, focusing on final ecosystem services enables greater distinctions to be made among biodiversity (stocks), ecosystem services (flows) and their values. As a result, assessments and reports should have increased accuracy, helping avoid double counting among other common inaccuracies.54, 55 The Biodiversity Application Guidance refers to final ecosystem services throughout. However, the Guidance is still applicable and relevant to any definition of ecosystem services an organisation chooses to adopt.
Despite the critical role played by biodiversity, drivers from human activities (including from businesses) are causing an unprecedented and accelerating loss on a global scale.56 This includes the rate of species extinction of plants, mammals, fish, and others being approximately 1,000 times higher than background extinction rates57 and the total numbers of wild mammals
(measured in biomass) declining by 82% compared to historical records,58 being described by scientists as a “biological annihilation” amounting to the sixth mass extinction.59 In addition, the world’s ecosystems have declined in size and condition by 47% compared to estimated baselines, for example, over 85% of wetland habitats had been lost by
viii For example, existing definitions and groupings are: Millennium Assessment, IPBES. Classification systems: CICES, National Ecosystem Services Classification System. For additional detail, see Finisdore, J., et al. (2020). The 18 benefits of using ecosystem services classification systems. Ecosystem Services, 45, 101160. Available from: https://www.sciencedirect.com/science/article/pii/S2212041620301029?casa_token=XPfVCTyH4t4AAAAA:IL9cImZshq28sQ4rLmFE2bXT805-HDF-EWY1w1rBxqhYF5ZfpUkcTa_bQQcTmVcRO53iBi4NFw

16 CDSB Framework 16 CDSB Framework | Application guidance for biodiversity-related disclosures
Box 2: Business drivers of biodiversity loss
Aligned with the pressures on nature identified by the SBTN and the direct drivers identified by IPBES, the main causes of biodiversity loss include, but are not limited to (Figure 3):
• Land-, freshwater- and sea-use change (areas) causes habitat and ecosystem loss, degradation and fragmentation, and can lead to the extinction of species and the loss of ecosystem functions and related ecosystem services. Land-use change is the leading driver of terrestrial and freshwater biodiversity loss, with agricultural expansion being the most widespread form of land-use change. The planetary boundary of land-system change has been deemed to be crossed.64
• Resource exploitation refers to the exploitation of animals, plants and other organisms (e.g. fish stocks), as well as natural resources such as timber, soil and water (mainly through harvesting, logging, hunting and fishing). The rate of resources exploitation often exceeds their capacity for regeneration with ecological consequences including extinction of species, genetic drift (a change in the gene pool of a population) and habitat degradation. Resource exploitation is the leading driver of marine biodiversity loss.
• Climate change and its related effects (e.g. changes in temperature, precipitation patterns, and sea levels) has both direct and indirect effects on the distribution of species, their physiology and behaviour and on modification of habitats. Climate change increasingly exacerbates the impact of other drivers due to compounding effects.
• Pollution, including agricultural pollutants (e.g. fertilisers and pesticides), industrial emissions and marine plastic pollution, cause environmental change, such as modifying the physical and chemical state of soil, air and water, resulting in the degradation of ecosystem quality and threats to plant and animal species. Light and noise pollution, which can result from business operations, also impacts biodiversity through modifying species behaviour and distribution.
• Invasive species, which may be introduced deliberately or accidentally by organisations, pose a threat to ecosystems, habitats and native species, as well as human health and the economy through their establishment and propagation.
Figure 3. Drivers of biodiversity loss (see Box 2). Adapted from SBTN Initial Guidance and IPBES Global assessment report on biodiversity and ecosystem services of the Intergovernmental Science-Policy Platform on Biodiversity and Ecosystem Services. Available from: https://sciencebasedtargetsnetwork.org/wp-content/uploads/2020/09/SBTN-initial-guidance-for-business.pdf and https://ipbes.net/global-assessment
the year 2000 compared to 1700.60, 61 Reflecting this, the planetary boundary of “biosphere integrity” is deemed to have been breached (meaning there is a high risk of deleterious or catastrophic environmental
change) and biodiversity loss has been ranked as the second most impactful and third most likely risk for the next decade.62, 63 Box 2 contains an overview of the drivers of biodiversity loss.
Influencing factors & trends Values & Behaviors
Demographic & Sociocultural
Economic & Technological
Institutions & Governance
Conflicts & Epidemics
Biodiversity impact drivers
Land/water/sea use change
Resource Exploitation
Climate Change
Pollution
Invasive species & others
land
freshwater
ocean
Changes to the state of natureEcosystem • Extent and condition • Biotic integrity
Species • Threat of extinction • Biomass and abundance
Ecosystem services • Provision of resources • Cultural value
17 CDSB Framework 17 CDSB Framework | Application guidance for biodiversity-related disclosures
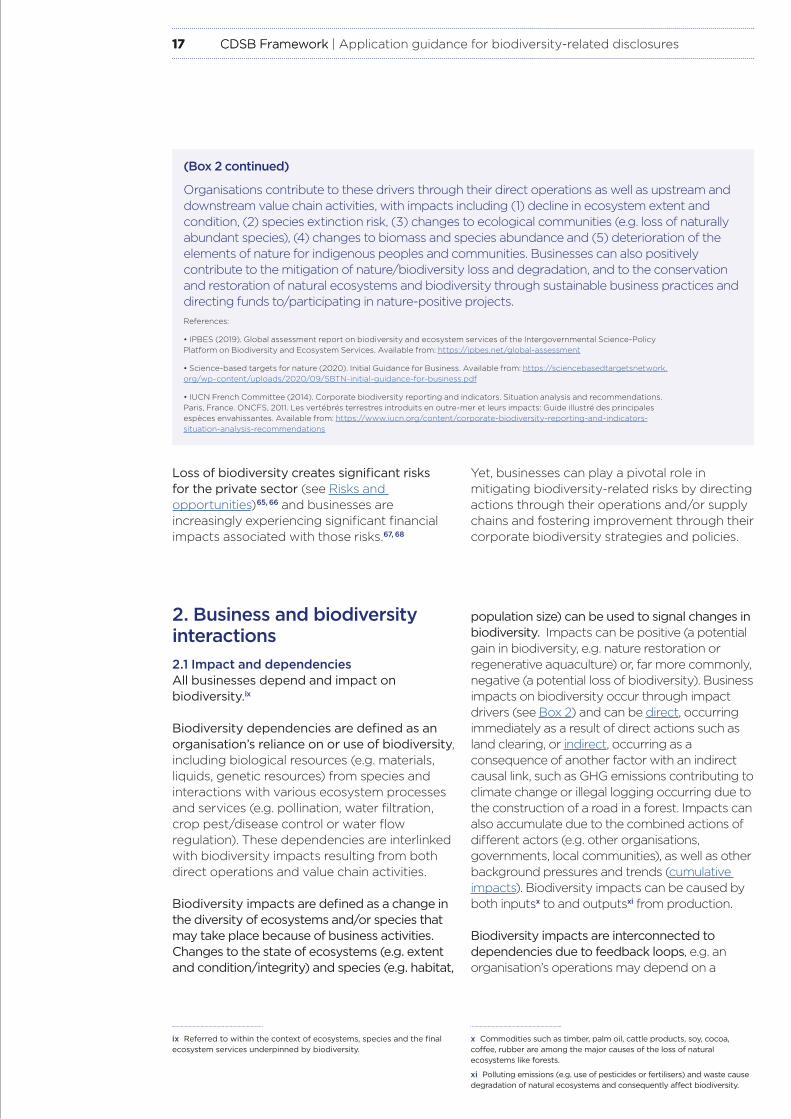
(Box 2 continued)
Organisations contribute to these drivers through their direct operations as well as upstream and downstream value chain activities, with impacts including (1) decline in ecosystem extent and condition, (2) species extinction risk, (3) changes to ecological communities (e.g. loss of naturally abundant species), (4) changes to biomass and species abundance and (5) deterioration of the elements of nature for indigenous peoples and communities. Businesses can also positively contribute to the mitigation of nature/biodiversity loss and degradation, and to the conservation and restoration of natural ecosystems and biodiversity through sustainable business practices and directing funds to/participating in nature-positive projects. References:
• IPBES (2019). Global assessment report on biodiversity and ecosystem services of the Intergovernmental Science-Policy Platform on Biodiversity and Ecosystem Services. Available from: https://ipbes.net/global-assessment
• Science-based targets for nature (2020). Initial Guidance for Business. Available from: https://sciencebasedtargetsnetwork.org/wp-content/uploads/2020/09/SBTN-initial-guidance-for-business.pdf
• IUCN French Committee (2014). Corporate biodiversity reporting and indicators. Situation analysis and recommendations. Paris, France. ONCFS, 2011. Les vertébrés terrestres introduits en outre-mer et leurs impacts: Guide illustré des principales espèces envahissantes. Available from: https://www.iucn.org/content/corporate-biodiversity-reporting-and-indicators-situation-analysis-recommendations
Loss of biodiversity creates significant risks for the private sector (see Risks and opportunities)65, 66 and businesses are increasingly experiencing significant financial impacts associated with those risks.67, 68
Yet, businesses can play a pivotal role in mitigating biodiversity-related risks by directing actions through their operations and/or supply chains and fostering improvement through their corporate biodiversity strategies and policies.
population size) can be used to signal changes in biodiversity. Impacts can be positive (a potential gain in biodiversity, e.g. nature restoration or regenerative aquaculture) or, far more commonly, negative (a potential loss of biodiversity). Business impacts on biodiversity occur through impact drivers (see Box 2) and can be direct, occurring immediately as a result of direct actions such as land clearing, or indirect, occurring as a consequence of another factor with an indirect causal link, such as GHG emissions contributing to climate change or illegal logging occurring due to the construction of a road in a forest. Impacts can also accumulate due to the combined actions of different actors (e.g. other organisations, governments, local communities), as well as other background pressures and trends (cumulative impacts). Biodiversity impacts can be caused by both inputsx to and outputsxi from production.
Biodiversity impacts are interconnected to dependencies due to feedback loops, e.g. an organisation’s operations may depend on a
2. Business and biodiversity interactions2.1 Impact and dependenciesAll businesses depend and impact on biodiversity.ix
Biodiversity dependencies are defined as an organisation’s reliance on or use of biodiversity, including biological resources (e.g. materials, liquids, genetic resources) from species and interactions with various ecosystem processes and services (e.g. pollination, water filtration, crop pest/disease control or water flow regulation). These dependencies are interlinked with biodiversity impacts resulting from both direct operations and value chain activities.
Biodiversity impacts are defined as a change in the diversity of ecosystems and/or species that may take place because of business activities. Changes to the state of ecosystems (e.g. extent and condition/integrity) and species (e.g. habitat,
ix Referred to within the context of ecosystems, species and the final ecosystem services underpinned by biodiversity.
x Commodities such as timber, palm oil, cattle products, soy, cocoa, coffee, rubber are among the major causes of the loss of natural ecosystems like forests.
xi Polluting emissions (e.g. use of pesticides or fertilisers) and waste cause degradation of natural ecosystems and consequently affect biodiversity.

18 CDSB Framework 18 CDSB Framework | Application guidance for biodiversity-related disclosures
xii These risk categories are aligned to the TCFD risk categories.
particular species of fish (dependency), yet if the organisation fishes at unsustainable fishing rates, the population of the species may reduce (biodiversity impact) causing loss of operational productivity and related income and/or increased costs. Business biodiversity dependencies and impacts vary according to sector, value chain and geographic location, for example, sectors that rely heavily on natural resources, such as agriculture, forestry and fishing sectors will have significant direct impacts whereas tertiary sectors are more likely to have indirect interactions through their supply chains.69
Financial implications include clean-up and/or remediation costs, sanctions, development of plans to mitigate or remediate negative ecological impacts, loss of revenue resulting from reputational damage associated with poor biodiversity management, or agricultural supply chain disruption due to declines in populations of species that the organisation depends on (e.g. pollinators).
2.2 Risks and opportunitiesOrganisations can experience different types of biodiversity-related financial risks and opportunities, such as: physical (biological, ecological, chemical etc.), reputational, policy and legal (or regulatory), technological, and market.xii
Physical risks are linked to changes to biodiversity, ecosystems and its related functioning, including risks posed to businesses from biodiversity impacts. Physical risks therefore encapsulate financial implications related to ecosystem and biodiversity loss and degradation, and the related consequences, such as reduction in soil fertility, reduction in pollination for crop production, reduced availability of fish stocks, as well as the increased likelihood and severity of extreme weather events e.g. due to erosion of coastal ecosystems (see REQ-03 for additional details and examples of types of biodiversity-related physical, biological, chemical and other related risks).
Additionally, organisations may have financial implications linked to the transition to a biodiversity-positive economy including: increased regulation regarding biodiversity protection and conservation (regulatory), shifts in market preferences (market), shifts in stakeholders’ perceptions of an organisation’s impact on biodiversity and natural ecosystems (reputational), and the impact of new technologies (technological). See Table 3 for examples of financial risks.
Biodiversity-related opportunities and related financial benefits are often linked to, for example, improved efficiency, development of new products and services, access to new funding streams, operational cost-savings through nature-based solutions and the engagement of and collaboration with stakeholders.
Biodiversity-related risks and opportunities can be caused by both (1) the organisation’s specific business sector and activities, including the activities within the value chain and/or (2) or by the geographic context70 in which its activities are located, for example, risks related to biodiversity/ecosystem mismanagement by other stakeholders, including organisations, and to socio-economic conditions in the areas of operations, such as lack of biodiversity governance or political instability. They are connected to other changes to natural capital (sharing common drivers) (see Key Characteristics). For example, changes to biodiversity, such as changes in species seasonal patterns, distribution and abundance, and ecosystem distribution, composition and function71 can be associated with the prolonged droughts, desertification, coastal erosion, and sea level rise72 associated with climate change.73 Additionally, biodiversity plays a key role in the mitigation of and adaptation to climate change since it ensures the resilience of major carbon sinks such as oceans and forests. Considering such aggregated risks, including interlinkages between biodiversity and socio-economic risks, is critical to drive business continuity and resilience to future scenarios.
Risks and opportunities may be directly related to business operations or be indirectly generated through feedback cycles resulting from the costs/benefits experienced by society.74, 75 Therefore, achieving a complete
Both dependencies and impacts generate economic costs and benefits for businesses and society, which consequently result in business risks and opportunities that can affect the present and/or future financial position and financial performance of the organisation (see Figure 4).

19 CDSB Framework 19 CDSB Framework | Application guidance for biodiversity-related disclosures
Pla
neta
ry B
oundariesB
usi
ne
ss A
cti
viti
es
Biophysical structure or process (e.g. saltmarsh habitat, net primary productivity)
Function(e.g. slow passage of water or biomass)
Final Ecosystem Service(e.g. flood protection or provision of fish stocks)
Dependencies Impacts
External Factors(e.g. natural disasters, pollutants emitted by other stakeholders)
changes to
RisksPhysical Risks*
Transition Risks
• Acute • Chronic
• Policy and Legal • Technology • Market • Reputation
Opportunities
• Resource Efficiency • Products / services • Markets • Resilience • Financial incentives • Reputation
Income Statement Cash Flow Statement Balance Sheet
Financial Impact
Strategic Planning Risk Management
Revenues
Expenditures
Assets and Liabilities
Capital & Financing
Figure 4. Business impacts and dependencies on biodiversity and final ecosystem services are sources of risks and opportunities for the organisation’s future financial position and financial performance (adapted from Recommendations of the TCFD and the Dasgupta review). *Physical risks (and opportunities) within this document includes not only physical risks (and opportunities) but also biological, ecological, chemical and other risks and opportunities (see REQ-03 for additional details and examples).
impacts on nature

20 CDSB Framework 20 CDSB Framework | Application guidance for biodiversity-related disclosures
understanding of the short- and long-term financial risks and opportunities associated with biodiversity requires considering, not only how nature may (positively or negatively) impact the organisation’s immediate financial performance (“outside in”), but also current and future significant impacts to society resulting from business activities (“inside out”).76, 77 For example, lowered availability of final ecosystem services resulting from business activities (e.g. water usage, deforestation) may have implications for local stakeholders (e.g. water/timber shortages), which may lead to business risks (e.g. reputational costs, loss of social licence to operate), and ultimately affect the organisation’s business model and ability to execute its strategy.
3. Key Characteristics
The interactions between biodiversity and business are characterised by key characteristics (Figure 5) that are important for organisations to consider during the process of preparing biodiversity-related disclosures.
1. Spatial dimension: Biodiversity dependencies, impacts, risks and opportunities are location-specific. The biodiversity-related geographic context in a given location concerns not only the biodiversity status of the area, in terms of existing ecosystems and species, protected area status and biodiversity value, but also in terms of (1) infrastructures; (2) social conditions, including community traditions and livelihoods; (3) economic conditions, such as nature-related productivity, employment, and income; (4) governance and regulation; (5) geopolitical dimensions (e.g. in transboundary locations); and (6) ongoing cooperation initiatives. For example, the risks associated with overfishing in an area are specific to the level of local employment and income that is dependent on that ecosystem, as well the community traditions, fishing infrastructure and techniques, regulations and cooperation initiatives (e.g. among fishing companies) that are in place.
Areas impacted by business activities may be large and extend beyond the immediate vicinity of activities due to, for example, ecological linkages and migratory or wide-ranging species. Areas impacted also differ depending on the driver of biodiversity loss (e.g. GHG emissions have a global effect whilst exploitation of organisms may be localised).78, 79
2. Time dimension: Biodiversity impacts and drivers of loss resulting from business activities vary both within and across years (e.g. seasonality of natural processes vs. seasonality of agricultural processes, species migrations, etc.). Future drivers and impacts can be hard to predict and can experience time-lags. For example, there may be a lag between the loss of biodiversity resulting from business activities and the consequent loss of final ecosystem services. Equally, management efforts may take time to achieve outcomes. It is therefore important to monitor changes in the state of biodiversity over time. Therefore, consideration is required when applying accounting timeframes to these biodiversity concepts, for example, when setting targets, determining appropriate measurement intervals for key performance indicators (KPIs) and determining appropriate intervals for comparative analysis.
3. Multi-faceted qualities: Biodiversity has varied dimensions, geographical scales and impact groups which need to be considered. Varied dimensions include genetic diversity within species, diversity between species and the diversity of ecosystems. The Dasgupta Review distinguishes three features of diversity that are significant: richness (the number of unique life forms); the flatness of the distribution of life forms (evenness); and dissimilarities in the life forms (heterogeneity).80 Geographical scales include biodiversity within a site, between sites and among sites in a landscape. Varied impact groups include, but are not limited to, risk of species extinction, loss of ecological integrity, ecosystem loss and fragmentation, loss of genetic diversity, changes in migration timing and routes, and ecosystem degradation.
4. Interconnectivity: Biodiversity loss is highly interconnected with other natural capital changes and socio-economic issues. Natural capital changes such as land degradation, water degradation and climate change share common drivers with biodiversity loss, including changes in land-use (e.g. deforestation and urbanisation), freshwater-use and sea-use, resource consumption and pollution. Biodiversity loss is inherently connected to the climate change crisis, which is contributing to rapid, broad-scale ecosystem system changes and exacerbating drivers of biodiversity loss.81 However, biodiverse ecosystems can also contribute to being a potential solution to climate change (e.g. ecosystems provide climate adaptation services such as protection from storm damage).82

21 CDSB Framework 21 CDSB Framework | Application guidance for biodiversity-related disclosures
Biodiversity is also integral to other global issues such as societal well-being and economic welfare. Consequently, both the Intergovernmental Panel on Climate Change (IPCC) and IPBES promote the need for holistic multi-outcome, multi-action and multi-actor environmental solutions,83 as opposed to solutions which maximise the outcome for a single issue at the expense of others. Developing effective and resilient biodiversity strategies therefore requires companies to consider many dynamic and interconnecting systems.xiii
The interconnected nature of biodiversity loss with other natural capital changes creates risks around reporting accuracy and double counting. For example, depending on how benefits are measured, management activities such as the purchase of carbon offsets to mitigate emissions may also have collateral effects on biodiversity through activities such as reforestation or land restoration.84, 85
5. Engagement and collaboration: Given the globalised nature of value chains, trade and economic flows, biodiversity dependencies and impacts are often most significant outside the organisation’s direct operations, resulting from upstream activities (e.g. land-use conversion for agricultural commodities) or downstream activities (e.g. water pollution from use of personal care and household goods, or management of plastic waste from packaging). As a result, institutional investors are increasingly asking detailed questions about biodiversity
management within value chains.86, 87, 88 This increases the importance of including the value chain in biodiversity assessments and strategies.89, 90
Stakeholders may have specific dependencies on biodiversity, including local and indigenous communities, local farmers/fishers, regulators, financial institutions, and civil societies/experts.91 As biodiversity is “shared” with local stakeholders in a given area, with actions of one party having impacts for other local parties, single actions at the operational level (e.g. to increase biodiversity by restoring part of a wetland/forest or reduce negative impacts by reducing polluting emissions) do not improve the status of biodiversity if others within the same geographical location are degrading the ecosystems, and/or regulators are not implementing biodiversity plans or regulating biodiversity impacts. Therefore, engagement with stakeholders, both at the operational and value chain level (particularly in areas with high biodiversity value), and participation in collaborative actions is fundamental for effective biodiversity management.
6. Methodologies: Due to the complexity of biodiversity impacts and dependencies, multiple measurement techniques may be required to fully capture the various possible changes. Whilst many biodiversity measurement methodologies exist, some of which are widely used (e.g. surface area metrics adjusted by ecosystem condition/integrity), this is a
Figure 5. The biodiversity key characteristics to be considered when preparing information for the mainstream report
SPATIAL DIMENSION location specificity, e.g. proximity to areas with high biodiversity value
TIME DIMENSION impacts and dependencies vary with natural dynamics within and across years
MULTI-FACETED QUALITIES varied dimensions, geographic scales and impact groups
INTERCONNECTIVITY e.g. link with climate change, water and land degradation
ENGAGEMENT and COLLABORATION e.g. value chain and stakeholders
METHODOLOGIES need for different methods to cover multi-faceted qualities, methodological development and data accessibility/accuracy
xiii The IPCC and IPBES both support holistic, multi-outcome and multi-action solutions, for example, balancing climate and nature solutions that also consider spatial and social contexts.

22 CDSB Framework 22 CDSB Framework | Application guidance for biodiversity-related disclosures
developing and rapidly expanding area. Approaches to measuring some areas may currently not be fully developed or standardised, for example, assessing dependencies is currently particularly challenging due to the indirect nature of benefits generated by biodiversity.xiv In addition, whilst many measurement methodologies exist, there is currently only one accounting approach available.92
Selecting methodologies and metrics requires consideration of data accessibility, availability, and accuracy. Traditional biodiversity metrics quantifying information, e.g. via ‘proxy approaches’ using databases or estimates from models to assess the effect on biodiversity, can be helpful to calculate biodiversity impacts and performance based on drivers of biodiversity loss. However, they are not always fit for purpose and may not be as accurate as direct measurement of the state of biodiversity at a business’s operating locations. Yet, access to primary data may be constrained due to being costly and time consuming to collect. Accessing data within the value chain may also be challenging due to the limited control of many companies over their supply chains.
The developing and complex nature of biodiversity measurement and accounting creates challenges for benchmarking and comparing performance both within and across organisations.xv, 93, 94 However, existing tools and
guidance can be referred toxvi and work is ongoing to create market harmonisation in this area, including through initiatives such as the Align project,95 Transparent project96 and TNFD.97 The monetary valuation of biodiversity and final ecosystem services may also be useful in this regard, using monetary units as common units that can be compared/benchmarked (albeit, dependent on consistent valuation techniques being applied, the same economic/monetary conversion figures being used and recognising that the full value of biodiversity may be hidden or missing as a result of valuation challenges,98 see Box 7 for additional details on valuation).
An additional element related to biodiversity measurement that needs to be considered is ecological equivalency (i.e. the notion of equity, like-for-like) which is integral to measuring impact, biodiversity footprint assessments, biodiversity accounting, forming offsetting strategies and biodiversity management activities. Due to variability in biogeography and types/intensities of activities, biodiversity patterns vary significantly between different species/ecosystems and locations. Therefore, aggregation (during the process of impact assessments) should consist of the same types of ecosystems (e.g. boreal forests, mangroves) or species (e.g. koala, cayote) as far as possible and care should be taken to achieve ecological equivalency as far as possible for the purposes of biodiversity offsetting.xvii, xviii
xiv Other examples include considering certain sector specificities, assessing value-chain interactions, measuring impacts to genetic resources, mapping marine biodiversity (and human impacts on it), understanding positive impacts as well as negative and spatial mapping.
xv The accounting framework provided by the Biological Diversity protocol aimed to overcome this by enabling benchmarking and performance comparison. See: Endangered Wildlife Trust (2020). The Biological Diversity Protocol (BD Protocol). Available from: https://www.nbbnbdp.org/uploads/1/3/1/4/131498886/biological_diversity_protocol__bd_protocol_.pdf
xvi For example, the Dasgupta review, BSI standard, WCMC ENCORE tool and the development of Science-Based Targets for Nature
xvii For further details on ecological equivalency, please refer to the Biological Diversity Protocol, the BBOP Guidance Notes to the Standard on Biodiversity Offsets, DEFRA Biodiversity metrics 3.0 – User Guide.
xviii Biodiversity offsetting should follow mitigation hierarchy principles. See REQ-02 for further details on mitigation hierarchy.

Chapter 3
Application guidance for biodiversity-related disclosures

24 CDSB Framework 24 CDSB Framework | Application guidance for biodiversity-related disclosures
This chapter represents the core element of the Biodiversity Application Guidance. Firstly, it sets out reporting expectations and important considerations for organisations whilst selecting and preparing biodiversity-related information to be included in the mainstream report. This includes the application of materiality to the aspects within the reporting requirements. Secondly, it provides a checklist and roadmap for organisations to support the process of integrating biodiversity-related information in mainstream reports. Thirdly, following CDSB reporting requirements from one to six, it provides guidance, resources and examples of practices from mainstream reports.
1. Reporting expectations and important considerationsThe following section illustrates the application of the first six reporting requirements of the CDSB Framework to biodiversity-related disclosures. A number of clarifications on the reporting expectations and related outcomes, and considerations regarding the guiding principles and remaining reporting requirements of the CDSB Framework are provided below.
1.1 Applying materialityBiodiversity information should be disclosed when deemed material by the organisation (see Principle 1 in the CDSB Framework and Appendix 2 for additional details). This means that, in practice, only the reporting practices within the Biodiversity Application Guidance that relate to information deemed to be material by the organisation should be considered for inclusion in the mainstream report. When preparing such information, report preparers should consider also (1) the organisation’s impacts on society and the environment that affect the company’s cash flow over the short-, medium- and long-term (also referred to as circularity), and (2) the dynamic nature of materiality for sustainability information, i.e. information that a company assesses to be material can rapidly change in response to drivers such as stakeholder pressure, consumer and investor expectations, regulation, evolution of science and understanding (see Appendix 2 for additional details).99
Assessing the materiality of biodiversity to a specific organisation can be difficult due to the complex links between business and
biodiversity, and the location-specificity and multifaceted qualities of biodiversity. Materiality assessments should:
1. Support the understanding of biodiversity-related risks and opportunities;
2. Support the effective selection and prioritisation of biodiversity-related information;
3. Be scientifically robust;
4. Aim to keep biodiversity disclosures concise, connected and decision-useful; and
5. Ensure that the results effectively support the management of biodiversity-related financial risks and opportunities that have implications for the business (i.e. operations, value chain, business model and financial results).
When approaching the materiality assessment, an organisation should focus on biodiversity-related information that can affect the business model and execution of its strategy as a result of the risks and opportunities identified (considering different categories of risks, see Table 3), as well as how the organisation’s business model and strategy may contribute to the risks and opportunities identified. A prerequisite step is an assessment of the organisation’s biodiversity dependencies and impacts (see Assessing biodiversity dependencies and impacts in REQ-02). This assessment allows for consequent exploration of biodiversity-related risks (e.g. exposure or liability due to its negative impacts) and opportunities (e.g. access to biodiversity-related funds and loans resulting from potential contributions to local, national or international biodiversity targets).
The materiality assessment should focus on the areas that are most relevant to the organisation (e.g. to business continuity). For example, when assessing ecosystems, an organisation should consider the loss of functionality to business operations if an ecosystem were to become lost/degraded and/or its final ecosystem service disrupted. When assessing species, the focus should be on species that (1) have the potential to disrupt business operations, (2) are legally protected under laws and conventions (e.g. listed by the Convention on International Trade in Endangered Species of Wild Fauna and Flora) therefore being potential sources of fines, and (3) play a significant cultural or economic role for stakeholders and can cause reputational risks (e.g. hunting, harvesting, pollinating services, educational and recreational services). Considering societal value can shed light on risks linked to potential greater regulation,

25 CDSB Framework 25 CDSB Framework | Application guidance for biodiversity-related disclosures
pressure from financial institutions and consumers that may be caused by growing concern over biodiversity loss from society.
Tools aimed at supporting biodiversity-related materiality assessment are emerging,xix however many are currently restricted to understanding final ecosystem services or specific species or habitats and do not represent the variety of species and ecosystems, and genetic diversity. Additionally, materiality assessments of biodiversity require knowledge of the biodiversity-related geographic context (from ecosystems to species). To that end, (1) public and/or private databases on, for example, species occurrence or ecosystem integrity, can be a useful and cost-effective solution, and (2) biodiversity experts and ecologists can support the process (e.g. if such databases are not available, outdated and/or incomplete).
Details on the approach applied in determining biodiversity materiality and in the selection of the biodiversity-related information included in the mainstream report represent useful information for investors, as well as an explanation of the reasons why specific biodiversity-related elements have been deemed material or immaterial (see Figure 6). This information is an important input to an investor’s decision-making process because it demonstrates the level of management understanding of the relevance of biodiversity to the business and helps to identify when biodiversity-related risks and opportunities are significant to the organisation’s business model and financial performance. This is crucial for biodiversity, since it is an emerging area in the reporting space and it is often poorly explored and understood, and therefore undervalued by organisations.100 Additionally, REQ-11 of the CDSB Framework encourages companies to include a statement of conformance, setting out the extent that the principles and reporting requirements of the CDSB Framework have been applied. In doing so, companies are expected to state the outcome of applying the relevance and materiality principle.
1.2 Providing contextualised and business-specific biodiversity-related information and clarifying methods Disclosures should provide the reader with succinct and concise contextual information specific to the reporting organisation.
The organisation should:
• Disclose business-specific biodiversity-related information, avoiding generic considerations and boilerplates;
• Emphasise and report details on priority species, ecosystems, geographical areas and products/services (see REQ-02). The disclosure should explain how an organisation is prioritising biodiversity-related risks and opportunities regarding such priority elements. Detailing what it is doing differently to tackle priority geographic areas compared to other areas can be particularly useful. This can represent decision-useful information for report users, showing that an organisation has:xx
• Understood the geographic-specificity of biodiversity-related risks and opportunities; and
• Screened and assessed the biodiversity-related status and risks of relevant species, ecosystems and areas where its operations and value chain are located, and classified them according to different levels of risks and opportunities for the business (see Tools for assessing biodiversity-related status and risks under REQ-03 for support).
The geographic detail of such disclosures should be set according to the materiality assessment of the organisation and can cover either regions, country, or specific sites (e.g. site-specific details can be disclosed for big mining sites that are significant for the overall organisation, for instance due to productivity or reputation);
• Contextualise information by clarifying the connections to other environmental matters disclosed, such as climate change, water or land-use; and
• Clearly describe the assessment methods used (e.g. for risk assessment, for biodiversity dependency and impacts measurement), as well as assumptions and reasons for inclusion in the mainstream report. Additionally, since several biodiversity-related terms are not uniquely defined and evolve over time, it is good practice to provide definitions of the biodiversity-related terms used in the mainstream report and reference to external sources.
xix For example, the Technical Annexes of the SBTN Initial Guidance (available at: https://sciencebasedtargetsnetwork.org/resources/) provide guiding questions for the materiality assessment considering sector, value chain and company’s specificities and the SBTN’s sector-specific materiality tool and guidance will be publicly available by March 2022.
xx Aligned with: UNEP-WCMC, Conservational International and Fauna & Flora International (2020). Biodiversity Indicators for Site- based Impacts. Cambridge, UK. Available from: https://www.unep-wcmc.org/system/comfy/cms/files/files/000/001/902/original/202102_Biodiversity_Indicators_Report_06.pdf

26 CDSB Framework 26 CDSB Framework | Application guidance for biodiversity-related disclosures
1.3 Disclosing information in a changing landscapeDue to the fast-moving and developing nature of biodiversity assessment and disclosure, organisations may have uncertainty in the identification of significant risks and opportunities (e.g. due to lacking an adequate methodology to measure an impact or dependency). Such uncertainties should not prevent an organisation from disclosing. Where this is the case, within its mainstream report, the organisation shall disclose the limitations in the assessment and state how they are planning to resolve this for future periods (e.g. working to determine the most appropriate measurement technique/or proxy). This builds upon Principle 1.4 of the CDSB Framework.
Some companies have already integrated biodiversity in their business strategy whilst others have yet to adopt substantive measures and are only in the preliminary stages of undertaking their journey towards biodiversity stewardship. Where organisations are still in the process of understanding or forming elements that should be disclosed upon (e.g. establishing biodiversity policies, targets and management responses, or in the process of analysing impacts and dependencies and preparing a response), this should be highlighted in the mainstream report. The description should include a summary of actions that are being taken to allow full disclosure for future years, including timelines. Reporting on the governance (REQ-01) and risk management (REQ-03) of biodiversity-related issues can be a useful basis for organisations in the process of understanding and forming elements, as the TCFD similarly suggests for climate-related issues.
1.4 Reporting boundaries and periodREQ-07 of the CDSB Framework states that the material biodiversity-related information disclosed should be prepared according to the reporting boundaries used for the rest of the mainstream report.xxi It may be, however, that biodiversity-related information that falls outside these reporting boundaries will be appropriate for inclusion in the mainstream report, such as
where significant risks or opportunities relate to suppliers and outsourced activities within the wider value chain. Since biodiversity-related dependencies and impacts can extend well beyond the immediate vicinity of an operation or supplier site (e.g. due to wildlife migration or other landscape level factors), an organisation may benefit from adopting a value chain approachxxii and considering wider spatial boundaries.
Organisations should explain the (biodiversity-related) value chain and spatial boundaries considered, outlining any limitations where applicable, for example, which parts of the value chain are considered (contractual arrangements, such as leased assets, outsourcing operations and franchises can be included)xxiii and related areas of risk (e.g. watershed, landscape, buffer zone).
REQ-09 suggests that the material biodiversity-related information included in the mainstream report should follow the reporting period used in the rest of the report (i.e. at least annually). Aligning the reporting period of the biodiversity-related information included in the mainstream report better ensures that it can be connected with other disclosures, such as financial performance and other environmental data, and so enhances comparability, as advocated by Principles 3 and 4, respectively. Despite the focus on financial year, the mainstream report considers past and forward-looking information, e.g. in the presentation of performance and target monitoringxxiv (REQ-05 and REQ-02), risks and opportunities assessment (REQ-03) and outlook (REQ-06). As detailed in the different requirements in the Biodiversity Application Guidance, identifying biodiversity-related temporal boundaries consists of determining appropriate timeframes for the assessment of dependencies and impacts and for the preparation of future outlook and related analyses (e.g. scenario analysis), and this selection will influence the extent to which future financial implications need to be included (e.g. decommissioning costs). The selection of timeframes depends on both the goals and targets of the organisation
xxi For additional information see CDSB (2014). Proposals for boundary setting in mainstream reports. Available from: https://www.cdsb.net/sites/cdsbnet/files/proposals_for_mainstream_report_boundary_setting.pdf
xxii Referring to the SBTN’s value chain ‘spheres of influence’ may be helpful during the adoption of a value chain approach.
xxiii See The Biological Diversity Protocol for details on boundaries setting (sections 2.1 and 2.2, pgs. 17-22) and on contractual arrangements (pg. 21)
xxiv In the Initial Guidance for Business, the SBTN suggests that target progress should be monitored regularly, with the frequency appropriate for each target determined in part by the indicator. For instance, quarterly may be appropriate for some (e.g. water use or pollution discharge), annual for others (e.g. ecosystem intactness), and every 3-5 years for others (e.g. species abundance).

27 CDSB Framework 27 CDSB Framework | Application guidance for biodiversity-related disclosures
as well as on the assessment of impacts or dependencies (see REQ-02 and REQ-04).
1.5 Using existing disclosures and resources, and ensuring connectivityThe CDSB Framework and its reporting requirements intend to align with and complement existing mainstream financial disclosures. Therefore, organisations may already have the information to satisfy certain aspects of the CDSB reporting requirements and the suggestions of the Biodiversity Application Guidance. For example, companies may already be disclosing biodiversity-related information that would be appropriate and material for mainstream disclosure through different reporting channels, such as sustainability reports, CDP submissions and index, investor questionnaires, or natural capital balance sheets or income statementsxxv (see Appendix 3). Repurposing these existing disclosures to meet the specific requirements of the mainstream report could benefit and streamline reporting practices. A useful resource to understand the interoperability of existing frameworks and standards is the paper Reporting on enterprise value101 which also provides a practical example of sustainability-related financial disclosure through a prototype focused on climate. Similarly, report preparers may be able to apply the financial accounting standards used for mainstream reporting to report on certain aspects of biodiversity-related financial information.xxvi
Finally, Principle 3 of the CDSB Framework emphasises the importance of ensuring environmental disclosures, including biodiversity disclosures, are connected with other mainstream disclosures where the information is material. The principle informs report preparers that disclosures
xxv E.g. referring to British Standard Institute (2021). BS 8632:2021 Natural Capital Accounting for Organisations.
xxvi Useful resources include the CDSB’s Uncharted waters, which explores financial accounting standards that could aid companies in responding to various aspects of the TCFD recommendations. IASB (IFRS® Standards and climate-related disclosures) and the IFRS Foundation (Effects of climate-related matters on financial statements) have both published papers that discuss how the IFRS Standards address issues that relate to climate-change risks and other emerging risks. Similarly, FASB has also produced an educational paper (Intersection of Environmental, Social and Governance Matters with Financial Accounting Standards) that explains when applying financial accounting standards, organisations may consider the effects of certain material Environmental, Social and corporate Governance (ESG) matters (including “ecological impacts, such as pollution, deforestation, and loss of biodiversity”) that have a material direct or indirect effect on the financial statements and notes. Building on the IASB and IFRS Foundation papers, CDSB has also developed guidance (Accounting for Climate) to support preparers on how to integrate climate-related matters into financial reporting and could also be applied to biodiversity-related matters, where such matters are considered material.
should be formulated and positioned in a way to allow investors to see and understand the linkages. In developing their mainstream reporting practices, companies should try and ensure that the language and labelling used best allows for clear understanding of these interconnections and avoids unnecessary duplication or confusion of information.
2. Roadmap and checklist for biodiversity-related disclosures The reporting outcomes depend not only on the materiality assessment but also on the level of maturity of integration of biodiversity in the business strategy, policy, and management of the reporting organisation and of biodiversity-related disclosures. Providing a clear roadmap detailing actionable steps with measurable targets would be particularly valuable to report users. Figure 6 illustrates a potential approach to biodiversity-related financial disclosures according to the maturity of such disclosures. Additional support can be provided by the Biodiversity Guidance Navigation Tool102 by the Capitals Coalition, which supports the understanding and assessment of biodiversity, and its inclusion into the organisation’s management through interactive steps, that adapt to the maturity of the specific organisation. The tool also suggests biodiversity-specific tools and resources.
Combining the roadmap with the checklist provided below can support the preparation of effective disclosures, which need concrete assessment, governance and internal communication, co-ordination and cooperation among different business departments.

28 CDSB Framework 28 CDSB Framework | Application guidance for biodiversity-related disclosures
Check other CDSB requirements and principles (REQ-07 to REQ-12, e.g.
conformance, assurance)
Figure 6. Roadmap to effective biodiversity-related financial disclosures. This flowchart illustrates a hypothetical roadmap for biodiversity-related financial disclosures. The path depends on the organisation-specific maturity in and type of conducted biodiversity reporting (i.e. Global Reporting Initiative (GRI), CDP Questionnaire) and there can be additional intermediate paths besides the two shown in the figure. Materiality assessment can occur at different stages throughout the process (this figure is indicative). The Biodiversity Application Guidance provides additional support (e.g. suggestions and resources) for each step and references to the specific sections of the Guidance are included in the flow chart.
Materiality* assessment preparation
1. Identify and assess biodiversity dependencies and impacts across business activities, the value chain, and their respective locations (REQ-02, 04).
2. Assess links with overall business, including management, strategy and processes (e.g. risks assessment, value creation opportunities, monitoring systems) (REQ-02).
3. Assess biodiversity-related current and future risks and opportunities and their business implications over time (REQ-03, 06).
4. Consider (REQ-03, Table 3): • different categories of risks and opportunities ; • risks from operations, value chain & geographical context.
Gather the data and determine
materiality*
Is your organisation measuring, addressing and reporting on biodiversity-related impacts
and dependencies?
NO
Is biodiversity material*?
Use Table 6 (Appendix 3) in the Biodiversity Guidance to map your data to CDSB
Requirements
5. Prioritise areas of strategic relevance, including identifying priority species, ecosystems, geographic areas and products/services (REQ-02).
6. Assess company’s biodiversity-related capacity (expertise, stakeholder engagement capacity, monitoring systems) (REQ-01, REQ-03)
7. Detail resource needs and allocation (financial and personnel) (REQ-01).
8. Define biodiversity policies, goals, contextual targets and metrics that address the main risks and opportunities and contribute to business goals (REQ-02).
9. Determine management responses using the mitigation hierarchy (REQ-02)
10. Monitor performance over time (REQ-04, 05) and consider likely future effects of biodiversity risks and opportunities (REQ-06)
Follow the CDSB Framework, Biodiversity Application Guidance and the Checklist for biodiversity-related financial disclosures to prepare the mainstream report and then check if it:
Explains the rationale behind biodiversity-related information Provides business-specific information and links with business strategy Ensures the connectivity of information throughout the report Provides a clear roadmap with actionable steps and measurable goals Explains how external stakeholders have been engaged and how a value-chain approach has been adopted
Are there disclosure gaps?
Through-out the process
• Inform and receive sign-off from the Board and Management (REQ-01)
• Adopt a lo-cation-specific approach and engage with stakeholders.
• Adopt a value-chain approach, considering direct op-erations, and upstream and downstream activities
*Information is material if it impacts on the organisation’s financial condition and operational results, and its ability to execute its strategy – CDSB Framework
YES
Explain which elements are/are not material, and why this is the caseExplain why
Given the dynamic nature of materiality, materiality assessment should be repeated regularly
NOYES
Define clear steps to address the gaps and to enhance disclosure including measurable objectives and timeline
NO YES

29 CDSB Framework 29 CDSB Framework | Application guidance for biodiversity-related disclosures
REQ-01 Governance
Does the disclosure:
Identify the person(s) or committee responsible for biodiversity-related policies, strategy and information?
Explain how biodiversity-related policies, strategy and management responses are delegated to management?
Explain whether there are specific roles or mechanisms in place in priority geographical areas and for priority products/services to tackle compliance with the biodiversity-related regulatory landscape, implementation of biodiversity management responses and engagement with stakeholders?
Describe any systems for accountability and incentivisation of biodiversity management?
Explain whether the governance mechanisms for biodiversity-related policies, strategies and disclosure differ from other significant concerns and, if so, why?
REQ-02 Management’s environmental policies, strategy and targets
Does the disclosure:
Provide context by explaining the biodiversity-related dependencies and impacts of the organisation with additional consideration of links to natural capital?
Summarise the biodiversity policies and strategies, including definitions and how they support or link to the organisation’s risks and opportunities and overall strategy?
When applicable, explain whether and how biodiversity strategies, policies, and management are established through stakeholder engagement and connect with relevant external societal agreements, policies and targets?
Set out targets (which, where possible, should be contextual, science-based and time bound), timelines, and indicators for delivery of biodiversity policy and strategy with methods and baselines, including progress towards targets?
Detail the resourcing of the delivery and management of biodiversity policies and strategies?
REQ-03 Risks and opportunities
Does the disclosure:
Identify significant biodiversity-related risks and opportunities (including those arising from the loss of related final ecosystem services) by adopting a value-chain approach and considering different types of risk?
Explain the implications of significant biodiversity-related risks and opportunities on business, value chain and products/services, specifying the geographical locations and time horizons in which they will materialise?
Quantify biodiversity-related risks and opportunities in the context of the organisation’s business model and strategy, using relevant financial and non-financial metrics and the quantification of dependencies where relevant?
Describe the systems and processes used for assessing, identifying, and monitoring biodiversity-related risks and opportunities, including whether they are integrated with existing risk management systems and processes and are stakeholder inclusive?
REQ-04 Sources of environmental impact
Does the disclosure:
Provide a selection of relevant biodiversity impact indicators and metrics, considering sources of significant biodiversity impacts, changes to the state of biodiversity and valuation of impacts?
Provide relevant baselines/reference states for metrics, and both absolute and normalised metrics where possible?
Provide explanations and contextualisation of the metrics including the methodologies used, levels of uncertainty, and appropriate narrative to assist understanding of results?
Categorise and disaggregate metrics where possible to support understanding and comparability?
REQ-05 Performance and comparative analysis
Does the disclosure:
Provide appropriate historical data to the results reported from REQ-04 for significant biodiversity-related impacts to allow for useful comparison, including details on priority geographical areas and priority products/services?
Contextualise performance with baselines/reference states, targets and other criteria used to assess progress?
Explain the major trends with reference to drivers of change under and/or outside the control of the organisation?
REQ-06 Outlook
Does the disclosure:
Explain the likely effect of future biodiversity-related impacts, risks and opportunities, as well as of biodiversity strategy on organisation performance and resilience, taking account of regulatory and market trends and environmental changes?
Identify and explain the time horizons used for reporting on corporate outlook?
Explain any techniques, such as scenario analysis, used to inform the outlook including the methods, scenarios and assumptions used, and any shortcomings and uncertainties?
The below checklist (referenced in Figure 6) summarises the suggestions on how to include material biodiversity-related information in mainstream reports following the CDSB requirements. The elements of the checklist are not to be addressed as mandatory requirements, but as desired disclosures that should be included in the mainstream report if
the information is material for the organisation. Companies that are still in the early stages of their biodiversity reporting could take a phased approach, reporting on elements that they have information for currently and setting out a plan to address additional elements in future periods (in line with Disclosing information in a changing landscape).

30 CDSB Framework 30 CDSB Framework | Application guidance for biodiversity-related disclosures
3. Biodiversity Application guidance
REQ-01 GovernanceDisclosures shall describe the governance of environmental policies, strategy and information
Disclosure checklist
Does the disclosure:
Identify the person(s) or committee responsible for biodiversity-related policies, strategy and information?
Explain how biodiversity-related policies, strategy and management responses are delegated to management?
Explain whether there are specific roles or mechanisms in place in priority geographical areas and for priority products/services to tackle compliance with the biodiversity-related regulatory landscape, implementation of biodiversity management responses and engagement with stakeholders?
Describe any systems for accountability and incentivisation of biodiversity management?
Explain whether the governance mechanisms for biodiversity-related policies, strategies and disclosure differ from other significant concerns and, if so, why?
1. Governance arrangements and rationaleGovernance disclosures should demonstrate transparency and accountability for the organisation’s oversight of biodiversity-related matters. It is essential that the responsibility for the disclosure of biodiversity-related information is identified, whether it is at board-level or delegated to specific committees, etc.
The most innovative, far-reaching, and successful biodiversity strategies and management plans will often require the leadership or integral support of the highest governing bodies of an organisation. Illustrating, whether diagrammatically or through clear narrative, where responsibility lies at board-level and who is driving forward such strategies at the management level is essential to evidence clear accountability and provide transparency. It assists report users in understanding the decision-making processes
for major strategic decisions. For instance, what processes would allow or require governance bodies to decide to allocate capital, change strategic direction or transform the business model in response to identified biodiversity-related risks and opportunities? If no board-level oversight of biodiversity-related issues is in place, the organisation should explain why and if there are plans to change this in the future.
In setting out the governance and management arrangements for biodiversity-related policies, strategies, and goals, companies should ideally summarise the rationale for such arrangements. For example, at board-level, what qualifications, skills, or experience makes the person or members of a committee best suited to overseeing the organisation’s biodiversity-related strategy? Some boards and management teams will draw on external expert advice on general or specific biodiversity-related issues for capacity building and steering. For example, capacity building sessions could be especially appropriate for companies approaching the assessment of biodiversity-related risks and opportunities or using scenario analysis to drive strategy development. Offering details of such external, expert advice in the mainstream report demonstrates proactive and responsive oversight of biodiversity, and improves the reliability of disclosure.
If in place, the organisation may describe the responsibilities of specific roles, capacity building sessions, and stakeholder engagement activities, especially in priority geographical areas to address the high level of geographic specificity associated with biodiversity-related dependencies and impacts and in relation to priority products/services.
2. Information flows and oversightEffective reporting on governance will articulate the connections, information flows and oversight mechanisms that exist between the board, management, and biodiversity-related issues. For example, report users may wish to know by what means and how often the appropriate board members are informed by management on biodiversity-related performance, targets, progress, or relevant changes to the external environment and through the supply chain, but also details on the nature and reliability of the control system used to prepare biodiversity-related information to be disclosed.

31 CDSB Framework 31 CDSB Framework | Application guidance for biodiversity-related disclosures
Additionally, information on how and how often the employees (and contractors) with direct responsibility for biodiversity topics (e.g. employees responsible for emissions and effluents treatment plants or land management) are consulted about the biodiversity strategy and management of the organisation would provide further helpful context on information flows.
To demonstrate that appropriate organisational and information systems are in place to oversee biodiversity-related risks and opportunities, reporting on the governance of significant biodiversity-related issues could answer the following questions:
• Which corporate governance codes determine or influence the way in which the organisation is governed?
• How often does the whole board discuss the biodiversity strategy, consider related developments, and assess related implications for the business (e.g. business plans and strategy, corporate responsibility strategy, biodiversity action plans (BAPs), risk management policies, innovation/research and development (R&D) priorities, and performance objectives)?
• How often is performance and progress in priority geographical areas and for priority products/services communicated to management and/or the person/committee responsible for biodiversity?
• How are biodiversity considerations incorporated into governance and business processes for the lifecycle of products, projects and activities (e.g. environmental management systems or health, safety and environment management systems)?
• Where appropriate, are there means for responsive strategic interventions or systems in place to ensure resilience (e.g. prevention or mitigation of incidents, such as polluting spills)?
• Who ensures compliance with biodiversity-related regulatory environment?
• How are biodiversity-related risks and opportunities considered in major strategic
decisions/capital allocations (e.g. acquisitions, divestiture, major capital expenditures, annual budgets)?
• Do biodiversity information systems exist, and if so, which are the organisational and value chain boundaries covered by biodiversity-related information systems?
3. Stakeholder engagement and cooperationAs impacts and dependencies related to biodiversity are likely to be found outside the direct operations and may result in unintended social consequences on local communities, the relationship between an organisation, the actors within its value chain and other stakeholders plays a key role in managing and mitigating biodiversity-related issues. A concise description of existing governance mechanisms illustrating how the organisation selects, engages, and collaborates with stakeholders in addressing biodiversity-related issues constitutes useful information to investors. An organisation can describe, for example:
• Collaboration with biodiversity organisations or experts to understand emerging trends and good conservation practices, including site-level examples to demonstrate how stakeholder concerns about potential impacts are addressed by the organisation;
• Engagement with local communities, consideration of their perspective of the organisation’s biodiversity conservation planning and related activitiesxxvii and collaboration, e.g. with smallholder farmers, to support the implementation of agricultural practices that do not harm natural ecosystems and related biodiversity;
• Involvement in multi-stakeholder initiatives or partnerships aimed at improving the understanding of biodiversity and ecosystems, and/or at addressing impacts to biodiversity; and
• Partnerships with third parties to protect or restore habitat areas distinct from where the organisation has overseen and implemented restoration or protection measures.
Among stakeholders, engagement and collaboration with actors of the value chain
xxvii E.g. the Free prior and Informed Consent (FPIC) is a specific right pertaining to indigenous peoples, recognised in the United Nations Declaration on the Rights of Indigenous Peoples (UNDRIP), that allows them to give or withhold consent to a project that may affect them or their territories.

32 CDSB Framework 32 CDSB Framework | Application guidance for biodiversity-related disclosures
is particularly important. Neglecting the value chain may fail to identify and therefore manage major biodiversity risks or opportunities103 while also leading to a misinterpretation of the company’s actual biodiversity exposure or contribution to society (e.g. biodiversity regulations and safeguards can affect the value chain and may result in rising costs or decreasing sales, even if the organisation itself is not directly subject to such regulations; or impacts on the agricultural production of raw materials caused by losses of pollination services due to declining bee populations104).
Relevant information on the governance of the value chain includes a description of existing traceability system(s) to track and monitor the origin of raw materials/inputs to operations and level of such systems (e.g. only direct suppliers or beyond), and of collaboration with suppliers to support and improve their capacity to comply with biodiversity-related requirements from the reporting organisation and to manage and mitigate biodiversity risks. If not in place, it would be useful to provide an explanation of why this is the case and if there are plans to develop these in the future.
4. IncentivisationIncentivising appropriate members of the board and management for meeting and fulfilling significant biodiversity-related goals and targets is a means of fostering ownership of performance and reporting on such arrangements in the mainstream report communicates that commitment. Equally important is the reporting of the metrics or criteria used in incentive schemes. They should speak to the organisation’s most pertinent biodiversity-related risks, opportunities, and strategy. Providing ongoing disclosure around biodiversity-related performance and progress towards long-term biodiversity targets tied to remuneration is useful.
5. Specificity of biodiversity governanceOrganisations’ biodiversity efforts sometimes form part of broader, cross-cutting environmental strategies with governance and oversight organised around these broader, interconnected environmental ambitions (e.g. climate, land or forest policies). However, different investors can focus their attention on different environmental issues when assessing companies and reading reports. With biodiversity escalating up the global agenda and understanding continuing to develop
around the importance of it to business, this specificity is important. When significant, companies should therefore explicitly summarise their biodiversity-related governance as discussed in previous paragraphs but more importantly, explain how it is integrated into a more connected environmental strategy, as well as in the wider business strategy.
Useful Resources105
1. Step 02 of the Natural Capital Protocol and related Biodiversity Guidance includes suggestions on methods, resources, and factors to consider when mapping the organisation’s stakeholders.
2. The International Petroleum Industry Environmental Conservation Association (IPIECA) Sustainability reporting guidance for the oil and gas industry provides both generic suggestions on how to map and prioritise stakeholders, and biodiversity-specific key points to consider in the organisation’s reporting (e.g. how are the stakeholders’ perspectives and concerns considered in biodiversity conservation planning and activities; including reference to any multi-stakeholder initiatives or partnerships the organisation joined to promote improved understanding of biodiversity and ecosystems, or to address potential impacts to biodiversity).
3. Some of the GRI standards provide generic suggestions on how to assess impacts on, engage with and disclose on stakeholders. In particular, GRI 308: Supplier Environmental Assessment 2016 supports organisations in the assessment of environmental impacts in their supply chain, in understanding how to manage these impacts, and the preparation of related disclosures. GRI 413: Local Communities 2016, instead, provides support in preparing disclosures that detail the impacts an organisation may have on local communities, and how they manage these impacts.

33 CDSB Framework 33 CDSB Framework | Application guidance for biodiversity-related disclosures
REQ-02 Management’s environmental policies, strategy and targets
Disclosures shall report management’s environmental policies, strategy and targets, including the indicators, plans and timelines used to assess performance
Disclosure checklist
Does the disclosure:
Provide context by explaining the biodiversity-related dependencies and impacts of the organisation with additional consideration of links to natural capital?
Summarise the biodiversity policies and strategies, including definitions and how they support or link to the organisation’s risks and opportunities and overall strategy?
When applicable, explain whether and how biodiversity strategies, policies, and management are established through stakeholder engagement and connect with relevant external societal agreements, policies and targets?
Set out targets (which, where possible, should be contextual, science-based and time bound), timelines, and indicators for delivery of biodiversity policy and strategy with methods and baselines, including progress towards targets?
Detail the resourcing of the delivery and management of biodiversity policies and strategies?
1. Providing the context for biodiversity policy, strategy, and targets
The report user should be able to understand how biodiversity and ecosystems, which underpin and support the organisation’s ability to succeed, are reflected in its ambitions in meeting business goals.
1.1 Assessing biodiversity dependencies and impactsA prerequisite step to reporting consists of assessing a) dependencies of the business on biodiversity and b) impacts the organisation has on biodiversity (REQ-04). There are interconnections between dependencies and impacts, and for that reason they cannot be treated in isolation, and this requirement (REQ-02) therefore tackles both. Such a holistic assessment, that considers both dependencies and impacts, should consider ecosystems, species and final ecosystem services within the organisational and value chain boundaries set (see Reporting boundary and period). The identified dependencies and impacts should be considered in the assessment of risks and opportunities (REQ-03), as well as the materiality assessment.
When conducting such assessment, organisations may start by identifying biodiversity dependencies and impacts accompanied by details on their locations.xxviii
Examples
1. Kering Universal Registration Document 2020 identifies the committee responsible for addressing biodiversity-related risks and opportunities, i.e. the Board Sustainability Committee; the CEO, the Group Managing Director, and the Lead Independent Directorate members of the committee (pg. 135). Kering also discloses biodiversity-related incentives; the amount of performance shares awarded to executive corporate officers is linked to the achievement of biodiversity-related targets (pg. 285).
2. Ørsted Sustainability Report 2020 clearly reports that the heads of its four Offshore market regions are responsible for the implementation of the Group’s policy on biodiversity, and are supported by environmental specialists to do so (pg. 37).
3. Danone Universal Registration Document 2020 describes the board’s role in monitoring investments in projects that have a positive environmental impact, including in relation to biodiversity (pg. 224).
xxviii For example, see Step 1 (Biodiversity risk screening) in UNEP-WCMC, Conservational International and Fauna & Flora International (2020). Biodiversity Indicators for Site- based Impacts. Cambridge, UK. Available from: https://www.unep-wcmc.org/system/comfy/cms/files/files/000/001/902/original/202102_Biodiversity_Indicators_Report_06.pdf

34 CDSB Framework 34 CDSB Framework | Application guidance for biodiversity-related disclosures
Box 3: Assessment approaches
The impact pathway approach assesses how, as a result of a specific business activity, an impact driver results in changes to biodiversity (or natural capital) and how these changes impact different stakeholders (see Figure 7). A dependency pathway is similar and shows how a particular business activity depends upon specific features of biodiversity (or natural capital) and identifies how changes in biodiversity affect business costs and/or benefits.
Figure 7. Impact pathway approach (based on Biodiversity Guidance of the Natural Capital Protocol)
Figure 7 illustrates how a business activity can be a biodiversity impact driver (either through an input, such as material used, or a non-product output, such as air or water pollution). This generates changes in biodiversity, which in turn can affect the organisation or society. 109, 110 Dependencies are often integrated into the impact pathway due to their interconnections with impacts (e.g. feedback loops between impacts on habitats and loss of pollinators, see Figure 7).
Secondly, measures and quantitative assessments come into place: quantitative information is added to the qualitative list (i.e. inventory)xxix and metrics are calculated. Approaches such as the pathway approach (outlined in the Natural Capital Protocol) and the Driver-Pressure-State-Impact-Response (DPSIR) framework can be used to guide this process (see Box 3), from the measurement of drivers of impacts and dependencies to valuation. Completing a biodiversity footprint assessment can also be useful during this step (see Box 4).
Frameworks and tools can assist with this process. For example, the Natural Capital Protocol (and associated Biodiversity Guidance)106 provides flexible measurement and valuation guidance and the Biological Diversity Protocol107 provides a standardised accounting framework for consolidated impact disclosure. See Useful Resources for other resources and tools such as ENCORE,108 a web-based tool that supports the exploration of dependencies on nature of the economic system and of the risks for businesses caused by environmental change.
xxix See Biological Diversity Protocol for further details. Endangered Wildlife Trust (2020). The Biological Diversity Protocol. Available from: https://www.nbbnbdp.org/uploads/1/3/1/4/131498886/biological_diversity_protocol__bd_protocol_.pdf
Exa
mp
le 1
Business activities at an agri-food company lead to land conversion to create a new agricultural area (impact driver)
The land development leads to the reduction or loss of pollinators due to loss of supporting habitat (change in the state of biodiversity)
The reduction or loss of pollination (final ecosystem services) disrupts the productivity of pollinator-dependent crops like almonds and the related organisation’s financial performance (impact on business)
Business activities discharge polluting water emissions (impact driver)
Aquatic ecosystems are degraded and related biodiversity is impacted, e.g. due to toxic substances, reduction of oxygen levels (change in the state of biodiversity)
Reduction of water purification and availability of clean water (final ecosystem services) affects affects financial performance of (downstream) organisations requiring clean water as input into business operations (impact on business)
Exa
mp
le 2
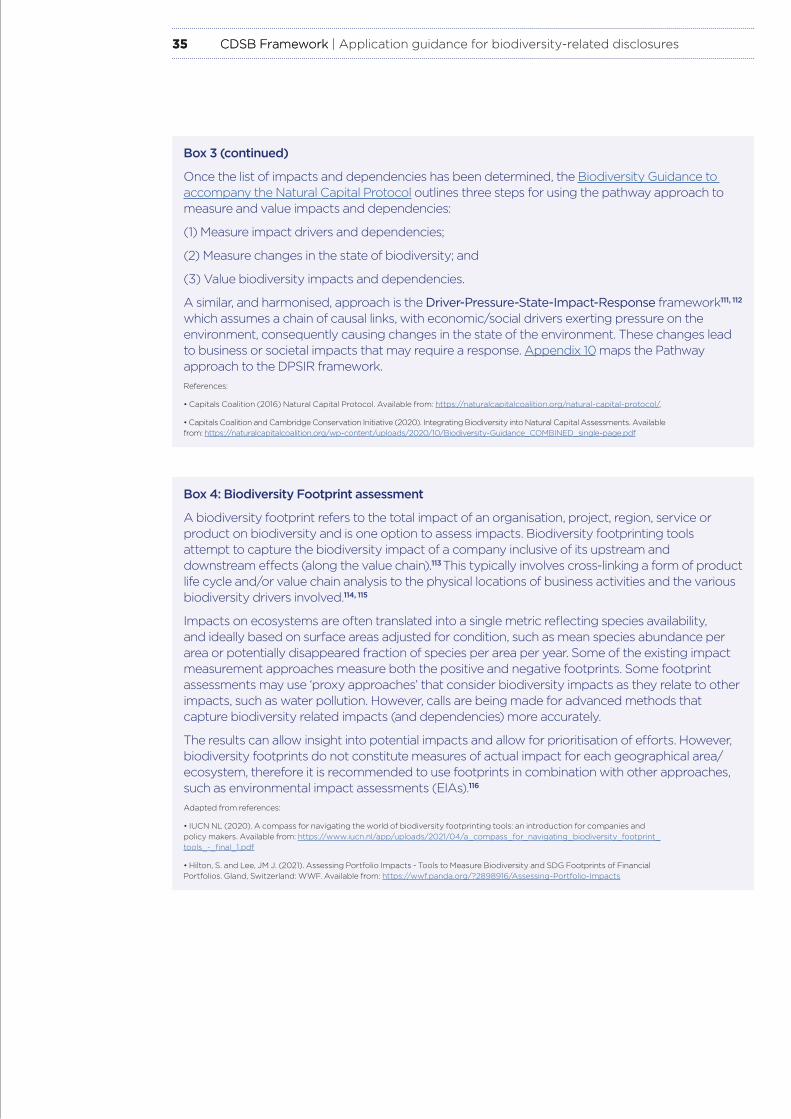
35 CDSB Framework 35 CDSB Framework | Application guidance for biodiversity-related disclosures
Box 3 (continued)
Once the list of impacts and dependencies has been determined, the Biodiversity Guidance to accompany the Natural Capital Protocol outlines three steps for using the pathway approach to measure and value impacts and dependencies:
(1) Measure impact drivers and dependencies;
(2) Measure changes in the state of biodiversity; and
(3) Value biodiversity impacts and dependencies.
A similar, and harmonised, approach is the Driver-Pressure-State-Impact-Response framework111, 112 which assumes a chain of causal links, with economic/social drivers exerting pressure on the environment, consequently causing changes in the state of the environment. These changes lead to business or societal impacts that may require a response. Appendix 10 maps the Pathway approach to the DPSIR framework. References:
• Capitals Coalition (2016) Natural Capital Protocol. Available from: https://naturalcapitalcoalition.org/natural-capital-protocol/,
• Capitals Coalition and Cambridge Conservation Initiative (2020). Integrating Biodiversity into Natural Capital Assessments. Available from: https://naturalcapitalcoalition.org/wp-content/uploads/2020/10/Biodiversity-Guidance_COMBINED_single-page.pdf
Box 4: Biodiversity Footprint assessment
A biodiversity footprint refers to the total impact of an organisation, project, region, service or product on biodiversity and is one option to assess impacts. Biodiversity footprinting tools attempt to capture the biodiversity impact of a company inclusive of its upstream and downstream effects (along the value chain).113 This typically involves cross-linking a form of product life cycle and/or value chain analysis to the physical locations of business activities and the various biodiversity drivers involved.114, 115
Impacts on ecosystems are often translated into a single metric reflecting species availability, and ideally based on surface areas adjusted for condition, such as mean species abundance per area or potentially disappeared fraction of species per area per year. Some of the existing impact measurement approaches measure both the positive and negative footprints. Some footprint assessments may use ‘proxy approaches’ that consider biodiversity impacts as they relate to other impacts, such as water pollution. However, calls are being made for advanced methods that capture biodiversity related impacts (and dependencies) more accurately.
The results can allow insight into potential impacts and allow for prioritisation of efforts. However, biodiversity footprints do not constitute measures of actual impact for each geographical area/ecosystem, therefore it is recommended to use footprints in combination with other approaches, such as environmental impact assessments (EIAs).116
Adapted from references:
• IUCN NL (2020). A compass for navigating the world of biodiversity footprinting tools: an introduction for companies and policy makers. Available from: https://www.iucn.nl/app/uploads/2021/04/a_compass_for_navigating_biodiversity_footprint_tools_-_final_1.pdf
• Hilton, S. and Lee, JM J. (2021). Assessing Portfolio Impacts - Tools to Measure Biodiversity and SDG Footprints of Financial Portfolios. Gland, Switzerland: WWF. Available from: https://wwf.panda.org/?2898916/Assessing-Portfolio-Impacts

36 CDSB Framework 36 CDSB Framework | Application guidance for biodiversity-related disclosures
The assessment should be in the context of the organisational boundary set and of wider natural capital changes and social issues, with other considerations including:
• Different business units and phases of the value chain (from raw material extraction to end-of-life of products, when applicable) in relation to their locations, thus considering both on-site and off-site dependencies, and both those that are under and outside the control of the organisation;xxx
• Aspects linked to the socio-economic context;
• Interactions between biodiversity impacts and dependencies;
• Trends in external factors, outside the control of the business, that may accentuate or moderate impacts, or result in changes to business dependencies (e.g. the degradation of a forest that currently provides flooding protection). This may include both natural forces and human activities, including regulatory changes;
• Dependencies/impacts that arise outside the reporting period timeframe. For example, significant impacts from previous years that are still ongoing (despite the activity having ceased) and future potential impacts/dependencies; and
• The need to consult with external stakeholders to understand key biodiversity considerations.
As organisations’ biodiversity dependencies and impacts vary according to sector, role in the value chain and geographic location, organisations should consider supplementary sector-specific and location-specific guidance where possible.
1.2 Reporting material information on dependencies and impactsReporting details of the impact and dependency assessment provides report users with useful business context regarding the selection of biodiversity-related strategies, policies and targets. Material information about biodiversity-related dependencies and impacts should be disclosed and related to the context of the business model where possible, including those related to previous years that the organisation has continued responsibility for. This may include those related to ecosystems, species and/or the
final ecosystem services underpinned by biodiversity.
Options for summarising dependencies and impacts include a narrative description and/or graphical representation of the integrated business model. Where applicable, organisations should recognise and illustrate the interconnected nature between impacts and dependencies, detailing how significant impacts are connected to or arise as a result of dependencies (e.g. degradation of forest ecosystem — impact — due to the use of timber during the production process - dependency).
When reporting, it is recommended to categorise biodiversity impacts and dependencies into value chain phases (i.e. direct operations, downstream and upstream) and/or into different impact driver categories (see Box 2) as outlined by IPBES,117 the SBTN,118 the Natural Capital Protocol119 and the Transparent project.120 To exemplify this, Appendix 6 contains a table of biodiversity impacts categorised into impact driver categories.
As biodiversity loss is interconnected to and shares impact drivers, such as pollution, water-use and land-use change, with other changes to natural capital (e.g. climate change, land and water degradation) (see Key Characteristics), it is helpful for companies to detail their dependencies and impacts on biodiversity in the context of wider natural capital changes and social issues affecting the business. Graphical representations may be helpful in this respect. This contextualisation offers report users the opportunity to understand:
• The position of biodiversity impacts and dependencies within the complex web of natural systems;
• Risks and opportunities emerging from interconnections and relationships between different changes to natural capital; and
• How the reporting organisation integrates learnings from interconnections into risk management, strategy and performance.
The thinking and guidance in the Natural Capital Protocol,121 the Principles of Integrated Capitals Assessments,122 British Standard Institute (BSI)’s standard on natural capital accounting for organisations123 and International <IR> Framework,124, xxxi can support (1) the wider
xxx For practical suggestions refer to the Natural Capital Protocol (e.g. value chain in Table 3.6 and Table 5.4).
xxxi IIRC is as of 2021 is now part of The Value Reporting Foundation.

37 CDSB Framework 37 CDSB Framework | Application guidance for biodiversity-related disclosures
understanding of the relationships between natural capital and also other capitals and (2) the preparation of effective disclosures.
Finally, disclosing relevant metrics and valuations can help report users to understand the relevance and magnitude of dependencies and impacts (see REQ-03 and REQ-04 for further details). Methods to measure dependencies are a current research gap and may be challenging (see REQ-03).
1.3 Reporting priority species, ecosystems, geographical areas and products/servicesThe dependency and impact assessment (also in combination with materiality and risk assessment) should support the identification of species, ecosystems, geographical areas and
products/services that are priorities to the organisation from a biodiversity management perspective. A concise overview of these priorities can provide useful context to the report user, enabling them to determine how they have been addressed through policies, targets and management activities. Priority elements reported should be within the organisational boundaries set and should consider the value chain, as well as future operations that have a degree of certainty.
Table 1 contains a summary of considerations for determining priority species, ecosystems and habitats, geographical areas and products/services, as well as useful details/indicators to report for each element.
xxxii For example, species classified as Critically Endangered, Endangered or Vulnerable on the IUCN Red List of Threatened Species or species known to be locally threatened (e.g. on a national Red List).
Table 1. Determining priority species, ecosystems, geographical areas and products/services - considerations and useful indicators (Adapted from: IUCN Guidelines for planning and monitoring corporate biodiversity performance and GRI 304 on Biodiversity)
xxxiii The IUCN Habitat Classification Scheme and IUCN Ecosystem Typology are useful resources.
Priority element Considerations Useful details or indicators to disclose
Species • Species commonly impacted by business activities (e.g. forest dependent birds whose habitat is cleared for agriculture, marine mammals struck by vessels). This should also include species impacted by downstream value chain activities (e.g. consumer use of products).
• Threatened species within areas impacted by business activities (whether impacted directly or not).xxxii
• Species that are unique to (i.e. restricted to) or dependent on the sites or habitats the company operates in.
• Species important for business continuity (e.g. because they are necessary for the final ecosystem services the organisation depends on, such as pollination).
• Species that are important for local stakeholders (e.g. of cultural value to local or indigenous people, or are necessary for the final ecosystem services that stakeholders are dependent on).
• List of priority species deemed to constitute material information, including a brief explanation linked to the geographic context of the business.
• Protected and extinction risk status of species, referring to external guidance, such as the International Union for Conservation of Nature (IUCN) Red List of Threatened Species.
Ecosystems and habitats
• Ecosystems commonly impacted by business activities (e.g. mangroves or seagrass beds being used by marine construction companies).
• Level of threat to ecosystems that are commonly impacted by business activities.
• Habitats unique to sites the company operates in or very localised habitats (e.g. seamounts or coastal upwellings).
• List of priority ecosystems and habitats deemed to be significant that the organisation interacts with, including a brief explanation linked to the context of the business and geographical details.xxxiii
• Level of ecosystem threat, with reference to external resources, such as the IUCN Red List of Ecosystems or conserved or protected areas.
• Extent of ecosystems and habitats, where possible.
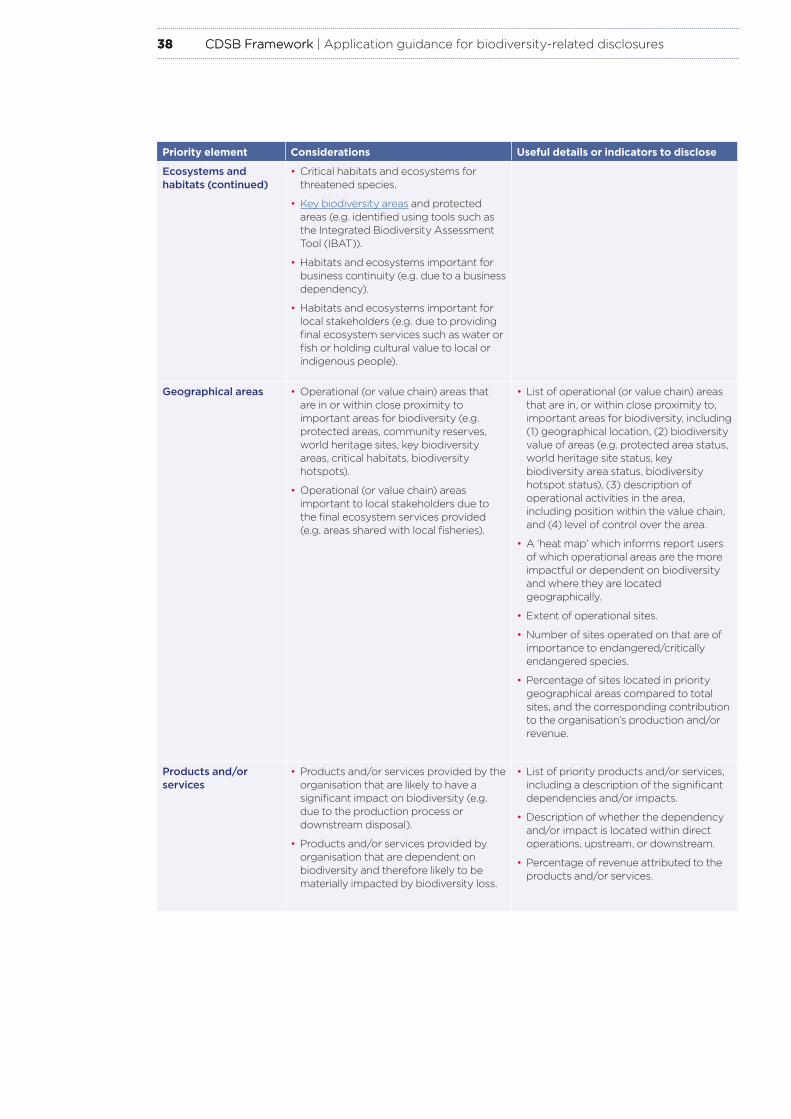
38 CDSB Framework 38 CDSB Framework | Application guidance for biodiversity-related disclosures
Priority element Considerations Useful details or indicators to disclose
Ecosystems and habitats (continued)
• Critical habitats and ecosystems for threatened species.
• Key biodiversity areas and protected areas (e.g. identified using tools such as the Integrated Biodiversity Assessment Tool (IBAT)).
• Habitats and ecosystems important for business continuity (e.g. due to a business dependency).
• Habitats and ecosystems important for local stakeholders (e.g. due to providing final ecosystem services such as water or fish or holding cultural value to local or indigenous people).
Geographical areas • Operational (or value chain) areas that are in or within close proximity to important areas for biodiversity (e.g. protected areas, community reserves, world heritage sites, key biodiversity areas, critical habitats, biodiversity hotspots).
• Operational (or value chain) areas important to local stakeholders due to the final ecosystem services provided (e.g. areas shared with local fisheries).
• List of operational (or value chain) areas that are in, or within close proximity to, important areas for biodiversity, including (1) geographical location, (2) biodiversity value of areas (e.g. protected area status, world heritage site status, key biodiversity area status, biodiversity hotspot status), (3) description of operational activities in the area, including position within the value chain, and (4) level of control over the area.
• A ‘heat map’ which informs report users of which operational areas are the more impactful or dependent on biodiversity and where they are located geographically.
• Extent of operational sites.
• Number of sites operated on that are of importance to endangered/critically endangered species.
• Percentage of sites located in priority geographical areas compared to total sites, and the corresponding contribution to the organisation’s production and/or revenue.
Products and/or services
• Products and/or services provided by the organisation that are likely to have a significant impact on biodiversity (e.g. due to the production process or downstream disposal).
• Products and/or services provided by organisation that are dependent on biodiversity and therefore likely to be materially impacted by biodiversity loss.
• List of priority products and/or services, including a description of the significant dependencies and/or impacts.
• Description of whether the dependency and/or impact is located within direct operations, upstream, or downstream.
• Percentage of revenue attributed to the products and/or services.

39 CDSB Framework 39 CDSB Framework | Application guidance for biodiversity-related disclosures
It may be helpful to aggregate some details for simplicity. For example, details on priority ecosystems could be aggregated into types of ecosystems and details on priority species could be aggregated into different taxonomic levels (such as genus or family) or ecological functions. When reporting details on priority geographical areas, it may be helpful to categorise and/or aggregate areas based on their level of biodiversity priority (e.g. according to habitat quality scores or protected/key biodiversity area status, using tools such as ENCORE,125 STAR,126 and IBAT127 or a combination — see REQ-04 Useful Resources for further details). An example of a detail being aggregated is reporting the percentage of land split into ownership categories as opposed to the level of control for each individual priority geographic area.
Providing an explanation of basis, criteria, or metrics for defining and determining priority species, ecosystems, and geographical areas is helpful for report users, including the considered definitions of classifications, such as protected areas or areas with high biodiversity value.xxxiv
2. Policies and strategies
Organisations should outline policies, strategies and public commitments to protect, restore or sustainably use biodiversity. Report users should be able to understand how identified risks and opportunities (due to dependencies and impacts, see REQ-03) are reflected in the organisation’s strategic development and how they affect biodiversity-related ambitions.
It may be beneficial to set out the reasoning behind the adoption of policies and strategies, explaining how they are mitigating risks and harnessing opportunities identified in the related assessment. The description should be appropriately connected with risk management processes and detail how biodiversity policies and strategies are integrated in the overall business strategy and management (e.g. in assessing organisation performance, overseeing expenditure, costing, acquisitions and divestures, and in assurance processes). Since biodiversity-related risks and opportunities vary greatly according to location and time horizon,
consideration of geography and time is central when reporting on biodiversity-related policies, strategies and targets. For example:
• Biodiversity-related regulations are more likely to be introduced in one country compared to another;
• The nature and severity of biodiversity changes, such as species loss and ecosystem degradation and its implications for the socio-economic conditions, will vary significantly;128, 129
• Risks and impacts related to biodiversity and final ecosystem services may extend well beyond the immediate vicinity of current activities; and
• Potential impacts, opportunities and management approaches vary according to geography.
The details reported will depend on the organisational boundary set (see Reporting boundary and period). It is also useful to explain if specific goals or targets and prioritising actions are in place in priority geographical areas and priority products/services.
It is recommended that strategies and policies are developed in connection to important agreements, policies or targets (e.g. SDGs, Science-based Targets for Nature and United Nations (UN) Convention on Biological Diversity (CBD) post-2020 biodiversity framework), national and regional regulations and goals (e.g. EU Biodiversity Strategy for 2030, the Leaders Pledge for Naturexxxv, the Nature Compact signed by G7 leaders, National Biodiversity Strategy and Action Plans (NBSAPs)), and/or sectoral initiatives (e.g. One Planet Business for Biodiversity which focuses on agriculture, the Finance for Biodiversity pledge and the requirement for International Council on Mining and Metals (ICMM) members to commit to net positive impact). As stated in the CDSB Framework, this is good practice because it provides a basis for comparison, but the relevance to the organisation should be explained. It is also suggested to provide details of compliance to laws in different jurisdictions (e.g. Brazilian forest code or EU Timber Regulation) or mandatory standards (e.g. Indonesian Sustainable Palm Oil standard).
xxxv 88 countries have currently signed, committing to reversing biodiversity loss by 2030.
xxxvi For example, the IUCN categorisation for national protected areas, international protected area designations including UNESCO World Heritage natural and cultural sites, the Ramsar Convention wetlands sites, the UNESCO Man and Biosphere Reserves; or Key Biodiversity Areas — sites that contribute significantly to the global persistence of biodiversity, or other national or regional protected areas or priority sites may be relevant for the organisation.
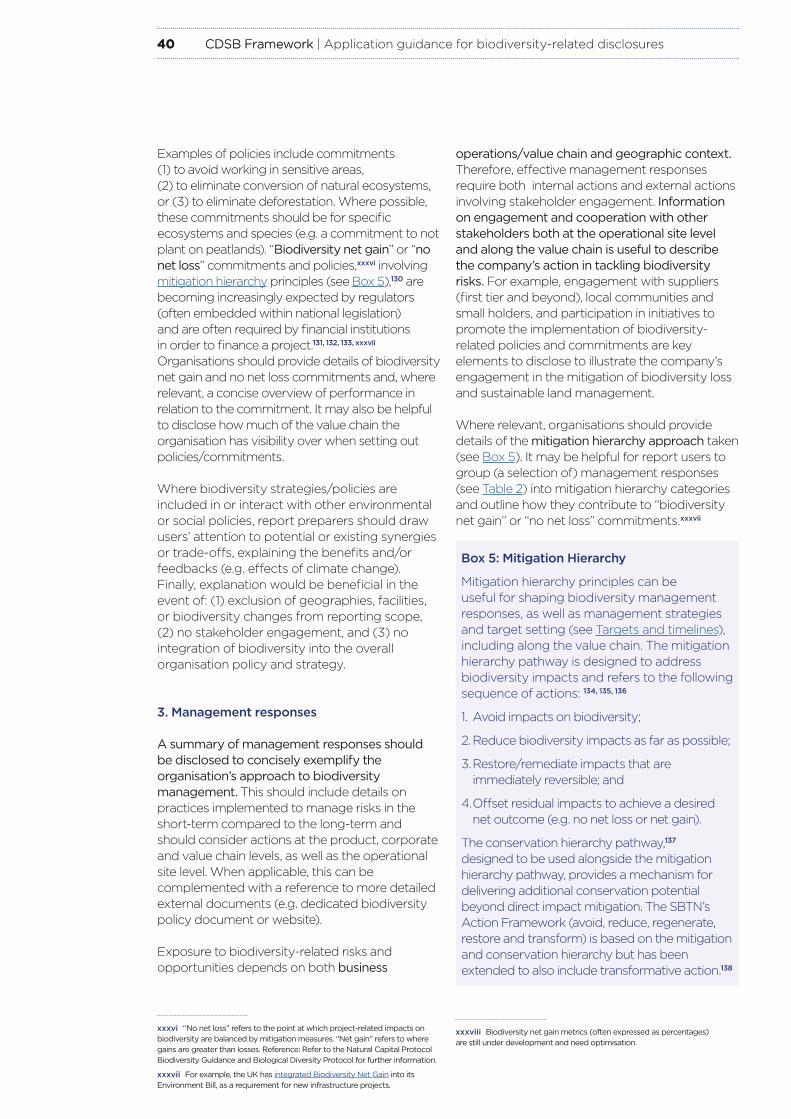
40 CDSB Framework 40 CDSB Framework | Application guidance for biodiversity-related disclosures
Examples of policies include commitments (1) to avoid working in sensitive areas, (2) to eliminate conversion of natural ecosystems, or (3) to eliminate deforestation. Where possible, these commitments should be for specific ecosystems and species (e.g. a commitment to not plant on peatlands). “Biodiversity net gain” or “no net loss” commitments and policies,xxxvi involving mitigation hierarchy principles (see Box 5),130 are becoming increasingly expected by regulators (often embedded within national legislation) and are often required by financial institutions in order to finance a project.131, 132, 133, xxxvii Organisations should provide details of biodiversity net gain and no net loss commitments and, where relevant, a concise overview of performance in relation to the commitment. It may also be helpful to disclose how much of the value chain the organisation has visibility over when setting out policies/commitments.
Where biodiversity strategies/policies are included in or interact with other environmental or social policies, report preparers should draw users’ attention to potential or existing synergies or trade-offs, explaining the benefits and/or feedbacks (e.g. effects of climate change). Finally, explanation would be beneficial in the event of: (1) exclusion of geographies, facilities, or biodiversity changes from reporting scope, (2) no stakeholder engagement, and (3) no integration of biodiversity into the overall organisation policy and strategy.
3. Management responses
A summary of management responses should be disclosed to concisely exemplify the organisation’s approach to biodiversity management. This should include details on practices implemented to manage risks in the short-term compared to the long-term and should consider actions at the product, corporate and value chain levels, as well as the operational site level. When applicable, this can be complemented with a reference to more detailed external documents (e.g. dedicated biodiversity policy document or website).
Exposure to biodiversity-related risks and opportunities depends on both business
operations/value chain and geographic context. Therefore, effective management responses require both internal actions and external actions involving stakeholder engagement. Information on engagement and cooperation with other stakeholders both at the operational site level and along the value chain is useful to describe the company’s action in tackling biodiversity risks. For example, engagement with suppliers (first tier and beyond), local communities and small holders, and participation in initiatives to promote the implementation of biodiversity-related policies and commitments are key elements to disclose to illustrate the company’s engagement in the mitigation of biodiversity loss and sustainable land management.
Where relevant, organisations should provide details of the mitigation hierarchy approach taken (see Box 5). It may be helpful for report users to group (a selection of) management responses (see Table 2) into mitigation hierarchy categories and outline how they contribute to “biodiversity net gain” or “no net loss” commitments.xxxvii
xxxviii Biodiversity net gain metrics (often expressed as percentages) are still under development and need optimisation.
xxxvi “No net loss” refers to the point at which project-related impacts on biodiversity are balanced by mitigation measures. “Net gain” refers to where gains are greater than losses. Reference: Refer to the Natural Capital Protocol Biodiversity Guidance and Biological Diversity Protocol for further information.
xxxvii For example, the UK has integrated Biodiversity Net Gain into its Environment Bill, as a requirement for new infrastructure projects.
Box 5: Mitigation Hierarchy
Mitigation hierarchy principles can be useful for shaping biodiversity management responses, as well as management strategies and target setting (see Targets and timelines), including along the value chain. The mitigation hierarchy pathway is designed to address biodiversity impacts and refers to the following sequence of actions: 134, 135, 136
1. Avoid impacts on biodiversity;
2. Reduce biodiversity impacts as far as possible;
3. Restore/remediate impacts that are immediately reversible; and
4. Offset residual impacts to achieve a desired net outcome (e.g. no net loss or net gain).
The conservation hierarchy pathway,137 designed to be used alongside the mitigation hierarchy pathway, provides a mechanism for delivering additional conservation potential beyond direct impact mitigation. The SBTN’s Action Framework (avoid, reduce, regenerate, restore and transform) is based on the mitigation and conservation hierarchy but has been extended to also include transformative action.138

41 CDSB Framework 41 CDSB Framework | Application guidance for biodiversity-related disclosures
Categorising biodiversity expenditure into levels of hierarchy and providing percentages where possible (e.g. 40% of biodiversity expenditure was on avoiding biodiversity impacts) can also provide useful context.
The first stage of ‘avoidance of impacts’ is the most important, therefore if it is necessary for an organisation to descend the sequence of actions, they should demonstrate why avoidance was not possible. When detailing activities that aim to
offset biodiversity impacts (which should only be performed as the last option of the sequence of actions), organisations should provide access to offsetting methodologies, an explanation of why activities could not follow any of the other mitigation pathways and a statement outlining how ecological equivalency has been achieved.xxxix
Examples of management responses are outlined in Table 2.
Table 2. Examples of management responses to biodiversity risks and opportunities, categorised into internal (responses related to internal policies and business operations), external (responses related to stakeholders outside the organisational boundary), value chain phases (direct operations, upstream, downstream), level (site, corporate, product) and possible mitigation hierarchy category.
Management response Inter-nal
Exter-nal
Value chain position
Level Possible mitigation hierarchy category
Investment in natural infrastructure (e.g. forests for flood protection or wetlands to reduce water treatment costs).
Direct operations; Upstream
Site; Corporate
Avoid; Reduce; Restore
Implementation of projects/initiatives focused on ecosystem restoration and protection, or preventing ecosystem conversion, such as deforestation.
Direct operations; Upstream; Downstream
Site; Corporate
Avoid; Restore
Improving product design to improve longevity, recyclability, circularity, resource efficiency or use of hazardous inputs.
Direct operations; Upstream; Downstream
Product Avoid; Reduce
Minimising the input of virgin materials. Direct operations; Upstream; Downstream
Product Reduce
Production of BAPs which aim to address identified biodiversity impacts and lead to the conservation or enhancement of biodiversity at a local level.
Direct operations; Upstream
Site Reduce; Restore
Create an internal culture of learning around biodiversity and sustainability.
Direct operations
Corporate Avoid; Reduce
Training courses for employees and suppliers. Direct operations; Upstream
Site; Corporate
Avoid; Reduce
Measurement and monitoring procedures in light of risks and opportunities described in REQ-03, including throughout the value chain.
Direct operations; Upstream; Downstream
Site Avoid; Reduce
Measures implemented as a result of legal proceedings or legal obligations, such as changes to operations, processes, products or technology.
Direct operations; Upstream; Downstream
Site; Corporate; Product
Avoid; Reduce
Processes used to integrate biodiversity considerations into site and product selection and design, including the level of ecological sensitivity and methods to minimise ecological impacts such as soil disturbance and erosion, storm water, waste, and wildlife habitat impacts.
Direct operations
Site; Product
Avoid; Reduce
xxxix For further details on ecological equivalency, please refer to the Biological Diversity Protocol, the BBOP Guidance Notes to the Standard on Biodiversity Offsets, DEFRA Biodiversity metrics 3.0 – User Guide.

42 CDSB Framework 42 CDSB Framework | Application guidance for biodiversity-related disclosures
Management response Inter-nal
Exter-nal
Value chain position
Level Possible mitigation hierarchy category
Using standard and certification schemes to independently verify business activities and actions related to biodiversity (e.g. Marine Stewardship Council or Forest Stewardship Council certifications).
Direct operations; Upstream
Site; Product
Avoid; Reduce
Implementing a biodiversity informed procurement strategy which, for example, sources products based on their biodiversity dependency, with the aim of reducing operating and financial risk.
Direct operations; Upstream
Corporate Avoid; Reduce
Gaining relevant biodiversity certifications for production/sourcing of commodities with increased risk (high dependency or impact).
Direct operations; Upstream
Site; Product
Avoid; Reduce
Participating in an extended producer responsibility scheme or applying product stewardship, which extends the producer’s responsibility for a product or service to its end of life.
Downstream Product Reduce
Engaging in/implementing product take-back schemes to divert products and materials from disposal.
Downstream Product Avoid; Reduce
Implementing agreements with third parties to follow specific procedures when managing waste.
Direct operations; Upstream; Downstream
Site; Corporate
Reduce
Where available, setting science-based targets for value chain partners to achieve for their sites and adjacent landscapes/seascapes.
Upstream; Downstream
Site; Corporate
Avoid; Reduce; Restore
Where relevant, design products that enable customers to have more sustainable lifestyles and behaviour.
Downstream Product Avoid; Reduce
Consumer engagement to raise awareness about sustainable consumption practices from a biodiversity perspective.
Downstream Product; Corporate
Avoid; Reduce
Stakeholder engagement activities aimed at integrated biodiversity management influencing governance within an area, and protection and restoration of habitats or ecosystems.
Direct operations; Upstream; Downstream
Site Avoid; Restore
Work with industry coalitions to establish and share best practices.
Direct operations; Upstream; Downstream
Corporate Avoid; Reduce
Implement systems that conciliate production and restoration.
Direct operations; Upstream
Corporate Restore
Advocate to support the effectiveness of biodiversity-related actions from local and national governments and halt similar advocacy efforts that are detrimental to the protection of biodiversity.
Direct operations; Upstream; Downstream
Corporate Avoid; Reduce; Restore
Engage in integrated multi-stakeholder planning for natural resources at the landscape level, including consideration of cumulative impacts.
Direct operations; Upstream
Corporate Avoid; Reduce; Restore
Support of biodiversity restoration efforts where these are linked to business operations, such as funding biodiversity related projects.
Direct operations; Upstream; Downstream
Site; Corporate
Restore
Support species restoration activities, including to reduce extinction risk.
Direct operations; Upstream; Downstream
Corporate Restore
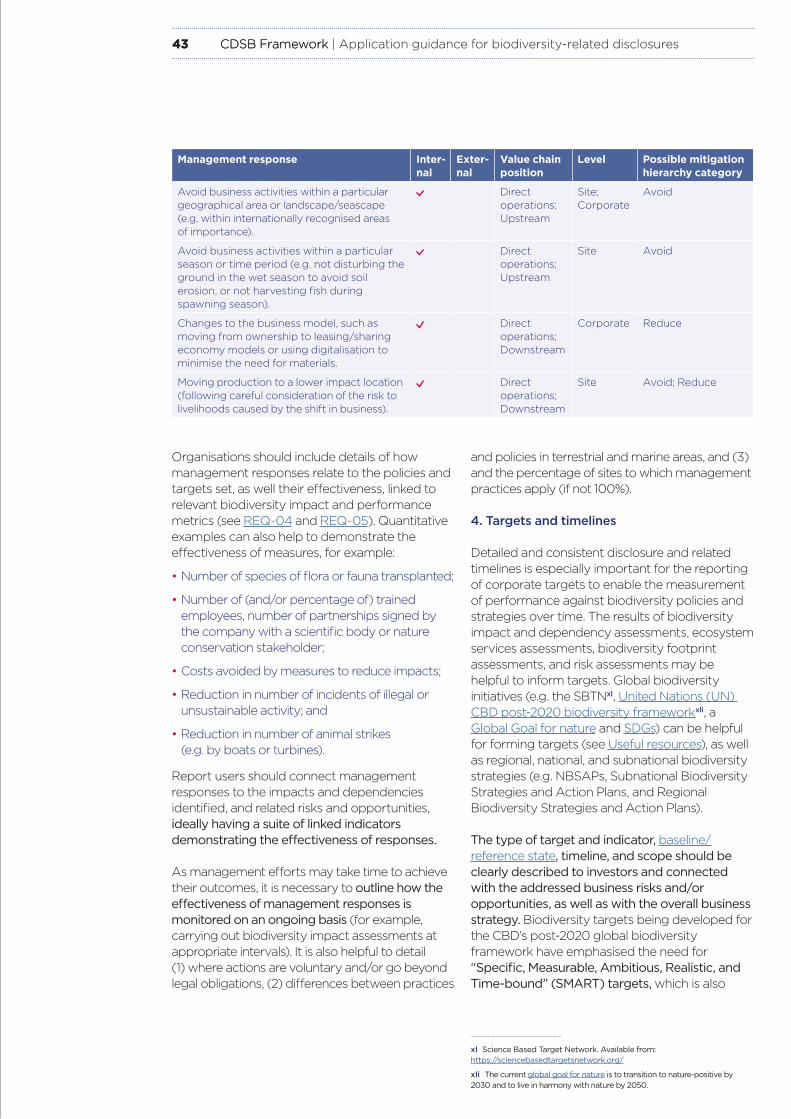
43 CDSB Framework 43 CDSB Framework | Application guidance for biodiversity-related disclosures
Management response Inter-nal
Exter-nal
Value chain position
Level Possible mitigation hierarchy category
Avoid business activities within a particular geographical area or landscape/seascape (e.g. within internationally recognised areas of importance).
Direct operations; Upstream
Site; Corporate
Avoid
Avoid business activities within a particular season or time period (e.g. not disturbing the ground in the wet season to avoid soil erosion, or not harvesting fish during spawning season).
Direct operations; Upstream
Site Avoid
Changes to the business model, such as moving from ownership to leasing/sharing economy models or using digitalisation to minimise the need for materials.
Direct operations; Downstream
Corporate Reduce
Moving production to a lower impact location (following careful consideration of the risk to livelihoods caused by the shift in business).
Direct operations; Downstream
Site Avoid; Reduce
Organisations should include details of how management responses relate to the policies and targets set, as well their effectiveness, linked to relevant biodiversity impact and performance metrics (see REQ-04 and REQ-05). Quantitative examples can also help to demonstrate the effectiveness of measures, for example:
• Number of species of flora or fauna transplanted;
• Number of (and/or percentage of) trained employees, number of partnerships signed by the company with a scientific body or nature conservation stakeholder;
• Costs avoided by measures to reduce impacts;
• Reduction in number of incidents of illegal or unsustainable activity; and
• Reduction in number of animal strikes (e.g. by boats or turbines).
Report users should connect management responses to the impacts and dependencies identified, and related risks and opportunities, ideally having a suite of linked indicators demonstrating the effectiveness of responses.
As management efforts may take time to achieve their outcomes, it is necessary to outline how the effectiveness of management responses is monitored on an ongoing basis (for example, carrying out biodiversity impact assessments at appropriate intervals). It is also helpful to detail (1) where actions are voluntary and/or go beyond legal obligations, (2) differences between practices
and policies in terrestrial and marine areas, and (3) and the percentage of sites to which management practices apply (if not 100%).
4. Targets and timelines
Detailed and consistent disclosure and related timelines is especially important for the reporting of corporate targets to enable the measurement of performance against biodiversity policies and strategies over time. The results of biodiversity impact and dependency assessments, ecosystem services assessments, biodiversity footprint assessments, and risk assessments may be helpful to inform targets. Global biodiversity initiatives (e.g. the SBTNxl, United Nations (UN) CBD post-2020 biodiversity frameworkxli, a Global Goal for nature and SDGs) can be helpful for forming targets (see Useful resources), as well as regional, national, and subnational biodiversity strategies (e.g. NBSAPs, Subnational Biodiversity Strategies and Action Plans, and Regional Biodiversity Strategies and Action Plans).
The type of target and indicator, baseline/reference state, timeline, and scope should be clearly described to investors and connected with the addressed business risks and/or opportunities, as well as with the overall business strategy. Biodiversity targets being developed for the CBD’s post-2020 global biodiversity framework have emphasised the need for “Specific, Measurable, Ambitious, Realistic, and Time-bound” (SMART) targets, which is also
xl Science Based Target Network. Available from: https://sciencebasedtargetsnetwork.org/
xli The current global goal for nature is to transition to nature-positive by 2030 and to live in harmony with nature by 2050.

44 CDSB Framework 44 CDSB Framework | Application guidance for biodiversity-related disclosures
encouraged for organisations.139 The SBTN defines science-based targets as being measurable, actionable, and time-bounded, based on the best available science, that allow actors to align with Earth’s limits and societal sustainability goals.140 Whilst defining the planetary boundary for biodiversity is challenging,141 the principles of planetary boundaries142 can be useful for guiding biodiversity target-setting within the context of other societal risks. The National Biodiversity Account (e.g. based on the UN System of Environmental Economic Accounting (SEEA)143) developed by the National Statistical Office can help organisations to define targets which are specific for different contexts.
Targets should follow the principles set out in the CDSB framework, with useful details to report including:
• Are the targets contextual and science-based?
• Have the baseline/reference state and target year been defined?
• Are targets quantifiable?
• Are specific targets set for priority species, ecosystems, geographical areas and products/services or for areas where no biodiversity standards exist (e.g. set by regulatory mechanisms)?
• Are targets measured through KPIs and are these used internally by management?
• Have targets been discussed with stakeholders? Will they fulfil stakeholder expectations?
• Are targets aligned with international goals, and/or with regional, national, or local regulations?
• How do targets link to and contribute towards commitments such as “no net loss” or “net gain” and/or commitments in response to regulatory or impact drivers?
Due to the variability of biodiversity impacts over time (see Key characteristics), it may be beneficial to set timelines for targets according to how the organisation has defined the short-, medium- and long-term in its risk and outlook analysis. Due to the geographical variation in biodiversity priorities, as well as differing legal and regulatory requirements, targets may need to be tailored to different locations or be specific to categories of areas based on their risk-ratings (e.g. specific targets for priority geographical areas).
As an organisation progresses with its biodiversity strategies and policies, it is beneficial to explain its progress towards targets and what factors have been intrinsic to achieving or surpassing the targets. Progress towards targets may be expressed in terms of reducing negative impacts but also through more proactive targets. REQ-05 contains examples of indicators. When targets have been or are likely to be missed, this should be rationalised, detailing factors that were significant and explaining what could have been and could not be controlled or better managed. Explaining how strategies will be adapted to improve performance as a result would be of particular interest to report users.
Where biodiversity targets interact with other environmental or social policies, report preparers should draw users’ attention to potential or existing synergies, explaining the benefits and/or feedbacks (e.g. effects of climate change).
5. Resourcing
When reporting on biodiversity-related policies, strategies and targets, companies should set out the resourcing, both financial and personnel, for meeting the delivery of the biodiversity policies and strategy. Such detail in a mainstream report can offer investors reassurance of the organisation’s commitment and effort to meeting its biodiversity ambitions. Reporting on resourcing is especially important if the organisation’s strategy requires significant capital investment or operation reorganisation to meet its ambitions. Additionally, specific resources in place in priority geographical areas should be detailed.

45 CDSB Framework 45 CDSB Framework | Application guidance for biodiversity-related disclosures
Useful Resources: Biodiversity impact and dependency assessment / footprint assessment
1. The Biodiversity Guidance to accompany the Natural Capital Protocol offers a decision-making framework for completing a biodiversity-inclusive natural capital assessment, allowing organisations to identify, measure and value their direct and indirect impacts and dependencies on biodiversity. The Biodiversity Guidance Navigation Tool guides users through a biodiversity-inclusive natural capital assessment, following the steps in the Natural Capital Protocol and suggesting specific tools, resources and methodologies based on the scope/area of the value chain a company sits.
2. Stage 1 of the IUCN Guidelines for planning and monitoring corporate biodiversity performance offers guidance around defining the corporate scope of biodiversity influence, identifying which pressures (drivers) and dependencies are the most important for a company to tackle, based on the importance of each pressure and the level of control, as well as identifying priority species, habitats, areas and ecosystem services.
3. The Good Practices for the Collection of Biodiversity Baseline Data by the Multilateral Financing Institutions Biodiversity Working Group & Cross Sector Biodiversity Initiative supports the implementation of biodiversity-inclusive impact assessments (in particular for Environmental and Social Impact Assessments) and management planning, by providing a step-by-step approach (from the identification of the area to long term monitoring) and a useful summary and checklist. This resource is also useful for REQ-04.
4. Bioscope provides businesses with a simple and fast indication of the most important impacts on biodiversity arising from their supply chain, including the potential impact of commodities purchased as well as the upstream supply chain.
5. The first and the second stage of the Biodiversity indicators for site-based impacts methodology support the identification of sites (operations) with potentially high biodiversity significance.
6. GRI 304 disclosure standards on biodiversity include a disclosure on operational sites owned, leased, managed in, or adjacent to protected areas and areas of high biodiversity value.
7. The Biological Diversity Protocol is currently the only existing accounting framework for biodiversity footprint assessments. It offers an accounting and reporting framework that enables organisations to produce Statements of Biodiversity Position and Performance, which can be used to measure performance and risk over time.
8. Among other information, the Biodiversity A to Z provides biodiversity-related data at the country level, such as recognised protected areas and biodiversity designations.
9. Tools providing interactive maps can support the assessment of dependencies and impacts:
• ENCORE allows the exploration of dependencies (on ecosystem services) and impacts (on ecosystems) on nature of businesses across all sectors. Additionally, the biodiversity module allows users to assess the potential to reduce species extinction and ecological integrity risk of portfolios (using the STAR metric).
• The IBAT tool provides geographic information about global biodiversity (i.e. World Database on Protected Areas, IUCN Red List of Threatened Species, and the World Database of Key Biodiversity Areas) that support the assessment of priority areas and impact. The results of the assessment can indicate whether companies might contribute towards species extinction risk, changes to species abundance, deterioration of indigenous peoples’ protected areas, also through metrics such as the Biodiversity Impact Metric (which uses the Rarity-weighted Species Richness data from the IUCN Red List) and the STAR Metric scores per site.
• The Global Forest Watch is a tool for exploring and monitoring forest changes and associated biodiversity impacts in different areas through interactive maps and country dashboard.
• The Ocean Data Viewer allows users to view (and download) a range of spatial datasets on marine and coastal biodiversity that are useful for informing decisions regarding the conservation of marine and ocean ecosystems.
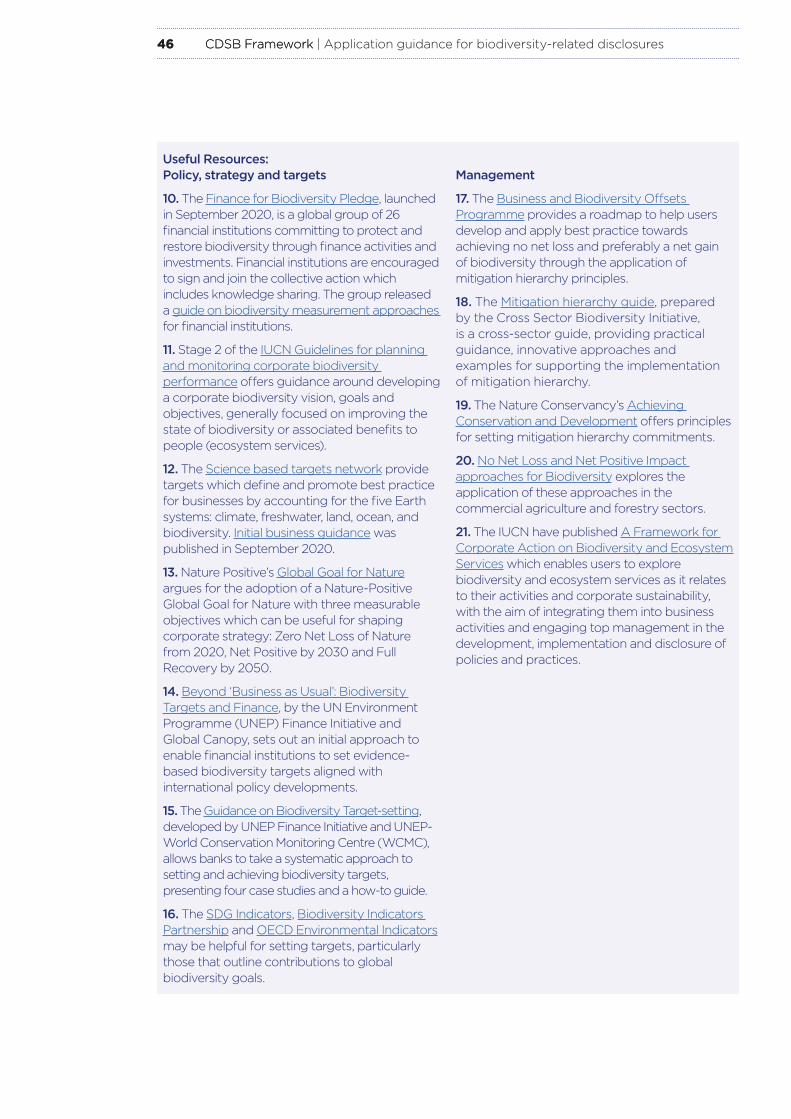
46 CDSB Framework 46 CDSB Framework | Application guidance for biodiversity-related disclosures
Useful Resources: Policy, strategy and targets
10. The Finance for Biodiversity Pledge, launched in September 2020, is a global group of 26 financial institutions committing to protect and restore biodiversity through finance activities and investments. Financial institutions are encouraged to sign and join the collective action which includes knowledge sharing. The group released a guide on biodiversity measurement approaches for financial institutions.
11. Stage 2 of the IUCN Guidelines for planning and monitoring corporate biodiversity performance offers guidance around developing a corporate biodiversity vision, goals and objectives, generally focused on improving the state of biodiversity or associated benefits to people (ecosystem services).
12. The Science based targets network provide targets which define and promote best practice for businesses by accounting for the five Earth systems: climate, freshwater, land, ocean, and biodiversity. Initial business guidance was published in September 2020.
13. Nature Positive’s Global Goal for Nature argues for the adoption of a Nature-Positive Global Goal for Nature with three measurable objectives which can be useful for shaping corporate strategy: Zero Net Loss of Nature from 2020, Net Positive by 2030 and Full Recovery by 2050.
14. Beyond ‘Business as Usual’: Biodiversity Targets and Finance, by the UN Environment Programme (UNEP) Finance Initiative and Global Canopy, sets out an initial approach to enable financial institutions to set evidence-based biodiversity targets aligned with international policy developments.
15. The Guidance on Biodiversity Target-setting, developed by UNEP Finance Initiative and UNEP- World Conservation Monitoring Centre (WCMC), allows banks to take a systematic approach to setting and achieving biodiversity targets, presenting four case studies and a how-to guide.
16. The SDG Indicators, Biodiversity Indicators Partnership and OECD Environmental Indicators may be helpful for setting targets, particularly those that outline contributions to global biodiversity goals.
Management
17. The Business and Biodiversity Offsets Programme provides a roadmap to help users develop and apply best practice towards achieving no net loss and preferably a net gain of biodiversity through the application of mitigation hierarchy principles.
18. The Mitigation hierarchy guide, prepared by the Cross Sector Biodiversity Initiative, is a cross-sector guide, providing practical guidance, innovative approaches and examples for supporting the implementation of mitigation hierarchy.
19. The Nature Conservancy’s Achieving Conservation and Development offers principles for setting mitigation hierarchy commitments.
20. No Net Loss and Net Positive Impact approaches for Biodiversity explores the application of these approaches in the commercial agriculture and forestry sectors.
21. The IUCN have published A Framework for Corporate Action on Biodiversity and Ecosystem Services which enables users to explore biodiversity and ecosystem services as it relates to their activities and corporate sustainability, with the aim of integrating them into business activities and engaging top management in the development, implementation and disclosure of policies and practices.
https://www.unepfi.org/wordpress/wp-content/uploads/2020/06/Beyond-Business-As-Usual-Full-Report.pdf
https://www.unepfi.org/wordpress/wp-content/uploads/2020/06/Beyond-Business-As-Usual-Full-Report.pdf
https://www.besnet.world/sites/default/files/mediafile/Biodiversity%20Offset%20Design%20Handbook.pdf

47 CDSB Framework 47 CDSB Framework | Application guidance for biodiversity-related disclosures
Examples
1. Repsol Integrated Management Report 2020 describes the context around the company’s biodiversity-related disclosures; ecosystems in general and biodiversity in particular are a key component of its natural capital. The company discloses potential impacts on biodiversity by defining relevant activities, describing related impacts and likelihood, and distinguishing between operation phases (pg. 75).
2. Iberdrola Biodiversity Report 2018-2019 describes the main biodiversity dependencies and potential impacts. Relevant project stages and tools used to evaluate the impact of activities in different project stages are also disclosed (pgs.35-38 — linked to REQ-04). The company describes its biodiversity policy and action plan (pg. 21), which includes achieving “No Net Loss” of biodiversity by 2030. It describes that this target is based on the mitigation hierarchy principle in all activities and continual improvement of biodiversity protection standards. Management tools adopted to implement commitments are also disclosed (e.g. Group Biodiversity Policy, BAPs, EIAs for new projects, etc.) (pg. 20). Biodiversity protection and conservation emerge as part of the Group’s overall Environmental Management System (pg. 22).
3. Solvay Annual Report 2020 discloses the pressure points through which the company impacts biodiversity (15 pressures; e.g. GHG emissions, freshwater eutrophication, marine ecotoxicity, and soil acidification) (pg.123). Solvay discloses its commitment to reduce its biodiversity impact by 30% by 2030 compared to the baseline year of 2018, in areas such as climate, terrestrial acidification, water eutrophication, and marine ecotoxicity (calculated using the ReCiPe methodology) (pg. 123). The target was endorsed by the Act4Nature International coalition (pg. 124).
4. Kering Universal Registration Document 2020 clearly summarises its biodiversity strategy. It discloses its target of achieving net positive biodiversity impact by 2025, which is supported by quantitative commitments (e.g. protect 1 million hectares of essential and irreplaceable habitats outside of its supply chain) (pg. 136). Kering has joined the SBTN initiative in order to contribute to the development of science-based methodologies (pg. 177).
5. Firmenich Sustainability Report 2020 communicates the company’s commitment to the CBD Post-2020 framework to reach net positive impact by 2030. It plans on supporting this commitment by combining the use of natural resources with smart developments in green chemistry and white biotechnology (pg. 49).
6. FrieslandCampina Annual Report 2020 describes the strategy it has adopted to address the risks resulting from flora and fauna deteriorating in the Netherlands, threatening the milk production of its dairy suppliers (linked to REQ-03). The organisation recognises the extent to which its member dairy farmers influence biodiversity, and incentivises its protection by collaborating with farmers and providing a higher price for sustainably produced milk. The report clearly recognises the shared efforts required to address biodiversity, and states that “the financial perspective needed to really invest in biodiversity and make a real difference is still mostly lacking” and that “improving biodiversity costs money and we all are responsible for this cost, all of society” (pg. 61).
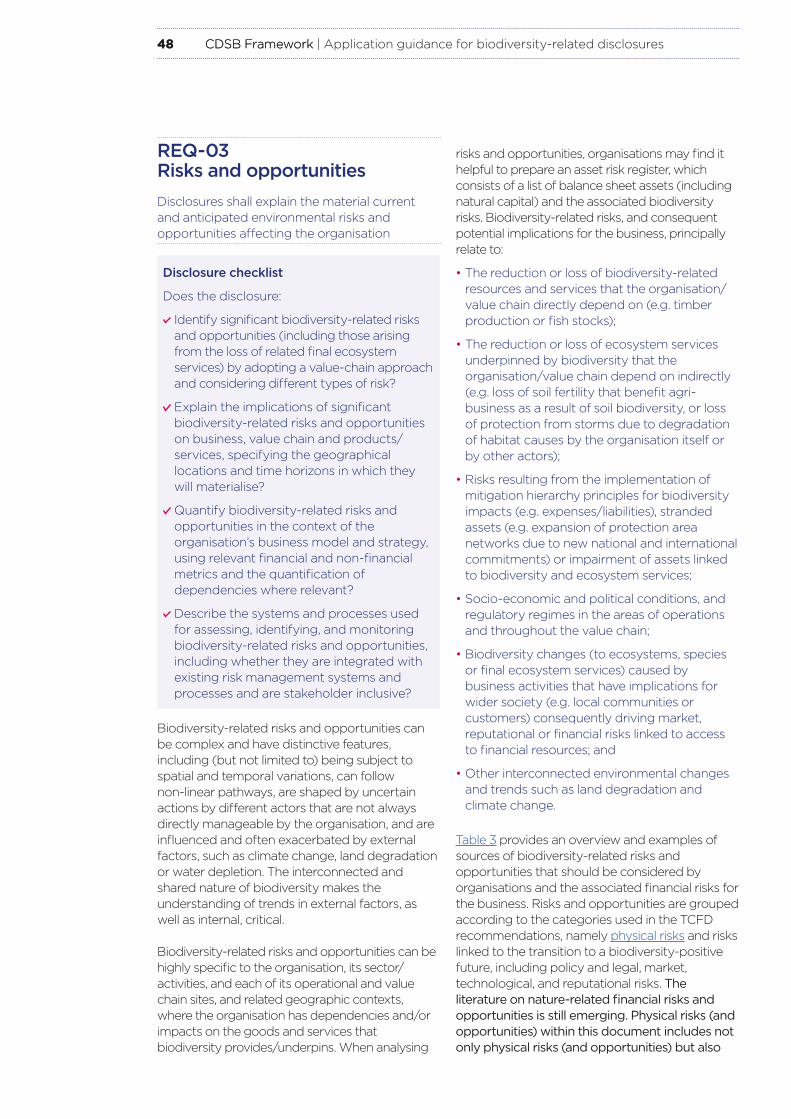
48 CDSB Framework 48 CDSB Framework | Application guidance for biodiversity-related disclosures
REQ-03 Risks and opportunitiesDisclosures shall explain the material current and anticipated environmental risks and opportunities affecting the organisation
Disclosure checklist
Does the disclosure:
Identify significant biodiversity-related risks and opportunities (including those arising from the loss of related final ecosystem services) by adopting a value-chain approach and considering different types of risk?
Explain the implications of significant biodiversity-related risks and opportunities on business, value chain and products/services, specifying the geographical locations and time horizons in which they will materialise?
Quantify biodiversity-related risks and opportunities in the context of the organisation’s business model and strategy, using relevant financial and non-financial metrics and the quantification of dependencies where relevant?
Describe the systems and processes used for assessing, identifying, and monitoring biodiversity-related risks and opportunities, including whether they are integrated with existing risk management systems and processes and are stakeholder inclusive?
Biodiversity-related risks and opportunities can be complex and have distinctive features, including (but not limited to) being subject to spatial and temporal variations, can follow non-linear pathways, are shaped by uncertain actions by different actors that are not always directly manageable by the organisation, and are influenced and often exacerbated by external factors, such as climate change, land degradation or water depletion. The interconnected and shared nature of biodiversity makes the understanding of trends in external factors, as well as internal, critical.
Biodiversity-related risks and opportunities can be highly specific to the organisation, its sector/activities, and each of its operational and value chain sites, and related geographic contexts, where the organisation has dependencies and/or impacts on the goods and services that biodiversity provides/underpins. When analysing
risks and opportunities, organisations may find it helpful to prepare an asset risk register, which consists of a list of balance sheet assets (including natural capital) and the associated biodiversity risks. Biodiversity-related risks, and consequent potential implications for the business, principally relate to:
• The reduction or loss of biodiversity-related resources and services that the organisation/value chain directly depend on (e.g. timber production or fish stocks);
• The reduction or loss of ecosystem services underpinned by biodiversity that the organisation/value chain depend on indirectly (e.g. loss of soil fertility that benefit agri-business as a result of soil biodiversity, or loss of protection from storms due to degradation of habitat causes by the organisation itself or by other actors);
• Risks resulting from the implementation of mitigation hierarchy principles for biodiversity impacts (e.g. expenses/liabilities), stranded assets (e.g. expansion of protection area networks due to new national and international commitments) or impairment of assets linked to biodiversity and ecosystem services;
• Socio-economic and political conditions, and regulatory regimes in the areas of operations and throughout the value chain;
• Biodiversity changes (to ecosystems, species or final ecosystem services) caused by business activities that have implications for wider society (e.g. local communities or customers) consequently driving market, reputational or financial risks linked to access to financial resources; and
• Other interconnected environmental changes and trends such as land degradation and climate change.
Table 3 provides an overview and examples of sources of biodiversity-related risks and opportunities that should be considered by organisations and the associated financial risks for the business. Risks and opportunities are grouped according to the categories used in the TCFD recommendations, namely physical risks and risks linked to the transition to a biodiversity-positive future, including policy and legal, market, technological, and reputational risks. The literature on nature-related financial risks and opportunities is still emerging. Physical risks (and opportunities) within this document includes not only physical risks (and opportunities) but also

49 CDSB Framework 49 CDSB Framework | Application guidance for biodiversity-related disclosures
biological, ecological, chemical and other risks and opportunities.144, 145, 146, 147
The included examples can originate from either the business (e.g. sector and/or activities) or from external geographic context and drivers (e.g. presence of biodiversity-rich areas or effects of climate and land-use change), and
some can fall under more than one risk category or result from cascading effects (e.g. physical risks linked to land and soil degradation can be caused by policy and legal risks, such as poor regulations on biodiversity conservation or on polluting emissions). When selecting which categories to disclose, preparers need to assess what is significant to their organisation.
Sources of biodiversity-related business risks Financial risks for the business
Physical risks
Acute
• Increased natural hazard costs, for example, impaired assets due to damages resulting from floods or cyclones, not limited to the organisation’s property (e.g. infrastructures it relies on)
• Reduced revenue and/or increased costs due to interruption of operations or interruption/deterioration of supply chain as a consequence of uncertainty of natural inputs/raw material supply (e.g. loss of pollinators, pests, loss of fish stocks, water), or damage caused by natural hazards
• Increased insurance premiums and potential for reduced availability of insurance on assets
• Increased capital expenditure due to adaptation (e.g. mechanical pollination, protection against floods)
• Reduced productivity and consequent rethinking of production processes or timing (e.g. agricultural production)
• Write-offs, early retirement of existing assets and relocation of operations and suppliers, affecting the costs of raw materials (e.g. transportation)
Degradation of biodiversity and ecosystems and loss of their natural protection (e.g. caused by vegetation clearance for initial clearing for mining sites), which can exacerbate severity of damages from extreme weather events such as cyclones, droughts, flooding and storms B E C W L
BD
FES
Species loss and ecosystem degradation (e.g. loss of connectivity associated with species ranges, impacting flyways or marine migratory corridors) due to leaks or accidental discharges (e.g. oil) contaminating air, soil and water bodies by the organisation itself or by other stakeholders located in the same area B E W L
BD
Disease or pests affecting the species or variety of crop the organisation relies on, especially in the case of no or low genetic diversity B E
BD
Chronic
Increasing scarcity or variable production of key natural inputs B E C W L
FES
Ecosystem degradation due to operations leading to, for example, coastal erosion and forest fragmentation B E C W L
BD
Ocean acidification (due to industrial waste or improper land management) causing degradation of reef, coastal and planktonic ecosystems and consequent losses of aquatic biodiversity E C W
BD
Overfishing and bycatch B E FES
Land loss to desertification and soil degradation and consequent loss of soil fertility B E C L
BD
FES
Species loss and ecosystem degradation due to contamination of air, soil and water bodies (e.g. pesticides) caused by the organisation itself or by other stakeholders located in the same area (also cumulative) B E W L
BD
Table 3. Biodiversity-related financial risks and opportunities that may guide organisations’ risks (and opportunities) assessment. Examples are classified with BD, when they relate to changes to biodiversity and/or ecosystems, and with FES, when they relate to the loss of final ecosystem services. The provided examples are labelled according to the origin: business-specific risks are labelled with B , and risks that may be caused by external geographic context and drivers are labelled with E . Additionally, links with other environmental drivers are provided: examples linked to climate change are labelled with C , those that are linked to water changes with W , and those that are linked to land-use with L .

50 CDSB Framework 50 CDSB Framework | Application guidance for biodiversity-related disclosures
Sources of biodiversity-related business risks Financial risks for the business
Policy and Legal
Changes to existing legislation and/or new legislation (e.g. creation of new protected areas) or license fees E C W L
BD
FES
• Increased costs of operations and inputs to operations (e.g. higher charges for extracting groundwater, timber or for waste disposal)
• Increased costs of personnel (report preparers, biodiversity experts) and monitoring activities required for reporting activities (e.g. data collection campaigns)
• Increased fines, penalties, compensation, or legal costs (e.g. due to liability for natural capital impacts)
• Increased capital costs or production losses due to permit denials or delays
• Reduced revenue from decreased production capacity due to limited access to natural resources
• Fines due to violation of regulations
• Increased costs and/or reduced demand for products and services resulting from fines and judgments
• Loss of revenues or stranded assets due to loss of a permit to operate from litigation and/or from direct action by the regulator towards non-compliance
• Increased compliance costs
• Disruption of operations or supply due to reduced supply of natural resources caused by poor transboundary governance or poor infrastructures
• Loss of licence to operate due to non-compliance
• Starting delays due to permits
• Increased export costs
Tighter (emerging) legislation (e.g. trades restrictions or taxes) on activities, products and/or services that impacts biodiversity (both species and ecosystems), and rights, permits, and allocations on natural resources designated to alleviate pressure on nature or impacts on local communities (e.g. their access to water, foraging, and hunting) E C W L
BD
FES
Enhanced reporting obligations on biodiversity, ecosystems and related services E
BD
FES
Exposure to sanctions and litigation (e.g. spills of polluting effluents that damage human and ecosystem health; or violation of biodiversity-related rights, permits or allocations; or negligence towards or killing of threatened species) B E
BD
Non-compliance with legislation on, for example, use of natural resources/ecosystems B
BD
FES
Ineffective biodiversity governance in an area, across boundaries (i.e. transboundary governance) and cooperation resulting in biodiversity loss and nature degradation (e.g. biodiversity-rich ecosystems crossing national boundaries) E
BD
Stakeholder conflicts due to competition in the exploitation of resources and ecosystems or due to impacts on biodiversity or ecosystems (e.g. in transboundary protected areas where no cooperation between countries is in place) E L
BD
FES
Market Shifting customer values or preferences to products (e.g. food, textile) with lower impacts on biodiversity and ecosystems (e.g. lower biodiversity footprint) E
BD
FES
• Reduced demand for products and services (reduced market share)
• Increased production costs
• Supply disruption
• Increased raw material or resource costs
• Loss of market access
• Smaller customer base
• Limited or denied access to new markets
Volatility or increased costs of raw materials (e.g. biodiversity-intense inputs for which price has raised due to ecosystem degradation) B E C W L
BD
FES
Technology Transition to more efficient and cleaner technologies (i.e. with lower impacts on biodiversity) B C W L
BD • Expenditure for R&D of new and alternative technologies
• Capital investments in technology development
• Unsuccessful investments in technology
• Increased costs of operations and raw materials (e.g. higher energy use) required to achieve biodiversity-related goals
• Lack of access to technology developed by competitors resulting in higher operational costs
Substitution of existing products and services with lower biodiversity footprint or cleaner emissions options B C W L
BD
Lack of access to data or access to poor quality data that hamper biodiversity-related assessments B E
BD
New monitoring technologies (e.g. satellite) used by regulators E
BD
Adaptation technologies required to cope with new future scenarios and trends (e.g. climate resistant crops, mechanical pollinators, water purification, flood protection) B E C W L
FES

51 CDSB Framework 51 CDSB Framework | Application guidance for biodiversity-related disclosures
Sources of biodiversity-related business risks Financial risks for the business
Reputa-tional
Shifts in consumer sentiment towards the organisation/brand as a result of poor biodiversity management and/or lack of stewardship activities B E
BD • Reduced demand and purchase of products and services
• Workers’ strike (in case of damages to natural resources, ecosystems and their functioning used by local communities)
• Loss of licence to operate (e.g. after community protests)
• Loss of social licence to operate,148 which may also result in stranded assets
• Increased security costs
• Increased staff turnover, higher recruitment and retention costs
• Reduced loyalty of key suppliers or business service providers
Stigmatisation of sector due to impacts on biodiversity and ecosystems (e.g. mining, infrastructures) B E
BD
Stakeholders’ (e.g. communities, activists, stockholders) perceptions, concerns and pressure related to the organisation’s impacts on and management of biodiversity B E
BD
FES
Violation of nature-related rights through operations (e.g. reduced access to timber for local communities; degradation of biodiversity-rich sites that have cultural value for local communities, displacement of indigenous communities) B C W L
BD
FES
Negative media coverage due to impacts on critical species and/or ecosystems B E
BD
Biodiversity social conflicts over endangered species, protected areas, resources or pollution B E C W L
BD
FES
Sources of biodiversity-related opportunities Financial opportunities for the business
Resource Efficiency
Transition to more efficient services and processes requiring less natural resources, energy or impact on biodiversity, ecosystems and their services (e.g. fracking) B E C W L
BD
FES
• Reduced operation and compliance costs
• Reduced exposure to raw materials/natural resources price volatility
• Reduced reliance on natural resources and increased resilience to potential shortagesIncreased reuse and recycling of natural
resources (e.g. circular approach) reducing dependencies and impacts on biodiversity and ecosystems B E C W L
BD
Reduced waste production, effluents and emissions B W L
BD
Products, services, and market
Development of less resource-intense products and services (e.g. adopting regenerative agriculture that restore and preserve soil fertility with a consequent reduction in the use of fertilisers) B E C W L
BD
FES
• Increased resilience due to business diversification
• Access to new markets due to less resource-intense products and services
• Increased insurance coverage and access to new assets that require it
• Access to public-sector incentives
• Reduced costs of raw materials and inputs to production
• New revenue streams (e.g. carbon offsets, sale of surplus water rights, habitat credits)
• Faster access to permits
• Reduced interest rate costs
• Reduced fines and regulatory compliance costs
Development of green solutions (e.g. nature-based solutions or biodiversity-related insurance risk products) B E C W L
BD
Ability to diversify business activities (e.g. new business units on green infrastructures leveraging organisation experience on site remediation) B
BD
FES
Financial incentives
Access to biodiversity-related and/or green funds, bonds, or loans B E C
BD • Increased access to funds and loans
• Access to capital for high-risk projects
Incentives for suppliers to improve their biodiversity and ecosystem management B E
BD

52 CDSB Framework 52 CDSB Framework | Application guidance for biodiversity-related disclosures
When conducting a risk assessment, it is important to adopt a broad approach by ideally considering:
• Different types of potential impact drivers (e.g. resource exploitation, land-use change, contributions to climate change; see Table 8);
• Suitable spatial scales and time periods (see Key characteristics and Reporting expectations and important considerations);
• The cumulative impact over time and of all parties that affect a given geographic area; and
• Any potential thresholds or tipping points as well as the multiple ways in which biodiversity has value to different stakeholders.
Like other risks and opportunities that companies face in the modern, interconnected era, those related to biodiversity require careful consideration, across all the locations of operations and value chain, different time horizons and potential future pathways. For this reason, risk management approaches, horizon scanning, forecasting, sensitivity testing and scenario analysis, which is discussed further below in relation to REQ-06, are amongst the
practical tools that can guide companies in their assessment of risk and opportunities.
1. Detailing risks and opportunities
When disclosing material information about biodiversity-related risks and opportunities in the mainstream report, thoroughly describing them by specifying their key characteristics and explaining their relevance to the organisation offers useful information to report users. In terms of characteristics for high quality reporting, it is essential to properly account for when and where the risk or opportunity may materialise, specifying whether it concerns a specific business area (e.g. priority products/services), a particular region or site (e.g. priority geographical areas) and time horizons, for instance.
Causes and sources of risks and opportunities and their implications for the business (on operations, value chain, business model and financial results) should be described and linked to the dependencies and impacts identified in REQ-02, biodiversity impact metrics (REQ-04), and performance (REQ-05) where appropriate.
Sources of biodiversity-related opportunities Financial opportunities for the business
Resilience Diversification of biodiversity-related resources (e.g. use of different plant species) and business activities (e.g. start a new business unit on ecosystem restoration) B
BD • Increased business stability
• Business and supply chain continuity
• Reduced capital infrastructure costs
• Reduced costs for damages
• Improved risk mitigation via improved understanding of the organisation’s impacts and dependencies on biodiversity
• Increased resilience to natural disasters
• Improved response to regulatory changes
Participation in programmes and adoption of resource-efficiency, recycling and circularity mechanisms that reduce the dependencies and impacts on biodiversity and ecosystems B E C W L
BD
Improved biodiversity-related monitoring activities and data availability B E
BD
Adopting a landscape approach to biodiversity management and implement nature-based solutions B E
BD
Investing in “green” infrastructure (e.g. protecting against natural hazards or improving water filtration by restoring wetlands) B E C W L
BD
FES
Reputation and rela- tionship with stake- holders
Collaborative engagement with stakeholders to tackle biodiversity-related challenges B E
BD • Improved reputation among stakeholders located in areas of operations or value chain
• Improved stability of operations and working conditions
• Improved ability to attract and retain employees
• Increased brand value
• Improved supply chain engagement
• Increased influence of government policy
Improved conditions of biodiversity and ecosystems the organisation relies on (e.g. wetlands restoration can improve water purification) B E C W L
BD
FES

53 CDSB Framework 53 CDSB Framework | Application guidance for biodiversity-related disclosures
Information on material biodiversity-related risks and opportunities should include considerations of and details on:
• Methods and procedures for risk and opportunities assessment and monitoring, as well as materiality assessments, including tools used (e.g. geospatial monitoring tools; ground-based monitoring systems; community-based monitoring; first-, second-, third-party verification; see Tools for assessing biodiversity-related risks), timeframes, risk categories, biodiversity-related issues considered (e.g. compliance with biodiversity-related regulations and/or mandatory standards), stakeholders considered (e.g. only first-tier or beyond suppliers), frequency of assessment and on the integration into overall business risk assessment;
• Geographic specificity and influencing context-specific elements, connected to the priority species, ecosystems, geographic areas and products/services identified in REQ-02 where appropriate, such as geography, climate, status of biodiversity and ecosystems, regulation, location in or proximity to (within, adjacent or near) designated protected areas for biodiversity conservation, and socio-economic conditions (e.g. poverty rates, employment rates, communities traditions in relations to nature, human-wellbeing benefits), as well as stakeholders’ biodiversity-related challenges;
• Variability of risks and opportunities over short-, medium- and long-term time horizons. It is important for companies to explain when risks and opportunities could be expected to materialise and how they may develop through the considered timeframes, highlighting the main differences compared to baseline/reference conditions. The Biodiversity Application Guidance does not define timeframes in order to encourage reporting organisations to consider the most appropriate timeframes for their specific needs (as the timing of biodiversity-related impacts on organisations varies). It is good practice to consider the timing of natural processes the organisation depends or impacts on in a given geographic area (e.g. seasonality, breeding season of key species, migration season etc.) in combination with projections of different future climatic but also socio-economic scenarios to convey uncertainty and possible ranges of future impacts on biodiversity.149 Considering risks and opportunities resulting from long-term biodiversity changes is crucial as some may take years to manifest (e.g. the outcomes of restoration of ecosystems such as rainforests); and
• Scenarios considered in the risk assessment, describing which drivers that may influence the business-biodiversity interactions are included, such as regulations, socio-economic drivers, and environmental drivers like climate change. This information is interconnected with scenario analysis disclosed under REQ-06.
Where biodiversity-related risks interact with other business and environmental risks in amplifying manners (i.e. aggregate risks), it is prudent for companies to identify and explain such connections and feedbacks.
Finally, explanation would be useful (1) if the organisation does not undertake a biodiversity-related risk assessment or (2) if the organisation does not consider itself to be materially exposed to biodiversity-related risks and opportunities.
2. Quantification of financial risks and opportunities
Decision-useful disclosures should illustrate biodiversity-related risks and opportunities through descriptive indicators and financial information which detail the financial implications of such risks and opportunities. Metrics reported should consider appropriate timeframes and may be financial or non-financial. Indicators and metrics from other requirements, such as those considered in the assessment of impacts (REQ- 04) and related to biodiversity policies, management activities and targets, as well as priority species, ecosystems, geographic areas and products/services (REQ-02) may be repurposed to provide useful details. This is particularly the case where aggregated at the corporate level (e.g. percentage of suppliers and operational sites covered by a sustainability certification standard or formalised sustainable management programme) and/or disaggregated into regions and/or business units (e.g. biodiversity footprint assessment metric disaggregated into regions).
Disclosing material biodiversity-related financial information provides a useful illustration of the role of biodiversity in relation to the business model and strategy, and for financial planning purposes. For example, useful indicators related to risks and opportunities include:

54 CDSB Framework 54 CDSB Framework | Application guidance for biodiversity-related disclosures
• Operational expenses, cost savings and revenue associated with biodiversity management and targets (e.g. remediation costs or provisions in the case of accidents like polluting spills, costs to obtain regulatory permits or licences, costs of staff training) and the implementation of the mitigation hierarchy (e.g. costs saved by measures taken to avoid biodiversity impacts and revenue from biodiversity-efficient products and services, capital and operation expenditures of offset requirements), possibly broken down per biodiversity unit (e.g. Euro or US $/hectare (ha) of ecosystem type or taxon);
• Expenses related to legal proceedings linked to non-compliance with environmental law influencing biodiversity or biodiversity incidents (e.g. fines in relation to water and soil contamination and/or air emissions, or court-ordered remediation costs); and
• Transactions contingent to biodiversity-related rights of access or use. For example, a fishing corporation could disclose the financial value of its fishing rights and the associated changes in the state of fish stocks linked to overfishing; a forestry company could disclose the financial value of its logging concession rights and the associated changes in the state of harvested forests; and an agri-business could disclose the financial value of its key commodities and associated changes in the state of natural capital (e.g. soils, water resources, as well as access-and-benefit sharing arrangements regarding genetic resources for various industries such as chemistry, pharmaceuticals etc.).
Additionally, where organisations have trade-offs around “natural” biodiversity in addressing biodiversity risks (e.g. replacing natural systems with crop plantations), valuations of the externalities generated (benefits and costs) can be helpful. The report user should be offered the assumptions and essential figures (e.g. present value of asset or revenue stream affected) as well as the uncertainties for the financial figures, especially if the size of the risk or opportunity varies largely over time.
Non-financial metrics are useful to report where they provide context around the risk magnitude in relation to business operations. Examples of non-financial metrics that may be useful to disclose include:
• Percentage of operational sites that are in or near protected areas, priority sites for biodiversity conservation and/or key biodiversity areas (e.g. UNESCO World Heritage natural and cultural sites, the Ramsar Convention wetlands sites,
the UNESCO Man and Biosphere Reserves; or Key Biodiversity Areas); and
• Total number of IUCN Red List species and national conservation list species with habitats located in areas impacted by business operations by level of extinction risk (i.e. critically endangered, endangered, vulnerable, near threatened, or least concern).
The quantification of dependencies on biodiversity, often related to the final ecosystem services provided/underpinned by biodiversity, is particularly useful for demonstrating the magnitude of biodiversity risks and possible implications to its financial position and performance. However, this is a developing area with limited methodologies currently available. The use of valuation methodologies can support this process (see REQ-04 for additional details).
A possible approach to disclose financial information linked to dependencies is to connect the dependent final ecosystem services provided (which are underpinned by biodiversity) to the related financial accounts, such as assets (e.g. fish stocks), revenues (e.g. sales of wild fish) and expenses. Example indicators include the income generated from sale of nature-dependent resources (e.g. fisheries or crops), income generated from nature-based tourism, or eco-efficiency ratings, such as tons of wild fish per total revenue/sales. Non-financial metrics that measure the organisation dependencies on biodiversity are also particularly useful to investors. For example, metrics on (1) natural resources used as inputs to operations/production processes, such as a certain amount of water available to withdrawals, certain agricultural area and related fertile soil, or on (2) outputs from production, such as the amount of crops guaranteed by pollination and biological pest control.
3. Connecting information
While the CDSB Framework does not set out specific reporting requirements, Principle 3 encourages organisations to explain whether and to what extent biodiversity-related issues are connected with other information and results in the mainstream report, with REQ-03 explaining that links should be made to the reporting of processes and systems for risks and opportunities. For example, report users should be able to understand how biodiversity-related issues have been incorporated into existing systems of risk identification and prioritisation and whether the systems have been adapted to accommodate the characteristics of biodiversity-related issues. Furthermore, the systems used to identify biodiversity-related risks and opportunities will

55 CDSB Framework 55 CDSB Framework | Application guidance for biodiversity-related disclosures
develop in coming years with greater understanding of the link between biodiversity and environmental, regulatory, socio-economic and technological pathways in the different areas. Setting out how the organisation is developing and adapting these systems (also by linking to REQ-01 and REQ-02) will demonstrate responsive and effective management.
In addition, the mainstream report should be designed in a manner that allows the reader to navigate from these risks and opportunities to the policies and strategies developed, and to risk management systems, including an explanation of how the organisation considers short-, medium- and long-term issues in linkage with disclosures under REQ-02.
1. The Integrated Biodiversity Assessment Tool (IBAT, see REQ-02 and REQ-04) can support the categorisation of locations based on risk of biodiversity loss (and consequent financial risks): for a particular site, land management unit, or country/province, the STAR metric shows the potential for reducing extinction risk before investment activities start, or can measure the achieved impact of conservation interventions on extinction risk over time (ex-post measure).
2. The Agrobiodiversity Index measures biodiversity across nutrition, agriculture and genetic resources, identifying risks and opportunities as well as assisting with management.
3. The biodiversity module of ENCORE provides insights on the portfolio exposure to species extinction and ecological integrity risks, and related mitigation actions. These results can support the categorisation of locations based on biodiversity-related risks, the alignment of financial portfolios with global biodiversity targets, and assessment of financial risks.
4. Trase Earth Tool maps financing and ownership of trading companies at scale to assess the exposure of financial institutions to deforestation risk.
5. OHI+ uses the Ocean Health index to allow exploration of variables influencing ocean health at small scales where management decisions can be made.
Tools for assessing biodiversity-related risks
The use of existing tools for assessing the biodiversity-related status and risks in operations, supply, and market, can inform and support organisation materiality assessment.
These tools represent useful ready-to-use resources, but companies should (1) understand the assumptions and the methodology behind the selected tool(s), (2) combine different tools when performing their risk assessment, and (3) integrate company-specific components and information in the assessment (e.g. local regulations or risks).
Examples
1. Kering Universal Registration Document 2020 lists biodiversity as one of the Group’s ‘social and environmental responsibility risks’ (pg. 80 and pg. 462). For example, the loss of biodiversity caused by intensive livestock farming, threatens the production of high-quality raw materials. The company recognises that more generally, the degradation and depletion of soil, as well as the destruction of biotopes, pose a significant risk to the maintenance of high-quality livestock and crop farming (pg. 480).
2. Symrise Group Management Report 2020 addresses biodiversity-related risks in relation to own operations and the value chain. It recognises that environmental issues such as biodiversity loss can negatively impact the productivity of the ecosystems managed by the company and its suppliers, which threatens raw material availability or could lead to increasing raw material prices (pg.
55). In line with REQ-02, the company discloses its resulting risk minimisation efforts (e.g. development of solutions for key raw materials; reworking recipes with customers; identification of alternative suppliers and countries for raw material sourcing) (pg. 55).
3. Cemex Annual Report 2020 provides an example of financial opportunities linked to biodiversity; Quarry biodiversity conservation is one of the KPIs included in the company’s recently issued sustainability-linked loan (October 2021, 3.2$billion; the largest sustainability-linked loan to-date in South America).
4. The BHP Annual Report 2021 describes the biodiversity-related risks identified by the company. This includes failure to identify and manage climate change risks to communities, biodiversity and ecosystems, which in turn could result in land access restrictions or litigation, or limit the company’s access to new opportunities (pg. 58).

56 CDSB Framework 56 CDSB Framework | Application guidance for biodiversity-related disclosures
Useful resources
1. UNEP-WCMC’s report Biodiversity measures for business illustrates probable physical, transitional, and reputational biodiversity-related risks, and provides forecasts on expected national and regional regulations with biodiversity reporting obligations.
2. The report Handbook for Nature-related Financial Risks details transmission channels that make nature loss a financial risk and outlines a framework to identify nature-related financial risks.
3. The report Guidelines for Identifying Business Risks and Opportunities Arising from Ecosystem Change by World Business Council for Sustainable Development (WBCSD), the Meridian Institute and World Resources Institute (WRI), provides a structured methodology that helps organisations to develop strategies to manage business risks and opportunities arising from their company’s dependence and impact on ecosystems (and related services). The report also includes case studies.
4. The report The Climate-Nature Nexus: Implications for the Financial Sector takes a practical look at where climate- and nature-related risks and opportunities do and do not overlap (see Figure 1 on pg. 4), highlights the implications for investment potential of different sectors and solutions, and offers recommendations on how the private financial sector can adapt its climate approaches to address nature and be robust to nature-related risks (see Figure 2 on pg. 5, it provides an overview of the current climate frameworks — e.g. screening of physical risks, impact metrics — that can be adapted to capture nature risks and opportunities).
5. The report The pollination deficit - Towards supply chain resilience in the face of pollinator decline supports the understanding of risks related to loss of pollinators risk within private sector (agricultural) supply chains. In particular, the report provides examples of dependencies, risks and potential responses, some real case studies, and a roadmap towards sustainable pollinator management.
6. The report Indebted to nature – Exploring biodiversity risks for the Dutch financial sector and the working paper A “Silent Spring” for the Financial System? Exploring Biodiversity-Related Financial Risks in France explores the biodiversity-related financial risks of the Dutch and French financial system, respectively. It covers physical (through dependencies on ecosystem services) and transition risks (through impacts on terrestrial and freshwater ecosystems).
7. The IFC’s Guidance Note 6: Biodiversity Conservation and Sustainable Management of Living Natural Resources supports the risks and impacts identification process. The requirements of this performance standard support the assessment of projects that potentially impact on or are dependent on ecosystem services over which the organisation has direct management control or significant influence (also useful for REQ 02).
8. Swiss Re Institute’s Biodiversity and Ecosystem Services Index analysis highlights which economic sectors are most reliant on nature and the exposure each country has to biodiversity and ecosystems services decline.

57 CDSB Framework 57 CDSB Framework | Application guidance for biodiversity-related disclosures
REQ-04 Sources of environmental impactQuantitative and qualitative results, together with the methodologies used to prepare them, shall be reported to reflect material sources of environmental impact
Disclosure checklist
Does the disclosure:
Provide a selection of relevant biodiversity impact indicators and metrics, considering sources of material biodiversity impacts, changes to the state of biodiversity and valuation of impacts?
Provide relevant baselines/reference states for metrics, and both absolute and normalised metrics where possible?
Provide explanations and contextualisation of the metrics including the methodologies used, levels of uncertainty, and appropriate narrative to assist understanding of results?
Categorise and disaggregate metrics where possible to support understanding and comparability?
1. Indicators and metrics
As explained in REQ-02, the significant biodiversity impacts and dependencies, which are connected to business risks and opportunities, should drive the formation of biodiversity-related policies, strategies and targets. REQ-04 of the CDSB Framework requires companies to disclose quantitative and qualitative results to reflect significant sources of impacts, including reporting key indicators and metrics. When considering biodiversity, this should be expanded to include key indicators and metrics on:
• Significant sources of biodiversity impact (i.e. impacts drivers);
• Significant changes to the state of biodiversity (i.e. biodiversity impacts), including ecosystems, species and related ecosystem services (where relevant); and
• The valuation of significant impacts to the business (i.e. business impacts).
This aligns with the pathway approach (see Box 3) and can also be used within the context of the DPSIR framework (see Appendix 10). Figure 8 includes some example metrics following the pathway approach (note that the actual metrics used will be specific to the organisation).
Examples
Indicator Metric
Pesticides released in proximity (<20 km) of protected areas
Ecological integrity within priority geographical areas
Population levels of IUCN Red List species in priority geographical areas
Amount of crops from priority areas located within or close to (<20 km) areas of high biodiversity value
Income from crops from priority areas located within or close to (<20 km) areas of high biodiversity value
Amount (tons) of pesticides
Habitat hectares
Number of IUCN Red List species identified through EIA
Amount of crops (tons) (guaranteed by pollination and soil fertility)
Income from crops (£) (guaranteed by pollination and soil fertility)
Impact drivers
Typologies of biodiversity metrics and indicators
Changes to the state of biodiversity
ecosystems
species
final ecosystem services
Valuation of impacts
Figure 8. Examples of biodiversity metrics and indicators following a pathway approach. This table includes examples only and is not an exhaustive list.

58 CDSB Framework 58 CDSB Framework | Application guidance for biodiversity-related disclosures
As noted in REQ-02, a pre-requisite to biodiversity reporting is the completion of an impact and dependency assessment (see Assessing biodiversity dependencies and impacts in REQ-02), the outcomes of which may be able to be repurposed for inclusion in the mainstream report to satisfy this requirement. In addition, it may be that companies are disclosing results related to significant biodiversity impacts (and sources of impacts) in their sustainability reports, CDP responses or index questionnaires. Such disclosures can be repurposed to be included in the mainstream report (see Appendix 3).
The selection of indicators/metricsxlii included in the disclosure should be aligned with the targets set by the organisation. Indicators selected should be representative of the specific organisation, such as those used in internal biodiversity management and performance monitoring, or illustrate biodiversity-related financial impacts to the organisation. Organisations should aim to connect the indicators with those disclosed under other requirements (e.g. performance against targets, management response indicators) in order to have a linked suite of indicators connected to the significant impacts and dependencies identified.
Consideration should be given as to which metrics are most suitable to measure progress against indicators (see REQ-05). Ideal metrics should be consistent with industry guidelines, recognised by existing reporting provisions and international initiatives, and calculated in accordance with recognised approaches, to enable comparability and benchmarking. Quantitative metrics should be supplemented by qualitative details and information where appropriate.
Metrics can be applied at the product/service, project or company level. Whilst the company level is most likely to be appropriate for disclosure in the mainstream report, highlighting product/service or project level metrics may also be appropriate where significant risks and impacts vary significantly between products/services, projects and geographic locations. Appropriate metrics depend on both sector and (location of) site. Therefore, while sectoral guidelines can provide support, assessment of the main impacts
affecting biodiversity at the operations or supplier locations would complement the information and support the selection.
Where organisations have completed a biodiversity footprint assessment (see Box 4), it is helpful to provide quantitative data on indicators related to this analysis, such as the net impact of the organisation. From an integrated management and reporting perspective, organisations should also consider reporting productivity/efficiency ratios (e.g. business output per unit of biodiversity impact). Methodologies for biodiversity efficiency ratios are still evolving.
For most indicators, an explicit baseline year and/or reference state is required to enable report users to draw decision-useful conclusions (see REQ-05).
The following sections outline example biodiversity metrics following the pathway approach. Metrics reported should correspond to the selected indicators that organisations have chosen to measure based on their specific biodiversity strategies, impacts and dependencies, and targets.
1.1 Metrics: Sources of impacts (impact drivers)Table 4 contains examples of metrics that outline sources of biodiversity impact (i.e. impact drivers). The exact metrics reported will depend on the organisation’s impact assessment, materiality assessment and sectoral specifications. Organisations may find it helpful to group impacts under the impact driver categories outlined by IPBES,150 the SBTN151 (see Box 2), the Natural Capital Protocol152 or the Transparent project.153 It may be helpful to outline whether impact drivers impact biodiversity directly (i.e. immediately and occurring directly in response to actions from the organisation, such as land clearing) or indirectly (i.e. as a consequence of another factor, for example, GHG emissions causing climate change which consequently causes negative changes to the state of biodiversity, or illegal logging resulting from the construction of a road by the organisation near a forest).
xlii Metrics are outcomes of a measurement process. A metric (or a group of metrics) becomes an indicator when used to support the decision-making process of the organisation and to assess its performance against its strategy, policy, and target.

59 CDSB Framework 59 CDSB Framework | Application guidance for biodiversity-related disclosures
Impact Driver Examples metrics
Land-, water- and sea-use change xliii
• Area (Ha) of forest, grassland or wetland converted due to urbanisation
• Area (Ha) of degraded land converted to agricultural land
• Area (Ha) of land converted to monoculture
• Area (Ha) of mangrove protected and/or restored
• Area (Ha) of marine area for aquaculture (e.g. to grow mussels)
Resource exploitation
• Quantity (tons) of natural resources (e.g. leather, soy, palm oil) sourced per year
• Amount (tons) of fish caught
• Number of wild species exploited for commercial purposes
• Volume (tons) of timber and non-timber forest products harvested
• Total volumes of water withdrawals, consumption and discharge
• Percentage of sustainable fish stocks
Light and noise pollution
• Decibels of noise above normal level
Waste • Amount (tons) of hazardous waste discharged
• Amount (tons) of non-hazardous waste incinerated
Soil pollution • Amount (kg) of pesticide discharged to soil
• Amount (kg) of fertilisers (and main components, e.g. nitrogen and phosphorous) applied to soil
Water pollution • Concentrations of key pollutants in the wastewater
• Amount of arsenic released to water
• Amount of deleterious chemicals released to water
• Refer to the Water Application Guidance
Air Emissions • Volume of CO2, sulphur dioxide (SO2), nitrogen oxide (NOx) and methane (CH4) emissions.
• Refer to the Climate Application Guidance
Table 4. Examples of metrics outlining sources of biodiversity impacts aligned with the impact pathway approach (Adapted from: Natural Capital Protocol biodiversity guidance; IUCN Guidelines for planning and monitoring corporate biodiversity performance).
xliii The location of land should be provided as accompanying information.
xliv It is recognised that the metrics suggested here are limited in assessing changes to marine and freshwater biodiversity.
1.2 Metrics: Changes to the state of biodiversity (biodiversity impact metrics)Biodiversity impact metrics should consider changes to ecosystems and ideally also species relative to a defined baseline/reference state. It may also be helpful to provide metrics on changes to the flows of final ecosystem services that can be attributed to changes to biodiversity.xliv
As single metrics do not cover all elements of biodiversity, disclosing a combination of relevant metrics that provide different perspectives (e.g. species abundance, species richness, habitat availability, ecosystem integrity, final ecosystem services) is encouraged, including clear explanations of what is being measured (see Rationale of selection and methodological details). Where organisations are still in the early
stages of biodiversity reporting, a phased approach to metric disclosure is encouraged.
To enrich and complement the disclosure, metrics should be accompanied (where possible) by a narrative or categorisation detailing (1) whether impacts are temporary (short-term or long-term), recurrent (e.g. seasonal) or permanent, (2) the location (also in relation to priority geographic areas), (3) the stage of the value chain the impact relates to and (4) whether the metric relates to an impact in a previous period that still has ongoing implications for biodiversity. When assessing impacts, organisations should consider external factors that could result in major changes in the state of biodiversity, as these may affect the significance of business impacts (as well as dependencies).xlv
xlv Refer to Natural Capital Protocol for further details. Capitals Coalition (2016) Natural Capital Protocol. Available from: https://naturalcapitalcoalition.org/natural-capital-protocol/

60 CDSB Framework 60 CDSB Framework | Application guidance for biodiversity-related disclosures
1.2.1 Ecosystem metricsWithin this context, ecosystem metrics describe the conditions and related changes of an area of interest for the reporting organisation (e.g. due to its impacts or dependencies). Key ecosystem metrics are based on the extent of the ecosystem (assessed and monitored via satellite imagery or on-site) and the condition/integrity of that ecosystem (e.g. condition rating per area, mean species abundance per area or potentially disappeared fraction of species per area per year). The most generally accepted condition/integrity-rating methods applicable to the impact area should be used and the same method should be used for ecologically equivalent ecosystems.154
Examples of useful ecosystem metrics are:
• Quality scoring or ratings of ecosystems located in priority geographic areas, which express the related condition/integrity and/or intactness of ecosystems, for example, quality hectares measured through fieldwork,xlvi habitat hectares or hectares equivalent or GLOBIO’s Mean Species Abundance (see Table 5);
• Potentially disappeared or affected fraction of species (see Table 5);
• Number or percentage of sites in which the species richness is progressing/stable/regressing;
• Ecosystem/habitat cover change, e.g. forest area as a percentage of total land area or tree cover loss (ha);
• Range of species identified through environmental DNA (eDNA) analysis; and
• Ecosystem/Habitat fragmentation change (ha).
Metrics on habitat are a hybrid category between ecosystem and species metrics, because they refer to an area that is suitable for a species or a group of species, and, depending on the focus, they can be classified as an ecosystem or a species metric.
1.2.2 Species metricsWhere information about species is deemed material, metrics should also be provided for species that assess the population status (e.g. species abundance) and/or related proxies, such as available habitat size (often requiring the use of
spatial mapping), both relative to a defined baseline/reference state.
Examples of useful metrics are:
• Risk of species extinction (e.g. through the STAR metric — see Table 5);
• Areas (ha) of critical habitat for species in priority geographical areas;
• Biodiversity impact metric, which combines data such as mean species abundance and rarity-weighted species data (see Table 5);
• Number of IUCN Red List species and national conservation list species within priority geographic areas;
• Range of species identified through eDNA analysis;
• Number of invasive alien species identified on the organisation’s sites/impact areas;
• Target species population sizes/abundance compared to actual population sizes; and
• Measurements of species populations and habitat diversity from on-the-ground studies (see Box 6).
A suitable baseline/reference state for species involves determining the target population size of
xlvi For example, Victorian Government Department of Sustainability and Environment (2004) Vegetation Quality Assessment Manual–Guidelines for applying the habitat hectares scoring method. Version 1.3.. Available from: https://www.environment.vic.gov.au/__data/assets/pdf_file/0016/91150/Vegetation-Quality-Assessment-Manual-Version-1.3.pdf
Box 6: Direct measurement techniques
The most used techniques for measuring/estimating species population numbers are direct measurement techniques, such as quadrats, line transects and nest searches, as well as the use of audio/photo/video tracking.155 Direct observation of all individuals is generally too time consuming, expensive, or not feasible, therefore biodiversity specialists and scientists typically estimate the population size within a study area or region based on samples. Where population measurement is not possible, alternatives include the use of credible taxa databases applicable to ecosystem types within organisational and value chain boundaries and combining these with habitat extent as a proxy.156 eDNA is increasingly being used in terrestrial and aquatic systems to monitor species diversity and can be a cost and time effective technique to understand site level biodiversity which can be aggregated at a corporate level.157, 158, xlvii
xlvii See NatureMetrics – DNA-based monitoring for examples of environmental DNA being used in practice

61 CDSB Framework 61 CDSB Framework | Application guidance for biodiversity-related disclosures
the species, and/or establishing the target habitat size for species as a proxy (i.e. performing an ecological assessment). The organisation should ensure the most suitable population target is selected.xlviii The difference between actual and target population size is useful for demonstrating to report users whether management responses are effective (linked to REQ-02 and REQ-05). Where target population sizes greatly differ to
actual population sizes, management responses to address this should be outlined.
Table 5 contains a summary of commonly used metrics, split into metrics related to ecosystems and/or species, and Appendix 8 contains a summary of tools/frameworks that may be helpful for the assessment and quantification of biodiversity impacts.
Metric Description Metric classification
Species and habitat diversity (richness and abundance)
The use of on-the-ground monitoring/measurement of species and habitats (see Box 6) to determine species richness, abundance and trends over time.
Species richness, species abundance and/or ecosystem condition/integrity
Mean species abundance A metric of biodiversity intactness that considers mean abundance of species relative to abundance in undisturbed ecosystems (i.e. reference site). A value between 0 and 1 is given, with 1 indicating an ecosystem similar to is natural state and 0 indicating complete destruction. Mean species abundances is often estimated using the GLOBIO model (see Appendix 8).
Ecosystem condition/ integrity rating
The Habitat Hectare A site-based vegetation assessment method that measures the current condition of native vegetation against a benchmark for the same vegetation type or Ecological Vegetation Class. It is a product of the ecosystem extent and the condition rating.159
Ecosystem condition/integrity
The Healthy Ecosystem Metric
Based on land-use only, this metric combines area affected with the impact on quantity and quality of biodiversity, soil and water to provide the total impact on ecosystem.
Ecosystem condition/integrity
Surface area equivalents (such as acre equivalents, hectare equivalents, square kilometre equivalents or square mile equivalents)
Surface area equivalents express the condition/integrity-adjusted surface areas of impacted ecosystems. They are calculated by multiplying the surface area of the target ecosystem(s) by the ratio of its current condition/integrity score over the maximum condition/integrity score. 160, 161
Ecosystem condition/ integrity
Potentially disappeared fraction of species
Measures the decline in species richness in an area over a time period (with a focus on plants). Percentage disappeared fraction of species is often estimated using the ReCiPe model (see Appendix 8).
Ecosystem condition/ integrity
Potentially affected fraction of species
It measures the fraction of species affected in an area over a time period (before they have disappeared), focusing on the species richness of plants.
Ecosystem condition/ integrity
Risk of extinction (e.g. STAR metric)
Measure of potential reduction of species extinction risk resulting from removal of threats in a given area. STAR is based on IUCN Red List data and contained within IBAT (see Appendix 8).
Species abundance
Biodiversity impact metric
Developed by the Cambridge Institute for Sustainability Leadership, the Biodiversity (CISL) impact metric estimates the proportion of biodiversity loss for different land-use types and intensities using data such as global mean species abundance combined with rarity-weighted species richness data from the IUCN Red List.
Ecosystem condition/ integrity
Table 5. Examples of biodiversity impact metrics (References: Natural Capital Protocol biodiversity guidance; IUCN Guidelines for planning and monitoring corporate biodiversity performance).
xlviii Refer to Biological Diversity protocol for further detail on how to determine this. See: Endangered Wildlife Trust (2020). The Biological Diversity Protocol. Available from: https://www.nbbnbdp.org/uploads/1/3/1/4/131498886/biological_diversity_protocol__bd_protocol_.pdf

62 CDSB Framework 62 CDSB Framework | Application guidance for biodiversity-related disclosures
Some metrics may be more suitable than others depending on the specific business activities, policies and targets. Metrics may have limitations, for example, mean species abundance and potentially disappeared fraction of species do not capture changes to all the multi-faceted aspects of biodiversity (such as distinguishing different ecosystem types at the local/regional level), therefore their use may be enhanced by combining them with additional metrics and information (e.g. as seen within the Biodiversity impact metric). Any limitations with metrics should be outlined and it may be helpful to include a clear rationale for chosen metrics. The most relevant biodiversity metrics and indicators vary by sector, ecosystem type and country, therefore it is recommended to look at sector/ecosystem/country specific guidance where available.xlix
1.2.3 Final ecosystem services metricsMeasuring (and valuing) biodiversity can be complex and challenging. Whilst our knowledge is constantly developing and improving, we still do not fully understand all the ways in which organisations interact with (i.e. impact and depend upon) biodiversity. Therefore, when assessing and reporting metrics on impacts/dependencies on biodiversity, including information on the changes to the final ecosystem services (underpinned by biodiversity) is often a useful way to complement data directly related to biodiversity itself. It can also be used to supplement gaps in biodiversity data, where it is impractical or impossible to provide that information directly. Metrics related to final ecosystem services should be used to complement biodiversity impact metrics and build a fuller picture, as opposed to an alternative.
Where business activities result in significant impacts on final ecosystem services that are underpinned by biodiversity, it may be helpful to provide metrics that demonstrate these impacts. This is a developing and challenging area162 often requiring complex quantitative models. Useful resources identified for REQ-04 and some of the tools in Appendix 8 can support the assessment of final ecosystem services. A possible way to report metrics related to final ecosystem services is to split them into categories of (1) supply of final ecosystem services available to the business,
(2) delivery of final ecosystem services utilised by the business and (3) contributions to wellbeing of both internal and external stakeholders. For example:l
• Supply: Amount of biomass available for fodder (tons), amount of carbon absorbed by vegetation (tons), pollinator abundance and pollination rates, amount of area that is suitable for nature-based tourism (ha).
• Delivery: Total production of all commercial crops (tons), caloric content of fish landings (kcal), volume of timber harvested (tons), marginal contribution of soils to crop production, area of avoided flood damage due to regulation by vegetation and soils (ha), nature-based tourism visitation rates (number of visits).
• Contributions to wellbeing: number of jobs contributed by aquaculture, basic needs satisfied via ecosystem service (e.g. number of people with access to adequate water), number of people protected from flooding and erosion due to coastal protection, marginal contribution of pest control to food or biofuel production, marginal contributions to income or wellbeing of visitors.
Depending on the definition and classification of ecosystem services selected by the organisation (see Box 1), it may also be helpful to categorise indicators into types of services (e.g. provisioning, regulating and cultural).
1.3 Metrics: Valuation of impactsWhere information about the valuation of impacts is material, reporting metrics that value the impact of changes in biodiversity to the organisation (i.e. the related costs and benefits) can be helpful for report users, demonstrating the relative worth or importance of biodiversity impacts.
Valuation metrics may be quantitative, qualitative, monetary or a combination163 (see Box 7 for additional details, including why using a combination of valuation metrics is useful). Valuation metrics should reflect the significant costs and benefits that are specific to the organisation. As well as demonstrating the significance of biodiversity impacts to the report user, valuation can also be useful in communicating exposure to risks or opportunities (see REQ-03).
xlix For example, WET-Health contains wetlands specific methods and Australia’s Integrated Ecosystem Condition Assessment Framework provides country specific guidance.
l For further detail see: Brown, C., Reyers, B., Ingwall-King, L., Mapendembe, A., Nel, J., O’Farrell, P., Dixon, M. & Bowles-Newark, N. J. (2014). Measuring ecosystem services: Guidance on developing ecosystem service indicators. UNEP-WCMC, Cambridge, UK. Available from: https://www.unep-wcmc.org/system/dataset_file_fields/files/000/000/303/original/1850_ESI_Guidance_A4_WEB.pdf?1424707843

63 CDSB Framework 63 CDSB Framework | Application guidance for biodiversity-related disclosures
Valuing the financial consequences for the business associated with biodiversity impacts could include considering abatement costs, costs of delay/disruption and costs associated with complying with legal requirements (see REQ-03 for further examples).
The context of the valuation can be business (costs/benefits to the organisation) or societal (costs/benefits to society). As noted in the Biodiversity and Business section, costs and benefits to wider society resulting from an organisation’s impacts on biodiversity can affect its future financial position and financial performance (e.g. reputational damage, fines), therefore it is encouraged to adopt a societal perspective as well as an economic perspective throughout the assessment. Organisations
should clearly specify the value perspective they are reporting (i.e. societal value or economic value), and limitations, uncertainties or estimates should be disclosed to improve report user understandability.
The assessment and reporting of valuation metrics related to biodiversity impacts should include consideration of changes to the final ecosystem services underpinned by biodiversity resulting from business activities. Example (monetary) metrics include market value of livestock products, market value of carbon uptake, marginal contribution of irrigation to crop market value, avoided water treatment costs, economic revenues derived from visits to aesthetic areas, and marginal contribution to real estate prices by nature-based tourism.164
Box 7: Biodiversity valuation types
Within the Biodiversity Application Guidance, valuation is defined as the process of estimating the relative importance, worth, or usefulness of biodiversity to people, in a particular context (e.g. for an organisation).165 This involves determining the consequences of biodiversity impacts and dependencies, and their related costs and benefits, considering that biodiversity may have different values to different groups of people.
Placing values on biodiversity is challenging and it is more common to apply valuation techniques to the final ecosystem services that flow from biodiversity. Types of valuation include:166
• Qualitative valuation which is descriptive and often includes subjective perceptions, ranking impacts/dependencies into high, medium or low.
• Quantitative valuation which assesses the magnitude of biodiversity impacts or dependencies in numerical, non-monetary terms (e.g. areas, mass or value). It differs from quantitative measurement (i.e. metrics) as it relates to the importance, worth, or usefulness of the impact and/or dependency, often considering geographic context and impacted stakeholders.
• Monetary valuation which uses market (i.e. observed prices) and non-market (e.g. revealed or stated preference) approaches to infer the monetary value of a biodiversity impact/dependency. Monetary values include both financial values and externalities that are not reflected in the final cost or benefit.
Monetary valuations can also be used to (1) provide a common measurement unit to compare with financial values, such as business costs or revenues, (2) benchmark performance across organisations, assuming the same economic/monetary conversion figures are used, and (3) assess and communicate the significance and distribution of costs and benefits amongst stakeholders and net impacts to society.
Whilst useful for decision-making, some aspects of biodiversity’s value cannot be captured using monetary valuations, even if they potentially represent a cost or benefit, therefore monetary valuations are likely to be partial and underestimated.167 For this reason, monetary valuations should be treated as a minimum value and should be supported by qualitative/quantitative approaches in order to provide a more complete picture.

64 CDSB Framework 64 CDSB Framework | Application guidance for biodiversity-related disclosures
2. Contextualising biodiversity-related metrics
Biodiversity-related metrics should describe the organisation’s relationship with the biodiversity-related geographic contexts in which it operates, including both environmental and socio-economic conditions, as well being connected to the information in the rest of the mainstream report and other CDSB requirements, including financial performance (e.g. financial opportunities from improved biodiversity/reduced biodiversity negative impacts). Qualitative details and indicators on the following, linked to Key Characteristics, can provide useful contextualisation:
• Spatial: Details on how metrics relate to priority geographical areas support the understanding of the diversification and prioritisation of management actions. It is useful to state whether the impact accrues globally (e.g. carbon emissions), regionally or locally (e.g. impacting a localised population of species), as well as provide details on how it is being managed (connected to REQ-02).
• Temporal: Details around the timeframes of impacts, including any time-lags, cumulative impacts, potential thresholds and tipping points, where minor changes in biodiversity can cause larger changes to the ways ecosystems function.
• Regulatory or licence requirements: Details on how the metrics provided align with legal requirements.
• Societal: Where information about risks related to social impacts connected to changes in biodiversity is identified as material (e.g. costs resulting from reputational damage), it may be appropriate to also include social indicators and/or metrics. This could include (1) indicators that highlight the contribution of the organisation to biodiversity-related societal conditions and (2) indicators or details linking biodiversity impacts to reductions/increases in final ecosystem services, noting that there may be a time-lag between loss of biodiversity and loss of services. For example, health impact metrics, societal costs resulting from eutrophication or loss of property values related to business impacts on biodiversity, number of people with access to parks/open space/recreation areas or number of people in air quality or water quality non-attainment areas.
• External factors: Details on external factors
that may directly or indirectly affect the significance of biodiversity impacts, such as climate change or immigration.
3. Decision-useful information
When reporting results on significant sources of biodiversity impacts, organisations should consider what the characteristics of decision-useful information are — consistency, comparability, clarity and verifiability — as set out in Principles 4, 5 and 6 of the CDSB Framework. In satisfying these key characteristics, the applicability of the metrics and indicators chosen to report on significant sources of biodiversity impacts, such as sector or industry and/or national or regional standards for reporting, should be considered. In addition, where appropriate, results should be reported in absolute and intensity terms, with organisation revenue and/or appropriate non-financial output measures (e.g. a standard unit of product or service) being used to normalise the results. This supports comparability and benchmarking of companies and allows investors to understand the biodiversity implications aligned to business strategy.
To this aim, disclosing clear definitions of biodiversity impact drivers, impacts and biodiversity terms (such as species abundance or ecosystem quality) is fundamental. Furthermore, companies should ensure that they do not conflate their results for negative significant biodiversity impacts with possible mitigation activities, such as restoring ecosystems and other biodiversity offsetting measures. The latter should be reported where relevant and material but accompanied with clear definitions of used metrics and accounting methods in a manner that is distinct from negative biodiversity impacts, otherwise it may mislead the report user. Disclosure against the mitigation hierarchy can be helpful for guiding this process (see REQ-02).
4. Disaggregation and categorisation
To benefit comparability and understandability, it can be helpful to disaggregate and/or categorise results (where appropriate) to better appreciate impact and report this alongside total results. Results can be disaggregated into different impact drivers and impact driver

65 CDSB Framework 65 CDSB Framework | Application guidance for biodiversity-related disclosures
categories, as well as direct and indirect impacts, and phases of the value chain. Other useful disaggregation options include ecosystem types, species, species broken down into levels of extinction riskli and geographies (regional, national or categorised into levels of biodiversity risk). Disaggregation categories should be clearly defined, and care should be taken not to confuse context specific elements when aggregating/disaggregating biodiversity metrics.
5. Rationale of selection and methodological details
It is useful to offer brief explanations to the appropriateness of reporting choices for metrics. Given that it is common for selective reporting on corporate impact, such explanations offer further confidence in the data disclosed.
There are many methods used for biodiversity measurement. For example, methods for measuring changes in the state of biodiversity include direct measurement methods and ecological survey methods (see Box 6), estimations, which may be high-level, and ecological or species modelling methods which use equations and input data to model impacts, such as population dynamics modelling. Clearly stating the methodologies used will add to the validity and usefulness of the results. The description should provide measurement details for the metrics reported and tools and databases used should be referenced where possible. It is also helpful to outline the organisational level the metric applies to (i.e. global, country, region, site or project-level).
The method selected should be appropriate for its purpose considering the level of reporting detail required, management information needs, geographic scope, value chain boundary and available time and resources. Where possible, the most generally accepted or recognised method within a jurisdiction should be used,
the same methodologies should be used for ecologically equivalent ecosystem types and methods should be consistent over time to allow comparability. When using primary data, it may be helpful to outline the measures taken to ensure data collected has appropriate measurement intervals that match the ecological timescale (e.g. seasonal variations) and spatial scale of the biodiversity impact.lii Useful details can cover: (1) tools used, (2) data used (primary and/or secondary, geographical and/or ecosystem specific), (3) use of proxies, generalised relationships, and/or models, (4) assumptions made, uncertainties (e.g. sensitivity analysis) and limitations of the methods used, and (5) unit of sampling used.
Finally, where there are uncertainties and gaps in the biodiversity data, limitations with methodologies/data or where methods and assumptions have been amended or applied, highlighting and offering an explanation to report users for these differences can alleviate confusions or misconceptions. For example:
• Most measurement approaches are tailored to terrestrial use and may need to be adapted for marine or freshwater use, therefore it is useful to highlight any significant assumptions made in this context.
• A possible limitation may be that measurement approaches are largely focused on changes in the extent and condition of ecosystems and target/actual population/habitat sizes of significant taxa. Other multi-faceted biodiversity areas, such as genetic resources and associated ecosystem services, may not be fully considered by metrics.
• The use of model-based metrics, and/or metrics based on global datasets, then applied locally may create limitations around accuracy.
• Where data access is problematic in the value chain there may be issues around data availability, reliability or accuracy.
li For example, Total number of IUCN Red List species and national conservation list species with habitats in areas affected by the operations of the organisation, by level of extinction risk: i. Critically endangered ii. Endangered iii. Vulnerable iv. Near threatened v. Least concern
lii Yearly monitoring may be appropriate for measures aimed at stabilising or improving species’ population numbers, whereas monthly monitoring may be necessary for actions such as water quality.

66 CDSB Framework 66 CDSB Framework | Application guidance for biodiversity-related disclosures
Useful resources
1. The EU Business @ Biodiversity Platform have published a series of three reports (2018, 2019, 2021) on the Assessment of biodiversity measurement approaches for businesses and financial institutions which may be helpful for selecting a measurement approach, as well as considering data and metrics, and disclosure. Annexes in the reports include lists and short descriptions of metrics such as mean species abundance and potentially disappeared fraction of species (also indicating the initiatives using the metrics), tools and frameworks such as IBAT, Biodiversity Footprint Financial Institutions (BFFI), and Biodiversity Footprint Calculator, and measurement approaches such as the Global Biodiversity Score and the Biodiversity Impact Metric (see Appendix 8 and Appendix 9). Additionally, the 2021 report introduces the Biodiversity Measurement Navigation Wheel — a decision framework to help businesses select the most suitable measurement approaches for a specific business context.
2. UNEP-WCMC’s report Biodiversity measures for business discusses the rationale and current business practice on biodiversity measurement, and the related reporting and disclosures. It provides sector-specific examples of metrics and approaches.
3. Resources from the Capitals Coalition guide organisations in the understanding and selection of measurements and valuation approaches and tools. The Natural Capital Protocol provides examples of impact drivers and dependencies (also useful for REQ-02), related indicators and measurement techniques (e.g. Table 7.1 on valuations techniques); the related Biodiversity Guidance includes examples of biodiversity-specific resources relating to measurement and valuation (Table MV.2, Figure 6.1, and Table 6.4); the Natural Capital Toolkit is an interactive database that helps businesses find the right tool to measure and value natural capital; and the Biodiversity Guidance Navigation Tool guides users through a biodiversity-inclusive natural capital assessment, following the steps in the Natural Capital Protocol and suggesting specific tools, resources and methodologies based on the scope/area of the value chain a company sits.
4. Biodiversity and Ecosystem Services in Impact Assessment by the International Association for Impact Assessment, provides best practice principles that are intended to improve impact assessment outcomes.
5. The World Wide Fund for Nature (WWF) report Assessing portfolio impacts - Tools to measure biodiversity and SDG footprints of financial portfolios provides tools and methodologies to help financial institutions quantify portfolio environmental impacts, with a focus on biodiversity, and identify the most significant impact areas based on the nature, content, and location of their portfolios. The report also provides examples of real case studies.
6. The SEEA Ecosystem Accounting consists of an integrated ecosystem accounting system including physical terms (for the account of ecosystem extent, condition and ecosystem services flows) and monetary terms (for the account of ecosystem services flows and ecosystem assets). The document describes and provides suggestions and resources for each type of account and illustrates how the different accounts are interconnected and together provide a comprehensive and coherent view of ecosystems.
7. The Life Cycle Initiatives of the UNEP has developed regionalised factors to conduct an assessment of impacts related to land-use impacts on biodiversity.
8. eDNA is increasingly used in biodiversity-related assessments in combination with traditional survey methods and is particularly useful for aquatic species. The Biodiversity Consultancy provides a briefing note illustrating the current state of eDNA approaches, therefore allowing practitioners (including organisations) to identify where the application of this technology can benefit a project and where it will complement or enhance traditional survey methods. Nature Metrics provides easily accessible tools for DNA-based biodiversity monitoring, which analyse biological data to provide insights about soil health and ecosystem quality.
9. The IUCN’s Tools for measuring modelling and valuing ecosystem services provides guidance for practitioners on existing tools that can be applied to measure or model ecosystem services provided by important sites for biodiversity and nature conservation (e.g. Key Biodiversity Areas, natural World Heritage sites, and protected areas).
10. Measuring ecosystem services: Guidance on developing ecosystem service indicators by UNEP-WCMC, besides supporting the selection

67 CDSB Framework 67 CDSB Framework | Application guidance for biodiversity-related disclosures
of indicators (REQ-05), provides examples of ecosystem services indicators from CICES (Table 2, pg. 28), of decision-support and modelling tools (Box 6, pg. 34), data sources (Table 3 and 4, pg. 35), (Box 12), and existing ecosystem services research and monitoring initiatives (Box 12, pg. 52).
11. The BFFI is a methodology (and related tool) based on life cycle assessment to measure the impact of financial institutions on biodiversity. It consists of four steps, from the identification of economic activities included in the portfolio to the assessment of impacts on biodiversity (expressed in Potentially Disappeared Fraction of species).
12. Tools for the assessment of ecosystem services, such as InVEST and ARIES, provide models to map and value ecosystem services, assisting with balancing environmental and economic goals, by using production functions to define how changes in an ecosystem’s structure and function are likely to affect flows and values of ecosystem services.
Metrics and indicators from other reporting standards/frameworks
13. Many of the world’s largest companies already disclose information and data to CDP via their Corporate Forests Questionnaire, Water Security Questionnaire and Climate Change Questionnaire. CDP submissions can provide a useful, well-structured basis for developing mainstream disclosures in response to REQ-04 as well as other reporting requirements of the CDSB Framework, such as on governance, strategies and targets, and outlook
14. Sustainability Accounting Standards Board (SASB) materiality matrix and industry-specific standards identify a base set of material ecological impacts for each industry, providing metrics for reporting on them in a consistent and comparable manner.
15. GRI 304 disclosure standards on biodiversity include a disclosure on significant impacts of activities, products and services on biodiversity. Specific suggestions are included in the sectoral standards (e.g. Oil and Gas).
Valuation
In addition to SEEA and the monetary valuation techniques included in the summary provided in the Natural Capital Protocol (see Table 7.1, pg. 84), the list below includes further resources on valuation:
16. The Environmental Valuation Reference Inventory is a database of empirical studies on the economic value of environmental assets. It provides summaries including details on the specific environmental assets being valued, the methodological approaches and the estimated monetary values.
17. The Ecosystem Services Valuation Database contributes to the insights on monetary valuation of ecosystem and biodiversity. It focuses on compensating the continued intergenerational loss due to the damage in ecosystem and biodiversity.
18. The IPBES guidance on Diverse Value and Valuation proposes standard procedures to diversity valuation in order to assure comparability, accountability and transparency. It provides (1) a review of types of valuation methodologies, (2) a preliminary guide on diverse conceptualisation of multiple values of nature and its benefits, and (3) a six-step approach to valuation.
19. The The Economics of Ecosystems and Biodiversity (TEEB) Valuation Database is a searchable database of 1,310 estimates of monetary values of ecosystem services provided by different ecosystems (e.g. open ocean, coral reefs, wetlands, rivers, lakes, forests, and grasslands).
20. The Environmental Value Look-Up is a measuring tool to assess monetary value of environmental impacts. The related database contains indicative monetary values of environmental impacts, including biodiversity (focus is on the UK).
Please also refer to Table 5 and databases contained in Appendix 8 and Appendix 9.

68 CDSB Framework 68 CDSB Framework | Application guidance for biodiversity-related disclosures
Examples
1. Kering Universal Registration Document 2020 summarises how the organisation measures its biodiversity-related impact. Its Environmental Profit & Loss Account (EP&L) methodology quantifies the impact on natural capital, including along the value chain (in 2019, 32% of Kering’s environmental impacts related to biodiversity and land-use, most of which was at the level of Tier 4 suppliers). The company reports using the Biodiversity Impact Metric, which measures the impact of operations on biodiversity (including along the supply chain) and provides a basis to compare impacts of different raw materials or supply regions. The report clarifies that the CISL team is working on improvements alongside EP&L specialists before disclosing the Group’s impact on biodiversity (pg. 176).
2. Solvay Annual Report 2020 describes the methodology used to measure its impact on biodiversity - the ReCiPe method, based on
three factors: product environmental footprint calculated using Life Cycle Assessment (the assessment covers the “cradle-to-gate” scope for each Solvay product); pressure that components released into air, water, and soil puts on the ecosystem, converted into “biodiversity loss” or “ecosystem quality”; product sales volume during the year in question (pg. 123).
3. FrieslandCampina Annual Report 2020 has developed an indicator to measure the impact of dairy farms on biodiversity, in collaboration with WWF and Rabobank - the Biodiversity Monitor (pg. 60). The company’s website clarifies that the Biodiversity Monitor uses the following KPIs to measure a dairy farm’s influence on biodiversity: GHG emissions, soil nitrogen balance, ammonia emission, share of protein produced by own land, share of permanent grassland, and share of nature and landscape management.
REQ-05 Performance and comparative analysisDisclosures shall include an analysis of the information disclosed in REQ-04 compared with any performance targets set and with results reported in previous periods
Disclosure checklist
Does the disclosure:
Provide appropriate historical data to the results reported from REQ-04 for significant biodiversity-related impacts to allow for useful comparison, including details on priority geographical areas and priority products/services?
Contextualise performance with baselines/reference states, targets and other criteria used to assess progress?
Explain the major trends with reference to drivers of change under and/or outside the control of the organisation?
Principle 2 of the CDSB Framework sets out that disclosures should include “all information that is necessary for an understanding of the matter that it purports to represent and does not leave out details that could cause information to be false or misleading to users.” To offer report users proper comparability between past and present material biodiversity-related performance, companies need to ensure that they are offering an appropriate number of historical datapoints. Narrow dataset windows or intermittent, longer-term datasets are unsuitable for comparison and decision-making, for instance, potentially obscuring the actual trends. Where long-term measures and performance are not possible, an organisation should disclose the reasons why. In addition, clarification of boundaries considered (e.g. value chain) should be provided.
Reporting on progress against targets offers an effective means of providing a narrative analysis of performance to improve biodiversity impact. In particular, a small set of core indicators that can be monitored across the corporate scope of biodiversity influence and can be aggregated at the corporate level is ideal. Additionally, in accordance with Principle 3 of the CDSB Framework, the set of selected indicators should (1) connect to the impacts and dependencies

69 CDSB Framework 69 CDSB Framework | Application guidance for biodiversity-related disclosures
identified, and related risks and opportunities, and (2) illustrate the effectiveness/ineffectiveness of management responses. When reporting on performance in reference to targets set for significant sources of biodiversity impacts, it is useful to restate the overall ambition and the baseline/reference state, clarifying for the reader as to whether the targets are part of a corporate initiative or scheme, or tied to wider national or international ambitions. Example indicators that may be useful to report users to demonstrate progress towards targets include:
• Percentage increase in the area, connectivity and integrity of natural ecosystems within the organisation’s impact area;
• Percentage increase in the population of threatened species within the impact area;
• Non-compliance with biodiversity-related regulation (e.g. percentage of facilities with violations);
• Membership of biodiversity initiatives (e.g. percentage of facilities or suppliers with biodiversity-related certifications or number of partnerships signed with a biodiversity-related scientific body, NGO, foundation or nature conservation stakeholder);
• Number of farms applying approved techniques;
• Proportion of products from certified sources;
• Value of fines and sanctions for non-compliance with biodiversity laws and regulations;
• Level of investment in biodiversity;
• Number of employees that attended at least one biodiversity training session; and
• Percentage of entities trained in biodiversity issues (both under and outside the control of the reporting organisation e.g. suppliers, depending on the reporting boundaries).
Indicators can also be helpful for demonstrating performance of delivery of strategies and objectives. For example, a company’s objectives can be best tracked with impact indicators (Table 4 and Table 5) whilst the strategies will require response indicators (e.g. biodiversity impact mitigation measures or BAPs in place). Additionally, it would be beneficial to provide details on performance and progress in priority geographical areas and for priority products/services, but also in areas experiencing significant changes including related to land-use (e.g. urbanisation or deforestation), legislations, and population growth.
In order to show progress across the years, a baseline assessment should be performed for each metric considered to assess performance. Reference to an explicit baseline year and/or reference state is required to enable report users to draw decision-useful conclusions, providing a starting point or state of biodiversity benchmark against which changes in biodiversity can be compared. Options include:
• Comparisons to previous years (baseline year) or an average over previous years (e.g. the year the organisation first started to operate in a specific area and completed a biodiversity-related assessment). This may be most useful where the objective is to reduce or improve organisation’s biodiversity impact over time.
• Comparisons to the state of biodiversity at a point in time, such as a pristine baseline where impacts are measured relative to biodiversity in its natural state (reference state), or a counterfactual reference state, which is a plausible state of biodiversity that would occur if the business did not operate. A counterfactual reference state is useful as it takes into account external, non-business impacts (e.g. climate change or other organisations).
Industry benchmarks, such as an industry average, may also be useful to include as they assist with the comparability of disclosures.liii
When explaining trends, companies should draw the reader’s attention to the impacts of environmental initiatives and management actions, wider corporate developments (e.g. changes in strategy, acquisitions or divestments), and other drivers of change that are internal to the organisation such as methodological modifications (e.g. changes in targets or data coverage). For example, an increase in biodiversity risk might be the result of the development of new products with inputs sourced from regions with high biodiversity-related risks, or a new acquisition. Other natural and human-induced factors that are outside the control of the organisation (e.g. regulatory changes) can influence such trends. Such narratives should try to illustrate a more holistic biodiversity impact, clearly describing the changes between reporting years and the drivers, while making connections across different aspects of the corporate report.
liii Check the work of the World Benchmarking Alliance. Available from: https://www.worldbenchmarkingalliance.org/seafood-stewardship-index/

70 CDSB Framework 70 CDSB Framework | Application guidance for biodiversity-related disclosures
Consistency needs to be applied to techniques used for data gathering and processing, accounting approaches, and impact assessment methods to produce credible data over time and to allow for aggregation of information, proper comparability, and understanding of performance and trends. For example, good practice consists of (1) applying the same estimation method for each species and ecosystem throughout the data collection activities and across different sites as far as possible and feasible, (2) ensuring that the sample selected is a statistically appropriate representation of the total population, both in terms of size and location, and (3) recording the methodological choices, assumptions and
limitations inherent to the selected data collection methods (e.g. the number of visits to sample units undertaken). A concise summary of methodological information should be provided in the report and, if procedures deviate from recommended practice, the organisation should provide the basis for decision-making and potential related implications. In many circumstances, changes are made to improve accuracy or meet new standards. Where changes are made to data collection boundary, methods, data, or any other factors affecting biodiversity impact assessment, restatements should be produced, as in REQ-10 of the CDSB Framework, to draw attention to these changes and provide an explanation.
Useful resources
1. The 2021 report Assessment of Biodiversity Measurement Approaches for Businesses and Financial Institutions from the EU Business @ Biodiversity Platform includes a summary of different biodiversity measurement approaches, highlighting those that support the assessment of current performance and the tracking of target progress (see Figure 2, pg. 17)
2. Stage 4 of the IUCN Guidelines for planning and monitoring corporate biodiversity performance offers guidance for choosing, defining and using a small set of core indicators that can be monitored across the corporate scope of biodiversity influence, to show progress against goals, objectives and the delivery of strategies.
3. The Biodiversity Indicators Partnership is a global initiative promoting the development and delivery of biodiversity indicators, linked to global initiatives (i.e. CBD and other biodiversity-related conventions, IPBES, the SDGs) that may be useful for organisations when selecting and developing indicators.
4. Measuring ecosystem services: Guidance on developing ecosystem service indicators by UNEP-WCMC, supports the development of ecosystem service indicators at the national and regional level for uses including corporate assessment, decision-making and reporting.
5. The Biodiversity Indicators for Site-Based Impacts methodology by UNEP-WCMC, Conservation International and Fauna & Flora International sets out a methodology for aggregating biodiversity impact and performance data at site level to provide indicators of biodiversity management performance at corporate level.
6. The development and use of biodiversity indicators in business by the IUCN, introduces a spectrum of business applications for biodiversity indicators, illustrating their use in the decision-making process and in the measurement and tracking of biodiversity performance. This report also guides companies in the selection of indicators (REQ-04).
7. Towards Nature Positive Business: The case for biodiversity indicators by UNEP-WCMC, provides guidance on how biodiversity indicators can be used to track biodiversity performance and report progress to relevant stakeholders.
8. The Biological Diversity Protocol offers an accounting and reporting framework that enables organisations to produce Statements of Biodiversity Position and Performance, which can be used to measure performance and risk over time. The protocol also provides suggestions on how to accurately conduct and report on data collection.
Please also refer to Table 11 in Appendix 9.

71 CDSB Framework 71 CDSB Framework | Application guidance for biodiversity-related disclosures
REQ-06 OutlookManagement shall summarise their conclusions about the effect of environmental impacts, risks and opportunities on the organisation’s future performance and position
Disclosure checklist
Does the disclosure:
Explain the likely effect of future biodiversity-related impacts, risks and opportunities, as well as of biodiversity strategy on organisation performance and resilience, taking account of regulatory and market trends and environmental changes?
Identify and explain the time horizons used for reporting on corporate outlook?
Explain any techniques, such as scenario analysis, used to inform the outlook including the methods, scenarios and assumptions used, and any shortcomings and uncertainties?
REQ-06 of the CDSB Framework encourages companies to provide a future-oriented summary that enables report users to understand how an organisation’s biodiversity-related risks, opportunities, dependencies and impacts are affecting, or will affect, its ability to execute its strategy, innovate and create value across time horizons. According to Principle 7 of the CDSB Framework, the information provided in response to REQ-06 should synthesise in a forward-looking manner and build on what has been disclosed in line with the first five reporting requirements of the CDSB Framework. In practice, REQ-06 should provide a full picture for investors of how biodiversity-related governance, strategy, management, and current and potential risks and opportunities will likely influence the organisation’s performance and position.
Taking into account the timescales over which biodiversity-related risks will manifest, the non-linear and potentially abrupt nature of possible impacts, and the multiple, interconnecting systems that drive biodiversity-related risks and opportunities for companies, scenario analysis is a particularly useful method for companies to better understand potential futures, assess and build resilience within environmental, economic and social systems that are in flux, and to disclose such information to investors.
Examples
1. Stora Enso Annual Report 2020 assesses progress against responsible forestry (which is explicitly connected to biodiversity – pgs. 3, 11 and 18) by measuring the proportion of land in wood production and harvesting owned and managed by Stora Enso which is covered by forest certification schemes. The report includes the company’s target and performance against previous years (pg. 9 Sustainability Section in Annual Report 2020). It outlines the geographical location of forests, plantations, and land owned or managed by Stora Enso, providing details on hectares covered by each unit, and whether or not it is covered by forest certification schemes (and if so, which one(s)) (pgs. 52-53).
2. Eramet Universal Registration Document 2020 discloses its progress against its biodiversity objective, i.e. to achieve and maintain the ratio of rehabilitated areas to cleared areas ≥ 1 over the period 2019-2023 (excluding long-term infrastructures). The company reports on both
current progress and past performance (pg. 295), allowing for comparison over time. The report also discloses the contributions of subsidiaries to the overall result (e.g. in Gabon, in 2014, a mining environment brigade was created, contributing to the increase in rehabilitated areas (pgs. 296-298)).
3. Titan Integrated Annual Report 2020 discloses various indicators (e.g. Active quarry sites with high biodiversity value (number); Active quarry sites with biodiversity management plans (number); Active quarry sites with biodiversity management plans (percentage); Active quarry sites with quarry rehabilitation plans (percentage), etc.). For each, the company discloses current performance, as well as that of the previous four years (pg. 75 and pg. 87). Explanations behind some of the changes are provided. For example, a decrease in the percentage of active quarry sites with quarry rehabilitation plans was due to the organisation acquiring a quarry in North Macedonia which does not yet have in place a plan that meets TITAN’s standards (pg. 75).

72 CDSB Framework 72 CDSB Framework | Application guidance for biodiversity-related disclosures
1. Scenario analysis
Assessing a range of future biodiversity-related states and consequences for the business will elicit important information for companies and report users. Scenario analysis can be conducted through different routes including consultation with internal and external experts or scientific analysis, which would support the understanding of complex and interconnected biodiversity-related issues. It can be a quantitative or qualitative exercise. There is no special or correct formula by which it is to be completed. Instead, it is a process to analyse a suite of potential futures, understanding the organisation, its dependencies and strategic resilience, within the different forces that drive each of the futures. It is an advanced exercise because it would, ideally, consider a set of drivers influencing the status of biodiversity, ecosystems and their functioning/services in the different areas of operations and value chain, including drivers linked to business operations, as well as external drivers such as population, regulatory mechanisms, land-use change, and climate change and its effects (e.g. ocean acidification). Few existing practices focus on biodiversity-related outcomes from climate-related scenario analysis. In this analysis, a range of different warming levels (e.g. 1.5, 2, 3 and greater than 4°C) and transition pathways (e.g. drastic to 1.5°C, relatively more gradual 2°C, technologically-enabled 1.5°C) should be taken into account, as recommended by the TCFD. Climate change is a key driver of biodiversity loss: in particular, scenarios characterised by greater temperature increases (e.g. more than 3°C) should be assessed since they are critical for biodiversity-related risks168 (e.g. exacerbate the extinction risk in biodiversity hotspots such as mountains, islands, and coral reefs;169, 170 or increase of invasive species due to climate-induced migration and consequent impacts on pollinators and crop productivity,171 and soil biodiversity and fertility), and related adaptation and mitigation actions. On the other hand, 2 °C or 1.5 °C scenarios can have significant impacts due to land-use change required for the expansion of bioenergy cropland, if bioenergy remains a major component of climate change mitigation strategies.172 Climate scenarios, such as those developed by the IPCC and the International Energy Agency (IEA), can be combined with socio-economic scenarios such as the Shared Socioeconomic Pathways (SSP) by the International Institute for Applied Systems Analysis (IIASA),173 which can influence and be influenced by biodiversity impact drivers (other than climate change), such as land-use change and pollution. Such scenarios can be combined with models for
the assessment of biodiversity and ecosystem services (e.g. Globio174 and InVEST175)176 and of economic indicators.177
The results of the scenario analysis should provide a summary of the organisation’s future dependencies on biodiversity and related future risks and opportunities, including details on current and future areas impacted by business activities, to be included in the outlook.
Considerations on the resilience of the organisation to the analysed future scenarios in light of biodiversity strategy and management should be presented, highlighting the main plans and actions to cope with future risks and seize future opportunities from current strategy and management (e.g. mitigation of impacts on biodiversity, stakeholder engagement) and potential limitations and gaps. Given the site specificity of biodiversity risks, details on resilience in priority geographical areas would be beneficial. Links, synergies and trade-offs between biodiversity-related management actions and those implemented to tackle other natural capital changes (but also social and governance issues) should be explained (e.g. transitioning to renewable energy such as wind farm can impact bird habitat or migration; or installing a mini-hydropower station can impact fish habitat and breeding process).
The use of scenario analysis will be based on iterative learning and development. This will allow companies to build on findings or methods employed previously as well as incorporate more up-to-date understanding of biodiversity dependencies and impacts, of other influencing environmental systems and their interactions as well as greater comprehension of biodiversity and climate resilient pathways. If using scenario analysis, then report preparers should be open with these aspects of learning and development.
2. Methods, assumptions and uncertainties
When reporting on corporate outlook, report users should be able to understand the different methods that have been used to prepare the outlook, including horizon scanning and scenario analysis, any assumptions made and the timeframes over which the analysis has been completed. These different characteristics of the scenarios should reflect the nature of the organisation, its assets and operations, and the scale of risks and opportunities already identified. In addition, where external advice or assistance on conducting scenario analysis is

73 CDSB Framework 73 CDSB Framework | Application guidance for biodiversity-related disclosures
used, it is beneficial for this to be highlighted within the methods and inputs. In reporting the effectiveness and resilience of the organisation’s strategies to the potential business impacts of the different scenarios, report preparers should be clear about uncertainties but as precise as possible with how the impacts of risks differ by geography and time horizon. Clear articulation of the specific sensitivities to the different scenarios will allow report users to better understand the potential responses identified by the organisation as a result of the exercise, whether that is no response, changes to financial planning and investment, or reimagining the business model.
3. Iteration and learning
Biodiversity-related risks and opportunities are highly dynamic and dependent upon changes
in complex environmental systems and political, economic and societal arenas as well as the exposure of the organisation or assets and its associated vulnerabilities. The qualities and dimensions of biodiversity-related risks and opportunities for companies are likely to change over time, whether gradually or abruptly. Therefore, using the findings of such exercises to assess corporate outlook is an important means of updating risk and opportunity identification systems and refine or reformulate biodiversity-related policies, strategies and targets. This will better prepare the organisation in limiting and seizing biodiversity-related risks and opportunities. Including such learnings and how they have been incorporated into systems and ambitions in the mainstream report is a valuable means of demonstrating effective and efficient management of significant biodiversity-related matters to investors.
Assessment Tools
As for risks, existing assessment tools can support the assessment of future scenarios and business resilience to those scenarios. Combining different tools and integrating organisation-specific components and information is good practice and would provide a more comprehensive and robust assessment.
1. The Globio model allows trends in biodiversity and ecosystem services to be modelled under future socio-economic development scenarios, as well as different policy interventions.
2. The Water Risk Filter by WWF includes TCFD-aligned future scenarios that combine climate and socioeconomic scenarios and provides 2030 and 2050 quantitative projections of physical risks. Despite being focused on water, among the physical risks the tool includes risks also linked to ecosystem services status considering the fragmentation status of rivers, catchment ecosystem services degradation level, and projected impacts on freshwater biodiversity. The Water Risk Filter methodology includes a description of methods, data and sources used.
3. IUCN’s STAR tool measures the contribution that investments can make to reducing species extinction risk which could be used for scenario analysis purposes.
4. The current version of ENCORE allows exploration of future scenarios in terms of the potential direct impacts of each commodity on biodiversity (available for some sectors, e.g. agriculture and mining). The description of methods supports the understanding and the selection of scenarios and related analysis and provides a list of models that can be coupled with ENCORE (see Table 5, pg. 40).

74 CDSB Framework 74 CDSB Framework | Application guidance for biodiversity-related disclosures
4. Basis for conclusions
The content of the Biodiversity Application Guidance has been developed and selected according to the scope and aim of the document (see About this guidance) and reflecting the fact that it is subordinated to the CDSB Framework and is complementary to other CDSB guidance documents, such as the Climate and the Water Guidance. The Biodiversity Application Guidance reflects the status of the sustainability reporting environment and regulation at the time of writing. As explained in Reporting expectations and important considerations, materiality plays a crucial role within this dynamic space. The CDSB reporting requirements are voluntary, unless prescribed in guidance issued by national or supranational government or regulator, and therefore the reporting suggestions provided in the Biodiversity Application Guidance are also voluntary.
The Biodiversity Application Guidance also reflects the status of research and scientific developments on biodiversity, for example, on biodiversity impact assessment and related metrics and on nature-related financial risks and opportunities (see example of physical risks and opportunities in REQ-03)
The focus of the Biodiversity Application Guidance is on disclosures and not on corporate management and practices. For this reason, the Guidance mentions some good management practices to provide examples and direction to disclosures but does not go deeper into methodological details (e.g. steps to define biodiversity targets) and sign-posts to external resources that have specific focus on such topics in order to avoid duplicating existing information.
Useful resources
1. The TCFD Technical Supplement: The Use of Scenario Analysis in Disclosure of Climate-related Financial Disclosures explains the importance of scenario analysis and offers considerable advice on and resources for developing and applying scenario analysis for climate issues, including biodiversity-related issues. Additionally, the TCFD Knowledge Hub offers a free on-line course on the introduction to scenario analysis.
2. The IPBES Methodological assessment report on scenarios and models of biodiversity and
ecosystem services provides guidance for the use of scenarios and existing models aimed at assessing biodiversity and ecosystem services. In particular, it provides an analysis of best practices for using scenarios and models in assessments. Additionally, the report summarising the scientific outputs of the IPBES-IPCC co-sponsored workshop - Biodiversity and climate change illustrates the interlinkages between and effects of climate change scenarios and biodiversity (including reference to further useful literature).
Examples
1. FrieslandCampina is in the process of assessing the results of a study commissioned to the University of Wageningen on what the dairy industry might be like in 2030. The study looks at a variety of scenarios based on different considerations, including the shift towards more nature-inclusive dairy farming, or towards a world which will require reliable, cheap, and efficiently produced food, where requirements relating to grazing and biodiversity will disappear due to consumers no longer being ready to pay for this in a generic sense. The company states that it will take the study’s future scenarios into consideration in its long-term strategy development and decision-making process
(while the Annual Report 2020 refers to the study (pg. 63), further details were found on the company’s website and in the official study).
2. Unilever Annual Report and Accounts 2020 addresses scenario analysis in a dedicated section of the report (pgs. 52-54). While focused on climate change, the report summarises methods and assumptions, findings, impacts and outlook for the organisation and key commodities, and explains how the outcomes feed into risk management and other processes. Shifting towards sustainable agriculture (as well as net zero deforestation requirements) underpins the 2°C scenario, which would translate into increased raw material prices, hence costs for the company.

AppendicesChapter 4

76 CDSB Framework 76 CDSB Framework | Application guidance for biodiversity-related disclosures
Appendix 1: CDSB Framework – Guiding principles and reporting requirements
Principles
P1 Environmental information shall be prepared applying the principles of relevance and materiality
P2 Disclosures shall be faithfully represented
P3 Disclosures shall be connected with other information in the mainstream report
P4 Disclosures shall be consistent and comparable
P5 Disclosures shall be clear and understandable
P6 Disclosures shall be verifiable
P7 Disclosures shall be forward looking
Reporting requirements
REQ-01 Disclosures shall describe the governance of environmental policies, strategy and information
REQ-02 Disclosures shall report management’s environmental policies, strategy and targets, including the indicators, plans and timelines used to assess performance
REQ-03 Disclosures shall explain the material current and anticipated environmental risks and opportunities affecting the organisation
REQ-04 Quantitative and qualitative results, together with the methodologies used to prepare them, shall be reported to reflect material sources of environmental impact
REQ-05 Disclosures shall include an analysis of the information disclosed in REQ-04 compared with any performance targets set and with results reported in a previous period
REQ-06 Management shall summarise their conclusions about the effect of environmental impacts, risks and opportunities on the organisation’s future performance and position
REQ-07 Environmental information shall be prepared for the entities within the boundary of the organisation or group for which the mainstream report is prepared and, where appropriate, shall distinguish information reported for entities and activities outside that boundary
REQ-08 Disclosures shall cite the reporting provisions used for preparing environmental information and shall (except in the first year of reporting) confirm that they have been used consistently from one reporting period to the next
REQ-09 Disclosures shall be provided on an annual basis
REQ-10 Disclosures shall report and explain any prior year restatements
REQ-11 Disclosures shall include a statement of conformance with the CDSB Framework
REQ-12 If assurance has been provided over whether reported environmental information is in conformance with the CDSB Framework, this shall be included in or cross-referenced to the statement of conformance of REQ-11
December 2019www.cdsb.net/framework
CDSB FrameworkAdvancing and aligning disclosure of environmental information in mainstream reports
for reporting environmental & climate change information

77 CDSB Framework 77 CDSB Framework | Application guidance for biodiversity-related disclosures
Appendix 2: CDSB materiality approachPrinciple 1 of the CDSB Framework offers that information is material if:
• The impacts or results it describes are, due to their nature and magnitude, expected to have a significant positive or negative impact on the company’s financial condition and operational results and its ability to execute its strategy over the short-, medium-, and long-term; or
• Omitting, misstating, or obscuring the information could reasonably be expected to influence the decisions that users of mainstream reports make on the basis of that mainstream report, which provides information about a specific reporting company.178
Corporate reporting on sustainability (including biodiversity) may include three distinct, but nested lenses179 (Figure 9):
a. Reporting to all stakeholders on all sustainability matters that reflect significant impacts on people, the environment and the economy;
b. Reporting to investors on all sustainability matters that affect (future) financial position and performance; and
c. Reporting to investors on monetary amounts included in the financial statements.
The scope of the CDSB Framework mainly covers the intermediate lens (b), but there is significant overlap in the scope of sustainability matters addressed in the different lenses (as shown in Figure 9). Therefore, material information on sustainability risks and opportunities useful to investors can include information about the entity’s impacts on society and the environment, and how those impacts affect its cash flows over the short-, medium- and long-term (also referred to as circularity).
Additionally, the materiality of sustainability issues is dynamic on account of changing environmental conditions and their interactions with an organisation and the development of investor, regulator and consumer expectations, for example business.180 Therefore, depending on its materiality for a specific organisation at a given time, sustainability-related information falls under one of the three forms of reporting noted above. This means that the concerns of one stakeholder group may quickly become material for financial decision-makers (Figure 9). As such, disclosures based on sustainability reporting standards and frameworks from organisations such as CDP, GRI, and the Capitals Coalition are important to ensure reciprocity and responsiveness in the reporting landscape (Figure 9). Organisations should regularly reassess the materiality of sustainability issues to their business and reflect this selection in the sustainability-related financial disclosures (and financial accounting) included in their mainstream report.

78 CDSB Framework 78 CDSB Framework | Application guidance for biodiversity-related disclosures
Figure 9. Materiality of sustainability matters is dynamic, and the three forms of sustainability reporting are nested. The CDSB Framework and Biodiversity Application Guidance focus on sustainability matters that affect financial position and performance. This figure is an adapted version from the publication Reporting on enterprise value by CDP, CDSB, GRI, IIRC and SASB (IIRC and SASB have merged into the Value Reporting Foundation).
E.g. Biodiversity change including source of impacts, standards methodologies, assumptions and tools used to determine contribution (destruction) to sustainable development
Sustainability-related financial disclosure
E.g. Trend and scenario analysis of biodiversity change, including sales-weighted biodiversity dependencies and impacts of products. Companies and investors can thus understand the business levers available to reduce/halt biodiversity loss and the likely effect of improving performance on the company’s enterprise value by reducing / avoiding remediation expenses or improved reputation thanks to the reduction of impacts on biodiversity
Financial accounting and disclosure
E.g. Monetary impact on the statement of profit or loss due to remediation expenses or fines related to regulation on biodiversity
Reporting on all sustainability matters that reflect significant positive or negative impacts on people, the environment and the economy
To various users with various objectives, who want to understand the enterprise’s positive and negative contributions to sustainable development
Reporting on those sustainability matters that create or erode enterprise value
To users with specific interest in understanding enterprise value
Already represented in the financial statements
X
Enterprise value ReportingSustainability Reporting
Data structured using taxonomies and powered by technology
Dynamic Materiality: sustainability topics can move either gradually or very quickly
Dynamic materiality: Dynamic materiality: Sustainability matters can move between boxes over time. For example, changes to biodiversity enters the big box perspective as society becomes aware of biodiversity loss, the middle box as investors start to factor in biodiversity positive transition into capital market pricing, and the small box as financial consequences are felt in net asset values
X Sustainability matter: e.g. biodiversity loss
Sustainability reporting via various materiality lenses
Biodiversity loss
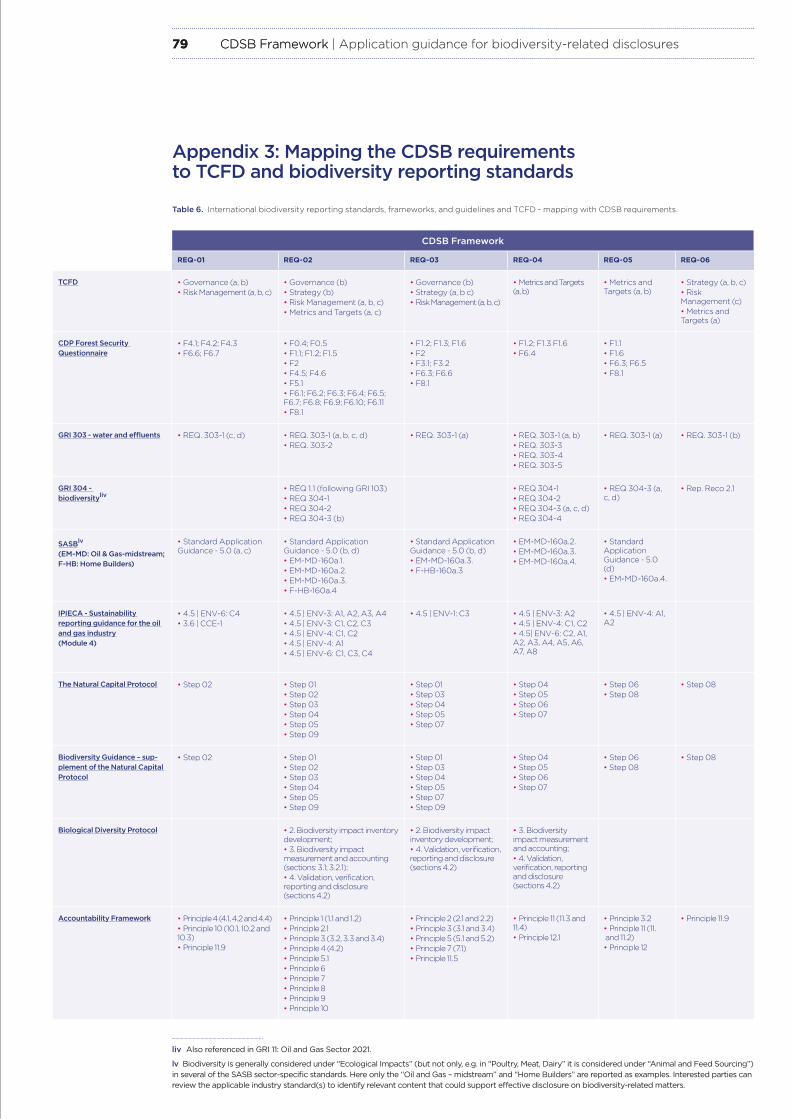
79 CDSB Framework 79 CDSB Framework | Application guidance for biodiversity-related disclosures
Appendix 3: Mapping the CDSB requirements to TCFD and biodiversity reporting standards
Table 6. International biodiversity reporting standards, frameworks, and guidelines and TCFD - mapping with CDSB requirements.
liv Also referenced in GRI 11: Oil and Gas Sector 2021.
lv Biodiversity is generally considered under “Ecological Impacts” (but not only, e.g. in “Poultry, Meat, Dairy” it is considered under “Animal and Feed Sourcing”) in several of the SASB sector-specific standards. Here only the “Oil and Gas – midstream” and “Home Builders” are reported as examples. Interested parties can review the applicable industry standard(s) to identify relevant content that could support effective disclosure on biodiversity-related matters.
REQ-01 REQ-02 REQ-03 REQ-04 REQ-05 REQ-06
TCFD • Governance (a, b)• Risk Management (a, b, c)
• Governance (b)• Strategy (b)• Risk Management (a, b, c)• Metrics and Targets (a, c)
• Governance (b)• Strategy (a, b c)• Risk Management (a, b, c)
• Metrics and Targets (a, b)
• Metrics and Targets (a, b)
• Strategy (a, b, c)• Risk Management (c)• Metrics and Targets (a)
CDP Forest Security Questionnaire
• F4.1; F4.2; F4.3• F6.6; F6.7
• F0.4; F0.5• F1.1; F1.2; F1.5 • F2• F4.5; F4.6• F5.1 • F6.1; F6.2; F6.3; F6.4; F6.5; F6.7; F6.8; F6.9; F6.10; F6.11• F8.1
• F1.2; F1.3; F1.6• F2• F3.1; F3.2• F6.3; F6.6• F8.1
• F1.2; F1.3 F1.6• F6.4
• F1.1• F1.6 • F6.3; F6.5• F8.1
GRI 303 - water and effluents • REQ. 303-1 (c, d) • REQ. 303-1 (a, b, c, d)• REQ. 303-2
• REQ. 303-1 (a) • REQ. 303-1 (a, b)• REQ. 303-3• REQ. 303-4• REQ. 303-5
• REQ. 303-1 (a) • REQ. 303-1 (b)
GRI 304 - biodiversityliv
• REQ 1.1 (following GRI 103)• REQ 304-1• REQ 304-2• REQ 304-3 (b)
• REQ 304-1• REQ 304-2• REQ 304-3 (a, c, d)• REQ 304-4
• REQ 304-3 (a, c, d)
• Rep. Reco 2.1
SASBlv (EM-MD: Oil & Gas-midstream; F-HB: Home Builders)
• Standard Application Guidance - 5.0 (a, c)
• Standard Application Guidance - 5.0 (b, d)• EM-MD-160a.1. • EM-MD-160a.2.• EM-MD-160a.3.• F-HB-160a.4
• Standard Application Guidance - 5.0 (b, d)• EM-MD-160a.3.• F-HB-160a.3
• EM-MD-160a.2.• EM-MD-160a.3.• EM-MD-160a.4.
• Standard Application Guidance - 5.0 (d)• EM-MD-160a.4.
IPIECA - Sustainability reporting guidance for the oil and gas industry (Module 4)
• 4.5 | ENV-6: C4• 3.6 | CCE-1
• 4.5 | ENV-3: A1, A2, A3, A4• 4.5 | ENV-3: C1, C2, C3• 4.5 | ENV-4: C1, C2• 4.5 | ENV-4: A1• 4.5 | ENV-6: C1, C3, C4
• 4.5 | ENV-1: C3 • 4.5 | ENV-3: A2• 4.5 | ENV-4: C1, C2• 4.5| ENV-6: C2, A1, A2, A3, A4, A5, A6, A7, A8
• 4.5 | ENV-4: A1, A2
The Natural Capital Protocol • Step 02 • Step 01• Step 02• Step 03• Step 04• Step 05• Step 09
• Step 01• Step 03• Step 04• Step 05• Step 07
• Step 04• Step 05• Step 06• Step 07
• Step 06• Step 08
• Step 08
Biodiversity Guidance – sup-plement of the Natural Capital Protocol
• Step 02 • Step 01• Step 02• Step 03• Step 04• Step 05• Step 09
• Step 01• Step 03• Step 04• Step 05• Step 07• Step 09
• Step 04• Step 05• Step 06• Step 07
• Step 06• Step 08
• Step 08
Biological Diversity Protocol • 2. Biodiversity impact inventory development;• 3. Biodiversity impact measurement and accounting (sections: 3.1; 3.2.1);• 4. Validation, verification, reporting and disclosure (sections 4.2)
• 2. Biodiversity impact inventory development;• 4. Validation, verification, reporting and disclosure (sections 4.2)
• 3. Biodiversity impact measurement and accounting; • 4. Validation, verification, reporting and disclosure (sections 4.2)
Accountability Framework • Principle 4 (4.1, 4.2 and 4.4)• Principle 10 (10.1, 10.2 and 10.3)• Principle 11.9
• Principle 1 (1.1 and 1.2)• Principle 2.1• Principle 3 (3.2, 3.3 and 3.4)• Principle 4 (4.2)• Principle 5.1• Principle 6• Principle 7• Principle 8• Principle 9• Principle 10
• Principle 2 (2.1 and 2.2)• Principle 3 (3.1 and 3.4)• Principle 5 (5.1 and 5.2)• Principle 7 (7.1)• Principle 11.5
• Principle 11 (11.3 and 11.4)• Principle 12.1
• Principle 3.2• Principle 11 (11. and 11.2)• Principle 12
• Principle 11.9
CDSB Framework

80 CDSB Framework 80 CDSB Framework | Application guidance for biodiversity-related disclosures
Term Definition Source
Area of high biodiversity value
(1) Habitat of significant importance to critically endangered and/or endangered species; (2) Areas of habitat of significant importance to endemic and/or restricted-range species;(3) Habitat supporting globally significant concentrations of migratory species and/or congregatory species; (4) Highly threatened and/or unique ecosystems; and/or (5) Areas associated with key evolutionary processes.
International Finance Corporation
Biodiversity (or biological diversity)
The diversity of life in all its forms — the diversity of species, of genetic variations within one species, and of ecosystems.
UN CBD, 1992
Biodiversity dependency
A biodiversity dependency is a reliance on or use of biodiversity, including biological resources (e.g. materials, liquids, genetic resources) from both species and interactions with various ecosystem processes and services (e.g. pollination, water filtration, crop pest/disease control or water flow regulation).
Adapted from: Biological Diversity Protocol
Biodiversity impact A change in the diversity of ecosystems and/or species that may take place because of business activities. This includes changes to the state of ecosystems (e.g. extent and condition/integrity) and species (e.g. habitat, population size) that can be used to signal changes in biodiversity. A negative impact is a potential loss of biodiversity (e.g. decline in species number) and a positive impact is a potential gain in biodiversity (e.g. nature restoration).
CDSB
Biodiversity-related Financial Disclosure
Decision-useful material information disclosed by an organisation about risks and opportunities that biodiversity presents to an organisation’s strategy, financial performance and condition within the mainstream report to investors.
CDSB
Biodiversity-related financial risks
Financial risks to organisations and the wider financial system resulting from biodiversity loss and ecosystem degradation due to human activity that drives nature loss. This includes physical, transition and liability risk types, aligned to the TCFD. Biodiversity-related financial risks may include expenses/liabilities resulting from implementing mitigation hierarchy principles for biodiversity impacts, impairment of assets linked to biological resources and the associated access/use right/quotas (e.g. fishing rights, forestry concessions) and/or increased costs/decreased revenues resulting from changes in availability of resources.
Adapted from: The Economics of Biodiversity: Dasgupta Review
Cumulative impact A change in the state of biodiversity (direct or indirect) that occurs due to the interaction of activities of different actors operating in a landscape, not only the target organisation.
Adapted from Biological Diversity Protocol, Natural Capital Protocol: Biodiversity Guidance and BBOP, 2012
Direct impact A change in the state of biodiversity caused by a business activity with a direct causal link.
Adapted from: Biological Diversity Protocol and Natural Capital Protocol: Biodiversity Guidance
Ecological Equivalency
The principle that for impact assessment or offsetting purposes, the types of biodiversity lost or gained should be ecologically equivalent or like-for-like (i.e. only the same types of ecosystems or taxa should be aggregated), due to biodiversity patterns varying significantly between different species/ecosystems and locations.
Adapted from: Biological Diversity Protocol
Ecological thresholds and tipping points
An ecological threshold is the point at which a relatively small change or disturbance to a system leads to an abrupt change in ecosystem quality, property or phenomenon.
A tipping point is a specific type of ecological threshold, referring to a situation where accelerating change, caused by a positive (self-enforcing) feedback mechanism, drives an ecosystem to a new state, with significant changes in biodiversity, natural capital and/or ecosystem services. Changes in ecosystems that take place once a tipping point has been reached can be long lasting, hard to reverse or irreversible.
Adapted from: Valuing Nature Programme and Groffman, P. et al (2006)
Appendix 4: Definitions
The definitions and associated sources for key terms used in the Biodiversity Application Guidance are outlined below.
Table 7. Definitions of common terms used throughout the Biodiversity Application Guidance, including sources.

81 CDSB Framework 81 CDSB Framework | Application guidance for biodiversity-related disclosures
Term Definition Source
Ecosystem A dynamic complex of plants, animals, and microorganisms, and their non-living environment, interacting as a functional unit (e.g. deserts, coral reefs, wetlands, and rainforests).
Millennium Ecosystem Assessment (MEA), 2005
Ecosystem Services The flows of benefits that ecosystems make to people (e.g. timber, fibre, pollination, water regulation, climate regulation, recreation, mental health), enabling human activities which, include the operation of businesses.
Adapted from: Natural Capital Protocol
Final Ecosystem Services
When an ecological end-product transitions to being either an economic benefit or something that can be directly used or appreciated by people.
Adapted from: Finisdore, J., et al. (2020), CICES and NESCS
Habitat The place or type of site where an organism or population naturally occurs.
UN CBD, 1992
Indirect impact A change in the state of biodiversity caused by a business activity with an indirect causal link (e.g. indirectly caused by the climate change GHG emissions contributed to).
Adapted from: Biological Diversity Protocol and Natural Capital Protocol: Biodiversity Guidance
Invasive species Plant and animal species introduced (deliberately or accidentally) into a natural environment, whose acclimatisation and propagation represent a major threat to eco-systems, habitats and native species with negative impacts on the environment, the economy and human health.
From IUCN French Committee.
Land-use The human use of a specific area for a certain purpose (such as residential; agriculture; recreation; industrial, etc.). Influenced by, but not synonymous with, land cover. Land-use change refers to a change in the use or management of land by humans, which may lead to a change in land cover.
Note: In the context of this guidance, the connection to climate change will also be considered in relation to land-use, land-use change and forestry (LULUCF), as set out by the IPCC. LULUCF activities have an important role to play in climate mitigation, although mitigation options can also have adverse side effects for biodiversity and nature.
IPBES; IPCC, Special Report on Climate Change and Land, 2019
Mitigation hierarchy (biodiversity)
A sequence of actions applied to the management of biodiversity impacts, consisting of four stages:
1. Avoid impacts on biodiversity;
2. Reduce biodiversity impacts as far as possible;
3. Restore/remediate impacts that are immediately reversible; and
4. Offset residual impacts to achieve a desired net outcome (e.g. no net loss or net gain).
Adapted from: Business and Biodiversity Offsets Programme (BBOP) and Natural Capital Protocol: Biodiversity Guidance
Natural Capital The stock of renewable and non-renewable natural resources (e.g., plants, animals, air, water, soils, minerals) that combine to yield a flow of benefits to people (ecosystem services).
Natural Capital Protocol
Nature-positive A world with a net positive state of nature by 2030, and full recovery of nature by 2050.
Adapted from: SBTN and Nature+Positive
Physical risks: acute and chronic
Physical climate (and environmental) risks can be classified as acute when they are event driven, or chronic when they are linked to longer-term shifts in climate (and environmental) patterns.
Recommendations of the TCFD
Protected area A clearly defined geographical space, recognised, dedicated, and managed, through legal or other effective means, to achieve the long-term conservation of nature with associated ecosystem services and cultural values.
IUCN definition 2008, 2013
Species A group of individuals that actually or potentially interbreed and produce fertile offspring.
Biological Diversity Protocol
Valuation The process of estimating the relative importance, worth, or usefulness of biodiversity to people, in a particular context (e.g. for an organisation).
Natural Capital Protocol: Biodiversity Guidance
Value Chain An organisation’s direct operations, upstream activities and downstream activities. Direct operations cover activities over which the organisation has direct control, upstream activities cover the activities of suppliers, leased assets, outsourcing operation and franchises and downstream activities are those linked to the purchase, use, re-use, recovery, recycling and final disposal of the organisation’s products and services.
Adapted from: Natural Capital Protocol; Biological Diversity Protocol

82 CDSB Framework 82 CDSB Framework | Application guidance for biodiversity-related disclosures
Appendix 5: Key CDSB resourceslvi
1. CDSB (2021). Accounting for climate Integrating climate-related matters into financial reporting - Supplementary paper. Available from: https://www.cdsb.net/sites/default/files/cdsb_climateaccountingguidance_2021_v4.pdf
2. CDSB (2021). The CDSB Framework Application guidance for water-related disclosures. Available from: https://www.cdsb.net/water
3. CDSB (2021). Decision-useful climate-related information for investors - What, Why & How?. Available from: https://www.cdsb.net/decision-useful
4. CDSB (2020). Accounting for climate. Available from: https://www.cdsb.net/climateaccounting
5. CDSB (2020). Application guidance for climate-related disclosures. Available from: https://www.cdsb.net/climateguidance
6. CDSB and CDP (2020). The building blocks: Connecting CDP data with the CDSB Framework to successfully fulfil the TCFD Recommendations. Available from: https://www.cdsb.net/buildingblocks
7. CDSB (2019). CDSB Framework for reporting environmental and climate change information. Available from: https://www.cdsb.net/framework
8. CDSB (2018). Uncharted waters: How can companies use financial accounting standards to deliver on the Task Force on Climate-related Financial Disclosures’ recommendations? Available from: https://www.cdsb.net/sites/default/files/uncharted_waters_final.pdf
9. CDSB (2012). Proposals for boundary setting in mainstream reports. Available from: https://www.cdsb.net/sites/default/files/proposals_for_mainstream_report_boundary_setting.pdf
lvi These resources are mainly related to climate (and water), but they provide technical and practical support for the preparation of sustainability-related financial information and mainstream reports, which can be useful also in the case of biodiversity-related financial information.

83 CDSB Framework 83 CDSB Framework | Application guidance for biodiversity-related disclosures
Appendix 6: Common examples of biodiversity impacts drivers and changes to the state of biodiversity
Table 8. Common examples of biodiversity impacts drivers (sources of biodiversity impact), with a description of each and how they contribute to or are connected to biodiversity impacts. References: Natural Capital Protocol Biodiversity Guidance; IUCN Guidelines for planning and monitoring corporate biodiversity performance, IPBES Global assessment report on biodiversity and ecosystem services
Impact Driver Description Change in state of biodiversity
Changes in land-, freshwater- and sea-use
Changes to land/sea/freshwater areas such as deforestation, urbanisation, converting natural habitats for agriculture or seabed destruction (e.g. due to bottom trawling or marine construction) transforms the amount of natural habitat available and can cause habitat fragmentation.
Loss of habitat cover and connectivity, degradation and fragmentation can lead to changes to species distribution, changes to species migration patterns, changes to population sizes and loss of ecosystem function.
Resource exploitation
Direct exploitation of organisms and natural resources (e.g. use of timber, use of water, exploitation of animals on or close to farms).
Decrease in abundance and diversity of species, genetic drift and habitat degradation.
Noise/light pollution Noise or light pollution as a result of operational activities (e.g. construction noise, artificial light emissions).
Changes to species behaviour and distribution, including migration and breeding patterns (e.g. disruption of foraging, breeding or social behaviour).
Waste Plastic waste or waste assimilation. Impacts on species abundance (e.g. reduction in abundance due to macroplastics or microplastics along the food chain).
Soil pollution Toxic pollution resulting from the use of agrochemicals being up taken by plant species and ingested across the food chain. Excessive nutrients used in agriculture entering water networks.
Loss of abundance or diversity of species that ingest of toxic pollutants (e.g. invertebrates, insects) and those that feed on them (e.g. birds). Aquatic eutrophication resulting in destruction of equilibrium in aquatic ecosystems.
Water pollution Water pollutants resulting in reduced oxygen levels within the impacted waterway (e.g. river, lake, or stream) due to the input of chemicals.
Reduction in number of species present in affected area, including both those affected by chemicals and those that feed on them.
Air emissions Emissions of GHGs and other air pollutants. Decrease in air quality and climate change resulting in loss of ecosystem quality and changes to species distribution and population sizes.

84 CDSB Framework 84 CDSB Framework | Application guidance for biodiversity-related disclosures
Appendix 7: Key Initiatives
Table 9. Key biodiversity-related initiatives.
Initiative Description Key aims
Capitals Coalition
A collaboration of leading organisations in areas including research, science, academia, reporting, investment and business. The coalition develops, advocates for and advances the capitals approach, and has developed two standardised frameworks for identifying, measuring and valuing dependencies on natural capital, including biodiversity guidance.
To work with organisations and individuals spanning global systems, to understand the value that flows from the capitals, to ensure that it is included in decision-making and that the value of nature, people and society sits alongside financial value in the minds of decision-makers.
TNFD A global initiative catalysed through a partnership between Global Canopy, UNDP, UNEP-FI & WWF. The Taskforce consists of approximately 35 members, including financial institutions, corporates and service providers.
Provision of a framework by late 2023 for corporates and financial institutions to assess, manage and report impacts and dependencies on nature, to provide a complete picture of environmental risks and support a shift in global financial flows away from nature-negative outcomes and towards nature-positive outcomes.
Business For Nature
A coalition comprising of companies and conservation organisations, encouraging companies to commit and act to reverse nature loss.
Amplifying the voice of business to encourage greater policy ambition relating to biodiversity and nature, as well as strengthening business momentum.
Partnership for Biodiversity Accounting Financials
A partnership of financial institutions initiated by ASN Bank in 2019 that work together to explore challenges and opportunities of the assessment and disclosure of the impact on biodiversity associated with loans and investments.
Contribute to the development of a harmonised biodiversity accounting approach in the financial sector: the ‘PBAF Standard’.
SBTN A network of organisations aligned through the Global Commons Alliance focused on building upon the Science-Based Targets Initiative across the whole Earth system.
Defining integrated targets for cities and companies across all Earth system, defining what is necessary to stay within Earth’s limits and meet society’s needs, by 2022.
The Food and Land Use Coalition
A community of partners including SYSTEMIQ, WBCSD and WRI, working to galvanise system change relating to food and land-use, through a series of global initiatives.
Harnessing the expertise of public, private and research organisations to enable systems thinking on food and land-use transformation for people, nature and climate.
EU Business @ Biodiversity Platform
A forum set up by the European Commission, running workstreams with EU companies and financial institutions to link business and biodiversity.
Working with and helping businesses to measure and integrate the value of nature into business practices.
The Global Partnership for Business and Biodiversity
Links 21 national and regional initiatives, all working towards greater business engagement on biodiversity-related issues, so that they can share information and good practices, and cooperate on common projects.
Increase the number of companies with a significantly reduced negative impact upon biodiversity (or even a net-positive impact) and to mobilise and enable them to act as positive influencers upon other entities.
Act4nature An international alliance led by EpE under a multi-stakeholder steering committee. Act4nature has CEO-level and SMART individual objectives for businesses to sign.
Aim to accelerate business action in favour of nature and mobilise companies to protect, promote and restore biodiversity driven by commitment from CEOs.
One Planet Business for Biodiversity
An international, cross-sectorial business coalition on biodiversity with a specific focus on agriculture, launched at the UN Climate Action Summit in 2019.
Drive transformational systemic change and catalyse action to protect and restore biodiversity within value chains, engage institutional and financial decision-makers, and promote policy recommendations.
Finance for Biodiversity Pledge and Foundation
A biodiversity commitment pledge launched by 26 financial institutions in 2020, which currently has 55 signatories, representing over EURO 9 trillion in assets.
Reverse nature loss to ensure ecosystem resilience through commitments by global leaders to restore and protect biodiversity through finance activities and investments in the run-up to COP 15.

85 CDSB Framework 85 CDSB Framework | Application guidance for biodiversity-related disclosures
Initiative Description Key aims
Finance4 Biodiversity Initiative
A dual-purpose platform, established in 2019, implementing its activities across five workstreams and making grants to support others to undertake work in these areas.
To increase the materiality of biodiversity in financial decision-making and to better align global finance with nature conservation and restoration.
The Align Project (Aligning accounting approaches for nature)
Funded by the European Commission, and led by WCMC Europe, the Capitals Coalition, Arcadis, ICF and UNEP-WCMC, the Align project supports businesses, financial institutions and other stakeholders in developing standardised natural capital accounting practices, including a standardised approach to biodiversity measurement.
To accelerate the natural evolution of natural capital accounting approaches, from guidance to standardisation, by developing a generally accepted set of methods, indicators and criteria for corporate biodiversity measurement tools and approaches, sector specific guidance for site based, value chain and finance sector companies and a standardised approach to measure corporate impacts and dependencies on biodiversity.
The Transparent Project
A collaboration between The Value Balancing Alliance, the Capitals Coalition and the WBCSD to develop a set of environmental generally accepted accounting principles.
To help the private sector shift towards a more sustainable financial and economic system. by developing a standardised natural capital accounting and valuation methodology that businesses can use in their decision-making and external disclosure.
The Biodiversity Finance Initiative
Initiated at the CBD COP 11 by UNDP and the European Commission, and now present in 40 countries, BIOFIN is working with governments, civil-society, vulnerable communities, and the private sector to catalyse investments in nature.
To demonstrate how nature-positive economies can work for people and the planet.

86 CDSB Framework 86 CDSB Framework | Application guidance for biodiversity-related disclosures
Tool / Approach Developer Description Sector
Biodiversity and ecosystem services guidance for the oil and gas industry
International Petroleum Industry Environmental
Conservation Association and International
Association of Oil & Gas Producers
Sets out guidance for the oil and gas industry to assess biodiversity and ecosystem services dependencies and potential impacts.
Extractive industry
Biodiversity Footprint Calculator
Plansup Calculates the impact of a company’s supply chain, production processes and transport related to products.
Cross-sectoral
Biodiversity Footprint Financial Institution
CREM, PRé Sustainability
Provides an overall biodiversity footprint of investments of a financial institution, including the calculation of environmental impact as well as the environmental footprint of investments within a portfolio.
Cross-sectoral
Biodiversity Indicators for Site-Based Impacts
UNEP-WCMC, Conservation International and Fauna and Flora International
Methodology that meets the needs of extractive companies in understanding their performance in mitigating their impacts on biodiversity.
Extractive industry
Biodiversity Monitoring System
EU LIFE Food and Biodiversity
Assesses site level supply chain biodiversity impacts by processing aggregated data sets. Includes 35 indicators covering the loss of biodiversity.
Food sector
Biodiversity Intactness Index
Newbold et al. (2016)
Modelled (or expert-derived) species population densities in different land-use intensities, weighted by species richness for the ecoregion.
Maps can be downloaded from: https://data.nhm.ac.uk/dataset/global-map-of-the-biodiversity-intactness-index-from-newbold-et-al-2016-science
Cross-sectoral
Biodiversity Net-Gain Calculator
Acadis This accounting approach allows companies to verify compliance with ‘No Net Loss’ and ‘Net Gain’ goals. It aims to demonstrate the ‘Net Gain’ achieved through insight to the land-use related biodiversity value at site level considering extent, condition and significance (a score between 0 and 1 is attributed by experts through field survey assessments).
Cross-sectoral
Biological Diversity Protocol
Biodiversity Disclosure Project and Endangered Wildlife Trust
Aligned with the Natural Capital Protocol, it enables organisations to identify, manage and report on their impacts in a standardised, credible and comparable way through statements of biodiversity position and performance.
Cross-sectoral
Bioscope PRé Sustainability, Arcadis and CODE
Calculates supply chain impacts on biodiversity for commodities and resources purchased from 170 sectors for a range of impact drivers using the ReCiPe method.
Cross-sectoral
Cool Farm Tool Cool Farm Alliance Enables organisations to calculate the biodiversity footprint of products and supply chains.
Agriculture sector
Corporate
Biodiversity
Footprint
Iceberg data lab Metric of corporate biodiversity impact that reflects the extent to which ecosystems affected by a company’s business have been degraded from their pristine natural state. The score factors in a company’s land-use, nitrogen deposition, GHG emissions and release of toxic compounds.
Cross-sectoral
Appendix 8: Tools, models and frameworks supporting the assessment and quantification of biodiversity impacts
Table 10. References: Adapted from Natural Capital Protocol Biodiversity Guidance; IUCN Guidelines for planning and monitoring corporate biodiversity performance; EU Business @ Biodiversity Platform - Assessment of biodiversity measurement approaches for businesses and financial institutions; UN WCMC – Biodiversity Measures for Business.
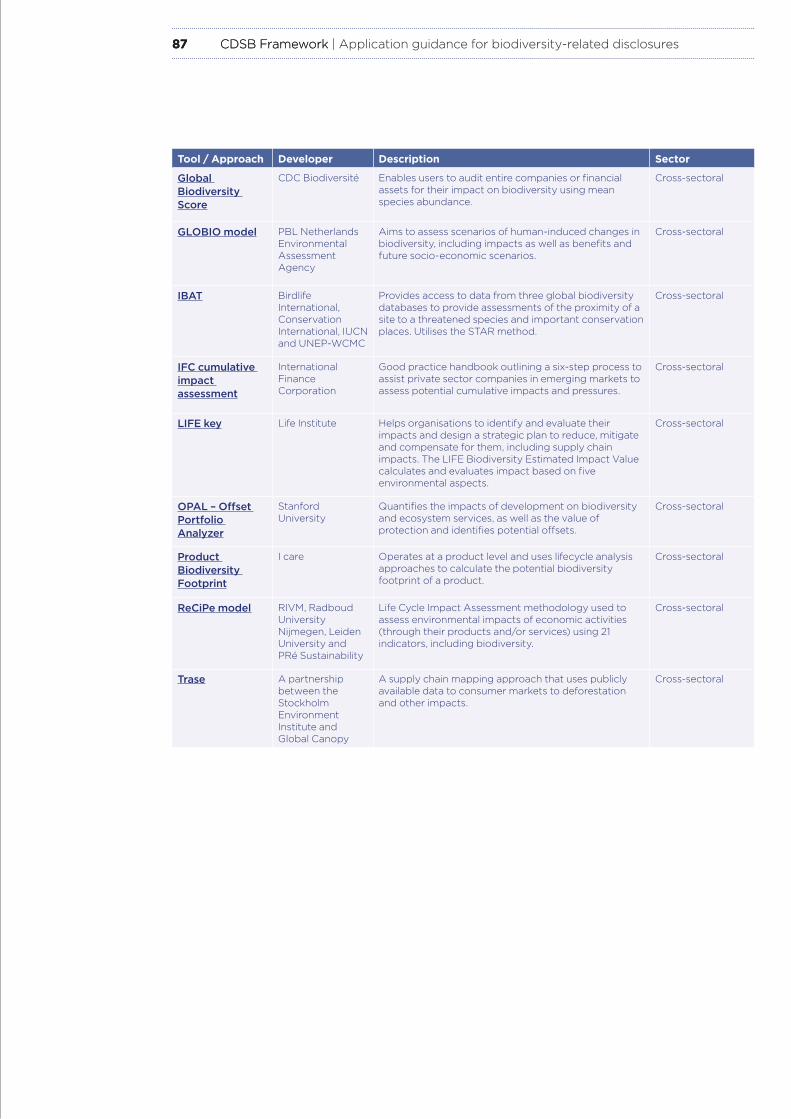
87 CDSB Framework 87 CDSB Framework | Application guidance for biodiversity-related disclosures
Tool / Approach Developer Description Sector
Global Biodiversity Score
CDC Biodiversité Enables users to audit entire companies or financial assets for their impact on biodiversity using mean species abundance.
Cross-sectoral
GLOBIO model PBL Netherlands Environmental Assessment Agency
Aims to assess scenarios of human-induced changes in biodiversity, including impacts as well as benefits and future socio-economic scenarios.
Cross-sectoral
IBAT Birdlife International, Conservation International, IUCN and UNEP-WCMC
Provides access to data from three global biodiversity databases to provide assessments of the proximity of a site to a threatened species and important conservation places. Utilises the STAR method.
Cross-sectoral
IFC cumulative impact assessment
International Finance Corporation
Good practice handbook outlining a six-step process to assist private sector companies in emerging markets to assess potential cumulative impacts and pressures.
Cross-sectoral
LIFE key Life Institute Helps organisations to identify and evaluate their impacts and design a strategic plan to reduce, mitigate and compensate for them, including supply chain impacts. The LIFE Biodiversity Estimated Impact Value calculates and evaluates impact based on five environmental aspects.
Cross-sectoral
OPAL – Offset Portfolio Analyzer
Stanford University
Quantifies the impacts of development on biodiversity and ecosystem services, as well as the value of protection and identifies potential offsets.
Cross-sectoral
Product Biodiversity Footprint
I care Operates at a product level and uses lifecycle analysis approaches to calculate the potential biodiversity footprint of a product.
Cross-sectoral
ReCiPe model RIVM, Radboud University Nijmegen, Leiden University and PRé Sustainability
Life Cycle Impact Assessment methodology used to assess environmental impacts of economic activities (through their products and/or services) using 21 indicators, including biodiversity.
Cross-sectoral
Trase A partnership between the Stockholm Environment Institute and Global Canopy
A supply chain mapping approach that uses publicly available data to consumer markets to deforestation and other impacts.
Cross-sectoral

88 CDSB Framework 88 CDSB Framework | Application guidance for biodiversity-related disclosures
Database Developer Description
Global Forest Watch Partnership convened by World Resources Institute
Online platform that provides data and tool for monitoring forests.
IUCN Red Lists (Threatened Species; Ecosystems)
IUCN Threatened Species: A comprehensive information source on the global extinction risk status of animal, fungus and plant species, including information on range, population size, habitat and ecology, use and/or trade, threats and conservation actions.
Ecosystems: Evaluation of the status of ecosystems based on scientific assessments of the risk of ecosystem collapse (i.e. collapsed, threatened at Critically Endangered, Endangered or Vulnerable levels, of Least Concern).
The Living Planet Database
ZSL and WWF Holds time-series data for over 27,000 populations of mammals, birds, fish, reptiles and amphibian species around the world, which are aggregated to produce indices on the state of biodiversity. Data can be disaggregated for analysis of trends at different scales and for different habitats.
International Waterbird Census Database
Wetlands International Provides population trend data for over 800 waterbird species and 2300 biogeographic populations worldwide.
Global Biodiversity Information System
Global Biodiversity Information Facility
Provides historical trends in the occurrence of species.
Ocean Data Viewer UNEP-WCMC Provides a range of spatial datasets on marine and coastal biodiversity that are useful for informing decisions regarding the conservation of marine and ocean ecosystems.
Integrated Biodiversity Assessment Tool
Birdlife International, Conservation International, IUCN and UNEP-WCMC
Provides geographic information about global biodiversity (i.e. World Database on Protected Areas, IUCN Red List of Threatened Species, and the World Database of Key Biodiversity Areas) that support the assessment of priority areas and impact.
Appendix 9: Databases that may be useful for identifying risk areas (REQ-03), measuring impact (REQ-04) or monitoring performance (REQ-05)Table 11. Biodiversity-related databases.
Appendix 10: Mapping of the Pathway approach and DPSIR framework
Figure 10. Mapping of DPSIR (Driver-Pressure-State-Impact-Response) framework to Pathway approach (see Box 2) and CDSB requirements. References: SBTN Guidance Updates, the Natural Capital Protocol and Environmental indicators: Typology and overview by the European Environmental Agency.
RE
Qs
Drivers
e.g. land-use planning restrictions, consumer demand for natural resources
Pat
hway
DP
SIR
Pressures
e.g. ecosystem use change, resource exploitation, pollution, climate change
State
e.g. decline of biodiversity, change to species abundance or ecosystem intactness
Impact
e.g. reputational loss, fines, reduction in availability of natural resources
Responses
e.g. management biodiversity strategy, habitat restoration, use of sustainable resources
1. Measure impact drivers and dependencies
2. Measure changes in the state of biodiversity
3. Value biodiversity impacts and dependencies
REQ-06 REQ-02REQ-04
REQ-04 REQ-03REQ-04REQ-06
REQ-01REQ-02REQ-05REQ-06

89 CDSB Framework 89 CDSB Framework | Application guidance for biodiversity-related disclosures
References1. Climate Disclosure Standards Board (2019). CDSB
Framework for reporting environmental and climate change information. Available from: https://www.cdsb.net/framework
2. United Nations (1992). Convention on Biological Diversity. Available from: https://www.cbd.int/doc/legal/cbd-en.pdf
3. Endangered Wildlife Trust (2020). The Biological Diversity Protocol. Available from: https://www.nbbnbdp.org/uploads/1/3/1/4/131498886/biological_diversity_protocol__bd_protocol_.pdf
4. Reid, W. V. (2005). Millennium ecosystem assessment. Available from: http://www.millenniumassessment.org/en/Synthesis.aspx
5. Capitals Coalition (2016). Natural Capital Protocol. Available from: https://naturalcapitalcoalition.org/natural-capital-protocol/
6. Ibid.
7. Ibid., 3.
8. Task Force on Climate-related Financial Disclosures (2017). Final Report: Recommendations of the Task Force on Climate-related Financial Disclosures. Available from: https://www.fsb-tcfd.org/wp-content/uploads/2017/06/FINAL-2017-TCFD-Report-11052018.pdf
9. Dasgupta, P. (2021). The Economics of Biodiversity: The Dasgupta Review. (London: HM Treasury). Available from: https://assets.publishing.service.gov.uk/government/uploads/system/uploads/attachment_data/file/962785/The_Economics_of_Biodiversity_The_Dasgupta_Review_Full_Report.pdf
10. UN Environment Programme, UNEP Finance Initiative and Global Canopy (2020). Beyond ‘Business as Usual’: Biodiversity targets and finance. Managing biodiversity risks across business sectors. UNEP-WCMC, Cambridge, UK. Available from: https://www.unepfi.org/wordpress/wp-content/uploads/2020/06/Beyond-Business-As-Usual-Full-Report.pdf
11. De Nederlandsche Bank, PBL Netherlands Environmental Assessment Agency (2020). Indebted to nature - Exploring biodiversity risks for the Dutch financial sector. Available from: https://www.dnb.nl/media/4c3fqawd/indebted-to-nature.pdf
12. World Economic Forum (2020). Nature Risk Rising: Why the Crisis Engulfing Nature Matters for Business and the Economy, New Nature Economy series, World Economic Forum. Available from: http://www3.weforum.org/docs/WEF_New_Nature_Economy_Report_2020.pdf
13. ILO and WWF (2020). Nature Hires: How Nature-based Solutions can power a green jobs recovery. Available from: https://wwfint.awsassets.panda.org/downloads/nature_hires_report_wwf_ilo.pdf
14. OECD (2019). Biodiversity: Finance and the Economic and Business Case for Action (prepared by the OECD for the French G7 Presidency and the G7 Environment Ministers’ Meeting). Available from: https://www.oecd.org/environment/resources/biodiversity/G7-report-Biodiversity-Finance-and-the-Economic-and-Business-Case-for-Action.pdf
15. Ibid., 66.
16. Ibid., 9.
17. Ibid., 10.
18. AXA & WWF (2019). Into the Wild: Integrating nature into investment strategies. Available from: https://wwfint.awsassets.panda.org/downloads/report_wwf_france___axa_into_the_wild_may_2019__dv_1.pdf
19. Capitals Coalition and Cambridge Conservation Initiative (2020). Integrating Biodiversity into Natural Capital Assessments. Available from: https://naturalcapitalcoalition.org/wp-content/uploads/2020/10/Biodiversity-Guidance_COMBINED_single-page.pdf
20. Thamotheram, R., Stewart, O. (2016). Bee colony and food supply collapse: Could investors be the cavalry? Chapter 9 in Atkins and Atkins, The business of bees: An integrated approach to bee decline and corporate responsibility. Greenleaf Publishing, Saltaire, UK, pp. 170–186. pp. 170–186. Available from: https://www.taylorfrancis.com/chapters/edit/10.4324/9781351283922-18/bee-colony-food-supply-collapse-could-investors-cavalry-raj-thamotheram-olivia-stewart-preventable-surprises-uk
21. Herron, A. (2019). Extraction and extinction: the role of investors in ensuring the marine health of the planet. Chapter 7 in Atkins and Atkins, Around the World in 80 Species: Exploring the Business of Extinction, pp.146–150. Available from: https://www.taylorfrancis.com/books/edit/10.4324/9780429437397/around-world-80-species-jill-atkins-barry-atkins
22. IPIECA, API and IOGP (2020). Sustainability reporting guidance for the oil and gas industry. Available from: https://www.ipieca.org/media/5115/ipieca_sustainability-guide-2020.pdf
23. IUCN (2020). A compass for navigating the world of biodiversity footprinting tools: an introduction for companies and policy makers. Available from: https://www.iucn.nl/app/uploads/2021/04/a_compass_for_navigating_biodiversity_footprint_tools_-_final_1.pdf
24. Hilton, S. and Lee, JM J. (2021). Assessing Portfolio Impacts - Tools to Measure Biodiversity and SDG Footprints of Financial Portfolios. Gland, Switzerland: WWF. Available from: https://wwf.panda.org/?2898916/Assessing-Portfolio-Impacts
25. The Netherlands Enterprise Agency (2021). Biodiversity Footprint for Financial Institutions - Exploring Biodiversity Assessment. Available from: https://www.government.nl/documents/reports/2021/07/29/biodiversity-footprint-for-financial-institutions
26. CDSB (2021). The state of EU Environmental Disclosure in 2020. Available from: https://www.cdsb.net/nfrd2020
27. UN-WCMC (2020). Biodiversity measures for business: Corporate biodiversity measurement, reporting and disclosure within the current and future global policy context. Available from: https://www.unep-wcmc.org/system/comfy/cms/files/files/000/001/845/original/aligning_measures_corporate_reporting_disclosure_dec2020.pdf
28. Addison, P. F., Bull, J. W., & Milner-Gulland, E. J. (2019). Using conservation science to advance corporate biodiversity accountability. Conservation Biology,
https://www.unepfi.org/wordpress/wp-content/uploads/2020/06/Beyond-Business-As-Usual-Full-Report.pdf
https://www.unepfi.org/wordpress/wp-content/uploads/2020/06/Beyond-Business-As-Usual-Full-Report.pdf

90 CDSB Framework 90 CDSB Framework | Application guidance for biodiversity-related disclosures
33(2), 307-318. Available from: https://conbio.onlinelibrary.wiley.com/doi/full/10.1111/cobi.13190
29. KPMG (2020) The KPMG Survey of Sustainability Reporting 2020. KPMG Impact. Available from: https://assets.kpmg/content/dam/kpmg/xx/pdf/2020/11/the-time-has-come.pdf
30. Ibid., 10.
31. Vivid Economics and PRI (2020). The Inevitable Forest Finance Response: Investor Opportunities. Available from: https://www.unpri.org/download?ac=11981
32. United Nations (2015). The 17 Sustainable Development Goals. Available from: https://sdgs.un.org/goals
33. Steffen, W., Richardson, K., Rockström, J., Cornell, S. E., Fetzer, I., Bennett, E. M., et al. (2015). Planetary boundaries: Guiding human development on a changing planet. Science, 347(6223). Available from: https://science.sciencemag.org/content/347/6223/1259855
34. Ibid., 9.
35. Ibid., 9.
36. Ibid., 5.
37. Ibid., 23.
38. Ibid., 5.
39. IPBES (2019). Global assessment report on biodiversity and ecosystem services of the Intergovernmental Science-Policy Platform on Biodiversity and Ecosystem Services. Available from: https://ipbes.net/global-assessment
40. Haines-Young, R. and M.B. Potschin (2018). Common International Classification of Ecosystem Services (CICES) V5.1 and Guidance on the Application of the Revised Structure. Available from: https://cices.eu/content/uploads/sites/8/2018/01/Guidance-V51-01012018.pdf
41. Díaz, S., et al. (2020). RE: There is more to Nature’s Contributions to People than Ecosystem Services–A response to de Groot et al.. Available from: https://www.researchgate.net/publication/351984127_There_is_more_to_Nature%27s_Contributions_to_People_than_Ecosystem_Services_-_A_response_to_de_Groot_et_al
42. Ibid., 39.
43. Ibid., 41.
44. Finisdore, J., et al. (2020). The 18 benefits of using ecosystem services classification systems. Ecosystem Services, 45, 101160. Available from: https://www.sciencedirect.com/science/article/pii/S2212041620301029?casa_token=XPfVCTyH4t4AAAAA:IL9cImZshq28sQ4rLmFE2bXT805-HDF-EWY1w1rBxqhYF5ZfpUkcTa_bQQcTmVcRO53iBi4NFw
45. EPA (2015). National Ecosystem Services Classification System (NESCS): Framework Design and Policy Application. Available from: https://www.epa.gov/eco-research/national-ecosystem-services-classification-system-framework-design-and-policy
46. Ibid., 9.
47. Wall, D. H., & Nielsen, U. N. (2012). Biodiversity and ecosystem services: is it the same below ground.
Nature Education Knowledge, 3(12), 8. Available from: https://www.nature.com/scitable/knowledge/library/biodiversity-and-ecosystem-services-is-it-the-96677163/
48. Ibid., 19.
49. Tilman, D. (2000). Causes, consequences and ethics of biodiversity. Nature 405, 208-211. Available from: https://www.nature.com/articles/35012217
50. Ives, A. R. & Carpenter, S. R. (2007). Stability and diversity of ecosystems. Science 317, 58-62. Available from: https://science.sciencemag.org/content/317/5834/58.abstract?casa_token=Rs3F1E_HMoYAAAAA:bP1Bpx20YuiY8HjptqKx3iMxxi3dsRBDUcBwzW0m-TAwEAwehIKjtLOHEe82LPUSY_NUPmaIf-ht9g
51. Brussaard, L., de Ruiter P. C., & Brown, G. G. (2007). Soil biodiversity for agricultural sustainability. Agriculture, Ecosystems and Environment 121, 233-244. Available from: https://www.sciencedirect.com/science/article/pii/S0167880906004476?casa_token=vGt-dc2LE7gAAAAA:wD0TMPTlLZXM5181ril0Q3-vVsBtAZoB0FWDwPqCo0R5sMeYwm3xyyGVZGWGN0Ox_TfAEDjWQg
52. Nielsen, U. N., Ayres, E., Wall, D. H., & Bardgett, R. D. (2011). Soil biodiversity and carbon cycling: a review and synthesis of studies examining diversity–function relationships. European Journal of Soil Science, 62(1), 105-116. Available from: https://onlinelibrary.wiley.com/doi/full/10.1111/j.1365-2389.2010.01314.x?casa_token=byPRQ4D2mvEAAAAA%3AzVY8wuoTtvGWo66XVXWVQgsTG5Ewhg9rL0Bxagy1-RLdN8T-YDRClAOhoLyAR_K1jdSUfQzPtUie2g
53. Ibid., 9.
54. Ibid., 44.
55. Ibid., 45.
56. Ibid., 9.
57. Pimm, S. L., et al. (2014). The biodiversity of species and their rates of extinction, distribution, and protection. science, 344(6187). Available from: https://www.science.org/doi/10.1126/science.1246752?sid=3f4c15ad-79f5-4eeb-a618-af62e6fccef2
58. Ibid., 39.
59. Ceballos, G., Ehrlich, P. and Dirzo, R. (2017). Population losses and the sixth mass extinction. Proceedings of the National Academy of Sciences. Jul 2017, 114 (30). Available from: https://www.pnas.org/content/114/30/E6089
60. Ibid., 39.
61. Ibid., 10.
62. Ibid., 33.
63. World Economic Forum (2020). Global Risk Report 2020. Available from: https://www.weforum.org/reports/the-global-risks-report-2020
64. Ibid., 33.
65. Ibid., 14.
66. Sutton, P.C., S. Anderson, R. Costanza, and I. Kubiszewski (2016). The Ecological Economics of Land Degradation: Impacts on Ecosystem Service Values. Ecological Economics 129: 182–192. Available from:
91 CDSB Framework 91 CDSB Framework | Application guidance for biodiversity-related disclosures
https://www.sciencedirect.com/science/article/abs/pii/S0921800915301725
67. Ibid., 10.
68. Ibid., 11.
69. Ibid., 23.
70. Ibid., 5.
71. UNEP-WCMC and BirdLife (2021). Impacts of climate change on biodiversity and ecosystem services. Available from: https://www.birdlife.org/projects/7-impacts-climate-change-biodiversity-and-ecosystem-services
72. IPCC (2019). Sea Level Rise and Implications for Low-Lying Islands, Coasts and Communities. In: IPCC Special Report on the Ocean and Cryosphere in a Changing Climate. Available from: https://www.ipcc.ch/srocc/;
73. IPCC (2018). Global Warming of 1.5°C. Available from: https://www.ipcc.ch/sr15/
74. Ibid., 5.
75. Ibid., 19.
76. Ibid., 5.
77. TNFD (2021). TNFD – Nature in scope. Available from: https://tnfd.global/wp-content/uploads/2021/07/TNFD-Nature-in-Scope-2.pdf
78. Ibid., 5.
79. PBAF Netherlands (2020). Paving the way towards a harmonised biodiversity accounting approach for the financial sector. Available from: https://www.pbafglobal.com/files/downloads/PBAF_commongroundpaper2020.pdf
80. Ibid., 9.
81. Ibid., 9.
82. IUCN (2021). Crossroads blog - Tackling biodiversity loss to achieve green, resilient, and inclusive development. Available from: https://www.iucn.org/crossroads-blog/202109/tackling-biodiversity-loss-achieve-green-resilient-and-inclusive-development
83. IPBES, IPCC (2021). Biodiversity and climate change – Scientific outcome. Available from: https://ipbes.net/sites/default/files/2021-06/2021_IPCC-IPBES_scientific_outcome_20210612.pdf
84. Ibid., 22.
85. Ibid., 23.
86. Ibid., 20.
87. Herron, A. (2016). Pollinators as a portfolio risk: Making the case for investor action. Chapter 7 in Atkins and Atkins, The Business of Bees: An Integrated Approach to Bee Decline and Corporate Responsibility, Greenleaf Publishing, Saltaire, UK, pp.131–150. Available from: https://www.taylorfrancis.com/chapters/edit/10.4324/9781351283922-16/pollinators-portfolio-risk-making-case-investor-action-abigail-herron-aviva-investors-uk
88. Ibid., 21.
89. British Standard Institute (2021). BS 8632:2021 Natural Capital Accounting for Organisations.
90. Ibid., 3
91. Ibid., 19.
92. Ibid., 3
93. Rimmel, G., Jonaell, K. (2013). Biodiversity reporting in Sweden: Corporate disclosure and preparers’ views. Accounting, Auditing & Accountability 26(5), 746–778. Available from: https://www.emerald.com/insight/content/doi/10.1108/AAAJ-02-2013-1228/full/html
94. Atkins, J., Gräbsch, C., Jones, M.J. (2014). Biodiversity reporting: Exploring its anthropocentric nature. Chapter in Jones (eds.). Accounting for Biodiversity. Routledge, UK. Available from: https://www.taylorfrancis.com/chapters/edit/10.4324/9780203097472-23/corporate-biodiversity-reporting-exploring-anthropocentric-nature-jill-atkins-carmen-gr-bsch-michael-jones
95. Align project (2021). Available from: https://ec.europa.eu/environment/biodiversity/business/align/index_en.htm
96. Transparent project (2021). Available from: https://capitalscoalition.org/project/transparent/
97. Task Force on Nature-related financial disclosures - TNFD (2021). Available from: https://tnfd.info/why-a-task-force-is-needed/
98. Ibid., 9.
99. IFRS (2021). G20 Sustainable Finance Working Group (SFWG) - Input Paper Synergies between sustainability and financial reporting. Available from: https://g20sfwg.org/wp-content/uploads/2021/08/2021-IFRS-GSG.-Synergies-between-sustainability-and-financial-reporting.pdf
100. ACCA, KPMG and Fauna & Flora International (2012). Is natural capital a material issue? Available from: https://www.accaglobal.com/hk/en/technical-activities/technical-resources-search/2012/november/is-natural-capital-a-material-issue.html
101. CDP, CDSB, GRI, IIRC and SASB (2020). Reporting on enterprise value - Illustrated with a prototype climate-related financial disclosure standard. Available from: https://impactmanagementproject.com/structured-network/global-sustainability-and-integrated-reporting-organisations-launch-prototype-climate-related-financial-disclosure-standard/
102. Capitals Coalition (2020). The Biodiversity Guidance Navigation Tool. Available from: https://capitalscoalition.org/tools/navigation-tool/
103. Whatling, D.R., Hedges, P., Brown, R., Fermor, P. (2010). Corporate responsibility reporting of biodiversity in the supply chain. International Journal of Innovation and Sustainable Development 5(1). Available from: http://www.inderscience.com/offer.php?id=34557
104. Atkins, J.F., Atkins, B.C. (eds.) (2016). The business of bees. An integrated approach to bee decline. Greenleaf Publishers, Saltaire, UK. Available from: https://www.routledge.com/The-Business-of-Bees-An-Integrated-Approach-to-Bee-Decline-and-Corporate/Atkins-Atkins/p/book/9781783534357
105. The CDSB Climate Application Guidance and Water Application guidance include other resources under REQ-01 that can be adapted and applied to biodiversity.
106. Ibid., 5.
107. Ibid., 3
108. UNEP Finance Initiative (2021). ENCORE tool – United

92 CDSB Framework 92 CDSB Framework | Application guidance for biodiversity-related disclosures
Nations Environment. Available from: https://www.unepfi.org/nature/exploring-natural-capital-opportunities-risks-and-exposure-encore-tool/
109. Ibid., 3
110. Ibid., 5.
111. Kristensen (2004). The DPSIR Framework. Available from: https://wwz.ifremer.fr/dce/content/download/69291/913220/.../DPSIR.pdf
112. European Environmental Agency (1999). Environmental indicators: Typology and overview (Technical report No 25). Available from: https://www.eea.europa.eu/publications/TEC25
113. Ibid., 24.
114. Ibid., 24.
115. Ibid., 25.
116. Gullison, R.E., J. Hardner, S. Anstee, M. Meyer. (2015). Good Practices for the Collection of Biodiversity Baseline Data - Prepared for the Multilateral Financing Institutions Biodiversity Working Group & Cross-Sector Biodiversity Initiative. Available from: http://www.csbi.org.uk/our-work/good-practices-for-the-collection-of-biodiversity-baseline-data/
117. Ibid., 39.
118. Science-Based Targets For Nature (2020). Initial Guidance for Business. Available from: https://sciencebasedtargetsnetwork.org/wp-content/uploads/2020/09/SBTN-initial-guidance-for-business.pdf
119. Ibid., 19.
120. Ibid., 96.
121. Ibid., 5.
122. Capitals Coalition (2020). Principles of Integrated Capitals Assessments. Available from: https://capitalscoalition.org/principles-of-integrated-capitals-assessments/
123. Ibid., 89.
124. International Integrated Reporting Council (2013). International Framework. Available from: https://integratedreporting.org/resource/international-ir-framework/
125. Ibid., 108.
126. IUCN. Species Threat Abatement and Restoration (STAR) metric. Available from: https://www.iucn.org/resources/conservation-tools/species-threat-abatement-and-restoration-star-metric
127. IBAT Alliance. Integrated Biodiversity Assessment Tool. Available from: https://www.ibat-alliance.org/
128. Swiss Re (2020). Biodiversity and Ecosystems Services Index: measuring the value of nature. Available from: https://www.swissre.com/publication-form.html?t=1715&id=fa67fe8d-0f2c-49fb-b3c6-a2002906ab55#PublicationForm
129. Ibid., 108.
130. BBOP (2012). Resource Paper: No Net Loss and Loss-Gain Calculations in Biodiversity Offsets. Available at: https://www.forest-trends.org/publications/resource-paper-no-net-loss-and-loss-gain-calculations-in-biodiversity-offsets/
131. The Nature Conservancy (2015). Achieving
Conservation and Development. Available from: https://www.conservationgateway.org/Documents/TNCApplyingTheMitigationHierarchy.pdf
132. Ibid., 130.
133. IUCN (2017). Global database on biodiversity offset policies launched: Preliminary analysis shows progress in biodiversity-rich mining countries. Available from: https://www.iucn.org/news/business-and-biodiversity/201711/global-database-biodiversity-offset-policies-launched-preliminary-analysis-shows-progress-biodiversity-rich-mining-countries
134. Ibid., 130.
135. Ibid., 3.
136. Conservation Hierarchy. What is the mitigation & conservation hierarchy? Available from: https://conservationhierarchy.org/what-is-conservation-hierarchy/
137. Ibid.
138. Ibid., 118.
139. OECD (2019). The post-2020 biodiversity framework: targets, indicators and measurability implications at the global and national level. Available from: https://www.cbd.int/doc/c/0590/6ddd/ab6b9375338ff831dcf5541d/sbstta-23-inf-03-en.pdf
140. Ibid., 118.
141. Mace, G. M., et al. (2014). Approaches to defining a planetary boundary for biodiversity. Global Environmental Change, 28, 289-297. Available from: https://www.sciencedirect.com/science/article/pii/S0959378014001368
142. Ibid., 33.
143. UNCEEA (2021). System of Environmental-Economic Accounting—Ecosystem Accounting: Final Draft. Available from: https://unstats.un.org/unsd/statcom/52nd-session/documents/BG-3f-SEEA-EA_Final_draft-E.pdf
144. Rosenzweig et al. (2008). Attributing physical and biological impacts to anthropogenic climate change. Nature 453.7193 (2008): 353-357. Available from: https://www.nature.com/articles/nature06937
145. Lewis, J. S., Farnsworth, M. L., Burdett, C. L., Theobald, D. M., Gray, M., & Miller, R. S. (2017). Biotic and abiotic factors predicting the global distribution and population density of an invasive large mammal. Scientific Reports, 7(1), 1-12. Available from: https://www.nature.com/articles/srep44152?error=cookies_not_supported&code=c1abf4c8-6cd6-475a-8126-004a93bd828f
146. Stohlgren, T. J., & Schnase, J. L. (2006). Risk analysis for biological hazards: what we need to know about invasive species. Risk Analysis: An International Journal, 26(1), 163-173. Available from: https://onlinelibrary.wiley.com/doi/full/10.1111/j.1539-6924.2006.00707.x?casa_token=Fr0vYC5WyVEAAAAA%3ABpnMu0DDU_Lanjm4z4QJyAiYqXAQR8ACBgbULWPTdfQng-KgtktJsyLc8EIUVl_j6HmPbMfrXNWmK
147. UNDRR (2021). Hazard. Available from: https://www.undrr.org/terminology/hazard
148. CERES (2019). Investors Water Toolkit - Understanding water risks. Available from: https://www.ceres.org/resources/toolkits/investor-water-toolkit

93 CDSB Framework 93 CDSB Framework | Application guidance for biodiversity-related disclosures
149. IPBES (2016). The methodological assessment report on scenarios and models of biodiversity and ecosystem services. Secretariat of the Intergovernmental Science-Policy Platform on Biodiversity and Ecosystem Services. Available from: https://ipbes.net/assessment-reports/scenarios
150. Ibid., 39.
151. Ibid., 118.
152. Ibid., 19.
153. Ibid., 96.
154. Ibid., 3
155. Ibid., 3
156. Ibid., 3
157. Deiner, K., Bik, H.M., Mächler, E., Seymour, M., Lacoursière-Roussel, A., Altermatt, F. et al. (2017). Environmental DNA metabarcoding: Transforming how we survey animal and plant communities. Molecular Ecology, 26(21): 5872- 5895. Available from: https://doi.org/10.1111/mec.14350
158. Stephenson, P.J. and Carbone, G. (2021). Guidelines for planning and monitoring corporate biodiversity performance. Gland, Switzerland: IUCN. Available from: https://portals.iucn.org/library/sites/library/files/documents/2021-009-En.pdf
159. DELWP Victoria State (2004). Habitat Hectare Assessment – Fact Sheet. Available from: https://www.environment.vic.gov.au/__data/assets/pdf_file/0023/48542/Habitat-Hectare-Assessment-fact-sheet_Feb-2016.pdf
160. Ibid., 3
161. Houdet, J., Ding, H., Quétier, F., Addison, P., & Deshmukh, P. (2020). Adapting double-entry bookkeeping to renewable natural capital: An application to corporate net biodiversity impact accounting and disclosure. Ecosystem Services, 45, 101104. Available from: https://www.sciencedirect.com/science/article/abs/pii/S2212041620300462?via%3Dihub
162. Brown et al. (2014). Measuring ecosystem services: Guidance on developing ecosystem service indicators. UNEP-WCMC, Cambridge, UK. Available from: https://www.unep-wcmc.org/system/dataset_file_fields/files/000/000/303/original/1850_ESI_Guidance_A4_WEB.pdf?1424707843
163. Ibid., 5.
164. Ibid., 162.
165. Ibid., 5.
166. Ibid., 5.
167. Ibid., 9.
168. Ibid., 83.
169. Pörtner et al. (2021). IPBES-IPCC co-sponsored workshop report on biodiversity and climate change. Available from: https://ipbes.net/sites/default/files/2021-06/20210609_workshop_report_embargo_3pm_CEST_10_june_0.pdf
170. Shukla et al. (2019). IPCC, 2019: Climate Change and Land: an IPCC special report on climate change, desertification, land degradation, sustainable land management, food security, and greenhouse gas
fluxes in terrestrial ecosystems. Available from: https://www.ipcc.ch/srccl/
171. IPBES. Climate change and land-use impacts on pollinators and pollination. Available from: https://ipbes.net/policy-support/case-studies/climate-change-land-use-impacts-pollinators-pollination
172. Hof et al. (2018). Bioenergy cropland expansion may offset positive effects of climate change mitigation for global vertebrate diversity. Proceedings of the National Academy of Sciences, 115(52), 13294-13299. Available from: https://www.pnas.org/content/115/52/13294
173. Here an example: Schipper et al. (2020). Projecting terrestrial biodiversity intactness with GLOBIO 4. Global change biology, 26(2), 760-771. Available from: https://onlinelibrary.wiley.com/doi/full/10.1111/gcb.14848
174. GLOBIO (2021). Global biodiversity model for policy support. Available from: https://www.globio.info/what-is-globio
175. Natural Capital Project. InVEST (Integrated Valuation of Ecosystem Services and Tradeoffs). Available from: https://naturalcapitalproject.stanford.edu/software/invest
176. Ibid., 149.
177. Johnson, J.A., Baldos, U., Hertel, T., Liu, J., Nootenboom, C., Polasky, S., and Roxburgh, T. (2020). Global Futures: modelling the global economic impacts of environmental change to support policy-making. Technical Report, January 2020. Available from: https://www.wwf.org.uk/globalfutures
178. Ibid., 1.
179. Ibid., 99.
180. Ibid., 101.

With the contribution of the LIFE Programme of the European Union.
This publication was funded in part by the Gordon and Betty Moore Foundation.
ContactCDSB Secretariat [email protected]@CDSBGlobal
Project hosted by CDP Europe.
Funding for this research was provided by UK PACT Green Recovery Challenge Fund.