CDP 2015 Climate Change 2015 Information Request
92
CDP CDP 2015 Climate Change 2015 Information Request Westpac Banking Corporation Module: Introduction Page: Introduction CC0.1 Introduction Please give a general description and introduction to your organization. Westpac Group (“Westpac”) is a financial services company with operations in Australia, New Zealand (NZ), the United Kingdom (UK) & the near Pacific region & maintains offices in other key financial centres around the world. Westpac is ranked in the top 5 listed companies by market capitalisation on the Australian Securities Exchange. As at 30 September 2014, Westpac had a market capitalisation of $100 billion, around 595,000 shareholders, around 8 million customers & approximately 36,000 employees (fulltime equivalent basis). Westpac has five key customer facing divisions:Westpac Retail & Business Banking (WRBB), St George Banking Group (SGB), BT Financial Group Australia (BTFG) , Westpac Institutional Bank (WIB), & New Zealand Banking (WNZL). WRBB is responsible for banking and financial services to consumer, small-to-medium enterprise (SME), commercial & agribusiness customers (typically with turnover of up to $100 million) in Australia under the Westpac brand. St.George Banking Group is responsible for banking and financial services to consumer, SME & corporate customers (businesses with facilities up to $150 million) in Australia under the St.George, Bank of Melbourne, BankSA & RAMS brands. BT Financial Group (BTFG) is Westpac’s wealth management business, providing investment, superannuation, financial advice, funds administration, private banking and insurance. WIB delivers a broad range of financial services to corporate, institutional & government customers with connections to Australia, New Zealand & Asia as well as banking services in Fiji & PNG . WNZL offers banking, wealth, & insurance products to consumer, business & institutional customers in New Zealand. Westpac's vision is 'to be one of the world's great companies helping our customers, communities & people to prosper & grow'. Achieving this requires us to manage our direct & indirect environmental impacts, including dealing with the critical issue of climate change. Climate change will have significant economic, social & environmental impacts in the regions in which we operate. This means that our investment, lending & operational decisions must take these impacts into account, but we also expect to drive shareholder value through our response. We were amongst the first Australian companies to take action on climate change: publicly reporting our emissions since 1996; responding to the CDP each year since it began; & we have a strong history of calling for early action on climate change from government & the broader business community. In 2014 Westpac Group released our second Climate Change & Environmental Position Statement & 2017 Action Plan (Climate Change & Envio PS). This follows our first Climate Change Position Statement published in 2008, & reflects the substantive program of work we have implemented as summarised in our Progress Report, whilst reiterating our commitment to taking a precautionary approach to managing climate change & to embedding a whole of value chain approach to addressing climate change impacts across our operations. This updated CC&E position statement confirms Westpac Group’s perspective on the science, economics & social impacts of climate change, the impacts for our business, & the role of the finance sector. It also includes our 2017 Action Plan, providing our approach to managing environmental risk, community engagement, reporting on our sustainability performance & creating innovative customer solutions from 2014-2017. It was developed following extensive internal & external stakeholder consultation & approved by the Group Executive & Westpac Board. These principles are re-iterated in various commercial, marketing & capabilities documents.
Transcript of CDP 2015 Climate Change 2015 Information Request

CDP CDP 2015 Climate Change 2015 Information Request
Westpac Banking Corporation
Module: Introduction
Page: Introduction
CC0.1
Introduction
Please give a general description and introduction to your organization. Westpac Group (“Westpac”) is a financial services company with operations in Australia, New Zealand (NZ), the United Kingdom (UK) & the near Pacific region & maintains offices in other key financial centres around the world. Westpac is ranked in the top 5 listed companies by market capitalisation on the Australian Securities Exchange. As at 30 September 2014, Westpac had a market capitalisation of $100 billion, around 595,000 shareholders, around 8 million customers & approximately 36,000 employees (fulltime equivalent basis). Westpac has five key customer facing divisions:Westpac Retail & Business Banking (WRBB), St George Banking Group (SGB), BT Financial Group Australia (BTFG) , Westpac Institutional Bank (WIB), & New Zealand Banking (WNZL). WRBB is responsible for banking and financial services to consumer, small-to-medium enterprise (SME), commercial & agribusiness customers (typically with turnover of up to $100 million) in Australia under the Westpac brand. St.George Banking Group is responsible for banking and financial services to consumer, SME & corporate customers (businesses with facilities up to $150 million) in Australia under the St.George, Bank of Melbourne, BankSA & RAMS brands. BT Financial Group (BTFG) is Westpac’s wealth management business, providing investment, superannuation, financial advice, funds administration, private banking and insurance. WIB delivers a broad range of financial services to corporate, institutional & government customers with connections to Australia, New Zealand & Asia as well as banking services in Fiji & PNG . WNZL offers banking, wealth, & insurance products to consumer, business & institutional customers in New Zealand. Westpac's vision is 'to be one of the world's great companies helping our customers, communities & people to prosper & grow'. Achieving this requires us to manage our direct & indirect environmental impacts, including dealing with the critical issue of climate change. Climate change will have significant economic, social & environmental impacts in the regions in which we operate. This means that our investment, lending & operational decisions must take these impacts into account, but we also expect to drive shareholder value through our response. We were amongst the first Australian companies to take action on climate change: publicly reporting our emissions since 1996; responding to the CDP each year since it began; & we have a strong history of calling for early action on climate change from government & the broader business community. In 2014 Westpac Group released our second Climate Change & Environmental Position Statement & 2017 Action Plan (Climate Change & Envio PS). This follows our first Climate Change Position Statement published in 2008, & reflects the substantive program of work we have implemented as summarised in our Progress Report, whilst reiterating our commitment to taking a precautionary approach to managing climate change & to embedding a whole of value chain approach to addressing climate change impacts across our operations. This updated CC&E position statement confirms Westpac Group’s perspective on the science, economics & social impacts of climate change, the impacts for our business, & the role of the finance sector. It also includes our 2017 Action Plan, providing our approach to managing environmental risk, community engagement, reporting on our sustainability performance & creating innovative customer solutions from 2014-2017. It was developed following extensive internal & external stakeholder consultation & approved by the Group Executive & Westpac Board. These principles are re-iterated in various commercial, marketing & capabilities documents.

Following an extensive Board-led review over 2011-12, the Group has agreed an explicit sustainability focus on longer term issues & mega-trends as core strategy. Our aim is to have a positive societal impact on the trajectory of these issues whilst pursuing the future growth opportunities they represent. Climate change & other environmental challenges form one of three priority issues for action in the Group’s 2013-17 sustainability strategy, launched in February 2013. In addition to the new longer-term focus & objectives, the governance of our direct footprint has been enhanced with the formation of a Group-wide Environment Management Committee (EMC) in November 2012 which is overseeing performance improvements across a broadened environmental dashboard & the transition to carbon neutrality. Overall we continue to drive awareness & action in the community & amongst business & policymakers to help in the transition to a low carbon economy. Ultimately all parts of the economy will need to collaborate to effectively address climate change. For further information on the Group see http://www.westpac.com.au/about-westpac/.
CC0.2
Reporting Year
Please state the start and end date of the year for which you are reporting data. The current reporting year is the latest/most recent 12-month period for which data is reported. Enter the dates of this year first. We request data for more than one reporting period for some emission accounting questions. Please provide data for the three years prior to the current reporting year if you have not provided this information before, or if this is the first time you have answered a CDP information request. (This does not apply if you have been offered and selected the option of answering the shorter questionnaire). If you are going to provide additional years of data, please give the dates of those reporting periods here. Work backwards from the most recent reporting year. Please enter dates in following format: day(DD)/month(MM)/year(YYYY) (i.e. 31/01/2001).
Enter Periods that will be disclosed
Mon 01 Jul 2013 - Mon 30 Jun 2014
CC0.3
Country list configuration
Please select the countries for which you will be supplying data. If you are responding to the Electric Utilities module, this selection will be carried forward to assist you in completing your response.
Select country
CC0.4
Currency selection
Please select the currency in which you would like to submit your response. All financial information contained in the response should be in this currency. AUD ($)
CC0.6
Modules
As part of the request for information on behalf of investors, electric utilities, companies with electric utility activities or assets, companies in the automobile or auto component manufacture sub-industries, companies in the oil and gas sub-industries, companies in the information technology and telecommunications sectors and companies in the food, beverage and tobacco industry group should complete supplementary questions in addition to the main questionnaire. If you are in these sector groupings (according to the Global Industry Classification Standard (GICS)), the corresponding sector modules will not appear below but will automatically appear in the navigation bar when you save this page. If you want to query your classification, please email [email protected]. If you have not been presented with a sector module that you consider would be appropriate for your company to answer, please select the module below. If you wish to view the questions first, please see https://www.cdp.net/en-US/Programmes/Pages/More-questionnaires.aspx.
Further Information
Module: Management
Page: CC1. Governance
CC1.1
Where is the highest level of direct responsibility for climate change within your organization?

Board or individual/sub-set of the Board or other committee appointed by the Board
CC1.1a
Please identify the position of the individual or name of the committee with this responsibility
The highest level of direct responsibility for climate change at Westpac Group is the Board. The Westpac Banking Corporation's Board Charter states that the key responsibilities of the Board includes considering the social, ethical and environmental impacts of the Westpac Group's activities, setting standards and monitoring compliance with Westpac's sustainability policies and practices. Westpac Group's Environmental Policy, updated in 2014, states that the Policy includes our management of issues associated with climate change. Furthermore, Westpac Group's Climate Change & Environment Position Statement covers the management of our ecological footprint, the measuring and reporting of our performance and the incorporation of environmental considerations into our risk management framework. The Position Statement has been approved by the Group Executive and Westpac Board.
CC1.2
Do you provide incentives for the management of climate change issues, including the attainment of targets?
Yes
CC1.2a
Please provide further details on the incentives provided for the management of climate change issues
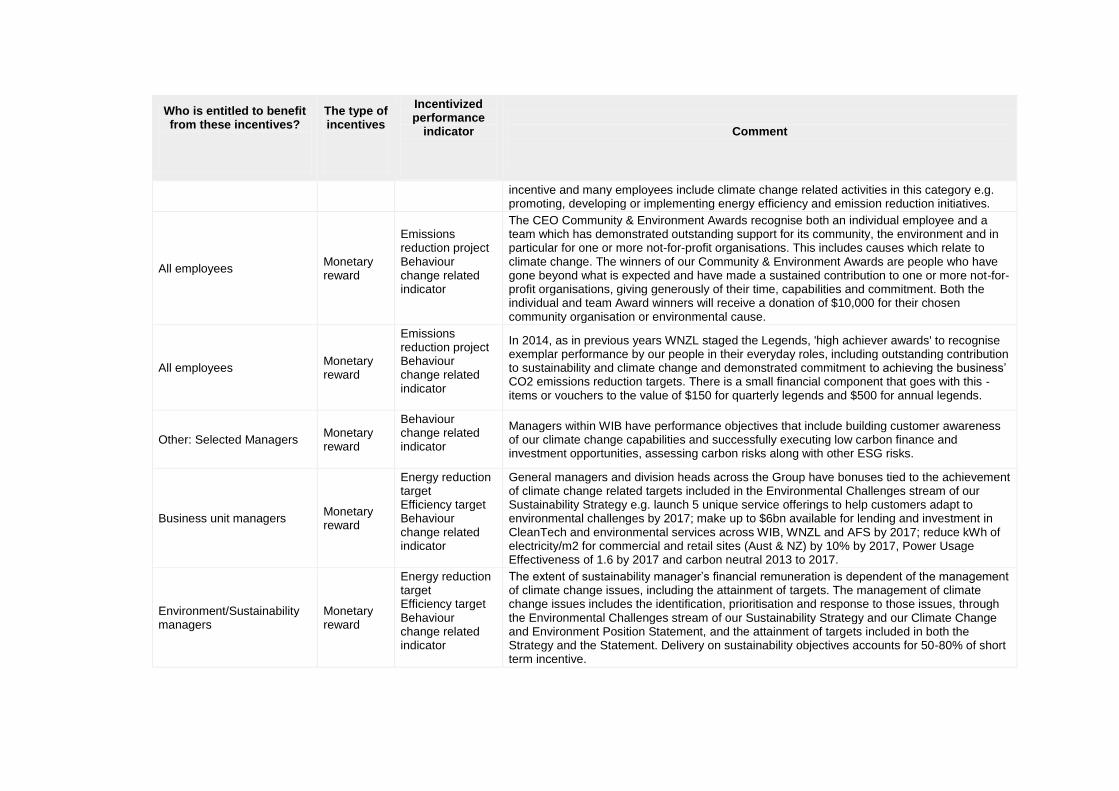
Who is entitled to benefit from these incentives?
The type of incentives
Incentivized performance
indicator
Comment
Board/Executive board Monetary reward
Energy reduction project Efficiency target Behaviour change related indicator
The highest level of direct responsibility for climate change at The Westpac Group is the Board. The Westpac Banking Corporation's Board states that the key responsibilities of the Board includes considering the social, ethical and environmental impact of the Westpac Group's activities, setting standards and monitoring compliance with Westpac's sustainability policies and practices. The Westpac Group's Environmental Policy, updated in 2014, states that the Policy includes our management of issues associated with climate change. Furthermore, Westpac Climate Change and Environment (CC&E) Position Statement

Who is entitled to benefit from these incentives?
The type of incentives
Incentivized performance
indicator
Comment
refreshed in 2014 sets out our approach to managing environmental and climate change risks, building community engagement and creating innovative customer solutions to address climate issues and includes our 2017 Climate Change and Environment Action Plan. This plan was approved and endorsed by the Westpac Group Board and Executive Team. In 2014, the Annual Base Fee for the Chairman was $780,000, Deputy Chairman was $283,000 and Non-executive Directors were $220,000. Sustainability, including Westpac’s response to key issues such as climate change and the achievement of our public targets and commitments forms part of 10% of the overall short term incentive in the CEO’s scorecard, outlined in our Annual Report. This is cascaded to the Group Executives. In 2014 the CEO’s STI Cash Payment was $2,743,200, Fixed Remuneration was $3,028, 096, Total Cash Payments were $5,771,296 and Prior Year Equity Awards Vested during 2014 was $7,059,026.
Corporate executive team Monetary reward
Energy reduction project Efficiency target Behaviour change related indicator
Responsibility for Sustainability, including Westpac’s response to key issues such as climate change and the achievement of our public target and commitments are cascaded from the CEO to relevant Group Executives. This includes: Christine Parker, Group Executive Human Resources & Corporate Affairs is responsible for Corporate Affairs & Sustainability, which coordinates the Group’s response to climate change. In 2014, Christine Parker’s fixed remuneration was $779,747, STI Cash Payment was $702,000, Total Cash Payments were $1,481,747 and Prior Year Equity Awards Vested during 2014 was $611,353. John Arthur, Chief Operating Officer is responsibility for banking operations, property, procurement, compliance, legal and secretariat services. This includes includes a number of energy efficiency targets within the Group Sustainability Strategy, as well as the banks Carbon Neutral Program. In 2014 John Arthur’s fixed Remuneration was $1,227,422, STI Cash Payment was $943,800, Total Cash Payments were $2,171,222 and Prior Year Equity Awards Vested during 2014 was $1,748,054.
Management group Monetary reward
Energy reduction target Efficiency target Behaviour change related indicator
Westpac Group’s Sustainability Council, formed in 2008, brings together senior leaders from across Westpac Group with explicit responsibility for managing our sustainability agenda and performance, including climate change. Members of the Sustainability Council with responsibility for Sustainability Strategy objectives are rewarded via a portion of short term incentives for delivery against these objectives, including those relating to climate change in the Environmental Challenges stream of our Sustainability Strategy.
All employees Monetary reward
Energy reduction target Efficiency target
Strength is a key component of Westpac’s strategy and is included as a category in the balanced scorecard of all employees. Short term incentive includes an objective of strength or remaining strong which includes enhancing our governance frameworks for long-term sustainability and responding to society’s expectations and environmental concerns, including climate change. Performance against the objectives determines an employee’s short term
Who is entitled to benefit from these incentives?
The type of incentives
Incentivized performance
indicator
Comment
incentive and many employees include climate change related activities in this category e.g. promoting, developing or implementing energy efficiency and emission reduction initiatives.
All employees Monetary reward
Emissions reduction project Behaviour change related indicator
The CEO Community & Environment Awards recognise both an individual employee and a team which has demonstrated outstanding support for its community, the environment and in particular for one or more not-for-profit organisations. This includes causes which relate to climate change. The winners of our Community & Environment Awards are people who have gone beyond what is expected and have made a sustained contribution to one or more not-for-profit organisations, giving generously of their time, capabilities and commitment. Both the individual and team Award winners will receive a donation of $10,000 for their chosen community organisation or environmental cause.
All employees Monetary reward
Emissions reduction project Behaviour change related indicator
In 2014, as in previous years WNZL staged the Legends, 'high achiever awards' to recognise exemplar performance by our people in their everyday roles, including outstanding contribution to sustainability and climate change and demonstrated commitment to achieving the business’ CO2 emissions reduction targets. There is a small financial component that goes with this - items or vouchers to the value of $150 for quarterly legends and $500 for annual legends.
Other: Selected Managers Monetary reward
Behaviour change related indicator
Managers within WIB have performance objectives that include building customer awareness of our climate change capabilities and successfully executing low carbon finance and investment opportunities, assessing carbon risks along with other ESG risks.
Business unit managers Monetary reward
Energy reduction target Efficiency target Behaviour change related indicator
General managers and division heads across the Group have bonuses tied to the achievement of climate change related targets included in the Environmental Challenges stream of our Sustainability Strategy e.g. launch 5 unique service offerings to help customers adapt to environmental challenges by 2017; make up to $6bn available for lending and investment in CleanTech and environmental services across WIB, WNZL and AFS by 2017; reduce kWh of electricity/m2 for commercial and retail sites (Aust & NZ) by 10% by 2017, Power Usage Effectiveness of 1.6 by 2017 and carbon neutral 2013 to 2017.
Environment/Sustainability managers
Monetary reward
Energy reduction target Efficiency target Behaviour change related indicator
The extent of sustainability manager’s financial remuneration is dependent of the management of climate change issues, including the attainment of targets. The management of climate change issues includes the identification, prioritisation and response to those issues, through the Environmental Challenges stream of our Sustainability Strategy and our Climate Change and Environment Position Statement, and the attainment of targets included in both the Strategy and the Statement. Delivery on sustainability objectives accounts for 50-80% of short term incentive.

Further Information
Page: CC2. Strategy
CC2.1
Please select the option that best describes your risk management procedures with regard to climate change risks and opportunities
Integrated into multi-disciplinary company wide risk management processes
CC2.1a
Please provide further details on your risk management procedures with regard to climate change risks and opportunities
Frequency of monitoring
To whom are results
reported?
Geographical areas
considered
How far into
the future are risks
considered?
Comment
Six-monthly or more frequently
Board or individual/sub-set of the Board or committee appointed by the Board
Australia New Zealand Pacific Asia (Singapore, China, Hong Kong, India, Indonesia)
> 6 years
Frameworks and policies for climate change risks and opportunities are approved by the Board Risk and Compliance Committee. Risks, opportunities and performance against the sustainability strategy are monitored on an ongoing business in our lending and quarterly by our Group Executive Risk Committee and Sustainability Council.
CC2.1b
Please describe how your risk and opportunity identification processes are applied at both company and asset level
Our Group Sustainability Risk Management Framework, approved by the Board Risk & Compliance Committee (BRCC) guides the identification, management & monitoring of risks, including climate change risks (physical, market & regulatory) at all levels of the organisation (company & asset) & across all parts of the business. At an asset level the requirements of the Framework are translated into local frameworks & policies eg our WNZL ESG Risk Management Framework, & our WIB & AFS Credit Manuals

Climate change risks & opportunities are identified: at a company level by our Sustainability & Community team & an emissions & environment specialist in WIB; at an asset level by Divisional Line & Risk Management For credit, climate risks are identified at a country, sector, customer & transaction level at all stages of the decision making process as guided by our ESG Credit Risk Policy & our Credit Manuals For our supply chain, climate change risks & opportunities are identified through our Sustainable Supply Chain Management Process, which involves a mandatory self-assessment process for suppliers For our properties, climate change risks & opportunities are identified through environmental assessments & physical inspections, & through our Business Continuity Planning framework which takes an ‘all hazards’ approach to planning for natural disasters, including those linked to climate For investment management, climate change risks & opportunities are identified & considered in investment decision-making by our fund managers. Climate change regulatory risks are identified by our Corporate Affairs & Sustainability & Enterprise Compliance & Regulatory Affairs teams, logged in a Regulatory Change Register & communicated in a Regulatory Change Alert. Prior to the launching our Climate Change & Environment Position Statement we consulted with stakeholders to identify carbon risks & opportunities at a company & business unit level to ensure these were captured in the statement.
CC2.1c
How do you prioritize the risks and opportunities identified?
Overall: At Group level, WBC identifies and prioritises material risks, including climate change, on an ongoing basis based on importance to stakeholders (through engagement) and importance to the business to inform our evolving strategic approach. The most material risks including climate risks are captured by our internal Risk Radar maintained on an ongoing basis by our Corporate Affairs & Sustainability team. These risks are included within quarterly reporting to Group Executive Risk Committee, prioritised based on business exposure and stakeholder sensitivity, and then reported up to the Board Risk and Compliance Committee. Credit risks ESG risks in credit inc. climate risks are considered when setting sector strategies.Transactions where ESG risks inc. climate risks are identified, divisional managers work with Group Risk to prioritise risks in the context of the sector & jointly determine if they are sufficiently material to require escalation. Material ESG risks inc. climate risks are escalated to divisional Chief Risk Officers (CRO), and other senior leaders at Group level if required. Operational risks As part of our Sustainability Supply Chain Mgmt process, WBC asks suppliers about GHG emissions reporting, GHG reduction targets & enviro management plans (which include GHG management). A non-compliant supplier is prioritised for a higher level of climate & enviro. risk & is required to introduce an action plan to meet the minimum requirements. Climate change risks & opportunities are prioritised for properties based on whole of business considerations inc. lease terms & OH&S Regulatory risks Regulatory risks inc. those related to climate change reg., are prioritised as high/med/low based on factors such as scope of impact, likely funding & implementation path. High priority risks are generally actioned at an Group-wide level. Medium & low priority risks are assigned to business units for action.
CC2.1d

Please explain why you do not have a process in place for assessing and managing risks and opportunities from climate change, and whether you plan to introduce such a process in future
Main reason for not having a process
Do you plan to introduce a process?
Comment
CC2.2
Is climate change integrated into your business strategy?
Yes
CC2.2a
Please describe the process of how climate change is integrated into your business strategy and any outcomes of this process
i)Explicit inclusion of sustainability leadership, including climate change, is necessary to deliver WBC’s vision “to be one of the world’s great companies, helping our customers, communities & people to prosper & grow”. This vision guides strategy development across the business. Corporate strategy development is led by Group Strategy with inputs from the Sustainability Council, ongoing stakeholder engagement (e.g. with customers & NGOs), the annual AA1000 sustainability materiality analysis & business unit inputs e.g. WIB sector reviews (incorporating climate change risks & opportunities). The materiality analysis involves review of stakeholder feedback & a ‘Sustainability Azone’ workshop with expert external input and involvement of key stakeholders. At a corporate level, key aspects of our climate change response are included within our Board-approved Climate Change & Environment Position Statement: managing carbon & environmental risk; supporting customers; partnering with suppliers; reducing our environmental footprint; & engaging employees. These themes are reflected in corporate & business unit strategy. In February 2013, WBC launched its 2013-2017 Sustainability Strategy, based on extensive research & stakeholder consultation, and intrinsically linked to WBC's 2017 enterprise-wide strategy. It identifies ‘Economic Solutions for Environmental Challenges’ as a key theme with objectives relating to environmental products & services, lending & investment to cleantech / environmental services, & management of our direct environmental footprint (including GHG). Progress against our carbon related strategic objectives is monitored & reported to our Environmental Management Committee (quarterly), Sustainability Council (quarterly), Executive Team & Board (both six monthly). Feedback from these meetings provides ongoing input to our strategic approach. This strategy is integrated into relevant business unit strategies. Within WIB the Clean Tech Committee meets quarterly to oversee investment eg. in renewable energy, providing ongoing input to the WIB strategic approach. The NZ Sustainable Business Strategy (SBS) informs Corporate Strategy by providing insights on ESG risks, including climate change. This is developed annually with a time horizon of two to three years based on external trends & strategic priorities of business units. Relevant Bus Units are responsible for the SBS eg.Operational Sustainability governance group responsible for driving business decisions to reduce CO2 emissions.

ii)Key areas of climate change influencing strategy include: Emerging markets in climate/green bonds, cleantech and carbon trading influencing our lending, investments and trading activity; Risks from tropical deforestation and impacts on high carbon stock forest, influencing the publication of our Financing Agribusiness Position Statement. Physical climate risks driving our active participation in the Australian Business Roundtable for Disaster Resilience; Carbon risks in general driving the need to understand exposure within our lending & investments and engage with client sectors on carbon risk management. iii)Key components of short-term strategy include: Climate change related performance objectives & targets, including: energy efficiency target, power usage effectiveness target, commitment to maintain carbon neutrality through to 2017, and commitment to make available $6bn for cleantech lending and investment by 2017 (exceeded in 2014). Changes to risk appetite, risk management & underwriting practices to account for carbon risk; Recognise employee efforts in delivering on climate change objectives; Strengthening processes to deliver against reporting legislation & objectives; Integrating GHG management into supplier screening; Development of new products including Solar Shed, Energy Efficiency Lease & green bonds. Active participation in the Australian Business Roundtable on Disaster Resilience. Increased disclosure of financed emissions. Continuing to reduce our direct carbon footprint through our Property Sustainability Strategy, including relocating our Melbourne Head Office to 6 Star Green Star rated building; NZ target to maintain min 20% reduction on 2008 baseline CO2e emissions & upgrade of AC to phase out R22. iv)Key components of long-term strategy include: Stronger integration of climate change adaptation risk in credit & investment decisions; Partner with our customers to develop innovative solutions which address sustainability challenges including climate change, for key industry sectors More strategic response to issues interconnected with climate change (e.g. water) and specific commitments including carbon neutrality, carbon pricing and zero net deforestation. Further reductions in our direct carbon footprint through our planned move to newly constructed sustainable premises in Sydney, Melbourne & Brisbane. Participate in working groups to develop a carbon risk disclosure standard for the sector. Explore themes to test our thinking and create opportunities: building resilience; sustainable cities; investing for a two degree economy. v)Strategic advantage: Revenue growth through lending & product development in the CleanTech & environmental services sector(59% of our energy sector lending goes to hydro & renewables); Credit & relationship managers developing expertise in carbon; Strong market recognition due to effective public advocacy; Highly regarded carbon trading expertise Best Trading Company in Australasia 4 years in a row since 2010 by customers, peers & competitors Environmental Finance Awards, 2010 - 2013, 2014 (uncontested) Reduced operational costs vi)Key substantial decisions & influencing factors during the reporting year: Influenced by our commitment to ongoing reporting enhancements and engagement with investors, we increased our disclosure in relation to lending to mining, cleantech, and the emissions intensity of our infrastructure & utilities portfolio (financed emissions) to demonstrate our indirect climate change exposure. Influenced by increase in climate risk associated with deforestation, we signed the BEI’s Soft Commodities Compact & released our Agribusiness Position statement, outlining how we will work with our customer to address issues regarding clearing of high conservation value & high carbon stock forests. Influenced by the importance of reducing our direct carbon footprint in line with targets, we continued to focus on reducing electricity consumption, paper use & data
centre efficiency. Influenced by our desire to go further than reductions feasible within our operations, we continue to ensure that we are carbon neutral following the National Carbon Offset Standard. Influenced by the importance & growing cost effectiveness of clean technologies, we continue to develop new business in the areas of lending to cleantech/renewables, lending $8bn to this sector in the reporting year.
CC2.2b
Please explain why climate change is not integrated into your business strategy
CC2.2c
Does your company use an internal price of carbon?
Yes
CC2.2d
Please provide details and examples of how your company uses an internal price of carbon
Carbon pricing is integrated into business case considerations for energy efficiency works across the operational portfolio, for example the cost of off-setting has been taken into consideration for work the business unit is doing on its fleet management strategy and HVAC upgrade roll out.
CC2.3
Do you engage in activities that could either directly or indirectly influence public policy on climate change through any of the following? (tick all that apply)
Direct engagement with policy makers Trade associations Funding research organizations

Other
CC2.3a
On what issues have you been engaging directly with policy makers?
Focus of legislation
Corporate Position
Details of engagement
Proposed legislative solution
Mandatory carbon reporting
Support with minor exceptions
Engaged on the design and implementation of the Emissions Reduction Fund in Australia. Westpac is a signatory to a number of commitments under the CDP Road to Paris initiative, including providing climate change information in mainstream filings.
WBC supported the use of the Australian National Greenhouse & Energy Reporting (NGERs) as the basis for the proposed Emissions Reduction Fund in Australia and supported maintaining current reporting thresholds. Westpac has publicly reported on environmental performance and climate change since 2002.
Cap and trade
Support
Engaged on the market implications of repealing the Australian Clean Energy Act, including the carbon market component of the scheme. In New Zealand, Westpac engaged with Government and regulators on ongoing adjustments to the NZ ETS. Westpac is a signatory to a number of commitments under the CDP Road to Paris initiative, including putting a price on carbon. Westpac is a signatory to a number of commitments under the CDP Road to Paris initiative, including putting a price on carbon.
WBC's core position is set out in our recently refreshed Climate Change & Envio PS. This is approved by the Board and Executive Team and informs all government engagement. Westpac supports a market-based approach to regulating emissions. Policy design and implementation must support: - Investment certainty; - Market confidence; - Environmental outcomes; - Affordable and efficient greenhouse gas abatement across the economy; & - A clear understanding of ongoing liabilities.
Clean energy generation
Support Engaged with the Expert Review Panel on the Renewable Energy Target (RET) review undertaken in Australia.
WBC participated in dialogue and engagement with the Expert Review Panel regarding the investment and market implications of a number of matters under consideration as part of the review and potential wind back of the Renewable Energy Target. Negotiations on the policy outcome of this review are ongoing.
Adaptation resiliency
Support
As a member of the Australian Business Roundtable for Disaster Resilience and Natural Disasters, together with IAG, Optus, Munich Re, Investa and the Red Cross. The Roundtable commissioned a white paper examining the cost benefits of investing in resilience activities pre-disaster in order to reduce the economic and social impacts.
WBC has engaged with Government on recommendations from the White Paper, and continues to engage with Government in order to examine issues and impacts for policy makers and business.
Climate finance
Support with minor exceptions
Engaging in Government consultation process on the design of the Australian Emission Reduction Fund and ‘Safeguard Mechanism’.
WBC has engaged with Government and policy-makers as part of the consultation process on the design of the Emission Reduction Fund and ‘Safeguard Mechanism’. This process is ongoing. Westpac argued that the policy framework should

Focus of legislation
Corporate Position
Details of engagement
Proposed legislative solution
incorporate longer contract periods and greater linking to international markets.
Other: Support with minor exceptions
National Carbon Offset Standard (NCOS): Engaging with Government on the review of the NCOS, a government framework for achieving certified ‘Carbon Neutral’ status. Westpac Group has recently become a Champion for the Climate Neutral Now Initiative, an collaboration with the Caring for Climate initiative jointly supported by the UNFCCC, UNEP and UN Global Compact.
WBC has engaged with Government and policy-makers as part of the consultation process on measures to review and streamline the administrative processes for achieving government certified ‘Carbon Neutral’ status, including accessing a broader range of international units for offsetting purposes. As part of the Champion for the Climate Neutral Now Initiative Westpac has commitment to estimating and reducing our Carbon footprint and encouraging other organisations to also consider undertaking carbon neutrality.
Other: Neutral
National Target: Westpac will be engaging in Government consultation processes, where appropriate, aimed at finalising post-2020 national emission reduction targets ahead of the Paris Conference of the UNFCCC in December 2015. Westpac is a signatory to a number of commitments under the CDP Road to Paris initiative, including commitment to GHG emissions reduction targets that limit global warming to below 2°C
Over 2015, the Australian and New Zealand Governments will be finalising national commitments on post-2020 emissions reduction targets to be submitted as part of the UNFCCC process to agree a new international climate change agreement. Westpac will be monitoring and, where appropriate, engaging in consultation processes to determine an appropriate level of national ambition.
CC2.3b
Are you on the Board of any trade associations or provide funding beyond membership?
Yes
CC2.3c
Please enter the details of those trade associations that are likely to take a position on climate change legislation

Trade association
Is your position on
climate change
consistent with theirs?
Please explain the trade association's position
How have you, or are you attempting to, influence the position?
Business Council of Australia
Consistent
The BCA has a high level position on energy and climate change issues, which is consistent with WBC’s view. The BCA has recently announced participation in the Australian Climate Roundtable with principles framed around Australia’s role in limiting global warming to less than 2 degrees and the risk of delayed action. Other members include The Climate Institute (TCI), WWF, the Investor Group on Climate Change and the Australian Council of Social Services. WBC’s perspective is frequently more detailed and more focused on investment and market implications.
WBC is a longstanding member and participant on the Board of the BCA. WBC also maintains an ongoing dialogue with policy directors within the BCA on key areas of carbon policy development.
Australian Bankers Association
Consistent
The ABA supports the application of carbon pricing signals and the efficient and effective operation of carbon policies via financial instruments, as well as environmental policies which deliver investment certainty more broadly.
WBC is a the chair of the ABA Board, numerous policy and working group committees on aspects of carbon market design and renewable energy policy frameworks, and engages on an ongoing basis around key policy issues and impacts.
Australian Financial Markets Associations
Consistent AFMA engages with regulatory and government authorities on a number of aspects of the technical design, implementation and operation of the Australian carbon market and related impacts.
WBC directs policy engagement on carbon related matters via our position as Chair of the Carbon Markets Committee and a member of the AFMA Electricity Committee. As an active market participant, we actively engage in formulating core positions based on practical market experience.
New Zealand Financial Markets Association
Consistent NZFMA engages with regulatory and government authorities on a number of aspects of the technical design, implementation and operation of the NZ carbon market and related impacts.
WBC is Deputy Chair of the NZFMA Carbon Markets Committee and actively engaged in formulating core positions based on practical market experience.
Green Building Council of Australia
Consistent
GBCA engages with regulatory and government authorities on a number of aspects of the technical design, implementation and operation of the Australian carbon market, with a specific focus on a low carbon, energy efficient built environment.
WBC is Deputy Chair of the GBCA. We actively engage in formulating core positions and Green Star tool development based on practical market experience.
Investor Group on Climate Change
Consistent
IGCC aims to encourage government policies and investment practices that address the risks and opportunities of climate change, for the ultimate benefit of superannuates and unit holders. The IGCC has recently announced participation in the Australian Climate Roundtable with principles framed around Australia’s role in limiting global warming to less than 2 degrees and the risk of delayed action. Other members include The Climate Institute (TCI), WWF, Business
Through BT Financial Group’s membership in the IGCC we support the development of investment practices that seek to address the risks and opportunities of climate change.

Trade association
Is your position on
climate change
consistent with theirs?
Please explain the trade association's position
How have you, or are you attempting to, influence the position?
Council of Australia and the Australian Council of Social Services.
The Carbon Market Institute (CMI)
Consistent
CMI is an Australian membership-based not-for-profit organisation which engages with Government and business to promote policy outcomes to assist Australian business meet the challenges and opportunities associated with carbon markets and build capacity a low-carbon world.
WBC is on the Board of CMI, supports the flagship, annual Emissions Reduction Summit and engages in policy working groups.
CC2.3d
Do you publicly disclose a list of all the research organizations that you fund?
Yes
CC2.3e
Do you fund any research organizations to produce or disseminate public work on climate change?
Yes
CC2.3f
Please describe the work and how it aligns with your own strategy on climate change
WBC has a number of relationships with organisations undertaking climate change & related research including: Banking Environment Initiative (BEI) - this multi-bank initiative seeks to lead the banking industry in collectively directing capital towards environmental & socially sustainable eco-development. BEI was first established as a CEO-led working Group of the Cambridge Institute for Sustainability Leadership. BEI has engaged with corporate clients to research & address the systemic blockages to clean energy investment, including existing valuation methodologies at the project & corporate level. This is consistent with WBC’s climate strategy focus on risk, including risk settings.

The Climate Institute (TCI) – we have been a lead partner of TCI's Climate Partner’s Network since 2010 which aims to promote business leadership in driving action on climate change and to better inform policy debate. This aligns both to a number of objectives within our climate change strategy, including advocacy and customer engagementbut also to our risk management approach, by enhancing our own understanding of direct and indirect risks associated with climate change. We continue to work with The Climate Institute to support a greater understanding of policy design and investment impacts. TCI has recently announced participation in the Australian Climate Roundtable with principles framed around Australia’s role in limiting global warming to less than 2 degrees and the risk of delayed action. Other members include Investor Group on Climate Change, WWF, Business Council of Australia and the Australian Council of Social Services. Australian Business Roundtable for Disaster Resilience and Safer Communities – this group was founded by the CEOs of six organisations Westpac, IAG, Optus, Munich Re, Investa and Red Cross quantify the economic impacts of natural disaster and call for greater coordination and funding of resilience activities pre-disaster. By quantifying the impact of natural disasters now and into the future this work directly aligns to our position statement principles that managing environmental risk is also about managing financial risk and that economic growth and environmental protection are complementary goals. Encouraging a greater focus on disaster resilience is also consistent with our vision to help customers, employees and communities to prosper and grow. Earlier this year the work of the Roundtable was recognised with a certificate of distinction at the prestigious UN Sasakawa awards for disaster reduction, the first time in the 29 year history of the awards that the activities of private sector organisation has been recognised.http://australianbusinessroundtable.com.au/ This work also aligns with WBC’s climate strategy and the first theme of our Climate Change and Enviro PS – ‘Building Resilience ‘ Westpac New Zealand is working with The Greenhouse and The New Zealand Clean Tech & Environment Network (NZCEN) to better understand how best to develop financial solutions to help grow the CleanTech sector. Westpac and The Greenhouse have undertaken a survey of up to 500 NZCEN members to provide a basis for establishing a New Zealand CleanTech certification programme. This will give potential clients, investors, and equity partners of these businesses a robust standard for benchmarking CleanTech opportunities. This also is aligns WBC’s climate strategy and the first theme of our Climate Change and Enviro PS providing support for clients working towards Cleatech soltuions to support working towards a 2 degree economy. United Nations Environmental Program Finance Initiative (UNEP FI) – WBC is a founding signatory to UNEP FI & has actively engaged in its work on a range of environmental issues. We are currently playing an active part in work currently underway as part of the GHG Protocol/UNEPFI Project Stream on developing guidance for reporting Scope 3 emissions for the finance sector. Westpac is also co-convenor of a project group of Australasian financial institutions working to develop localised guidance for reporting financed emissions and carbon risk in the context of regional financial reporting and regulatory frameworks. This also aligns with WBC’s climate strategy and the first theme of our Climate Change and Enviro PS, working to understanding the economic impact of the 2 degree economy.
CC2.3g
Please provide details of the other engagement activities that you undertake
Each year Westpac undertake a comprehensive engagement and consultation program. This includes one on one consultation with a range of stakeholders, internal and external, on the key current and emerging issues for our business, including climate change, and how best to respond. In 2014, as part of this process, Westpac published a full Progress Report on the previous five-year Climate Change Action Plan, including a summary of key learnings and practical achievements. This discussion also helped form Westpac Group position outlined in the refreshed Westpac Group Climate Change and Environment Position Statement and 2017 Action Plan. The Progress Report and revised Westpac Climate change and Environment Position Statement and 2017 Action Plan are available here: http://www.westpac.com.au/about-westpac/sustainability-and-community/environment/our-approach/
We continue to undertake rolling client engagement to better understand the key risks and opportunities for our clients. This has followed on from a program of internal engagement including training of over 1,800 employees in climate risk and has been supported by the development of a client engagement toolkit. As part of 2013-15 Westpac New Zealand Sustainable Business Strategy: Smarter Sustainability governance framework, an external panel of diverse stakeholders meets bi-annually to provide our Steering Committee challenge and thought leadership on the direction of our strategy to ensure we maximise our impact and leadership of the sector. This external panel includes representatives of the Business New Zealand, a representative organisation for NZ businesses and employers.
CC2.3h
What processes do you have in place to ensure that all of your direct and indirect activities that influence policy are consistent with your overall climate change strategy?
Our climate change position has been formally endorsed by the Board and Executive Team. All policy activities must be in line with this approved position and are reviewed by our WIB Head of Sustainability (formerly Executive Director Environment and Emissions) as well as the Group Sustainability and Government and Industry Affairs teams to ensure consistency. Substantive policy changes are overseen by the Group Sustainability Council and escalated through Executive and Board channels where required. There are approved spokespeople on climate related issues, consistent with our approach to a range of issues. In addition there is a climate change toolkit available to all employees on our intranet site which outlines our strategy and reinforces processes for policy comments and submissions. In New Zealand our actions are guided by our sustainable business strategy, which was developed after assessing the issues facing New Zealand over the next 30 years, their relevance to our role as a financial institution and where we can have the most impact. Our internal manager responsible for delivery of this strategy is also head of government relations for the bank.
CC2.3i
Please explain why you do not engage with policy makers
CC2.4
Would your organization's board of directors support an international agreement between governments on climate change, which seeks to limit global temperature rise to under two degree Celsius from pre-industrial levels in line with IPCC scenarios such as RCP2.6?
Yes
CC2.4a
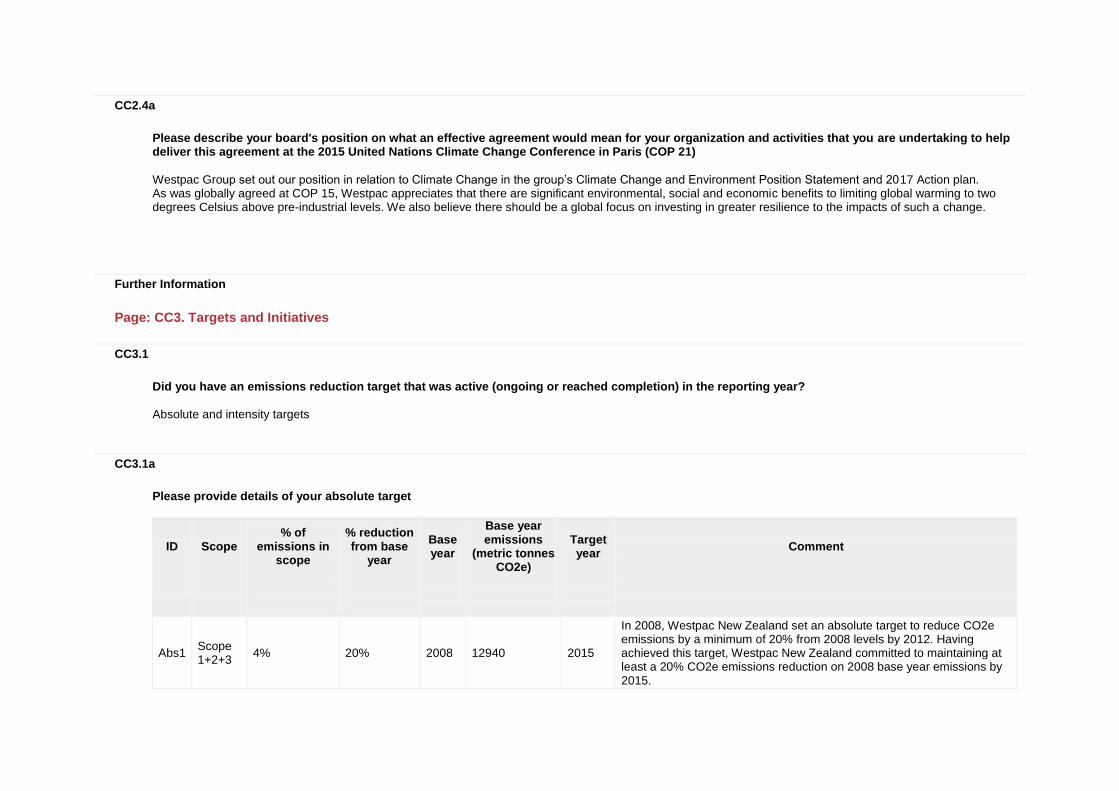
Please describe your board's position on what an effective agreement would mean for your organization and activities that you are undertaking to help deliver this agreement at the 2015 United Nations Climate Change Conference in Paris (COP 21)
Westpac Group set out our position in relation to Climate Change in the group’s Climate Change and Environment Position Statement and 2017 Action plan. As was globally agreed at COP 15, Westpac appreciates that there are significant environmental, social and economic benefits to limiting global warming to two degrees Celsius above pre-industrial levels. We also believe there should be a global focus on investing in greater resilience to the impacts of such a change.
Further Information
Page: CC3. Targets and Initiatives
CC3.1
Did you have an emissions reduction target that was active (ongoing or reached completion) in the reporting year?
Absolute and intensity targets
CC3.1a
Please provide details of your absolute target
ID
Scope
% of emissions in
scope
% reduction from base
year
Base year
Base year emissions
(metric tonnes CO2e)
Target year
Comment
Abs1 Scope 1+2+3
4% 20% 2008 12940 2015
In 2008, Westpac New Zealand set an absolute target to reduce CO2e emissions by a minimum of 20% from 2008 levels by 2012. Having achieved this target, Westpac New Zealand committed to maintaining at least a 20% CO2e emissions reduction on 2008 base year emissions by 2015.
ID
Scope
% of emissions in
scope
% reduction from base
year
Base year
Base year emissions
(metric tonnes CO2e)
Target year
Comment
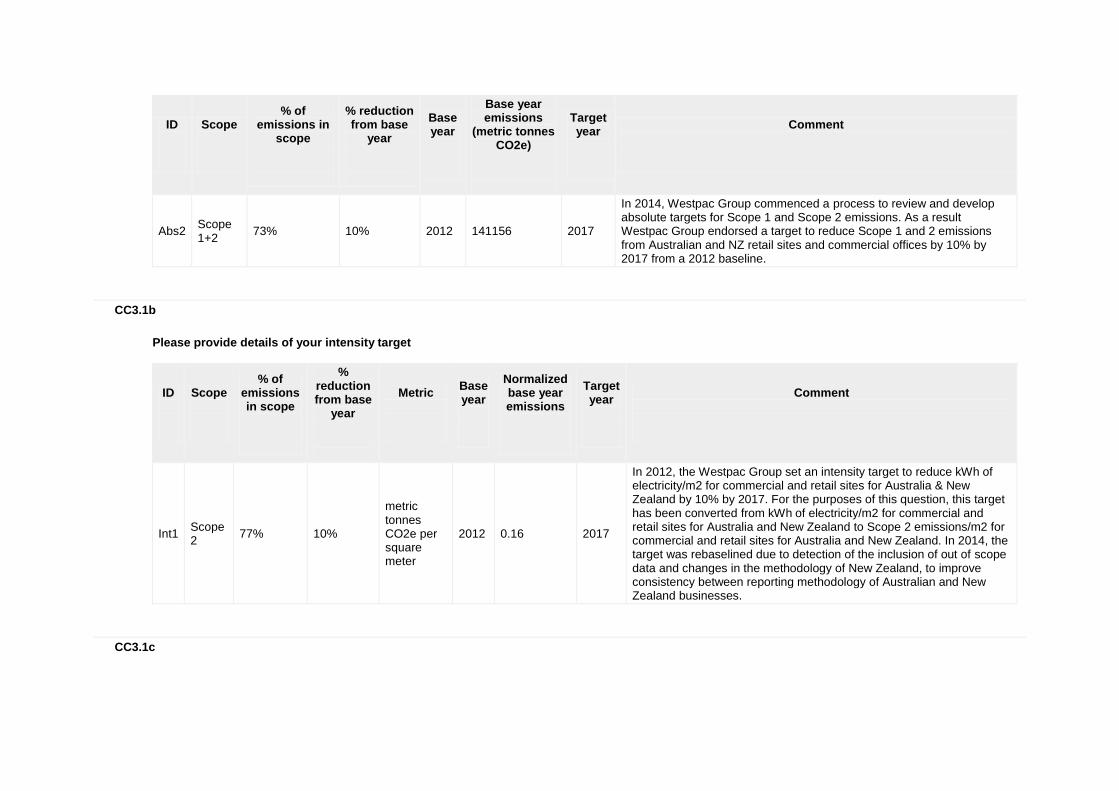
Abs2 Scope 1+2
73% 10% 2012 141156 2017
In 2014, Westpac Group commenced a process to review and develop absolute targets for Scope 1 and Scope 2 emissions. As a result Westpac Group endorsed a target to reduce Scope 1 and 2 emissions from Australian and NZ retail sites and commercial offices by 10% by 2017 from a 2012 baseline.
CC3.1b
Please provide details of your intensity target
ID
Scope
% of emissions in scope
% reduction from base
year
Metric
Base year
Normalized base year emissions
Target year
Comment
Int1 Scope 2
77% 10%
metric tonnes CO2e per square meter
2012 0.16 2017
In 2012, the Westpac Group set an intensity target to reduce kWh of electricity/m2 for commercial and retail sites for Australia & New Zealand by 10% by 2017. For the purposes of this question, this target has been converted from kWh of electricity/m2 for commercial and retail sites for Australia and New Zealand to Scope 2 emissions/m2 for commercial and retail sites for Australia and New Zealand. In 2014, the target was rebaselined due to detection of the inclusion of out of scope data and changes in the methodology of New Zealand, to improve consistency between reporting methodology of Australian and New Zealand businesses.
CC3.1c
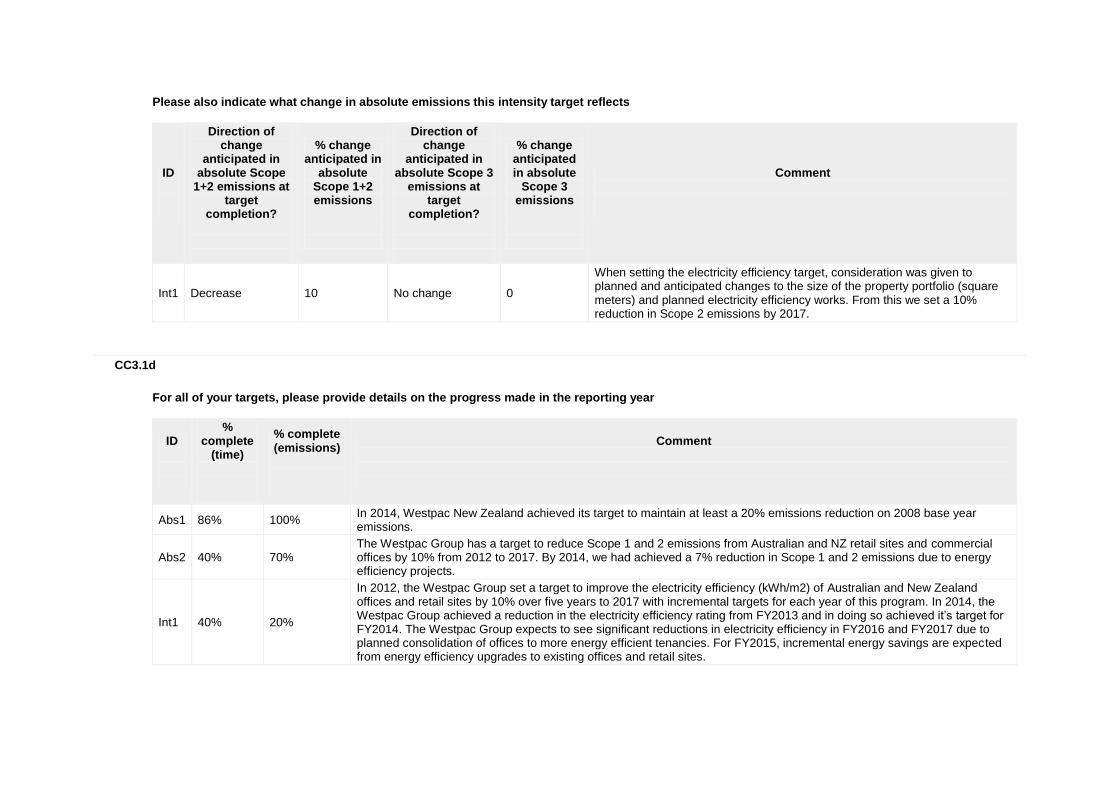
Please also indicate what change in absolute emissions this intensity target reflects
ID
Direction of change
anticipated in absolute Scope
1+2 emissions at target
completion?
% change anticipated in
absolute Scope 1+2 emissions
Direction of change
anticipated in absolute Scope 3
emissions at target
completion?
% change anticipated in absolute
Scope 3 emissions
Comment
Int1 Decrease 10 No change 0
When setting the electricity efficiency target, consideration was given to planned and anticipated changes to the size of the property portfolio (square meters) and planned electricity efficiency works. From this we set a 10% reduction in Scope 2 emissions by 2017.
CC3.1d
For all of your targets, please provide details on the progress made in the reporting year
ID
% complete
(time)
% complete (emissions)
Comment
Abs1 86% 100% In 2014, Westpac New Zealand achieved its target to maintain at least a 20% emissions reduction on 2008 base year emissions.
Abs2 40% 70% The Westpac Group has a target to reduce Scope 1 and 2 emissions from Australian and NZ retail sites and commercial offices by 10% from 2012 to 2017. By 2014, we had achieved a 7% reduction in Scope 1 and 2 emissions due to energy efficiency projects.
Int1 40% 20%
In 2012, the Westpac Group set a target to improve the electricity efficiency (kWh/m2) of Australian and New Zealand offices and retail sites by 10% over five years to 2017 with incremental targets for each year of this program. In 2014, the Westpac Group achieved a reduction in the electricity efficiency rating from FY2013 and in doing so achieved it’s target for FY2014. The Westpac Group expects to see significant reductions in electricity efficiency in FY2016 and FY2017 due to planned consolidation of offices to more energy efficient tenancies. For FY2015, incremental energy savings are expected from energy efficiency upgrades to existing offices and retail sites.
CC3.1e
Please explain (i) why you do not have a target; and (ii) forecast how your emissions will change over the next five years
CC3.2
Does the use of your goods and/or services directly enable GHG emissions to be avoided by a third party?
Yes
CC3.2a
Please provide details of how the use of your goods and/or services directly enable GHG emissions to be avoided by a third party
i. Whether avoided emissions represent the third party’s Scope 1 emissions, Scope 2 emissions, or both; • The use of Westpac’s Energy Efficiency Lease, SunPower Flexi Loan and Solar Shed Package directly enables third parties, in this instance, our customers to avoid Scope 2 emissions. • In 2014 Westpac lent $8bn to customers in the CleanTech and environmental services across WIB, WNZL and AFS (far exceeding our aim to make available $6bnby 2017) and enables third parties to reduce their black electricity consumption and avoid Scope 2 emissions. As at 30 September 2014, 59% of infrastructure and utilities financing was in renewables and hydro. • Westpac Institutional Bank partnership with the World Bank as joint lead manager for the issue of the first Green Kangaroo Bond, allows mainstream Australian domestic investors to support activities such as renewable energy, energy efficiency projects and climate adaptation programs through a liquid, tradable instrument which meets traditional investment considerations and enables third parties to avoid Scope 2 emissions. • By attending one of Westpac’s Davidson Institute’s 28 free carbon education seminars, small businesses and not-for-profit organisations can learn where to access resources and information on grants and energy efficiency and avoid Scope 2 emissions. • Paperless online banking, emailed communications, electronic bank account statements (e-statements) in lieu of posting printed material directly enable third parties to avoid Scope 1 and 2 emissions. • Commodity, Carbon and Energy trading activities include Renewable Energy Certificates and Australian, New Zealand and European carbon units. Potential client impacts sit predominantly in WIB (operating income of $3,161m; total assets $118.9m FY14). Total fair value of commodity, carbon and energy contracts outstanding as at 30 Sept 2014 was $14m. ii. How the Scope 1 and/or Scope 2 emissions are/were avoided by the third party; • The Energy Efficiency Lease applies the standard features of an equipment lease to energy efficient assets making it easier for third parties to reduce their total electricity consumption. • The SunPower Flexi Loan provides a discounted interest rate for customers wishing to finance their solar products and reduce their black electricity consumption.

• The Solar Shed Package offers farmers in New Zealand easy and affordable access to solar energy through high quality grid-connected solar system with a 100% equipment finance loan and the opportunity to reduce their black electricity consumption and provide clean energy to the grid network • Paperless online banking, emailed communications, electronic bank account statements (e-statements) in lieu of posting printed material allows our third party printers to avoid consuming electricity in printing and fuel in delivery. iii. An estimate of the amount of the emissions that are/were avoided over the time (must include timescale over which emissions are avoided or baseline year); • A SunPower project in Augusta, Western Australia supplies approx 50% of each apartment’s electricity; saves each apartment owner AU$ 346 per year & saves 45 metric tonnes per year of CO2e across all 18 apartments. • The ‘Solar Shed’ package, has been designed to provide customers with a return on their investment, with an estimated average break-even period of around seven to eight years, and expected potential electricity savings of more than $3,000 per year. iv. The methodology, assumptions, emission factors and global warming potentials (if you have expressed your carbon saving figure in CO2e) used for your estimations; • To calculate carbon savings in CO2e from a reduction electricity consumption, Westpac applies the relevant (e.g. 2009) National Greenhouse and Energy Reporting (Measurement) Determination and the Emission Factor for the relevant state (e.g. Western Australia) v. Whether you are considering generating CERs or ERUs within the framework of CDM or JI (UNFCCC). WBC are not considering generating CERs or ERUs within the framework of CDM or JI (UNFCCC).
CC3.3
Did you have emissions reduction initiatives that were active within the reporting year (this can include those in the planning and/or implementation phases)
Yes
CC3.3a
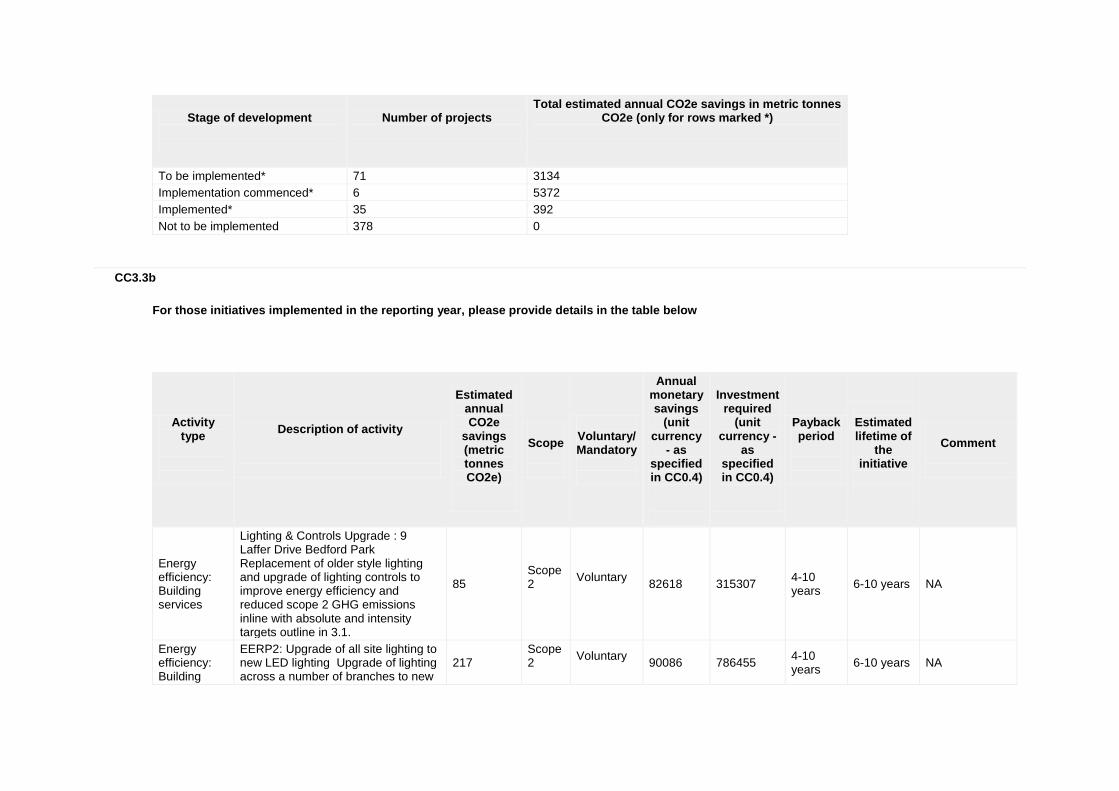
Please identify the total number of projects at each stage of development, and for those in the implementation stages, the estimated CO2e savings
Stage of development
Number of projects
Total estimated annual CO2e savings in metric tonnes CO2e (only for rows marked *)
Under investigation 440 0
Stage of development
Number of projects
Total estimated annual CO2e savings in metric tonnes CO2e (only for rows marked *)
To be implemented* 71 3134
Implementation commenced* 6 5372
Implemented* 35 392
Not to be implemented 378 0
CC3.3b
For those initiatives implemented in the reporting year, please provide details in the table below
Activity type
Description of activity
Estimated annual CO2e
savings (metric tonnes CO2e)
Scope
Voluntary/ Mandatory
Annual monetary savings
(unit currency
- as specified in CC0.4)
Investment required
(unit currency -
as specified in CC0.4)
Payback period
Estimated lifetime of
the initiative
Comment
Energy efficiency: Building services
Lighting & Controls Upgrade : 9 Laffer Drive Bedford Park Replacement of older style lighting and upgrade of lighting controls to improve energy efficiency and reduced scope 2 GHG emissions inline with absolute and intensity targets outline in 3.1.
85 Scope 2
Voluntary
82618 315307 4-10 years
6-10 years NA
Energy efficiency: Building
EERP2: Upgrade of all site lighting to new LED lighting Upgrade of lighting across a number of branches to new
217 Scope 2
Voluntary
90086 786455 4-10 years
6-10 years NA

Activity type
Description of activity
Estimated annual CO2e
savings (metric tonnes CO2e)
Scope
Voluntary/ Mandatory
Annual monetary savings
(unit currency
- as specified in CC0.4)
Investment required
(unit currency -
as specified in CC0.4)
Payback period
Estimated lifetime of
the initiative
Comment
services LED fittings to improve energy efficiency and reduced scope 2 GHG emissions use inline with absolute and intensity targets outline in 3.1.
Energy efficiency: Processes
Data Centre R : Legacy data hall Modem Room Exit Upgrade works completed at Data Centre have resulted in scope 2 GHG emissions
90 Scope 2
Voluntary
15111 4930000 16-20 years
Ongoing
Project was primarily undertaken on a risk reduction basis
CC3.3c
What methods do you use to drive investment in emissions reduction activities?
Method
Comment
Compliance with regulatory requirements/standards
The Group complies with the National Greenhouse and Energy Reporting Act which requires Westpac to capture and report all energy consumption, Scope 1 and Scope 2 greenhouse gas emissions from Australian activities under our operational control.
Dedicated budget for energy efficiency
The Westpac Australia Property team has a dedicated property environmental improvement budget, of which approximately 80% is spent on energy efficiency and carbon reduction projects for property functions (eg lighting, HVAC, building management systems, etc) and the remainder is spent on water and waste (Scope 3) reduction projects. Westpac New Zealand Property division also has a dedicated energy budget.
Dedicated budget for other The Group's WorkSMART program is focused on new ways of working and leading in an Agile and paper independent

Method
Comment
emissions reduction activities environment which will drive less investment in paper and therefore Scope 3 emissions reduction activities. The Group also has a continuous improvement budget from which Scope 1, 2 or 3 emission reduction projects may be funded where they meet business requirements. In addition, other project budgets may be established to run specific carbon reduction initiatives.
Internal price of carbon
Westpac New Zealand uses an internal price on carbon based on the domestic carbon market and the purchase of New Zealand units. In Australia, the Westpac Group is currently reviewing and updating the internal carbon pricing mechanism to better reflect international market prices for carbon. The internal price on carbon is used for property related energy efficiency business case development.
Employee engagement
Employees are engaged through the Our Tomorrow Program, an Employee Action Group informing and empower our people around Sustainability and We have the Will campaign which supports our employee action group on the Environmental. These groups are which are supported by an intranet site, Yammer (internal social media), a regular newsletters as well as invitations to presentations and workshops. Employees are also engaged through participation in Earth Hour and environmental activities, as well as building specific and general information on implementing emission reduction activities at work and at home. In NZ employees of relevant business units are also engaged in working groups focused on our own emissions reductions and developing and promoting CleanTech products.
Other We engage with clients to encourage them to invest in emissions reduction activities for example running environmental savings programs for small and medium enterprise (SME) customers.
Other The Westpac Group participates in the NSW Energy Saving Scheme and Victorian Energy Efficiency Target programs which allow us to create and sell carbon certificates for eligible energy efficiency works. The income derived from these programs is used to reduce project payback and is fed back into energy and energy / carbon efficiency budgets.
Other Achievement of the Group’s 2017 environmental targets for energy efficiency, carbon neutrality, paper reductions and data centre efficiency also supports the business case for funds to be directed towards energy efficient projects. Progress against these targets is reported publicly each year.
CC3.3d
If you do not have any emissions reduction initiatives, please explain why not
Further Information
Page: CC4. Communication
CC4.1

Have you published information about your organization’s response to climate change and GHG emissions performance for this reporting year in places other than in your CDP response? If so, please attach the publication(s)
Publication
Status
Page/Section reference
Attach the document
In mainstream financial reports but have not used the CDSB Framework
Complete 12, 52 & 121 https://www.cdp.net/sites/2015/51/19051/Climate Change 2015/Shared Documents/Attachments/CC4.1/2014-westpac-group-annual-report.pdf
In voluntary communications Complete 10,11 & 22 https://www.cdp.net/sites/2015/51/19051/Climate Change 2015/Shared Documents/Attachments/CC4.1/2014-group-annual-review.pdf
In voluntary communications Complete All https://www.cdp.net/sites/2015/51/19051/Climate Change 2015/Shared Documents/Attachments/CC4.1/Climate_Change_Progress_Report.pdf
In voluntary communications Complete 6 https://www.cdp.net/sites/2015/51/19051/Climate Change 2015/Shared Documents/Attachments/CC4.1/2014-wbc-customer-factpac.pdf
In voluntary communications Complete 2,4,6 &7 https://www.cdp.net/sites/2015/51/19051/Climate Change 2015/Shared Documents/Attachments/CC4.1/Westpac-NZ-2014-Sustainability-Review.pdf
In voluntary communications Complete All https://www.cdp.net/sites/2015/51/19051/Climate Change 2015/Shared Documents/Attachments/CC4.1/2014-wbc-environment-factpac.pdf
In other regulatory filings Complete 10, 15, 127 https://www.cdp.net/sites/2015/51/19051/Climate Change 2015/Shared Documents/Attachments/CC4.1/2014-annual-report-f20.pdf
Further Information
Module: Risks and Opportunities
Page: CC5. Climate Change Risks
CC5.1
Have you identified any inherent climate change risks that have the potential to generate a substantive change in your business operations, revenue or expenditure? Tick all that apply
Risks driven by changes in regulation Risks driven by changes in physical climate parameters Risks driven by changes in other climate-related developments
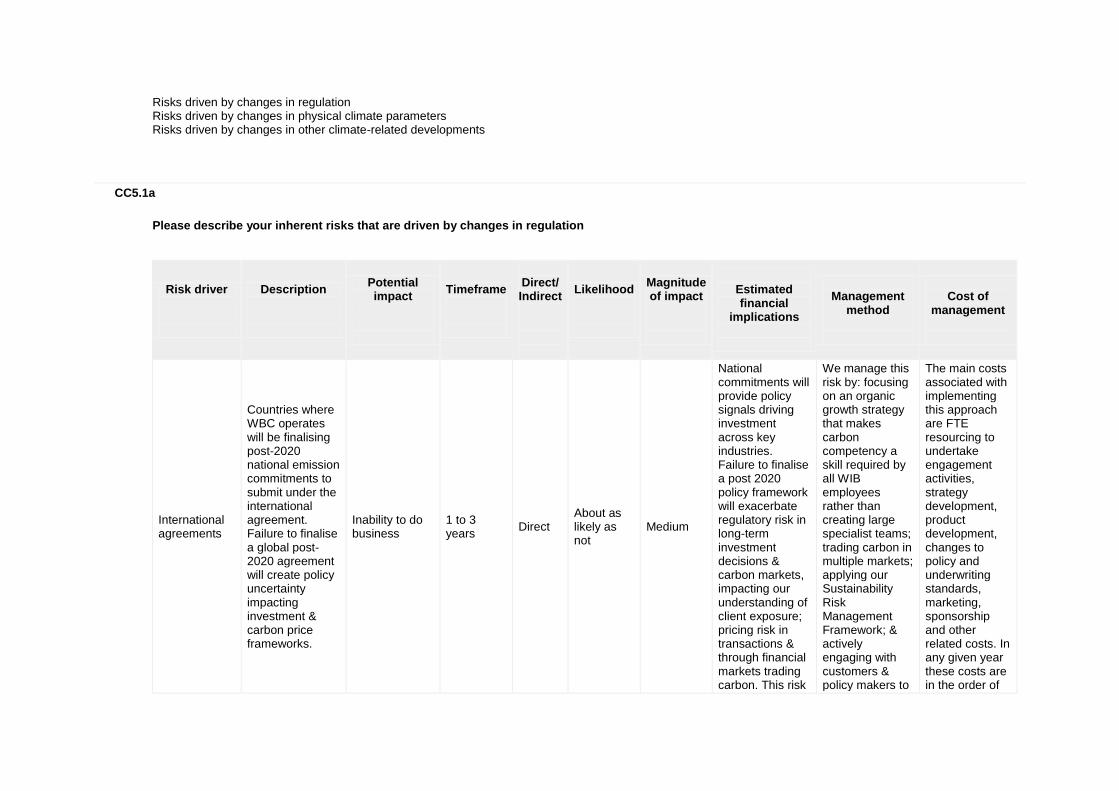
CC5.1a
Please describe your inherent risks that are driven by changes in regulation
Risk driver
Description
Potential impact
Timeframe
Direct/ Indirect
Likelihood
Magnitude of impact
Estimated financial
implications
Management
method
Cost of
management
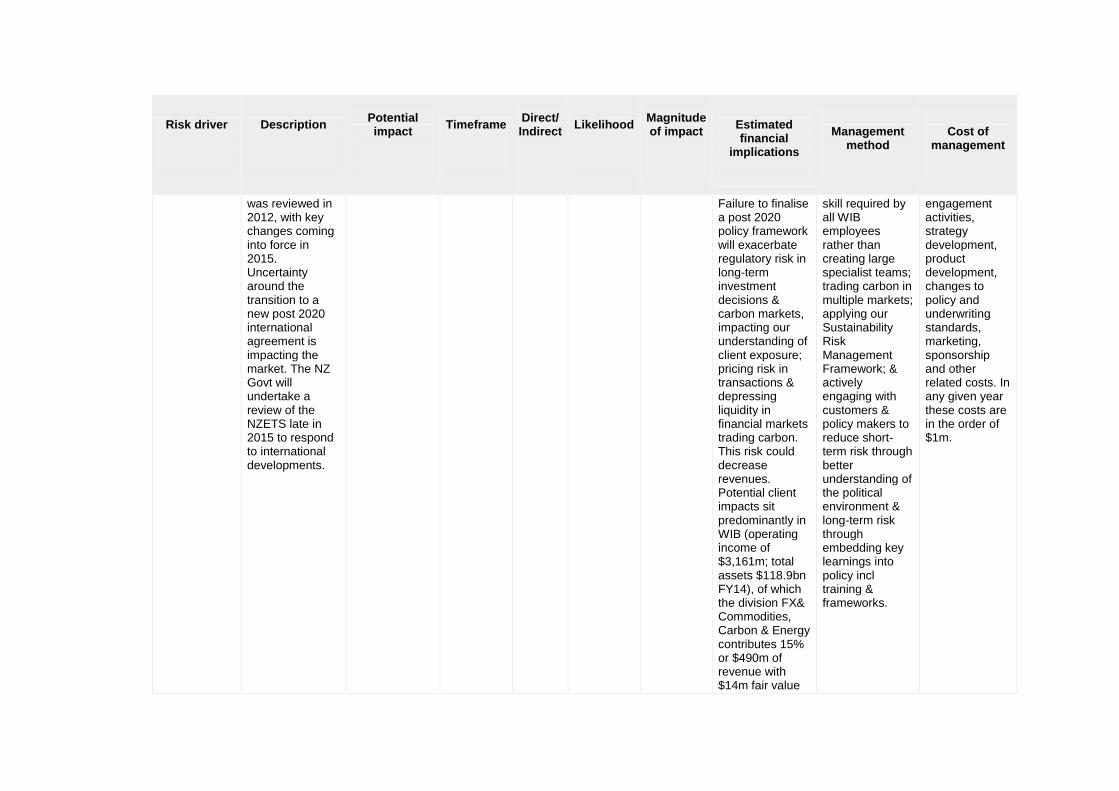
International agreements
Countries where WBC operates will be finalising post-2020 national emission commitments to submit under the international agreement. Failure to finalise a global post-2020 agreement will create policy uncertainty impacting investment & carbon price frameworks.
Inability to do business
1 to 3 years
Direct About as likely as not
Medium
National commitments will provide policy signals driving investment across key industries. Failure to finalise a post 2020 policy framework will exacerbate regulatory risk in long-term investment decisions & carbon markets, impacting our understanding of client exposure; pricing risk in transactions & through financial markets trading carbon. This risk
We manage this risk by: focusing on an organic growth strategy that makes carbon competency a skill required by all WIB employees rather than creating large specialist teams; trading carbon in multiple markets; applying our Sustainability Risk Management Framework; & actively engaging with customers & policy makers to
The main costs associated with implementing this approach are FTE resourcing to undertake engagement activities, strategy development, product development, changes to policy and underwriting standards, marketing, sponsorship and other related costs. In any given year these costs are in the order of

Risk driver
Description
Potential impact
Timeframe
Direct/ Indirect
Likelihood
Magnitude of impact
Estimated financial
implications
Management
method
Cost of
management
could decrease revenues. Potential client impacts sit predominantly in WIB (operating income of $3,161m; total assets $118.9bn FY14), of which the division FX& Commodities, Carbon & Energy contributes 15% or $490m of revenue with $14m fair value of commodity, carbon and energy contracts outstanding as at 30 Sept 2014.
reduce short-term risk through better understanding of the political environment & long-term risk through embedding key learnings into policy incl training & frameworks.
$1m.
Uncertainty surrounding new regulation
The Australian Carbon Price Mechanism was repealed in 2014, with the final compliance date in February 2015. A new carbon pricing framework, including the Emissions Reduction Fund
Reduced demand for goods/services
Up to 1 year
Indirect (Client)
Likely Medium-high
Ongoing changes to domestic regulatory frameworks will exacerbate regulatory risk in long-term investment decisions & carbon markets, impacting our understanding of
We manage this risk by: focusing on an organic growth strategy that makes carbon competency a skill required by all WIB employees rather than creating large specialist teams;
The main costs associated with implementing this approach are FTE resourcing to undertake engagement activities, strategy development, product development,

Risk driver
Description
Potential impact
Timeframe
Direct/ Indirect
Likelihood
Magnitude of impact
Estimated financial
implications
Management
method
Cost of
management
and a future ‘Safeguard Mechanism’ is being introduced. This creates market uncertainty and will have compliance and revenue obligations for market participants.
client exposure; pricing risk in transactions & through financial markets trading carbon. This risk could decrease revenues. Potential client impacts sit predominantly in WIB (operating income of $3,161m; total assets $118.9bn FY14), of which the division FX& Commodities, Carbon & Energy contributes 15% or $AUD490m of revenue with $14m fair value of commodity, carbon and energy contracts outstanding as at 30 Sept 2014.
trading carbon in multiple markets; applying our Sustainability Risk Management Framework; & actively engaging with customers & policy makers to reduce short-term risk through better understanding of the political environment & long-term risk through embedding key learnings into policy incl training & frameworks.
changes to policy and underwriting standards, marketing, sponsorship and other related costs. In any given year these costs are in the order of $1m.
Cap and trade schemes
The New Zealand Emission Trading Scheme (NZETS) has been in operation since FY10 and
Reduced demand for goods/services
1 to 3 years
Indirect (Client)
More likely than not
Low
National commitments will provide policy signals driving investment across key industries.
We manage this risk by: focusing on an organic growth strategy that makes carbon competency a
The main costs associated with implementing this approach are FTE resourcing to undertake
Risk driver
Description
Potential impact
Timeframe
Direct/ Indirect
Likelihood
Magnitude of impact
Estimated financial
implications
Management
method
Cost of
management
was reviewed in 2012, with key changes coming into force in 2015. Uncertainty around the transition to a new post 2020 international agreement is impacting the market. The NZ Govt will undertake a review of the NZETS late in 2015 to respond to international developments.
Failure to finalise a post 2020 policy framework will exacerbate regulatory risk in long-term investment decisions & carbon markets, impacting our understanding of client exposure; pricing risk in transactions & depressing liquidity in financial markets trading carbon. This risk could decrease revenues. Potential client impacts sit predominantly in WIB (operating income of $3,161m; total assets $118.9bn FY14), of which the division FX& Commodities, Carbon & Energy contributes 15% or $490m of revenue with $14m fair value
skill required by all WIB employees rather than creating large specialist teams; trading carbon in multiple markets; applying our Sustainability Risk Management Framework; & actively engaging with customers & policy makers to reduce short-term risk through better understanding of the political environment & long-term risk through embedding key learnings into policy incl training & frameworks.
engagement activities, strategy development, product development, changes to policy and underwriting standards, marketing, sponsorship and other related costs. In any given year these costs are in the order of $1m.
Risk driver
Description
Potential impact
Timeframe
Direct/ Indirect
Likelihood
Magnitude of impact
Estimated financial
implications
Management
method
Cost of
management
of commodity, carbon and energy contracts outstanding as at 30 Sept 2014.
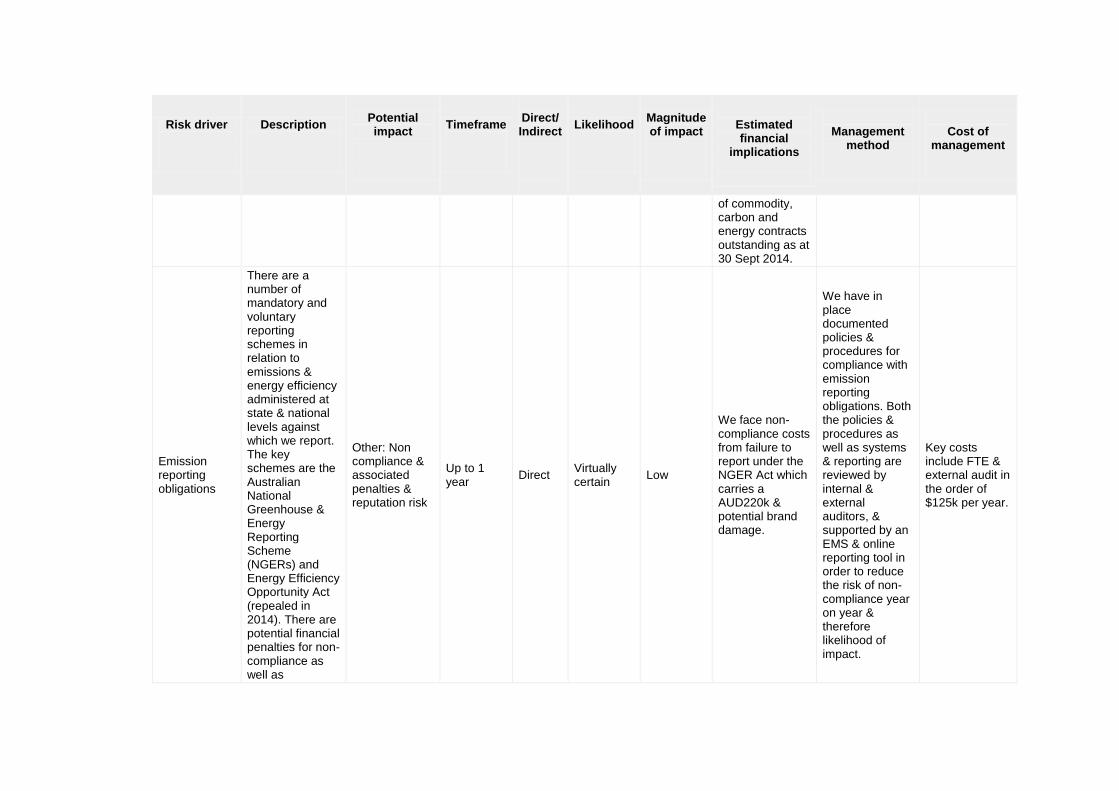
Emission reporting obligations
There are a number of mandatory and voluntary reporting schemes in relation to emissions & energy efficiency administered at state & national levels against which we report. The key schemes are the Australian National Greenhouse & Energy Reporting Scheme (NGERs) and Energy Efficiency Opportunity Act (repealed in 2014). There are potential financial penalties for non-compliance as well as
Other: Non compliance & associated penalties & reputation risk
Up to 1 year
Direct Virtually certain
Low
We face non-compliance costs from failure to report under the NGER Act which carries a AUD220k & potential brand damage.
We have in place documented policies & procedures for compliance with emission reporting obligations. Both the policies & procedures as well as systems & reporting are reviewed by internal & external auditors, & supported by an EMS & online reporting tool in order to reduce the risk of non-compliance year on year & therefore likelihood of impact.
Key costs include FTE & external audit in the order of $125k per year.
Risk driver
Description
Potential impact
Timeframe
Direct/ Indirect
Likelihood
Magnitude of impact
Estimated financial
implications
Management
method
Cost of
management
reputational impacts.
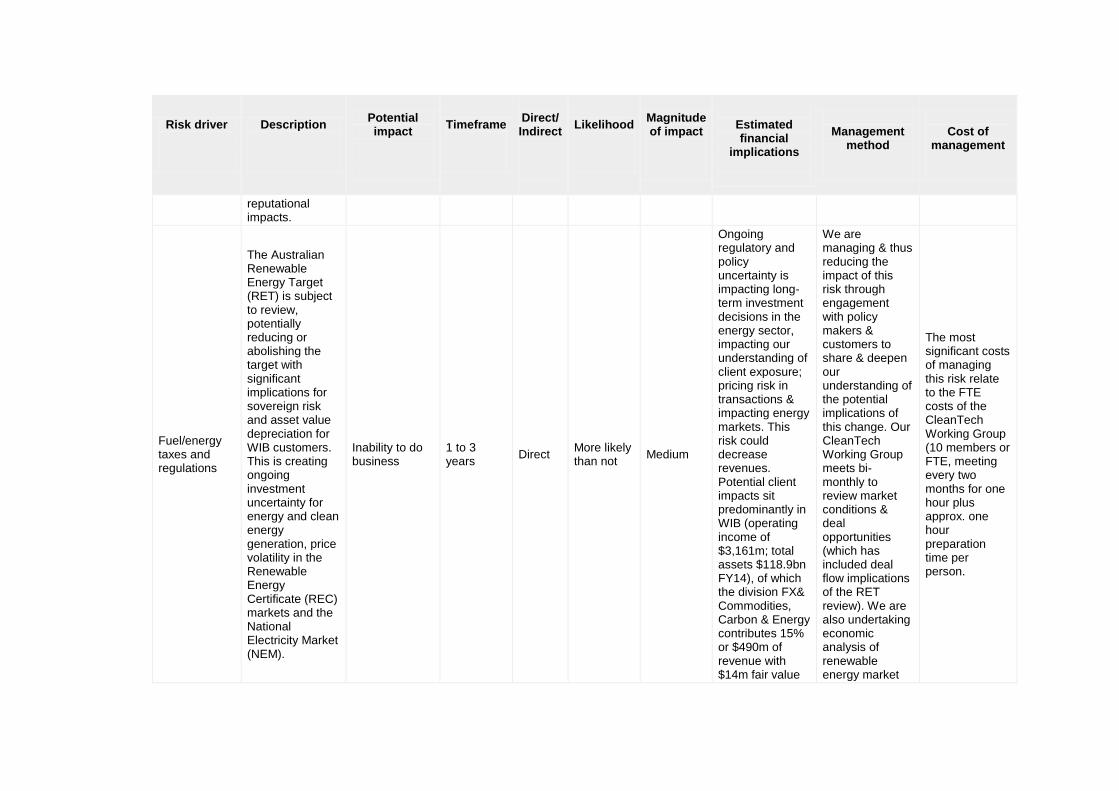
Fuel/energy taxes and regulations
The Australian Renewable Energy Target (RET) is subject to review, potentially reducing or abolishing the target with significant implications for sovereign risk and asset value depreciation for WIB customers. This is creating ongoing investment uncertainty for energy and clean energy generation, price volatility in the Renewable Energy Certificate (REC) markets and the National Electricity Market (NEM).
Inability to do business
1 to 3 years
Direct More likely than not
Medium
Ongoing regulatory and policy uncertainty is impacting long-term investment decisions in the energy sector, impacting our understanding of client exposure; pricing risk in transactions & impacting energy markets. This risk could decrease revenues. Potential client impacts sit predominantly in WIB (operating income of $3,161m; total assets $118.9bn FY14), of which the division FX& Commodities, Carbon & Energy contributes 15% or $490m of revenue with $14m fair value
We are managing & thus reducing the impact of this risk through engagement with policy makers & customers to share & deepen our understanding of the potential implications of this change. Our CleanTech Working Group meets bi-monthly to review market conditions & deal opportunities (which has included deal flow implications of the RET review). We are also undertaking economic analysis of renewable energy market
The most significant costs of managing this risk relate to the FTE costs of the CleanTech Working Group (10 members or FTE, meeting every two months for one hour plus approx. one hour preparation time per person.

Risk driver
Description
Potential impact
Timeframe
Direct/ Indirect
Likelihood
Magnitude of impact
Estimated financial
implications
Management
method
Cost of
management
of commodity, carbon and energy contracts outstanding as at 30 Sept 2014. Total attributable financing for Infrastructure & Utilities (Aust &NZ) was $3,197m at FY14, we may not be able to grow this figure due to uncertainty in the market.
segments to identify opportunities for growth & innovation (eg solar).
General environmental regulations, including planning
Ongoing changes and intra-state variability in planning and approval requirements for large infrastructure and property development, including required environmental approvals, are impacting credit risk assessment processes and
Other: Credit Risk
1 to 3 years
Indirect (Client)
More likely than not
Low-medium
Climate change considerations and national policy commitments to constrain emissions growth to limit global warming to 2 degrees above pre-industrial levels are unevenly factored into planning and approval processes, predominantly
We continue to engage with policy-makers to understand ongoing changes, focus on applying our Sustainability Risk Management Framework & actively engaging with customers to reduce short-term risk through better understanding of
The main costs associated with implementing this approach are FTE resourcing to undertake engagement activities, strategy development, product development, changes to policy and underwriting standards, marketing,

Risk driver
Description
Potential impact
Timeframe
Direct/ Indirect
Likelihood
Magnitude of impact
Estimated financial
implications
Management
method
Cost of
management
transactional costs.
impacting large infrastructure developments and client sets in the Institutional Bank (operating income of $3,161m; total assets $118.9bn FY14), This has the potential to impact revenues of this business unit.
the political environment & long-term risk through embedding key learnings into policy incl training & frameworks.
sponsorship and other related costs. In any given year these costs are in the order of $1m.
CC5.1b
Please describe your inherent risks that are driven by change in physical climate parameters
Risk driver
Description
Potential impact
Timeframe
Direct/ Indirect
Likelihood
Magnitude of impact
Estimated financial
implications
Management
method
Cost of
management
Change in temperature extremes
The Westpac Group Climate Change & Enviro PS (updated 2014), states that we anticipate significant changes across our areas of
Other: Indirect impacts on customer viability, business continuity planning
1 to 3 years
Indirect (Client)
Virtually certain
Low-medium
The Aust Bus Roundtable found that the economic cost of natural disasters is about $6.3bn p.a. & forecast to rise to $23bn by 2050.
Engagement with stakeholders to understand and better manage impacts, and participation in research e.g. on
Costs of engagement and research in FY14 of $100-150k can be expected to reflect likely order of

Risk driver
Description
Potential impact
Timeframe
Direct/ Indirect
Likelihood
Magnitude of impact
Estimated financial
implications
Management
method
Cost of
management
operation over the near and long-term. The statement draws upon the work of the Intergovernmental Panel on Climate Change (IPCC 5), as well as domestic research undertaken in Australia, New Zealand and the Pacific, to identify projected impacts and emerging physical risks. The annual State of the Climate (2014) report, released by CSIRO and the Bureau of Meteorology (BoM) found that Australia’s climate has now warmed by 0.9°C since 1910, and the frequency of extreme weather has changed, with more extreme heat and fewer cool extremes. In addition the Angry Summer report released by the
There is a risk of increase in cost of insurance claims associated with extreme temp events. In FY14. BTFG (operating income $2,654m total assets $31.8bn) Gen. Insurance reported 47,593 claims. There is also a risk of cost increase in Disaster Relief for impacted communities due to increase in natural disasters from extreme temp. In Oct 2013 Westpac set aside $250,000 for the establishment of the Westpac National Disaster Recovery Community Fund. 12 grants/$92145 were allocated in Dec ‘14 to 12 projects in the Blue Mountains & 5 projects/$38745 for Perth Hills & $150,000 in Jan ‘15 for bushfires in South Australia. Increased frequency of extreme temperatures also has implications for operational costs
costs of natural disasters through Australian Business Roundtable for Disaster Resilience, and on highly impacted sectors through Climate Institute Climate Partners' Network. In 2013 BTFG introduced bush fire pricing within postcodes to reduce portfolio risk over 1-3 years. Integration of climate risk into ESG framework for reduced credit risk on ongoing basis. Ongoing management of disaster relief via the Disaster Relief retail package for impacted customers & Westpac’s
magnitude of annual costs over next 2-3 years to better understand and manage impacts. FTE costs of better risk pricing methods in order of AUD500k per annum. Disaster Relief fund is $250k p.a on an ongoing basis. Ad hoc funding for additional disaster relief donations as required.

Risk driver
Description
Potential impact
Timeframe
Direct/ Indirect
Likelihood
Magnitude of impact
Estimated financial
implications
Management
method
Cost of
management
Climate Commission in 2013 highlighted an extreme heatwave that impacted 70% of the continent in Dec/Jan and saw the hottest ever area averaged temperature nationally as well as new maximum highs recorded at 44 weather stations.
associated with rising energy bills.
National Disaster Recovery Fund for impacted communities. Group Operations manage impacts for Westpac’s own operations.
Change in precipitation extremes and droughts
The Westpac Group Climate Change & Enviro PS (updated 2014), states that we anticipate significant changes across our areas of operation over the near and long-term. The statement draws upon the Intergovernmental Panel on Climate Change (IPCC 5) & domestic research undertaken in Australia, New Zealand and the Pacific, to identify projected impacts
Other: credit risk and operational risks
Up to 1 year
Direct Virtually certain
Medium
Increasing frequency of extremes in precipitation (floods &/or droughts) have impacts including disruption to business delivery, damage to WBC infrastructure/equip. & commercial outlets, client impacts across portfolios & ongoing delivery and management of disaster relief across impacted communities. Total economic costs of Aus. natural disasters forecast to grow by approx. 3.5% pa
Engagement with stakeholders to understand and better manage impacts over next 1-3 years, and participating in research e.g. on costs of natural disasters through Australian Business Roundtable for Disaster Resilience, and on highly impacted sectors through Climate Institute
Costs of engagement and research in FY14 of $100-150k can be expected to reflect likely order of magnitude of annual costs over next 2-3 years to better understand and manage impacts. FTE costs of better risk pricing methods in order of AUD500k per annum.

Risk driver
Description
Potential impact
Timeframe
Direct/ Indirect
Likelihood
Magnitude of impact
Estimated financial
implications
Management
method
Cost of
management
and emerging physical risks. The short and long-term physical impacts for Australia are summarised in the annual State of the Climate (2014) report, by CSIRO and the Bureau of Meteorology (BoM). The report charts temperature and rainfall changes already observed & likely trends. It shows that rainfall averaged across Australia has slightly increased since 1900, but declined since 1970 in the southwest, dominated by reduced winter rainfall. Autumn and early winter rainfall has mostly been below average in the southeast since 1990. Average rainfall in southern Australia is projected to decrease with more droughts and heavy
from current average of $6.3bn/yr. Risk s include increased insurance claims assoc. with extreme precip. in BTFG (operating income of $2,654m; total assets $31.8bn FY14) of which the General Insurance business contributes 15% or $490m . General Insurance reported 47,593 claims in FY14. Risk of reductions in value of mortgage book (Aus value $351bn at 30 Sept ‘14). Response cost increase incl. donations & customer assistance. In Oct 2013, $250k was set aside for the establishment of Westpac disaster recovery community fund. After Cyclone Pam in Vanuatu in Mar ’15, $100k was donated to assist in rebuilding.
Climate Partners' Network. Flood risk pricing to reduce portfolio risk is already in place. Integration of climate risk into ESG framework for reduced credit risk on ongoing basis. Delivery of Disaster Relief special assistance packages for customers impacted by flooding or drought-related exceptional circumstances.
Disaster Relief fund is $250k p.a

Risk driver
Description
Potential impact
Timeframe
Direct/ Indirect
Likelihood
Magnitude of impact
Estimated financial
implications
Management
method
Cost of
management
rainfall is projected to increase over most parts of Australia
Sea level rise
The Westpac Group Climate Change & Enviro PS (updated 2014), states that we anticipate significant changes across our areas of operation over the near and long-term. The statement draws upon the Intergovernmental Panel on Climate Change (IPCC 5) & domestic research undertaken in Australia, New Zealand and the Pacific, to identify projected impacts and emerging physical risks. Populations in our key markets are densely concentrated in a relatively small number of larger coastal cities or coastal areas which are potentially
Other: Indirect impacts on customer viability, business continuity planning
1 to 3 years
Indirect (Client)
Virtually certain
Medium
Approx 85% of Australia’s population live in coastal areas, at risk of increased storm surge & sea level rise. Research has found that up to $63 billion (replacement value) of existing residential buildings are potentially at risk of inundation from a 1.1 metre sea-level rise. Risk of reductions in valuation of mortgage book (valued at $351bn (Aus only) at 30 Sept 2014). Risk of flood response cost increase (e.g. incl. donations, customer assistance). In October 2013, $250,000 was set aside p.a for the establishment of a new ongoing Westpac disaster recovery community fund.
Engagement with stakeholders to understand and better manage impacts over next 1-3 years, and participating in research e.g. on costs of natural disasters through Australian Business Roundtable for Disaster Resilience, and on highly impacted sectors through Climate Institute Climate Partners' Network. Introducing storm surge pricing to reduce portfolio risk over next 1-3 years. Integration of climate risk into
Costs of engagement and research in FY14 of $100-150k can be expected to reflect likely order of magnitude of annual costs over next 2-3 years to better understand and manage impacts. FTE costs of better risk pricing methods in order of $500k per annum. Disaster Relief fund is $250k p.a

Risk driver
Description
Potential impact
Timeframe
Direct/ Indirect
Likelihood
Magnitude of impact
Estimated financial
implications
Management
method
Cost of
management
exposed to rising sea levels and storm surges. For instance around 85% of Australia’s population live in coastal areas. This is also of concern within the Pacific Islands where sea level rise will lead to increased salination of coastal plains. Impacts for Australia have also been summarised in a report released by the CSIRO & Bureau of Meteorology, which states that global-average mean sea level from 2011 was 210 mm above the level in 1880 and rose faster between 1993 and 2011 than during the 20th century as a whole. All of which creates credit and portfolio risk from impacted customers and operational risk associated with direct impacts.
ESG framework for reduced credit risk on ongoing basis.

Risk driver
Description
Potential impact
Timeframe
Direct/ Indirect
Likelihood
Magnitude of impact
Estimated financial
implications
Management
method
Cost of
management
Tropical cyclones (hurricanes and typhoons)
The Westpac Group Climate Change & Enviro PS (updated 2014), states that we anticipate significant changes across our areas of operation over the near and long-term. The statement draws upon the Intergovernmental Panel on Climate Change (IPCC 5) & domestic research undertaken in Australia, New Zealand and the Pacific, to identify projected impacts and emerging physical risks. The short and long-term physical impacts for Australia have been summarised in a report released by the CSIRO and Bureau of Meteorology which states that it is likely (with more than a 66 per cent probability) that there will be fewer tropical cyclones in
Other: Indirect impacts on customer viability, business continuity planning
1 to 3 years
Indirect (Client)
Likely Low
Total economic costs of Australian natural disasters forecast to grow by approx. 3.5% /yr, from a current average of $6.3bn/yr. Risk of increased insurance claims assoc. with cyclones. e.g during 2011, General Insurance paid $150m claims associated with extreme weather events, reducing revenues by $34m. Risk of reductions in valuation of mortgage book (valued at $351bn (Aus only) at 30 Sept 2014). Risk of flood response cost increase (e.g. incl. donations, customer assistance). Risk of cyclone response cost increase (e.g. incl. donations, customer assistance). In October 2013, $250,000 was set aside p.a for the establishment of a new ongoing
Engagement with stakeholders to understand and better manage impacts over next 1-3 years, and participating in research e.g. on costs of natural disasters through Australian Business Roundtable for Disaster Resilience, and on highly impacted sectors through Climate Institute Climate Partners' Network. Integration of climate risk into ESG framework for reduced credit risk on ongoing basis.
Costs of engagement and research in FY14 of $100-150k can be expected to reflect likely order of magnitude of annual costs over next 2-3 years to better understand and manage impacts. FTE costs of better risk pricing methods in order of $500k per annum. Disaster Relief fund is $250k p.a
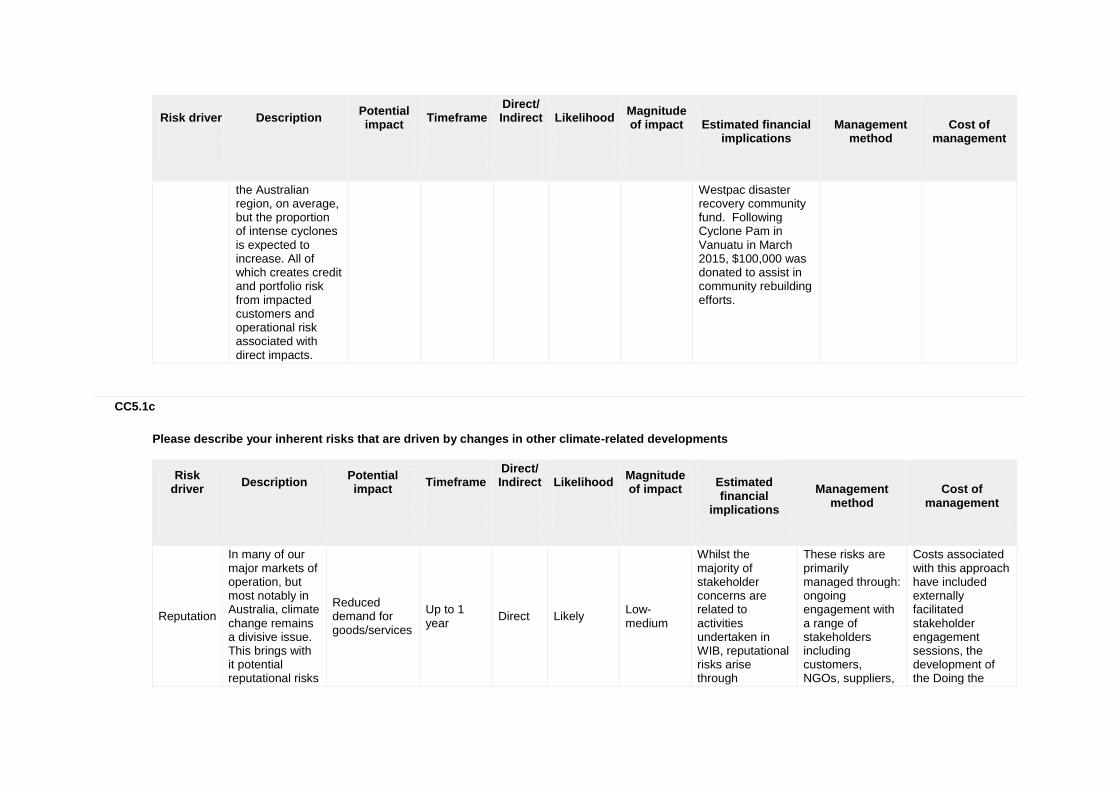
Risk driver
Description
Potential impact
Timeframe
Direct/ Indirect
Likelihood
Magnitude of impact
Estimated financial
implications
Management
method
Cost of
management
the Australian region, on average, but the proportion of intense cyclones is expected to increase. All of which creates credit and portfolio risk from impacted customers and operational risk associated with direct impacts.
Westpac disaster recovery community fund. Following Cyclone Pam in Vanuatu in March 2015, $100,000 was donated to assist in community rebuilding efforts.
CC5.1c
Please describe your inherent risks that are driven by changes in other climate-related developments
Risk driver
Description
Potential impact
Timeframe
Direct/ Indirect
Likelihood
Magnitude of impact
Estimated financial
implications
Management
method
Cost of
management
Reputation
In many of our major markets of operation, but most notably in Australia, climate change remains a divisive issue. This brings with it potential reputational risks
Reduced demand for goods/services
Up to 1 year
Direct Likely Low-medium
Whilst the majority of stakeholder concerns are related to activities undertaken in WIB, reputational risks arise through
These risks are primarily managed through: ongoing engagement with a range of stakeholders including customers, NGOs, suppliers,
Costs associated with this approach have included externally facilitated stakeholder engagement sessions, the development of the Doing the
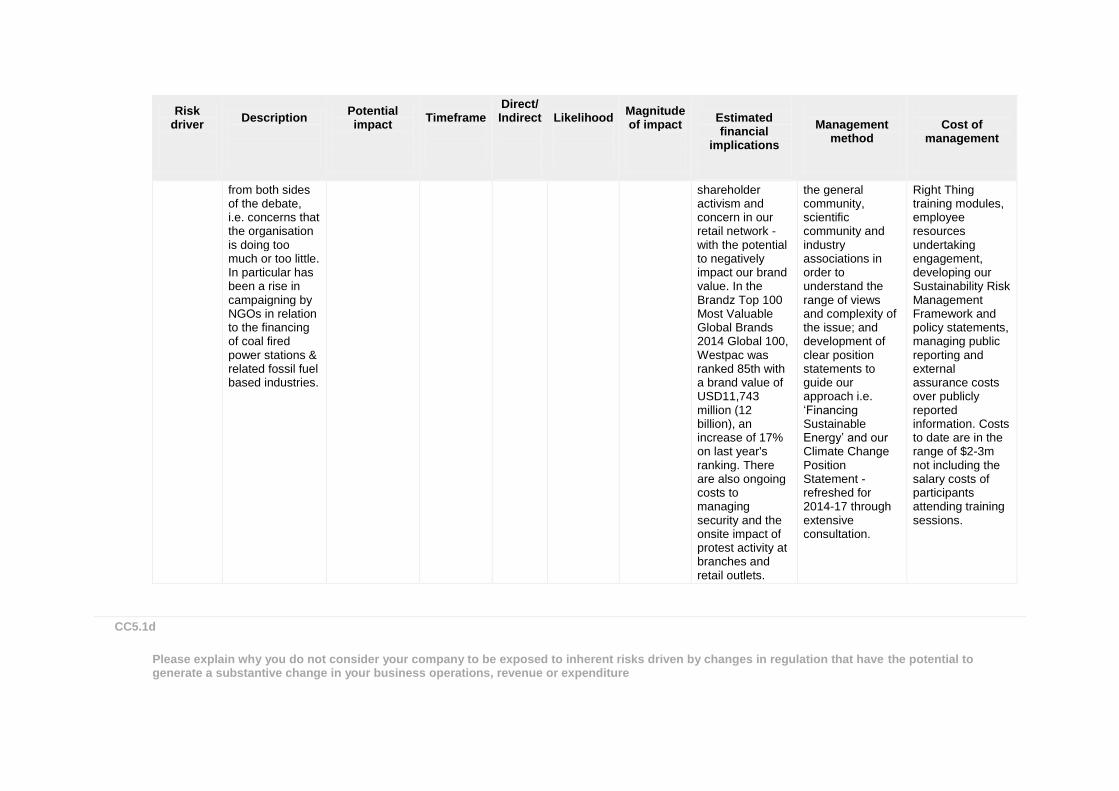
Risk driver
Description
Potential impact
Timeframe
Direct/ Indirect
Likelihood
Magnitude of impact
Estimated financial
implications
Management
method
Cost of
management
from both sides of the debate, i.e. concerns that the organisation is doing too much or too little. In particular has been a rise in campaigning by NGOs in relation to the financing of coal fired power stations & related fossil fuel based industries.
shareholder activism and concern in our retail network - with the potential to negatively impact our brand value. In the Brandz Top 100 Most Valuable Global Brands 2014 Global 100, Westpac was ranked 85th with a brand value of USD11,743 million (12 billion), an increase of 17% on last year's ranking. There are also ongoing costs to managing security and the onsite impact of protest activity at branches and retail outlets.
the general community, scientific community and industry associations in order to understand the range of views and complexity of the issue; and development of clear position statements to guide our approach i.e. ‘Financing Sustainable Energy’ and our Climate Change Position Statement - refreshed for 2014-17 through extensive consultation.
Right Thing training modules, employee resources undertaking engagement, developing our Sustainability Risk Management Framework and policy statements, managing public reporting and external assurance costs over publicly reported information. Costs to date are in the range of $2-3m not including the salary costs of participants attending training sessions.
CC5.1d
Please explain why you do not consider your company to be exposed to inherent risks driven by changes in regulation that have the potential to generate a substantive change in your business operations, revenue or expenditure

CC5.1e
Please explain why you do not consider your company to be exposed to inherent risks driven by physical climate parameters that have the potential to generate a substantive change in your business operations, revenue or expenditure
CC5.1f
Please explain why you do not consider your company to be exposed to inherent risks driven by changes in other climate-related developments that have the potential to generate a substantive change in your business operations, revenue or expenditure
Further Information
Page: CC6. Climate Change Opportunities
CC6.1
Have you identified any inherent climate change opportunities that have the potential to generate a substantive change in your business operations, revenue or expenditure? Tick all that apply
Opportunities driven by changes in regulation Opportunities driven by changes in physical climate parameters Opportunities driven by changes in other climate-related developments
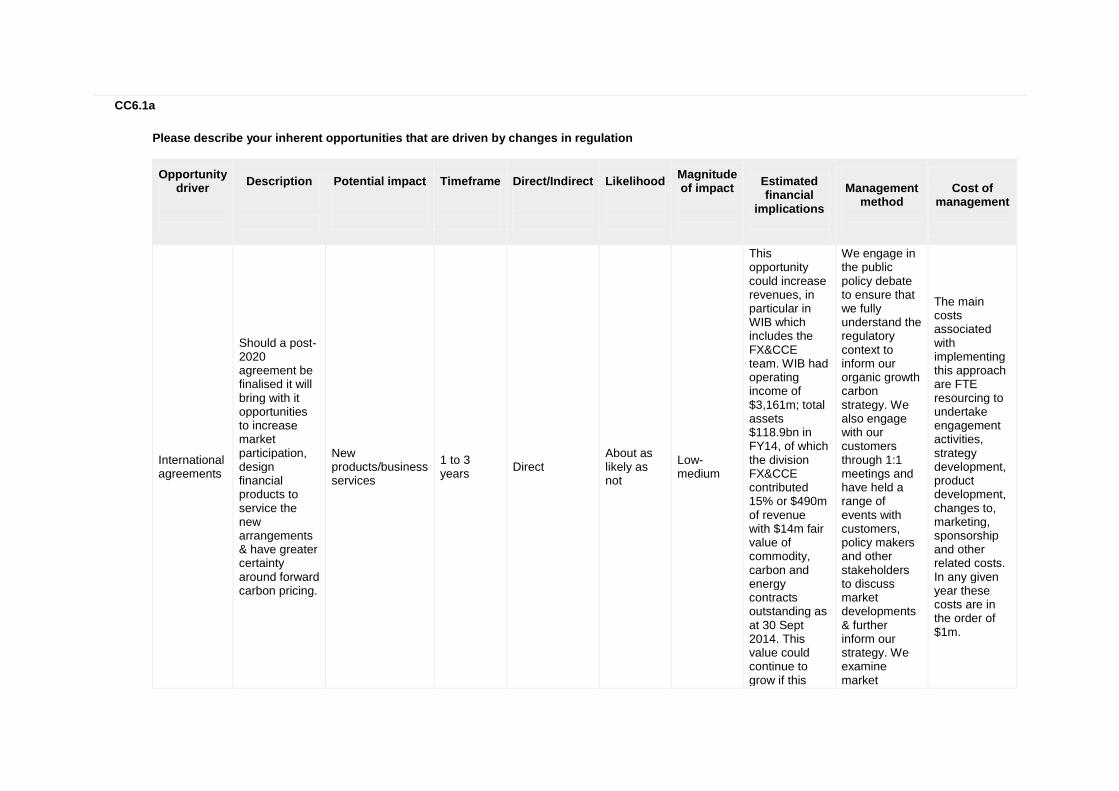
CC6.1a
Please describe your inherent opportunities that are driven by changes in regulation
Opportunity driver
Description
Potential impact
Timeframe
Direct/Indirect
Likelihood
Magnitude of impact
Estimated financial
implications
Management
method
Cost of
management
International agreements
Should a post-2020 agreement be finalised it will bring with it opportunities to increase market participation, design financial products to service the new arrangements & have greater certainty around forward carbon pricing.
New products/business services
1 to 3 years
Direct About as likely as not
Low-medium
This opportunity could increase revenues, in particular in WIB which includes the FX&CCE team. WIB had operating income of $3,161m; total assets $118.9bn in FY14, of which the division FX&CCE contributed 15% or $490m of revenue with $14m fair value of commodity, carbon and energy contracts outstanding as at 30 Sept 2014. This value could continue to grow if this
We engage in the public policy debate to ensure that we fully understand the regulatory context to inform our organic growth carbon strategy. We also engage with our customers through 1:1 meetings and have held a range of events with customers, policy makers and other stakeholders to discuss market developments & further inform our strategy. We examine market
The main costs associated with implementing this approach are FTE resourcing to undertake engagement activities, strategy development, product development, changes to, marketing, sponsorship and other related costs. In any given year these costs are in the order of $1m.

Opportunity driver
Description
Potential impact
Timeframe
Direct/Indirect
Likelihood
Magnitude of impact
Estimated financial
implications
Management
method
Cost of
management
opportunity was realised.
dynamics and identify growth opportunities on an ongoing basis.
Other regulatory drivers
The Australian Carbon Price Mechanism was repealed in 2014, with the final compliance date in February 2015. A new carbon pricing framework, including the Emissions Reduction Fund and a future ‘Safeguard Mechanism’ is being introduced. This creates potential funding and market facilitation opportunities.
New products/business services
1 to 3 years
Direct Likely Medium-high
Potential client impacts sit predominantly in WIB(operating income of $3,161m; total assets $118.9bn FY14), of which the division FX& Commodities, Carbon & Energy contributes 15% or $490m of revenue with $14m fair value of commodity, carbon and energy contracts outstanding as at 30 Sept 2014. WBC is targeting CleanTech investment with a public
We engage in the public policy debate to ensure that we fully understand the regulatory context to inform our organic growth carbon strategy. We also engage with our customers through 1:1 meetings and have held a range of events with customers, policy makers and other stakeholders to discuss market developments & further inform our strategy. We examine
The main costs associated with implementing this approach are FTE resourcing to undertake engagement activities, strategy development, product development, changes to policy and underwriting standards, marketing, sponsorship and other related costs. In any given year these costs are in the order of $1m.

Opportunity driver
Description
Potential impact
Timeframe
Direct/Indirect
Likelihood
Magnitude of impact
Estimated financial
implications
Management
method
Cost of
management
commitment set in 2013 to make available $6bn by 2017. Total exposures as at FY14 were $8bn. Increases in customers seeking funding to undertake emissions reductions projects is one example of Westpac could benefit from growth in this market.
market dynamics and identify growth opportunities on an ongoing basis to support our public CleanTech commitment.
Cap and trade schemes
Westpac was the first and is the principal market maker in the NZ ETS and has traded the EUETS since 2006. There are ongoing opportunities for revenue growth as a provider of financial
New products/business services
Up to 1 year
Direct Virtually certain
Low
Potential client impacts sit predominantly in WIB (operating income of AUD3,161m; total assets AUD118.9bn FY14), of which the division FX& Commodities, Carbon & Energy
We engage in the public policy debate to ensure that we fully understand the regulatory context to inform our organic growth carbon strategy. We also engage with our customers
The main costs associated with implementing this approach are FTE resourcing to undertake engagement activities, strategy development, product development,
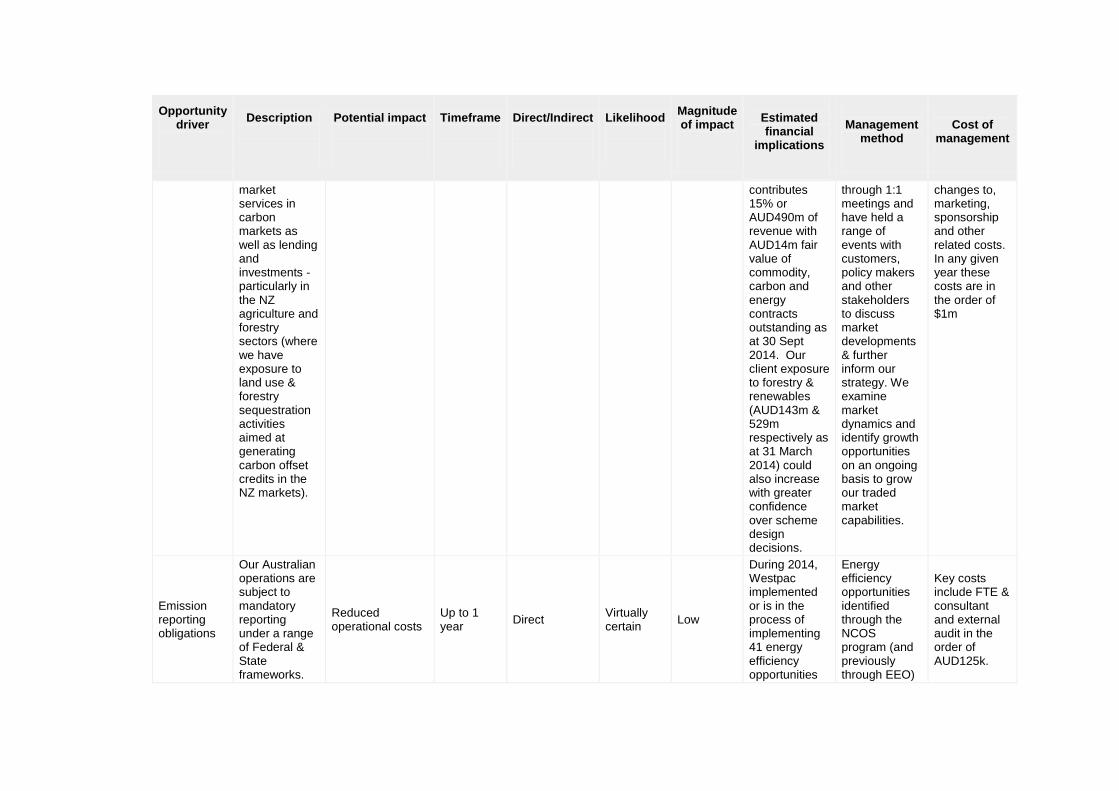
Opportunity driver
Description
Potential impact
Timeframe
Direct/Indirect
Likelihood
Magnitude of impact
Estimated financial
implications
Management
method
Cost of
management
market services in carbon markets as well as lending and investments - particularly in the NZ agriculture and forestry sectors (where we have exposure to land use & forestry sequestration activities aimed at generating carbon offset credits in the NZ markets).
contributes 15% or AUD490m of revenue with AUD14m fair value of commodity, carbon and energy contracts outstanding as at 30 Sept 2014. Our client exposure to forestry & renewables (AUD143m & 529m respectively as at 31 March 2014) could also increase with greater confidence over scheme design decisions.
through 1:1 meetings and have held a range of events with customers, policy makers and other stakeholders to discuss market developments & further inform our strategy. We examine market dynamics and identify growth opportunities on an ongoing basis to grow our traded market capabilities.
changes to, marketing, sponsorship and other related costs. In any given year these costs are in the order of $1m
Emission reporting obligations
Our Australian operations are subject to mandatory reporting under a range of Federal & State frameworks.
Reduced operational costs
Up to 1 year
Direct Virtually certain
Low
During 2014, Westpac implemented or is in the process of implementing 41 energy efficiency opportunities
Energy efficiency opportunities identified through the NCOS program (and previously through EEO)
Key costs include FTE & consultant and external audit in the order of AUD125k.

Opportunity driver
Description
Potential impact
Timeframe
Direct/Indirect
Likelihood
Magnitude of impact
Estimated financial
implications
Management
method
Cost of
management
These require us to report Scope 1 & 2 emissions, energy consumption & production. As part of Westpac commitments under NCOS the group also reports energy efficiency opportunities identified in our operations . This follows on from previous commitments under the now removed Energy Efficiency Opportunities (EEO) Act and has provided opportunities for improved benchmarking & identification of cost savings associated with identified opportunities to reduce
which are expected to result in energy and maintenance cost savings exceeding $800000 per year. We met our 2014 energy efficiency target, achieving a reduction of almost 2% in our energy use per square metre across our retail and corporate networks in Australia and New Zealand since 2012.
are reviewed at least annually by relevant Department Heads, the Environmental Management Committee, the Sustainability Council, the Board and Executive. Although the mandatory EEO obligation has been removed, WBC will continue to apply the framework as part of the NCOS commitment and to ensure a consistent process for identifying energy efficiency opportunities across the portfolio
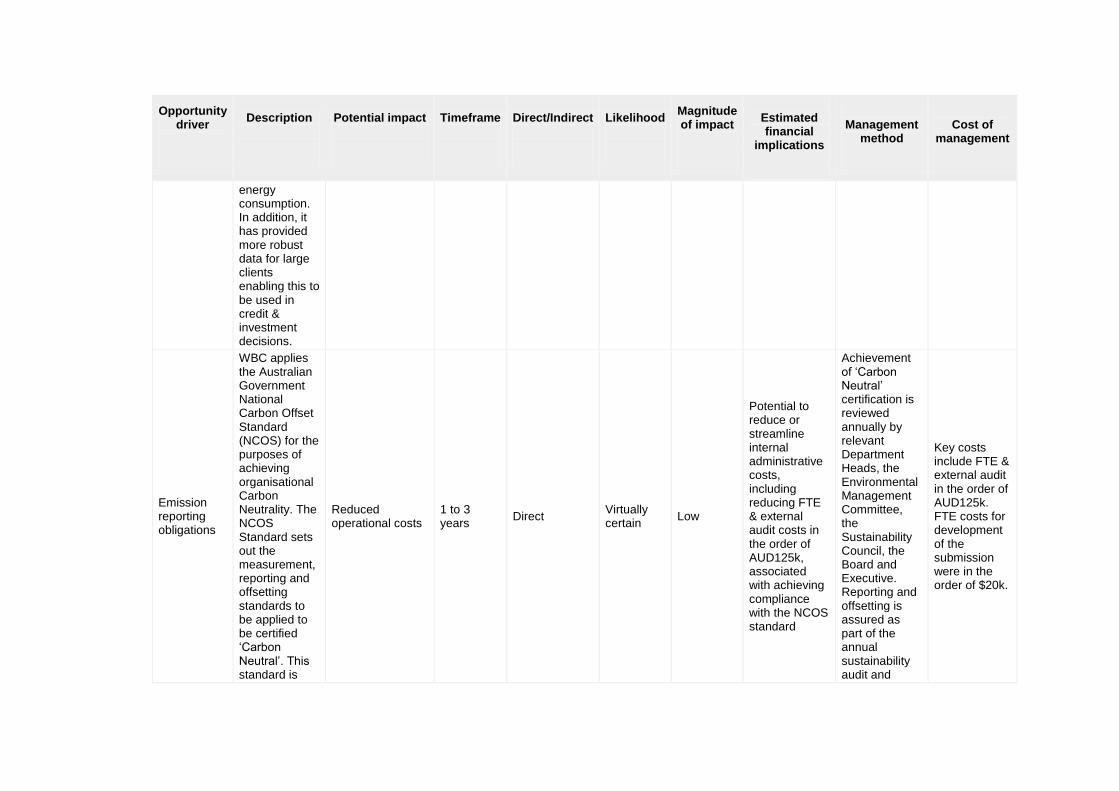
Opportunity driver
Description
Potential impact
Timeframe
Direct/Indirect
Likelihood
Magnitude of impact
Estimated financial
implications
Management
method
Cost of
management
energy consumption. In addition, it has provided more robust data for large clients enabling this to be used in credit & investment decisions.
Emission reporting obligations
WBC applies the Australian Government National Carbon Offset Standard (NCOS) for the purposes of achieving organisational Carbon Neutrality. The NCOS Standard sets out the measurement, reporting and offsetting standards to be applied to be certified ‘Carbon Neutral’. This standard is
Reduced operational costs
1 to 3 years
Direct Virtually certain
Low
Potential to reduce or streamline internal administrative costs, including reducing FTE & external audit costs in the order of AUD125k, associated with achieving compliance with the NCOS standard
Achievement of ‘Carbon Neutral’ certification is reviewed annually by relevant Department Heads, the Environmental Management Committee, the Sustainability Council, the Board and Executive. Reporting and offsetting is assured as part of the annual sustainability audit and
Key costs include FTE & external audit in the order of AUD125k. FTE costs for development of the submission were in the order of $20k.

Opportunity driver
Description
Potential impact
Timeframe
Direct/Indirect
Likelihood
Magnitude of impact
Estimated financial
implications
Management
method
Cost of
management
being reviewed in 2015, with opportunities for streamlining the associated administrative costs for achieving net neutrality.
assurance process. Westpac made a submission to the review of the NCOS standard in early 2015.
Fuel/energy taxes and regulations
The Australian Renewable Energy Target (RET) has been under review and political negotiations for an extended period of time. Uncertainty over the outcome has had a chilling effect on renewable energy investment over the last 12-18 months. It is expected that resolution of the policy framework will open up new
Investment opportunities
1 to 3 years
Direct More likely than not
Low-medium
As at 31st March 2014 our lending to renewable energy projects was AUD1,261m. Lending for CleanTech was AUD8bn at HY14. Lending to these two areas has the potential to increase with financing opportunities linked to the CEFC.
We are managing this opportunity through engagement with customers to deepen our understanding of renewable energy market dynamics as well as ongoing discussions with the CEFC. Our CleanTech Working Group meets bi-monthly to review market conditions and deal opportunities.
The most significant costs of managing this risk relate to the FTE costs of the CleanTech Working Group (10 members or FTE, meeting every two months for one hour plus approx. one hour preparation time per person).
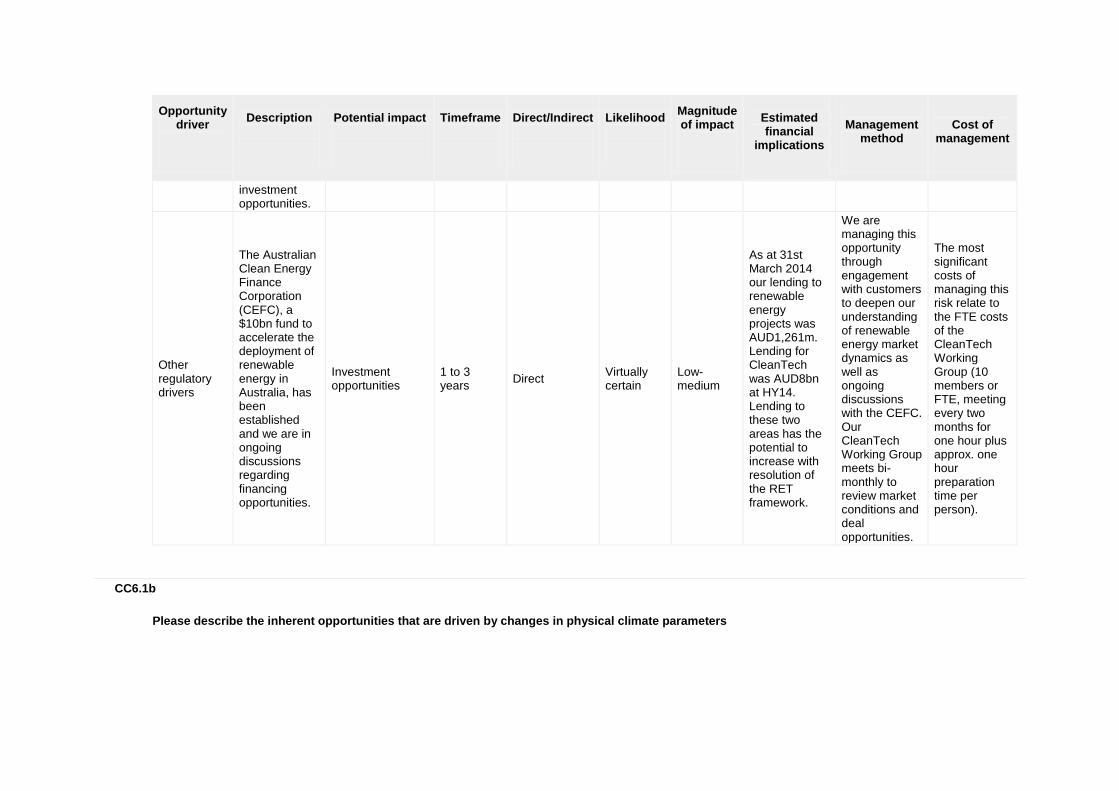
Opportunity driver
Description
Potential impact
Timeframe
Direct/Indirect
Likelihood
Magnitude of impact
Estimated financial
implications
Management
method
Cost of
management
investment opportunities.
Other regulatory drivers
The Australian Clean Energy Finance Corporation (CEFC), a $10bn fund to accelerate the deployment of renewable energy in Australia, has been established and we are in ongoing discussions regarding financing opportunities.
Investment opportunities
1 to 3 years
Direct Virtually certain
Low-medium
As at 31st March 2014 our lending to renewable energy projects was AUD1,261m. Lending for CleanTech was AUD8bn at HY14. Lending to these two areas has the potential to increase with resolution of the RET framework.
We are managing this opportunity through engagement with customers to deepen our understanding of renewable energy market dynamics as well as ongoing discussions with the CEFC. Our CleanTech Working Group meets bi-monthly to review market conditions and deal opportunities.
The most significant costs of managing this risk relate to the FTE costs of the CleanTech Working Group (10 members or FTE, meeting every two months for one hour plus approx. one hour preparation time per person).
CC6.1b
Please describe the inherent opportunities that are driven by changes in physical climate parameters

Opportunity driver
Description
Potential impact
Timeframe
Direct/ Indirect
Likelihood
Magnitude of impact
Estimated financial
implications
Management
method
Cost of
management
Change in mean (average) temperature
The Westpac Group Climate Change & Environment Position Statement (updated 2014), states that we anticipate significant changes across our areas of operation over the near and long-term. The statement draws upon the work of the Intergovernmental Panel on Climate Change (IPCC 5), as well as domestic research undertaken in Australia, New Zealand and the Pacific, to identify projected impacts and emerging physical risks. The annual State of the Climate (2014) report, released by CSIRO and the Bureau of Meteorology (BoM) found that Australia’s climate has now warmed by 0.9°C since 1910, and the frequency of extreme weather has changed, with
Investment opportunities
1 to 3 years
Indirect (Client)
Virtually certain
Low
Increases in mean temperatures and extreme heat events increase demand for baseload energy, creating volatility in traded wholesale energy markets. This increases demand for our services in Australia's energy markets and potential for increased revenues for our FX&CCE team in WIB. In FY14 FX&CCE generated AUD490m of revenue with AUD14m fair value of commodity, carbon and energy contracts outstanding as at 30 Sept 2014. This value could continue to grow if this
Our dedicated team of energy trading specialists (the largest financial intermediary in the National Electricity Market (NEM)) analyse factors which drive demand for energy including weather and climate patterns, as a key input to trading decisions - currently and on an ongoing basis - in order to increase the likelihood of realising this opportunity. Our CleanTech Working Group meets bi-monthly to review market conditions and deal opportunities.
The main costs of managing this opportunity are fixed and variable operational costs and FTE costs for our dedicated energy market specialists. Due to market sensitivities the value of this cost cannot be disclosed. In addition, there are the costs of managing this risk relate to the FTE costs of the CleanTech Working Group (10 members or FTE, meeting every two months for one hour plus approx. one hour preparation time per person).
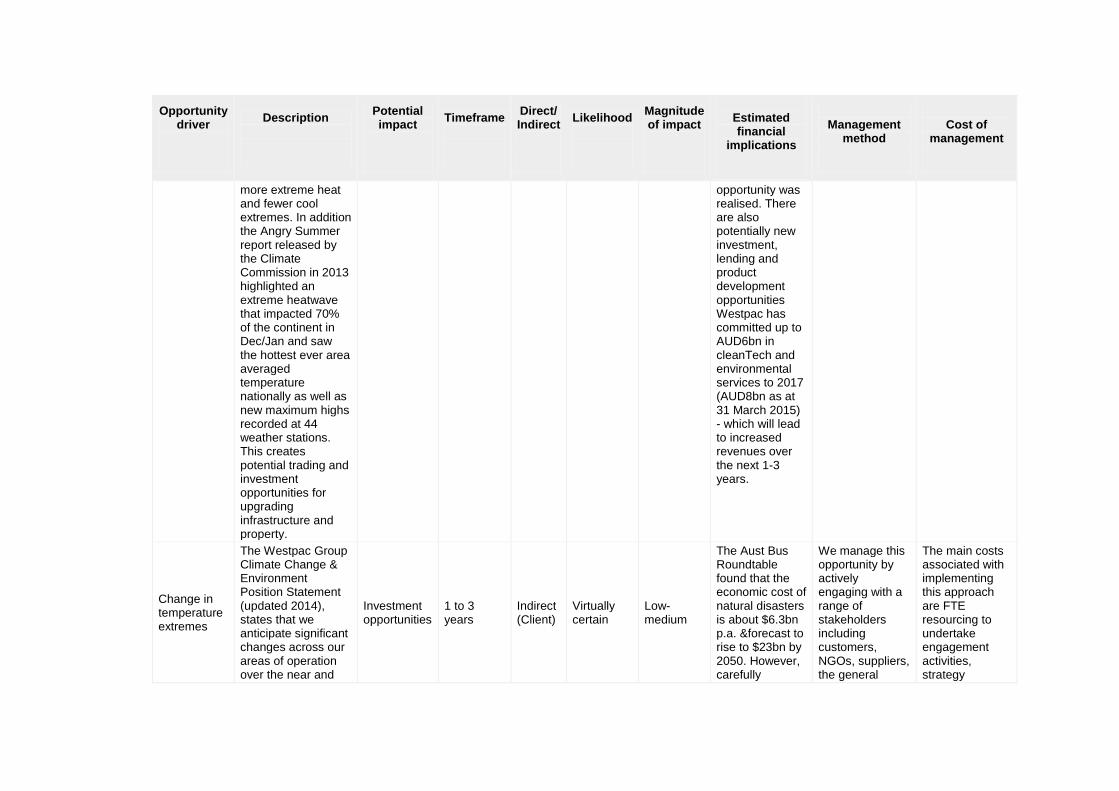
Opportunity driver
Description
Potential impact
Timeframe
Direct/ Indirect
Likelihood
Magnitude of impact
Estimated financial
implications
Management
method
Cost of
management
more extreme heat and fewer cool extremes. In addition the Angry Summer report released by the Climate Commission in 2013 highlighted an extreme heatwave that impacted 70% of the continent in Dec/Jan and saw the hottest ever area averaged temperature nationally as well as new maximum highs recorded at 44 weather stations. This creates potential trading and investment opportunities for upgrading infrastructure and property.
opportunity was realised. There are also potentially new investment, lending and product development opportunities Westpac has committed up to AUD6bn in cleanTech and environmental services to 2017 (AUD8bn as at 31 March 2015) - which will lead to increased revenues over the next 1-3 years.
Change in temperature extremes
The Westpac Group Climate Change & Environment Position Statement (updated 2014), states that we anticipate significant changes across our areas of operation over the near and
Investment opportunities
1 to 3 years
Indirect (Client)
Virtually certain
Low-medium
The Aust Bus Roundtable found that the economic cost of natural disasters is about $6.3bn p.a. &forecast to rise to $23bn by 2050. However, carefully
We manage this opportunity by actively engaging with a range of stakeholders including customers, NGOs, suppliers, the general
The main costs associated with implementing this approach are FTE resourcing to undertake engagement activities, strategy
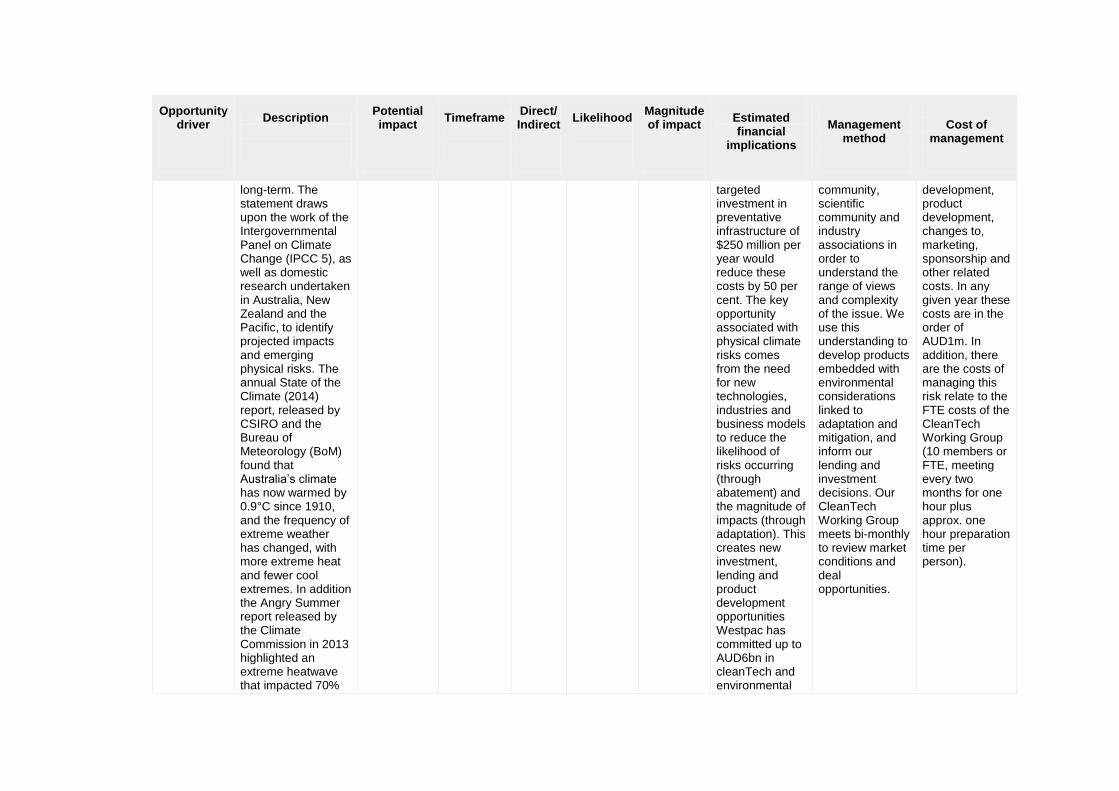
Opportunity driver
Description
Potential impact
Timeframe
Direct/ Indirect
Likelihood
Magnitude of impact
Estimated financial
implications
Management
method
Cost of
management
long-term. The statement draws upon the work of the Intergovernmental Panel on Climate Change (IPCC 5), as well as domestic research undertaken in Australia, New Zealand and the Pacific, to identify projected impacts and emerging physical risks. The annual State of the Climate (2014) report, released by CSIRO and the Bureau of Meteorology (BoM) found that Australia’s climate has now warmed by 0.9°C since 1910, and the frequency of extreme weather has changed, with more extreme heat and fewer cool extremes. In addition the Angry Summer report released by the Climate Commission in 2013 highlighted an extreme heatwave that impacted 70%
targeted investment in preventative infrastructure of $250 million per year would reduce these costs by 50 per cent. The key opportunity associated with physical climate risks comes from the need for new technologies, industries and business models to reduce the likelihood of risks occurring (through abatement) and the magnitude of impacts (through adaptation). This creates new investment, lending and product development opportunities Westpac has committed up to AUD6bn in cleanTech and environmental
community, scientific community and industry associations in order to understand the range of views and complexity of the issue. We use this understanding to develop products embedded with environmental considerations linked to adaptation and mitigation, and inform our lending and investment decisions. Our CleanTech Working Group meets bi-monthly to review market conditions and deal opportunities.
development, product development, changes to, marketing, sponsorship and other related costs. In any given year these costs are in the order of AUD1m. In addition, there are the costs of managing this risk relate to the FTE costs of the CleanTech Working Group (10 members or FTE, meeting every two months for one hour plus approx. one hour preparation time per person).

Opportunity driver
Description
Potential impact
Timeframe
Direct/ Indirect
Likelihood
Magnitude of impact
Estimated financial
implications
Management
method
Cost of
management
of the continent in Dec/Jan and saw the hottest ever area averaged temperature nationally as well as new maximum highs recorded at 44 weather stations. This creates potential investment opportunities for upgrading infrastructure and property.
services to 2017 (AUD8bn as at 31 March 2015) - which will lead to increased revenues over the next 1-3 years.
Change in precipitation extremes and droughts
The Westpac Group Climate Change & Environment Position Statement (updated 2014), states that we anticipate significant changes across our areas of operation over the near and long-term. The statement draws upon the Intergovernmental Panel on Climate Change (IPCC 5) & domestic research undertaken in Australia, New Zealand and the Pacific, to identify
Investment opportunities
Up to 1 year
Indirect (Client)
Virtually certain
Medium
The Aust Bus Roundtable found that the economic cost of natural disasters is about $6.3bn p.a. &forecast to rise to $23bn by 2050. However, carefully targeted investment in preventative infrastructure of $250 million per year would reduce these costs by 50 per cent. The key opportunity associated with
We manage this opportunity by actively engaging with a range of stakeholders including customers, NGOs, suppliers, the general community, scientific community and industry associations in order to understand the range of views and complexity of the issue. We use this
The main costs associated with implementing this approach are FTE resourcing to undertake engagement activities, strategy development, product development, changes to, marketing, sponsorship and other related costs. In any given year these costs are in the order of
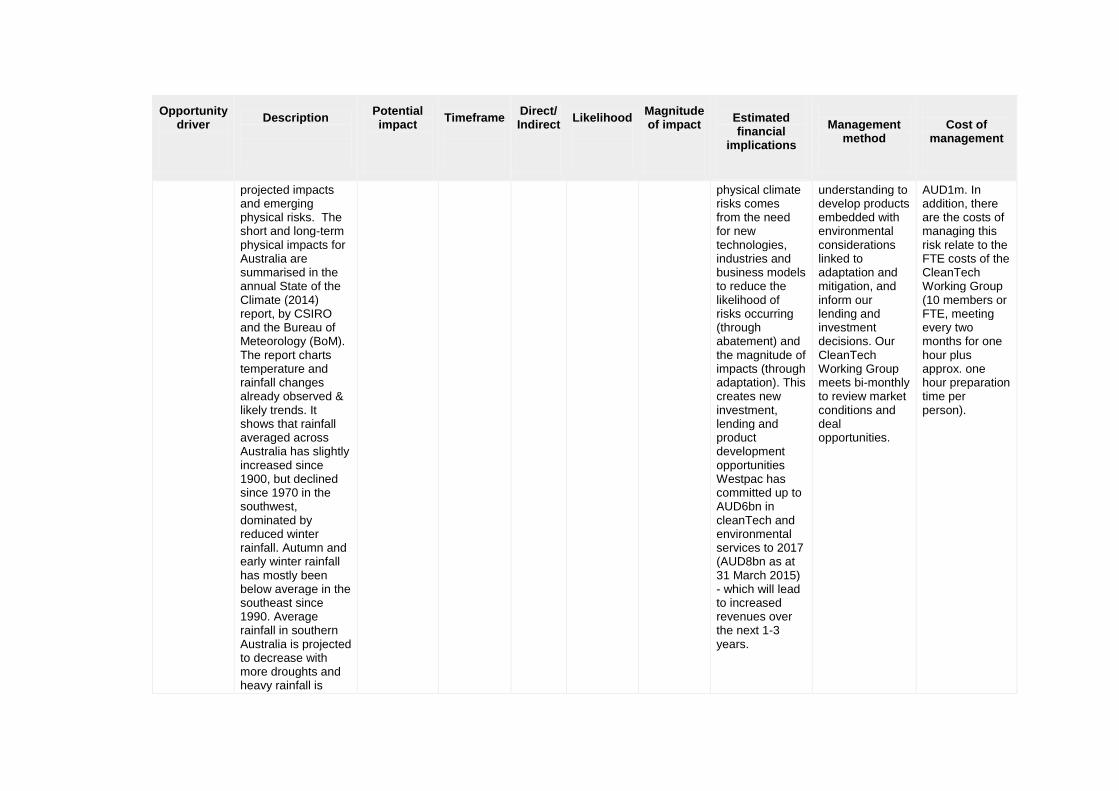
Opportunity driver
Description
Potential impact
Timeframe
Direct/ Indirect
Likelihood
Magnitude of impact
Estimated financial
implications
Management
method
Cost of
management
projected impacts and emerging physical risks. The short and long-term physical impacts for Australia are summarised in the annual State of the Climate (2014) report, by CSIRO and the Bureau of Meteorology (BoM). The report charts temperature and rainfall changes already observed & likely trends. It shows that rainfall averaged across Australia has slightly increased since 1900, but declined since 1970 in the southwest, dominated by reduced winter rainfall. Autumn and early winter rainfall has mostly been below average in the southeast since 1990. Average rainfall in southern Australia is projected to decrease with more droughts and heavy rainfall is
physical climate risks comes from the need for new technologies, industries and business models to reduce the likelihood of risks occurring (through abatement) and the magnitude of impacts (through adaptation). This creates new investment, lending and product development opportunities Westpac has committed up to AUD6bn in cleanTech and environmental services to 2017 (AUD8bn as at 31 March 2015) - which will lead to increased revenues over the next 1-3 years.
understanding to develop products embedded with environmental considerations linked to adaptation and mitigation, and inform our lending and investment decisions. Our CleanTech Working Group meets bi-monthly to review market conditions and deal opportunities.
AUD1m. In addition, there are the costs of managing this risk relate to the FTE costs of the CleanTech Working Group (10 members or FTE, meeting every two months for one hour plus approx. one hour preparation time per person).

Opportunity driver
Description
Potential impact
Timeframe
Direct/ Indirect
Likelihood
Magnitude of impact
Estimated financial
implications
Management
method
Cost of
management
projected to increase over most parts of Australia. This creates potential investment opportunities for upgrading infrastructure and property.
CC6.1c
Please describe the inherent opportunities that are driven by changes in other climate-related developments
Opportunity driver
Description
Potential impact
Timeframe
Direct/ Indirect
Likelihood
Magnitude of impact
Estimated financial
implications
Management
method
Cost of
management
Reputation
In many of our major markets of operation, but most notably in Australia, climate change remains a divisive issue. This brings with it potential reputation opportunities from both sides of the debate,
Increased demand for existing products/services
Up to 1 year
Direct Likely Low-medium
Whilst the majority of stakeholder concerns are related to activities undertaken in WIB, reputational opportunities relate to Westpac Group as a whole and
This opportunity is primarily managed through: ongoing engagement with a range of stakeholders including customers, NGOs, suppliers, the general community,
Costs associated with this approach have included externally facilitated stakeholder engagement sessions, the development of the Doing the Right Thing training modules, employee resources
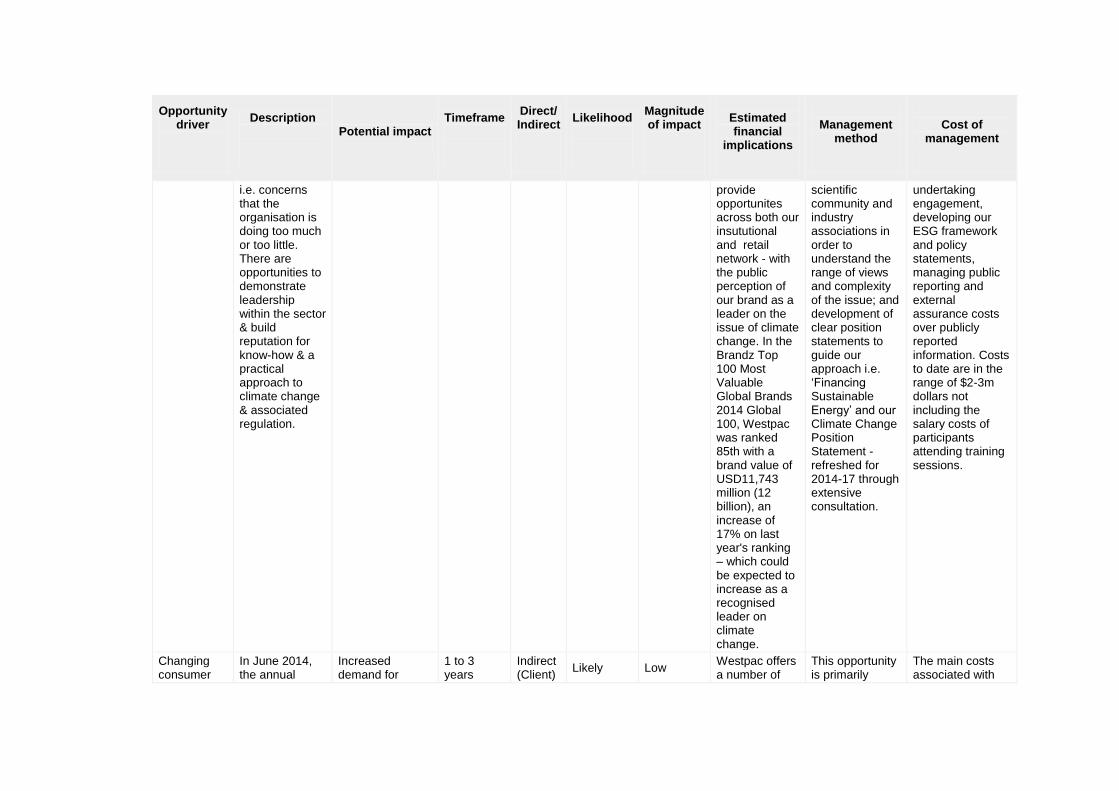
Opportunity driver
Description
Potential impact
Timeframe
Direct/ Indirect
Likelihood
Magnitude of impact
Estimated financial
implications
Management
method
Cost of
management
i.e. concerns that the organisation is doing too much or too little. There are opportunities to demonstrate leadership within the sector & build reputation for know-how & a practical approach to climate change & associated regulation.
provide opportunites across both our insututional and retail network - with the public perception of our brand as a leader on the issue of climate change. In the Brandz Top 100 Most Valuable Global Brands 2014 Global 100, Westpac was ranked 85th with a brand value of USD11,743 million (12 billion), an increase of 17% on last year's ranking – which could be expected to increase as a recognised leader on climate change.
scientific community and industry associations in order to understand the range of views and complexity of the issue; and development of clear position statements to guide our approach i.e. ‘Financing Sustainable Energy’ and our Climate Change Position Statement - refreshed for 2014-17 through extensive consultation.
undertaking engagement, developing our ESG framework and policy statements, managing public reporting and external assurance costs over publicly reported information. Costs to date are in the range of $2-3m dollars not including the salary costs of participants attending training sessions.
Changing consumer
In June 2014, the annual
Increased demand for
1 to 3 years
Indirect (Client)
Likely Low Westpac offers a number of
This opportunity is primarily
The main costs associated with
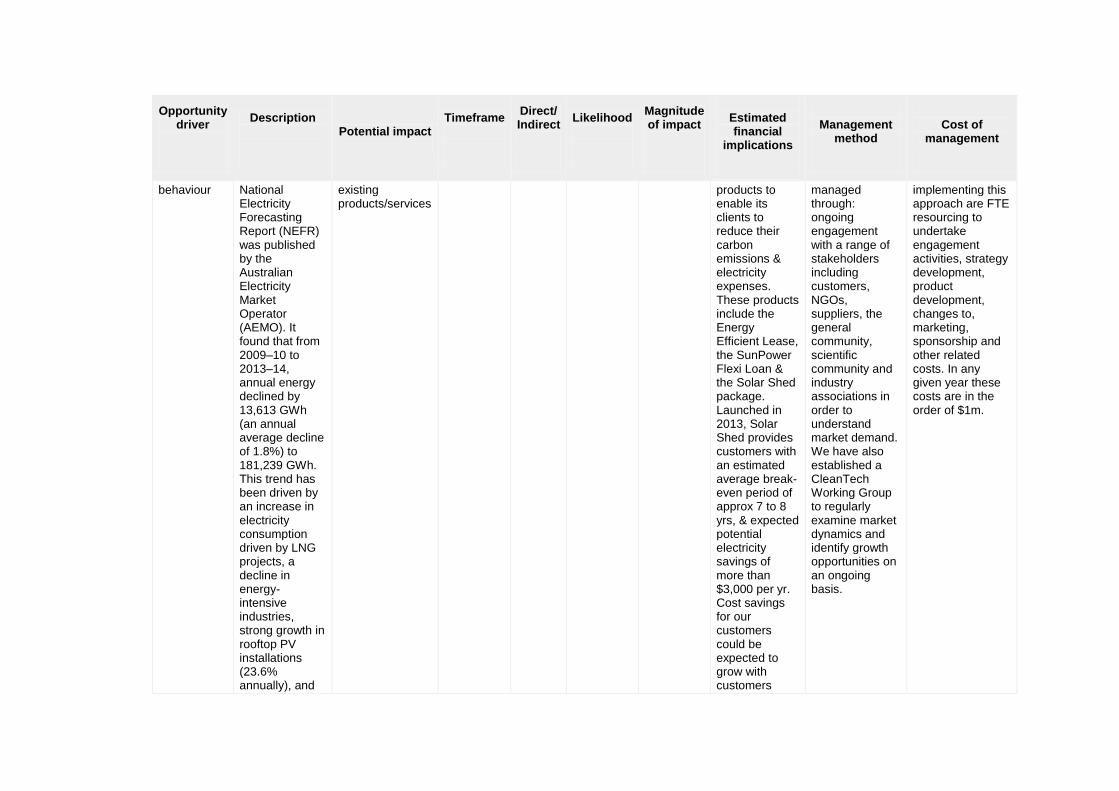
Opportunity driver
Description
Potential impact
Timeframe
Direct/ Indirect
Likelihood
Magnitude of impact
Estimated financial
implications
Management
method
Cost of
management
behaviour National Electricity Forecasting Report (NEFR) was published by the Australian Electricity Market Operator (AEMO). It found that from 2009–10 to 2013–14, annual energy declined by 13,613 GWh (an annual average decline of 1.8%) to 181,239 GWh. This trend has been driven by an increase in electricity consumption driven by LNG projects, a decline in energy-intensive industries, strong growth in rooftop PV installations (23.6% annually), and
existing products/services
products to enable its clients to reduce their carbon emissions & electricity expenses. These products include the Energy Efficient Lease, the SunPower Flexi Loan & the Solar Shed package. Launched in 2013, Solar Shed provides customers with an estimated average break-even period of approx 7 to 8 yrs, & expected potential electricity savings of more than $3,000 per yr. Cost savings for our customers could be expected to grow with customers
managed through: ongoing engagement with a range of stakeholders including customers, NGOs, suppliers, the general community, scientific community and industry associations in order to understand market demand. We have also established a CleanTech Working Group to regularly examine market dynamics and identify growth opportunities on an ongoing basis.
implementing this approach are FTE resourcing to undertake engagement activities, strategy development, product development, changes to, marketing, sponsorship and other related costs. In any given year these costs are in the order of $1m.
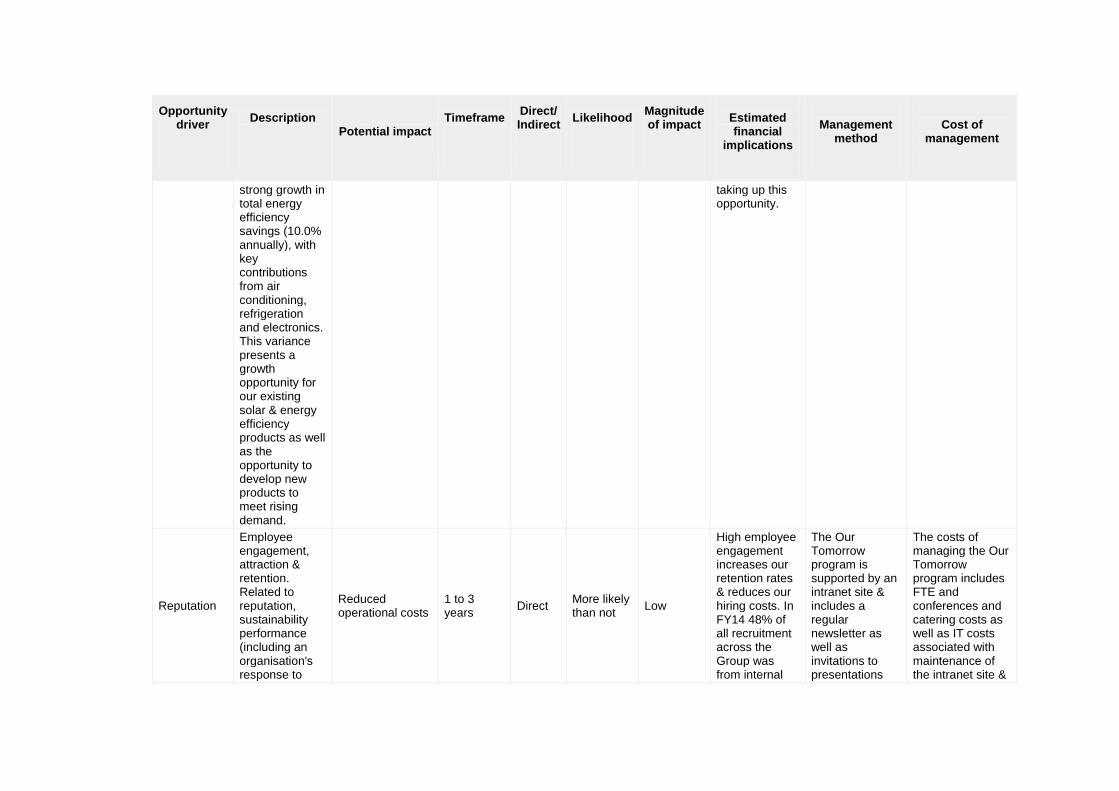
Opportunity driver
Description
Potential impact
Timeframe
Direct/ Indirect
Likelihood
Magnitude of impact
Estimated financial
implications
Management
method
Cost of
management
strong growth in total energy efficiency savings (10.0% annually), with key contributions from air conditioning, refrigeration and electronics. This variance presents a growth opportunity for our existing solar & energy efficiency products as well as the opportunity to develop new products to meet rising demand.
taking up this opportunity.
Reputation
Employee engagement, attraction & retention. Related to reputation, sustainability performance (including an organisation's response to
Reduced operational costs
1 to 3 years
Direct More likely than not
Low
High employee engagement increases our retention rates & reduces our hiring costs. In FY14 48% of all recruitment across the Group was from internal
The Our Tomorrow program is supported by an intranet site & includes a regular newsletter as well as invitations to presentations
The costs of managing the Our Tomorrow program includes FTE and conferences and catering costs as well as IT costs associated with maintenance of the intranet site &
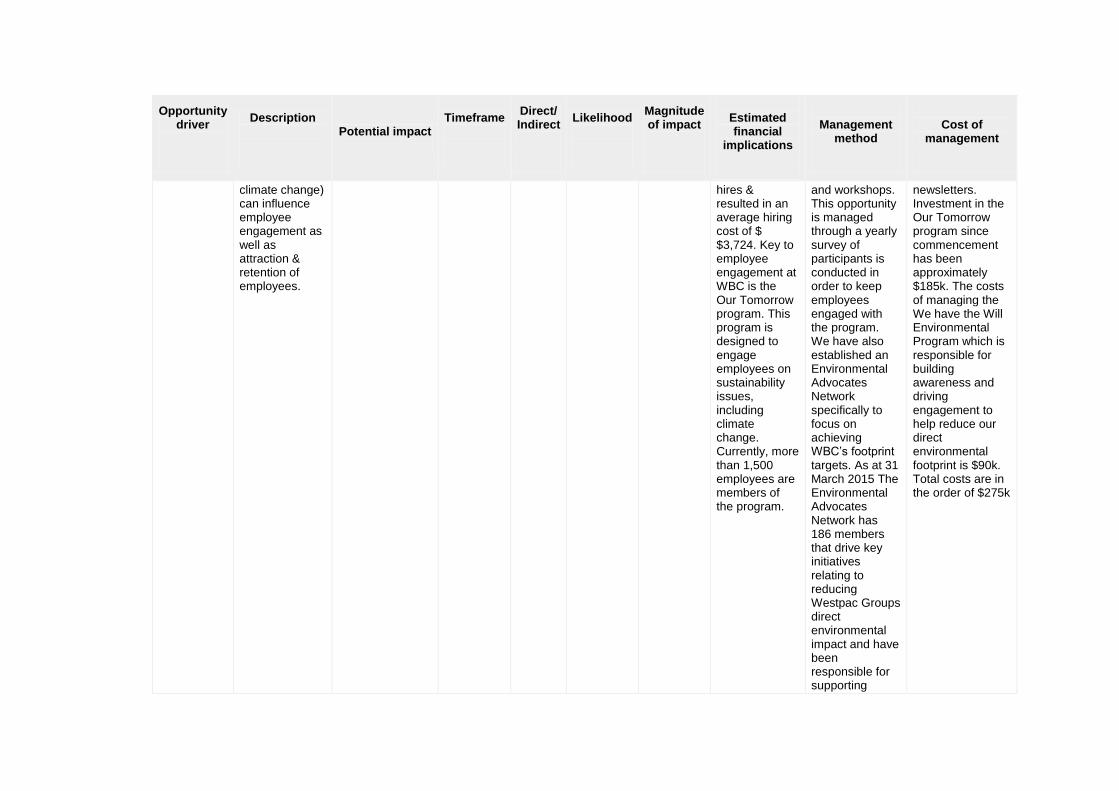
Opportunity driver
Description
Potential impact
Timeframe
Direct/ Indirect
Likelihood
Magnitude of impact
Estimated financial
implications
Management
method
Cost of
management
climate change) can influence employee engagement as well as attraction & retention of employees.
hires & resulted in an average hiring cost of $ $3,724. Key to employee engagement at WBC is the Our Tomorrow program. This program is designed to engage employees on sustainability issues, including climate change. Currently, more than 1,500 employees are members of the program.
and workshops. This opportunity is managed through a yearly survey of participants is conducted in order to keep employees engaged with the program. We have also established an Environmental Advocates Network specifically to focus on achieving WBC’s footprint targets. As at 31 March 2015 The Environmental Advocates Network has 186 members that drive key initiatives relating to reducing Westpac Groups direct environmental impact and have been responsible for supporting
newsletters. Investment in the Our Tomorrow program since commencement has been approximately $185k. The costs of managing the We have the Will Environmental Program which is responsible for building awareness and driving engagement to help reduce our direct environmental footprint is $90k. Total costs are in the order of $275k
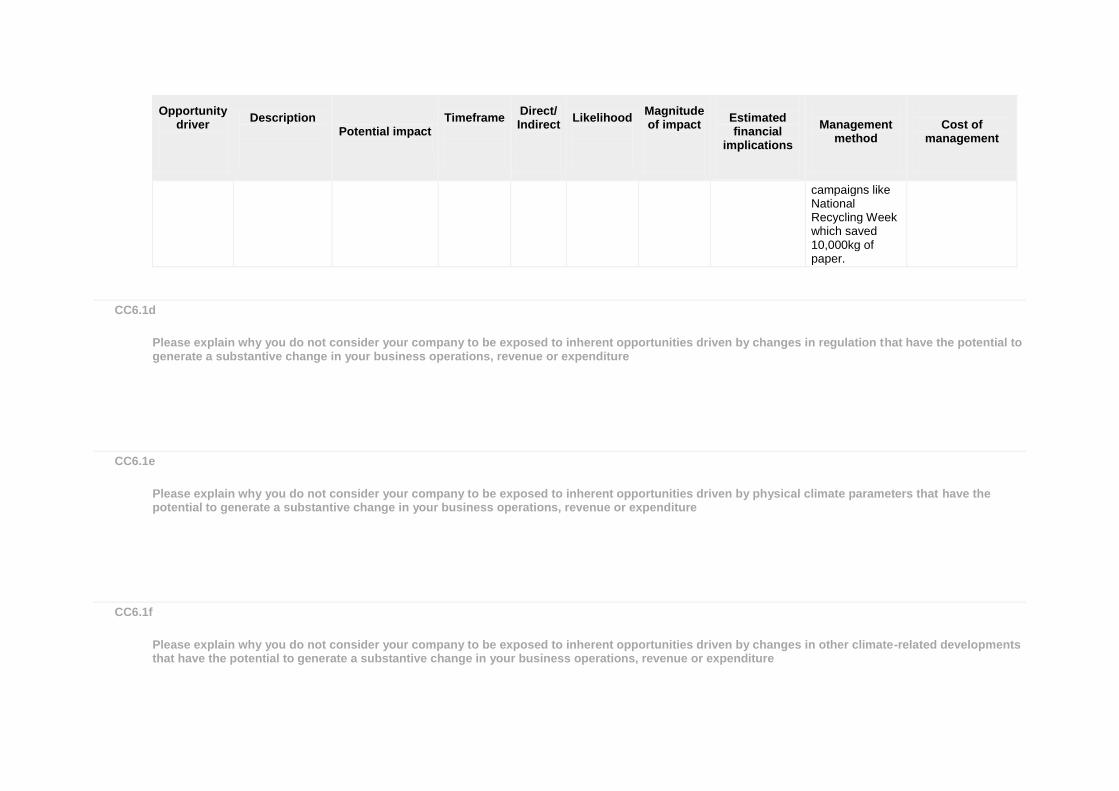
Opportunity driver
Description
Potential impact
Timeframe
Direct/ Indirect
Likelihood
Magnitude of impact
Estimated financial
implications
Management
method
Cost of
management
campaigns like National Recycling Week which saved 10,000kg of paper.
CC6.1d
Please explain why you do not consider your company to be exposed to inherent opportunities driven by changes in regulation that have the potential to generate a substantive change in your business operations, revenue or expenditure
CC6.1e
Please explain why you do not consider your company to be exposed to inherent opportunities driven by physical climate parameters that have the potential to generate a substantive change in your business operations, revenue or expenditure
CC6.1f
Please explain why you do not consider your company to be exposed to inherent opportunities driven by changes in other climate-related developments that have the potential to generate a substantive change in your business operations, revenue or expenditure

Further Information
Module: GHG Emissions Accounting, Energy and Fuel Use, and Trading
Page: CC7. Emissions Methodology
CC7.1
Please provide your base year and base year emissions (Scopes 1 and 2)
Scope
Base year
Base year emissions (metric tonnes CO2e)
Scope 1 Sun 01 Jul 2007 - Mon 30 Jun 2008
10823
Scope 2 Sun 01 Jul 2007 - Mon 30 Jun 2008
188780
CC7.2
Please give the name of the standard, protocol or methodology you have used to collect activity data and calculate Scope 1 and Scope 2 emissions
Please select the published methodologies that you use
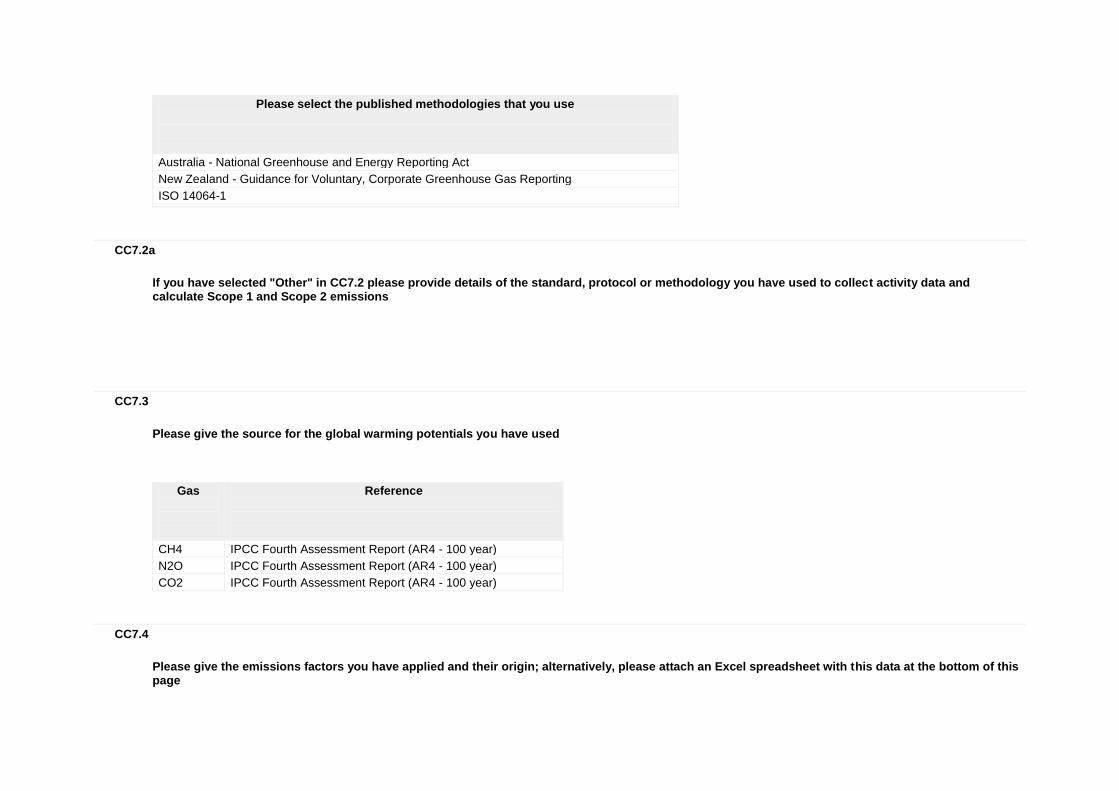
Please select the published methodologies that you use
Australia - National Greenhouse and Energy Reporting Act
New Zealand - Guidance for Voluntary, Corporate Greenhouse Gas Reporting
ISO 14064-1
CC7.2a
If you have selected "Other" in CC7.2 please provide details of the standard, protocol or methodology you have used to collect activity data and calculate Scope 1 and Scope 2 emissions
CC7.3
Please give the source for the global warming potentials you have used
Gas
Reference
CH4 IPCC Fourth Assessment Report (AR4 - 100 year)
N2O IPCC Fourth Assessment Report (AR4 - 100 year)
CO2 IPCC Fourth Assessment Report (AR4 - 100 year)
CC7.4
Please give the emissions factors you have applied and their origin; alternatively, please attach an Excel spreadsheet with this data at the bottom of this page
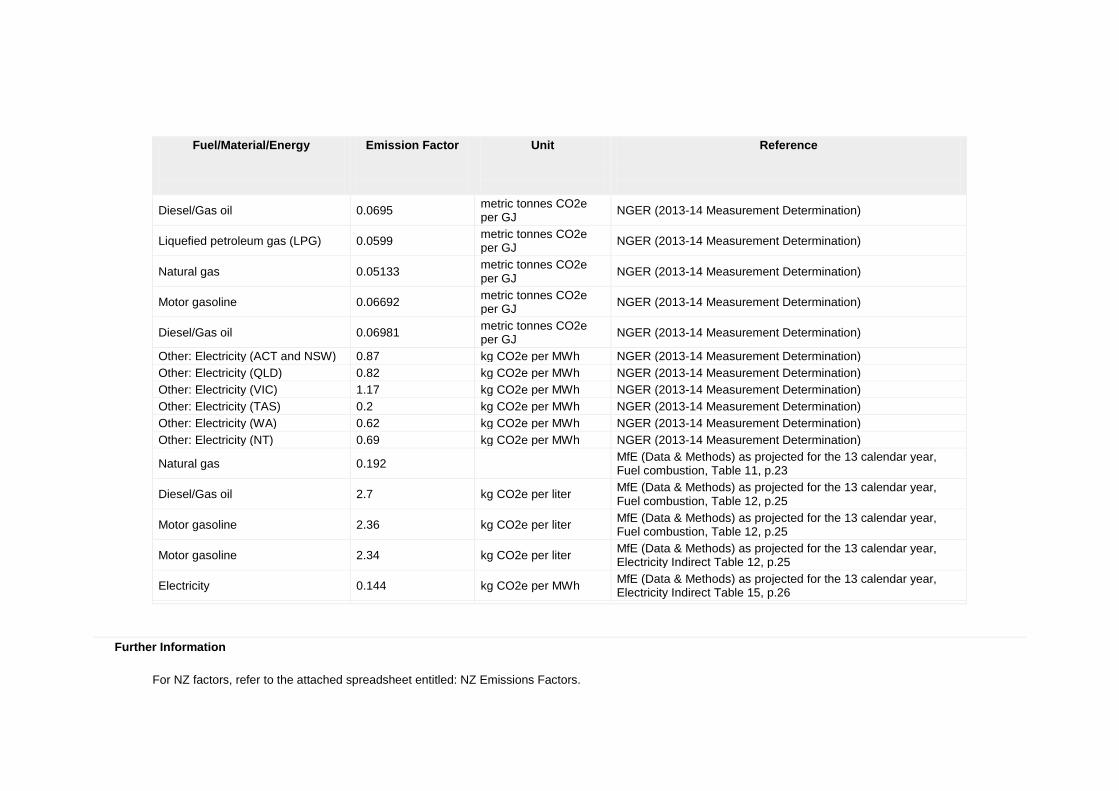
Fuel/Material/Energy
Emission Factor
Unit
Reference
Diesel/Gas oil 0.0695 metric tonnes CO2e per GJ
NGER (2013-14 Measurement Determination)
Liquefied petroleum gas (LPG) 0.0599 metric tonnes CO2e per GJ
NGER (2013-14 Measurement Determination)
Natural gas 0.05133 metric tonnes CO2e per GJ
NGER (2013-14 Measurement Determination)
Motor gasoline 0.06692 metric tonnes CO2e per GJ
NGER (2013-14 Measurement Determination)
Diesel/Gas oil 0.06981 metric tonnes CO2e per GJ
NGER (2013-14 Measurement Determination)
Other: Electricity (ACT and NSW) 0.87 kg CO2e per MWh NGER (2013-14 Measurement Determination)
Other: Electricity (QLD) 0.82 kg CO2e per MWh NGER (2013-14 Measurement Determination)
Other: Electricity (VIC) 1.17 kg CO2e per MWh NGER (2013-14 Measurement Determination)
Other: Electricity (TAS) 0.2 kg CO2e per MWh NGER (2013-14 Measurement Determination)
Other: Electricity (WA) 0.62 kg CO2e per MWh NGER (2013-14 Measurement Determination)
Other: Electricity (NT) 0.69 kg CO2e per MWh NGER (2013-14 Measurement Determination)
Natural gas 0.192
MfE (Data & Methods) as projected for the 13 calendar year, Fuel combustion, Table 11, p.23
Diesel/Gas oil 2.7 kg CO2e per liter MfE (Data & Methods) as projected for the 13 calendar year, Fuel combustion, Table 12, p.25
Motor gasoline 2.36 kg CO2e per liter MfE (Data & Methods) as projected for the 13 calendar year, Fuel combustion, Table 12, p.25
Motor gasoline 2.34 kg CO2e per liter MfE (Data & Methods) as projected for the 13 calendar year, Electricity Indirect Table 12, p.25
Electricity 0.144 kg CO2e per MWh MfE (Data & Methods) as projected for the 13 calendar year, Electricity Indirect Table 15, p.26
Further Information
For NZ factors, refer to the attached spreadsheet entitled: NZ Emissions Factors.

Attachments
https://www.cdp.net/sites/2015/51/19051/Climate Change 2015/Shared Documents/Attachments/ClimateChange2015/CC7.EmissionsMethodology/NZ Emissions Factors.xlsx
Page: CC8. Emissions Data - (1 Jul 2013 - 30 Jun 2014)
CC8.1
Please select the boundary you are using for your Scope 1 and 2 greenhouse gas inventory
Operational control
CC8.2
Please provide your gross global Scope 1 emissions figures in metric tonnes CO2e
11309
CC8.3
Please provide your gross global Scope 2 emissions figures in metric tonnes CO2e
168373
CC8.4

Are there are any sources (e.g. facilities, specific GHGs, activities, geographies, etc.) of Scope 1 and Scope 2 emissions that are within your selected reporting boundary which are not included in your disclosure?
Yes
CC8.4a
Please provide details of the sources of Scope 1 and Scope 2 emissions that are within your selected reporting boundary which are not included in your disclosure
Source
Relevance of
Scope 1 emissions from this source
Relevance of
Scope 2 emissions
excluded from this source
Explain why the source is excluded
US Sites Emissions are not relevant
Emissions are not relevant
US operations include only two small sites which are deemed not material in size.
Asian Sites Emissions are not relevant
Emissions are not relevant
Energy and Carbon data for Asian operations are deemed to be not material in size. This continues to be assessed as Westpac Group grows in the Asian region.
Incidental Emissions (e.g. Fire suppressants)
Emissions are not relevant
Emissions are not relevant
Minor sources deemed not material in size.
Refrigerants from retail sites
Emissions are not relevant
Emissions are not relevant
Retail sites are generally located in shopping strips or shopping centres. In the case of shopping strips, air conditioning systems are typically small and refrigerants are considered immaterial. For shopping centres, air conditioning is generally provided by base building equipment which serves the entire shopping centre and is outside Westpac's operational control and therefore outside our reporting boundary
CC8.5
Please estimate the level of uncertainty of the total gross global Scope 1 and 2 emissions figures that you have supplied and specify the sources of uncertainty in your data gathering, handling and calculations

Scope
Uncertainty range
Main sources of
uncertainty
Please expand on the uncertainty in your data
Scope 1
More than 2% but less than or equal to 5%
Data Gaps Assumptions Extrapolation Metering/ Measurement Constraints
Assumptions: 1. Metering equipment is calibrated and maintained. 2. All sources of fuel and all accounts are identified. 3. All fuel purchased is captured by accounts and correctly coded 4. Invoices from energy provider are an accurate reflection of fuel used. Extrapolation: 1. Where invoices are late or missing, an approximation (based on historical consumption) is used. Data Gaps: 1. For un-metered sites, energy use is estimated based on averages for that facility type. Metering / Measurement constraints: 1. Accuracy of data is limited by the accuracy of metering equipment and ability of personnel to read meters accurately. Where data is available through multiple channels, eg time of use or flow meters and monthly invoices, data from these channels is reconciled to check for errors in the invoice and /or metering equipment
Scope 2
More than 2% but less than or equal to 5%
Data Gaps Assumptions Extrapolation Metering/ Measurement Constraints
Assumptions: 1. Metering equipment is calibrated and maintained. 2. All sources of fuel and all accounts are identified. 3. All fuel purchased is captured by accounts and correctly coded 4. Invoices from energy provider are an accurate reflection of fuel used. Extrapolation: 1. Where invoices are late or missing, an approximation (based on historical consumption) is used. Data Gaps: 1. For un-metered sites, energy use is estimated based on averages for that facility type. Metering / Measurement constraints: 1. Accuracy of data is limited by the accuracy of metering equipment and ability of personnel to read meters accurately. Where data is available through multiple channels, eg time of use or flow meters and monthly invoices, data from these channels is reconciled to check for errors in the invoice and /or metering equipment.
CC8.6
Please indicate the verification/assurance status that applies to your reported Scope 1 emissions
Third party verification or assurance complete
CC8.6a
Please provide further details of the verification/assurance undertaken for your Scope 1 emissions, and attach the relevant statements
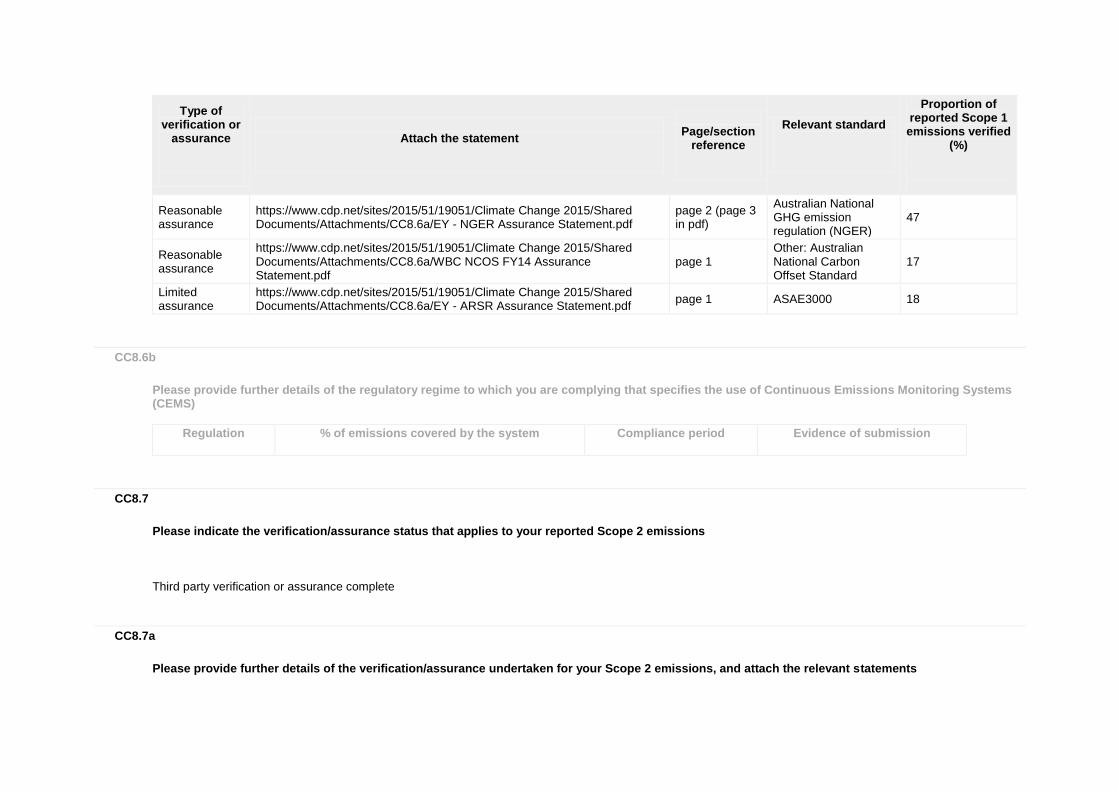
Type of verification or
assurance
Attach the statement
Page/section
reference
Relevant standard
Proportion of reported Scope 1
emissions verified (%)
Reasonable assurance
https://www.cdp.net/sites/2015/51/19051/Climate Change 2015/Shared Documents/Attachments/CC8.6a/EY - NGER Assurance Statement.pdf
page 2 (page 3 in pdf)
Australian National GHG emission regulation (NGER)
47
Reasonable assurance
https://www.cdp.net/sites/2015/51/19051/Climate Change 2015/Shared Documents/Attachments/CC8.6a/WBC NCOS FY14 Assurance Statement.pdf
page 1 Other: Australian National Carbon Offset Standard
17
Limited assurance
https://www.cdp.net/sites/2015/51/19051/Climate Change 2015/Shared Documents/Attachments/CC8.6a/EY - ARSR Assurance Statement.pdf
page 1 ASAE3000 18
CC8.6b
Please provide further details of the regulatory regime to which you are complying that specifies the use of Continuous Emissions Monitoring Systems (CEMS)
Regulation
% of emissions covered by the system
Compliance period
Evidence of submission
CC8.7
Please indicate the verification/assurance status that applies to your reported Scope 2 emissions
Third party verification or assurance complete
CC8.7a
Please provide further details of the verification/assurance undertaken for your Scope 2 emissions, and attach the relevant statements

Type of verification or
assurance
Attach the statement
Page/Section reference
Relevant standard
Proportion of
reported Scope 2 emissions verified
(%)
Reasonable assurance
https://www.cdp.net/sites/2015/51/19051/Climate Change 2015/Shared Documents/Attachments/CC8.7a/EY - NGER Assurance Statement.pdf
Page 2 (page 3 in pdf)
Australian National GHG emission regulation (NGER)
97
Limited assurance
https://www.cdp.net/sites/2015/51/19051/Climate Change 2015/Shared Documents/Attachments/CC8.7a/EY - ARSR Assurance Statement.pdf
page 1 ASAE3000 2
CC8.8
Please identify if any data points have been verified as part of the third party verification work undertaken, other than the verification of emissions figures reported in CC8.6, CC8.7 and CC14.2
Additional data points verified
Comment
Year on year change in emissions (Scope 1 and 2)
As part of the Australian and New Zealand assurance process, year on year changes in Scope 1 and 2 emissions are assessed and where necessary, significant movements are noted in the Environmental Factpac
Year on year change in emissions (Scope 3)
As part of the Australian and New Zealand assurance process, year on year changes in Scope 3 emissions are assessed and where necessary, significant movements are noted in the Environmental Factpac
Progress against emission reduction target
The Westpac Group has a public target to remain Carbon Neutral for the life of our current Sustainability Strategy, to improve electricity efficiency of our Australian and New Zealand operations by 10% by 2017, to improve the energy efficiency of our Data Centres, increase recycling rates to 75%, to reduce Scope 1 and 2 emissions by 10% and reduce paper use by 5%. Progress against these targets is assured by third party auditors each year.
Emissions reduction activities
Under the Carbon Neutral program (Australia and New Zealand), the Westpac group must identify energy / emission reduction activities. This data is subjected to limited assurance each year.
Year on year emissions intensity figure
As part of the Australian and New Zealand assurance process, year on year emission intensities are assessed to check for anomalies.

CC8.9
Are carbon dioxide emissions from biologically sequestered carbon relevant to your organization?
No
CC8.9a
Please provide the emissions from biologically sequestered carbon relevant to your organization in metric tonnes CO2
Further Information
Page: CC9. Scope 1 Emissions Breakdown - (1 Jul 2013 - 30 Jun 2014)
CC9.1
Do you have Scope 1 emissions sources in more than one country?
Yes
CC9.1a
Please break down your total gross global Scope 1 emissions by country/region
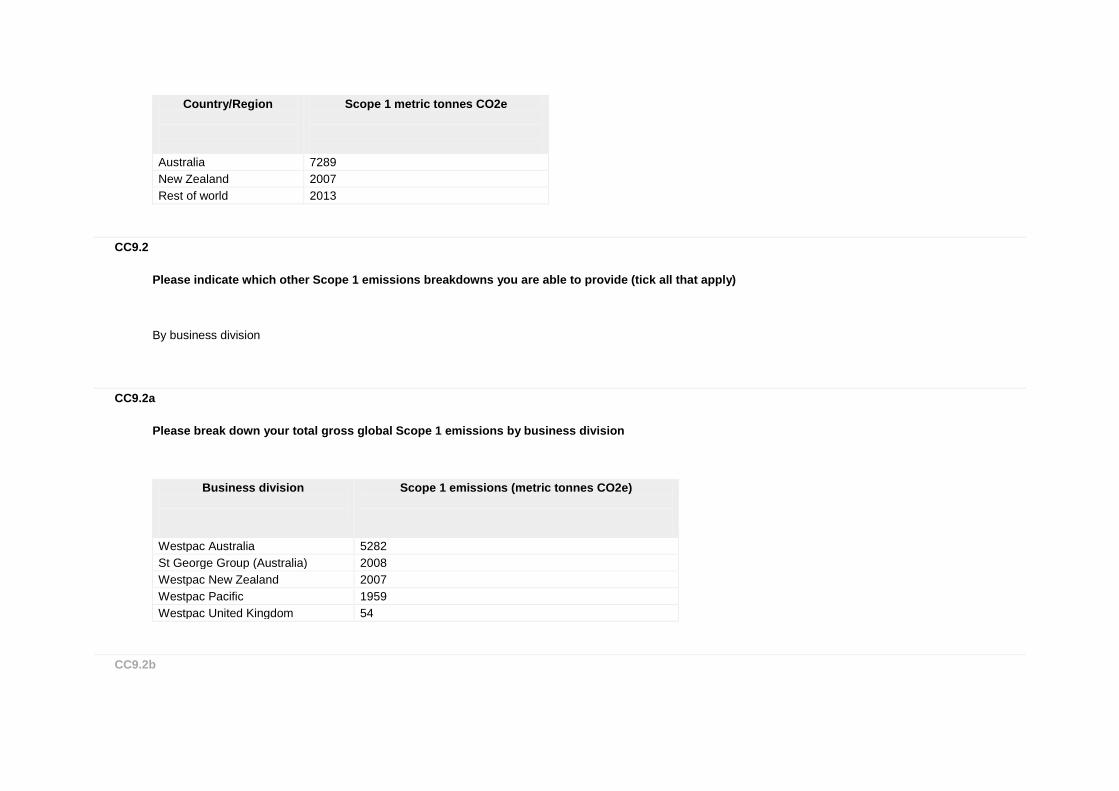
Country/Region
Scope 1 metric tonnes CO2e
Australia 7289
New Zealand 2007
Rest of world 2013
CC9.2
Please indicate which other Scope 1 emissions breakdowns you are able to provide (tick all that apply)
By business division
CC9.2a
Please break down your total gross global Scope 1 emissions by business division
Business division
Scope 1 emissions (metric tonnes CO2e)
Westpac Australia 5282
St George Group (Australia) 2008
Westpac New Zealand 2007
Westpac Pacific 1959
Westpac United Kingdom 54
CC9.2b

Please break down your total gross global Scope 1 emissions by facility
Facility
Scope 1 emissions (metric tonnes CO2e)
Latitude
Longitude
CC9.2c
Please break down your total gross global Scope 1 emissions by GHG type
GHG type
Scope 1 emissions (metric tonnes CO2e)
CC9.2d
Please break down your total gross global Scope 1 emissions by activity
Activity
Scope 1 emissions (metric tonnes CO2e)
CC9.2e
Please break down your total gross global Scope 1 emissions by legal structure
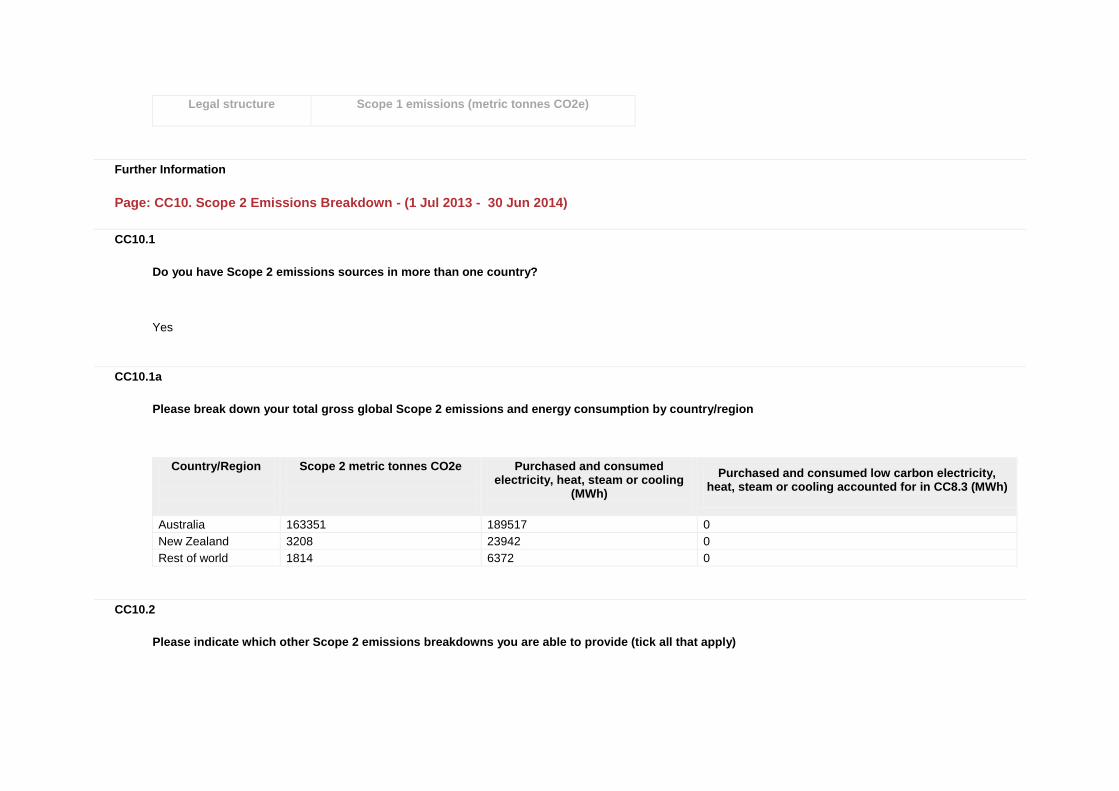
Legal structure
Scope 1 emissions (metric tonnes CO2e)
Further Information
Page: CC10. Scope 2 Emissions Breakdown - (1 Jul 2013 - 30 Jun 2014)
CC10.1
Do you have Scope 2 emissions sources in more than one country?
Yes
CC10.1a
Please break down your total gross global Scope 2 emissions and energy consumption by country/region
Country/Region
Scope 2 metric tonnes CO2e
Purchased and consumed electricity, heat, steam or cooling
(MWh)
Purchased and consumed low carbon electricity, heat, steam or cooling accounted for in CC8.3 (MWh)
Australia 163351 189517 0
New Zealand 3208 23942 0
Rest of world 1814 6372 0
CC10.2
Please indicate which other Scope 2 emissions breakdowns you are able to provide (tick all that apply)

By business division
CC10.2a
Please break down your total gross global Scope 2 emissions by business division
Business division
Scope 2 emissions (metric tonnes CO2e)
Westpac Australia 112946
St George Group (Australia) 49202
Australian Subsidiaries 1008
Australian Property Trusts 195
Westpac New Zealand 3208
Westpac Pacific 1387
UK 427
CC10.2b
Please break down your total gross global Scope 2 emissions by facility
Facility
Scope 2 emissions (metric tonnes CO2e)
CC10.2c
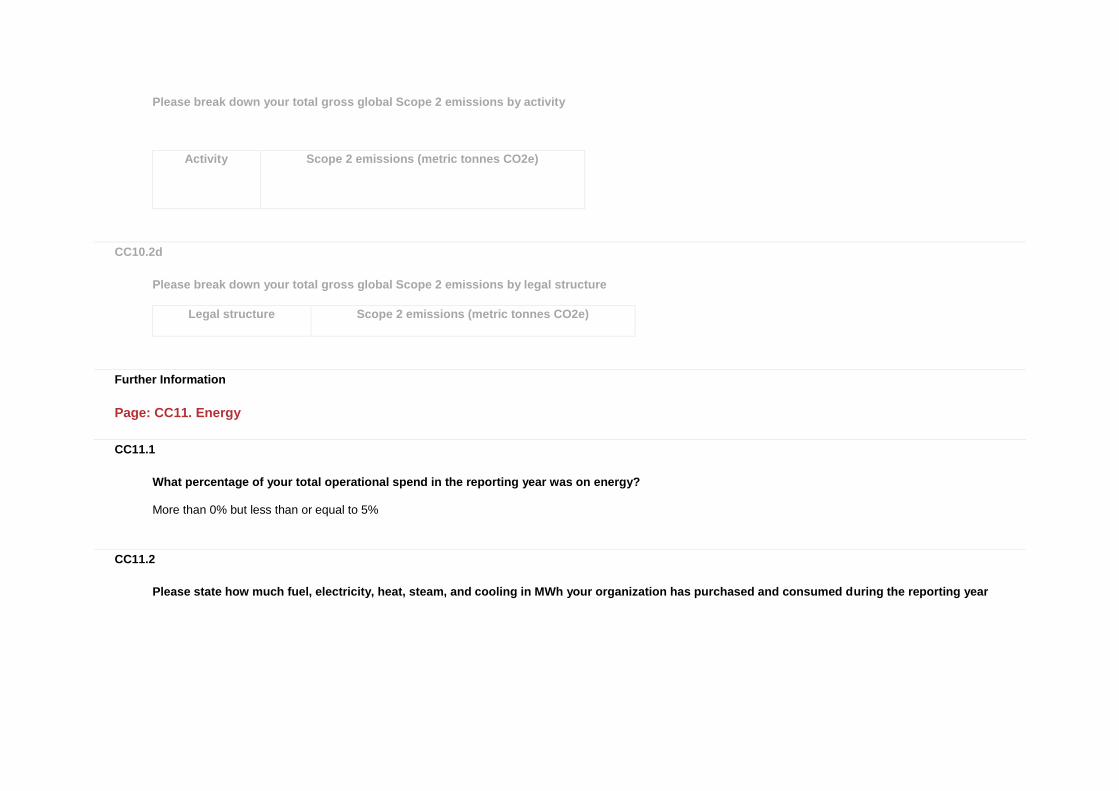
Please break down your total gross global Scope 2 emissions by activity
Activity
Scope 2 emissions (metric tonnes CO2e)
CC10.2d
Please break down your total gross global Scope 2 emissions by legal structure
Legal structure
Scope 2 emissions (metric tonnes CO2e)
Further Information
Page: CC11. Energy
CC11.1
What percentage of your total operational spend in the reporting year was on energy?
More than 0% but less than or equal to 5%
CC11.2
Please state how much fuel, electricity, heat, steam, and cooling in MWh your organization has purchased and consumed during the reporting year
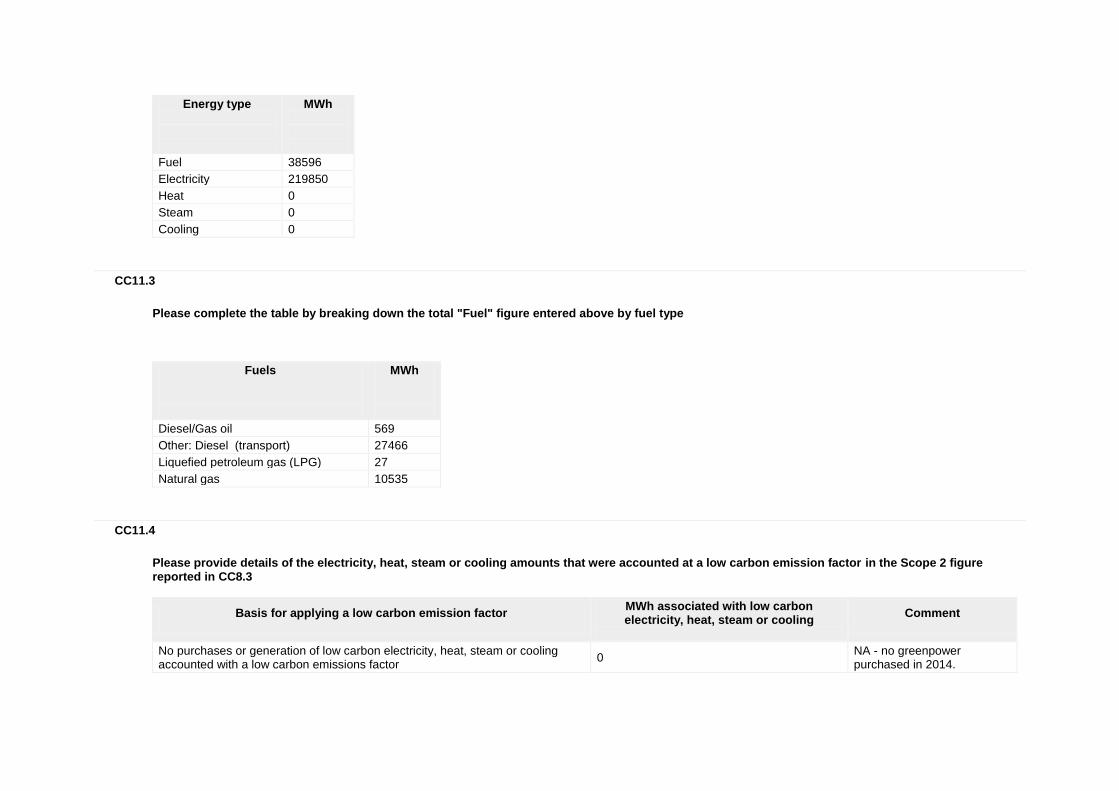
Energy type
MWh
Fuel 38596
Electricity 219850
Heat 0
Steam 0
Cooling 0
CC11.3
Please complete the table by breaking down the total "Fuel" figure entered above by fuel type
Fuels
MWh
Diesel/Gas oil 569
Other: Diesel (transport) 27466
Liquefied petroleum gas (LPG) 27
Natural gas 10535
CC11.4
Please provide details of the electricity, heat, steam or cooling amounts that were accounted at a low carbon emission factor in the Scope 2 figure reported in CC8.3
Basis for applying a low carbon emission factor
MWh associated with low carbon electricity, heat, steam or cooling
Comment
No purchases or generation of low carbon electricity, heat, steam or cooling accounted with a low carbon emissions factor
0 NA - no greenpower purchased in 2014.
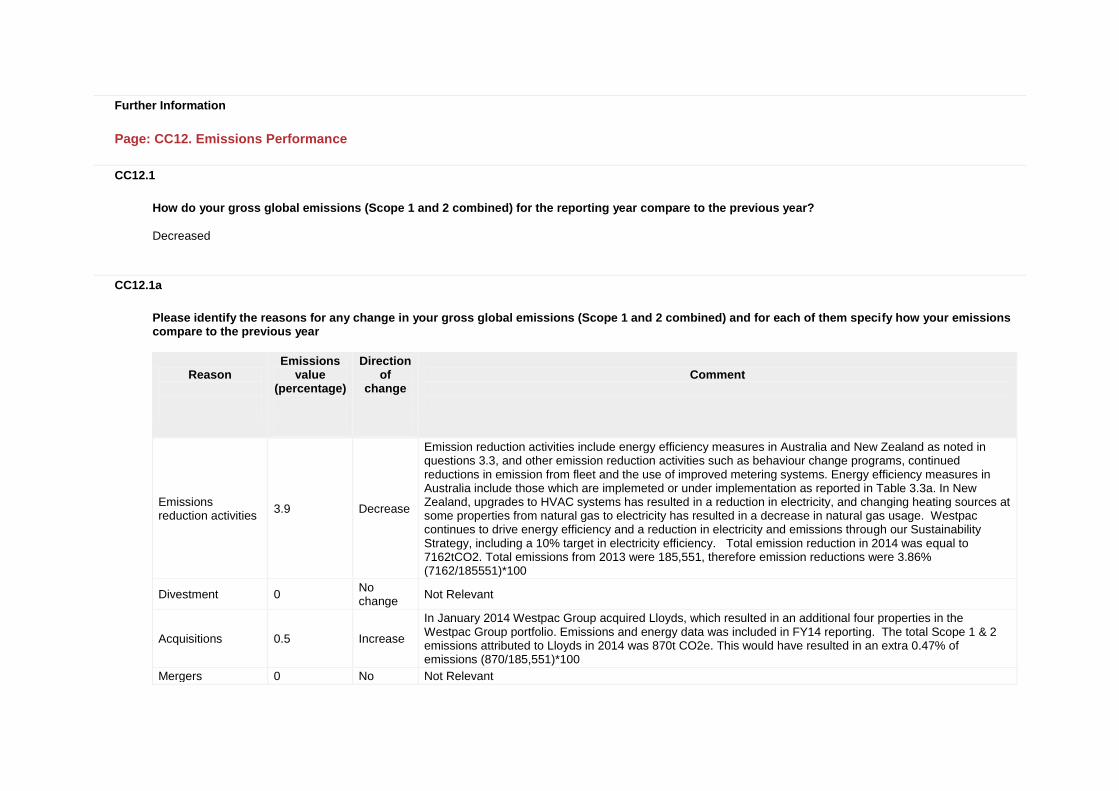
Further Information
Page: CC12. Emissions Performance
CC12.1
How do your gross global emissions (Scope 1 and 2 combined) for the reporting year compare to the previous year?
Decreased
CC12.1a
Please identify the reasons for any change in your gross global emissions (Scope 1 and 2 combined) and for each of them specify how your emissions compare to the previous year
Reason
Emissions value
(percentage)
Direction of
change
Comment
Emissions reduction activities
3.9 Decrease
Emission reduction activities include energy efficiency measures in Australia and New Zealand as noted in questions 3.3, and other emission reduction activities such as behaviour change programs, continued reductions in emission from fleet and the use of improved metering systems. Energy efficiency measures in Australia include those which are implemeted or under implementation as reported in Table 3.3a. In New Zealand, upgrades to HVAC systems has resulted in a reduction in electricity, and changing heating sources at some properties from natural gas to electricity has resulted in a decrease in natural gas usage. Westpac continues to drive energy efficiency and a reduction in electricity and emissions through our Sustainability Strategy, including a 10% target in electricity efficiency. Total emission reduction in 2014 was equal to 7162tCO2. Total emissions from 2013 were 185,551, therefore emission reductions were 3.86% (7162/185551)*100
Divestment 0 No change
Not Relevant
Acquisitions 0.5 Increase
In January 2014 Westpac Group acquired Lloyds, which resulted in an additional four properties in the Westpac Group portfolio. Emissions and energy data was included in FY14 reporting. The total Scope 1 & 2 emissions attributed to Lloyds in 2014 was 870t CO2e. This would have resulted in an extra 0.47% of emissions (870/185,551)*100
Mergers 0 No Not Relevant
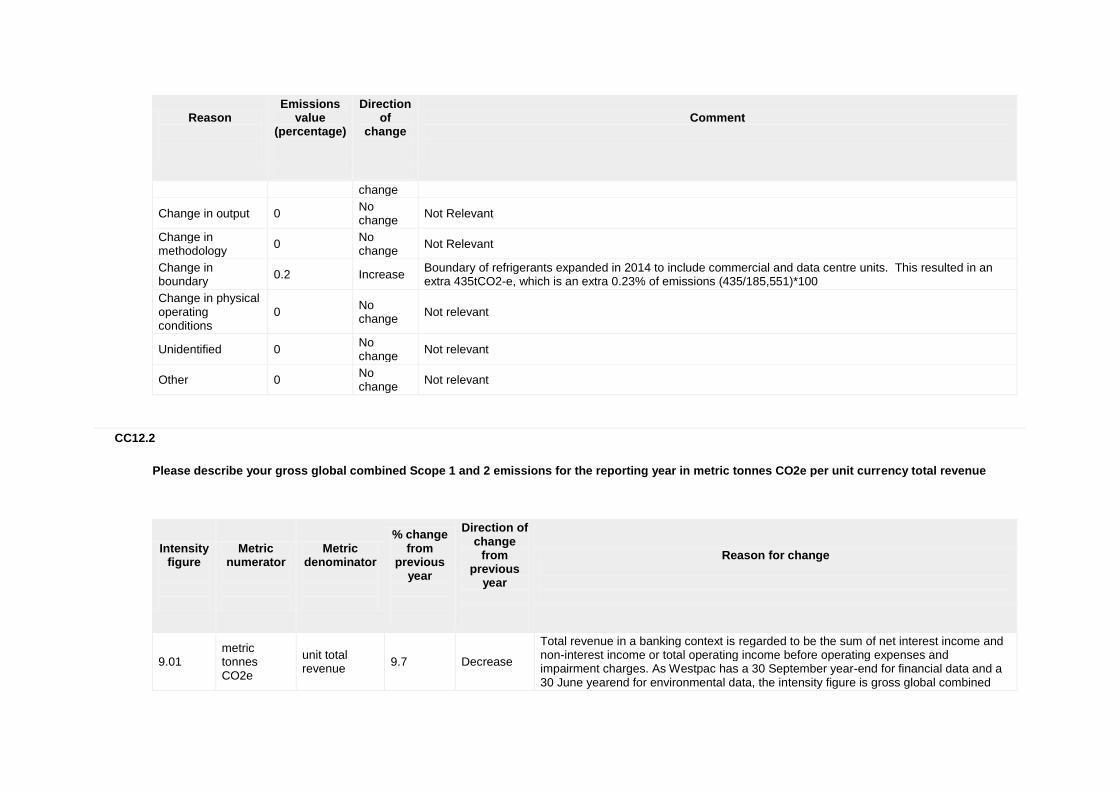
Reason
Emissions value
(percentage)
Direction of
change
Comment
change
Change in output 0 No change
Not Relevant
Change in methodology
0 No change
Not Relevant
Change in boundary
0.2 Increase Boundary of refrigerants expanded in 2014 to include commercial and data centre units. This resulted in an extra 435tCO2-e, which is an extra 0.23% of emissions (435/185,551)*100
Change in physical operating conditions
0 No change
Not relevant
Unidentified 0 No change
Not relevant
Other 0 No change
Not relevant
CC12.2
Please describe your gross global combined Scope 1 and 2 emissions for the reporting year in metric tonnes CO2e per unit currency total revenue
Intensity figure
Metric numerator
Metric denominator
% change from
previous year
Direction of change
from previous
year
Reason for change
9.01 metric tonnes CO2e
unit total revenue
9.7 Decrease
Total revenue in a banking context is regarded to be the sum of net interest income and non-interest income or total operating income before operating expenses and impairment charges. As Westpac has a 30 September year-end for financial data and a 30 June yearend for environmental data, the intensity figure is gross global combined

Intensity figure
Metric numerator
Metric denominator
% change from
previous year
Direction of change
from previous
year
Reason for change
Scope 1 and 2 emissions in metric tonnes CO2e as at 30 June 2014 divided by total revenue (million $) as at 30 September 2014. The decrease from 9.96 to 9.01 between 2013 and 2014 can be attributed to a decrease in Scope 1 and 2 emissions as a result of emission reduction activities (refer to questions 3.3 and 12.1) although an increase in total revenue has also had a slight impact on this ratio (less than 10%).
CC12.3
Please describe your gross global combined Scope 1 and 2 emissions for the reporting year in metric tonnes CO2e per full time equivalent (FTE) employee
Intensity figure
Metric numerator
Metric denominator
% change from
previous year
Direction of change
from previous
year
Reason for change
5.35 metric tonnes CO2e
FTE employee
4.7 Decrease
As WBC has a 30 September year-end for financial data and a 30 June year-end for environmental data, the intensity figure is gross global combined Scope 1 and 2 emissions in metric tonnes CO2e divided by full time equivalent staff as at 30 September 2014. The decrease from 5.62 to 5.35 between 2013 and 2014 can primarily be attributed to a decrease in Scope 1 and 2 emissions as a result of emission reduction activities, with only a very small increase in underlying FTE.
CC12.4

Please provide an additional intensity (normalized) metric that is appropriate to your business operations
Intensity figure
Metric numerator
Metric denominator
% change from previous
year
Direction of change from previous year
Reason for change
0.209 metric tonnes CO2e
Other: Net Lettable Area (m2)
2.5 Decrease Continued efforts across Westpac Group to meet our FY17 target of reducing electricity per m2 by 10% including energy efficiency measures as shown in question 3.3.
Further Information
Page: CC13. Emissions Trading
CC13.1
Do you participate in any emissions trading schemes?
No, and we do not currently anticipate doing so in the next 2 years
CC13.1a
Please complete the following table for each of the emission trading schemes in which you participate
Scheme name
Period for which data is supplied
Allowances allocated
Allowances purchased
Verified emissions in metric tonnes CO2e
Details of ownership
CC13.1b
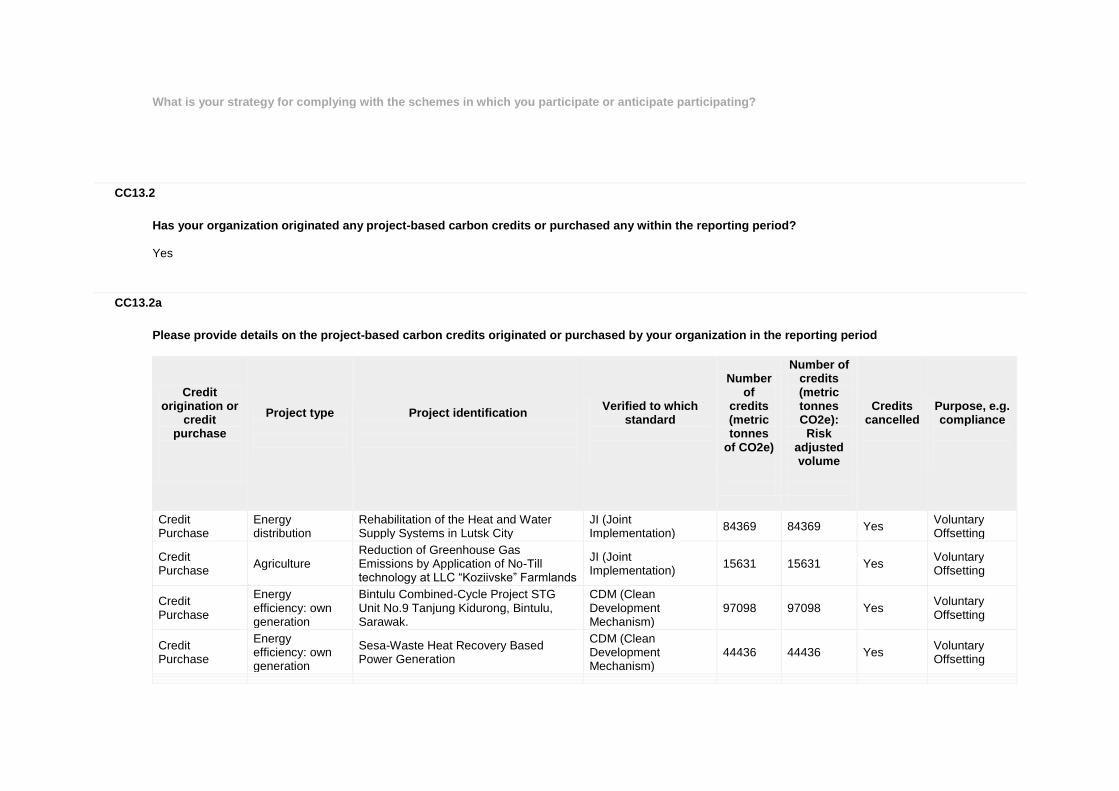
What is your strategy for complying with the schemes in which you participate or anticipate participating?
CC13.2
Has your organization originated any project-based carbon credits or purchased any within the reporting period?
Yes
CC13.2a
Please provide details on the project-based carbon credits originated or purchased by your organization in the reporting period
Credit origination or
credit purchase
Project type
Project identification
Verified to which standard
Number of
credits (metric tonnes
of CO2e)
Number of credits (metric tonnes CO2e):
Risk adjusted volume
Credits cancelled
Purpose, e.g. compliance
Credit Purchase
Energy distribution
Rehabilitation of the Heat and Water Supply Systems in Lutsk City
JI (Joint Implementation)
84369 84369 Yes Voluntary Offsetting
Credit Purchase
Agriculture Reduction of Greenhouse Gas Emissions by Application of No-Till technology at LLC “Koziivske” Farmlands
JI (Joint Implementation)
15631 15631 Yes Voluntary Offsetting
Credit Purchase
Energy efficiency: own generation
Bintulu Combined-Cycle Project STG Unit No.9 Tanjung Kidurong, Bintulu, Sarawak.
CDM (Clean Development Mechanism)
97098 97098 Yes Voluntary Offsetting
Credit Purchase
Energy efficiency: own generation
Sesa-Waste Heat Recovery Based Power Generation
CDM (Clean Development Mechanism)
44436 44436 Yes Voluntary Offsetting
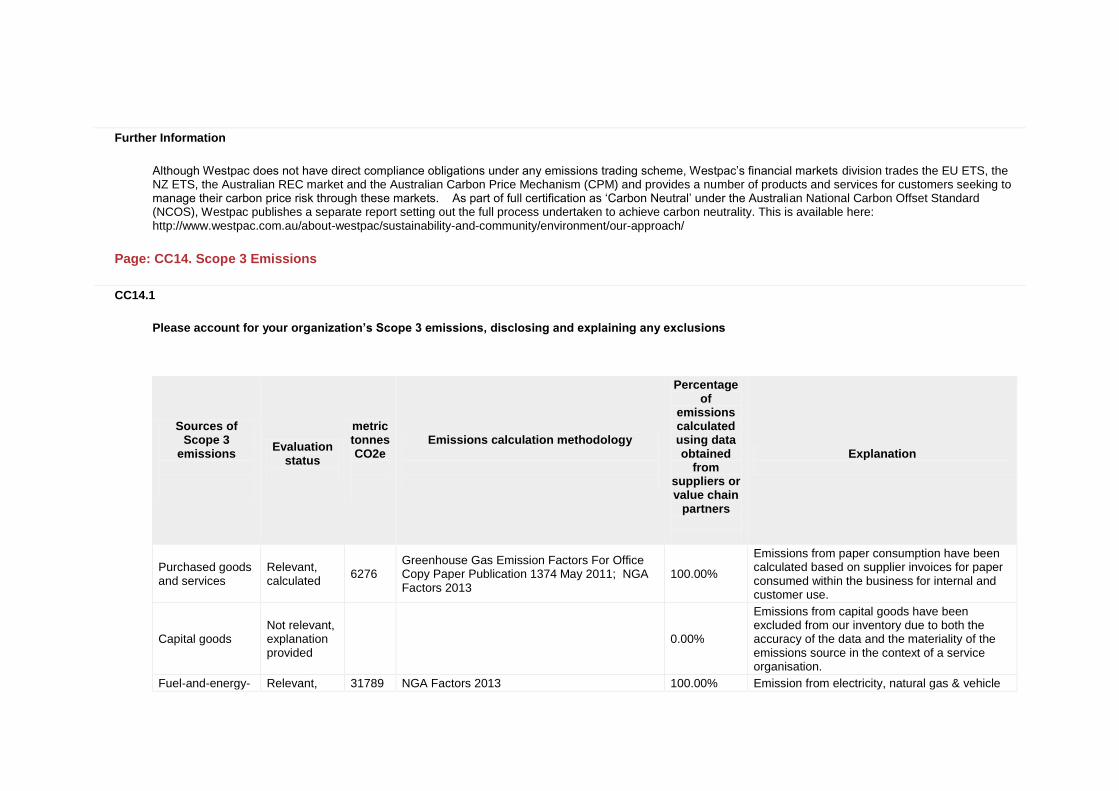
Further Information
Although Westpac does not have direct compliance obligations under any emissions trading scheme, Westpac’s financial markets division trades the EU ETS, the NZ ETS, the Australian REC market and the Australian Carbon Price Mechanism (CPM) and provides a number of products and services for customers seeking to manage their carbon price risk through these markets. As part of full certification as ‘Carbon Neutral’ under the Australian National Carbon Offset Standard (NCOS), Westpac publishes a separate report setting out the full process undertaken to achieve carbon neutrality. This is available here: http://www.westpac.com.au/about-westpac/sustainability-and-community/environment/our-approach/
Page: CC14. Scope 3 Emissions
CC14.1
Please account for your organization’s Scope 3 emissions, disclosing and explaining any exclusions
Sources of Scope 3
emissions
Evaluation status
metric tonnes CO2e
Emissions calculation methodology
Percentage of
emissions calculated using data obtained
from suppliers or value chain
partners
Explanation
Purchased goods and services
Relevant, calculated
6276 Greenhouse Gas Emission Factors For Office Copy Paper Publication 1374 May 2011; NGA Factors 2013
100.00%
Emissions from paper consumption have been calculated based on supplier invoices for paper consumed within the business for internal and customer use.
Capital goods Not relevant, explanation provided
0.00%
Emissions from capital goods have been excluded from our inventory due to both the accuracy of the data and the materiality of the emissions source in the context of a service organisation.
Fuel-and-energy- Relevant, 31789 NGA Factors 2013 100.00% Emission from electricity, natural gas & vehicle

Sources of Scope 3
emissions
Evaluation status
metric tonnes CO2e
Emissions calculation methodology
Percentage of
emissions calculated using data obtained
from suppliers or value chain
partners
Explanation
related activities (not included in Scope 1 or 2)
calculated fleet transmission and distribution losses were calculated based on consumption data from supplier invoices.
Upstream transportation and distribution
Not relevant, explanation provided
0.00%
Emissions from upstream transportation and distribution have been excluded from our inventory due to both the accuracy of the data and the materiality of the emissions source in the context of a service organisation.
Waste generated in operations
Relevant, calculated
2435 Greenhouse Gas Emission Factors For Office Copy Paper Publication 1374 May 2011; NGA Factors 2012
80.00%
Emissions from waste disposal in Australia have been calculated based on waste volume generated as per waste contractor statements. In New Zealand, emissions from waste were calculated based on waste audits conducted at all commercial offices and approximately 45% of retail branches. The average figure for retail sites was then uplifted by 10% to estimate data for non-audited retail sites.
Business travel Relevant, calculated
12469
2013 Guidelines to Defra / DECC's GHG Conversion Factors for Company Reporting: Greenhouse Gas Conversion Factor Repository; DCF Carbon Factors Spreadsheet; Emission factors for all air passengers transport for 2013 GHG Without RF Conversion Factors; GHG Protocol-Mobile Guide on calculating CO2 emissions from mobile sources; Australian Government Green Vehicle Guide
100.00% Emissions from air travel, fleet, rental cars, taxi usage and hotel occupancy were calculated based on supplier reports.
Employee commuting
Not relevant, explanation provided
Emissions from transportation of employees between their homes and WBC in vehicles not owned or operated by WBC is excluded from our inventory due to both the accuracy of the
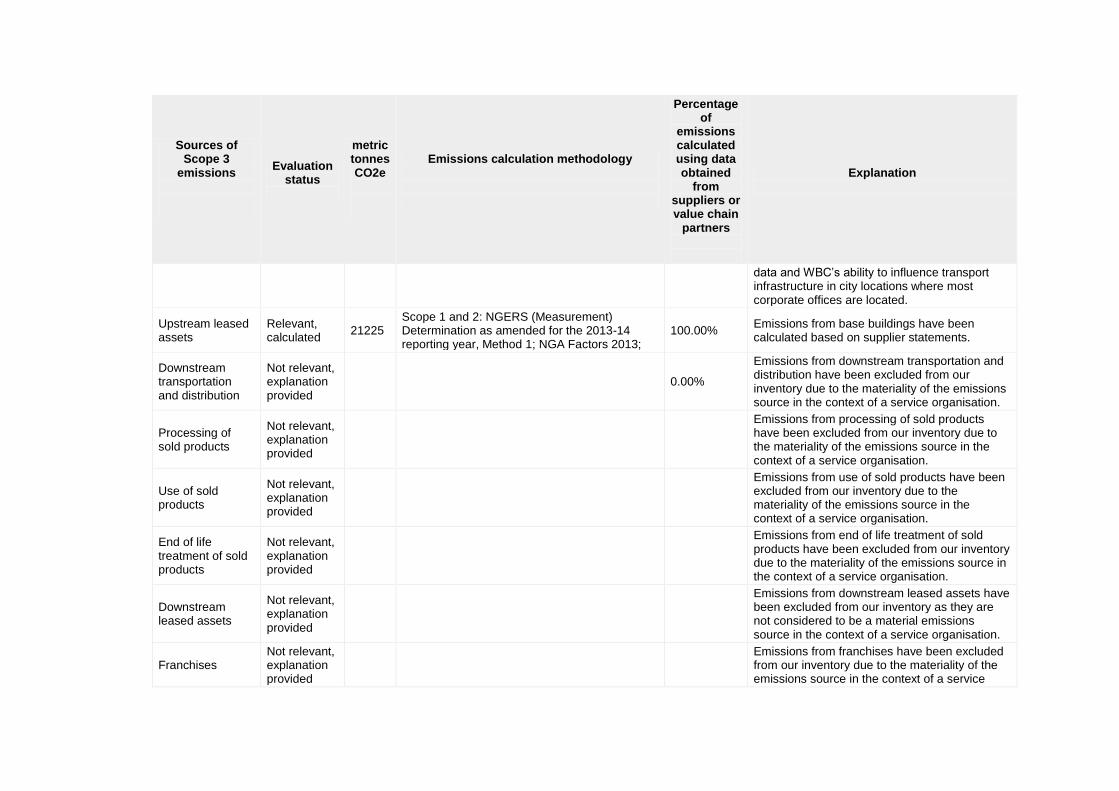
Sources of Scope 3
emissions
Evaluation status
metric tonnes CO2e
Emissions calculation methodology
Percentage of
emissions calculated using data obtained
from suppliers or value chain
partners
Explanation
data and WBC’s ability to influence transport infrastructure in city locations where most corporate offices are located.
Upstream leased assets
Relevant, calculated
21225 Scope 1 and 2: NGERS (Measurement) Determination as amended for the 2013-14 reporting year, Method 1; NGA Factors 2013;
100.00% Emissions from base buildings have been calculated based on supplier statements.
Downstream transportation and distribution
Not relevant, explanation provided
0.00%
Emissions from downstream transportation and distribution have been excluded from our inventory due to the materiality of the emissions source in the context of a service organisation.
Processing of sold products
Not relevant, explanation provided
Emissions from processing of sold products have been excluded from our inventory due to the materiality of the emissions source in the context of a service organisation.
Use of sold products
Not relevant, explanation provided
Emissions from use of sold products have been excluded from our inventory due to the materiality of the emissions source in the context of a service organisation.
End of life treatment of sold products
Not relevant, explanation provided
Emissions from end of life treatment of sold products have been excluded from our inventory due to the materiality of the emissions source in the context of a service organisation.
Downstream leased assets
Not relevant, explanation provided
Emissions from downstream leased assets have been excluded from our inventory as they are not considered to be a material emissions source in the context of a service organisation.
Franchises Not relevant, explanation provided
Emissions from franchises have been excluded from our inventory due to the materiality of the emissions source in the context of a service
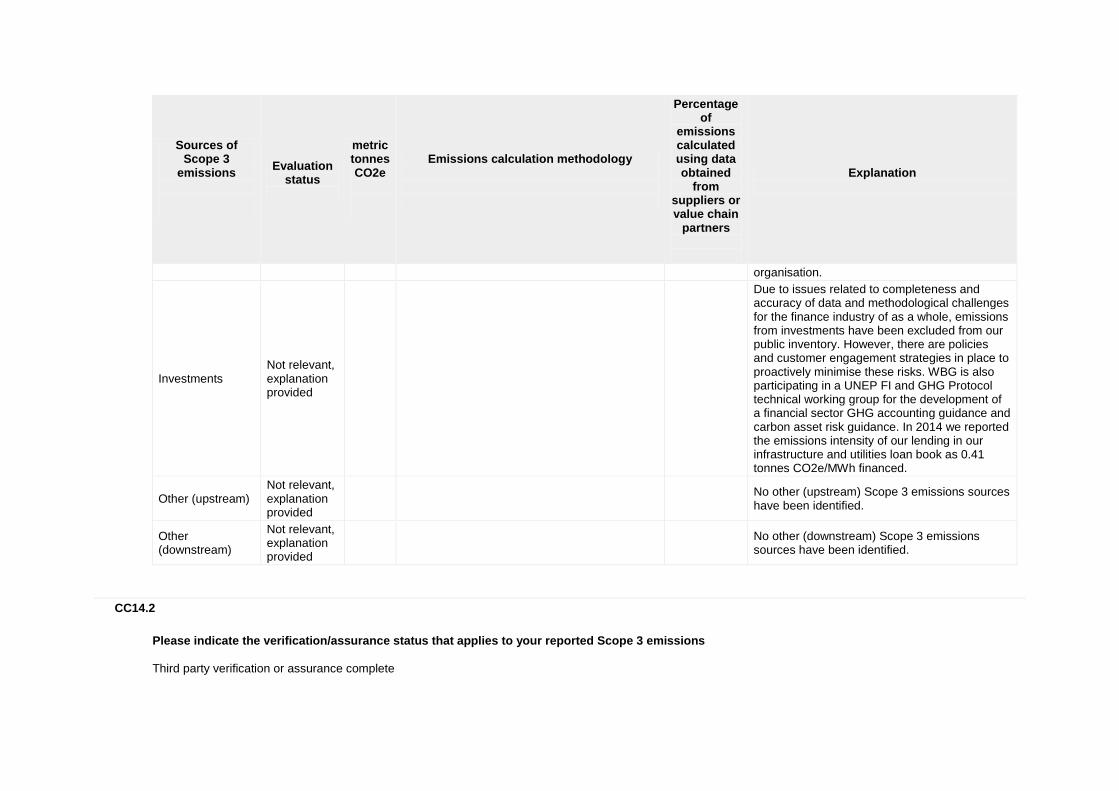
Sources of Scope 3
emissions
Evaluation status
metric tonnes CO2e
Emissions calculation methodology
Percentage of
emissions calculated using data obtained
from suppliers or value chain
partners
Explanation
organisation.
Investments Not relevant, explanation provided
Due to issues related to completeness and accuracy of data and methodological challenges for the finance industry of as a whole, emissions from investments have been excluded from our public inventory. However, there are policies and customer engagement strategies in place to proactively minimise these risks. WBG is also participating in a UNEP FI and GHG Protocol technical working group for the development of a financial sector GHG accounting guidance and carbon asset risk guidance. In 2014 we reported the emissions intensity of our lending in our infrastructure and utilities loan book as 0.41 tonnes CO2e/MWh financed.
Other (upstream) Not relevant, explanation provided
No other (upstream) Scope 3 emissions sources have been identified.
Other (downstream)
Not relevant, explanation provided
No other (downstream) Scope 3 emissions sources have been identified.
CC14.2
Please indicate the verification/assurance status that applies to your reported Scope 3 emissions
Third party verification or assurance complete
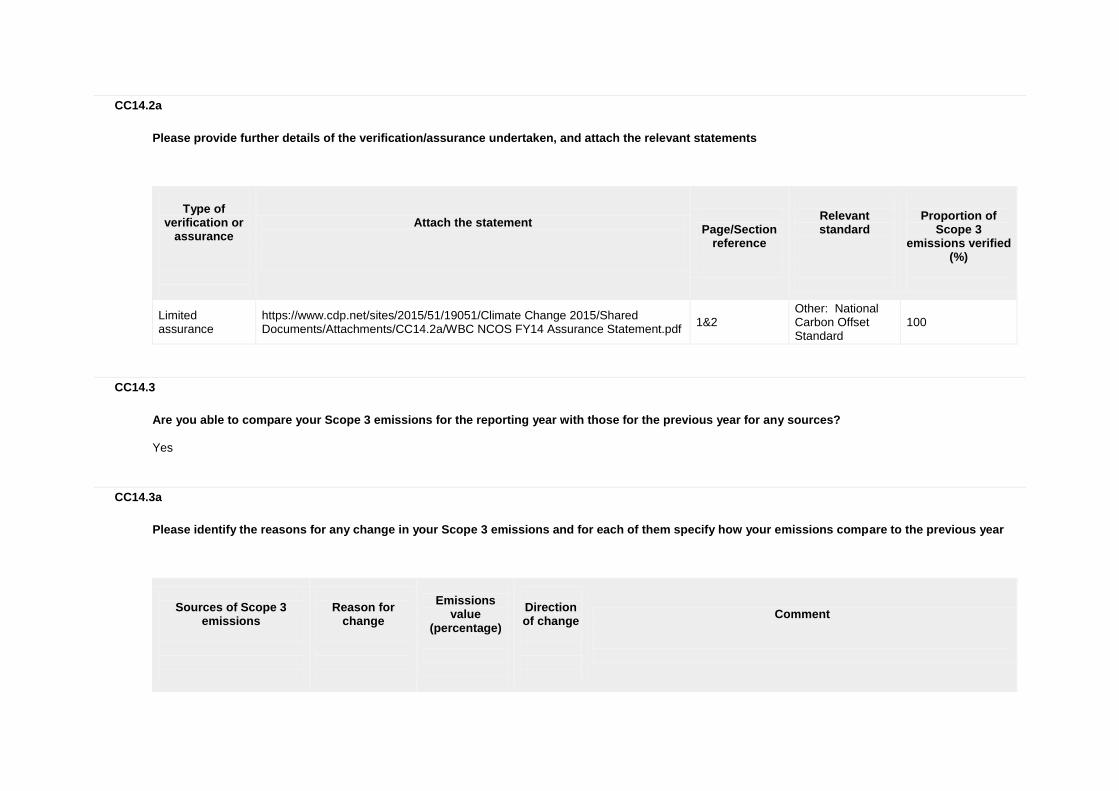
CC14.2a
Please provide further details of the verification/assurance undertaken, and attach the relevant statements
Type of
verification or assurance
Attach the statement
Page/Section
reference
Relevant standard
Proportion of
Scope 3 emissions verified
(%)
Limited assurance
https://www.cdp.net/sites/2015/51/19051/Climate Change 2015/Shared Documents/Attachments/CC14.2a/WBC NCOS FY14 Assurance Statement.pdf
1&2 Other: National Carbon Offset Standard
100
CC14.3
Are you able to compare your Scope 3 emissions for the reporting year with those for the previous year for any sources?
Yes
CC14.3a
Please identify the reasons for any change in your Scope 3 emissions and for each of them specify how your emissions compare to the previous year
Sources of Scope 3
emissions
Reason for
change
Emissions
value (percentage)
Direction of change
Comment

Sources of Scope 3
emissions
Reason for
change
Emissions
value (percentage)
Direction of change
Comment
Purchased goods & services
Emissions reduction activities
46 Decrease With the introduction of a paper reduction target, agile working and digitalisation, the Westpac Group is reducing its paper consumption.
Fuel- and energy-related activities (not included in Scopes 1 or 2)
Change in methodology
1 Increase Change in NGA Factors (emission factors) for Electricity transmission and distribution losses – Australia since 2013
Waste generated in operations
Emissions reduction activities
27 Decrease The Westpac Group has a target to improve recycling rates which has resulted in waste management system improvements, expansion of waste services and staff engagement.
Business travel Emissions reduction activities
0.3 Decrease As part of its Scope1, 2, 3 emission reduction target, Westpac NZ reduced business travel emissions by 26% offset by an increase in business travel for Australia and the UK as a result of project-based work across multi-states.
Upstream leased assets Change in methodology
20 Decrease In 2014, the calculation used to estimate base building emissions changed from an approximation based on tCO2e/m2 to NABERS ratings providing a more accurate reflection of base building emissions.
CC14.4
Do you engage with any of the elements of your value chain on GHG emissions and climate change strategies? (Tick all that apply)
Yes, our suppliers Yes, our customers
CC14.4a
Please give details of methods of engagement, your strategy for prioritizing engagements and measures of success
Engagement methods
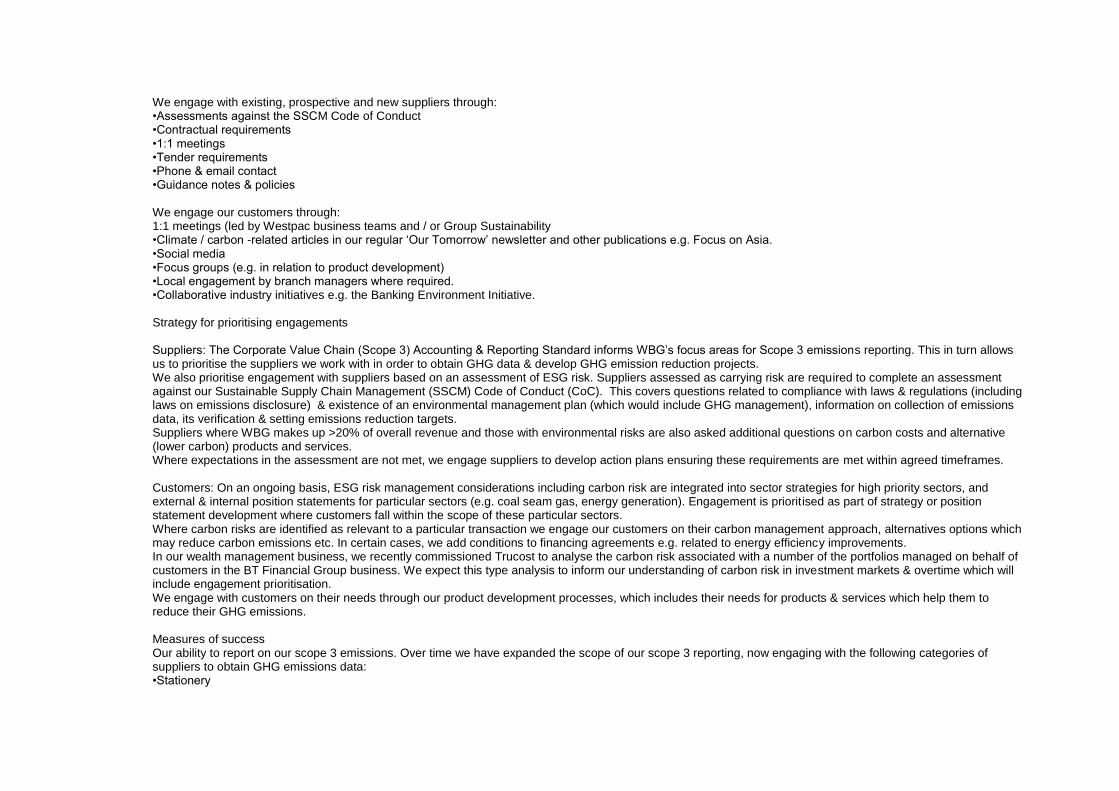
We engage with existing, prospective and new suppliers through: •Assessments against the SSCM Code of Conduct •Contractual requirements •1:1 meetings •Tender requirements •Phone & email contact •Guidance notes & policies We engage our customers through: 1:1 meetings (led by Westpac business teams and / or Group Sustainability •Climate / carbon -related articles in our regular ‘Our Tomorrow’ newsletter and other publications e.g. Focus on Asia. •Social media •Focus groups (e.g. in relation to product development) •Local engagement by branch managers where required. •Collaborative industry initiatives e.g. the Banking Environment Initiative. Strategy for prioritising engagements Suppliers: The Corporate Value Chain (Scope 3) Accounting & Reporting Standard informs WBG’s focus areas for Scope 3 emissions reporting. This in turn allows us to prioritise the suppliers we work with in order to obtain GHG data & develop GHG emission reduction projects. We also prioritise engagement with suppliers based on an assessment of ESG risk. Suppliers assessed as carrying risk are required to complete an assessment against our Sustainable Supply Chain Management (SSCM) Code of Conduct (CoC). This covers questions related to compliance with laws & regulations (including laws on emissions disclosure) & existence of an environmental management plan (which would include GHG management), information on collection of emissions data, its verification & setting emissions reduction targets. Suppliers where WBG makes up >20% of overall revenue and those with environmental risks are also asked additional questions on carbon costs and alternative (lower carbon) products and services. Where expectations in the assessment are not met, we engage suppliers to develop action plans ensuring these requirements are met within agreed timeframes. Customers: On an ongoing basis, ESG risk management considerations including carbon risk are integrated into sector strategies for high priority sectors, and external & internal position statements for particular sectors (e.g. coal seam gas, energy generation). Engagement is prioritised as part of strategy or position statement development where customers fall within the scope of these particular sectors. Where carbon risks are identified as relevant to a particular transaction we engage our customers on their carbon management approach, alternatives options which may reduce carbon emissions etc. In certain cases, we add conditions to financing agreements e.g. related to energy efficiency improvements. In our wealth management business, we recently commissioned Trucost to analyse the carbon risk associated with a number of the portfolios managed on behalf of customers in the BT Financial Group business. We expect this type analysis to inform our understanding of carbon risk in investment markets & overtime which will include engagement prioritisation. We engage with customers on their needs through our product development processes, which includes their needs for products & services which help them to reduce their GHG emissions. Measures of success Our ability to report on our scope 3 emissions. Over time we have expanded the scope of our scope 3 reporting, now engaging with the following categories of suppliers to obtain GHG emissions data: •Stationery

•Car fleet management •Car rental •Taxis •Print management •Facilities management •Air travel •Mail houses •Waste management A reduction in our scope 3 emissions. During 2013/14 we achieved a reduction of 10,541 tonnes CO2e from 2012/13 levels for Australian operations. We also achieved a reduction in the numbers for NZ over the same period (628t) Supplier introduction of GHG data collection, environmental management plans (including GHG management), & for high risk suppliers, targets for reducing GHG emissions within the first year of contract based on action plans as agreed with WBG. Customers: Customer adherence to conditions in contracts e.g. implementation of energy efficiency projects or GHG monitoring / management requirements. Achievement of targets in our Sustainability Strategy e.g. our commitment to launch 5 unique product or service offerings by 2017, which help our customers adapt to environmental challenges. Customer engagement on needs in relation to energy efficiency & GHG reduction was a key contributor to our successful launch of the Energy Efficiency Lease, the SunPower Flexi-Loan, & the Solar Shed product.
CC14.4b
To give a sense of scale of this engagement, please give the number of suppliers with whom you are engaging and the proportion of your total spend that they represent
Number of suppliers
% of total
spend
Comment
186 73%
186 suppliers were assessed against the SSCM Code of Conduct (COC) in FY14. This includes suppliers who completed the SSCM COC Toolkit, the SSCM Questionnaire or the new SSCM Online Assessment which has replaced use of the COC Toolkit and Questionnaire. The assessments are required for new, prospective and existing suppliers assessed as carrying a medium or high level of environmental, social or other risk.
CC14.4c

If you have data on your suppliers’ GHG emissions and climate change strategies, please explain how you make use of that data
How you make use of the data
Please give details
Identifying GHG sources to prioritize for reduction actions
Suppliers are required to set, develop and implement an environmental management policy and plan as part of our SSCM assessment. This requirement encourages our suppliers to identify and implement GHG reduction opportunities in their own operations. In addition, suppliers are encouraged to consider the impact of carbon costs and mechanisms and identify GHG reduction opportunities.
Managing the impact of regulation in the supply chain
By requiring our suppliers to be compliant with laws and regulations as part of our Supplier Code of Conduct , we manage the impact of regulation in the supply chain – including regulation associated with emissions reporting.
Other
Reporting : By gathering GHG data from our suppliers, we are able to report on our scope 3 emissions for a range of categories annually within our Annual Review and Sustainability Report – Environment Factpac: http://www.westpac.com.au/docs/pdf/aw/sustainability-community/2013_WBC_Environmental_Factpac.pdf. The identification and reporting of these emissions is instrumental in ensuring Westpac meets Objective 6 (Reducing our environmental footprint) of our 2013-2017 Sustainability Strategy (http://www.westpac.com.au/docs/pdf/aw/sustainability-community/2013-2017_Sustainability_Strategy.pdf) which is communicated to suppliers that aid us in obtaining GHG data. Progress to Objective 6 is monitored quarterly by the Environmental Management Committee.
CC14.4d
Please explain why you do not engage with any elements of your value chain on GHG emissions and climate change strategies, and any plans you have to develop an engagement strategy in the future
Further Information
Module: Sign Off
Page: CC15. Sign Off
CC15.1
Please provide the following information for the person that has signed off (approved) your CDP climate change response
Name
Job title
Corresponding job category
Siobhan Toohill Group Head of Sustainability Business unit manager
Further Information
CDP 2015 Climate Change 2015 Information Request