C:\Documents and Settings\STuckerm\Desktop\Cuy Nutrient ...
14
Appendix L Nutrients in the Lower Cuyahoga River A nutrient is a substance that promotes growth or development in living things, most often in reference to plants. In aquatic systems, nutrients are mainly responsible for determining the level of productivity in terms of algal or macrophyte biomass. Waters enriched in nutrients have increased productivity which can have a profound effect on stream ecology. This process is called eutrophication and has been defined as “The biological reaction of aquatic systems to nutrient enrichment, the eventual consequence of which is the development of primary production to nuisance proportions” (Marsden 1989). Although the individual constituents of nutrients themselves can have adverse effects on aquatic life in high concentrations, it is this eutrophication, or over fertilization, that is usually of most concern. While essential to the functioning of healthy aquatic ecosystems, nutrients can exert negative effects by altering trophic dynamics, increasing algal and macrophyte production, increasing turbidity (via increased phytoplanktonic algal production), decreasing average dissolved oxygen concentrations, and increasing fluctuations in diurnal dissolved oxygen and pH (Sharpley et al. 1994). Such changes are caused by excessive nutrient concentrations that contribute to shifts in species composition away from functional assemblages of intolerant species, benthic insectivores and top carnivores (e.g.,darters, insectivorous minnows, redhorse, and esocids) typical of high quality warmwater streams towards less desirable assemblages of tolerant species, niche generalists, omnivores, and detritivores (e.g., creek chub, bluntnose minnow, white sucker, carp, green sunfish) typical of degraded warmwater streams (OEPA, 1999). As eutrophication proceeds, an increase in DELT anomolies and a reduction in fish biomass can occur and, in extreme conditions, the complete loss of the fishery. Other adverse effects of eutrophication on lakes and rivers include: increased biomass of phytoplankton; shifts in phytoplankton to bloom-forming species that may be toxic or inedible; increased biomass of benthic and epiphytic algae; changes in macrophyte species composition and biomass; decreases in water transparency; taste, odor, and water treatment problems; oxygen depletion; increased incidence of fish kills; loss of desirable fish species; reduction in harvestable fish and shellfish; reduction of aesthetic value of water body. (Smith, 1998). More specific effects depend on other factors such as physical properties of the water body and habitat. In addition, running water, simply because it is running, is an enriched environment compared to still waters because stream currents promote more efficient transfer of nutrients. Therefore, apparent low instream concentrations of nutrients can still exert a negative effect (Ruttner 1926). Eutrophication can result in visible algal blooms, algal mats and benthic algal and submerged macrophyte agglomerations. During respiration and upon decay, the algae contribute to dissolved oxygen depletion which can have negative consequences on the aquatic biota and is likely the major source of fish mortality and morbidity due to eutrophication. Nutrients are subject to rapid increases due to human activities. Accelerated eutrophication is the main cause of water quality impairment in the United States (EPA, 1996). The process of accelerated enrichment and its impacts, arising from human activities, is termed cultural eutrophication and has been recognized internationally as a significant environmental problem/challenge for decades (Vollenweider and Kerekes, 1982). Eutrophication can be assessed through direct observations of algal mass, or indirectly through measurements such as nutrients and dissolved oxygen. Nutrients
Transcript of C:\Documents and Settings\STuckerm\Desktop\Cuy Nutrient ...
Appendix L
Nutrients in the Lower Cuyahoga River
A nutrient is a substance that promotes growth or development in living things, most often in
reference to plants. In aquatic systems, nutrients are mainly responsible for determining the level
of productivity in terms of algal or macrophyte biomass. Waters enriched in nutrients have increased
productivity which can have a profound effect on stream ecology. This process is called
eutrophication and has been defined as “The biological reaction of aquatic systems to nutrient
enrichment, the eventual consequence of which is the development of primary production to
nuisance proportions” (Marsden 1989). Although the individual constituents of nutrients themselves
can have adverse effects on aquatic life in high concentrations, it is this eutrophication, or over
fertilization, that is usually of most concern.
While essential to the functioning of healthy aquatic ecosystems, nutrients can exert negative effects
by altering trophic dynamics, increasing algal and macrophyte production, increasing turbidity (via
increased phytoplanktonic algal production), decreasing average dissolved oxygen concentrations,
and increasing fluctuations in diurnal dissolved oxygen and pH (Sharpley et al. 1994). Such changes
are caused by excessive nutrient concentrations that contribute to shifts in species composition away
from functional assemblages of intolerant species, benthic insectivores and top carnivores
(e.g.,darters, insectivorous minnows, redhorse, and esocids) typical of high quality warmwater
streams towards less desirable assemblages of tolerant species, niche generalists, omnivores, and
detritivores (e.g., creek chub, bluntnose minnow, white sucker, carp, green sunfish) typical of
degraded warmwater streams (OEPA, 1999). As eutrophication proceeds, an increase in DELT
anomolies and a reduction in fish biomass can occur and, in extreme conditions, the complete loss
of the fishery. Other adverse effects of eutrophication on lakes and rivers include: increased biomass
of phytoplankton; shifts in phytoplankton to bloom-forming species that may be toxic or inedible;
increased biomass of benthic and epiphytic algae; changes in macrophyte species composition and
biomass; decreases in water transparency; taste, odor, and water treatment problems; oxygen
depletion; increased incidence of fish kills; loss of desirable fish species; reduction in harvestable
fish and shellfish; reduction of aesthetic value of water body. (Smith, 1998). More specific effects
depend on other factors such as physical properties of the water body and habitat. In addition,
running water, simply because it is running, is an enriched environment compared to still waters
because stream currents promote more efficient transfer of nutrients. Therefore, apparent low
instream concentrations of nutrients can still exert a negative effect (Ruttner 1926). Eutrophication
can result in visible algal blooms, algal mats and benthic algal and submerged macrophyte
agglomerations. During respiration and upon decay, the algae contribute to dissolved oxygen
depletion which can have negative consequences on the aquatic biota and is likely the major source
of fish mortality and morbidity due to eutrophication.
Nutrients are subject to rapid increases due to human activities. Accelerated eutrophication is the
main cause of water quality impairment in the United States (EPA, 1996). The process of accelerated
enrichment and its impacts, arising from human activities, is termed cultural eutrophication and has
been recognized internationally as a significant environmental problem/challenge for decades
(Vollenweider and Kerekes, 1982). Eutrophication can be assessed through direct observations of
algal mass, or indirectly through measurements such as nutrients and dissolved oxygen. Nutrients
can include many types of
ions and compounds, but are
most often identified as
compounds of nitrogen and
phosphorus. For the lower
Cuyahoga River TMDL, when
the term nutrients is used, it
will be used as in the common
sense to mean nitrogen and
phosphorus compounds.
Sources of nutrients can be
natural or from human
activities. Deforestation
results in losses of nutrients
from the forest as they are
carried into surface waters
through adsorption to eroded
soils or leached into surface
and subsurface waters.
Agriculture and construction
activities can be large sources of nutrients to waterways. Atmospheric deposition, especially of
nitrogen compounds, can also be significant. Treated domestic wastewater is one of the largest
sources of nutrients to the lower Cuyahoga River. Of great significance, the nutrients in treated
effluent from well operated or tertiary wastewater treatment plants are usually found in the dissolved
form. Dissolved nutrients are much more readily available for uptake by organisms than when
sorbed onto particles. In natural systems, very little phosphorus is contained in the dissolved form
as nearly all phosphorus in unimpacted streams are sorbed to sediment particles associated with bank
or soil erosion. Treated domestic wastewater may also be associated with organic enrichment and
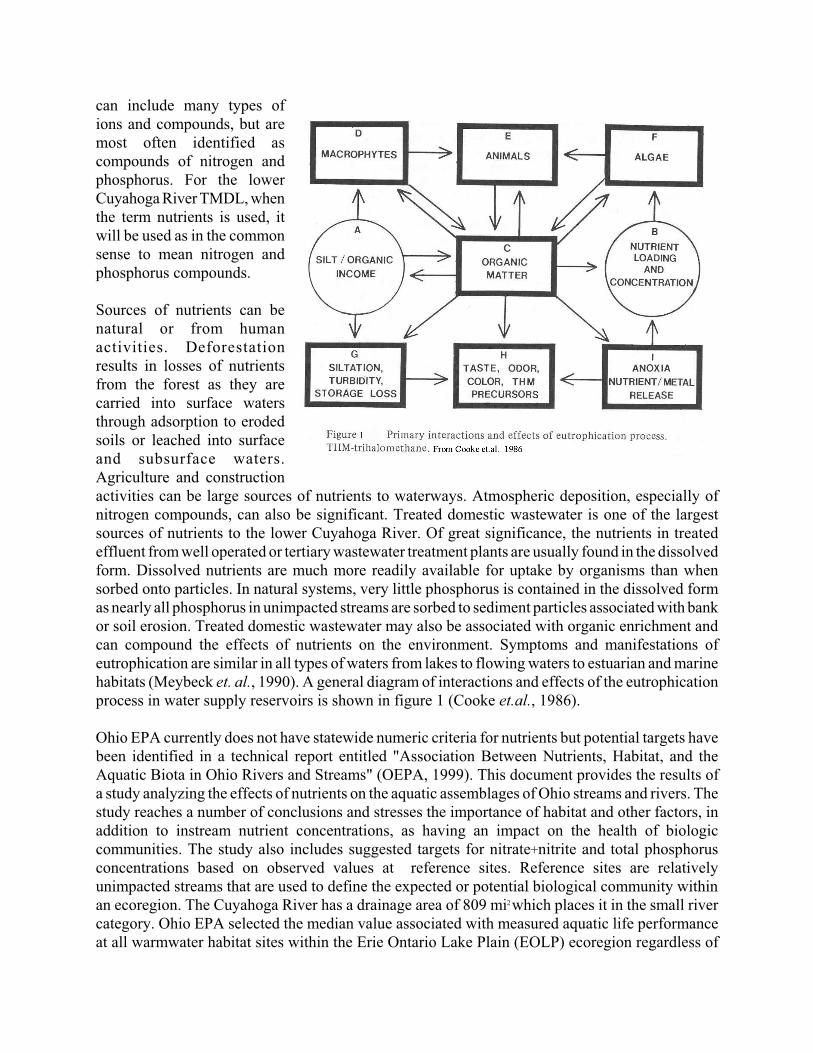
can compound the effects of nutrients on the environment. Symptoms and manifestations of
eutrophication are similar in all types of waters from lakes to flowing waters to estuarian and marine
habitats (Meybeck et. al., 1990). A general diagram of interactions and effects of the eutrophication
process in water supply reservoirs is shown in figure 1 (Cooke et.al., 1986).
Ohio EPA currently does not have statewide numeric criteria for nutrients but potential targets have
been identified in a technical report entitled "Association Between Nutrients, Habitat, and the
Aquatic Biota in Ohio Rivers and Streams" (OEPA, 1999). This document provides the results of
a study analyzing the effects of nutrients on the aquatic assemblages of Ohio streams and rivers. The
study reaches a number of conclusions and stresses the importance of habitat and other factors, in
addition to instream nutrient concentrations, as having an impact on the health of biologic
communities. The study also includes suggested targets for nitrate+nitrite and total phosphorus
concentrations based on observed values at reference sites. Reference sites are relatively
unimpacted streams that are used to define the expected or potential biological community within
an ecoregion. The Cuyahoga River has a drainage area of 809 mi2which places it in the small river
category. Ohio EPA selected the median value associated with measured aquatic life performance
at all warmwater habitat sites within the Erie Ontario Lake Plain (EOLP) ecoregion regardless of
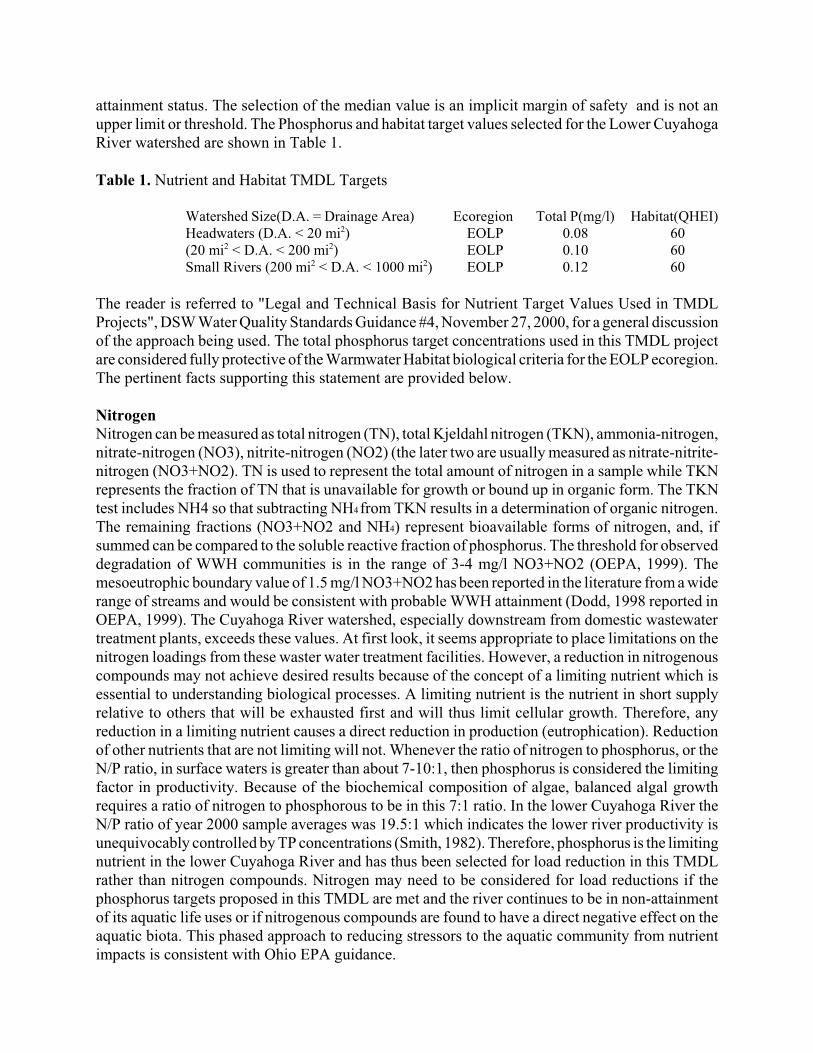
attainment status. The selection of the median value is an implicit margin of safety and is not an
upper limit or threshold. The Phosphorus and habitat target values selected for the Lower Cuyahoga
River watershed are shown in Table 1.
Table 1. Nutrient and Habitat TMDL Targets
Watershed Size(D.A. = Drainage Area) Ecoregion Total P(mg/l) Habitat(QHEI)
Headwaters (D.A. < 20 mi2) EOLP 0.08 60
(20 mi2 < D.A. < 200 mi2) EOLP 0.10 60
Small Rivers (200 mi2 < D.A. < 1000 mi2) EOLP 0.12 60
The reader is referred to "Legal and Technical Basis for Nutrient Target Values Used in TMDL
Projects", DSW Water Quality Standards Guidance #4, November 27, 2000, for a general discussion
of the approach being used. The total phosphorus target concentrations used in this TMDL project
are considered fully protective of the Warmwater Habitat biological criteria for the EOLP ecoregion.
The pertinent facts supporting this statement are provided below.
Nitrogen
Nitrogen can be measured as total nitrogen (TN), total Kjeldahl nitrogen (TKN), ammonia-nitrogen,
nitrate-nitrogen (NO3), nitrite-nitrogen (NO2) (the later two are usually measured as nitrate-nitrite-
nitrogen (NO3+NO2). TN is used to represent the total amount of nitrogen in a sample while TKN
represents the fraction of TN that is unavailable for growth or bound up in organic form. The TKN
test includes NH4 so that subtracting NH4from TKN results in a determination of organic nitrogen.
The remaining fractions (NO3+NO2 and NH4) represent bioavailable forms of nitrogen, and, if
summed can be compared to the soluble reactive fraction of phosphorus. The threshold for observed
degradation of WWH communities is in the range of 3-4 mg/l NO3+NO2 (OEPA, 1999). The
mesoeutrophic boundary value of 1.5 mg/l NO3+NO2 has been reported in the literature from a wide
range of streams and would be consistent with probable WWH attainment (Dodd, 1998 reported in
OEPA, 1999). The Cuyahoga River watershed, especially downstream from domestic wastewater
treatment plants, exceeds these values. At first look, it seems appropriate to place limitations on the
nitrogen loadings from these waster water treatment facilities. However, a reduction in nitrogenous
compounds may not achieve desired results because of the concept of a limiting nutrient which is
essential to understanding biological processes. A limiting nutrient is the nutrient in short supply
relative to others that will be exhausted first and will thus limit cellular growth. Therefore, any
reduction in a limiting nutrient causes a direct reduction in production (eutrophication). Reduction
of other nutrients that are not limiting will not. Whenever the ratio of nitrogen to phosphorus, or the
N/P ratio, in surface waters is greater than about 7-10:1, then phosphorus is considered the limiting
factor in productivity. Because of the biochemical composition of algae, balanced algal growth
requires a ratio of nitrogen to phosphorous to be in this 7:1 ratio. In the lower Cuyahoga River the
N/P ratio of year 2000 sample averages was 19.5:1 which indicates the lower river productivity is
unequivocably controlled by TP concentrations (Smith, 1982). Therefore, phosphorus is the limiting
nutrient in the lower Cuyahoga River and has thus been selected for load reduction in this TMDL
rather than nitrogen compounds. Nitrogen may need to be considered for load reductions if the
phosphorus targets proposed in this TMDL are met and the river continues to be in non-attainment
of its aquatic life uses or if nitrogenous compounds are found to have a direct negative effect on the
aquatic biota. This phased approach to reducing stressors to the aquatic community from nutrient
impacts is consistent with Ohio EPA guidance.
Phosphorus
Phosphorus can be measured as total phosphorus (TP), or soluble reactive phosphorus (SRP) (also
sometimes called phosphate (PO4) or orthophosphate (ortho-P) or dissolved phosphorus. The last
four represent different terms or tests used to describe the fraction of TP that is soluble or readily
available to organisms for growth and is somewhat analogous to NH4 plus the ions of NO3+NO2.
Data from the Erie Ontario Lake Plain ecoregion was examined to determine the relative frequency
of total phosphorus concentrations and WWH attainment. The target value of 0.12 mg/l for the
mainstem and 0.07 mg/l for major tributaries are median values in the Erie Ontario Lakeplain
ecoregion where there is a reasonable expectation of attainment of the WWH biocriteria. In other
words, for those similar sized streams in the ecoregion that are attaining the WWH use designation,
50% of the values for total phosphorus are below this target and 50% are above it.
Research of the OECD (Organization for Economic Co-Operation and Development) prepared by
the Soil & Water Conservation Society of Metro Halifax (Canada) have demonstrated that, in most
cases, phosphorus is the factor which determines the development of eutrophication; even when
another nutrient such as nitrogen is (occasionally or normally) the limiting factor, phosphorus may
still be made to play the role of limiting factor through appropriate control. Control of point sources
of pollution from municipalities and industries is usually given priority as it is generally the most
cost-effective measure. After reduction of phosphorus from point sources, the relative role of
phosphorus from diffuse sources will increase. This means that measures against diffuse sources
may become necessary if improvement of water quality cannot be achieved by further elimination
of phosphorus point sources. Diffuse source control is more difficult to achieve. Yet, in many cases,
effective prevention of eutrophication, or restoration of eutrophied waters cannot be achieved
without such control. Therefore, the improvement of all aspects of land use practices which
contribute nutrients to water bodies should be encouraged (Soil and Water, 2002). Further, because
phosphorus is often sorbed onto sediment, non point control of phosphorus often requires reduction
of soil and bank erosion which will improve instream habitat.
Evidence for Nutrient Impacts in the Lower Cuyahoga River
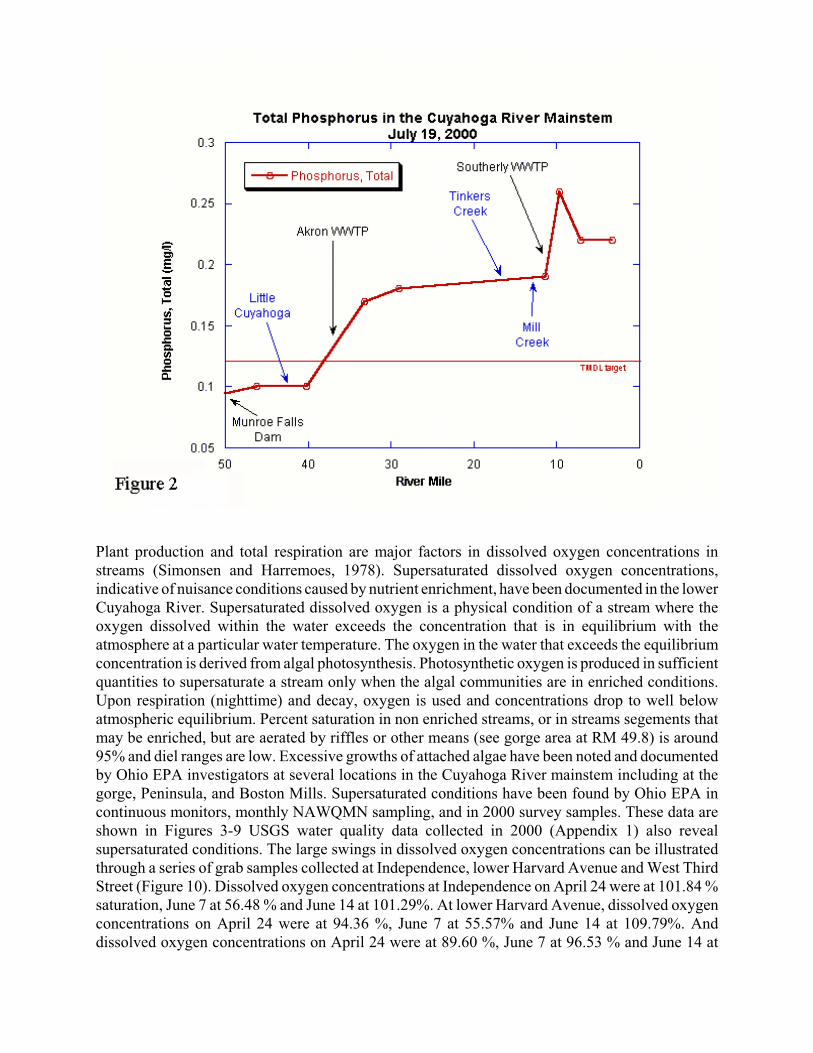
Total Phosphorus concentrations in the lower Cuyahoga River mainstem had a median total
phosphorus concentration of 0.17 mg/l from all samples collected in 2000 (N= 83). The maximum
value was 0.69 mg/l and the minimum was less than 0.05 mg/l. National Park Service samples
collected during 2000 from the mainstem at Station Road and Ira Road had an average concentration
of 0.22 mg/l (n=11). These values exceed the target value of 0.12 mg/l which is derived from all
EOLP ecoregion warmwater habitat sampling locations and also exceeds the USEPA recommended
phosphorus criterion of 0.1 mg/l. In comparison, a USGS NAWQA study reported the results of
samples collected at 213sites (8420 samples) from 1991 to 1996 at locations biased towards
agriculture impacted streams and storm events. The mean value reported in the USGS study was
0.24 mg/l, the median was 0.08 mg/l. The median total phosphorus concentration in the Cuyahoga
River downstream from NEORSD Southerly WWTP was 0.25 mg/l from five samples collected in
2000. The maximum value was 0.52 mg/l and the minimum was 0.21 mg/l. As shown in Figure 2,
both the Akron and NEORSD Southerly discharges increases the instream total phosphorus
concentration in the Cuyahoga River compared to upstream concentrations. NEORSD and Akron
self monitoring reports indicate the instream phosphorus concentrations corroborates Ohio EPA
2000 survey data.
Plant production and total respiration are major factors in dissolved oxygen concentrations in
streams (Simonsen and Harremoes, 1978). Supersaturated dissolved oxygen concentrations,
indicative of nuisance conditions caused by nutrient enrichment, have been documented in the lower
Cuyahoga River. Supersaturated dissolved oxygen is a physical condition of a stream where the
oxygen dissolved within the water exceeds the concentration that is in equilibrium with the
atmosphere at a particular water temperature. The oxygen in the water that exceeds the equilibrium
concentration is derived from algal photosynthesis. Photosynthetic oxygen is produced in sufficient
quantities to supersaturate a stream only when the algal communities are in enriched conditions.
Upon respiration (nighttime) and decay, oxygen is used and concentrations drop to well below
atmospheric equilibrium. Percent saturation in non enriched streams, or in streams segements that
may be enriched, but are aerated by riffles or other means (see gorge area at RM 49.8) is around
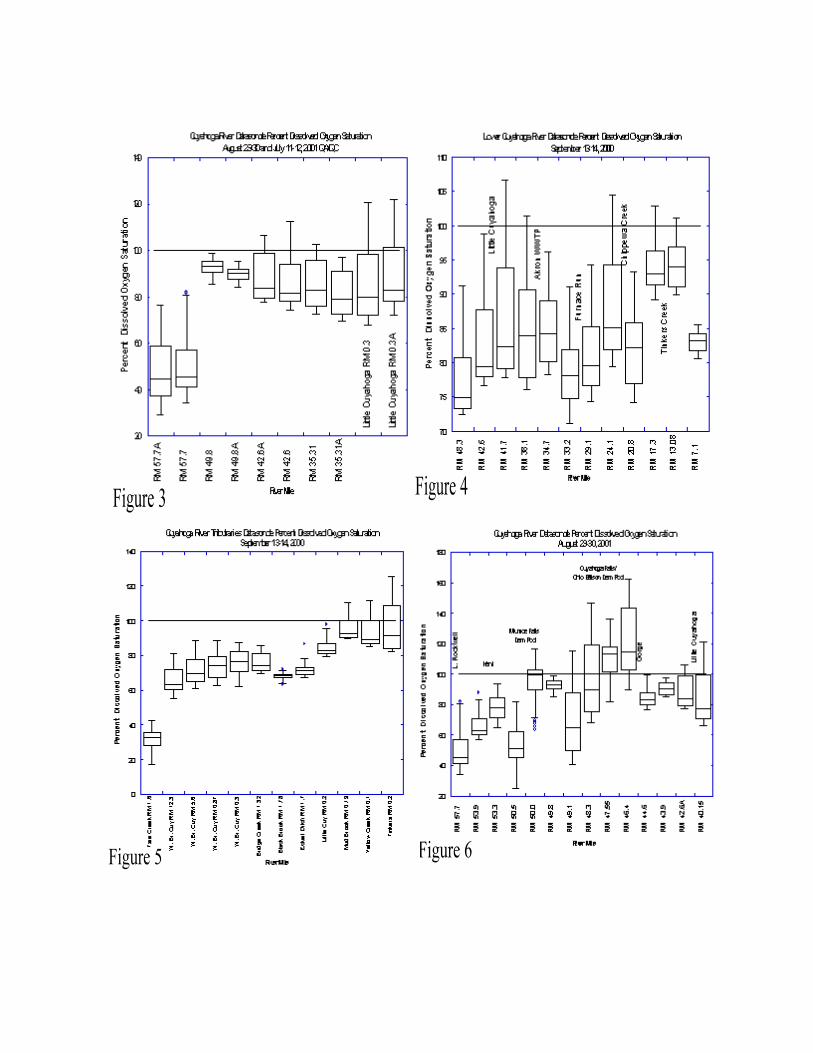
95% and diel ranges are low. Excessive growths of attached algae have been noted and documented
by Ohio EPA investigators at several locations in the Cuyahoga River mainstem including at the
gorge, Peninsula, and Boston Mills. Supersaturated conditions have been found by Ohio EPA in
continuous monitors, monthly NAWQMN sampling, and in 2000 survey samples. These data are
shown in Figures 3-9 USGS water quality data collected in 2000 (Appendix 1) also reveal
supersaturated conditions. The large swings in dissolved oxygen concentrations can be illustrated
through a series of grab samples collected at Independence, lower Harvard Avenue and West Third
Street (Figure 10). Dissolved oxygen concentrations at Independence on April 24 were at 101.84 %
saturation, June 7 at 56.48 % and June 14 at 101.29%. At lower Harvard Avenue, dissolved oxygen
concentrations on April 24 were at 94.36 %, June 7 at 55.57% and June 14 at 109.79%. And
dissolved oxygen concentrations on April 24 were at 89.60 %, June 7 at 96.53 % and June 14 at
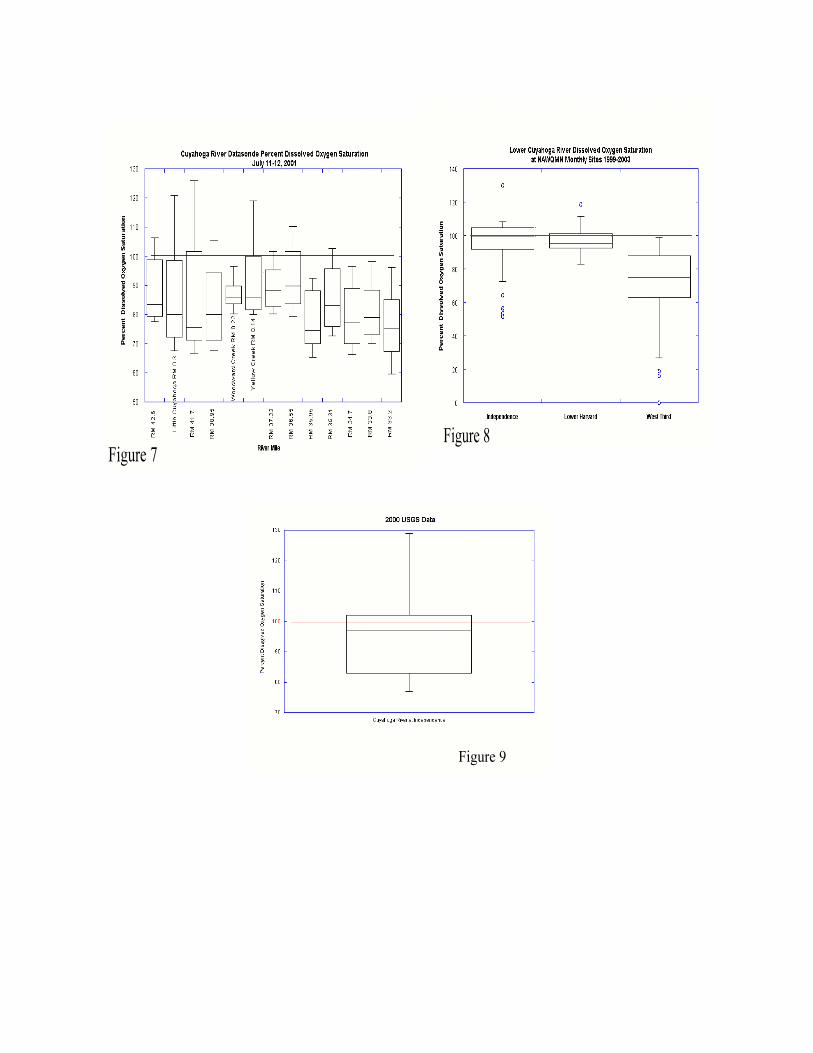
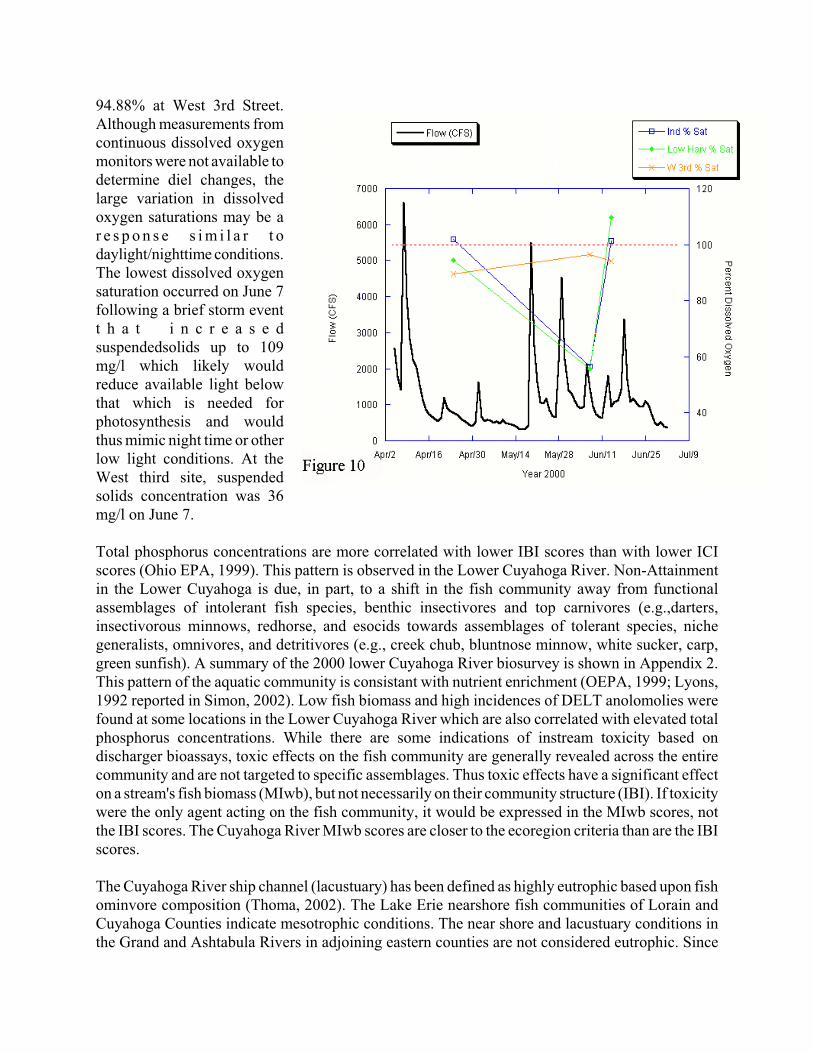
94.88% at West 3rd Street.
Although measurements from
continuous dissolved oxygen
monitors were not available to
determine diel changes, the
large variation in dissolved
oxygen saturations may be a
r e s p o n s e s i m i l a r t o
daylight/nighttime conditions.
The lowest dissolved oxygen
saturation occurred on June 7
following a brief storm event
t h a t i n c r e a s e d
suspendedsolids up to 109
mg/l which likely would
reduce available light below
that which is needed for
photosynthesis and would
thus mimic night time or other
low light conditions. At the
West third site, suspended
solids concentration was 36
mg/l on June 7.
Total phosphorus concentrations are more correlated with lower IBI scores than with lower ICI
scores (Ohio EPA, 1999). This pattern is observed in the Lower Cuyahoga River. Non-Attainment
in the Lower Cuyahoga is due, in part, to a shift in the fish community away from functional
assemblages of intolerant fish species, benthic insectivores and top carnivores (e.g.,darters,
insectivorous minnows, redhorse, and esocids towards assemblages of tolerant species, niche
generalists, omnivores, and detritivores (e.g., creek chub, bluntnose minnow, white sucker, carp,
green sunfish). A summary of the 2000 lower Cuyahoga River biosurvey is shown in Appendix 2.
This pattern of the aquatic community is consistant with nutrient enrichment (OEPA, 1999; Lyons,
1992 reported in Simon, 2002). Low fish biomass and high incidences of DELT anolomolies were
found at some locations in the Lower Cuyahoga River which are also correlated with elevated total
phosphorus concentrations. While there are some indications of instream toxicity based on
discharger bioassays, toxic effects on the fish community are generally revealed across the entire
community and are not targeted to specific assemblages. Thus toxic effects have a significant effect
on a stream's fish biomass (MIwb), but not necessarily on their community structure (IBI). If toxicity
were the only agent acting on the fish community, it would be expressed in the MIwb scores, not
the IBI scores. The Cuyahoga River MIwb scores are closer to the ecoregion criteria than are the IBI
scores.
The Cuyahoga River ship channel (lacustuary) has been defined as highly eutrophic based upon fish
ominvore composition (Thoma, 2002). The Lake Erie nearshore fish communities of Lorain and
Cuyahoga Counties indicate mesotrophic conditions. The near shore and lacustuary conditions in
the Grand and Ashtabula Rivers in adjoining eastern counties are not considered eutrophic. Since
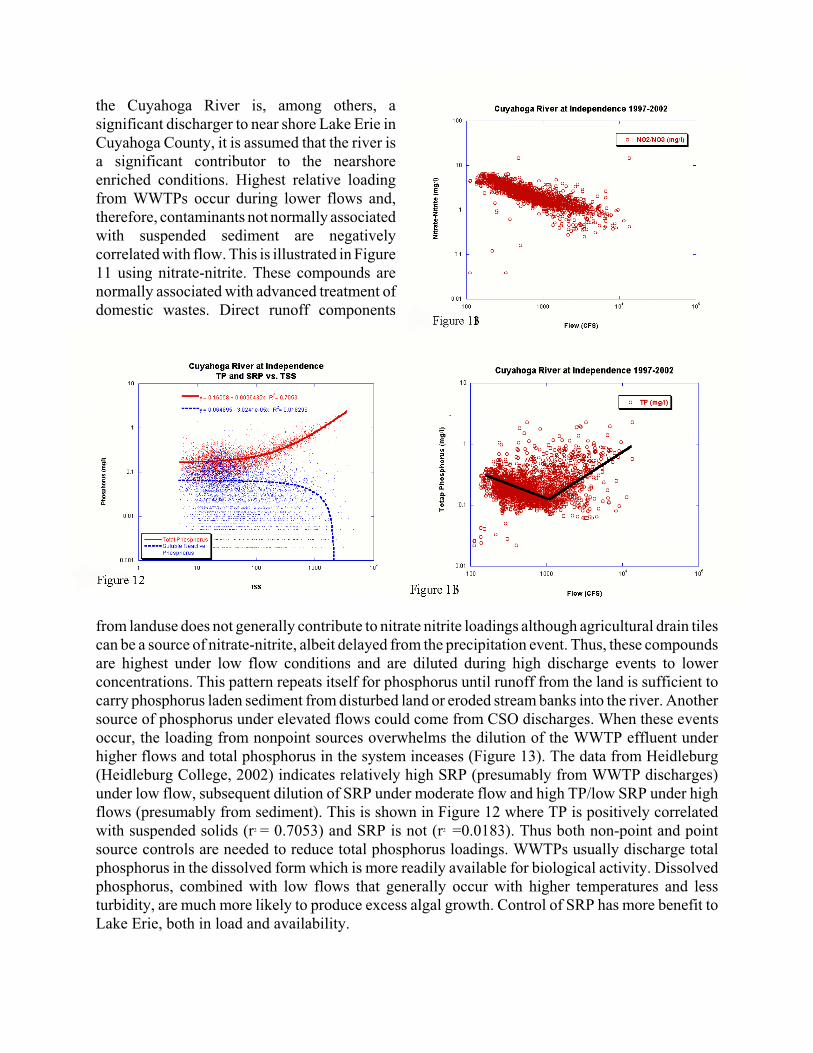
the Cuyahoga River is, among others, a
significant discharger to near shore Lake Erie in
Cuyahoga County, it is assumed that the river is
a significant contributor to the nearshore
enriched conditions. Highest relative loading
from WWTPs occur during lower flows and,
therefore, contaminants not normally associated
with suspended sediment are negatively
correlated with flow. This is illustrated in Figure
11 using nitrate-nitrite. These compounds are
normally associated with advanced treatment of
domestic wastes. Direct runoff components
from landuse does not generally contribute to nitrate nitrite loadings although agricultural drain tiles
can be a source of nitrate-nitrite, albeit delayed from the precipitation event. Thus, these compounds
are highest under low flow conditions and are diluted during high discharge events to lower
concentrations. This pattern repeats itself for phosphorus until runoff from the land is sufficient to
carry phosphorus laden sediment from disturbed land or eroded stream banks into the river. Another
source of phosphorus under elevated flows could come from CSO discharges. When these events
occur, the loading from nonpoint sources overwhelms the dilution of the WWTP effluent under
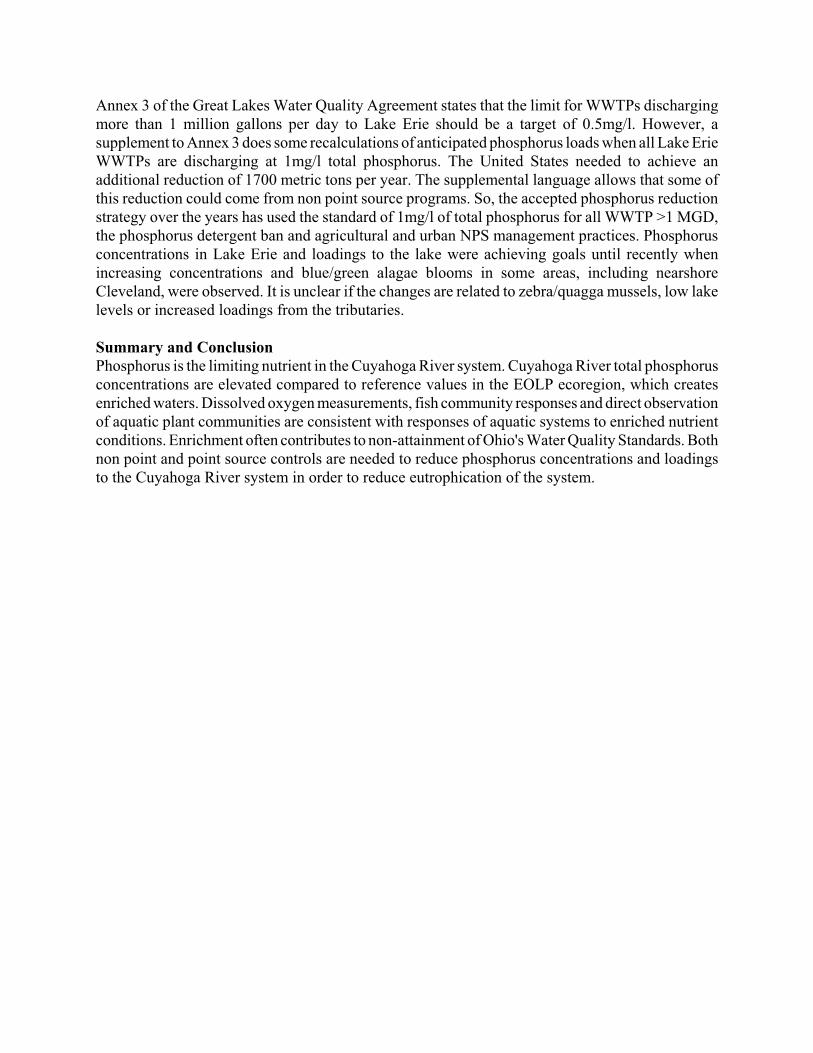
higher flows and total phosphorus in the system inceases (Figure 13). The data from Heidleburg
(Heidleburg College, 2002) indicates relatively high SRP (presumably from WWTP discharges)
under low flow, subsequent dilution of SRP under moderate flow and high TP/low SRP under high
flows (presumably from sediment). This is shown in Figure 12 where TP is positively correlated
with suspended solids (r2 = 0.7053) and SRP is not (r2 =0.0183). Thus both non-point and point
source controls are needed to reduce total phosphorus loadings. WWTPs usually discharge total
phosphorus in the dissolved form which is more readily available for biological activity. Dissolved
phosphorus, combined with low flows that generally occur with higher temperatures and less
turbidity, are much more likely to produce excess algal growth. Control of SRP has more benefit to
Lake Erie, both in load and availability.
STuckerm
STuckerm
STuckerm
STuckerm
1
STuckerm
3
Annex 3 of the Great Lakes Water Quality Agreement states that the limit for WWTPs discharging
more than 1 million gallons per day to Lake Erie should be a target of 0.5mg/l. However, a
supplement to Annex 3 does some recalculations of anticipated phosphorus loads when all Lake Erie
WWTPs are discharging at 1mg/l total phosphorus. The United States needed to achieve an
additional reduction of 1700 metric tons per year. The supplemental language allows that some of
this reduction could come from non point source programs. So, the accepted phosphorus reduction
strategy over the years has used the standard of 1mg/l of total phosphorus for all WWTP >1 MGD,
the phosphorus detergent ban and agricultural and urban NPS management practices. Phosphorus
concentrations in Lake Erie and loadings to the lake were achieving goals until recently when
increasing concentrations and blue/green alagae blooms in some areas, including nearshore
Cleveland, were observed. It is unclear if the changes are related to zebra/quagga mussels, low lake
levels or increased loadings from the tributaries.
Summary and Conclusion
Phosphorus is the limiting nutrient in the Cuyahoga River system. Cuyahoga River total phosphorus
concentrations are elevated compared to reference values in the EOLP ecoregion, which creates
enriched waters. Dissolved oxygen measurements, fish community responses and direct observation
of aquatic plant communities are consistent with responses of aquatic systems to enriched nutrient
conditions. Enrichment often contributes to non-attainment of Ohio's Water Quality Standards. Both
non point and point source controls are needed to reduce phosphorus concentrations and loadings
to the Cuyahoga River system in order to reduce eutrophication of the system.
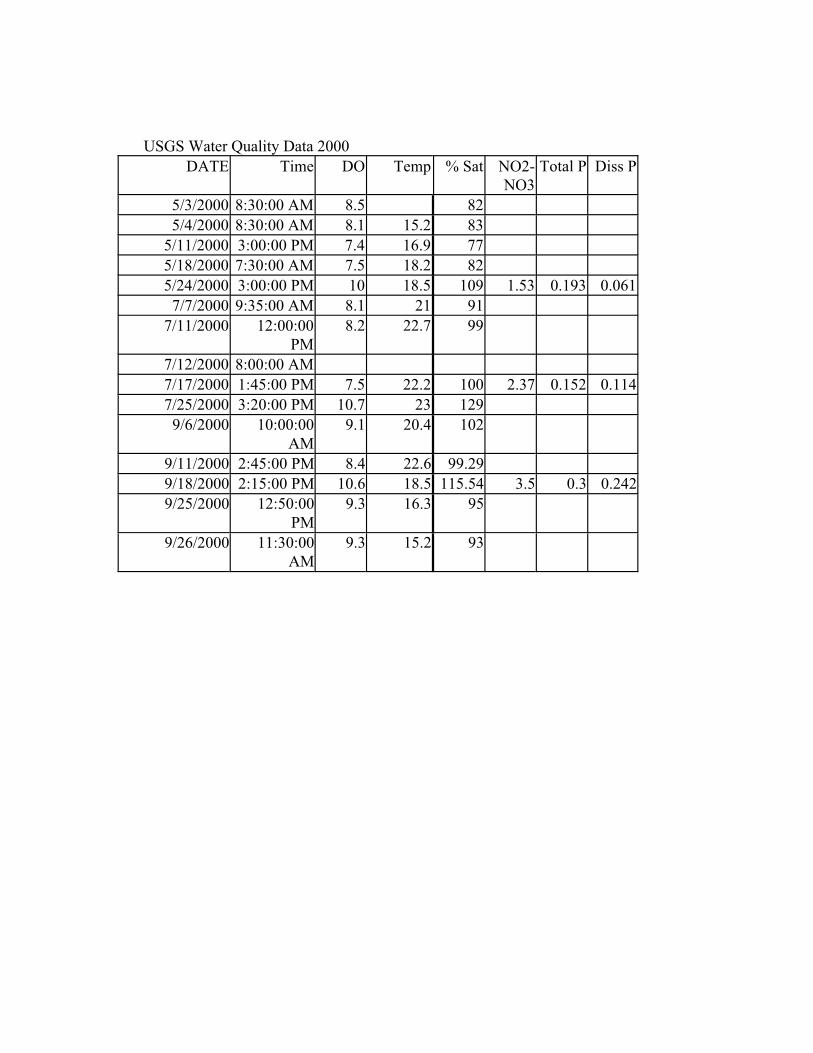
USGS Water Quality Data 2000
DATE Time DO Temp % Sat NO2-
NO3
Total P Diss P
5/3/2000 8:30:00 AM 8.5 82
5/4/2000 8:30:00 AM 8.1 15.2 83
5/11/2000 3:00:00 PM 7.4 16.9 77
5/18/2000 7:30:00 AM 7.5 18.2 82
5/24/2000 3:00:00 PM 10 18.5 109 1.53 0.193 0.061
7/7/2000 9:35:00 AM 8.1 21 91
7/11/2000 12:00:00
PM
8.2 22.7 99
7/12/2000 8:00:00 AM
7/17/2000 1:45:00 PM 7.5 22.2 100 2.37 0.152 0.114
7/25/2000 3:20:00 PM 10.7 23 129
9/6/2000 10:00:00
AM
9.1 20.4 102
9/11/2000 2:45:00 PM 8.4 22.6 99.29
9/18/2000 2:15:00 PM 10.6 18.5 115.54 3.5 0.3 0.242
9/25/2000 12:50:00
PM
9.3 16.3 95
9/26/2000 11:30:00
AM
9.3 15.2 93
References
Cooke, G. Dennis and Welch, Eugene B. et. al. 1986. Lake and Reservoir Restoration,
Butterworth Pub Boston, MA. (392 pp)
Janus, L. L. and Vollenweider, R.A. 1981. The OECD Cooperative Programme on
Eutrophication. Canadian Contribution, NWRI, Canada Centre for Inland Waters,
Scientific Series 131, Burlington, Ontario.
Heidelberg College Water Quality Laboratory. 2002. Unpublished data. Heidelberg College,
Tiffin, OH.
Karr, J.R. 1991. Biological integrity: A long-neglected aspect of water resource
management.Ecological Applications. 1(1):66-84.
Litke, David W. 1999. Review of Phosphorus Control Measures in the United States and Their
Effects on Water Quality. U.S. GEOLOGICAL SURVEY Water-Resources
Investigations Report 99 4007 . National. Water- quality Assessment Program. Denver,
Colorado.
Marsden, M.W. (1989) Lake restoration by reducing external phosphorus loading: the influence
of sediment phosphorus release. Freshwater Biology, 21, 139-162.
Mathews, William J. 1998. Patterns in Freshwater Fish EcologyChapman and Hall, NY 756 pp.
Meybeck, Michel, Chapman, V. Deborah, and Helmer, Richard (eds.). 1990. Global Freshwater
Quality, A First Assessment.World Health Organization and the United Nations
Environment Programme. Blackwell
OEPA. 1987a. Biological criteria for the protection of aquatic life. Volume I. The role of
biological data in water quality assessments. Division of Water Quality Monitoring
andAssessment, Surface Water Section, Columbus, Ohio.
OEPA. 1987b. Biological criteria for the protection of aquatic life. Volume II. Users manualfor
biological field assessment of Ohio surface waters. Division of Water Quality
Monitoringand Assessment, Surface Water Section, Columbus, Ohio.
OEPA. 1999. Association Between Nutrients, Habitat, and the Aquatic Biota in Ohio Rivers and
Streams. OEPA Technical Bulletin MAS/1999-1-1. Columbus, OH.
OEPA, Biological and Water Quality Study of the Cuyahoga River - EAS/1992-12-11
OEPA, Biological and Water Quality Study of the Cuyahoga River and Selected Tributaries;
Geauga, Portage, Summit and Cuyahoga Counties (Ohio). Volume 1. Appendices,
Volume 2 - MAS/1998-12-4
OEPA, Biological and Water Quality Study of the Little Cuyahoga River and Tributaries -
MAS/1997-12-9
Ohio EPA, 1999. Association between Nutrients, Habitat, and the Aquatic Biota in Ohio
Riversand Streams, Ohio EPA Technical Bulletin MAS/1999-1-1.
Ohio EPA, 2000. Biological and water Quality Study of Sugar Creek, 1998.Wayne,
Stark,Holmes and Tuscarawas Counties, Ohio. OEPA Technical Report MAS/1999-12-4.
Rankin, E. T. 1989. The qualitative habitat evaluation index (QHEI), rationale, methods,
andapplication. Ohio Environmental Protection Agency, Division of Water Quality
Planning andAssessment, Ecological Assessment Section, Columbus, Ohio.
Rankin, E. T. 1995. The use of habitat indices in water resource quality assessments, pp. 181-
208. in Biological Assessment and Criteria: Tools for Water Resource Planning and
DecisionMaking, Davis, W.S. and Simon, T.P. (eds.), Lewis Publishers, Boca Raton, FL.
Richards, R. Peter. 2002. Reports from the Ohio Tributary Monitoring Program, 3. Unit-area
loads of sediment, nutrients, and chloride. WQL Technical Report Series at
http://www.heidelberg.edu/wql/publish.html#reports. Tiffin, OH.
Ruttner, Franz.1973. Fundamentals of Limnology. 3rd Edition. University of Toronto Press,
Toronto.Sharpley, A. N., Chapra, S. C., Wedepohl, R., Sim, J. T., Daniel, T. C. and K. R.
Reddy. 1994.Managing agricultural phosphorus for protection of surface waters: Issues
and options.Journal of Environmental Quality. 23: 437-451.
Smith, Val H.. 1998. Cultural eutrophication of inland, estuarine, and coastal waters. pp. 7-49 in
M.L Pace and P.M. Groffman (eds.), Successes, Limitations and Frontiers in Ecosystem
Science. Springer-Verlag, New York.
Smith, Val H.. 1982. The nitrogen and phosphorus dependence of algal biomass in lakes: An
empirical and theoretical analysis. Limnol. Oceanogr., 27(6), 1101-1112.
Simonsen, J. F. and P. Harremoes. 1978. Oxygen and pH Fluctuations in Rivers. Water Res. 12,
477-89.
Smith, V.H., 1998. Cultural eutrophication of inland, estuarine, and coastal waters. pp. 7-49 in
M.L Pace and P.M. Groffman (eds.), Successes, Limitations and Frontiers in Ecosystem
Science. Springer-Verlag, New York.
Soil and Water Conservation District of Northern Halifax. 2002. Organization for Economic
Cooperation and Development (OECD) in http://lakes.chebucto.org/#eutrophication.
Thoma, Roger F. 2002. Correlation between Nutrient Stimulation and Presence of Omnivorous
Fish along the Lake Erie Nearshore, pp. 187-199 in Biological Response Signatures:
Indicator Patterns Using Aquatic Communities, Simon, Thomas P. (ed). CRC Press.
Boca Raton, FL.
USEPA 1976. Quality criteria for water. U.S. Environmental Protection Agency. Office ofWater.
U.S. Environmental Protection Agency, Washington, D.C..
USEPA. 1991. Guidance for water quality-based decisions: the TMDL process, EPA 440/4-91-
001. Office of Water. U.S. Environmental Protection Agency, Washington, D.C..
USEPA. 1997. Technical guidance manual for developing total maximum daily loads Book
2:Streams and rivers. Part 1: Biochemical oxygen demand/ dissolved oxygen and
nutrients/eutrophication. EPA 823-B-97-002. Office of Water. U.S. Environmental
Protection Agency, Washington, D.C..
USEPA 2000. Stressor Identification Guidance Document. EPA. Office of Water, Office of
Research and Development. U.S. Environmental Protection Agency, Washington, D.C..
Vollenweider, R.A., and Kerekes, J. 1982. Eutrophication of Waters. Monitoring, Assessment
and Control. Organization for Economic Co-Operation and Development (OECD), Paris.
156p.)
Yoder, C.O. 1991. Answering some concerns about biological criteria based on experience
inOhio. In Gretchin H. Flock, editor. Water Quality Standards 21st Century. Proceedings
of aNational Conference. U.S. EPA, Office of Water, Washington, DC.