CD15, CD24, and CD29 Define a Surface Biomarker Code for...
13
EMBRYONIC STEM CELLS/INDUCED PLURIPOTENT STEM CELLS CD15, CD24, and CD29 Define a Surface Biomarker Code for Neural Lineage Differentiation of Stem Cells JAN PRUSZAK,WESLEY LUDWIG,ALEXANDRA BLAK,KAMBIZ ALAVIAN,OLE ISACSON McLean Hospital/Harvard Medical School, Center for Neuroregeneration Research, Belmont, Massachusetts, USA Key Words. Stem cells • Neurons • Brain tumors • Flow cytometry • Transplantation • Surface antigens • Cell Therapy • Epithelial- mesenchymal transition ABSTRACT Identification and use of cell surface cluster of differentia- tion (CD) biomarkers have enabled much scientific and clini- cal progress. We identify a CD surface antigen code for the neural lineage based on combinatorial flow cytometric analy- sis of three distinct populations derived from human embry- onic stem cells: (1) CD15 1 /CD29 HI /CD24 LO surface antigen expression defined neural stem cells; (2) CD15 2 /CD29 HI / CD24 LO revealed neural crest-like and mesenchymal pheno- types; and (3) CD15 2 /CD29 LO /CD24 HI selected neuroblasts and neurons. Fluorescence-activated cell sorting (FACS) for the CD15 2 /CD29 LO /CD24 HI profile reduced proliferative cell types in human embryonic stem cell differentiation. This eliminated tumor formation in vivo, resulting in pure neuro- nal grafts. In conclusion, combinatorial CD15/CD24/CD29 marker profiles define neural lineage development of neural stem cell, neural crest, and neuronal populations from human stem cells. We believe this set of biomarkers enables analysis and selection of neural cell types for developmental studies and pharmacological and therapeutic applications. STEM CELLS 2009;27:2928–2940 Disclosure of potential conflicts of interest is found at the end of this article. INTRODUCTION Differentiating human pluripotent stem cells mirror all stages of cell development and lineages [1] and could represent an unlimited source of cells for therapeutic paradigms in regenera- tive medicine [2, 3]. Mouse and human embryonic stem (ES) cells, induced pluripotent stem (iPS) cells, or nuclear transfer cells have been used experimentally to develop analytical and cell replacement approaches for neurological disorders [4–8]. Functional recovery has been achieved in animal models of dis- ease [7, 9], and clinical data on cell therapy in the nervous sys- tem using human fetal material, although controversial [10], has shown proof-of-principle success [11–14]. Pluripotent stem cells, however, carry a risk of uncontrolled growth [15], and af- ter transplantation, tumors of neural and non-neural (teratoma) tissue origin have been observed [7, 9, 16]. The occurrence of tumors in applications of pluripotent stem cell-derivatives man- dates precise cell selection steps [17, 18]. Fluorescence-acti- vated cell sorting (FACS) is an approach to eliminate non-neu- ral cells from mixed cell preparations derived from ES cells for in vitro and in vivo studies [15, 19]. Such cell-sorting strategies require novel biomarkers to enable the selection of specific cell populations of potential therapeutic and scientific value for the fields of regenerative medicine and stem cell biology [15, 17, 18]. The combinato- rial detection of surface markers by multicolor flow cytometry has been widely applied in the fields of hematology and im- munology [20, 21], but has up to now only been marginally exploited in neurobiology [22–25]. A recent surface marker screen yielded an initial documentation of cluster of differen- tiation (CD) antigens expressed during human ES (hES) neu- ral differentiation [15], but on the whole, the neural lineage remains yet to be defined according to a combinatorial surface antigen code [17]. Previous studies utilized genetic fluorescent markers such as Tau-GFP [26], Synapsin-GFP [15], Pitx3-GFP [27], or dye labeling [28] to isolate mature, differentiated neurons. How- ever, clinical applicability of such cell isolation methods anal- ogous to hematological diagnosis and therapy depends on the usage of surface markers. We and others previously applied FACS methodology optimized for neural cell selection [15] to successfully eliminate tumor-generating proliferative cells from ES cell- [15, 19, 27, 29] as well as iPS-cell-derived [6] neural cell populations. Importantly, FACS is routinely applied in hematological cell transplantation to generate clini- cal-grade cell preparations of high purity [21]. In addition, there is considerable analytical value in the identification and isolation of multiple neural subsets exclusively by surface antigens: this eliminates the need for a genetic reporter and Author contributions: J.P.: Conception and design, collection and/or assembly of data, data analysis and interpretation, manuscript writing, final approval of manuscript; W.L.: Administrative support, collection and/or assembly of data, data analysis and interpretation; A.B., K.A.: Collection and/or assembly of data; O.I.: Conception and design, grant support, data analysis and interpretation, manuscript writing, final approval of manuscript. Grant support: National Institutes of Health grant (P50NS39793); Michael Stern Foundation; Orchard Foundation; Consolidated Anti- Aging Foundation; Harold and Ronna Cooper Family. Correspondence: Ole Isacson, M.D., McLean Hospital/Harvard Medical School, Center for Neuroregeneration Research, 115 Mill Street, Belmont, Massachusetts 02478, USA. Telephone: 617-855-3283; Fax: 617-855-3284; e-mail: [email protected]; or Jan Pruszak, M.D., as above; e-mail: [email protected]. Received April 7, 2009; accepted for publication August 20, 2009; first pub- lished online in STEM CELLS EXPRESS September 1, 2009. V C AlphaMed Press 1066-5099/2009/$30.00/0 doi: 10.1002/stem.211 STEM CELLS 2009;27:2928–2940 www.StemCells.com
Transcript of CD15, CD24, and CD29 Define a Surface Biomarker Code for...
EMBRYONIC STEM CELLS/INDUCED PLURIPOTENT STEM CELLS
CD15, CD24, and CD29 Define a Surface Biomarker Code for Neural
Lineage Differentiation of Stem Cells
JAN PRUSZAK, WESLEY LUDWIG, ALEXANDRA BLAK, KAMBIZ ALAVIAN, OLE ISACSON
McLean Hospital/Harvard Medical School, Center for Neuroregeneration Research, Belmont, Massachusetts, USA
Key Words. Stem cells • Neurons • Brain tumors • Flow cytometry • Transplantation • Surface antigens • Cell Therapy • Epithelial-
mesenchymal transition
ABSTRACT
Identification and use of cell surface cluster of differentia-tion (CD) biomarkers have enabled much scientific and clini-cal progress. We identify a CD surface antigen code for theneural lineage based on combinatorial flow cytometric analy-sis of three distinct populations derived from human embry-onic stem cells: (1) CD151/CD29HI/CD24LO surface antigen
expression defined neural stem cells; (2) CD152/CD29
HI/
CD24LO revealed neural crest-like and mesenchymal pheno-
types; and (3) CD152/CD29
LO/CD24
HIselected neuroblasts
and neurons. Fluorescence-activated cell sorting (FACS) for
the CD152/CD29LO/CD24HI profile reduced proliferative celltypes in human embryonic stem cell differentiation. Thiseliminated tumor formation in vivo, resulting in pure neuro-nal grafts. In conclusion, combinatorial CD15/CD24/CD29marker profiles define neural lineage development of neuralstem cell, neural crest, and neuronal populations from
human stem cells. We believe this set of biomarkers enablesanalysis and selection of neural cell types for developmental
studies and pharmacological and therapeutic applications.STEM CELLS 2009;27:2928–2940
Disclosure of potential conflicts of interest is found at the end of this article.
INTRODUCTION
Differentiating human pluripotent stem cells mirror all stagesof cell development and lineages [1] and could represent anunlimited source of cells for therapeutic paradigms in regenera-tive medicine [2, 3]. Mouse and human embryonic stem (ES)cells, induced pluripotent stem (iPS) cells, or nuclear transfercells have been used experimentally to develop analytical andcell replacement approaches for neurological disorders [4–8].Functional recovery has been achieved in animal models of dis-ease [7, 9], and clinical data on cell therapy in the nervous sys-tem using human fetal material, although controversial [10], hasshown proof-of-principle success [11–14]. Pluripotent stemcells, however, carry a risk of uncontrolled growth [15], and af-ter transplantation, tumors of neural and non-neural (teratoma)tissue origin have been observed [7, 9, 16]. The occurrence oftumors in applications of pluripotent stem cell-derivatives man-dates precise cell selection steps [17, 18]. Fluorescence-acti-vated cell sorting (FACS) is an approach to eliminate non-neu-ral cells from mixed cell preparations derived from ES cells forin vitro and in vivo studies [15, 19].
Such cell-sorting strategies require novel biomarkers toenable the selection of specific cell populations of potentialtherapeutic and scientific value for the fields of regenerative
medicine and stem cell biology [15, 17, 18]. The combinato-rial detection of surface markers by multicolor flow cytometryhas been widely applied in the fields of hematology and im-munology [20, 21], but has up to now only been marginallyexploited in neurobiology [22–25]. A recent surface markerscreen yielded an initial documentation of cluster of differen-tiation (CD) antigens expressed during human ES (hES) neu-ral differentiation [15], but on the whole, the neural lineageremains yet to be defined according to a combinatorial surfaceantigen code [17].
Previous studies utilized genetic fluorescent markers suchas Tau-GFP [26], Synapsin-GFP [15], Pitx3-GFP [27], or dyelabeling [28] to isolate mature, differentiated neurons. How-ever, clinical applicability of such cell isolation methods anal-ogous to hematological diagnosis and therapy depends on theusage of surface markers. We and others previously appliedFACS methodology optimized for neural cell selection [15] tosuccessfully eliminate tumor-generating proliferative cellsfrom ES cell- [15, 19, 27, 29] as well as iPS-cell-derived [6]neural cell populations. Importantly, FACS is routinelyapplied in hematological cell transplantation to generate clini-cal-grade cell preparations of high purity [21]. In addition,there is considerable analytical value in the identification andisolation of multiple neural subsets exclusively by surfaceantigens: this eliminates the need for a genetic reporter and
Author contributions: J.P.: Conception and design, collection and/or assembly of data, data analysis and interpretation, manuscriptwriting, final approval of manuscript; W.L.: Administrative support, collection and/or assembly of data, data analysis and interpretation;A.B., K.A.: Collection and/or assembly of data; O.I.: Conception and design, grant support, data analysis and interpretation, manuscriptwriting, final approval of manuscript.Grant support: National Institutes of Health grant (P50NS39793); Michael Stern Foundation; Orchard Foundation; Consolidated Anti-Aging Foundation; Harold and Ronna Cooper Family.
Correspondence: Ole Isacson, M.D., McLean Hospital/Harvard Medical School, Center for Neuroregeneration Research, 115 Mill Street,Belmont, Massachusetts 02478, USA. Telephone: 617-855-3283; Fax: 617-855-3284; e-mail: [email protected]; or Jan Pruszak,M.D., as above; e-mail: [email protected]. Received April 7, 2009; accepted for publication August 20, 2009; first pub-lished online in STEM CELLS EXPRESS September 1, 2009. VC AlphaMed Press 1066-5099/2009/$30.00/0 doi: 10.1002/stem.211
STEM CELLS 2009;27:2928–2940 www.StemCells.com

enables close monitoring of stem cell differentiation using arapid quantitative readout. In summary, although the technol-ogy is feasible and available, it has not been extensivelyapplied due to a lack of a comprehensive combinatorialmarker analysis.
Here, our aim was to discover a surface antigen profile ofneural lineage differentiation by identifying and characterizingspecific neural cell subsets derived from pluripotent stemcells.
MATERIALS AND METHODS
Pluripotent Stem Cell Culture and Differentiation
Work with hES cells was approved by the Partners EmbryonicStem Cell Research Oversight Committee. Undifferentiatedhuman ES cell lines H7 (WA-07, XX, passages 40-65) and H9(WA-09, XX, passages 35-45) were cultured under growth condi-tions and passaging techniques previously described [7]. In vitroanalysis was done with both hES cell lines, the transplantationassay was done with H9. Undifferentiated hES cell cultures weremaintained on mitotically inactivated human fibroblasts (D551;ATCC, Manassas, VA, http://www.atcc.org). Human ES cell neu-ronal induction and differentiation were achieved, essentially aspreviously described [7, 15]: a neural induction phase on stromalfeeder cells with 300 ng/ml of Noggin was followed by carefulmanual selection of neural rosettes using microdissection (at 21div) and subsequent culture on laminin/poly-ornithine substratewith N2-based medium (42 div and beyond) [30]. Mouse ES andinduced pluripotent stem (iPS) cell neuronal differentiation wasdone in a five-stage embryoid body-based protocol as previouslydescribed [6, 27, 31]. Cell lines used were as follows: mouse EScell lines J1 and R1 (both ATCC), Pitx3-GFP (M. Li; see Hed-lund et al. [27]); Sox1-GFP (A. Smith; see Chung et al. [19]); theOct4-selected mouse iPS cell line O9 (R. Jaenisch; see Werniget al., 2007, 2008 [6, 32]).
Neural Surface Antigen Staining
Cells were harvested and gently dissociated using TrypLEExpress (Invitrogen/Gibco, Carlsbad, CA, http://www.invitrogen.com). Cells were filtered through cell strainer caps (35-lm mesh;BD Biosciences, San Diego, http://www.bdbiosciences.com) toobtain a single cell suspension (approximately 106 cells per mlfor analysis, 0.5–2 � 107 cells per ml for sorting). Cell viabilitywas routinely determined to be above 90% by trypan blue dyeexclusion before use for analysis and sorting experiments. Spe-cies-specific antibodies were used whenever available; the CD15and FORSE-1 antibodies were found to label neuroepithelial celltypes on both mouse and human cell sources. For colocalizationassays on neural precursors (Fig. 1B), H7 cells were infected atday in vitro (div) 21 with lentivirus containing a Nestin-GFP re-porter (Isacson et al., unpublished). FORSE-1, SSEA-1, andSSEA-3 antibodies were obtained from the Developmental Stud-ies Hybridoma Bank developed under the auspices of the NICHDand maintained by the University of Iowa, Department of Biolog-ical Sciences, Iowa City, IA 52242. Surface antigens were labeledby incubating with the primary antibodies (see supporting infor-mation Table 1) for 20 minutes at room temperature, followed byincubation for 20 minutes with the appropriate Alexafluor-488 orAlexafluor-647 fluorescent secondary antibodies. Alternatively,coniugated antibodies were used (BD Pharmingen, San Diego,http://www.bdbiosciences.com). All washing steps were per-formed in cold phenol-free, Ca2þ-free, Mg2þ-free Hank’s buf-fered saline solution (Invitrogen/Gibco) containing penicillin-streptomycin (Invitrogen/Gibco), 20 mM D-glucose (Sigma, St.Louis, http://www.sigmaaldrich.com), and 2% fetal bovine serum(HyClone, Logan, UT, http://www.hyclone.com) [15].
Flow Cytometry and Cell Sorting
The stained cells were analyzed and sorted on a fluorescence-acti-vated cell sorter FACSAria (BD Biosciences) using FACSDivasoftware (BD Biosciences); data were additionally analyzed usingFlowJo software (Tree Star, Ashland, OR, http://www.treestar.com). The fluorochromes were excited with the instrument’sstandard 488-nm and 633-nm lasers, and green fluorescence wasdetected using 490 LP and 510/20 filters and far-red fluorescenceusing 660/20 filters. Fluorescence was determined by analysis andgating against appropriate controls (unstained, secondary anti-body-only, GFP-negative cells) at an identical stage of maturityand prepared in parallel. For triple staining, analysis was done inthe green, red, and far-red channels. Cell populations of interestwere gated to count a minimum of 10,000 live-gate events,excluding doublets, based on forward and side scatter of controlsamples. All flow cytometric analyses and sorts were repeated atleast three times. Gates determining positivity were set so thatless than 0.5% of positive events were present when acquiringthe corresponding negative control. Gates for ‘‘high’’ (HI) versus‘‘low’’ (LO) populations were set in comparison to the appropri-ate non-fluorescent control and adjusted to include visually dis-cernable clusters, if revealed by combinatorial staining. To assurespecificity, appropriate separation of sorted fractions was verifiedvisually and by FACS reanalysis of the subsets defined in thatmanner (>80% enrichment post-sort) as described before [19].Prior to aseptic sorting, the nozzle, sheath, and sample lines weresterilized with 70% ethanol for 15 minutes, followed by washeswith sterile water to remove remaining decontaminant. A 100-lmceramic nozzle (BD Biosciences), sheath pressure of 20-25 PSI,and an acquisition rate of 1,000-3,000 events per second wereused as conditions optimized for neuronal cell sorting (‘‘gentleFACS’’) as previously described [15].
Flow Cytometric Analysis of IntracellularNeural Antigens
Staining for intracellular antigens was done using commerciallyavailable fixation and buffer solutions IntraCyte fix solution,wash solution, and block reagent (Neuromics, www.neuromics.com). After careful validation and titration, the following antibod-ies were used at dilutions optimized for flow cytometric analysis:bIII tubulin (TuJ1), doublecortin, TH, MAP2, Pax3 (see support-ing information Table 2). It should be noted that different pri-mary antibodies against the intracellular antigens stain with vary-ing levels of background fluorescence, enabling relativecomparison between groups, but not an absolute quantitation. Forcombined surface and intracellular antigen detection, live cellswere stained for surface antigens as described above, followed byfixation and permeabilization to stain the intracellular epitopes.
Embryonic Central Nervous System TissueDissection and Dissociation
Timed pregnant C57BL/6 mice (Jackson ImmunoResearch, WestGrove, PA, http://www.jacksonimmuno.com) were anesthetizedwith intraperitoneal sodium pentobarbital (300 mg/kg) anddecapitated. Primary fore- and midbrain tissue was obtained fromE13 mouse embryos (Charles River, Wilmington, MA, http://www.criver.com) using a dissecting microscope. The overlyingscalp tissue and the outer meninges were removed entirely to ex-pose forebrain and midbrain tissue, which were dissected asdescribed in detail elsewhere [33]. For isolation of spinal cord tis-sue, a longitudinal paramedian cut along the dorsal midline wasperformed, and the spinal cord was isolated using forceps andmicroscissors. Dissected primary neural tissue was incubated withTrypLE express (Invitrogen/Gibco, Carlsbad, CA), and gently dis-sociated with fire-polished Pasteur pipettes. For FACS analysis andcell sorting, cells were resuspended in Hank’s Buffered Salt Solu-tion (HBSS)-buffered glucose solution, filtered through a 35 lmmesh and brought to a concentration of 0.5–2.0 � 106 cells/ml.
Pruszak, Ludwig, Blak et al. 2929
www.StemCells.com

Immunofluorescence, Imaging, and In Vitro Analysis
Indirect immunofluorescence was performed on 4% paraformalde-
hyde-fixed cell cultures and brain tissue. Fixed cells were incubated
in a blocking solution consisting of 10% normal donkey or goat se-
rum (Jackson ImmunoResearch Laboratories Inc., West Grove, PA,
USA) and 0.1% Triton X-100 (Sigma, St Louis) in 0.1 M phos-
phate-buffered saline (PBS) for 1 h at room temperature. Primary
antibodies were diluted in blocking solution and added to the cells.
Dilutions of the primary antibodies used were as listed in support-
ing information Table 2. Antibody concentrations for detection of
surface antigens were determined by titration assays using flow
cytometric analysis and immunocytochemistry, including staining of
viable, attached ES cell and primary neural cultures as previously
described [15]. The appropriate fluorescence-labeled secondary anti-
bodies (Alexafluor goat or donkey anti-rabbit, -mouse, or -sheep
488, 594, 647; Molecular Probes, Eugene, OR, http://probes.invitro-
gen.com; 1:500) were applied for visualization, and nuclei were
counterstained with Hoechst 33,342 (Molecular Probes, Invitrogen,
Carlsbad, CA; 5 lg/ml). On selected samples, the primary antibody
was omitted to verify specificity of staining.For visual microscopic analysis, quantification was performed
by counters blinded to experimental groups on the stained
Figure 1. Surface antigen expression profiles of neural cell types. (A) Study design. Screening for surface antigens expressed during neural dif-ferentiation of hESC enables the discovery of specific neural cell subsets according to a combination of these markers. These are subsequentlyselected by FACS for detailed characterization in vitro and in vivo. (B) Genetic fluorescent markers such as Nestin-GFP identify neural precursorcells derived from human ES cells. Cells gated as the Nestin-GFPþ fraction did not express immature stem cell markers such as SSEA-3. Surfaceantigen expression analysis proved essential to detect the presence of additional distinct cell populations within the neural subset, for example,displaying discrete levels of CD29 (� / LO / HI) and FORSE1 (�/ þ) antigen expression. Control gates as indicated were set against correspondingnegative controls (<0.5%). (C) Profiling of surface antigens such as carbohydrate epitopes (CD15 [SSEA1; Lewis- X]; FORSE1), beta1-integrin(CD29), and sialoglycoprotein epitopes such as the glycosylphosphatidylinositol-linked heat-stable antigen CD24 [BA-1; small-cell lung carci-noma cluster four antigen; nectadrin] and the immunoglobulin superfamily member CD56 [NCAM] on neurally differentiated human ES cellswas obtained by flow cytometric analysis (div 42; three independent experiments). Representative percentages of cells positively stained withinthe overall live cell population. Abbreviations: ES ¼ embryonic stem; FACS ¼ fluorescence-activated cell sorting; hESC ¼ immature human em-bryonic stem cells; hES NP ¼ neurally induced hES cells at the neuroepithelial precursor stage (21-39 div); hES ND ¼ hES cells at neuronal dif-ferentiation stage (40þ div).
2930 CD15, CD24, CD29: A Neural Surface Biomarker Code

coverslips using an integrated Axioskop-2 microscope (CarlZeiss, Thornwood, NY, http://www.zeiss.com) and Stereoinvesti-gator image-capture equipment and software (MicroBrightField,Williston, VT, www.mbfbioscience.com). A contour was drawnaround each coverslip to identify the area of interest. A physicaldissector probe was utilized, and counting frames were placed ina systematically random manner at �100 sites per coverslip. Foreach experiment, an average of 2,000 cells was scored.
Quantitative RT-PCR Gene Expression Analysis
Total RNA was extracted by using the RNeasy kit and DNase Itreatment (Qiagen, Valencia, CA). RNA samples from NS, NC,and ND populations were reverse-transcribed into cDNA usingSensiscript reverse transcriptase (Qiagen, Valencia, CA, http://www1.qiagen.com) and oligo dT as the primer. Polymerase chainreactions (PCRs) were set up in 25 ll reaction volume usingSYBR Green PCR Master Mix (Applied Biosystems, Foster City,CA, http://www.appliedbiosystems.com). Primers for each candi-date gene were designed using MacVector 7.0 and used with afinal concentration of 250 nM. See supporting information Table3 for a list of primers used. For each primer pair, duplicates ofthree independently collected samples were compared to quantifyrelative gene expression differences between these cells. Beta-actin was used as an internal control gene.
Immunoblotting
Cells and tissue samples were collected from and suspended inlysis buffer containing the following: 50 mM Tris-HCl, 0.15 MNaCl, 0.32 M sucrose, 1.0 mM EDTA, and 1% NP-40. In addi-tion, phosphatase inhibitors I and II (1:100) and protease inhibi-tors (1:100) were added fresh before cell lysis (P2850, P5276,and P8340, respectively; Sigma). After cell lysis, the homogenatewas centrifuged, a portion of the supernatant was reserved forprotein determination (BCA Assay; Pierce, Rockford, IL, http://www.piercenet.com), and the remainder was stored at –20�C.Solubilized protein (40 lg) was mixed 1:1 with sample bufferand boiled for 5 minutes. The samples and molecular weightstandards were separated using the Criterion precast 4-15% SDS–polyacrylamide gel system (Bio-Rad, Hercules, CA). After elec-trophoresis, the proteins were electrically transferred to polyviny-lidene difluoride membranes at 100 V for 30 minutes. After trans-fer, blots were incubated in Tris-buffered saline with 0.1%Tween 20 containing 5% BSA. Subsequently, blots were incu-bated with the TuJ1 primary antibody (1:2000; Covance, Prince-ton, NJ, http://www.covance.com) at 4�C overnight. Horseradishperoxidase (HRP)-conjugated secondary antibodies were thenapplied, and immunoreactive bands were visualized with chemilu-minescence (GE Healthcare, Little Chalfont, U.K., http://www.ge-healthcare. com) and exposed onto film. Immunoblots were thenstripped and reprobed for the expression of ß-actin (1:10,000;Abcam, Cambridge, MA, http://www.abcam.com) serving as aloading control. Optical density analysis (NIH Image, http://rsb.info.nih.gov/nih-image/) was used to determine the relativeabundance of protein in each sample.
Transplantation of Purified Neural Cell Populationsand In Vivo Analysis
Animal studies were approved by the Institutional Animal Careand Use Committee at McLean Hospital and Harvard MedicalSchool. Naı̈ve and unilaterally 6-hydroxydopamine-lesioned adultfemale Sprague-Dawley rats (200-250 g) were purchased fromTaconic (Germantown, NY, http://www.taconic.com). AfterFACS purification (see above), differentiated hES cells werecounted and resuspended at �25,000 viable cells per ll in thefinal differentiation medium. For each surgery, animals weredeeply anesthetized with ketamine and xylazine (60 and 3 mg/kg,respectively, i.m.). Injections were performed as previouslydescribed [30]. Two to four ll were slowly injected into striatumof the rats (anterior-posterior ¼ 0; lateral ¼ –2.8 from bregmaand from –5.5 to –4.5 mm ventral from dura, with the tooth bar
set at –3.3). For analysis at five weeks, naı̈ve animals receivedNS, NC, and ND cell suspensions in bilateral grafts (eight pergroup). In addition, eight lesioned rats unilaterally received NDcell suspension to be analyzed at 10 weeks post-transplantation.Rats were immunosuppressed with cyclosporin A (15 mg/kg perday; Sandimmune; Sandoz, East Hannover, NJ, http://www.san-doz.com) starting 1 day prior to surgery. Five and/or ten weeksafter transplantation, animals were terminally anesthetized by anintraperitoneal overdose of pentobarbital (150 mg/kg) and per-fused intracardially with 70 ml of heparinized saline (0.1% hepa-rin in 0.9% saline) followed by 100 ml of paraformaldehyde (4%in phosphate-buffered saline). Brains were removed, postfixed for4 hours in 4% paraformaldehyde, equilibrated in sucrose (20% inPBS), and sectioned on a freezing microtome in 40-lm slices thatwere serially collected and stored in cryoprotectant. Two full se-ries of sections were processed for visualization of the respectiveantigens using immunofluorescence staining, as described above.To identify human cells in the rodent brain, we used the human-specific antibody against human nuclear antigen (1:50; Chemicon/Millipore, Billerica, MA, http://www.millipore.com) and immuno-histochemical characterization for human/primate NCAM (Eric-1;Santa Cruz Biotechnology Inc., Santa Cruz, CA, http://www.scbt.com) and human/primate Nestin (Neuromics, Edina,MN, http://www.neuromics.com). The sections were permeabil-ized with 0.1% Triton X-100 and incubated with primary antibod-ies in 2% normal donkey serum overnight at 4�C. After rinsing,sections were incubated with appropriate fluorescence-labeledsecondary antibodies (Alexafluor; Molecular Probes/Invitrogen,Carlsbad, CA; 1:500) for 1 hour at room temperature, rinsed, andincubated with Hoechst 33,342 (5 lg/ml). Sections were mountedonto Superfrost Plus glass slides (Fisher Scientific, Pittsburgh,PA, http://www.fisherscientific.com), and confocal analysis wasperformed using a Zeiss LSM510/Meta station. For identificationof signal colocalization within a cell, optical sections were keptto a minimal thickness, and orthogonal reconstructions were ana-lyzed. Design-based stereology was performed on the specimensusing an integrated bright-field microscope (Axioskop 2; CarlZeiss, Thornwood, NY), confocal microscope (LSM510), andStereoInvestigator image-capture equipment and software (Micro-BrightField, Williston, VT). Graft volumes and ki-67-positive cellcounts were calculated using the Cavalieri estimator and opticalfractionator probes, from one-sixth of the total sections. The coef-ficient of error was used to assess probe accuracy, and p < .05was considered acceptable. The 3D reconstruction was createdfrom one-sixth of the total sections using Neurolucida solid mod-eling software (MicroBrightField). The graft constituent cellratios were calculated by blinded investigators counting cells inseveral [20–30] randomly selected high power fields.
Statistical Analysis
The data were analyzed using a one-way analysis of variance andTukey-Kramer multiple comparisons test or a two-tailed Studentt-test, where appropriate (InStat; GraphPad, San Diego, CA,http://www.graphpad.com; JMP, Cary, NC, http://www.jmp.com).Calculated comparisons of p < .05 were considered significantlydifferent. All reported values represent the mean � SEM.
RESULTS
Identification and prospective isolation of specific cell subsetsusing novel markers would enable more detailed studies ofneural lineage specification (Fig. 1A). We found that the nes-tin-positive population contained additional subpopulationsthat were only detected by analysis for differential expressionof surface antigens (Fig. 1B). Distinct levels of CD15,FORSE-1, CD24, CD29, and CD56 antigens underlined theheterogeneity of neuronal differentiation of hES cells (Fig.1C). Presence of these surface markers was also documented
Pruszak, Ludwig, Blak et al. 2931
www.StemCells.com

on a number of different neural cell types, including humanES cell-derived neurons and neuroblastoma cells, and varieddepending on the time in vitro and/or stage of differentiation(supporting information Fig. 1A, 1B). We therefore investi-gated whether combinatorial analysis for these markers couldyield specific expression patterns (codes) in the developingneural lineage.
Given the rising expression levels of the sialoglycoproteinCD24 (heat-stable antigen; nectadrin; small-cell lung carci-noma cluster four antigen; BA-1) during in vitro developmentfrom ES toward the neuronal differentiation (ND) stage (seesupporting information Fig. 1A, 1B), this antigen was singledout as a potential marker for the prospective enrichment ofdifferentiated neurons. Already at early stages of neural dif-ferentiation (div 14; NP), CD24 expression was observed asevident by utilizing a Sox1-GFP reporter mouse ES cell line[19] (Fig. 2 A, left panel; supporting information Fig. 2A).Presence of CD24 expression on mature neuronal cells typeswas determined by using transgenic mouse knock-in ES cell-derived Pitx3-GFPþ dopamine neurons [27] as an indicator oflate differentiation in ES cell cultures (Fig. 2A, right panel).On human neural cultures derived from hES cells, bivariateFACS analysis identified CD24HI cells to be negative forearly neural markers such as the FORSE1, CD15, and CD146antigens (Fig. 2B). Furthermore, CD24HI cells were alsofound to be negative for CD133 (data not shown), a markerpreviously shown to represent a subset of CD15þ cells in hESneural differentiation [15], and did not costain with Pax 3, aneural crest marker (supporting information Fig. 2D). In vitromaturation of hES neural differentiation culture was paralleledby increased CD24HI surface antigen expression (see support-ing information Fig. 2B–2D). Cell sorting of human ES cell-derived neural cell suspensions enabled the isolation ofCD24HI and CD24LO subpopulations. Post-FACS cell culturesof the CD24HI population were found to be enriched for neu-rons (Fig. 2C, upper row) and contained less proliferativeki67þ cells than the CD24LO fraction (Fig. 2C, lower row).We also found that, using primary mouse brain cell prepara-tions (E13), the neuronal fraction was enriched by selectingfor CD24HI expression (Fig. 2C, supporting information Fig.2E). CD24HI cultures displayed extension of neuronal proc-esses, forming a dense network immunoreactive for neuronalmarkers such as Tuj1, MAP2, and synapsin. Viability ofCD24HI-purified embryonic fore- and midbrain neuronal cul-tures was virtually unaffected by the sorting procedure (sup-porting information Fig. 2F). The CD24LO fraction enrichedfrom hES neural differentiation expressed more Pax6 (14.1-fold enriched; 12.7 � 0.5 versus 0.9 � 0.0% in CD24HI),Vimentin (2.6-fold enriched; 6.8 � 0.4 versus 2.6 � 0.4% inCD24HI) and Nestin (2.7-fold enriched; 36.1 � 1.1 versus13.3 � 2.0% in CD24HI), all markers characteristic of imma-ture neural phenotype (Fig. 2F, left panel). In contrast, theCD24HI cells were strongly positive for central nervous sys-tem (CNS) neuroblast (doublecortin; 13.6-fold enriched; 43.4� 1.0 versus 3.2 � 0.1% in CD24LO) and neuronal markers(TuJ1; 12.8-fold enriched; 46.0 � 0.5 versus 3.6 � 0.1%,Tau; 6.7-fold enriched; 32.8 � 3.0 versus 5.0 � 0.8% inCD24LO) (Fig. 2F, right panel). Our preliminary conclusionwas that CD24HI surface antigen was a marker well correlatedwith the differentiation of neuronal cells.
In contrast, CD15 (stage-specific embryonic antigen-1,Lewis-X antigen), a more immature marker staining a carbo-hydrate epitope (fucosyl-N-acetyl-lactosamine), was absent ondifferentiated neurons, including dopamine neurons identifiedby Pitx3-GFP expression (Fig. 3A). Known as an establishedmouse ES cell and a myeloid differentiation marker [34–37],it is important to note its clear and distinct labeling of mouse
neuroepithelium, as shown on midbrain sections of E13mouse embryos (Fig. 3B). In human ES cell differentiation,CD15 was found to be strongly expressed on Sox1 and Sox2-positive neuroepithelial rosette structures (Fig. 3C). CD15expression was thus determined to be a marker of immature,neuroepithelial cells, enabling their enrichment, or alterna-tively their depletion, for applications in developmental aswell as cell therapeutic paradigms.
Similarly, the CD29 antigen (beta1-integrin) was found topredominantly label the neuroepithelial rosette structures typi-cal of hES neural induction (Fig. 3D). CD29 expressiondecreased from 81.3 � 6.8% at rosette stage (div 21) to 53.6� 4.7% at differentiation (div 42; three independent experi-ments; not shown). At those later stages of in vitro neural dif-ferentiation, remaining clusters of proliferative neural stemcells displayed enhanced expression of CD29 (supporting in-formation Fig. 3A). Doublecortin-positive neuroblastsemerged from such more immature clusters and were negativefor CD15 and also CD29 expression (Fig. 3D). Interestingly,a second population of mesenchyme-like proliferative cells,typically forming a halo around dense neuroepithelial cellgroups, was identified to also strongly express CD29 (Fig.3D; supporting information Fig. 3B). Upon FACS analysisand cell sorting experiments, the CD29HI fraction wasenriched for proliferative spherical clusters as well as prolifer-ative adherent cell types (Fig. 3E). In contrast, the CD29LO
enriched fraction contained predominantly process-bearingpost-mitotic neurons (Fig. 3E). CD29HI contained more nestin(41.5%) and less TuJ1 (25.3 � 0.5%), CD29LO showedreduced nestin (9.6%) and increased TuJ1 (65.6 � 1.1%);TuJ1 in this subset is determined by flow cytometric analysisof intracellular neural antigens (single experiment) (supportinginformation Fig. 3C, 3D). Consistent with those observations,the CD29LO fraction was also enriched for doublecortin-posi-tive cells (50.2 � 14 compared to 9.5 � 3.5 in the CD29HI
population; three independent experiments; supporting infor-mation Fig. 3E).
Our findings thus far suggested that the fraction of neu-rons was augmented by sorting for CD24HI-expressing cells,as well as for CD15� or CD29LO-expressing cells. In contrast,more proliferative cell populations were enriched by isolatingthe CD24LO, the CD15þ, and/or the CD29HI cell subsets (seeFigs. 1–3). In order to fully characterize specific neural sub-populations according to surface antigens, combinatorialFACS analysis for the above and a variety of complimentarysurface markers [15] was performed (Fig. 4A): (i) CD29LO
cells were found to also exhibit CD24HI and CD56HI, a sur-face antigen pattern consistent with differentiation towardsneuroblasts and neurons [15, 38]. (ii) Precursor or stem cellmarkers, such as CD146 [15], FORSE1 [39] or CD15 [15](Fig. 3), CD133 [40], respectively, were present on theCD29MID/HI subset. (iii) Finally, CD29HI cells were found toexpress surface antigens consistent with mesenchymal and/orneural crest phenotypes, such as CD271, CD57, and CD73[41] (Fig. 3). Key populations of neural lineage developmentwere hereby defined according to a CD15/CD24/CD29 surfaceantigen code, as depicted in Figure 4B, 4C. A CD15þ/CD24LO/CD29HI surface antigen profile defined presumptiveneural stem/progenitor cells (NS). In contrast, CD15�/CD24LO/CD29HI expression was characteristic of a presump-tive neural crest/mesenchymal cell population (NC). Finally, aCD15�/CD24HI/CD29LO surface antigen signature defined apresumptive neuronal/neuroblast population (ND). The tempo-ral dynamics of CD15/CD24/CD29 surface expressions invitro were consistent with NS, NC, and ND phenotypes (sup-porting information Fig. 4B, 4C): at later stages of in vitromaturation, a shift toward ND population was observed.
2932 CD15, CD24, CD29: A Neural Surface Biomarker Code

However, also at prolonged differentiation in culture (up to70 div analyzed), all three populations remained present (datanot shown). Ki67þ cells appeared enriched in the NS popula-tion, whereas the central nervous system precursor marker
doublecortin and the neuronal microtubule-associated protein(MAP)-2 were highly expressed in the ND population (sup-porting information Fig. 4A). We then used cell sortingexperiments to isolate these subsets from typical
Figure 2. Qualitative analysis of CD24 as a marker for neuronal differentiation. (A) In mouse embryonic stem (ES) cell differentiation, anincrease in CD24 surface antigen expression levels was concurrent with the upregulation of neural markers, such as Sox1-GFP (left panel). Sox1-GFP-negative cells did not express CD24 (<0.5%; upper left quadrant). Also, differentiated post-mitotic neurons, here exemplified by the markerfor mature dopamine neurons Pitx3-GFP, were characterized to be a subset of the CD24HI population (right panel). 100% of distinctly Pitx3-GFP-positive mES cell-derived neurons showed CD24HI expression (upper right quadrant). Vertical dashed lines (gray) indicate negative versusHI and LO populations of surface marker staining. (B) In human ES-derived cultures at neuronal differentiation stage, CD24HI cells were nega-tive for putative neural precursor or stem cell markers, such as FORSE-1, CD15, and CD146, indicating that CD24 was differentially expressedon differentiating versus proliferative neural cell populations. (C) Qualitative immunocytochemical analysis of neural hES cultures (div 40-45) af-ter sorting according to levels of CD24 surface expression. Post-sort CD24HI cultures (upper row) were found to contain more differentiated neu-rons (FACS reanalysis and phase contrast images). Plated at identical densities post-FACS, the CD24HI population displayed lower cell numbersoverall (Hoechst) and appeared less proliferative (ki67 immunofluorescence) than the CD24LO fraction (lower row). In analogy, using mouse pri-mary midbrain cultures (far right panels), neuronal cells were enriched by selecting for CD24HI. (D) Using conditions optimized for isolation ofdifferentiated neurons [15], CD24HI cultures post-FACS were viable and exhibited signs of further neuronal differentiation and maturation, form-ing a network of neuronal processes stained with neuronal markers such as bIII tubulin and microtubule-associated protein MAP2 (E). (F) Rela-tive expression of established markers of neural differentiation on CD24LO versus CD24HI populations was detected by bivariate flow cytometricanalysis for intracellular antigens on CD24 labeled cell suspensions (see supporting information data). CD24LO cells were strongly positive forthe neuroepithelial marker Pax6 and also for the intermediate filament and precursor cell markers vimentin and nestin (left half). In contrast, theneuroblast marker doublecortin and markers of neuronal differentiation, such as TuJ1 or the microtubule-associated neuronal Tau antigen, werepredominantly expressed on the CD24HI population (right half of panel F). Data is displayed on a logarithmic scale, showing relative expressionof the respective marker on either subset normalized against an unsorted, non-gated control representing the overall population. Scale bars ¼ 50lm. Abbreviations: DCX ¼ doublecortin; FACS ¼ fluorescence-activated cell sorting; hES ND ¼ human embryonic stem cells at neuronal differ-entiation stage; mES ND ¼ murine embryonic stem cells at neuronal differentiation stage; mES NP ¼ neurally induced murine embryonic stemcells at the neuroepithelial precursor stage; TuJ1 ¼ bIII tubulin.
Pruszak, Ludwig, Blak et al. 2933
www.StemCells.com
heterogeneous cell populations differentiated from hES cells(H7 and H9; div 35-42) and found them to be morphologi-cally clearly distinct (Fig. 4C). The CD15þ/CD24LO/CD29HI
subset (NS) was enriched for proliferative clusters, giving riseto neural precursor/neurosphere cultures (Fig. 4D). TheCD15�/CD24LO/CD29HI subset (NC) presented with massiveproliferation of flat, adherent cells after cell sorting. In con-trast, the CD15�/CD24HI/CD29LO subset (ND) represented apurified culture of cells with neuronal morphology (Fig. 4D).
Subsequent detailed in vitro analysis of the neural cellpopulations identified according to CD15/CD24/CD29 expres-sion codes confirmed the prospective isolation of distinct sub-sets consistent with phenotypes of neural stem/progenitor(NS), neural crest/mesenchymal (NC), and neuronal/neuro-blast (ND) cells, respectively (Fig. 5; supporting informationFigs. 2D; 3B, 3C; 4A–4C). Quantitative analysis of geneexpression revealed characteristic expression patterns for the
isolated subsets, with ND cells predominantly expressing bIII-tubulin (2.8-fold increased expression over NS, 6.3-foldincrease over NC population; qRT-PCR; Fig. 5A). Investiga-tions on the protein level mirrored this expression pattern,characterizing ND cells as the fraction with the highest pres-ence of bIII-tubulin (Fig. 5B). Sorting for CD15�/CD24HI/CD29LO (ND) enabled the isolation of viable postmitoticnear-pure neuronal cultures. Under high-purity sorting condi-tions, those cultures were devoid of ki67þ cells (Fig. 5C).Sphere formation assays underlined this reduced proliferativecapacity of the ND (no spheres) versus the other populations(0.6 � 0.2 and 3.2 � 1.5 spheres per well in the NS and NCpopulations, respectively; supporting information Fig. 4E).We then tested the CD15/CD24/CD29 neural surface antigencode combination for its applicability as a marker set enablingthe prospective isolation of specific neural subpopulations intransplantation experiments, for both therapeutic and basic
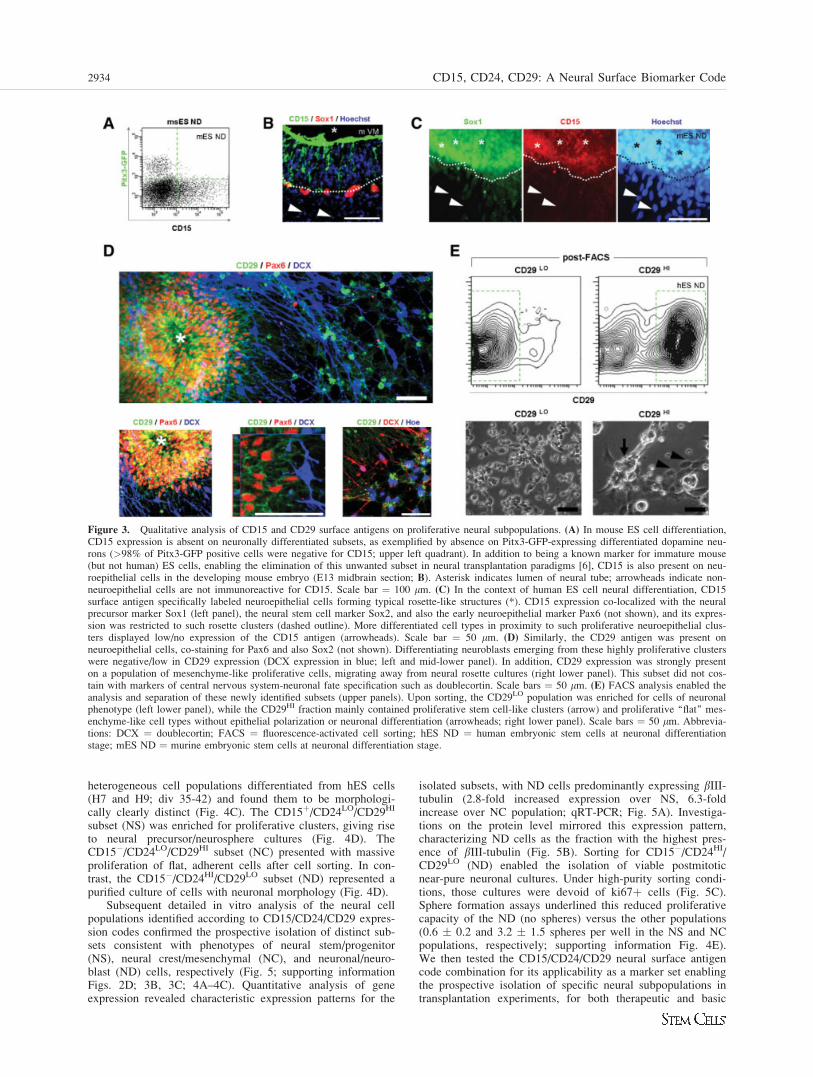
Figure 3. Qualitative analysis of CD15 and CD29 surface antigens on proliferative neural subpopulations. (A) In mouse ES cell differentiation,CD15 expression is absent on neuronally differentiated subsets, as exemplified by absence on Pitx3-GFP-expressing differentiated dopamine neu-rons (>98% of Pitx3-GFP positive cells were negative for CD15; upper left quadrant). In addition to being a known marker for immature mouse(but not human) ES cells, enabling the elimination of this unwanted subset in neural transplantation paradigms [6], CD15 is also present on neu-roepithelial cells in the developing mouse embryo (E13 midbrain section; B). Asterisk indicates lumen of neural tube; arrowheads indicate non-neuroepithelial cells are not immunoreactive for CD15. Scale bar ¼ 100 lm. (C) In the context of human ES cell neural differentiation, CD15surface antigen specifically labeled neuroepithelial cells forming typical rosette-like structures (*). CD15 expression co-localized with the neuralprecursor marker Sox1 (left panel), the neural stem cell marker Sox2, and also the early neuroepithelial marker Pax6 (not shown), and its expres-sion was restricted to such rosette clusters (dashed outline). More differentiated cell types in proximity to such proliferative neuroepithelial clus-ters displayed low/no expression of the CD15 antigen (arrowheads). Scale bar ¼ 50 lm. (D) Similarly, the CD29 antigen was present onneuroepithelial cells, co-staining for Pax6 and also Sox2 (not shown). Differentiating neuroblasts emerging from these highly proliferative clusterswere negative/low in CD29 expression (DCX expression in blue; left and mid-lower panel). In addition, CD29 expression was strongly presenton a population of mesenchyme-like proliferative cells, migrating away from neural rosette cultures (right lower panel). This subset did not cos-tain with markers of central nervous system-neuronal fate specification such as doublecortin. Scale bars ¼ 50 lm. (E) FACS analysis enabled theanalysis and separation of these newly identified subsets (upper panels). Upon sorting, the CD29LO population was enriched for cells of neuronalphenotype (left lower panel), while the CD29HI fraction mainly contained proliferative stem cell-like clusters (arrow) and proliferative ‘‘flat’’ mes-enchyme-like cell types without epithelial polarization or neuronal differentiation (arrowheads; right lower panel). Scale bars ¼ 50 lm. Abbrevia-tions: DCX ¼ doublecortin; FACS ¼ fluorescence-activated cell sorting; hES ND ¼ human embryonic stem cells at neuronal differentiationstage; mES ND ¼ murine embryonic stem cells at neuronal differentiation stage.
2934 CD15, CD24, CD29: A Neural Surface Biomarker Code

Figure 4. Deciphering a surface antigen code of neural lineage differentiation. (A) Combinatorial staining for CD29 with various other surfaceantigens suggested the presence of distinct cell subsets. Proliferative hES cell-derived neural cell cultures (div 35-42) displayed a characteristicpattern of CD29 expression. The CD29LO fraction (green label; second column) included cell populations positive for CD56 (NCAM) and for theCD24 antigen (expressed on neuronal cell populations; Fig. 2). The CD29HI population contained a subset (blue label; right column) that co-la-beled with CD271 (p75) and CD73 antigens, markers known to be present on mesenchymal and neural crest cell derivatives [41, 65]. An addi-tional CD29HI subset (red label; fourth column) included populations that co-stain CD15 (shown to be characteristic for neuroepithelial cells; Fig.3), FORSE-1, and CD133 (Prominin-1) [15, 66]. Intermediate stages of differentiation could be inferred by detecting a transient distinct popula-tion of CD29MID cells (yellow label, mid column), which colabel with FORSE-1 and CD146, markers recently described to be present on prolif-erative neural cell types [15, 39]. These markers did partially overlap with the neuroepithelial stem cell fraction (red) with respect to CD29expression. Left column: CD29 without co-staining for additional antigens. (B) Thus, a CD15þ/CD29HI population was identified, labeled in red(upper panel), which also displayed low CD24 expression, as depicted in the lower panel (red outline). In summary, this subset of neuroepithe-lial/neural stem cells (NS) was hypothetically characterized by CD15�/CD24HI/CD29LO surface antigen expression. Analogously, an additionalsubset negative for CD15, but showing CD29HI and CD24LO expression, was determined (CD15�/CD24LO/CD29HI; blue outline), potentially rep-resenting a mesenchymal or neural crest-like (NC) population, given its co-labeling with markers of such phenotype as shown in (A). Finally, aneuronally differentiating/ neuroblast (ND) neural subset was inferred to be characterized by the distinct surface antigen code CD15�/CD24HI/CD29LO (green outline). (C) Combinatorial FACS analysis according to the CD15/CD24/CD29 surface antigen code enabled the enrichment ofspecific neural cell populations differentiated from a mixed neural population derived from human pluripotent stem cells. The upper row displaysthe presumptive neuroepithelial/neural stem cell (NS) subset. Upon sorting (FACS reanalysis, left column), this subset shows enrichment for pro-liferative clusters containing neuroepithelial stem cells (phase contrast images; right columns). Selecting the CD15�/ CD24LO/ CD29HI fraction(second row) enriched for highly proliferative ‘‘flat’’, migratory cell types. The CD15�/ CD24HI/ CD29LO subset (lower row) displayed culturesdevoid of the previous cell populations and presented with a network of processes from neuronally differentiating cell types in high purity (D).Scale bars � 50 lm. See Methods for sorting parameters optimized for neuronal cell sorting and post-FACS culture conditions. Abbreviations:hES ND ¼ human embryonic stem cells at neuronal differentiation stage; NS ¼ CD15þ/CD24LO/CD29HI; NC ¼ CD15�/CD24LO/CD29HI.

Figure 5. Analysis of human ES cell-derived neural subpopulations identified according to CD15, CD24, CD29 expression. (A) mRNA expres-sion of Sox1 and bIII-tubulin. The CD15�/CD24HI/CD29LO population (ND) showed strong presence of the neuronal differentiation marker bIII-tubulin (50 kDa), confirmed by Western blot (B). (C) High-purity cell sorting of this subset enabled the derivation of viable, pure neuronal cul-tures (reanalysis: > 95%), in which clusters of proliferative stem cells or non-neuronal cell types were absent. Inset ¼ higher magnification. (D)Upon transplantation into rat brain (striatum), progeny of either population exhibited distinct developmental potential, as detected by histologicalanalysis of the respective grafts after 5 weeks in vivo. (i) NS grafts (CD15þ/CD24LO/CD29HI) showed formation of neuroepithelial tumors. (ii)NC grafts (CD15�/CD24LO/CD29HI) did not show any/few neuroepithelial rosette structures but presented tumors with massive presence of pro-liferative, strongly CD271 (p75)-positive cell types. (iii) ND grafts (CD15�/CD24HI/CD29LO) did not show tumor formation but presented withconfined neuronal grafts, staining positive for human neural markers (Fig. 5F; supporting information Fig. 4D). Note that hES-derived neural cellsuspensions were FACS-enriched for NS, NC, and ND cell populations to �80% purity prior to transplantation. Pseudocolor images wereobtained with identical setting for each experimental group using confocal microscopy. Scale bars ¼ 200 lm. (E) Neural tumors (NS group)were composed of typical neuroepithelial rosette-like structures and doublecortin (DCX)-positive neuroblasts emerging from the former (upperpanel). Myosin-positive cells were exclusively found in the NC grafts, underlining that the surface antigen combination of CD15�/CD24LO/CD29HI enabled the prospective selection of neural crest/mesenchymal cells types using the neural surface antigen code. Scale bars ¼ 50 lm. (F)In contrast, the ND group presented with tumor-free neural grafts, extending neuronal processes into the host brain tissue. Dashed line � graftoutline. Scale bar ¼ 50 lm. (G) Graft volume analysis documented that tumor formation was attenuated by FACS for CD15�/CD24HI/CD29LO.(H) Proliferative ki67-positive cells were greatly reduced in the CD15�/ CD24HI/ CD29LO grafts. A further reduction in proliferative cells wasobserved from five weeks compared to ten weeks after transplantation (far right column, 10 wks; n ¼ 8). Error bars indicate standard error. (I)Schematic of CD15, CD24, and CD29 expression dynamics during neural lineage differentiation. A population characterized by high levels ofCD15 and CD29 (NS, red) may develop towards two distinct subsets: one losing the CD15 expression while maintaining the CD29 expression(NC, blue), another one decreasing both CD15 and CD29 expression and gaining surface expression of CD24 (ND, green). Abbreviations: DCX¼ doublecortin; NS ¼ CD15þ/CD24LO/CD29HI; NC ¼ CD15�/CD24LO/CD29HI; ND ¼ CD15�/CD24HI/CD29LO group.

developmental studies (Fig. 5D–5H). The three described pop-ulations (NS, NC, ND) were isolated from differentiatedhuman ES cell cultures (H9; div 42) by FACS and subse-quently grafted into rodent brain for histological analysis after5 and 10 weeks post-transplantation. Consistent with theemerging hypothesis and designation of the combinatorialcode (see above; Fig. 4B, 4C), grafts from the CD15þ/CD24LO/CD29HI (NS) group showed neuroepithelial tumors,which displayed characteristic neural rosettes exhibiting im-munoreactivity for Sox2, Nestin, Vimentin, and radial glialmarkers 3CB2, RC2 (Fig. 5D, 5E; and data not shown) (n ¼8 grafts). The CD15�/CD24LO/CD29HI group (NC) showedsimilarly debilitating tumor formation of more diffuse compo-
sition with a strong component of migratory, mesenchyme-like cells. Confirming its characterization as neural crest/mes-enchymal phenotypes, cells in these grafts were stronglyCD271 positive (Fig. 5D; n ¼ 8 grafts). Myosin-positive mus-cle cells in the host brain, a confounding component of neuralgrafts in previous studies [7, 9, 16], were exclusively found inthis group (Fig. 5E). In contrast, CD15�/CD24HI/CD29LO
(ND) grafts were composed of human-NCAM-positive cells,extending neuronal processes into the host brain tissue (Fig.5F). Ki67-positivity in the graft area was decreased in the NDgroup (NS: 55.7 � 21.4; NC: 54.3 � 20.4; ND: 2.6 � 1.0;1.3 � 1.0; 1.0 � 0.2 � 103; supporting information Fig. 4D,4E). No tumor formation was observed at either 5 (two inde-pendent groups, n ¼ 5 each) or 10 weeks (n ¼ 8 grafts). Graftvolume in the ND groups ranged between 4.8 and 20.9%compared to that observed in the NS and NC groups; Fig. 5G,5H). Graft analysis clearly demonstrated that the prospectiveisolation of specific neural subsets according to CD15/CD24/CD29 surface antigen expression resulted in distinct graftcomposition and characteristics. Being important from a ther-apeutic perspective, the CD15�/CD24HI/CD29LO (ND) groupexclusively comprised neuronal grafts without tumorformation.
DISCUSSION
These experiments demonstrate that different combinations ofthe CD15, CD24, and CD29 surface antigens define distinctcellular subsets of neural lineage differentiation, includingbona fide neural stem, neural crest/mesenchymal cells, andneuronal cells from human pluripotent stem cell cultures. Weobserved these biomarkers consistently on a variety of neuralcell types and propose a model for selecting developing neu-ral cells based on these distinct profiles (Fig. 5I; Table 1).Cell sorting using these neural surface antigen codes enabledthe selection of specific cellular subsets from heterogeneousneural cell populations. After transplantation, the CD15�/CD24HI/CD29LO cell population yielded near-pure neuronalgrafts, while the other subsets formed large neuroepithelial(CD15þ/CD24LO/CD29HI) or neural crest/mesenchymal(CD15�/CD24LO/CD29HI) tissue tumors.
CD15 (Lewis-X antigen, SSEA-1), and also CD133(Prominin-1), have previously been identified as putativemarkers of stem cell identity not only in the neural system[15, 22, 42, 43] but also in hematopoietic [44, 45] and other[36, 46–48] cell types, suggesting functional relevance for‘‘stemness’’ properties in general, for example for adherenceto stem cell niches [49]. While CD15 and also the structurallyrelated FORSE-1 antigen are strongly expressed on neuroepi-thelial cells, they are both downregulated upon further differ-entiation, which suggests that delamination from the neuroepi-thelial tube/rosette-like structures parallels surface expressionchanges of these glycolipid markers [50]. This is consistentwith the observation that CD15 is present on neural stem cellsin vivo, residing in stem cell niches of the adult brain [51],including the recent identification of CD15 on nervous systemtumor cells, such as medulloblastoma [52, 53]. Similarly,integrins play an important role in neural development [54],and CD29 specifically was observed on human neural stemcells obtained from fetal tissue [55]. In addition, integrin signal-ing has been shown to be of functional relevance for both neuralcrest [56] and mesenchymal development [57, 58]. The distinctpattern of CD29 expression suggests that b1-integrin signaling,and regulatory events affecting cell adhesion, are of functionalrelevance in neural development not only in vivo but also in
Table 1. Schematic surface antigen profile of the NS, NC, andND populations identified and defined by CD15, CD24, and CD29expression code
The NS population (CD15þ/CD24LO/CD29HI), or subsetsthereof, are also characterized by positivity for FORSE-1,CD133, but low in differentiation markers. The NC population(CD15�/CD24LO/CD29HI) displays costaining for neural crestand mesenchymal markers such as CD57, CD73, and CD271.These categorizations are paralleled by immunocytochemicalstains for stem cell (Sox1, Sox2, Pax6, nestin), neural crest(myosin, Pax3, p75) and neural differentiation markers(doublecortin, MAP2, TuJ1, Tau), respectively.
¼ presence of marker on/within the population
www.StemCells.com
Pruszak, Ludwig, Blak et al. 2937

artificial in vitro systems. Again, analogous to physiological de-velopment in vivo, delamination of neural cells from neuroepi-thelium/neural tube-like structures can be observed [59], withdifferentiation toward neural crest/mesenchymal versus CNSneuronal phenotypes (see Fig. 3 D). In contrast, CD24 was iden-tified to be upregulated with neural differentiation and neuronalmaturation. We demonstrate that its surface expression is wellcorrelated with known markers of differentiating neurons, suchas Pitx3, TuJ1, and MAP2, and that high levels of CD24 surfaceexpression are a valid marker for maturing neuronal cell typesin in vitro neural differentiation (Table 1). Consistent with ourfindings, Uchida et al. have described only low levels of CD24on human neural stem cells isolated from human brain [22], andRougon et al. showed that CD24 labels neuroblasts in neuro-genic niches of mouse brain and during development [60]. Here,FACS for CD24HI was introduced to isolate purified neuronalcultures from primary rodent embryonic brain tissue, which pro-vides a valuable tool to analyze pure neuronal subpopulationsunder defined conditions. In hES cell cultures, we observed thata separation into a CD24LO versus a CD24HI populationoccurred with the transition from a mixed neural precursor cellpopulation to the neuronal differentiation stage (see supportinginformation Fig. 2). Yet, given the population dynamics in thedish [15] and the promiscuity of surface markers [61], a flowcytometric gating strategy according to a single marker wouldbe insufficient to isolate a pure, neuronally differentiating popu-lation from heterogeneous stem cell cultures. Characterizing theCD15/CD24/CD29-defined populations for coexpression of addi-tional neural surface markers may enable future studies on therelevance of these dynamic changes during in vitro neuropoiesis(see Fig. 4A). The presence of CD15/CD24/CD29 antigens onvarious neural cell types including mouse embryonic primarymid- and forebrain, spinal cord and stromal tissue, as well as ESand iPS cells, suggests more general applicability of this code(see supporting information Fig. 1B) not only for neurodevelop-mental studies and cell therapeutic paradigms but potentiallyalso in the diagnosis and study of neural tumors [62]. It remainsto be seen to which extent the dynamics of CD15, CD24, CD29expression on these other cell types mirror the code describedhere for human neural cells derived from ES cells: the NS popu-lation, characterized as CD15þ/CD24LO/CD29HI, comprises aCD133 population and positivity for FORSE-1, nestin, Pax6,Sox1. It generates proliferative neural clusters and spheres invitro, and leads to the formation of rosette-containing neuroepi-thelial tumors reminiscent of medulloblastoma. We do not for-mally study the generation of NC from NS cells, but sorting forCD15 appears to generate neurosphere-like cultures that, in turn,are able to give rise to heterogeneous cultures of NS, NC, andND populations (Fig. 5I). The precise level of multipotency ofthis overall population versus its subsets demands to be furtherelucidated [63], but all of the above features are consistent withneural stem cell character (see summary, Table 1). It will beclinically important to control and limit the presence of this pro-liferative population from a grafted cell suspension. In addition,the combinatorial code used here may serve to expand the bio-marker library used to isolate neural stem cells from cell cul-tures as well as from primary tissue.
The NC population (CD15�/CD24LO/CD29HI) entails sub-sets expressing Pax3, CD57 (HNK1), and CD271 (p75), all of
which have been described on neural crest cells [64, 41, 59].Furthermore, it contains markers also present on mesenchymalderivatives, including CD271, CD73 (ecto-5-nucleotidase), andmyosin [65, 58] (Table 1). Further analysis will be required todetermine in which way neural crest derivatives such as periph-eral neuron cells and melanocytes differentiate from this newlydefined hES subset, and whether the mesenchymal cells are infact generated via cranial neural crest-like cells in culture, orvia mesodermal specification from the original pluripotentsource [58]. From our current focus on cell transplantation tomodels of neurodegenerative disease in the CNS, it is an impor-tant finding that excluding this population is a prerequisite fortumor elimination and enhances the purity of the graft, as evi-denced by absence of myosin-positive cells.
Finally, the ND (CD15�/CD29LO/CD24HI) population wasfound to provide tumor-free neuronal grafts. In vitro, virtuallypure neuronal cultures were established by sorting for thissurface antigen combination. Markers co-expressed in thispopulation include neuroblast and neuronal markers double-cortin, TuJ1, and MAP2, while more immature markers suchas Pax6 and FORSE-1, the formation of proliferative clusters,are absent. While this study addresses one major obstacle toneural stem cell therapy, i.e. the formation of tumors, the der-ivation and stability of functional therapeutic phenotypes arestill a challenge that needs to be solved. A better understand-ing of the cell populations present in culture and their interac-tions in the dish may contribute to achieving that.
SUMMARY AND CONCLUSION
In summary, these data provide a novel surface antigen codefor neural lineage differentiation. Dynamic changes in surfaceexpression of the identified antigens CD15, CD24, and CD29in combination (Table 1) can be exploited for the experimen-tal separation of key neural cell populations derived fromdeveloping human stem cells.
ACKNOWLEDGMENTS
We thank Shreeya Karki and Casper Reske-Nielsen for excellenttechnical assistance. This work was supported by a NationalInstitutes of Health grant (P50NS39793), the Michael SternFoundation, the Orchard Foundation, the Consolidated Anti-Aging Foundation, and the Harold and Ronna Cooper Family.
DISCLOSURE OF POTENTIAL CONFLICTS
OF INTEREST
The authors indicate no potential conflicts of interest.
REFERENCES
1 Murry CE, Keller G. Differentiation of embryonic stem cells to clini-cally relevant populations: Lessons from embryonic development. Cell2008;132(4):661–680.
2 Deb KD, Sarda K. Human embryonic stem cells: Preclinical perspec-tives. J Transl Med 2008;6:7.
3 Mountford JC. Human embryonic stem cells: Origins, characteristicsand potential for regenerative therapy. Transfus Med 2008;18(1):1–12.
4 Bjorklund LM, Sanchez-Pernaute R, Chung S et al. Embryonic stemcells develop into functional dopaminergic neurons after transplanta-tion in a Parkinson rat model. Proc Natl Acad Sci U S A 2002;99(4):2344–2349.
5 Tabar V, Tomishima M, Panagiotakos G et al. Therapeutic cloning inindividual parkinsonian mice. Nat Med 2008;14(4):379–381.
2938 CD15, CD24, CD29: A Neural Surface Biomarker Code
6 Wernig M, Zhao JP, Pruszak J et al. Neurons derived from reprog-rammed fibroblasts functionally integrate into the fetal brain andimprove symptoms of rats with Parkinson’s disease. Proc Natl AcadSci U S A 2008;105(15):5856–5861.
7 Sonntag KC, Pruszak J, Yoshizaki T et al. Enhanced yield of neuroe-pithelial precursors and midbrain-like dopaminergic neurons fromhuman embryonic stem cells using the bone morphogenic protein an-tagonist noggin. Stem Cells 2007;25(2):411–418.
8 Astradsson A, Cooper O, Vinuela A et al. Recent advances in cell-based therapy for Parkinson disease. Neurosurg Focus 2008;24(3–4):E6.
9 Roy NS, Cleren C, Singh SK et al. Functional engraftment of humanES cell-derived dopaminergic neurons enriched by coculture with telo-merase-immortalized midbrain astrocytes. Nat Med 2006;12(11):1259–1268.
10 McKay R, Kittappa R. Will stem cell biology generate new therapiesfor Parkinson’s disease? Neuron 2008;58(5):659–661.
11 Mendez I, Vinuela A, Astradsson A et al. Dopamine neuronsimplanted into people with Parkinson’s disease survive without pathol-ogy for 14 years. Nat Med 2008;14(5):507–509.
12 Mendez I, Sanchez-Pernaute R, Cooper O et al. Cell type analysis offunctional fetal dopamine cell suspension transplants in the striatumand substantia nigra of patients with Parkinson’s disease. Brain 2005;128(Pt 7):1498–1510.
13 Kordower JH, Chu Y, Hauser RA et al. Lewy body-like pathology inlong-term embryonic nigral transplants in Parkinson’s disease. NatMed 2008;14(5):504–506.
14 Li JY, Englund E, Holton JL et al. Lewy bodies in grafted neurons insubjects with Parkinson’s disease suggest host-to-graft disease propa-gation. Nat Med 2008;14(5):501–503.
15 Pruszak J, Sonntag KC, Aung MH et al. Markers and methods for cellsorting of human embryonic stem cell-derived neural cell populations.Stem Cells 2007;25(9):2257–2268.
16 Brederlau A, Correia AS, Anisimov SV et al. Transplantation ofhuman embryonic stem cell-derived cells to a rat model of Parkin-son’s disease: Effect of in vitro differentiation on graft survival andteratoma formation. Stem Cells 2006;24(6):1433–1440.
17 Carson CT, Aigner S, Gage FH. Stem cells: The good, bad and barelyin control. Nat Med 2006;12(11):1237–1238.
18 Li JY, Christophersen NS, Hall V et al. Critical issues of clinicalhuman embryonic stem cell therapy for brain repair. Trends Neurosci2008;31(3):146–153.
19 Chung S, Shin BS, Hedlund E et al. Genetic selection of sox1GFP-expressing neural precursors removes residual tumorigenic pluripotentstem cells and attenuates tumor formation after transplantation. J Neu-rochem 2006;97(5):1467–1480.
20 Horan PK, Slezak SE, Poste G. Improved flow cytometric analysis ofleukocyte subsets: simultaneous identification of five cell subsets usingtwo-color immunofluorescence. Proc Natl Acad Sci U S A 1986;83(21):8361–8365.
21 Herzenberg LA, Parks D, Sahaf B et al. The history and future of thefluorescence activated cell sorter and flow cytometry: A view fromStanford. Clin Chem 2002;48(10):1819–1827.
22 Uchida N, Buck DW, He D et al. Direct isolation of human centralnervous system stem cells. Proc Natl Acad Sci U S A 2000;97(26):14720–14725.
23 Ono Y, Nakatani T, Sakamoto Y et al. Differences in neurogenicpotential in floor plate cells along an anteroposterior location: Mid-brain dopaminergic neurons originate from mesencephalic floor platecells. Development 2007;134(17):3213–3225.
24 Maric D, Barker JL. Neural stem cells redefined: A FACS perspective.Mol Neurobiol 2004;30(1):49–76.
25 Rietze RL, Valcanis H, Brooker GF et al. Purification of a pluripotentneural stem cell from the adult mouse brain. Nature 2001;412(6848):736–739.
26 Wernig M, Tucker KL, Gornik V et al. Tau EGFP embryonic stemcells: An efficient tool for neuronal lineage selection and transplanta-tion. J Neurosci Res 2002;69(6):918–924.
27 Hedlund E, Pruszak J, Lardaro T et al. Embryonic stem cell-derivedPitx3-enhanced green fluorescent protein midbrain dopamine neuronssurvive enrichment by fluorescence-activated cell sorting and functionin an animal model of Parkinson’s disease. Stem Cells 2008;26(6):1526–1536.
28 Ozdinler PH, Macklis JD. IGF-I specifically enhances axon outgrowthof corticospinal motor neurons. Nat Neurosci 2006;9(11):1371–1381.
29 Sundberg M, Jansson L, Ketolainen J et al. CD marker expressionprofiles of human embryonic stem cells and their neural derivatives,determined using flow-cytometric analysis, reveal a novel CD markerfor exclusion of pluripotent stem cells. Stem Cell Res 2009;2(2):113–124.
30 Pruszak J, Isacson O. Directed differentiation of human embryonicstem cells into dopaminergic neurons. In: Sullivan S, Cowan C, Eggan
K, eds. Human Embryonic Stem Cells: The Practical Handbook. NewYork: Wiley, 2007.
31 Lee SH, Lumelsky N, Studer L et al. Efficient generation of midbrainand hindbrain neurons from mouse embryonic stem cells. Nat Biotech-nol 2000;18(6):675–679.
32 Wernig M, Meissner A, Foreman R et al. In vitro reprogramming offibroblasts into a pluripotent ES-cell-like state. Nature 2007;448(7151):318–324.
33 Pruszak J, Just L, Isacson O, Nikkhah O. Isolation and culture of ven-tral mesencephalic precursor cells and dopaminergic neurons. CurrentProtocols in Stem Cell Biology 2009, Unit 2D.04
34 Draper JS, Pigott C, Thomson JA et al. Surface antigens of humanembryonic stem cells: Changes upon differentiation in culture. J Anat2002;200(Pt 3):249–258.
35 Cui L, Johkura K, Yue F et al. Spatial distribution and initial changesof SSEA-1 and other cell adhesion-related molecules on mouse em-bryonic stem cells before and during differentiation. J HistochemCytochem 2004;52(11):1447–1457.
36 Fox N, Damjanov I, Knowles BB et al. Immunohistochemical local-ization of the mouse stage-specific embryonic antigen 1 in human tis-sues and tumors. Cancer Res 1983;43(2):669–678.
37 Solter D, Knowles BB. Monoclonal antibody defining a stage-specificmouse embryonic antigen (SSEA-1). Proc Natl Acad Sci U S A 1978;75(11):5565–5569.
38 Schmandt T, Meents E, Gossrau G et al. High-purity lineage selectionof embryonic stem cell-derived neurons. Stem Cells Dev 2005;14(1):55–64.
39 Elkabetz Y, Panagiotakos G, Al SG et al. Human ES cell-derived neu-ral rosettes reveal a functionally distinct early neural stem cell stage.Genes Dev 2008;22(2):152–165.
40 Florek M, Haase M, Marzesco AM et al. Prominin-1/CD133, a neuraland hematopoietic stem cell marker, is expressed in adult human dif-ferentiated cells and certain types of kidney cancer. Cell Tissue Res2005;319(1):15–26.
41 Lee G, Kim H, Elkabetz Y et al. Isolation and directed differentiationof neural crest stem cells derived from human embryonic stem cells.Nat Biotechnol 2007;25(12):1468–1475.
42 Capela A, Temple S. LeX is expressed by principle progenitor cells inthe embryonic nervous system, is secreted into their environment andbinds Wnt-1. Dev Biol 2006;291(2):300–313.
43 Wakimoto H, Kesari S, Farrell CJ et al. Human glioblastoma-derivedcancer stem cells: Establishment of invasive glioma models and treat-ment with oncolytic herpes simplex virus vectors. Cancer Res 2009;69(8):3472–3481.
44 Unverzagt KL, Bender JG, Loudovaris M et al. Characterization of aculture-derived CD15þCD11b- promyelocytic population fromCD34þ peripheral blood cells. J Leukoc Biol 1997;62(4):480–484.
45 Hess DA, Wirthlin L, Craft TP et al. Selection based on CD133 andhigh aldehyde dehydrogenase activity isolates long-term reconstitutinghuman hematopoietic stem cells. Blood 2006;107(5):2162–2169.
46 Miki J, Furusato B, Li H et al. Identification of Putative Stem CellMarkers, CD133 And CXCR4, In hTERT-Immortalized Primary Non-malignant and Malignant Tumor-Derived Human Prostate EpithelialCell Lines and in Prostate Cancer Specimens. Cancer Res 2007;67(7):3153–3161.
47 Richardson GD, Robson CN, Lang SH et al. CD133, a novel markerfor human prostatic epithelial stem cells. J Cell Sci 2004;117(Pt 16):3539–3545.
48 Hilbe W, Dirnhofer S, Oberwasserlechner F et al. CD133 positive en-dothelial progenitor cells contribute to the tumour vasculature in non-small cell lung cancer. J Clin Pathol 2004;57(9):965–969.
49 Lathia JD, Rao MS, Mattson MP et al. The microenvironment of theembryonic neural stem cell: Lessons from adult niches? Dev Dyn2007;236(12):3267–3282.
50 Allendoerfer KL, Durairaj A, Matthews GA et al. Morphologicaldomains of Lewis-X/FORSE-1 immunolabeling in the embryonic neu-ral tube are due to developmental regulation of cell surface carbohy-drate expression. Dev Biol 1999;211(2):208–219.
51 Capela A, Temple S. LeX/ssea-1 is expressed by adult mouse CNSstem cells, identifying them as nonependymal. Neuron 2002;35(5):865–875.
52 Read TA, Fogarty MP, Markant SL et al. Identification of CD15 as amarker for tumor-propagating cells in a mouse model of medulloblas-toma. Cancer Cell 2009;15(2):135–147.
53 Ward RJ, Lee L, Graham K et al. Multipotent CD15þ cancer stemcells in patched-1-deficient mouse medulloblastoma. Cancer Res 2009;69(11):4682–4690.
54 Graus-Porta D, Blaess S, Senften M et al. Beta1-class integrins regu-late the development of laminae and folia in the cerebral and cerebel-lar cortex. Neuron 2001;31(3):367–379.
55 Hall PE, Lathia JD, Miller NG et al. Integrins are markers of humanneural stem cells. Stem Cells 2006;24(9):2078–2084.
Pruszak, Ludwig, Blak et al. 2939
www.StemCells.com

56 Breau MA, Pietri T, Eder O et al. Lack of beta1 integrins in entericneural crest cells leads to a Hirschsprung-like phenotype. Develop-ment 2006;133(9):1725–1734.
57 Fuchs BC, Fujii T, Dorfman JD et al. Epithelial-to-mesenchymal tran-sition and integrin-linked kinase mediate sensitivity to epidermalgrowth factor receptor inhibition in human hepatoma cells. CancerRes 2008;68(7):2391–2399.
58 Miller FD. Riding the waves: Neural and nonneural origins for mesen-chymal stem cells. Cell Stem CELL 2007;1(2):129–130.
59 Takashima Y, Era T, Nakao K et al. Neuroepithelial cells supply aninitial transient wave of MSC differentiation. Cell 2007;129(7):1377–1388.
60 Nieoullon V, Belvindrah R, Rougon G et al. mCD24 regulates prolif-eration of neuronal committed precursors in the subventricular zone.Mol Cell Neurosci 2005;28(3):462–474.
61 Zola H. Medical Applications of Leukocyte Surface Molecules—TheCD molecules. Mol Med 2006;12(11–12):312–316.
62 Mani SA, Guo W, Liao MJ et al. The epithelial-mesenchymal transi-tion generates cells with properties of stem cells. Cell 2008;133(4):704–715.
63 Sun Y, Kong W, Falk A et al. CD133 (Prominin) negative humanneural stem cells are clonogenic and tripotent. Plos One 2009;4(5):e5498.
64 Lazzari G, Colleoni S, Giannelli SG et al. Direct derivation of neuralrosettes from cloned bovine blastocysts: A model of early neurulationevents and neural crest specification in vitro. Stem Cells 2006;24(11):2514–2521.
65 Barberi T, Bradbury M, Dincer Z et al. Derivation of engraftable skel-etal myoblasts from human embryonic stem cells. Nat Med 2007;13(5):642–648.
66 Kosodo Y, Roper K, Haubensak W et al. Asymmetric distributionof the apical plasma membrane during neurogenic divisionsof mammalian neuroepithelial cells. Embo J 2004;23(11):2314–2324.
See www.StemCells.com for supporting information available online.
2940 CD15, CD24, CD29: A Neural Surface Biomarker Code