CCTA Model User s Guide Model User’s Guide final report ... 2.0 TransCAD® Interface ... 4-5 4.4...
110
Decennial Model Update CCTA Model User’s Guide final report prepared for Contra Costa Transportation Authority prepared by Cambridge Systematics, Inc. with Dowling Associates, Inc. Caliper Corporation June 2003
Transcript of CCTA Model User s Guide Model User’s Guide final report ... 2.0 TransCAD® Interface ... 4-5 4.4...

Decennial Model Update CCTA Model User’s Guide
finalreport
prepared for
Contra Costa Transportation Authority
prepared by
Cambridge Systematics, Inc.
with
Dowling Associates, Inc. Caliper Corporation
June 2003
Decennial Model Update CCTA Model User’s Guide
Cambridge Systematics, Inc. i
Table of Contents
1.0 Introduction.................................................................................................................... 1-1
2.0 TransCAD® Interface ................................................................................................... 2-1 2.1 Introduction ............................................................................................................ 2-1 2.2 Installing the Add-in.............................................................................................. 2-2 2.3 Launching the Add-in ........................................................................................... 2-3 2.4 Working with the Base Scenario .......................................................................... 2-3 2.5 Working with Additional Scenarios.................................................................... 2-10
3.0 Validation Data.............................................................................................................. 3-1 3.1 How to Access/Update the Database ................................................................. 3-1 3.2 CCTA Network Editing Considerations............................................................. 3-8 3.3 Validation Data Update Considerations............................................................. 3-9
4.0 Highway Networks ....................................................................................................... 4-1 4.1 Introduction ............................................................................................................ 4-1 4.2 Network Description ............................................................................................. 4-2 4.3 Master Highway Network Editing...................................................................... 4-7 4.4 Network Generation Steps.................................................................................... 4-10
5.0 Transit Networks........................................................................................................... 5-1 5.1 Introduction ............................................................................................................ 5-1 5.2 Description of Transit Network ........................................................................... 5-1
6.0 Master Zonal Database................................................................................................. 6-1 6.1 Introduction ............................................................................................................ 6-1 6.2 CCTA Master Zonal Database.............................................................................. 6-1 6.3 CCTA Master Zonal Database Editing Considerations .................................... 6-3
7.0 CCTA Model .................................................................................................................. 7-1 7.1 CCTA Travel Model Flowchart............................................................................ 7-1 7.2 Steps to Update Screenline Analysis and Validation Spreadsheets................ 7-1
8.0 Forecasts .......................................................................................................................... 8-1 8.1 Introduction ............................................................................................................ 8-1 8.2 Data Requirements for Forecast ........................................................................... 8-1 8.3 Socioeconomic Forecasts ....................................................................................... 8-2 8.4 Special Generators.................................................................................................. 8-3 8.5 Miscellaneous Files ................................................................................................ 8-3

Decennial Model Update CCTA Model User’s Guide
ii Cambridge Systematics, Inc.
Table of Contents (continued)
8.6 Highway Network Forecasts................................................................................ 8-5 8.7 Transit Network Forecasts .................................................................................... 8-5 8.8 Future Intersection Geometry .............................................................................. 8-6
9.0 Level of Service.............................................................................................................. 9-1 9.1 Introduction ............................................................................................................ 9-1 9.2 Working with the CCTA Console........................................................................ 9-4 9.3 Computing CCTALOS .......................................................................................... 9-11 9.4 Computing Intersection Capacity Utilization .................................................... 9-23

Decennial Model Update CCTA Model User’s Guide
Cambridge Systematics, Inc. iii
List of Tables
3.1 Tables in Validation Database ...................................................................................... 3-2
3.2 Data Dictionary for Freeway Ramp Count Tables..................................................... 3-3
3.3 Data Dictionary for Screenline Counts Table ............................................................. 3-3
3.4 Data Dictionary for Intersection Count (Full) Table.................................................. 3-4
3.5 Data Dictionary for Adjusted Intersection Approach Counts Table....................... 3-6
3.6 Data Dictionary for Speed Table .................................................................................. 3-7
3.7 Linkage of Validation Database to CCTA Networks ................................................ 3-7
4.1 Data Fields in MTC network......................................................................................... 4-3
4.2 Codes for MTC Data Fields........................................................................................... 4-4
4.3 Speed/Capacity Look-up Table ................................................................................... 4-5
4.4 One-Way Tolls on Bay Area Bridges ........................................................................... 4-5
4.5 Time-Based Link Delays on Bay Area Bridges (in 1998 Network).......................... 4-6
4.6 Locations with Reversible Lanes .................................................................................. 4-7
4.7 Linkage of Validation Database to CCTA Networks ................................................ 4-8
4.8 Linkage of Validation Database to CCTA Networks ................................................ 4-9
5.1 Number of Transit Routes by Location ....................................................................... 5-1
5.2 Transit Non-Motorized Access Links .......................................................................... 5-3
5.3 Mode Table ...................................................................................................................... 5-4
6.1 CCTA Travel Model Zone Data Files .......................................................................... 6-1

Decennial Model Update CCTA Model User’s Guide
iv Cambridge Systematics, Inc.
List of Tables (continued)
8.1 Future Scenarios ............................................................................................................. 8-1
8.2 Enrollment Assumptions for Future Schools ............................................................. 8-3
8.3 Special Generators .......................................................................................................... 8-4
8.4 Sources of Each Network Scenario .............................................................................. 8-5
Decennial Model Update CCTA Model User’s Guide
Cambridge Systematics, Inc. v
List of Figures
7.1 CCTA Travel Model Flowchart .................................................................................... 7-2
9.1 TransCAD CCTA Level of Service (CCTALOS) Procedures.................................... 9-1

Decennial Model Update CCTA Model User’s Guide
Cambridge Systematics, Inc. 1-1
1.0 Introduction
The Decennial Model Update was a process to update current models being used for transportation planning applications in Contra Costa County. This process involved implementing the recommendations in the Modeling Evaluation Study, which addressed the planning and modeling needs of the Contra Costa Transportation Authority (CCTA) over the next 10 years.
This report is one of the following five reports written to document the work completed during the Decennial Model Update study:
1. Executive Summary,
2. CCTA Travel Model Documentation,
3. CCTA Travel Model User’s Guide,
4. CCTA Travel Model Technical Appendices, and
5. MTC Consistency Report.
The purpose of this report is to provide technical guidance on the use of the models, including documenting new software procedures developed as part of this study. The purpose of the executive summary is to provide a brief overview of the study and summa-ries of validation and forecasting results. The purpose of the model documentation is to document the process of preparing the CCTA Travel Model and to provide results of the validation and forecasting model runs. The purpose of the technical appendices is to pro-vide technical details required in the model documentation and user’s guide that are too voluminous to be placed within these reports. The purpose of the MTC consistency report is to compare the CCTA travel model results with the MTC model results for each of the model components required by the MTC.

Decennial Model Update CCTA Model User’s Guide
Cambridge Systematics, Inc. 2-1
2.0 TransCAD® Interface
2.1 Introduction
The Contra Costa custom application performs the following transportation planning procedures:
• Highway and transit initialization,
• Trip generation,
• Highway and transit network skimming,
• Trip distribution,
• Modal split,
• Highway and transit trip assignment, and
• Feedback looping.
The specifics of these models are described in a separate documentation manual. In this User’s Guide, you will learn how to setup scenarios, run the models, and view the output.
The Add-in allows you to store any number of scenarios. For example, you may want to have a Base Year Scenario and a Year 2025 Scenario. Scenarios are defined by a scenario name, a set of input files, output files, and model parameters, and there are special fea-tures in the Add-in to assist in setting up scenarios. Once you have setup a scenario, the model steps for a scenario can be run separately, run as a group, or run iteratively with feedback.
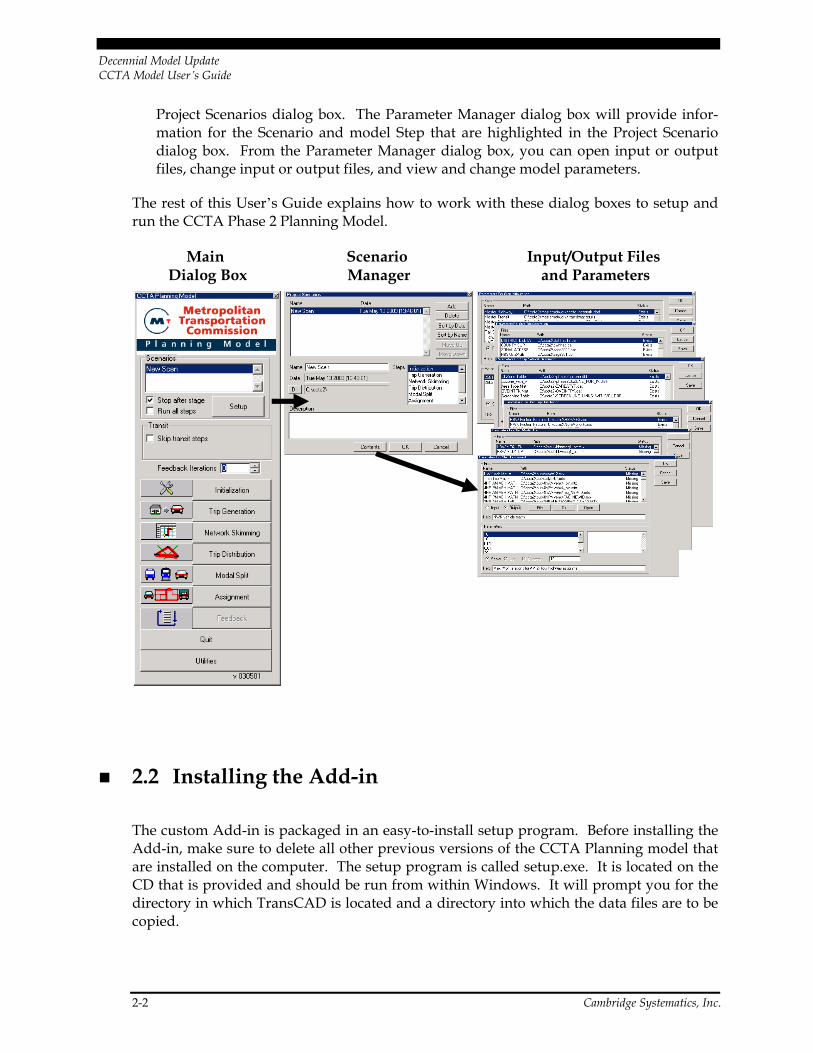
There are three key dialog boxes that are used to manage and run the model. These are shown below.
1. The first is the main dialog box (called the CCTA Planning Model dialog box), which is what appears when the Add-in is launched. From this dialog box, scenarios are selected and the models are run.
2. The second dialog box is the Project Scenarios dialog box. This is invoked by clicking on the Setup button from the main dialog box. In this dialog box, the scenarios are managed. Here you can add, delete, sort, describe, and rename scenarios. Each sce-nario is defined by a set of input files, output files, and parameters.
3. The third dialog box is where you enter and view the detailed information regarding the scenario. This type of dialog box is launched by clicking the Contents button in the
Decennial Model Update CCTA Model User’s Guide
2-2 Cambridge Systematics, Inc.
Project Scenarios dialog box. The Parameter Manager dialog box will provide infor-mation for the Scenario and model Step that are highlighted in the Project Scenario dialog box. From the Parameter Manager dialog box, you can open input or output files, change input or output files, and view and change model parameters.
The rest of this User’s Guide explains how to work with these dialog boxes to setup and run the CCTA Phase 2 Planning Model.
Main Dialog Box
Scenario Manager
Input/Output Files and Parameters
2.2 Installing the Add-in
The custom Add-in is packaged in an easy-to-install setup program. Before installing the Add-in, make sure to delete all other previous versions of the CCTA Planning model that are installed on the computer. The setup program is called setup.exe. It is located on the CD that is provided and should be run from within Windows. It will prompt you for the directory in which TransCAD is located and a directory into which the data files are to be copied.
Decennial Model Update CCTA Model User’s Guide
Cambridge Systematics, Inc. 2-3
This step only needs to be run one time (per computer). After it is installed, running the Add-in is as simple as running TransCAD. First, start TransCAD, then go to Tools-Add-ins and choose the Add-in entitled, CCTA Model Phase 2. Click on OK to invoke the custom interface.
Computer Requirements
The CCTA Model contains large matrices and files and requires a reasonably powerful PC machine in order to run efficiently. We recommend the following as minimum standards:
• Pentium 1GHz,
• 256MB of RAM memory, and
• 80 GB of hard drive space to house all of the scenario model input and output files.
2.3 Launching the Add-in
Once the Add-in is installed using the steps described above, the main dialog box is launched through the Tools-Add-ins feature in TransCAD.
To Launch the Add-in
1. If TransCAD is not running, launch TransCAD.
2. Choose Tools-Add-ins.
3. Choose CCTA Model Phase 2 and click OK to display the CCTA Planning Model dia-log box. (If you do not see CCTA Model Phase 2 in the Add-ins window, click Cancel and INSTALL the Add-in by following the directions above.)
All other functionality for the Add-in is accessed through this main dialog box.
2.4 Working with the Base Scenario
In this section, you will learn how to set up, run, and view outputs for the Base Scenario.

Decennial Model Update CCTA Model User’s Guide
2-4 Cambridge Systematics, Inc.
Setting Up the Base Scenario
Before you can run the model, you have to first define the scenario. This means providing TransCAD the name of the scenario along with the set of input files, output files, and parameters that define the scenario. This information is entered and viewed using the Project Scenarios and Parameter Manager dialog boxes. You can store any number of sce-narios in the custom Add-in.
The Base Scenario is particularly straightforward to set up, because it is the default sce-nario provided with the custom Add-in (as defined in the CCTA2_MOD.BIN file installed with the Add-in).
To Set Up the Base Scenario
1. If the Add-in is not launched, launch it by following the instructions above to open the CCTA Planning Model dialog box.
2. From the CCTA Planning Model dialog box, click on the Setup button to open the Project Scenarios dialog box. If there are no existing scenario files, the Custom Add-in will ask if you want to create a new one; click yes.
3. Click the Add button to add a new scenario.
A scenario named New Scen is automatically created and added to the list of scenarios in the text box at the top of the Project Scenarios dialog box, and the current time is also listed. By default, New Scen is the Base Scenario. The input and output files as well as the parameters are automatically entered, and the model is ready to run. Note that if you are setting up any scenario other than the base scenario, you will have to modify at least some of the input files and parameters to match the scenario of inter-est. This is described later in the section on Working with Additional Scenarios.
4. Rename the scenario to something more descriptive by entering the new name in the Name text box (for example, Base Scenario), and, if desired, provide a longer descrip-tion of the scenario in the Description text box.
5. Click OK to save the settings of the scenario and close the Project Scenarios dialog box.

Decennial Model Update CCTA Model User’s Guide
Cambridge Systematics, Inc. 2-5
Now the base scenario is setup and ready to run. Note that the model steps are listed in the Steps text box and the directory listed for the scenario is the location to which the installation program installed the input and output files. If you want to view or modify any of the scenario settings (input/output files or parameters), you can do so by clicking on the Contents button (described under Viewing Outputs and Modifying Scenarios).
Running the Base Scenario
Models are run from the CCTA Planning Model dialog box. Make sure you have exited the Project Scenarios dialog box (by clicking OK) so that the settings for the scenario are updated and saved.
Any scenario can be run either with feedback, without feedback, or with one model step at a time.
To Run the Base Scenario with Feedback
1. From the CCTA Planning Model dialog box, choose the Base Scenario from the Scenarios selection box. (If you have not yet created the base scenario, do so by following the instructions above.)
2. Enter in the number of Feedback Iterations to run in the spinner or use the Spinner Up and Down buttons.
3. Click the Feedback button.
The custom Add-in will first run all model steps from Initialization through Assignment. Then it will iterate through Network Skimming to Assignment, updating the network travel times using information from the latest iteration. Note that if the number of feed-back iterations is one or more, the only step you can run is feedback.

Decennial Model Update CCTA Model User’s Guide
2-6 Cambridge Systematics, Inc.
To Run all of the Model Steps for the Base Scenario without Feedback
1. From the CCTA Planning Model dialog box, choose the Base Scenario from the Scenarios selection box.
2. Uncheck the Stop after stage checkbox.
3. Make sure that the Run all steps checkbox is checked.
4. Make sure that Feedback Iterations is set to zero.
5. Click the Initialization button.
The custom Add-in will run all model stages (initialization, trip generation, network skimming, trip distribution, modal split, and assignment).
There is also an option in the dialog box to skip transit steps. Checking this box will force the model to skip any transit-related processing steps (building, skimming, transit matrix processing, and assignment). The use of this option will reduce the model running time considerably and can be invoked if none of the transit routes or parameters has changed from a previous run.
To Run a Single Model Step of Base Scenario
1. From the CCTA Planning Model dialog box, choose the Base Scenario from the Scenarios selection box.
2. Make sure that the Stop after stage checkbox is checked.
3. Make sure that the Run all steps checkbox is checked.
4. Make sure that the input files necessary for the model you want to run are available. (The easiest way to do this for the base scenario is to run each of the prior stages of the model by following these steps.)
5. Make sure that Feedback Iterations is set to zero.
6. Click the button that states the step you want to run (for example, Modal Split).
The custom Add-in will run just that stage and stop.
Viewing and Analyzing Outputs for the Base Scenario
The full functionality of TransCAD is available to analyze the outputs of a model run. There are innumerable ways to perform the analysis. Below are a few suggestions to get started viewing the output results. For more information, see the TransCAD User’s Guide and Travel Demand Modeling with TransCAD manual.

Decennial Model Update CCTA Model User’s Guide
Cambridge Systematics, Inc. 2-7
To Open the Output (or Input) Files for any Model Step
If you know the name and location of the output file (information for the base year sce-nario is provided in the Model Documentation manual), you can always choose File-Open in the TransCAD menu; choose the file type you wish to view (Geographic File, Dbase table, Matrix, etc.); and choose the file you wish to open. Alternatively, you can open the files from the Parameter Manager dialog box of the Add-in. To use this approach:
1. Click the Setup button in the CCTA Planning Model main dialog box to open the Project Scenarios dialog box.
2. Select the Scenario and model Step of Interest.
3. Click the Contents button to open the Parameter Manager dialog box.
4. Click the Output radio button to get the list of output files.

Decennial Model Update CCTA Model User’s Guide
2-8 Cambridge Systematics, Inc.
5. Select the files that you want to open (use Shift-click or Ctrl-click to select multiple files).
6. Click the Open button and the Add-in will open the files into TransCAD.
Note that when the Parameter Manager dialog box is open, you can change the step or the scenario that is displayed in the dialog box by making the selection in the Project Scenario dialog box.
There are many files that play a role in several of the model steps. For example, Modal Split produces an OD flow matrix as an output, which is an input to Assignment. How-ever, note that each file appears only once in the entire set of Parameter Manager dialog boxes, usually in the first model step for which it is used. The parallel Model Documentation manual provides additional information on the input and output files.
To Generate and View the Trip Length Distribution (TLD)
Open the OD Flow matrix and the Travel Time matrix:
1. Use the steps described above to open the HWY DA Skim, which is an output from the Network Skimming model step, and the NWK PA Matrix, which is an output to the Trip Generation step.
2. Make the HWY DA Skim matrix the current window and choose Matrix-Indices from the menu. For the current indices, choose “4digit” for both the row and column indi-ces. This makes the IDs for this matrix compatible with the trip matrix IDs.
Generate the Trip Length Distribution:
3. From the TransCAD menu, choose Planning-Planning Utilities-Trip Length Distribution to display the Trip Length Distribution dialog box.
4. Select the NWK PA Matrix as the Base Matrix File and the HWY DA skim matrix as the Impedance Matrix File.
5. Click the Options button and enter a bin starting point of 0, an ending point of 180, and bin sizes of 5. Click OK.
6. Click OK and enter the name for the output TLD matrix, and click OK to generate the matrix.
TransCAD generates the TLD matrix and shows a Results Summary dialog box. Click Show Report to view summary statistics, such as minimum, maximum, and average trip lengths. Otherwise, click Close to view the TLD matrix.

Decennial Model Update CCTA Model User’s Guide
Cambridge Systematics, Inc. 2-9
To provide a chart of the TLD:
7. Highlight the Percent column in the TLD matrix.
8. Choose File-New to display the New File dialog box. Choose Chart and click OK to open the Matrix Chart Data dialog box.
9. Click OK (to chart the Selected Cells) to display the Chart Properties dialog box.
10. Choose a bar chart and click OK.
TransCAD displays a chart for the TLD.
To View Highway Volume Outputs for the P.M. Peak Period
Open the highway geography and p.m. peak highway flow table:
1. Use the steps described above to open the Highway DB file, which is an input to the Initialization model step, and the 4HR AM VEH Flow, which is an output of the Assignment step. Note that in this step, the 4HR AM VEH Flow table may appear as missing in the dialog box. This is because several separate flow files were created in the feedback process, a file for each feedback iteration. Thus, if the original output file is called “4hram.bin”, you should open up “4hram2.bin” if you want the flow table from the second iteration. Use File-Open from the menu system and choose Fixed Format Binary as the type to manually open up these files.
Join the highway geography to the flow table:
2. From the TransCAD menu, choose Dataview-Join and join the Highway/Streets layer’s ID field to the flow table’s ID1 field. Click OK to view the join.
Generate a flow map:
3. Choose Planning-Planning Utilities-Create Flow Map to create both a both a size theme on the links based on volume flow and a color theme based on VOC ratio.
Use the utilities in TransCAD to move about the map, add labels, etc.
To View the Running Log and Report Files
Each time a model is run, the Add-in will save information on the run in two text files: the log file and the report file. The log file lists every procedure that you run and any warn-ings that were encountered. The report file lists every procedure that you run. It also lists all of the input data that was used for the procedure. To view these files:

Decennial Model Update CCTA Model User’s Guide
2-10 Cambridge Systematics, Inc.
1. Choose Edit-Preferences from the TransCAD menu to open the Preferences dialog box.
2. Choose the Logging tab.
3. Click on the Display button to display either the log file or the report file.
Information on the most recent model run will be at the end of these files.
2.5 Working with Additional Scenarios
Any number of scenarios beyond the Base Scenario can be setup, stored, and run using the Add-in.
Adding a Scenario
To Create an Additional Scenario
1. From the CCTA Planning Model dialog box, click on the Setup button to open the Project Scenarios dialog box.
2. Click the Add button to add a new scenario. The Add-in will create a scenario named New Scen and add it (along with the current date and time) to the end of the list of scenarios in the dialog box.
3. Rename the scenario using the Name text box.
4. Enter a description for the scenario in the Description text box.
By default, the added scenario is created using the settings for the default Base Scenario, and so you will have to re-specify at least some of these settings to generate the scenario of interest. The next step describes how to do this.
Modifying Scenarios
A scenario is defined by the set of input files, output files, and parameters for which the model is to be run. Each step of the model has a different set of files and parameters. These settings are managed using the Parameter Manager dialog boxes for which there is a different dialog box for each model step.
An important point in selecting the input files to use for a given scenario is that these files must match the input files provided for the default Base Scenario. This means that all table inputs (demographics table, trip rates table, etc.) must contain the same field names as the original default files and must have the same number of records. The default files
Decennial Model Update CCTA Model User’s Guide
Cambridge Systematics, Inc. 2-11
are described in the Model Documentation manual. However, note that you can use any of the following formats for the tables: DBASE, Comma Delimited ASCII, Fixed Format ASCII, and Fixed Format Binary. There are some exceptions to this rule for certain text files that are tied to certain Fortran programs.
If any of these restrictions are violated, the Add-in will give you error messages if you attempt to run the model.
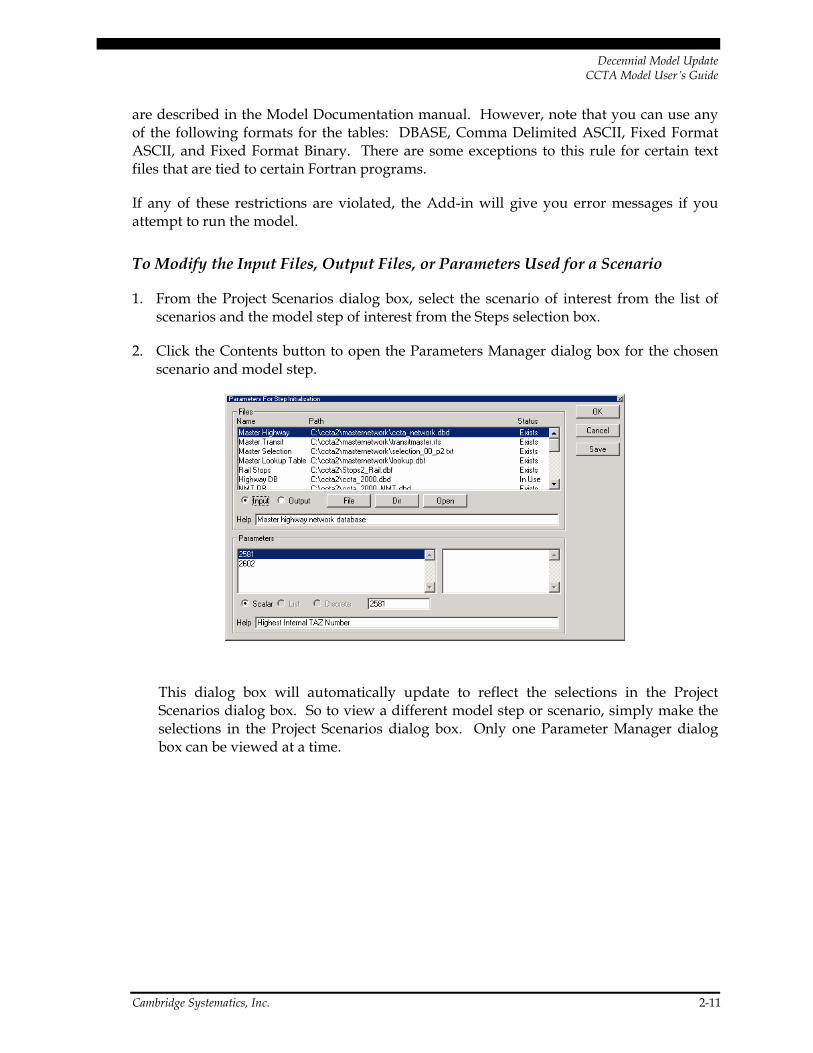
To Modify the Input Files, Output Files, or Parameters Used for a Scenario
1. From the Project Scenarios dialog box, select the scenario of interest from the list of scenarios and the model step of interest from the Steps selection box.
2. Click the Contents button to open the Parameters Manager dialog box for the chosen scenario and model step.
This dialog box will automatically update to reflect the selections in the Project Scenarios dialog box. So to view a different model step or scenario, simply make the selections in the Project Scenarios dialog box. Only one Parameter Manager dialog box can be viewed at a time.

Decennial Model Update CCTA Model User’s Guide
2-12 Cambridge Systematics, Inc.
3. Use this dialog box to manage the input and output files as follows.
To do this… Do this…
View the list of input files Click the Input radio button and all input files for the model step will be displayed in the Files scroll list.
View the list of output files Click the Output radio button and all output files for the step will be displayed in the Files scroll list.
Obtain a description of the file Select the file of interest from the Files scroll list and a description will be provided in the Help text box.
Check the status of a file The Status column in the Files scroll list states whether a file Exists, is In Use, or is Missing.
In Use, files will be automatically closed when a model is run.
All of the input files must Exist in order for a model to be run.
Any output files that Exist will be overwritten when a model is run.
Open a file Either double-click on the file in the Files scroll list or select the file in the Files scroll list and Click the Open button. Networks (.NET) and transit networks (.TNW) cannot be opened, but their geographic counterparts (.DBD line geographic files and .RTS route systems) can.
Change the file that is used Select the file you want to change from the Files scroll list. Click on File and select the file that you want to use.
All input files must match the structure of the input files provided with the Year 2000 Base Scenario.
Change the directory of a file To change the directory of a file, select it from the Files scroll list, click on Dir and select the directory. To change the directory for multiple files, use Shift-click or Ctrl-click to select multiple files from the Files scroll list.

Decennial Model Update CCTA Model User’s Guide
Cambridge Systematics, Inc. 2-13
4. Use this dialog box to manage the parameters as follows
To do this… Do this…
View scalar parameters Click the Scalar radio button and the scalar parameters will be listed in the Parameters scroll list.
View List (Vector) parameters Click the List radio button and any parameter lists will be displayed in the left Parameters scroll list. Click on a parameter list and the parameters that make up the list will be displayed in the right Parameters scroll list.
Obtain a description of the Parameter
Select a parameter from the Parameters scroll list and a description will be provided in the Help text box.
Change the parameter Select the parameter from the Parameters scroll list and enter the value of the parameter in the text box.
Managing Scenarios
Any number of scenarios can be stored in the Add-in. Scenarios can be added, deleted, and modified at will.
To Manage the Scenarios
1. From the CCTA Planning Model dialog box, click the Setup button to open the Project Scenarios dialog box.
Decennial Model Update CCTA Model User’s Guide
2-14 Cambridge Systematics, Inc.
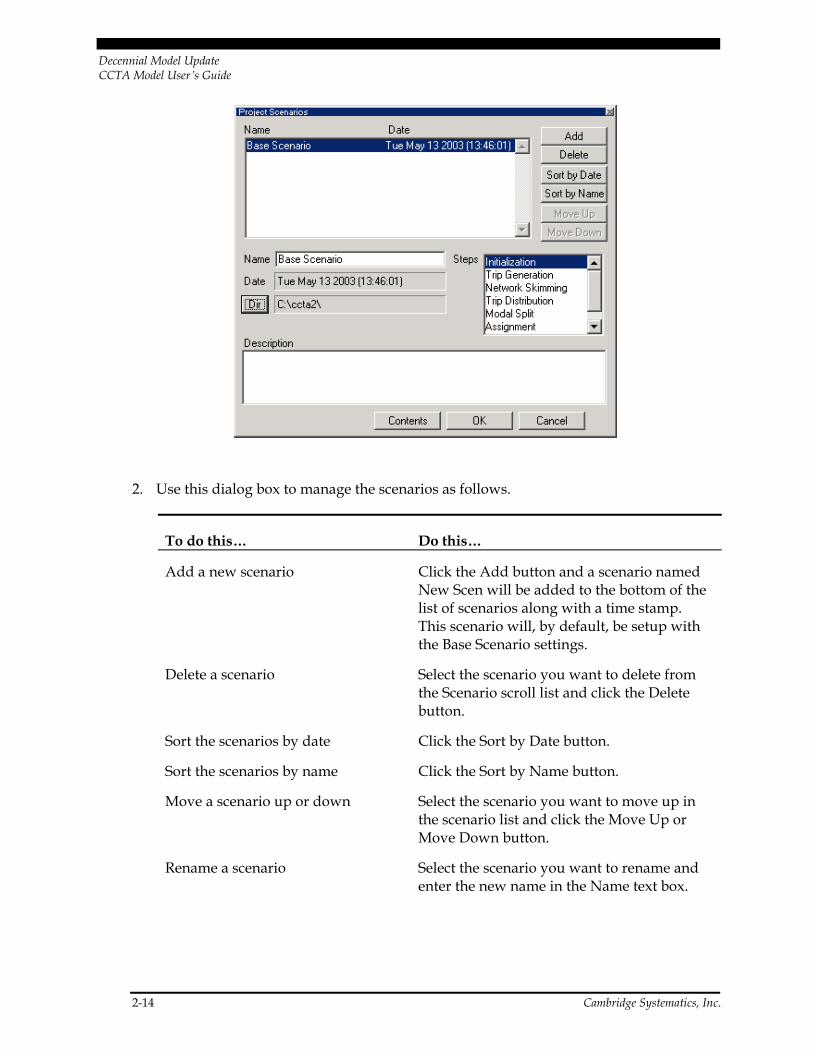
2. Use this dialog box to manage the scenarios as follows.
To do this… Do this…
Add a new scenario Click the Add button and a scenario named New Scen will be added to the bottom of the list of scenarios along with a time stamp. This scenario will, by default, be setup with the Base Scenario settings.
Delete a scenario Select the scenario you want to delete from the Scenario scroll list and click the Delete button.
Sort the scenarios by date Click the Sort by Date button.
Sort the scenarios by name Click the Sort by Name button.
Move a scenario up or down Select the scenario you want to move up in the scenario list and click the Move Up or Move Down button.
Rename a scenario Select the scenario you want to rename and enter the new name in the Name text box.

Decennial Model Update CCTA Model User’s Guide
Cambridge Systematics, Inc. 2-15
To do this… Do this…
Change the default directory Select the scenario for which you want to change the default directory for the input and output files, click the Dir button, and select the directory. The directory for all input and output files for the scenario will be changed to this default directory.
Provide a description Select the scenario for which you want to provide a description and enter the description in the Description text box.
Save scenario settings Click OK.
Running a Scenario
Running a scenario is no different from running the Base Scenario. However, the key to running a scenario that is not the default is to verify that the inputs are set up correctly. This means that all input files must exist and they must have the same format as the default input files, as described above in Modifying Scenarios. Another important point is that all existing Output files will be overwritten when the model is run.
Decennial Model Update CCTA Model User’s Guide
2-16 Cambridge Systematics, Inc.
To Run a Scenario
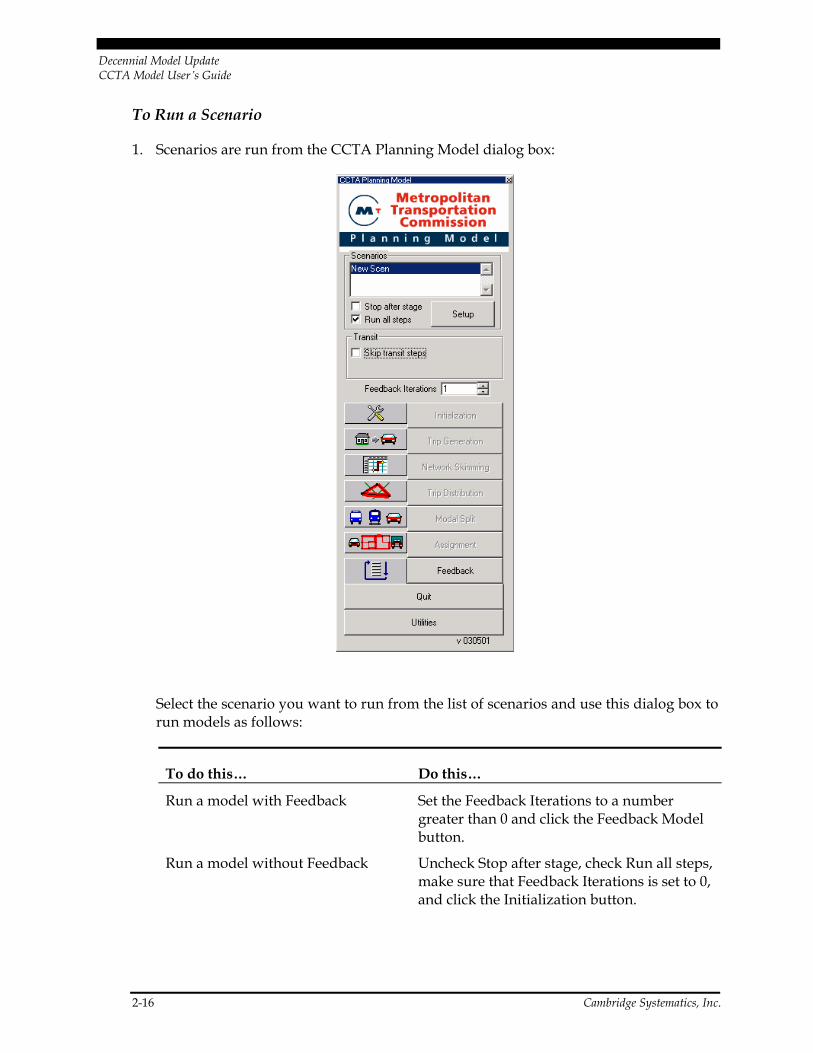
1. Scenarios are run from the CCTA Planning Model dialog box:
Select the scenario you want to run from the list of scenarios and use this dialog box to run models as follows:
To do this… Do this…
Run a model with Feedback Set the Feedback Iterations to a number greater than 0 and click the Feedback Model button.
Run a model without Feedback Uncheck Stop after stage, check Run all steps, make sure that Feedback Iterations is set to 0, and click the Initialization button.

Decennial Model Update CCTA Model User’s Guide
Cambridge Systematics, Inc. 2-17
To do this… Do this…
Run one model step Verify that all inputs for the model step exist. Check Stop after stage, check Run all steps, make sure that Feedback Iterations is set to 0, and click the button that states the model step you want to run.
Skip Transit Steps Click on the Skip Transit Steps checkbox. This will skip the transit pre-processing, building, skimming, matrix processing, and assignment steps. This is used if none of the transit routes or parameters have changed and you wish to save time in running the model.
Skip a model step Click on the picture button next to the step you want to skip to open the Stage Step Settings dialog box. Uncheck any step you do not want to run and click OK. The Run all steps checkbox will automatically be unchecked.
View/modify scenario settings Click Setup to open the Project Scenarios dialog box and follow instructions above regarding setting up scenarios.
Exit the Add-in Click Quit.
Viewing and Analyzing Outputs from a Scenario
Once the model is run, you can use all of the functionality in TransCAD to view and ana-lyze results. There are innumerable ways to perform the analysis. Examples of such analysis were provided under the heading of Viewing and Analyzing Outputs of the Base Year Scenario. For more information, see the TransCAD User’s Guide and Travel Demand Modeling with TransCAD manual.

Decennial Model Update CCTA Model User’s Guide
Cambridge Systematics, Inc. 3-1
3.0 Validation Data
3.1 How to Access/Update the Database
The Validation Database can be accessed from either ACCESS or from TransCAD.
Using ACCESS
The ACCESS database is called, CountDatabase(03-03-03).mdb. This file is approximately 5.6 mb in size. It contains the tables of data identified in Table 3.1.
The analyst merely opens the database in ACCESS, double-clicks on the desired table, and edits the data. Care should be taken though not to inadvertently edit the fields that link the database to the CCTA highway and transit networks. These fields are identified in the following section.
The year 2000 screenline counts are compared to 1990 counts in a separate EXCEL spread-sheet file called, CCTAscreenlines(11-26-02)_1page.xls.
The freeway ramp count data is organized into two tables: Data_CaltransRampsAC (for ramps on state routes in Alameda County), and Data_CaltransRampsCC (for ramps on state routes in Contra Costa County). There are 112 records in the Alameda County table and 360 records in the Contra Costa County table. The data fields are described in Table 3.2 below.
The screenline count data is stored in two places. The Validation Database contains the year 2000 screenline counts in a table called, Data_Screenline. The year 2000 screenline data is compared to the 1990 screenline counts in a separate Excel spreadsheet called, CCTAscreenlines(11-26-02)_1page.xls. This spreadsheet is organized into worksheets containing regional screenline counts and internal screenline counts for the a.m. and p.m. peak hours, the a.m. and p.m. peak periods, and daily. The fields in the database are described in Table 3.3 below.
The turning movement counts are stored in two tables in the Validation Database. The table called, Data_IntersectionCount(Full), stores the raw a.m. and p.m. peak-hour turning movement counts. The table called, Data_IntersectionCount(AdjRamp), stores the equivalent approach and departure volumes, adjusted for the presence of ramps as explained above. Tables 3.4 and 3.5 below describe the data fields.

Decennial Model Update CCTA Model User’s Guide
3-2 Cambridge Systematics, Inc.
Table 3.1 Tables in Validation Database
Data Table Name Description (Year)
1. AC Transit Line Boarding Data
Data_AC_BoardingsByRteTimeZone AM, Midday, PM, and Evening Boardings for AC Transit by line aggregated by subarea (1998)
2. BART Station Boarding Data
Data_BartBoardingBySta Monthly boardings for BART by station O-D pairs (1998)
3. BART Line Boarding Data
Data_BartDailyBoarding Daily boardings for BART by line (1998)
4. Freeway Ramp Counts – Alameda County
Data_CaltransRampsAC Caltrans ramp counts (Daily, AM/PM Peak Hours and Peak Periods) in Alameda County
5. Freeway Ramp Counts – Contra Costa County
Data_CaltransRampsAC Caltrans ramp counts (Daily, AM/PM Peak Hours and Peak Periods) in Contra Costa County
6. All Transit Lines Boarding Data
Data_DailyBoardingByLine Daily boardings system-wide by line for all transit operators (1998)
7 All Transit Modes Boarding Data
Data_DailyBoardingByMode Daily boardings system-wide by mode for all transit operators (1998)
8. All Transit Operators Boarding Data
Data_DailyBoradingByOperator Daily boardings by operators and mode (1995-1998, depending on operator)
9. Intersection Approach Counts
Data_IntersectionCount(AdjRamp) Intersection link approach and departure volumes for AM and PM peak hour, adjusted to account for loop ramps (2000-2002, varies by location)
10. Intersection Turn Counts
Data_IntersectionCount(All) Intersection turning movements and link approach and departure volumes for AM and PM peak hour (2000-2002, varies by location)
11. MTC Screenlines Data_MTCscreenlines Screenline counts for MTC.
12. Screenline Counts
Data_Screenline Screenline volumes for 15-min increment, 1-hr increment, AM and PM peak hour, AM and PM peak period and daily (1999-2002, varies by location)
13. Speed Data Data_Speed Floating car mean speeds by freeway route, SOV only (1997)
14. Transit Operator Code Table
Data_TransitOperatorLookup Validation Database to TransCAD Mode Number Correspondence Table
15. Data Dictionaries Dict_* Data Dictionary

Decennial Model Update CCTA Model User’s Guide
Cambridge Systematics, Inc. 3-3
Table 3.2 Data Dictionary for Freeway Ramp Count Tables
Field Name Field Description Units Data Type
Field Size Notes
ID TransCAD link ID Number Double
Rte Route Number Double
Dir Direction Text 255
Leg Ramp direction (F=Off Ramp, N=On ramp)
Text 255
Description Location Description Text 255
PM PostMile Miles Number Double
Road Road Name Text 255
Daily Daily Volume Vehicles Number Double
AMPKHR AM Peak Hour Count observed for one hour
Vehicles Number Double
AMTIME AM Peak Hour Time Duration observed
Time Text 255
PMPKHR PM Peak Hour Count observed for one hour
Vehicles Number Double
PMTIME PM Peak Hour Time Duration observed
Time Text 255
AMPKPER AM Peak Hour Count (6:00-10:00) Vehicles Number Double
PMPKPER PM Peak Hour Count (15:00-19:00) Vehicles Number Double
Table 3.3 Data Dictionary for Screenline Counts Table
Field Name Field Description Units Data Type
Field Size Notes
SL_ID Screenline ID (Combination of Location Number and Direction)
Text 255
ID Unique ID created as a combination of Screenline Type, Screenline Number, Location Number and Direction
Text 255
SL_Type Screenline Type ( C=Cordon, R=Regional, I=Internal)
Text 255
Sl_No Screenline Number (0-18) Number Double
LocNo Count Location Number Number Double
Street Street Text 255

Decennial Model Update CCTA Model User’s Guide
3-4 Cambridge Systematics, Inc.
Table 3.3 Data Dictionary for Screenline Counts Table (continued)
Field Name Field Description Units Data Type
Field Size Notes
Location Location Text 255
Date Date of observation Date Text 255
Day Day of observation Text 255
Dir Direction Text 255
??:?? 15-mintue interval screenline counts Vehicles Number Double
??:??-??-?? 1-hour interval screenline counts Vehicles Number Double
DailyVol Daily Volume Vehicles Number Double
AM_PKPer AM Peak Hour Volume for the whole AM peak period ( 06:00-10:00)
Vehicles Number Double
PM_PKPer PM Peak Hour Volume for the whole PM peak period (15:00-19:00)
Vehicles Number Double
AM_PKHr AM Peak Hour Observed Time Text 255
AM_PKVol AM Peak Volume in Peak Hour Observed Vehicles Number Double
PM_PKHr PM Peak Hour Observed Time Text 255
PM_PKVol PM Peak Volume in Peak Hour Observed Vehicles Number Double
Source Count Source Text 255
Estimate Estimate Indicator(1 = Estimated Count, 0 = Observed Count)
Number Double
Table 3.4 Data Dictionary for Intersection Count (Full) Table
Field Field Description Units Type Field
IntNo Intersection Number Number Double
Jurisdiction Jurisdiction in which intersection is Text 255
SecIntNo Secondary Intersection Number Text 255
Date Date Date/Time
NS Street in the North-South Direction Text 255
EW Street in the East-West Direction Text 255
Peak Period AM/PM Text 255
Peak Hour Peak Hour Time Duration observed Time Text 255
NBL Northbound Left Turning Vehicles Vehicles Number Double
NBT Northbound Through Vehicles Vehicles Number Double

Decennial Model Update CCTA Model User’s Guide
Cambridge Systematics, Inc. 3-5
Table 3.4 Data Dictionary for Intersection Count (Full) Table (continued)
Field Field Description Units Type Field
NBR Northbound Right Turning Vehicles Vehicles Number Double
SBL Southbound Left Turning Vehicles Vehicles Number Double
SBT Southbound Through Vehicles Vehicles Number Double
SBR Southbound Right Turning Vehicles Vehicles Number Double
EBL Eastbound Left Turning Vehicles Vehicles Number Double
EBT Eastbound Through Vehicles Vehicles Number Double
EBR Eastbound Right Turning Vehicles Vehicles Number Double
WBL Westbound Left Turning Vehicles Vehicles Number Double
WBT Westbound Through Vehicles Vehicles Number Double
WBR Westbound Right Turning Vehicles Vehicles Number Double
N-App Approach Volume North of Intersection Vehicles Number Double
N-Dep Departure Volume North of Intersection Vehicles Number Double
S-App Approach Volume South of Intersection Vehicles Number Double
S-Dep Departure Volume South of Intersection Vehicles Number Double
E-App Approach Volume East of Intersection Vehicles Number Double
E-Dep Departure Volume East of Intersection Vehicles Number Double
W-App Approach Volume West of Intersection Vehicles Number Double
W-Dep Departure Volume West of Intersection Vehicles Number Double
TOTAL Total Count at Intersection Vehicles Number Double
APP VOL Total Approach Volume at Intersection Vehicles Number Double
DEP VOL Total Departure Volume at Intersection Vehicles Number Double
COUNTBY Count Source Text 255
SUBAREA Subarea Text 255
NOTES Text 255

Decennial Model Update CCTA Model User’s Guide
3-6 Cambridge Systematics, Inc.
Table 3.5 Data Dictionary for Adjusted Intersection Approach Counts Table
Field Field Description Units Type Size
IntNo Intersection Number Number Double
Jurisdiction Jurisdiction in which intersection is Text 255
Date Date Date/Time
NS Street in the North-South Direction Text 255
EW Street in the East-West Direction Text 255
Peak Period AM/PM Text 255
Peak Hour Peak Hour Time Duration observed Time Text 255
N-App Approach Volume North of Intersection Vehicles Number Double
N-Dep Departure Volume North of Intersection Vehicles Number Double
S-App Approach Volume South of Intersection Vehicles Number Double
S-Dep Departure Volume South of Intersection Vehicles Number Double
E-App Approach Volume East of Intersection Vehicles Number Double
E-Dep Departure Volume East of Intersection Vehicles Number Double
W-App Approach Volume West of Intersection Vehicles Number Double
W-Dep Departure Volume West of Intersection Vehicles Number Double
TOTAL Total Count at Intersection Vehicles Number Double
APP VOL Total Approach Volume at Intersection Vehicles Number Double
DEP VOL Total Departure Volume at Intersection Vehicles Number Double
COUNTBY Count Source Text 255
The speed data is stored in the table called, Data_Speed. Table 3.6 below describes the data fields.
Using TransCAD
The Validation Database can be accessed from TransCAD through the “Join Tool” (see Chapter 11 of the TransCAD User’s Guide) or the macros provided in the Technical Appendices A, B, and C. Table 3.7 below shows the values to be entered in the “Join-From” and “Join-To” fields of the Join Tool.

Decennial Model Update CCTA Model User’s Guide
Cambridge Systematics, Inc. 3-7
Table 3.6 Data Dictionary for Speed Table
Field Name Field Description Units Data Type Field Size
A A Node Number Double
B B Node Number Double
Route Route Name/Number Text 255
From Origin Text 255
To Destination Text 255
Direction NB/SB/EB/WB Text 255
Distance Distance Mile Number Double
Year Time when the data were collected Date/Time
Speed Average Travel Speed mph Number Double
Time Period AM/PM peak period Text 255
Time Time when data were collected Text 255
Source Source where data were obtained from Text 255
Notes Notes Text 255
Table 3.7 Linkage of Validation Database to CCTA Networks
Data Type Data Table Validation Field TransCAD
Layer TransCAD Field
1. Transit Boardings
AC Transit Line Boarding Data
None None None
All Transit Modes Boarding Data
Line Transit
BART Station Boarding Data
None None None
BART Line Boarding Data
None None None
Transit Operator Code Table
N/A N/A N/A
All Transit Operators Boarding Data
Operator Code Transit

Decennial Model Update CCTA Model User’s Guide
3-8 Cambridge Systematics, Inc.
Table 3.7 Linkage of Validation Database to CCTA Networks (continued)
Data Type Data Table Validation Field TransCAD
Layer TransCAD Field
2. Freeway Ramp Counts
Freeway Ramp Counts – Alameda County
ID Highway Orig_ID
Freeway Ramp Counts – Contra Costa County
ID Highway Orig_ID
3. Intersection Turn Counts
Intersection Approach Counts
Requires Macro* which uses IntNo, N-APP, N-DEP, S-APP, S-DEP, E-APP, E-DEP, W-APP, W-DEP
Highway Line
Requires Macro* which uses IntCntLoc, Int_Leg, AB_AppDep, BA_AppDep
Intersection Turn Counts
IntNo Highway Node
IntNo
4. Screenline Counts
Screenline Counts SL_ID Highway Line
Requires Macro* which uses AB_SrLnID, BA_SrLnID
5. Speed Data HICOMP Congested Freeways
None None None
MTC Speed Data A, B Highway Node
ID
*Note: See Technical Appendices A, B, and C for Macros to import data to TransCAD network.
One caution – the MTC BAYCAST speed data from 1997 is partially linked to the CCTA highway network through identification of the network node numbers (Fields “A” and “B” in the dataset), where the travel time run started and ended. These fields were filled in for 875 of the 1,026 records in the speed dataset before it was decided that this informa-tion would be of marginal use to model development and calibration.
3.2 CCTA Network Editing Considerations
Since the linkage between the Validation Database and TransCAD is the User Link ID, model operators can edit all link and node characteristics, except the fields identified in Table 3.7 above, without adversely affecting the linkage between the database and TransCAD. Links can be moved and shaped without adversely affecting the linkage.

Decennial Model Update CCTA Model User’s Guide
Cambridge Systematics, Inc. 3-9
The first exception is deleting either a link or a node. The analyst must check to ensure that the node or link is not linked to the validation database. The analyst should inspect the fields identified in Table 3.7 above to ensure that the field is blank for the particular node or link being deleted.
The second exception is splitting a link (which happens when adding a new centroid con-nector link as a result of splitting a zone). Splitting links will require the operator to determine which of the resulting links should retain the original linkage. The operator will have to base this decision upon the original location within the original link of the traffic counts, speeds, and other information in the Validation Database. The specific locations within the link are not stored in the database. The operator may have to research the raw data in paper form or consult with the agency or person that collected the data to determine which link should retain the original linkage to the Validation Database.
The third exception is editing the field names used by the linkage macros listed in Table 3.7 above. Changes in these field names would require editing of the macros to incorporate the new field names.
3.3 Validation Data Update Considerations
To facilitate the display and processing of count data, a duplicate set of some of the count data in the Validation Database is stored directly in the master highway network in TransCAD. Updates to the counts in the Validation Database require that a TransCAD macro be run to port over the new data into the appropriate fields in the master highway network. The duplicate data consists of screenline counts and intersection approach counts. The TransCAD resource codes (macros) for accomplishing these two tasks are provided in the appendices.
Note that, when new turning counts are made, they must be manually adjusted to remove movements not properly part of the actual intersection and the results summed to obtain the adjusted approach counts contained in the approach count table.

Decennial Model Update CCTA Model User’s Guide
Cambridge Systematics, Inc. 4-1
4.0 Highway Networks
This section describes the contents and procedures for editing the master highway network.
4.1 Introduction
The master highway network is a comprehensive TransCAD highway and HOV geo-graphic database file that has reasonable geographic shape (i.e., curvilinear streets, true interchange forms, etc.) and appropriate network attributes (lanes, functional classifica-tion, etc.) from which the following six network scenarios can be extracted:
1. Scenario #1 – Year 2000, Existing Conditions;
2. Scenario #2 – Regional Transportation Improvement Program (2000 RTIP) for Year 2010;
3. Scenario #3 – 2000 RTIP, plus Seven-Year Congestion Management Program (CMP)/ Capital Improvement Program (CIP) (CCTA 2001 CMP Update) also for the Year 2010;
4. Scenario #4 – Regional Transportation Plan (RTP) Track 1 (2001 RTP Update) for Year 2020;
5. Scenario #5 – RTP Track #1 (same as Scenario #4), but for Year 2025; and
6. Scenario #6 – RTP Blueprint, plus selected projects from CCTA’s Comprehensive Transportation Project List (CTPL) for Year 2025.
The “master” highway network concept overcomes the problems in older models of maintaining consistency between scenarios by placing all existing and future highway improvements in one master file. For example, a single link will have several fields indi-cating the number of lanes, each field appropriate to a particular future scenario. A future link may have zero lanes in the base year and non-zero lanes in one or more of the future years. The future networks are then generated from the master file, ensuring that all net-work edits are carried consistently through to all applicable future highway networks.
One difficulty working with master networks is visually checking the integrity of each future network that might be generated from the master network. Since the master net-work includes all existing and future links, it is hard to visually spot missing links. How-ever, this can be overcome by generating each future scenario network and proofing it.

Decennial Model Update CCTA Model User’s Guide
4-2 Cambridge Systematics, Inc.
The 2000 Model Update highway network within the CCTA area (defined as those links and nodes within Contra Costa County and the Tri-Valley area) includes all of the road-ways in the detailed networks of the subarea models from the 1990 CCTA model set. All links within this area have been geographically shaped to overlay the CCTA Land Use Information System (LUIS) map, which in turn is based upon the Contra Costa County road centerline file.
Network links and attributes outside of the CCTA area are consistent with currently avail-able MTC networks. These networks were transformed to a coordinate system consistent with the LUIS; however, no additional geographic shaping was performed for links out-side of the CCTA area.
The master highway network was created by combining the MTC Year 2000, 2010, and 2025 highway networks outside of the CCTA area (defined as Contra Costa County, plus the eastern half of Alameda County that lies in the Tri-Valley) with year 2000 and 2010 highway networks from each of the CCTA subarea EMME/2 models.
4.2 Network Description
The master highway network is composed of two layers: 1) the node layer and 2) the link layer. The data fields in the link and node layers are provided in the model documentation appendix. This appendix also provides summary statistics on the mean values and range of values for each of the data fields. The following tables provide additional detail on network attributes:
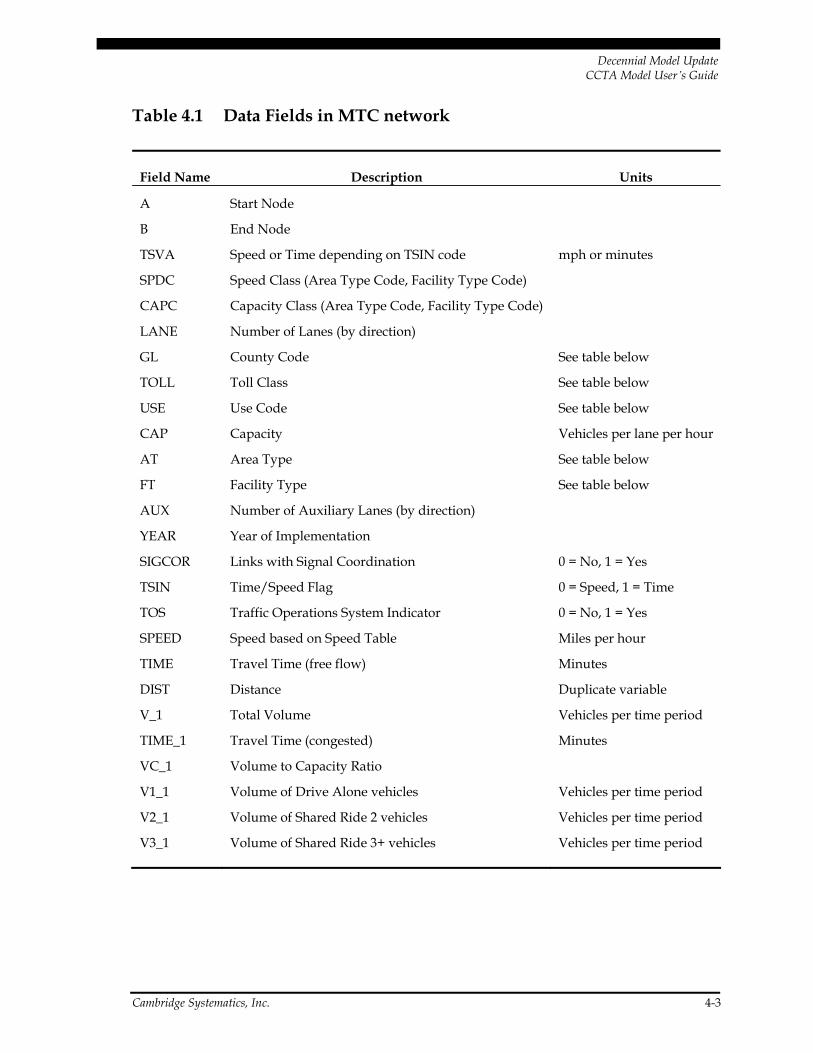
• Table 4.1 lists the MTC network data fields and provides a brief description of them.
• Table 4.2 explains the significance of the code numbers in the MTC network data fields.
• Table 4.3 provides the table of speeds and capacities used by MTC according to facility type and area type.
• There are a number of special cases where time delays or tolls are imposed by the MTC model on bridges and where reversible lanes are included in network coding. These special cases are all derived directly from the MTC networks and are included herein for information. Table 4.4 lists the one-way tolls.
• Table 4.5 lists the time-based delays on the bridges that were developed by MTC to represent the one-way tolls (applied in both directions equally rather than a single direction) and an observed time delay on the bridge.
Decennial Model Update CCTA Model User’s Guide
Cambridge Systematics, Inc. 4-3
Table 4.1 Data Fields in MTC network
Field Name Description Units A Start Node
B End Node
TSVA Speed or Time depending on TSIN code mph or minutes
SPDC Speed Class (Area Type Code, Facility Type Code)
CAPC Capacity Class (Area Type Code, Facility Type Code)
LANE Number of Lanes (by direction)
GL County Code See table below
TOLL Toll Class See table below
USE Use Code See table below
CAP Capacity Vehicles per lane per hour
AT Area Type See table below
FT Facility Type See table below
AUX Number of Auxiliary Lanes (by direction)
YEAR Year of Implementation
SIGCOR Links with Signal Coordination 0 = No, 1 = Yes
TSIN Time/Speed Flag 0 = Speed, 1 = Time
TOS Traffic Operations System Indicator 0 = No, 1 = Yes
SPEED Speed based on Speed Table Miles per hour
TIME Travel Time (free flow) Minutes
DIST Distance Duplicate variable
V_1 Total Volume Vehicles per time period
TIME_1 Travel Time (congested) Minutes
VC_1 Volume to Capacity Ratio
V1_1 Volume of Drive Alone vehicles Vehicles per time period
V2_1 Volume of Shared Ride 2 vehicles Vehicles per time period
V3_1 Volume of Shared Ride 3+ vehicles Vehicles per time period

Decennial Model Update CCTA Model User’s Guide
4-4 Cambridge Systematics, Inc.
Table 4.2 Codes for MTC Data Fields
Field Name Description Category Code GL County Code San Francisco 1 San Mateo 2 Santa Clara 3 Alameda 4 Contra Costa 5 Solano 6 Napa 7 Sonoma 8 Marin 9 TOLL Toll Class Benicia/Martinez Bridge I-680 1 Carquinez Bridge I-80 2 Richmond/San Rafael Bridge I-580 3 Golden Gate Bridge US 101 4 Oakland/San Francisco Bay Bridge I-80 5 San Mateo/Hayward Bridge Route 92 6 Dumbarton Bridge Route 84 7 Antioch Bridge Route 4/Route 160 8 USE Use Code Facility open to all vehicles 1 Carpool lane for 2+ vehicles 2 Carpool lane for 3+ vehicles 3 Trucks not allowed on facility 4 AT Area Type (see note) Regional Core (more than 300 density) 0 Central Business District (100-300 density) 1 Urban Business (55-100 density) 2 Urban (30-55 density) 3 Suburban (6-30 density) 4 Rural (less than 6 density) 5 FT Facility Type Freeway to freeway connector 1 Freeway 2 Expressway 3 Collector 4 Freeway Ramp 5 Dummy Link 6 Major Arterial 7 Metered Ramp 8 Special (not used) 9 Special (not used) 10 Local Street (potential new facility type) 11 Minor Arterial (potential new facility type) 12
Note: Area type density is defined as the Total Population + 2.5*Total Employment divided by the sum of the Residential and Commercial/Industrial Acres.

Decennial Model Update CCTA Model User’s Guide
Cambridge Systematics, Inc. 4-5
Table 4.3 Speed/Capacity Look-up Table
Facility Type Speed Class*
Area Type
Fwy- to-Fwy
(1) Fwy (2)
Expwy (3)
Collector (4)
Fwy Ramp
(5) Dummy
(6) Major
Arterial Metered
Ramp Special
(9) Special
(10) 1,700 1,850 1,300 550 1,300 na 800 700 1,900 (A) 1,350 (G) Core
(0) 40 55 40 10 30 20 25 55 40
1,700 1,850 1,300 600 1,300 na 850 700 1,950 (B) 1,500 (H) CBD (1) 40 55 40 15 30 25 25 60 45
1,750 1,900 1,450 650 1,400 na 900 800 2,000 (C) 1,530 (I) UBD (2) 45 60 45 20 35 30 30 65 55
1,750 1,900 1,450 650 1,400 na 900 800 1,780 (D) 900 (J) Urban (3) 45 60 45 25 35 30 30 50 25
1,800 1,950 1,500 800 1,400 na 950 900 1,800 (E) 950 (K) Suburb. (4) 50 65 50 30 40 35 35 45 30
1,800 1,950 1,500 850 1,400 na 950 900 1,840 (F) 980 (L) Rural (5) 50 65 55 35 40 40 35 50 40
Upper Entry: Capacity at level of service “E” in vehicles per hour per lane (i.e., ultimate capacity). Lower Entry: Free-flow speed (miles per hour). *Speed Class = (Area Type * 10) + Facility Type, 02/02/2001. na = not applicable. Notes: (A) TOS Fwy (AT=0,1); (B) TOS Fwy (AT=2,3); (C) TOS Fwy (AT=4,5); (D) Golden Gate; (E) TOS Fwy-to-Fwy (AT=0-3); (F) TOS Fwy-to-Fwy (AT=4,5); (G) Expwy TOS (AT=0,1); (H) Expwy TOS (AT=2,3); (I) Expwy TOS (AT=4,5); (J) Art.Sig.Coor. (AT=0,1); (K) Art.Sig.Coor. (AT=2,3); and (L) Art.Sig.Coor. (AT=4,5). Source: Metropolitan Transportation Commission.
Table 4.4 One-Way Tolls on Bay Area Bridges
Peak Tolls Off-Peak Tolls Bridge Name DA, SR2 SR3+ DA, SR2 SR3+ Benicia/Martinez Bridge I-680 Carquinez Bridge I-80 0.46 0 0.46 0 Richmond/San Rafael Bridge I-580 0.48 0 0.48 0.48 Golden Gate Bridge U.S. 101 0.47 0 0.47 0.47 Oakland/San Francisco Bay Bridge I-80 0.48 0 0.48 0.48 San Mateo/Hayward Bridge Route 92 0.48 0 0.48 0.48 Dumbarton Bridge Route 84 0.46 0 0.46 0 Antioch Bridge Route 4/Route 160 0.48 0 0.48 0

Decennial Model Update CCTA Model User’s Guide
4-6 Cambridge Systematics, Inc.
Table 4.5 Time-Based Link Delays on Bay Area Bridges (in 1998 Network)
TSVA Coding (Minutes)
Bridge Name Direction Toll
Class AM Midday PM Benicia/Martinez Bridge I-680 NB 1 6 6 6 SB 1 6 6 6
Carquinez Bridge I-80 NB 2 6 6 6 SB 2 6 6 6
Richmond/San Rafael Bridge I-580 WB 3 8 8 8 EB 3 6 6 6
Golden Gate Bridge US 101 NB 4 6 6 6 SB 4 11 11 11
Oakland/San Francisco Bay Bridge I-80 WB 5 16 16 16 EB 5 6 6 6
San Mateo/Hayward Bridge Route 92 WB 6 9 9 9 EB 6 6 6 6
Dumbarton Bridge Route 84 WB 7 16 16 16 EB 7 6 6 6
Antioch Bridge Route 4/Route 160 NB 8 6 6 6 SB 8 6 6 6
• Table 4.6 shows locations with reversible lanes. The CCTA model script generates only one peak period network that is used for both a.m. and p.m. peak periods. Since a.m. traffic conditions are key to the trip distribution and mode choice stages of the model, the a.m. lane configurations have been selected for coding in the CCTA peak period network. The exception is the Caldecott Tunnel where special script has been added to the CCTA model to generate separate a.m. and p.m. peak lanes for the tunnel since it closely affects Contra Costa traffic patterns.

Decennial Model Update CCTA Model User’s Guide
Cambridge Systematics, Inc. 4-7
Table 4.6 Locations with Reversible Lanes
Location Direction AM
Lanes PM
Lanes AM Use
Code PM Use
Code
Golden Gate Bridge U.S. 101 NB 2 4 SB 4 2
Caldecott Tunnel WB 4 2 EB 2 4
I-80 Sterling On-ramp EB 1 3
4.3 Master Highway Network Editing
The master highway network, like any conventional highway network can be edited inside TransCAD using all of the tools available in TransCAD. However, because it is a “master” network, the analyst should take into account the potential impacts of their edits on the linkages to the Validation Database, linkages to the intersection level of service computations, and linkages to the transit route and stops layers. The deletion of highway links and/or nodes may affect these linkages. The potential impact of link splits on the linkages should also be considered when editing the master highway network.
Linkage to Level of Service Computations
If level-of-service (LOS) computations are desired at a node, the following field cannot be deleted from the node layer: Number of Phases. Similarly, the following fields must be retained intact for all links approaching the node for which LOS computations are desired: Centroid Connector and Split Phasing.
Linkage to Validation Database
Model operators can edit all link and node characteristics, except the fields identified in Table 4.7 below, without adversely affecting the linkage between the Validation Database and TransCAD. Links can be moved and shaped without adversely affecting the linkage. Changing the field names listed in Table 4.7 for “macros” would adversely affect the func-tion of the macros to import updated count data from the Validation Database into the TransCAD master highway network.
Decennial Model Update CCTA Model User’s Guide
4-8 Cambridge Systematics, Inc.
Table 4.7 Linkage of Validation Database to CCTA Networks
Data Type Data Table Validation Field TransCAD Layer TransCAD Field
1. Transit Boardings
All Transit Modes Boarding Data
Mode Transit Mode
All Transit Operators Boarding Data
Operator Code Transit Owner
2. Freeway Ramp Counts
Freeway Ramp Counts – Alameda County
ID Highway Line ID
Freeway Ramp Counts – Contra Costa County
ID Highway Line ID
3. Intersection Turn Counts
Intersection Approach Counts
Requires Macro* which uses IntNo, N-APP, N-DEP, S-APP, S-DEP, E-APP, E-DEP, W-APP, and W-DEP
Highway Line Requires Macro* which uses IntCntLoc Int_Leg, AB_AppDep, and BA_AppDep
Intersection Turn Counts
IntNo Highway Node IntNo
4. Screenline Counts
Screenline Counts SL_ID Highway Line Requires Macro* which uses AB_SrLnID, and BA_SrLnID
5. Speed Data MTC Speed Data A, B Highway Node ID
*Note: See Validation Database Chapter for Macros to import data to TransCAD network.
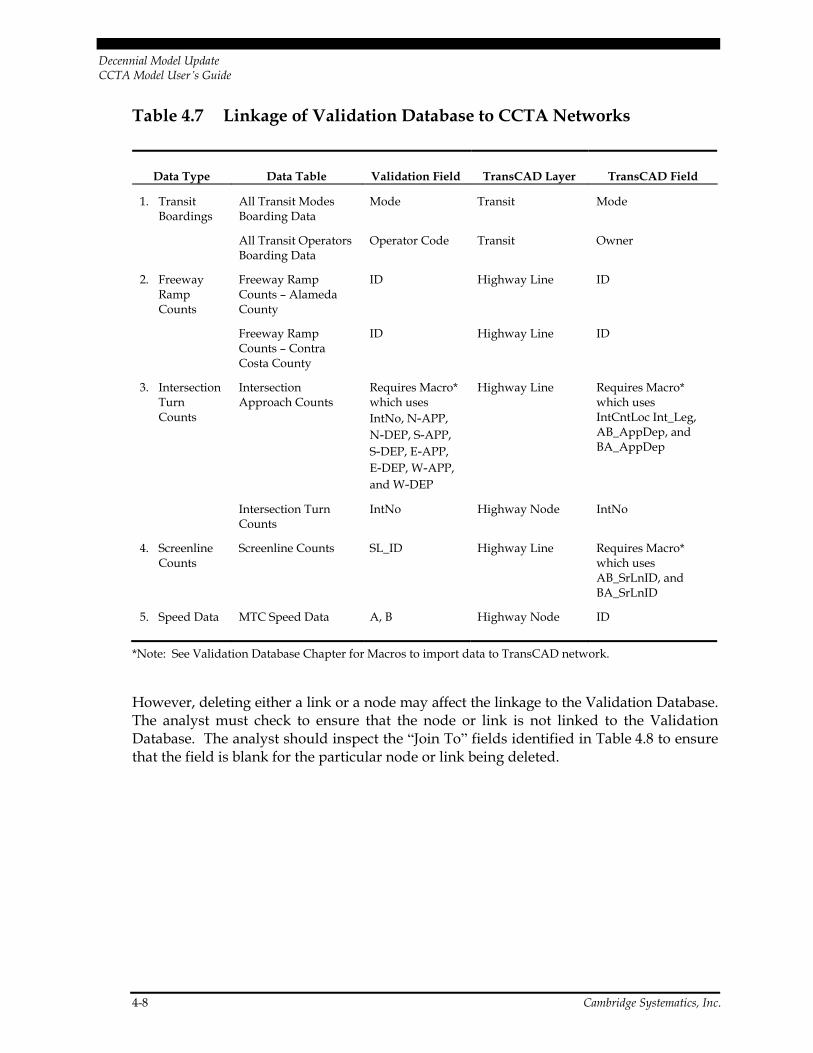
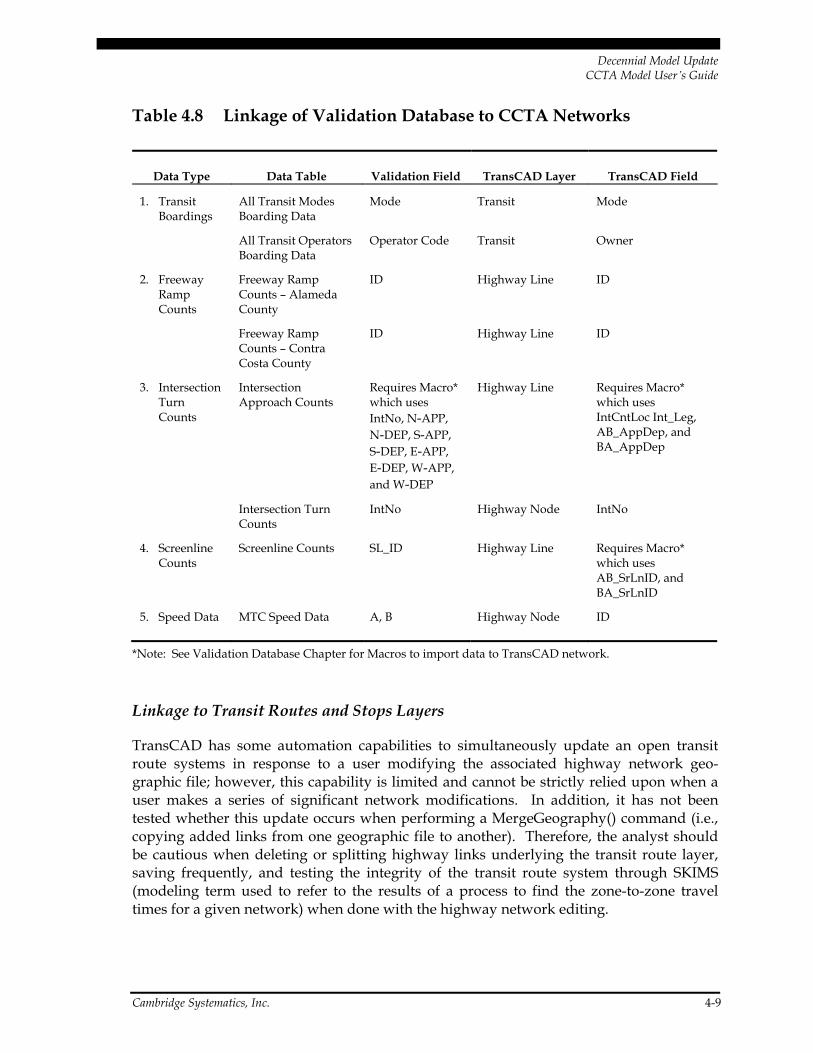
However, deleting either a link or a node may affect the linkage to the Validation Database. The analyst must check to ensure that the node or link is not linked to the Validation Database. The analyst should inspect the “Join To” fields identified in Table 4.8 to ensure that the field is blank for the particular node or link being deleted.
Decennial Model Update CCTA Model User’s Guide
Cambridge Systematics, Inc. 4-9
Table 4.8 Linkage of Validation Database to CCTA Networks
Data Type Data Table Validation Field TransCAD Layer TransCAD Field
1. Transit Boardings
All Transit Modes Boarding Data
Mode Transit Mode
All Transit Operators Boarding Data
Operator Code Transit Owner
2. Freeway Ramp Counts
Freeway Ramp Counts – Alameda County
ID Highway Line ID
Freeway Ramp Counts – Contra Costa County
ID Highway Line ID
3. Intersection Turn Counts
Intersection Approach Counts
Requires Macro* which uses IntNo, N-APP, N-DEP, S-APP, S-DEP, E-APP, E-DEP, W-APP, and W-DEP
Highway Line Requires Macro* which uses IntCntLoc Int_Leg, AB_AppDep, and BA_AppDep
Intersection Turn Counts
IntNo Highway Node IntNo
4. Screenline Counts
Screenline Counts SL_ID Highway Line Requires Macro* which uses AB_SrLnID, and BA_SrLnID
5. Speed Data MTC Speed Data A, B Highway Node ID
*Note: See Validation Database Chapter for Macros to import data to TransCAD network.
Linkage to Transit Routes and Stops Layers
TransCAD has some automation capabilities to simultaneously update an open transit route systems in response to a user modifying the associated highway network geo-graphic file; however, this capability is limited and cannot be strictly relied upon when a user makes a series of significant network modifications. In addition, it has not been tested whether this update occurs when performing a MergeGeography() command (i.e., copying added links from one geographic file to another). Therefore, the analyst should be cautious when deleting or splitting highway links underlying the transit route layer, saving frequently, and testing the integrity of the transit route system through SKIMS (modeling term used to refer to the results of a process to find the zone-to-zone travel times for a given network) when done with the highway network editing.

Decennial Model Update CCTA Model User’s Guide
4-10 Cambridge Systematics, Inc.
4.4 Network Generation Steps
All of the future scenario highway networks reside in the master highway network in the TransCAD formatted file, CCTA_Network.bin. The analyst must generate the specific highway network to be used. This is done through the macro (TransCAD resource code) provided in the model documentation appendix.
Decennial Model Update CCTA Model User’s Guide
Cambridge Systematics, Inc. 5-1
5.0 Transit Networks
5.1 Introduction
This section describes the transit network and the process used to edit it. In the CCTA model implementation of TransCAD, the transit network consists of two layers overlaid over the master highway network node and line layers: 1) route layer and 2) stop layer.
The transit access links (walk and drive) are stored in the master highway network. Walk access links are Mode 1; drive access links are Mode 2; and transfer links are Mode 3 in the master highway network. Mode 4 links are auto access walk funnel links. Mode 5 links are walk access walk funnel links. A funnel link is the dummy link connecting the park-and-ride lot to the station or the walk point to the station.
The master transit network was developed from the converted MTC years 2000 and 2025 transit networks. These networks had been converted by Caliper from TP+ to TransCAD.
5.2 Description of Transit Network
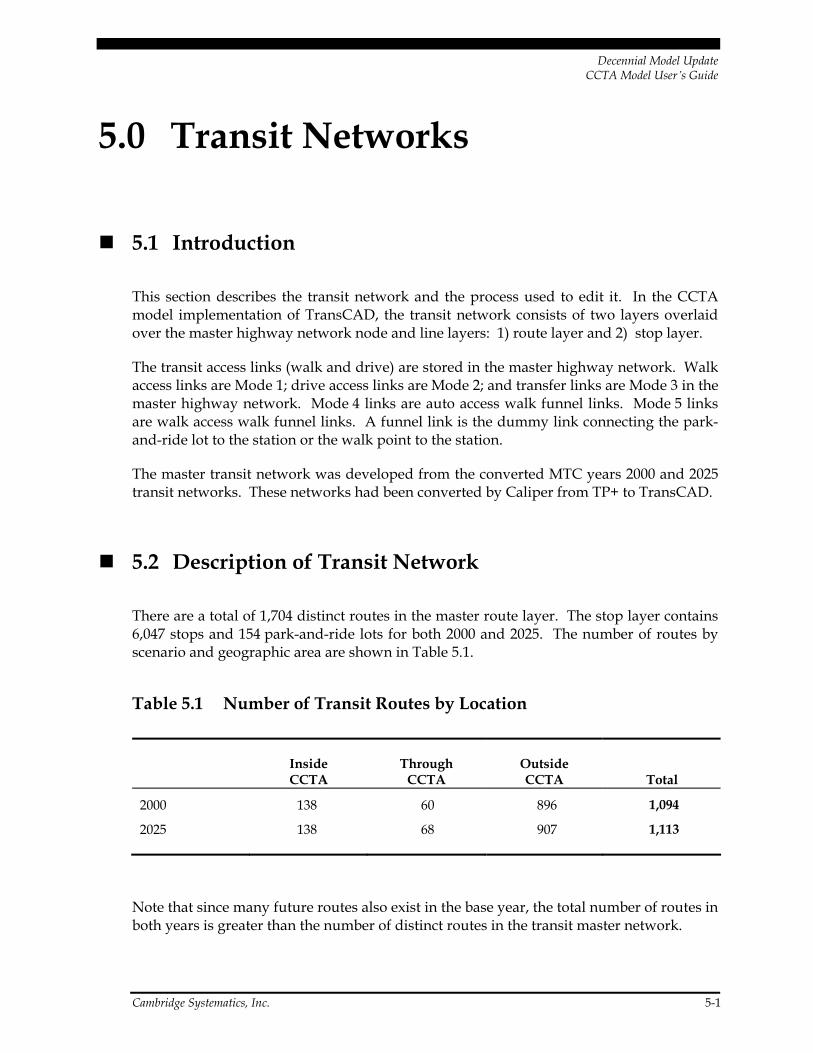
There are a total of 1,704 distinct routes in the master route layer. The stop layer contains 6,047 stops and 154 park-and-ride lots for both 2000 and 2025. The number of routes by scenario and geographic area are shown in Table 5.1.
Table 5.1 Number of Transit Routes by Location
Inside CCTA
Through CCTA
Outside CCTA Total
2000 138 60 896 1,094
2025 138 68 907 1,113
Note that since many future routes also exist in the base year, the total number of routes in both years is greater than the number of distinct routes in the transit master network.

Decennial Model Update CCTA Model User’s Guide
5-2 Cambridge Systematics, Inc.
The model documentation appendix provides a data dictionary for the transit stops layer. This appendix provides the data dictionary for the transit route layer.
Transit Access and Transfer Links
The transit master network contains the following access and transfer links:
1. Walk Access Links – Outside the study area, all the walk access links in the MTC 1998 and MTC 2025 models were combined together in the form of a “master walk access network” and brought into the CCTA master network, along with all the walk access attributes. Inside the study area, walk access links were created from all centroids to all stops/walk aux rail nodes within 0.5 mile of them. For those zones that did not have any stop within 0.5 mile, walk access links were created to the nearest stop to them to a maximum distance of eight miles. Walking speed on the links is assumed as three miles per hour.
2. Drive Access Links – Drive access links inside and outside the study area were pro-vided for all the zones that had drive access in the MTC 1998 and MTC 2025 models. For example, inside the study area, if a zone with a drive access link was split into four new zones, all these four zones now have drive access links to the parking lot. The “time” field on the drive access links inside the study area was filled by skimming the network on the congested time.
3. Transfer Links – Outside the study area, all the transfer links were brought in exactly as they were. Inside the study area, transfer links were created from all stops to all stops within 0.5 mile to each other.
4. Auto Access Walk “funnel” Links – These are the links from a park-and-ride lot to the rail station. Funnel links inside and outside the study area were brought in exactly as they were in the MTC 1998 and MTC 2025 models.
5. Walk Access Walk “funnel” Links – These are the links from a walk aux rail node to the rail station. Funnel links inside and outside the study area were brought in exactly as they were in the MTC 1998 and MTC 2025 models.
Table 5.2 provides the data dictionary for the non-motorized transit access links.

Decennial Model Update CCTA Model User’s Guide
Cambridge Systematics, Inc. 5-3
Table 5.2 Transit Non-Motorized Access Links
Field Name Field Description
Mode Transit mode as described in the mode table
Mdistance Length on the access link (skimmed distance for drive and transfer links) (miles)
MAB_Time Time taken to walk/drive (3 miles per hour walking speed for walk links and skimmed congested time for drive access links) (minutes)
MBA_Time Time in the reverse direction (minutes)
AB_NT_Time MAB_Time*0.01 (hundredths of minutes)
BA_NT_Time MBA_Time*0.01 (hundredths of minutes)
Future Year Networks
The future year transit networks were developed based on the following assumptions:
• Ace Train exists in 2000.
• All transit lines in the 2010, 2020, and 2025 scenarios inside the study area have the same route, frequency, and run time as the 2000 routes, except for the following:
− Track 1 – New train station at Hercules on the Capitol Corridor line;
− Track 1 – Increased frequency of Amtrak Capitol Corridor line between Oakland and Sacramento from 99 minutes to 60 minutes; and
− Track 2 – East County Commuter rail on existing tracks from Brentwood to Tracy.
• All routes passing through the study area from outside are kept the same as in the MTC 1998 and MTC 2025 models.
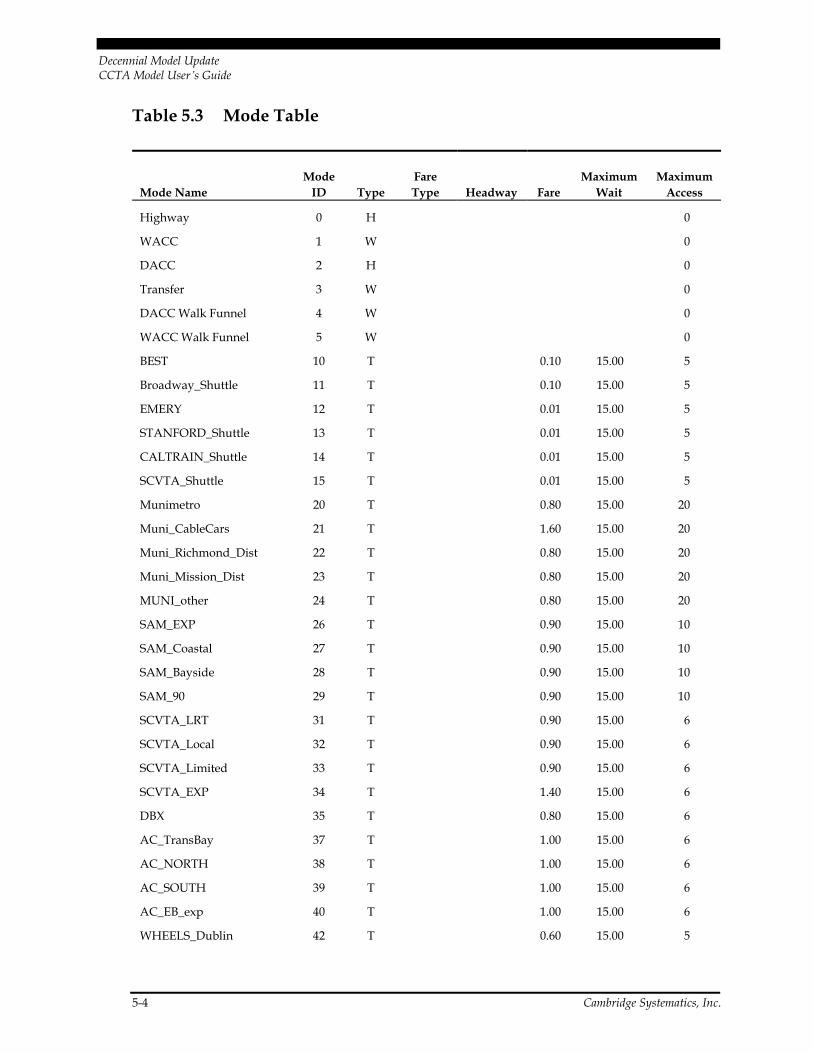
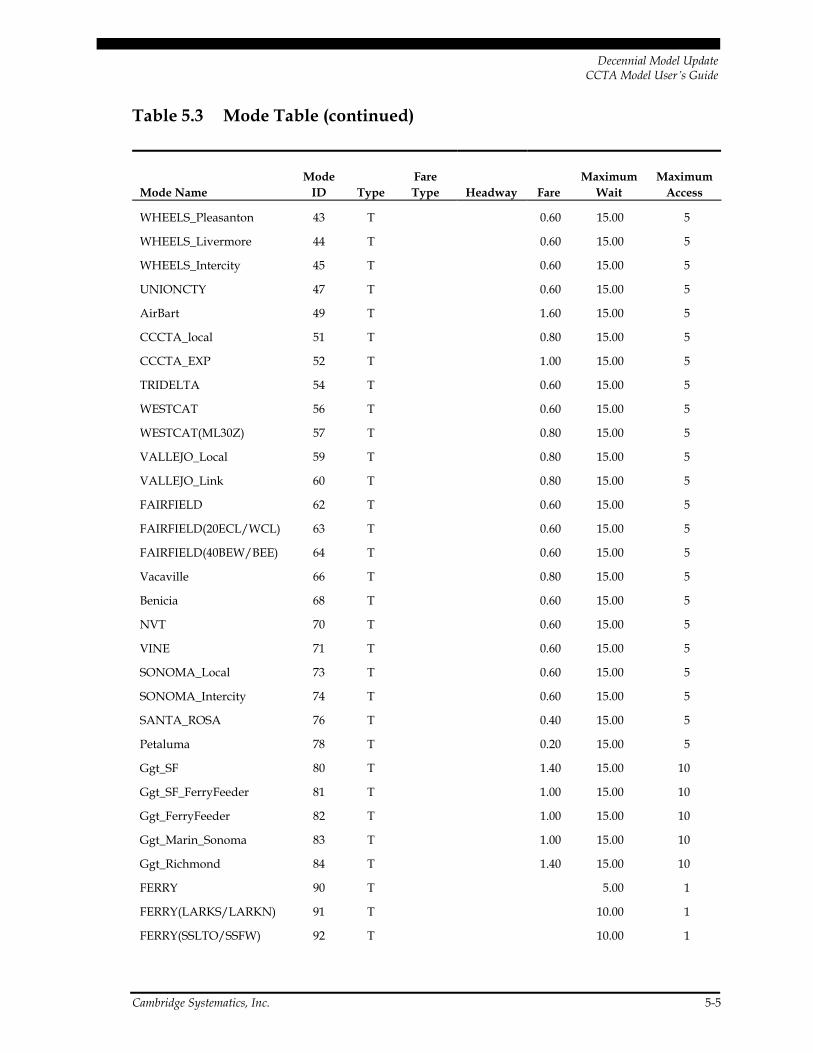
Table 5.3 provides a listing of the mode ID numbers for the transit operators.
Decennial Model Update CCTA Model User’s Guide
5-4 Cambridge Systematics, Inc.
Table 5.3 Mode Table
Mode Name Mode
ID Type Fare Type Headway Fare
Maximum Wait
Maximum Access
Highway 0 H 0
WACC 1 W 0
DACC 2 H 0
Transfer 3 W 0
DACC Walk Funnel 4 W 0
WACC Walk Funnel 5 W 0
BEST 10 T 0.10 15.00 5
Broadway_Shuttle 11 T 0.10 15.00 5
EMERY 12 T 0.01 15.00 5
STANFORD_Shuttle 13 T 0.01 15.00 5
CALTRAIN_Shuttle 14 T 0.01 15.00 5
SCVTA_Shuttle 15 T 0.01 15.00 5
Munimetro 20 T 0.80 15.00 20
Muni_CableCars 21 T 1.60 15.00 20
Muni_Richmond_Dist 22 T 0.80 15.00 20
Muni_Mission_Dist 23 T 0.80 15.00 20
MUNI_other 24 T 0.80 15.00 20
SAM_EXP 26 T 0.90 15.00 10
SAM_Coastal 27 T 0.90 15.00 10
SAM_Bayside 28 T 0.90 15.00 10
SAM_90 29 T 0.90 15.00 10
SCVTA_LRT 31 T 0.90 15.00 6
SCVTA_Local 32 T 0.90 15.00 6
SCVTA_Limited 33 T 0.90 15.00 6
SCVTA_EXP 34 T 1.40 15.00 6
DBX 35 T 0.80 15.00 6
AC_TransBay 37 T 1.00 15.00 6
AC_NORTH 38 T 1.00 15.00 6
AC_SOUTH 39 T 1.00 15.00 6
AC_EB_exp 40 T 1.00 15.00 6
WHEELS_Dublin 42 T 0.60 15.00 5
Decennial Model Update CCTA Model User’s Guide
Cambridge Systematics, Inc. 5-5
Table 5.3 Mode Table (continued)
Mode Name Mode
ID Type Fare Type Headway Fare
Maximum Wait
Maximum Access
WHEELS_Pleasanton 43 T 0.60 15.00 5
WHEELS_Livermore 44 T 0.60 15.00 5
WHEELS_Intercity 45 T 0.60 15.00 5
UNIONCTY 47 T 0.60 15.00 5
AirBart 49 T 1.60 15.00 5
CCCTA_local 51 T 0.80 15.00 5
CCCTA_EXP 52 T 1.00 15.00 5
TRIDELTA 54 T 0.60 15.00 5
WESTCAT 56 T 0.60 15.00 5
WESTCAT(ML30Z) 57 T 0.80 15.00 5
VALLEJO_Local 59 T 0.80 15.00 5
VALLEJO_Link 60 T 0.80 15.00 5
FAIRFIELD 62 T 0.60 15.00 5
FAIRFIELD(20ECL/WCL) 63 T 0.60 15.00 5
FAIRFIELD(40BEW/BEE) 64 T 0.60 15.00 5
Vacaville 66 T 0.80 15.00 5
Benicia 68 T 0.60 15.00 5
NVT 70 T 0.60 15.00 5
VINE 71 T 0.60 15.00 5
SONOMA_Local 73 T 0.60 15.00 5
SONOMA_Intercity 74 T 0.60 15.00 5
SANTA_ROSA 76 T 0.40 15.00 5
Petaluma 78 T 0.20 15.00 5
Ggt_SF 80 T 1.40 15.00 10
Ggt_SF_FerryFeeder 81 T 1.00 15.00 10
Ggt_FerryFeeder 82 T 1.00 15.00 10
Ggt_Marin_Sonoma 83 T 1.00 15.00 10
Ggt_Richmond 84 T 1.40 15.00 10
FERRY 90 T 5.00 1
FERRY(LARKS/LARKN) 91 T 10.00 1
FERRY(SSLTO/SSFW) 92 T 10.00 1

Decennial Model Update CCTA Model User’s Guide
5-6 Cambridge Systematics, Inc.
Table 5.3 Mode Table (continued)
Mode Name Mode
ID Type Fare Type Headway Fare
Maximum Wait
Maximum Access
FERRY(TIBFB/TIBFW) 93 T 5.00 1
FERRY(VALFB) 94 T 10.00 1
BART 100 T 15.00 2
CALTRAIN 101 T 15.00 2
AMTRAK 102 T 15.00 2
AMTRAK(SJQ) 103 T 15.00 2

Decennial Model Update CCTA Model User’s Guide
Cambridge Systematics, Inc. 6-1
6.0 Master Zonal Database
This section describes the master zonal database and the process used to edit it and create zonal files that are used in the trip generation and mode choice FORTRAN programs.
6.1 Introduction
The CCTA Travel Model uses four zonal data files as shown in Table 6.1. The format and content of these zonal data files have been carried over from the MTC model to accommo-date specifications in the trip generation and mode choice FORTRAN programs. To ease maintenance, updating, and inspection of the data, all four files were merged into a single, unified database for each analysis year. Prior to running the model, a pre-processing step creates each of these four ASCII files.
Table 6.1 CCTA Travel Model Zone Data Files
Data File Description
ZMAST*.ASC Master zonal data file
ZHBSK*.ASC School enrollment data file
ZAGE*.ASC Population for age group categories
AZLOS*.DAT Auto zonal level of service file
*Indicates the analysis year.
6.2 CCTA Master Zonal Database
The CCTA master zonal database (CCTA_2000_Phase1.DBD) includes all the base eco-nomic conditions for the region. This file includes the following:
• Population,
• Number of households,

Decennial Model Update CCTA Model User’s Guide
6-2 Cambridge Systematics, Inc.
• Employment categories,
• Income classifications,
• School/college enrollment,
• Age categories, and
• Auto zonal level of service variables.
The variables from each of the above categories are described in a data dictionary and pre-sented in the model documentation appendix. The data dictionary is comprised of the field names, field type, description, and data source for zones inside and outside the CCTA study area.
The variables included certain zone specific characteristics that currently do not exist as part of the LUIS. In order to implement Phase 1, testing of the new CCTA countywide model, the missing data was generated using the existing MTC zonal data. Because all CCTA zones nest within the MTC zones, it was possible to derive the values for each CCTA zone using the MTC data as a reference. For Phase 2, many of the data items were collected from local sources. If the data was from local sources, the derived values by analysis year serve as default values. Below describes how each value was derived using the MTC data as a reference.
• Total population – Total population was computed to be the same as household population in each CCTA zone for Phase 1. This procedure was replaced by total population from the 2000 Census in Phase 2 as part of the LUIS update.
• Households in single and multi-family dwelling units – Percentage of households in single and multi-family dwelling units to total households was computed for each MTC zone and applied to total households in each corresponding CCTA zone Phase 1. This procedure was replaced by households by type from the 2000 Census in Phase 2 as part of the LUIS update.
• Income quartiles – MTC distribution was computed and applied to each corre-sponding CCTA zone and adjusted as necessary to the average household income in Phase 1. This procedure was replaced by households by income quartile from the 2000 Census in Phase 2 as part of the LUIS update.
• Share of total population over age 62 – Percentage of population over age 62 in each MTC zone was calculated and applied to total population in each corresponding CCTA zone in Phase 1. This procedure was replaced by the share of population over age 62 from the 2000 Census in Phase 2 as part of the LUIS update.
• Agricultural, manufacturing, and wholesale employment categories – The sum of agricultural, manufacturing, wholesale, and other employment was computed to derive total other employment for each MTC zone. Percentage of each category to the total other employment in each MTC zone was calculated and applied to other employment category in each CCTA zone in Phase 1. This procedure was replaced by employment by type updated in the LUIS in Phase 2.

Decennial Model Update CCTA Model User’s Guide
Cambridge Systematics, Inc. 6-3
• School, college enrollment – In Phase 1, there was no valid method to derive these using the existing MTC or CCTA zonal data. In Phase 2, we compiled enrollment data for grade/middle school, high school, and college from the California Department of Education (CDE) web site. As part of this process, we requested and received a geographic information systems (GIS) file of all school locations from Caltrans.
• Calculation of age group profiles – Percentage of population in each age group to total population was calculated for each MTC zone and applied to the total population for each corresponding CCTA zone in Phase 1. This procedure was replaced with age group profiles from the 2000 Census as part of the LUIS update.
• Auto zonal level of service variables – These variables have information pertaining to parking costs and terminal times for each zone in the CCTA model. The majority of these values are calculated as part of the modeling process; however, parking cost in the peak and off-peak time periods is a required input of this dataset. For Phase 1, the MTC data was used as the default values.
6.3 CCTA Master Zonal Database Editing Considerations
The master zonal database can be easily edited to modify values of all variables using TransCAD software. If any of the values change, the four zonal ASCII files should be re-created using the GISDK script.
In case of zone splits and addition of new zones, the following steps should be taken to ensure the accuracy and consistency of the database:
1. Enter values for all the data fields in the new zone.
2. Apply appropriate percentage/aggregation of MTC data for those land use variables inside the study area for which data is not provided by the Authority (e.g., residential acreage (RESACRE); and commercial, industrial, and agricultural acreage (CIACRE)).
3. Perform error checks on the land use files (e.g., if RESACRE and CIACRE are both zero, the BAYCAST executable FORTRAN program will crash in home-based work trip generation).
4. Run the GISDK program to create the four ASCII zonal data files.
5. Resize K-factor matrices to represent the new zone system. This can be done by creating a TransCAD Dataview with the old and new zones and using the “Matrix – Disaggregate” feature.
6. Resize mode choice calibration delta files (HBSHMC29.DLT, HBSRMC29.DLT) to rep-resent the new zone system. Calibration deltas for the new zone can be assumed to be the same as that of the old zone or the nearest zone.

Decennial Model Update CCTA Model User’s Guide
Cambridge Systematics, Inc. 7-1
7.0 CCTA Model
This section describes the procedure to run the CCTA model and export the output files to create screenline analysis spreadsheets.
7.1 CCTA Travel Model Flowchart
A detailed flowchart was developed to better understand the inputs and outputs to each of the modules in the CCTA Travel Model. A list of input and output files specific to a scenario can also be found by clicking the ‘SETUP’ button in the ‘CCTA Planning Model’ interface.
Figure 7.1 has the flowchart for the 2000 model. Flowcharts for year 2025 are available upon request. The flowchart has a list of model input, output, and model programs used in each module.
7.2 Steps to Update Screenline Analysis and Validation Spreadsheets
After performing highway assignment, the model updates a database file called Screenline_links_withvol.DBF with the final traffic volumes for all time periods. This DBF file is used to update traffic volumes in the spreadsheet reports. The following are three spreadsheets that store highway assignment results for the a.m. peak period, p.m. peak period, and daily assignments:
• SCREENLINE_LINKS_WITHVOL.XLS – This spreadsheet reads traffic volumes from the DBF file of the same name. The DBF file should be opened to refresh the screenline volumes. The pivot point tables in the sheet named “ALL”, “Volume-Based”, and Link-Based” should be refreshed to update the facility/area type and link-based validation tables.
• CCTAScreenlines_1page(nolinks).xls – This spreadsheet has the detailed screenline analysis reports. Opening the SCREENLINE_LINKS_WITHVOL.XLS file will update all the screenline volumes.

Decennial Model Update CCTA Model User’s Guide
7-2 Cambridge Systematics, Inc.
Figure 7.1 CCTA Travel Model Flowchart

Decennial Model Update CCTA Model User’s Guide
Cambridge Systematics, Inc. 7-3

Decennial Model Update CCTA Model User’s Guide
7-4 Cambridge Systematics, Inc.
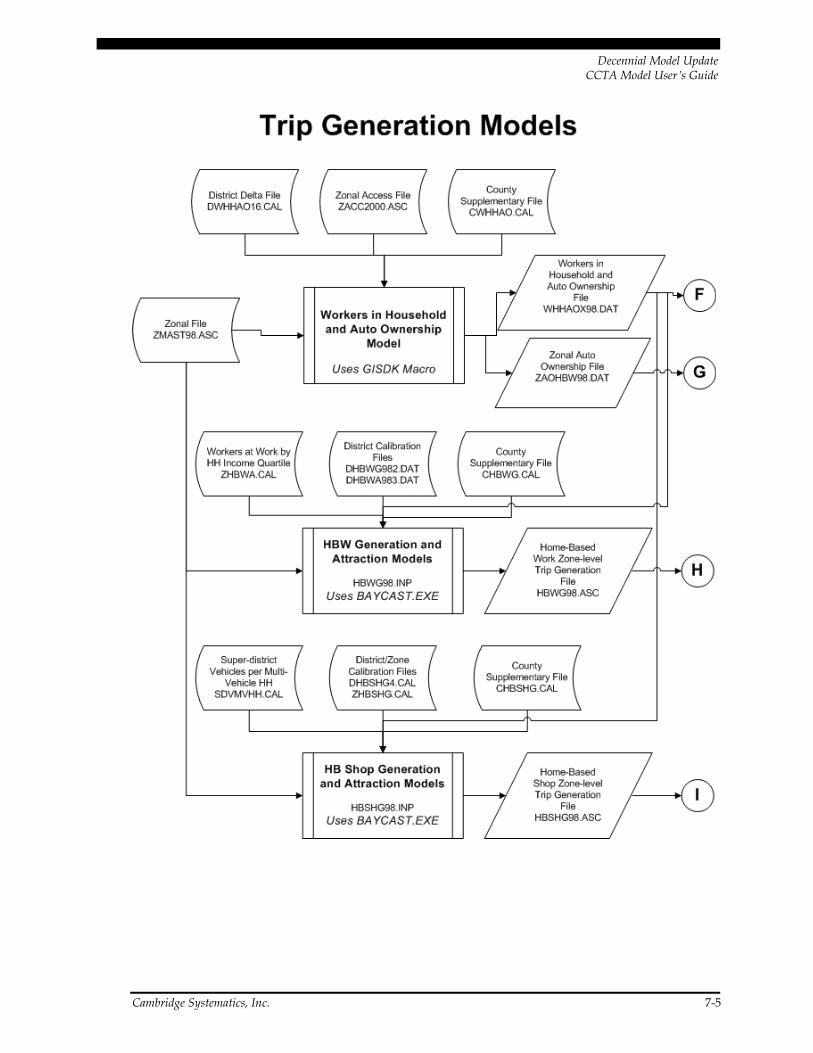
Decennial Model Update CCTA Model User’s Guide
Cambridge Systematics, Inc. 7-5

Decennial Model Update CCTA Model User’s Guide
7-6 Cambridge Systematics, Inc.

Decennial Model Update CCTA Model User’s Guide
Cambridge Systematics, Inc. 7-7

Decennial Model Update CCTA Model User’s Guide
7-8 Cambridge Systematics, Inc.

Decennial Model Update CCTA Model User’s Guide
Cambridge Systematics, Inc. 7-9

Decennial Model Update CCTA Model User’s Guide
7-10 Cambridge Systematics, Inc.

Decennial Model Update CCTA Model User’s Guide
Cambridge Systematics, Inc. 7-11

Decennial Model Update CCTA Model User’s Guide
7-12 Cambridge Systematics, Inc.

Decennial Model Update CCTA Model User’s Guide
Cambridge Systematics, Inc. 7-13

Decennial Model Update CCTA Model User’s Guide
7-14 Cambridge Systematics, Inc.

Decennial Model Update CCTA Model User’s Guide
Cambridge Systematics, Inc. 7-15
• Validation tables.xls – This spreadsheet has the final facility/area type, volume group, and link-based validation reports. Opening the SCREENLINE_LINKS_WITHVOL.XLS file will update all these reports.
Formulas with file and path references should automatically change when the spread-sheets and DBF files are opened. If they do not, perform a global ‘find and replace’ to update the file path to the correct data directory.

Decennial Model Update CCTA Model User’s Guide
Cambridge Systematics, Inc. 8-1
8.0 Forecasts
8.1 Introduction
The CCTA model is set up to run the Year 2000 calibration scenario, and the five future year scenarios shown in Table 8.1.
Table 8.1 Future Scenarios
Scenario Socioeconomic
Data (Year) Network Improvements
1. Existing 2000 Existing conditions as of 2000/2001, including recently completed major highway projects
2. TIP 2010 The 2002 Regional Transportation Improvement Program (RTIP/STIP) projects
3. CMP 2010 Authority’s 20031 Congestion Management Program, Capital Improvement Program (CMP/CIP)
4. RTP #1 2020
2020 MTC 2001 Regional Transportation Plan (RTP) Update Track 1 Improvements.
5. RTP #1 2025
2025 Same as Scenario 4
6. RTP #2 2025 MTC’s Blueprint; the RTP Track 2, plus selected projects from the Authority’s Comprehensive Transportation Project List (CTPL)
8.2 Data Requirements for Forecast
The CCTA travel model requires the following forecasts of input data in order to forecast future travel demand:
1. Socioeconomic Activity Forecasts;
2. Special Generators;

Decennial Model Update CCTA Model User’s Guide
8-2 Cambridge Systematics, Inc.
3. Miscellaneous Files;
4. Future Year Highway Network Improvements;
5. Future Year Transit Network Improvements; and
6. Future Year Intersection Geometry.
8.3 Socioeconomic Forecasts
The forecasted socioeconomic data required by the CCTA model are shown in the model documentation appendix. The data is stored in a “master zonal” file. The major categories are:
• Population (Total by age group);
• Household Population;
• Households;
• Number of households by Income Quartile;
• Employed Residents;
• Employment by Category;
• Mean Household Income by Income Quartile;
• School/College Enrollment;
• Total Acreage in Zone; and
• Auto Zonal Level of Service Variables.
Almost all of the forecast values for this data are contained in the Land Use Information System (LUIS) for the CCTA model area. For the MTC region, the values are obtained from the MTC web site.
Forecasts of population, household, income, and employment data by zone were devel-oped by EPS for inside Contra Costa and Tri-Valley. Forecasts of these data for the rest of the MTC region were taken directly from MTC forecast files for the region.
Residential, commercial, industrial and agricultural acres in a zone was not present in the LUIS database. They were calculated based on their percentage of total acres in the origi-nal MTC zones.
Future-year school enrollment is not forecasted by MTC or ABAG, and is not readily available for incorporation into this effort. Therefore, for this model development effort, future year enrollment has been set equal to year 2000 enrollment for all existing schools. Future school locations were provided by John Cunningham for Dougherty Valley. Enrollment for each new school was estimated using the table below (Table 8.2).

Decennial Model Update CCTA Model User’s Guide
Cambridge Systematics, Inc. 8-3
Table 8.2 Enrollment Assumptions for Future Schools
New School TAZ Enrollment Year
High School 40196 2,000 2007
Elementary School 40193 700 2010
Middle School 40191 1,150 2005
Total acreage for each zone is assumed to be unchanged in future years. It would only change if the zone boundaries were changed.
Auto Zonal Level of Service variables contain information on the parking costs and termi-nal times for each zone in the CCTA model. Most of these values are sensitive to network changes and could be calculated as part of the modeling process. Currently however, the terminal times and the parking costs are obtained from the MTC forecast files for both the base and the forecast years.
8.4 Special Generators
Special generators that were identified for addition to the CCTA Countywide travel model included hospitals, military bases, shopping malls, retirement homes and regional parks. The reviewed and recommended special generators are shown in Table 8.3. Note that all the special generators in the base year remain the same in all the forecast years. The only new special generator in the forecast years is the Deer Valley Medical Center.
8.5 Miscellaneous Files
Some data files other than the land use files were found to differ between the MTC 2000 and 2025 Models. A few of these are calibration files (dhbwg251.dat, dbhwa251.dat ) used in trip generation and others are ‘delta’ files (HBSMC.DLT, HBSRMC.DLT and NHBMC.DLT) used in Model Split. The intrazonal daily peak and off-peak trip input matrices also differ between years. All these files were converted from 1,099-zone system to Phase II zone system for the year 2025 using files from the MTC 2025 model. It is assumed that all these calibration and data files remain the same for all the forecast years (2010, 2020, and 2025).

Decennial Model Update CCTA Model User’s Guide
8-4 Cambridge Systematics, Inc.
Table 8.3 Special Generators
Name
Special Generator
Trips
Special Generator Employees
Remaining TAZ
Employees
Type of TAZ
Employees Year
Added
1 Contra Costa Regional Medical Center
3,954 373 738 Service 2000
2 John Muir Medical Center 5,518 731 702 Service 2000
3 Kaiser Permanente Walnut Creek Medical Center
4,602 521 445 Service 2000
5 Veterans Affairs Northern California Health Care
3,745 326 185 Service 2000
6 Doctors Medical Center 4,641 530 550 Service 2000
7 Mt. Diablo Medical Center 4,901 590 710 Service 2000
8 Sutter Delta Medical Center 3,416 250 39 Service 2000
9 Valley Care Health System 3,735 323 1,692 Service 2000
10 Broadway Plaza/Downtown Walnut Creek
31,725 1,076 546 Retail 2000
11 Sun Valley Mall 51,137 2,261 2,212 Retail 2000
12 County East Mall 27,217 848 -848 Retail 2000
13 Hilltop Mall 56,896 2,669 -1,709 Retail 2000
14 Stoneridge Mall 47,526 2,017 -1,837 Retail 2000
15 Parks Reserve Forces Training Area
5,395 741 -589 Service 2000
16 Rossmoor Retirement Home 18,576 8,000 0 Residents 2000
17 Deer Valley Medical Center 4,195 811 0 Service 2010
Note: All the special generators in the base year remain the same in all the forecast years. The only new spe-cial generator in the forecast years is the Deer Valley Medical Center.
The transit stop fare and link fare files also changed between the base and the MTC 2025 model. Since the 2000 transit network is used for 2000 and 2010, the year 2000 MTC fares are used for those years. Similarly, since the MTC 2025 transit route system is used for the subsequent years, the corresponding transit files (e.g., stopfare, linkfare, modes, modefactors, and farematrix) are used for the respective future forecasts to avoid errors due to differ-ences in route systems between years.
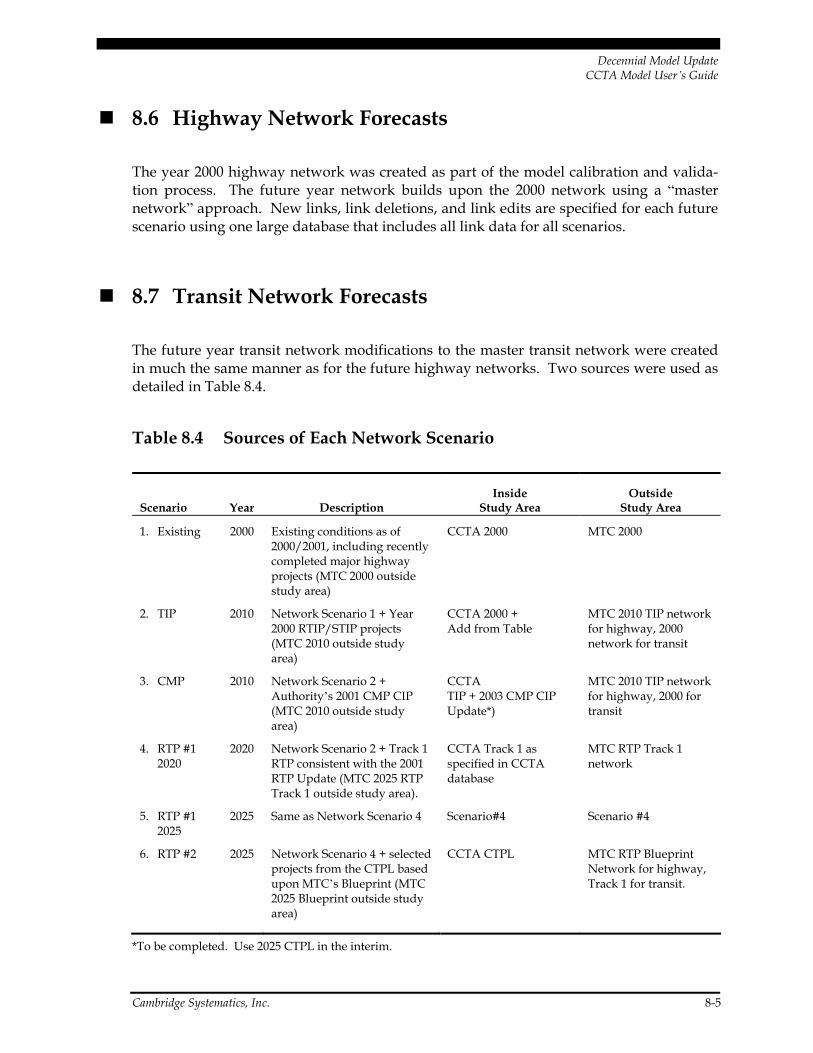
Decennial Model Update CCTA Model User’s Guide
Cambridge Systematics, Inc. 8-5
8.6 Highway Network Forecasts
The year 2000 highway network was created as part of the model calibration and valida-tion process. The future year network builds upon the 2000 network using a “master network” approach. New links, link deletions, and link edits are specified for each future scenario using one large database that includes all link data for all scenarios.
8.7 Transit Network Forecasts
The future year transit network modifications to the master transit network were created in much the same manner as for the future highway networks. Two sources were used as detailed in Table 8.4.
Table 8.4 Sources of Each Network Scenario
Scenario Year Description Inside
Study Area Outside
Study Area
1. Existing 2000 Existing conditions as of 2000/2001, including recently completed major highway projects (MTC 2000 outside study area)
CCTA 2000 MTC 2000
2. TIP 2010 Network Scenario 1 + Year 2000 RTIP/STIP projects (MTC 2010 outside study area)
CCTA 2000 + Add from Table
MTC 2010 TIP network for highway, 2000 network for transit
3. CMP 2010 Network Scenario 2 + Authority’s 2001 CMP CIP (MTC 2010 outside study area)
CCTA TIP + 2003 CMP CIP Update*)
MTC 2010 TIP network for highway, 2000 for transit
4. RTP #1 2020
2020 Network Scenario 2 + Track 1 RTP consistent with the 2001 RTP Update (MTC 2025 RTP Track 1 outside study area).
CCTA Track 1 as specified in CCTA database
MTC RTP Track 1 network
5. RTP #1 2025
2025 Same as Network Scenario 4 Scenario#4 Scenario #4
6. RTP #2 2025 Network Scenario 4 + selected projects from the CTPL based upon MTC’s Blueprint (MTC 2025 Blueprint outside study area)
CCTA CTPL MTC RTP Blueprint Network for highway, Track 1 for transit.
*To be completed. Use 2025 CTPL in the interim.

Decennial Model Update CCTA Model User’s Guide
8-6 Cambridge Systematics, Inc.
8.8 Future Intersection Geometry
Base year (2000) traffic counts and future year geometry must be input into the CCTALOS files for intersection level of service analysis (see next chapter for details).

Decennial Model Update CCTA Model User’s Guide
Cambridge Systematics, Inc. 9-1
9.0 Level of Service
9.1 Introduction
This User’s Guide describes in detail the Contra Costa Transportation Authority Level of Service (CCTALOS) Program in TransCAD (Figure 9.1) and provides instructions for its use. In this document, you will learn how to install and launch the Add-in and how to use it to apply Furness adjustment to future year turning volumes and to compute signalized intersection level of service with the CCTALOS method, as well as the Intersection Capacity Utilization (ICU) method.
Figure 9.1 TransCAD CCTA Level of Service (CCTALOS) Procedures
Copyright ©2003 Caliper Corporation, all rights reserved, May 22, 2003.
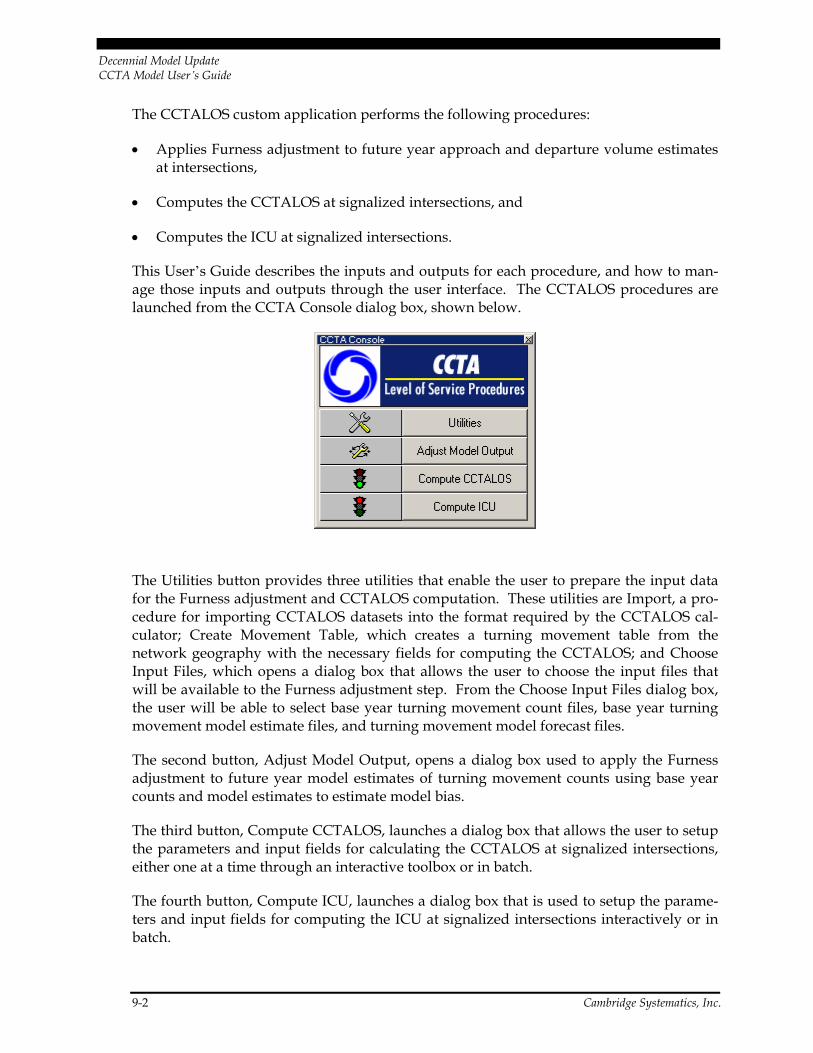
Decennial Model Update CCTA Model User’s Guide
9-2 Cambridge Systematics, Inc.
The CCTALOS custom application performs the following procedures:
• Applies Furness adjustment to future year approach and departure volume estimates at intersections,
• Computes the CCTALOS at signalized intersections, and
• Computes the ICU at signalized intersections.
This User’s Guide describes the inputs and outputs for each procedure, and how to man-age those inputs and outputs through the user interface. The CCTALOS procedures are launched from the CCTA Console dialog box, shown below.
The Utilities button provides three utilities that enable the user to prepare the input data for the Furness adjustment and CCTALOS computation. These utilities are Import, a pro-cedure for importing CCTALOS datasets into the format required by the CCTALOS cal-culator; Create Movement Table, which creates a turning movement table from the network geography with the necessary fields for computing the CCTALOS; and Choose Input Files, which opens a dialog box that allows the user to choose the input files that will be available to the Furness adjustment step. From the Choose Input Files dialog box, the user will be able to select base year turning movement count files, base year turning movement model estimate files, and turning movement model forecast files.
The second button, Adjust Model Output, opens a dialog box used to apply the Furness adjustment to future year model estimates of turning movement counts using base year counts and model estimates to estimate model bias.
The third button, Compute CCTALOS, launches a dialog box that allows the user to setup the parameters and input fields for calculating the CCTALOS at signalized intersections, either one at a time through an interactive toolbox or in batch.
The fourth button, Compute ICU, launches a dialog box that is used to setup the parame-ters and input fields for computing the ICU at signalized intersections interactively or in batch.

Decennial Model Update CCTA Model User’s Guide
Cambridge Systematics, Inc. 9-3
The rest of this guide explains the installation and use of the CCTA Console dialog box in greater detail.
Installing the CCTA Console Add-in
The custom Add-in is packaged in an easy-to-install setup program. The setup program is packaged in a file called, “install.exe.” To begin installation, double-click on the file from within Windows. You will be prompted for the directory where TransCAD is installed.
This step only needs to be run one time (per computer). After it is installed, running the Add-in is as simple as running TransCAD. First, start TransCAD, then go to Tools-Add-ins and choose the Add-in called CCTA Console. Click on OK to launch the custom add-in.
The installation will install a set of Tutorial files for practicing and testing the CCTALOS procedures. These files are as follows:
• A geographic database called, “cctalos_example.dbd,” which contains line and node layers containing input data for the CCTALOS and ICU methodologies;
• Three turning movement volume files, TM_Counts.bin, TM_CurrEst.bin, and TM_ForeEst.bin, which contain base year turning movement counts, base year model estimates, and future year model estimates, respectively; and
• A workspace called, “ccta.wrk,” which opens the urbanstreets.dbd database and the future year model estimates file, TM_ForeEst.bin. You should be able to begin using the CCTA procedures immediately after opening ccta.wrk and launching the add-in.
Launching the CCTA Console
Once the Add-in is installed using the steps described above, the main dialog box is launched through the Add-ins item in the Tools menu in TransCAD.
1. If TransCAD is not running, launch TransCAD.
2. Choose Tools-Add-ins.
3. Choose CCTA Console and click OK to display the CCTA Console dialog box. (If you do not see CCTA Console in the Add-ins window, click Cancel and INSTALL the Add-in by following the directions above.)
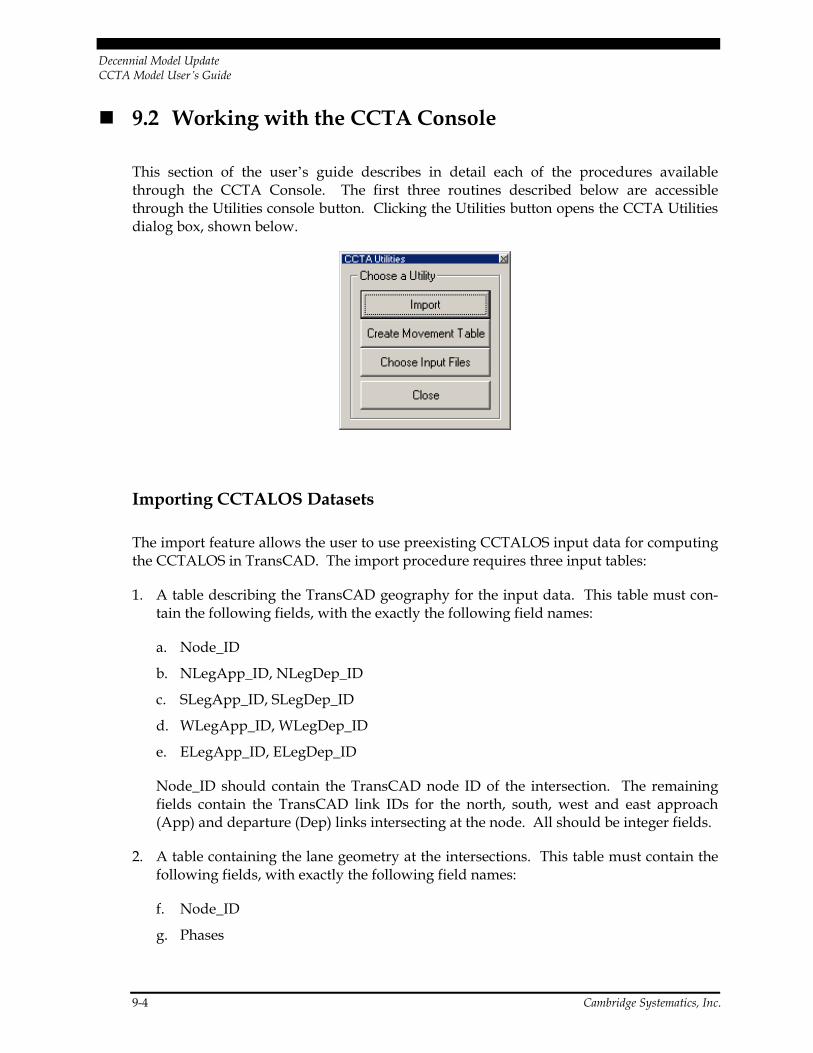
Decennial Model Update CCTA Model User’s Guide
9-4 Cambridge Systematics, Inc.
9.2 Working with the CCTA Console
This section of the user’s guide describes in detail each of the procedures available through the CCTA Console. The first three routines described below are accessible through the Utilities console button. Clicking the Utilities button opens the CCTA Utilities dialog box, shown below.
Importing CCTALOS Datasets
The import feature allows the user to use preexisting CCTALOS input data for computing the CCTALOS in TransCAD. The import procedure requires three input tables:
1. A table describing the TransCAD geography for the input data. This table must con-tain the following fields, with the exactly the following field names:
a. Node_ID
b. NLegApp_ID, NLegDep_ID
c. SLegApp_ID, SLegDep_ID
d. WLegApp_ID, WLegDep_ID
e. ELegApp_ID, ELegDep_ID
Node_ID should contain the TransCAD node ID of the intersection. The remaining fields contain the TransCAD link IDs for the north, south, west and east approach (App) and departure (Dep) links intersecting at the node. All should be integer fields.
2. A table containing the lane geometry at the intersections. This table must contain the following fields, with exactly the following field names:
f. Node_ID
g. Phases

Decennial Model Update CCTA Model User’s Guide
Cambridge Systematics, Inc. 9-5
h. NS_Split, EW_Split
i. SBR, SBT, SBL
j. NBR, NBT, NBL
k. WBR, WBT, WBL
l. EBR, EBT, EBL
Node_ID should be an integer field containing the TransCAD node ID of the intersec-tion. Phases should be an integer field containing the number of phases at the inter-section. The remaining fields should be string fields. The values in the NS_Split and EW_Split fields are not case-sensitive, and should contain “no” or “yes” in either any of the following forms: “N”/”Y” or “Yes”/No.”
Fields SBR through EBT should be filled with strings of the form “2.1,” where “2” is the number of lanes for the turning movement and “1” is the lane use code for the turning movement.
3. A table containing the turning movements at the intersections. This table must contain the following fields, with exactly the following field names:
m. Node_ID
n. SBR, SBT, SBT
o. NBR, NBT, NBT
p. WBR, WBT, WBT
q. EBR, EBT, EBT
Node_ID should be an integer field containing the TransCAD node ID of the intersec-tion. Fields SBR through EBT should be integer fields filled with the turning move-ment volumes.
All of the above three tables must be open when you click the Import button in the CCTA Utilities dialog box. The program will warn you if any of the input files is not open or does not contain the appropriate fields. In addition, a fourth table should be open in your workspace. This fourth table is the turning movement table that will contain the turning movement data in the format required by the CCTALOS calculator (see Creating a Turning Movement Table in the next section). The following fields with the following field names must be in the table:
• Node_ID
• FromLink
• ToLink
• Flow
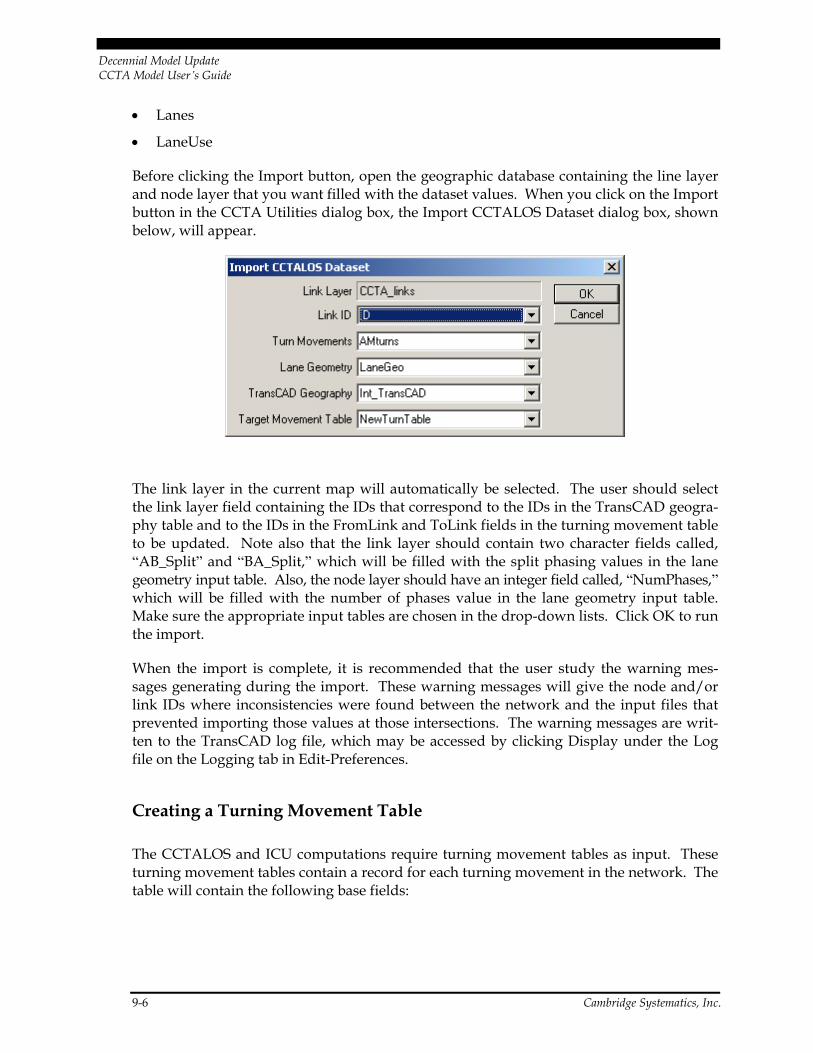
Decennial Model Update CCTA Model User’s Guide
9-6 Cambridge Systematics, Inc.
• Lanes
• LaneUse
Before clicking the Import button, open the geographic database containing the line layer and node layer that you want filled with the dataset values. When you click on the Import button in the CCTA Utilities dialog box, the Import CCTALOS Dataset dialog box, shown below, will appear.
The link layer in the current map will automatically be selected. The user should select the link layer field containing the IDs that correspond to the IDs in the TransCAD geogra-phy table and to the IDs in the FromLink and ToLink fields in the turning movement table to be updated. Note also that the link layer should contain two character fields called, “AB_Split” and “BA_Split,” which will be filled with the split phasing values in the lane geometry input table. Also, the node layer should have an integer field called, “NumPhases,” which will be filled with the number of phases value in the lane geometry input table. Make sure the appropriate input tables are chosen in the drop-down lists. Click OK to run the import.
When the import is complete, it is recommended that the user study the warning mes-sages generating during the import. These warning messages will give the node and/or link IDs where inconsistencies were found between the network and the input files that prevented importing those values at those intersections. The warning messages are writ-ten to the TransCAD log file, which may be accessed by clicking Display under the Log file on the Logging tab in Edit-Preferences.
Creating a Turning Movement Table
The CCTALOS and ICU computations require turning movement tables as input. These turning movement tables contain a record for each turning movement in the network. The table will contain the following base fields:

Decennial Model Update CCTA Model User’s Guide
Cambridge Systematics, Inc. 9-7
1. Node_ID – The node ID at which the turn movement occurs;
2. FromLink – The approach link for the turn movement; and
3. ToLink – The departure link for the turn movement.
When you click on the Create Movement Table button in the CCTA Utilities dialog box, the Create a Turning Movement Table dialog box, shown below, will appear.
To create a turning movement table, the link layer for which you want the turning move-ments must be the active layer. The link layer will, thus, be chosen automatically and dis-played in the dialog box. Select the link layer field containing the link IDs to be placed in the FromLink and ToLink fields.
In the Intersections drop-down list, choose the selection set containing the nodes for which you want to generate turning movement records. This selection set might contain only the nodes that represent signalized intersections in the network. By default, the user may generate turning movement records for “All Nodes” in the network. For very large networks, this may result in a large file. Thus, it is recommended that a selection set is used to avoid creating turning movement records at nodes for which the LOS is not relevant.
The Centroid Flag field is an integer field in the node layer table that has a null value for all real intersections, and a non-null value for centroids. The Centroid Flag field is optional. If you choose a field in the list, turning movements that involve centroid con-nectors will have a value of -1 in the FromLink or ToLink field indicating a centroid connector.
In the Create a Turning Movement Table dialog box, the user may select more fields to be added to the turn movement table. These will be included as empty fields in the table. Default input fields are created for the CCTALOS and ICU methods if the Include CCTALOS Fields or Include ICU Fields checkboxes are checked, respectively. Also, the user may click Add Fields to specify field names and types of his or her choosing.
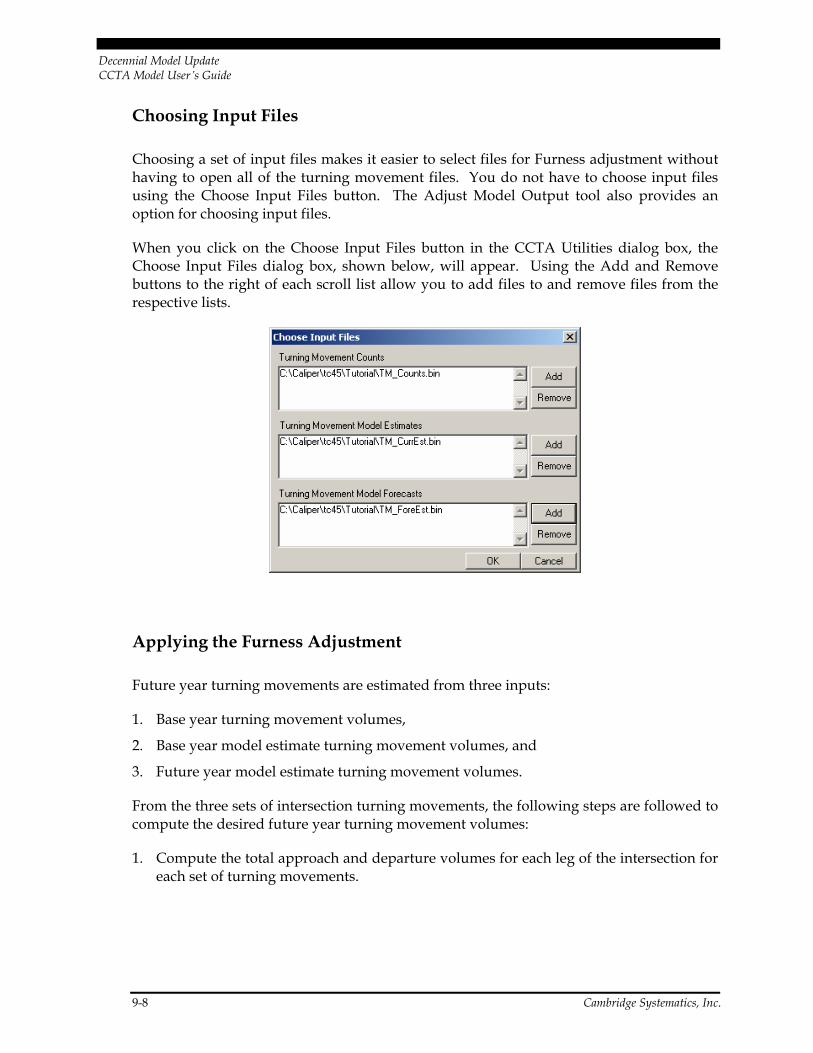
Decennial Model Update CCTA Model User’s Guide
9-8 Cambridge Systematics, Inc.
Choosing Input Files
Choosing a set of input files makes it easier to select files for Furness adjustment without having to open all of the turning movement files. You do not have to choose input files using the Choose Input Files button. The Adjust Model Output tool also provides an option for choosing input files.
When you click on the Choose Input Files button in the CCTA Utilities dialog box, the Choose Input Files dialog box, shown below, will appear. Using the Add and Remove buttons to the right of each scroll list allow you to add files to and remove files from the respective lists.
Applying the Furness Adjustment
Future year turning movements are estimated from three inputs:
1. Base year turning movement volumes,
2. Base year model estimate turning movement volumes, and
3. Future year model estimate turning movement volumes.
From the three sets of intersection turning movements, the following steps are followed to compute the desired future year turning movement volumes:
1. Compute the total approach and departure volumes for each leg of the intersection for each set of turning movements.

Decennial Model Update CCTA Model User’s Guide
Cambridge Systematics, Inc. 9-9
2. Compute the adjusted future year approach and departure volumes as follows:
a. Adjusted Future Year Approach Volume =
(Base Year Count Approach Volume) + (Future Year Model Approach Volume) – (Base Year Model Approach Volume)
b. Adjusted Future Year Departure Volume =
(Base Year Count Departure Volume) + (Future Year Model Departure Volume) – (Base Year Model Departure Volume)
3. Apply the Furness adjustment to the base year turning movement counts to achieve the adjusted future year approach and departure volumes.
Furness Adjustment Input
The input turning movement tables should contain a record for each turning movement. The input tables can have any number of records, storing turning movement data for any number of intersections. However, there are certain required input fields that must be in the tables in order to apply the Furness adjustment. These fields are listed below with a brief description:
• From Link – A field containing IDs or codes that uniquely identify each link in the network;
• To Link – A field containing IDs or codes that uniquely identify each link in the network;
• Node ID – A field containing the node ID for the intersection at which the turning movement takes place; and
• Flow – A field containing the volumes in vehicles/hour for the turning movement.
There can be any number of Flow fields in a single table to contain flow volumes for dif-ferent scenarios.
Furness Adjustment Steps
To apply the Furness adjustment to model output, follow the steps below:
1. Click the Adjust Model Output button to launch the Apply Furness Adjustment dialog box.
2. If any files were selected using the Choose Input Files button, those files will appear in the drop-down lists in the Adjust Model Output dialog box. Choose the input turning
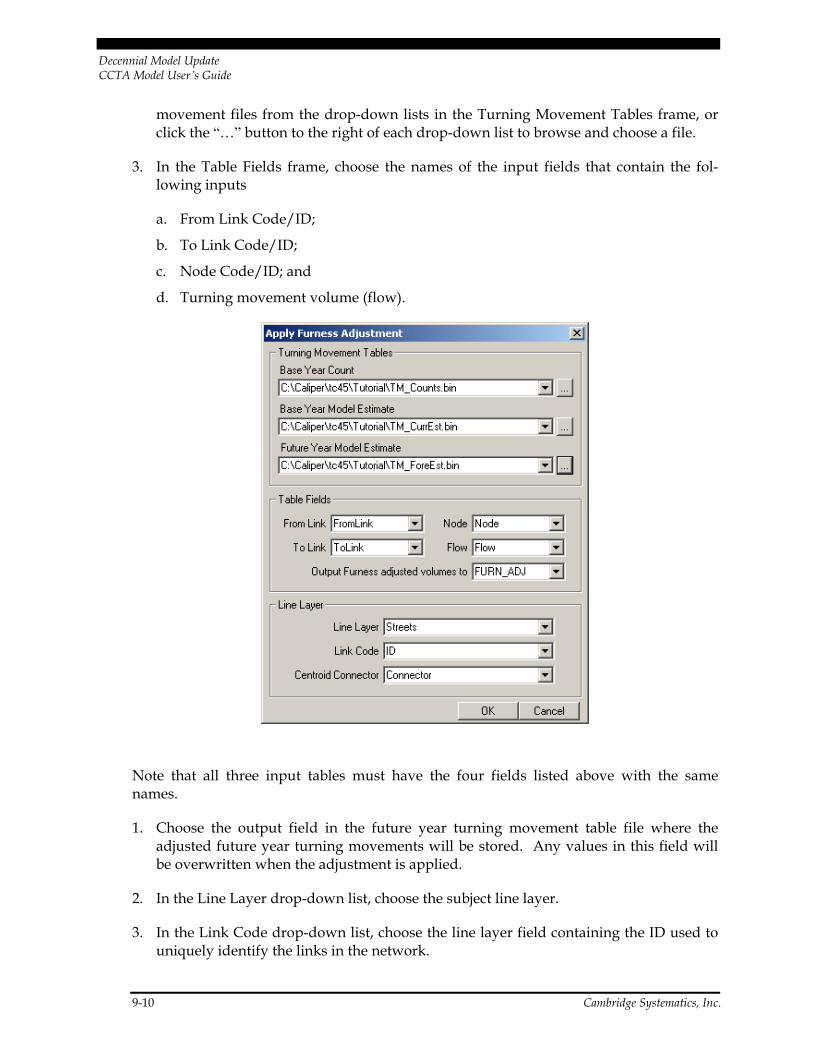
Decennial Model Update CCTA Model User’s Guide
9-10 Cambridge Systematics, Inc.
movement files from the drop-down lists in the Turning Movement Tables frame, or click the “…” button to the right of each drop-down list to browse and choose a file.
3. In the Table Fields frame, choose the names of the input fields that contain the fol-lowing inputs
a. From Link Code/ID;
b. To Link Code/ID;
c. Node Code/ID; and
d. Turning movement volume (flow).
Note that all three input tables must have the four fields listed above with the same names.
1. Choose the output field in the future year turning movement table file where the adjusted future year turning movements will be stored. Any values in this field will be overwritten when the adjustment is applied.
2. In the Line Layer drop-down list, choose the subject line layer.
3. In the Link Code drop-down list, choose the line layer field containing the ID used to uniquely identify the links in the network.

Decennial Model Update CCTA Model User’s Guide
Cambridge Systematics, Inc. 9-11
4. In the Centroid Connector drop-down list, choose the field indicating whether or not links in the network are centroid connectors.
5. Click OK to execute and apply the adjustment.
When the Furness adjustment is complete, a results summary dialog box will appear. Click Show Warnings to view any warning messages generated during the adjustment. Click Show Detailed Report to view a summary of the input and adjusted turn volumes at each intersection.
Computing Signalized Intersection Level of Service
Two methods are provided in the CCTA Console dialog box for computing signalized intersection level of service. These methods are the CCTALOS and the ICU. In the fol-lowing sections, these methods and their implementation in TransCAD are described.
To compute the CCTALOS, click the Compute CCTALOS button on the CCTA Console dialog box. Likewise, to compute the ICU, click the Compute ICU button. More details are provided in the following sections.
9.3 Computing CCTALOS
The computation of the CCTALOS has been adapted from the CCTA Technical Procedures manual. The CCTALOS is a planning method for describing the level of service at signal-ized intersections.

Decennial Model Update CCTA Model User’s Guide
9-12 Cambridge Systematics, Inc.
Four inputs are required for computing the CCTALOS at a signalized intersection:
1. Lane configuration and lane use,
2. Turning movement volumes,
3. Split phasing information, and
4. Number of phases.
Below is a detailed description of the implementation of CCTALOS in TransCAD.
About CCTALOS
In order to calculate the CCTALOS in TransCAD, you will need three things:
1. A node layer,
2. A line layer, and
3. A movement table.
The line layer, node layer, and movement table require a number of input fields in order to facilitate the CCTALOS analysis. Below is a description of the various input fields.
Movement Table Input Fields
Data specific to a particular turning movement is stored in fields in turning movement tables. Turning movement table fields include:
• FromLink,
• ToLink,
• Flow,
• Lanes,
• Lane Use, and
• Direction.
The FromLink and ToLink fields contain unique link code/IDs that designate the approach and departure links, respectively, for the turning movement. The Flow field contains the turning movement volumes in vehicles/hour. The Lanes field contains the number of lanes used by the turning movement, and the Lane Use field contains the lane use code, as described in Table VI-III of the CCTALOS Technical Procedures manual, indi-cating how the lanes are used by the turning movements. All fields in the turning move-ment table are required with the exception of the last field, Direction.
The Direction field can be used to override the cardinal directions and turning movements determined by link geography. The value in the Direction field should be a string that
Decennial Model Update CCTA Model User’s Guide
Cambridge Systematics, Inc. 9-13
takes on one of the 12 possible values: EBL, EBT, EBR, NBL, NBT, NBR, WBL, WBT, WBR, SBL, SBT, or SBR. If a Direction field is provided, then the values in the field will be used to determine the cardinal directions of each approach link and the turning movements. If None is chosen in the Direction field, then the cardinal directions and turning movements will be calculated by TransCAD according to the geography. Furthermore, the cardinal and turn direction for each movement will be written to a field called, “CARD_DIR,” which is generated automatically. If this field already exists, the values in the field will be overwritten.
Line and Node Layer Input Fields
Input data that does not pertain to a single turning movement is stored in the line and node layers associated with a line database. The line and node fields used in the CCTALOS computation are listed below:
• Node Fields:
− Number of Phases.
• Line Layer Fields:
− Link Code/ID,
− Centroid Connector,
− Split Phasing, and
− Pedestrian Flow (optional).
The Number of Phases field contains the number of signal phases at the intersection. The Link Code/ID field contains a code/ID that uniquely identifies the link the network. The Centroid Connector field contains null and non-null values, where null indicates a real link. Records with values other than null indicate centroid connectors or other symbolic links. Turning movements that include a centroid connector are ignored in the computa-tion. Split Phasing information is stored in a pair of AB/BA string fields containing either “Yes” or “No” to indicate whether or not split phasing is used on the approach. Finally, the number of pedestrians crossing the AB/BA end of the link at the intersection is stored in the Pedestrian Flow field. These pedestrians will interfere with vehicles turning right onto the link. The Pedestrian Flow field is used to adjust right-turn volumes and is optional.
The Split Phasing and Pedestrian Flow fields contain information that is specific to the approach to an intersection. Thus, there should be AB and BA fields for each variable in order to distinguish directionality (e.g., AB_Field_Name, BA_Field_Name).
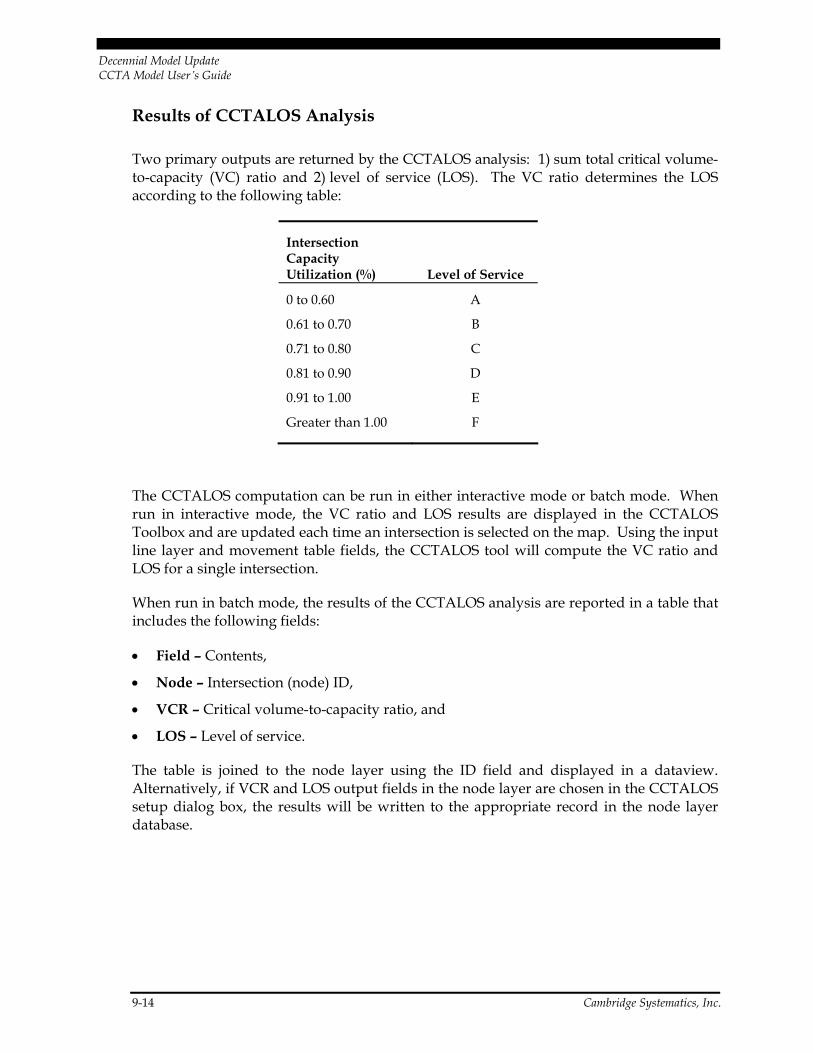
Decennial Model Update CCTA Model User’s Guide
9-14 Cambridge Systematics, Inc.
Results of CCTALOS Analysis
Two primary outputs are returned by the CCTALOS analysis: 1) sum total critical volume-to-capacity (VC) ratio and 2) level of service (LOS). The VC ratio determines the LOS according to the following table:
Intersection Capacity Utilization (%) Level of Service
0 to 0.60 A
0.61 to 0.70 B
0.71 to 0.80 C
0.81 to 0.90 D
0.91 to 1.00 E
Greater than 1.00 F
The CCTALOS computation can be run in either interactive mode or batch mode. When run in interactive mode, the VC ratio and LOS results are displayed in the CCTALOS Toolbox and are updated each time an intersection is selected on the map. Using the input line layer and movement table fields, the CCTALOS tool will compute the VC ratio and LOS for a single intersection.
When run in batch mode, the results of the CCTALOS analysis are reported in a table that includes the following fields:
• Field – Contents,
• Node – Intersection (node) ID,
• VCR – Critical volume-to-capacity ratio, and
• LOS – Level of service.
The table is joined to the node layer using the ID field and displayed in a dataview. Alternatively, if VCR and LOS output fields in the node layer are chosen in the CCTALOS setup dialog box, the results will be written to the appropriate record in the node layer database.

Decennial Model Update CCTA Model User’s Guide
Cambridge Systematics, Inc. 9-15
About the CCTALOS Toolbox
When you run the CCTALOS calculator in interactive mode, you use the CCTALOS Toolbox to select intersections and calculate the VC ratio and LOS.
The tools in the CCTALOS Toolbox perform the following operations:
1. Calculate the LOS by clicking on a map to select an intersection.
2. Edit the line, node, and turn movement input values for each approach to the intersec-tion and recalculate the LOS.
3. Apply changed input values to the source tables and geographic layers.
4. Display a turning movement intersection diagram.
5. Edit the cardinal direction designations of the intersecting links.
6. Return to the CCTALOS setup dialog box.
7. View the details of the CCTALOS calculation.

Decennial Model Update CCTA Model User’s Guide
9-16 Cambridge Systematics, Inc.
The CCTALOS Toolbox tools are:
Tool Name How to use it...
Select a node by pointing Click on a node to compute the VC ratio and LOS
Recalculate LOS Click to recalculate the LOS for the selected node
Apply changes Apply the changes to the input variables to the source tables
Show diagram Display a turning movement diagram for the
selected node
Adjust cardinal directions Modify the cardinal direction designation of the links
Return to setup Click to return to the CCTALOS setup dialog box
Show detailed results Click to show the details of the CCTALOS
calculation
Setting Up the CCTALOS Analysis
Setting up the CCTALOS analysis requires the specification of line layer fields that store approach-specific data and the movement table fields that store movement-specific infor-mation. These input fields are specified in the CCTALOS setup dialog box. The CCTALOS setup dialog box is also used to choose the analysis mode (interactive or batch) and to specify output preferences for the batch operation.
Before opening the interactive CCTALOS Toolbox, the CCTALOS setup dialog box is shown to allow the specification of input fields. The following steps are followed to set up the CCTALOS analysis.
1. Open or create a map that contains a node and a line layer.
2. Open a turning movement table.
3. Click the Compute CCTALOS button on the CCTA Console dialog box to display the CCTALOS Setup dialog box.
4. Choose the node layer containing the signalized intersections from the Intersection Layer drop-down list.
5. Enter a text description of the scenario in the Scenario Description text box. The description will appear on the detailed LOS report.

Decennial Model Update CCTA Model User’s Guide
Cambridge Systematics, Inc. 9-17
6. Make the following choices from the Movement Input tab:
To do this… Do this…
Choose the subject intersection layer Choose a node layer containing the intersections of interest from the Intersection Layer drop-down list. The associated line layer is automatically displayed in the Line Layer box.
Choose the movement table Choose a dataview containing the turning movement input from the Dataview drop-down list.
Choose to adjust turn volumes Check the Adjust Turn Volumes checkbox. Left and right turn volumes will be adjusted to determine passenger car equivalents if the box is checked.
Choose the from link ID field Choose the movement dataview field containing the from link codes/IDs from the From drop-down list.
Choose the to link ID field Choose the movement dataview field containing the to link codes/IDs from the To drop-down list.
Choose the actual flow field Choose the movement dataview field containing the actual movement flow from the Flow drop-down list.
Choose the number of lanes field Choose the movement dataview field containing the number of lanes from the Lanes drop-down list.
Choose the lane use field Choose the movement dataview field containing the lane use code for the turning movement.
Choose the direction field Choose the movement dataview field containing the cardinal direction and turn movement (e.g., NBR).
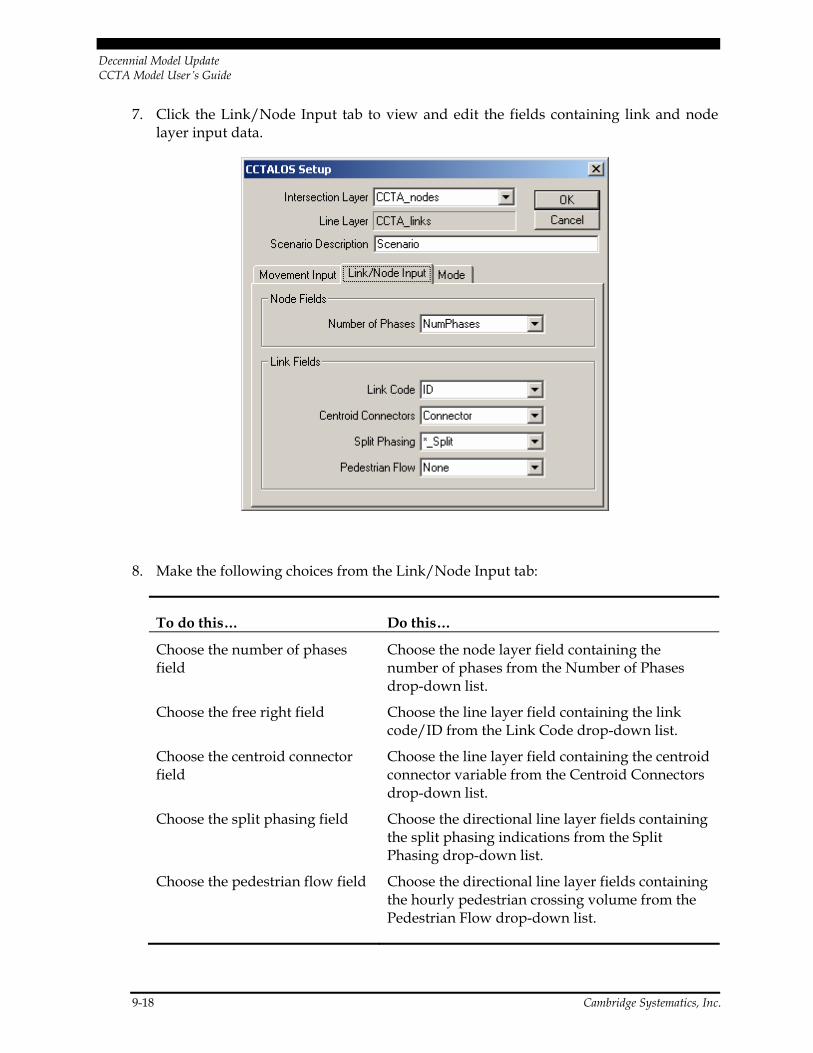
Decennial Model Update CCTA Model User’s Guide
9-18 Cambridge Systematics, Inc.
7. Click the Link/Node Input tab to view and edit the fields containing link and node layer input data.
8. Make the following choices from the Link/Node Input tab:
To do this… Do this…
Choose the number of phases field
Choose the node layer field containing the number of phases from the Number of Phases drop-down list.
Choose the free right field Choose the line layer field containing the link code/ID from the Link Code drop-down list.
Choose the centroid connector field
Choose the line layer field containing the centroid connector variable from the Centroid Connectors drop-down list.
Choose the split phasing field Choose the directional line layer fields containing the split phasing indications from the Split Phasing drop-down list.
Choose the pedestrian flow field Choose the directional line layer fields containing the hourly pedestrian crossing volume from the Pedestrian Flow drop-down list.

Decennial Model Update CCTA Model User’s Guide
Cambridge Systematics, Inc. 9-19
9. Click the Mode tab to view and edit the mode (interactive or batch) options.
10. Make the following choices in the Mode tab to finish setting up the CCTALOS analysis:
To do this… Do this…
Choose to analyze LOS in interactive mode
Click the Interactive radio button in the Mode frame.
Choose to analyze LOS in batch mode
Click the Batch radio button in the Mode frame.
Choose to a selection of nodes for batch mode
Be sure that the Batch radio button is chosen. Choose a selection set from the Selection drop-down list.
Join the results table to the node layer
Be sure that the Batch radio button is chosen. Click the Join to node dataview radio button.
Write the results to node layer fields
Be sure that the Batch radio button is chosen. Click the Fill fields in node layer radio button.
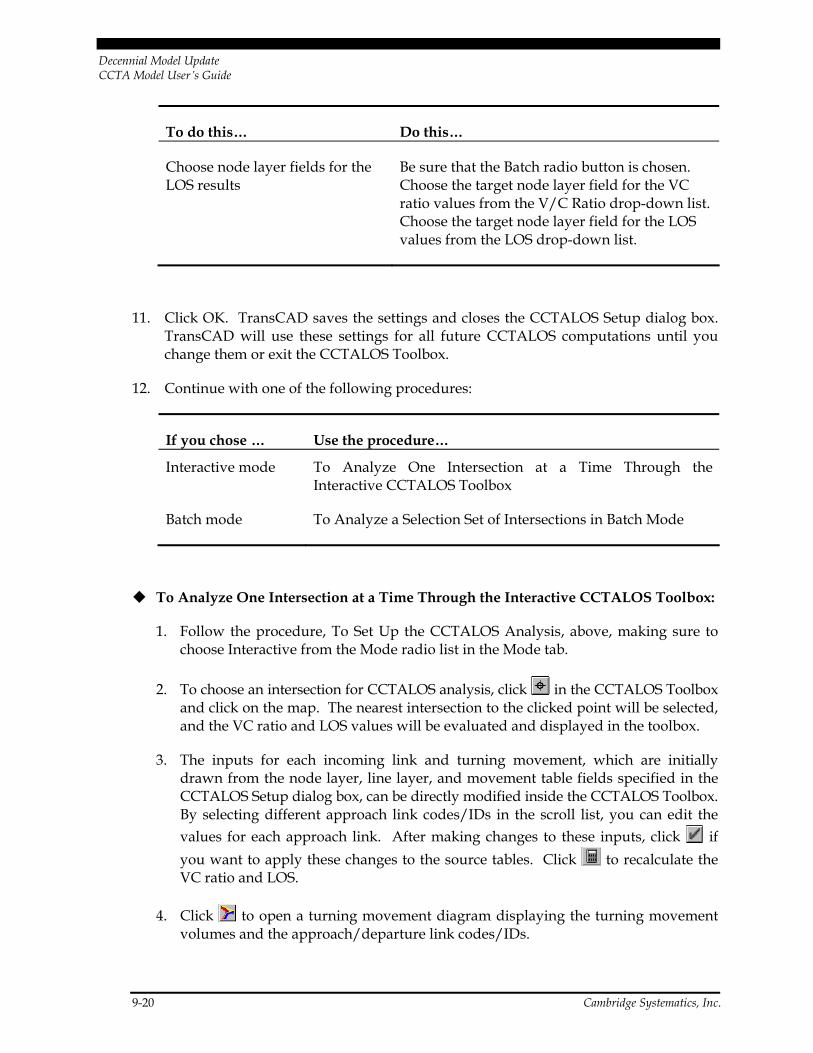
Decennial Model Update CCTA Model User’s Guide
9-20 Cambridge Systematics, Inc.
To do this… Do this…
Choose node layer fields for the LOS results
Be sure that the Batch radio button is chosen. Choose the target node layer field for the VC ratio values from the V/C Ratio drop-down list. Choose the target node layer field for the LOS values from the LOS drop-down list.
11. Click OK. TransCAD saves the settings and closes the CCTALOS Setup dialog box. TransCAD will use these settings for all future CCTALOS computations until you change them or exit the CCTALOS Toolbox.
12. Continue with one of the following procedures:
If you chose … Use the procedure…
Interactive mode To Analyze One Intersection at a Time Through the Interactive CCTALOS Toolbox
Batch mode To Analyze a Selection Set of Intersections in Batch Mode
To Analyze One Intersection at a Time Through the Interactive CCTALOS Toolbox:
1. Follow the procedure, To Set Up the CCTALOS Analysis, above, making sure to choose Interactive from the Mode radio list in the Mode tab.
2. To choose an intersection for CCTALOS analysis, click in the CCTALOS Toolbox and click on the map. The nearest intersection to the clicked point will be selected, and the VC ratio and LOS values will be evaluated and displayed in the toolbox.
3. The inputs for each incoming link and turning movement, which are initially drawn from the node layer, line layer, and movement table fields specified in the CCTALOS Setup dialog box, can be directly modified inside the CCTALOS Toolbox. By selecting different approach link codes/IDs in the scroll list, you can edit the values for each approach link. After making changes to these inputs, click if you want to apply these changes to the source tables. Click to recalculate the VC ratio and LOS.
4. Click to open a turning movement diagram displaying the turning movement volumes and the approach/departure link codes/IDs.

Decennial Model Update CCTA Model User’s Guide
Cambridge Systematics, Inc. 9-21
5. Click to view and edit the cardinal directions of the intersecting links. The Adjust Cardinal Directions dialog box will appear, which displays an inbound and outbound drop-down list for each cardinal direction (EB, NB, WB, SB). For each cardinal approach, choose the ID of the appropriate link from the corresponding drop-down list. If a bi-directional link is selected, it will automatically occupy both the inbound and outbound drop-down lists. If a one-way link is selected, it will automatically be shown in the appropriate drop-down list (i.e., inbound or outbound). For a one-way street, a “- -” can be displayed for the opposite direc-tion. The inbound and outbound components of a given cardinal direction can be represented by separate one-way links. One must take care when adjusting cardi-nal directions, because TransCAD will not check the settings with the intersection geography to ensure consistency.
6. Once a valid intersection has been chosen and the CCTALOS has been computed, click to view the details of the calculation.
7. Click at any time to return to the CCTALOS Setup dialog box. After reviewing and/or editing the inputs in the CCTALOS Setup dialog box, click OK, and return to Step 2.
8. When you have finished your analysis, close the toolbox by clicking the close box in the upper-right corner of the toolbox.
TransCAD closes the CCTALOS Toolbox.
To Analyze a Selection Set of Intersections in Batch Mode:
1. Follow the procedure, To Set Up the CCTALOS Analysis, above, making sure to choose Batch from the Mode radio list and a selection set from the Selection drop-down list.
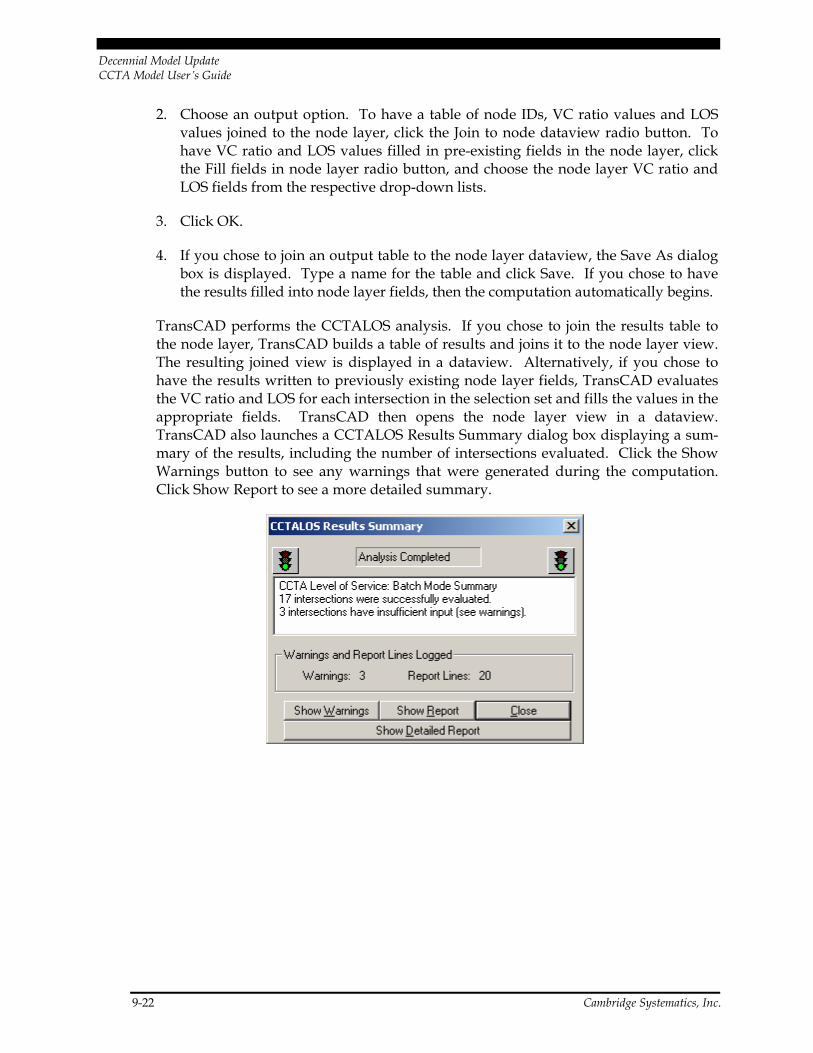
Decennial Model Update CCTA Model User’s Guide
9-22 Cambridge Systematics, Inc.
2. Choose an output option. To have a table of node IDs, VC ratio values and LOS values joined to the node layer, click the Join to node dataview radio button. To have VC ratio and LOS values filled in pre-existing fields in the node layer, click the Fill fields in node layer radio button, and choose the node layer VC ratio and LOS fields from the respective drop-down lists.
3. Click OK.
4. If you chose to join an output table to the node layer dataview, the Save As dialog box is displayed. Type a name for the table and click Save. If you chose to have the results filled into node layer fields, then the computation automatically begins.
TransCAD performs the CCTALOS analysis. If you chose to join the results table to the node layer, TransCAD builds a table of results and joins it to the node layer view. The resulting joined view is displayed in a dataview. Alternatively, if you chose to have the results written to previously existing node layer fields, TransCAD evaluates the VC ratio and LOS for each intersection in the selection set and fills the values in the appropriate fields. TransCAD then opens the node layer view in a dataview. TransCAD also launches a CCTALOS Results Summary dialog box displaying a sum-mary of the results, including the number of intersections evaluated. Click the Show Warnings button to see any warnings that were generated during the computation. Click Show Report to see a more detailed summary.
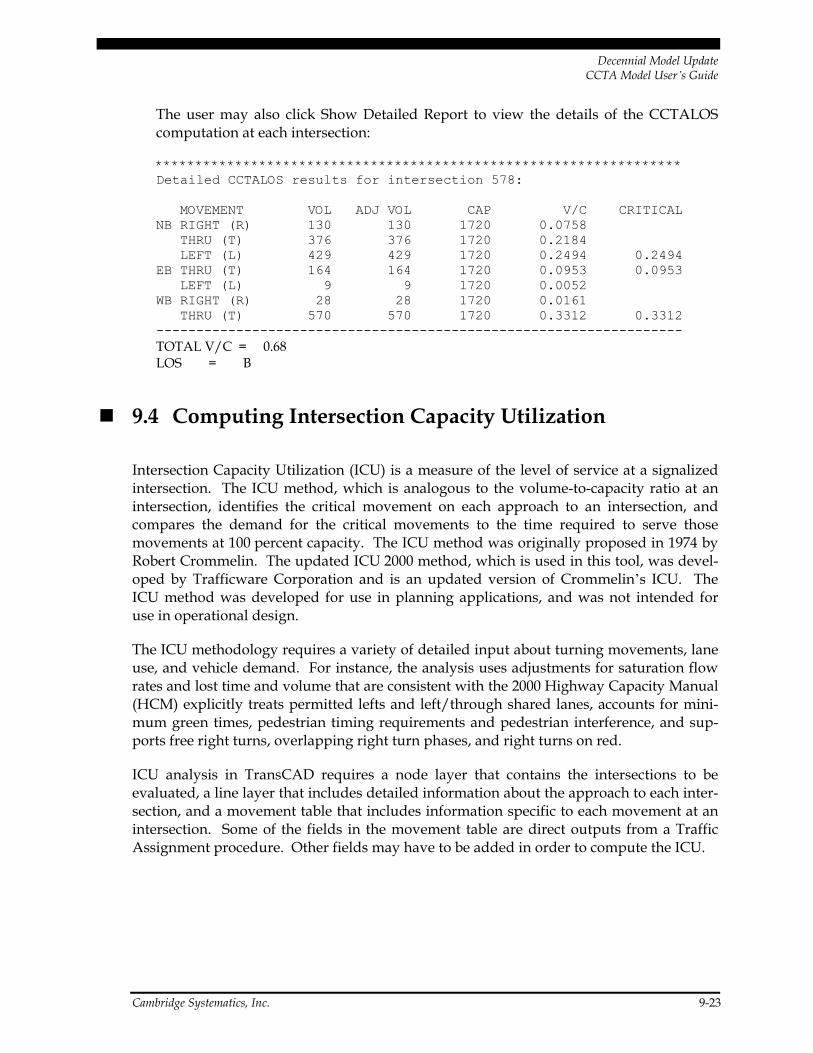
Decennial Model Update CCTA Model User’s Guide
Cambridge Systematics, Inc. 9-23
The user may also click Show Detailed Report to view the details of the CCTALOS computation at each intersection:
****************************************************************** Detailed CCTALOS results for intersection 578: MOVEMENT VOL ADJ VOL CAP V/C CRITICAL NB RIGHT (R) 130 130 1720 0.0758 THRU (T) 376 376 1720 0.2184 LEFT (L) 429 429 1720 0.2494 0.2494 EB THRU (T) 164 164 1720 0.0953 0.0953 LEFT (L) 9 9 1720 0.0052 WB RIGHT (R) 28 28 1720 0.0161 THRU (T) 570 570 1720 0.3312 0.3312 ------------------------------------------------------------------ TOTAL V/C = 0.68 LOS = B
9.4 Computing Intersection Capacity Utilization
Intersection Capacity Utilization (ICU) is a measure of the level of service at a signalized intersection. The ICU method, which is analogous to the volume-to-capacity ratio at an intersection, identifies the critical movement on each approach to an intersection, and compares the demand for the critical movements to the time required to serve those movements at 100 percent capacity. The ICU method was originally proposed in 1974 by Robert Crommelin. The updated ICU 2000 method, which is used in this tool, was devel-oped by Trafficware Corporation and is an updated version of Crommelin’s ICU. The ICU method was developed for use in planning applications, and was not intended for use in operational design.
The ICU methodology requires a variety of detailed input about turning movements, lane use, and vehicle demand. For instance, the analysis uses adjustments for saturation flow rates and lost time and volume that are consistent with the 2000 Highway Capacity Manual (HCM) explicitly treats permitted lefts and left/through shared lanes, accounts for mini-mum green times, pedestrian timing requirements and pedestrian interference, and sup-ports free right turns, overlapping right turn phases, and right turns on red.
ICU analysis in TransCAD requires a node layer that contains the intersections to be evaluated, a line layer that includes detailed information about the approach to each inter-section, and a movement table that includes information specific to each movement at an intersection. Some of the fields in the movement table are direct outputs from a Traffic Assignment procedure. Other fields may have to be added in order to compute the ICU.

Decennial Model Update CCTA Model User’s Guide
9-24 Cambridge Systematics, Inc.
About Intersection Capacity Utilization
In order to calculate the ICU in TransCAD, you will need three things:
1. A node layer,
2. A line layer, and
3. A movement table
The node layer need only contain the nodes representing signalized intersections adjoining link features represented by the line layer. The line layer and movement table, however, require a number of input fields in order to facilitate the ICU analysis. Below is a descrip-tion of the various input fields.
Movement Table Input Fields
The movement table contains information that is specific to each movement at an inter-section. The basic movement table inputs are as follows:
• From link ID,
• To link ID, and
• Turning movement flow.
These fields can be generated during a Traffic Assignment procedure when the option to report turns is chosen. These fields identify the approaching (from) link, the departing (to) link, and the hourly flow for the movement. The ICU computation uses other fields in the movement table, including the following:
• Number of lanes,
• Saturation flow,
• Peak-hour factor (optional),
• Lost time (optional), and
• Direction (optional).
The number of lanes is the number of lanes dedicated to a given movement. However, where there are lanes shared by through and left- or right-turning movements, the lane should be counted only once with the through movement. The saturation flow is the satu-rated flow rate in vehicles per hour. The peak-hour factor and lost time fields are optional. If the fields are not specified, then global values entered in the ICU setup dialog box are used. The peak-hour factor is defined as:
PHF = Volume60/(Volume15 * 4),

Decennial Model Update CCTA Model User’s Guide
Cambridge Systematics, Inc. 9-25
Where, Volume60 is the peak 60-minute volume and Volume15 is the peak 15-minute vol-ume. Where data is unavailable, a PHF value of 0.9 is recommended. The lost time should be greater than or equal to the travel time in seconds required for a movement to traverse the intersection. Typically, a value of four seconds is used.
The Direction field can be used to override the cardinal directions and turning movements determined by link geography. The value in the Direction field should be a string that takes on one of the 12 possible values: EBL, EBT, EBR, NBL, NBT, NBR, WBL, WBT, WBR, SBL, SBT, or SBR. If a Direction field is provided, then the values in the field will be used to determine the cardinal directions of each approach link and the turning movements. If None is chosen in the Direction field, then the cardinal directions and turning movements will be calculated by TransCAD according to the geography. Furthermore, the cardinal and turn direction for each movement will be written to a field called, CARD_DIR, which is generated automatically. If this field already exists, the values in the field will be overwritten.
Line Layer Input Fields
The line layer contains information that is specific to the approach to an intersection. Thus, there should be AB and BA fields for each input in order to distinguish directional-ity. The exception is centroid connector field, which should contain null and non-null values, where null indicates a real link. Records with values other than null indicate cen-troid connectors or other symbolic links. The required directional line layer fields include the following:
• Left/through shared lane,
• Free right,
• Pedestrian volume,
• Pedestrian timing required, and
• Pedestrian button.
The left/through shared lane field contains a “1” if the approach has left and through movements that share a lane and a “0” otherwise. The free right field contains a “1” if the right turn on the approach has a dedicated right-turn receiving lane, thus, allowing right-turning vehicles to proceed during any phase and a “0” otherwise. The pedestrian volume is the number of pedestrians per hour crossing the link at the intersection. The pedestrian timing required is the length of time in the cycle dedicated to permitting pedestrians to cross the street. Finally, the pedestrian button field contains a “1” if the pedestrians must push a button to request a pedestrian phase, and a “0” otherwise, indicating that a pedes-trian phase is built in to the signal timing plan at regular intervals.

Decennial Model Update CCTA Model User’s Guide
9-26 Cambridge Systematics, Inc.
Results of ICU Analysis
Two primary outputs are returned by the ICU analysis: 1) intersection capacity utilization (percent) and 2) level of service (LOS). The ICU may be interpreted as the percentage of the intersection capacity being utilized by the prevailing demand. Thus, an ICU value less than 100 percent indicates surplus capacity, and an ICU value greater than 100 percent indicates an overloaded intersection. The ICU determines the LOS according to the fol-lowing table:
Intersection Capacity Utilization (%) Level of Service
0 to 60 A
60 to 70 B
70 to 80 C
80 to 90 D
90 to 100 E
100 to 110 F
110 to 120 G
Greater than 120 H
The ICU computation can be run in either interactive mode or batch mode. When run in interactive mode, the ICU and LOS results are displayed in the ICU Toolbox and are updated each time an intersection is selected on the map. Using the input line layer and movement table fields, the ICU tool will compute the ICU and LOS for a single intersection.
When run in batch mode, the results of the ICU analysis are reported in a table that includes the following fields:
• Field – Contents,
• Node ID – Intersection (node) ID,
• ICU – Intersection Capacity Utilization in percent, and
• LOS – Level of service.
The table is joined to the node layer using the ID field and displayed in a dataview. Alternatively, if ICU and LOS output fields in the node layer are chosen in the ICU setup dialog box, the results will be written to the appropriate record in the node layer database.

Decennial Model Update CCTA Model User’s Guide
Cambridge Systematics, Inc. 9-27
About the ICU Toolbox
When you run the ICU calculator in interactive mode, you use the ICU Toolbox to select intersections and calculate the ICU and LOS:
The tools in the ICU Toolbox allow you to perform the following operations:
1. Calculate the ICU by pointing and clicking on a map to select an intersection.
2. Edit the approach-based input values for each approach to the intersection and recal-culate the ICU.
3. Return to the ICU setup dialog box to view or edit various input variables and parameters.
The ICU Toolbox tools are:
Tool Name How to use it...
Select a node by pointing Click on a node to compute the ICU and LOS
Recalculate ICU Click to recalculate the ICU for the selected node
Apply changes Apply the changes to the input variables to the source tables
Show diagram Display a turning movement diagram for the selected
node

Decennial Model Update CCTA Model User’s Guide
9-28 Cambridge Systematics, Inc.
Tool Name How to use it...
Adjust cardinal directions Modify the cardinal direction designation of the links
Return to setup Click to return to the ICU setup dialog box
Setting Up the ICU Analysis
Setting up the ICU analysis requires the specification of line layer fields that store approach-specific data and the movement table fields that store movement-specific infor-mation. These input fields are specified in the ICU setup dialog box. The ICU setup dialog box is also used to view and edit default global input parameters, to choose the analysis mode (interactive or batch), and to specify output preferences for the batch operation.
Before opening the interactive ICU Toolbox, the ICU setup dialog box is shown to allow the specification of inputs and parameters. The following steps are followed to set up the ICU analysis.
1. Open or create a map that contains a node and a line layer.
2. Open a turning movement table.
3. Click the Compute ICU button on the CCTA Console dialog box to display the Intersection Capacity Utilization Setup dialog box.

Decennial Model Update CCTA Model User’s Guide
Cambridge Systematics, Inc. 9-29
4. Make the following choices from the Movement Input tab:
To do this… Do this…
Choose the subject intersection layer Choose a node layer containing the intersections of interest from the Intersection Layer drop-down list. The associated line layer is automatically displayed in the Line Layer box.
Choose the movement table Choose a dataview containing the movement-specific input from the Dataview drop-down list.
Choose the from link ID field Choose the movement dataview field containing the from link IDs from the From drop-down list.
Choose the to link ID field Choose the movement dataview field containing the to link IDs from the To drop-down list.
Choose the number of lanes field Choose the movement dataview field containing the number of lanes from the Lanes drop-down list.
Choose the saturation flow field Choose the movement dataview field containing the saturation flow from the Saturation drop-down list.
Choose the actual flow field Choose the movement dataview field containing the actual movement flow from the Flow drop-down list.
Choose the peak hour factor field Choose the movement dataview field containing the peak hour factor from the PHF drop-down list.
Choose the lost time field Choose the movement dataview field containing the lost time from the Lost Time drop-down list.

Decennial Model Update CCTA Model User’s Guide
9-30 Cambridge Systematics, Inc.
5. Click on the Link Input tab to view and edit the line layer input fields.
6. Make the following choices from the Link Input tab:
To do this… Do this…
Choose the link code/ ID field
Choose the line layer field containing the link code/ID from the Link Code drop-down list.
Choose the centroid connector field
Choose the line layer field containing the centroid connector variable from the Centroid Connectors drop-down list.
Choose the left/ through lane field
Choose the directional line layer fields containing the left/through shared lane variable from the L/T Shared Lane drop-down list.
Choose the free right field
Choose the directional line layer fields containing the free right variable from the Free Right drop-down list.
Choose the pedestrian flow field
Choose the directional line layer fields containing the hourly pedestrian crossing volume from the Pedestrian Flow drop-down list.

Decennial Model Update CCTA Model User’s Guide
Cambridge Systematics, Inc. 9-31
To do this… Do this…
Choose the pedestrian timing field
Choose the directional line layer fields containing the required pedestrian timings from the Pedestrian Time drop-down list.
Choose the pedestrian button field
Choose the directional line layer fields containing the pedestrian button variable from the Pedestrian Button drop-down list.
7. Click the Parameters tab to view and edit the default global parameters.
Decennial Model Update CCTA Model User’s Guide
9-32 Cambridge Systematics, Inc.
8. Make the following choices in the Parameters tab:
To do this… Do this…
Edit the reference cycle length Click in the Reference Cycle Length edit box and type a value.
Edit the global minimum green time
Click in the Minimum Green edit box and type a value. Only a global minimum green time may be specified and will be applied to all movements.
Edit the (optional) global lost time Click in the Lost Time edit box and type a value. If a movement dataview field for lost times is specified in the Input Fields tab, then the global lost time value will be ignored.
Edit the (optional) peak hour factor Click in the Peak Hour Factor edit box and type a value. If a movement dataview field for peak-hour factors is specified in the Input Fields tab, then the global phf value will be ignored.
Edit the left turn adjustment factor Click in the Left Turn Adjustment Factor edit box and type a value. Only a global left turn adjustment factor may be specified and will be applied to all left turn movements.
Edit the right turn adjustment factor Click in the Right Turn Adjustment Factor edit box and type a value. Only a global right turn adjustment factor may be specified and will be applied to all right turn movements.
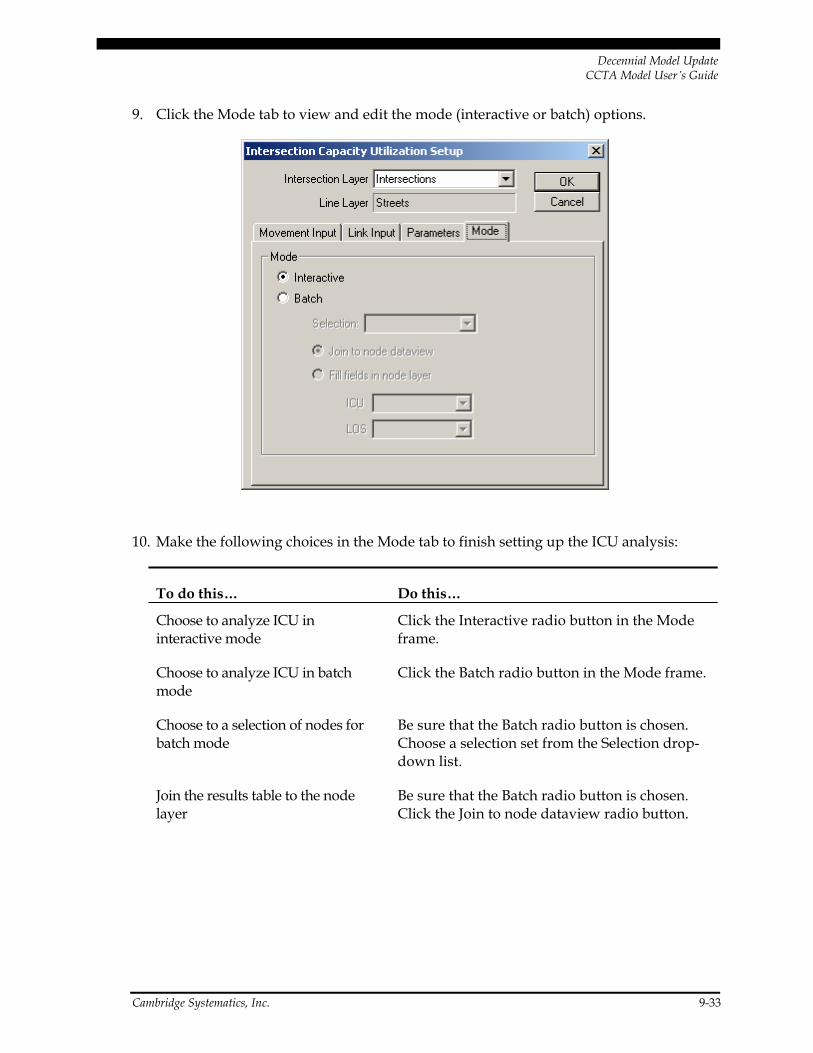
Decennial Model Update CCTA Model User’s Guide
Cambridge Systematics, Inc. 9-33
9. Click the Mode tab to view and edit the mode (interactive or batch) options.
10. Make the following choices in the Mode tab to finish setting up the ICU analysis:
To do this… Do this…
Choose to analyze ICU in interactive mode
Click the Interactive radio button in the Mode frame.
Choose to analyze ICU in batch mode
Click the Batch radio button in the Mode frame.
Choose to a selection of nodes for batch mode
Be sure that the Batch radio button is chosen. Choose a selection set from the Selection drop-down list.
Join the results table to the node layer
Be sure that the Batch radio button is chosen. Click the Join to node dataview radio button.
Decennial Model Update CCTA Model User’s Guide
9-34 Cambridge Systematics, Inc.
To do this… Do this…
Write the results to node layer fields Be sure that the Batch radio button is chosen. Click the Fill fields in node layer radio button.
Choose node layer fields for the ICU results
Be sure that the Batch radio button is chosen. Choose the target node layer field for the ICU values from the ICU drop-down list. Choose the target node layer field for the LOS values from the LOS drop-down list.
11. Click OK. TransCAD saves the settings and closes the ICU Setup dialog box. TransCAD will use these settings for all future ICU computations until you change them or exit the ICU Toolbox.
12. Continue with one of the following procedures:
If you chose … Use the procedure…
Interactive mode To Analyze One Intersection at a Time Through the Interactive ICU Toolbox
Batch mode To Analyze a Selection Set of Intersections in Batch Mode
To Analyze One Intersection at a Time Through the Interactive ICU Toolbox:
1. Follow the procedure, To Set Up the ICU Analysis, above, making sure to choose Interactive from the Mode radio list in the Options tab.
2. To choose an intersection for ICU analysis, click in the ICU Toolbox and click on the map. The nearest intersection to the clicked point will be selected, and the ICU and LOS values will be evaluated and displayed in the toolbox.
3. The inputs for each incoming link and turning movement, which are initially drawn from the node layer, line layer, and movement table fields specified in the ICU Setup dialog box, can be directly modified inside the ICU Toolbox. By selecting different approach link codes/IDs in the scroll list, you can edit the values for each approach link. After making changes to these inputs, click if you want to apply these changes to the source tables. Click to recalculate the ICU and LOS.
4. Click to open a turning movement diagram displaying the turning movement volumes and the approach/departure link codes/IDs.

Decennial Model Update CCTA Model User’s Guide
Cambridge Systematics, Inc. 9-35
5. Click to view and edit the cardinal directions of the intersecting links. The Adjust Cardinal Directions dialog box will appear, which displays an inbound and out-bound drop-down list for each cardinal direction (EB, NB, WB, SB).
For each cardinal approach, choose the ID of the appropriate link from the corre-sponding drop-down list. If a bi-directional link is selected, it will automatically occupy both the inbound and outbound drop-down lists. If a one-way link is selected, it will automatically be shown in the appropriate drop-down list (i.e., inbound or out-bound). For a one-way street, a “- - “ should be displayed for the opposite direction. The inbound and outbound components of a given cardinal direction can be repre-sented by separate one-way links. One must take care when adjusting cardinal direc-tions, because TransCAD will not check the settings with the intersection geography to ensure consistency.
6. Click at any time to return to the ICU Setup dialog box. After reviewing and/ or editing the inputs and parameters in the ICU Setup dialog box, click OK, and return to Step 2.
7. When you have finished your analysis, close the toolbox by clicking the close box in the upper right corner of the toolbox.
TransCAD closes the ICU Toolbox.
To Analyze a Selection Set of Intersections in Batch Mode:
1. Follow the procedure, To Set Up the ICU Analysis, above, making sure to choose Batch from the Mode radio list and a selection set from the Selection drop-down list.
2. Choose an output option. To have a table of node IDs, ICU values and LOS values joined to the node layer, click the Join to node dataview radio button. To have ICU and LOS values filled in preexisting fields in the node layer, click the Fill fields in
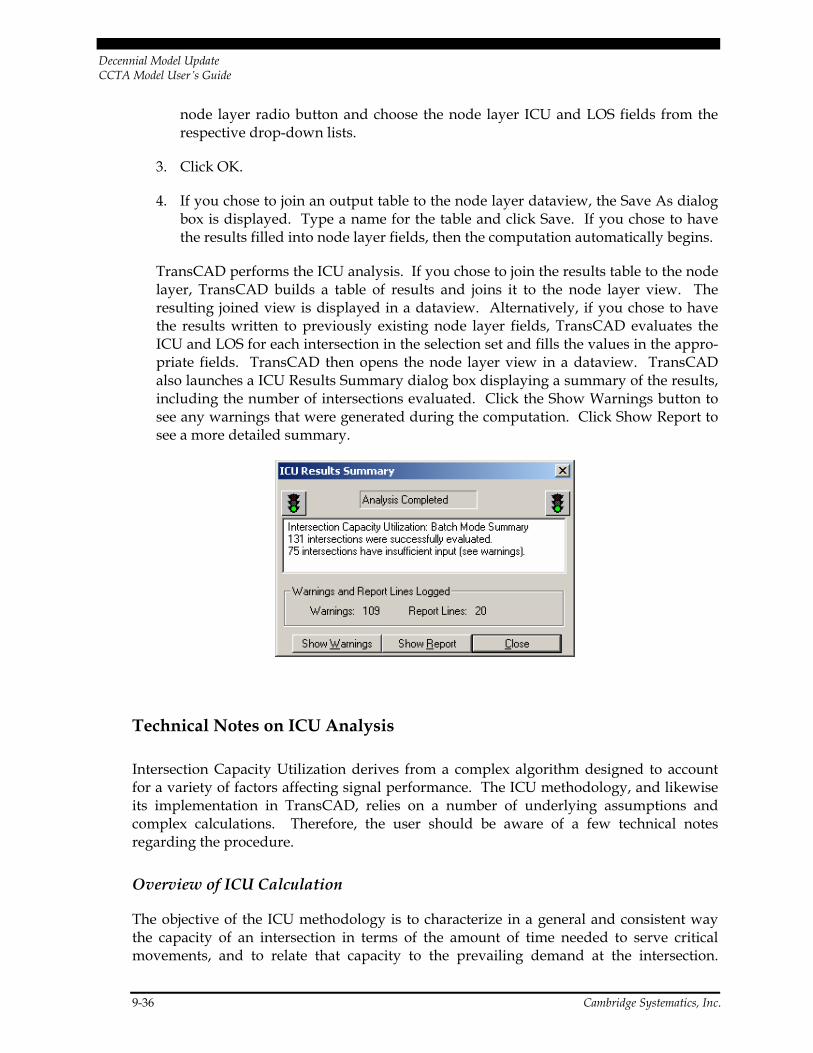
Decennial Model Update CCTA Model User’s Guide
9-36 Cambridge Systematics, Inc.
node layer radio button and choose the node layer ICU and LOS fields from the respective drop-down lists.
3. Click OK.
4. If you chose to join an output table to the node layer dataview, the Save As dialog box is displayed. Type a name for the table and click Save. If you chose to have the results filled into node layer fields, then the computation automatically begins.
TransCAD performs the ICU analysis. If you chose to join the results table to the node layer, TransCAD builds a table of results and joins it to the node layer view. The resulting joined view is displayed in a dataview. Alternatively, if you chose to have the results written to previously existing node layer fields, TransCAD evaluates the ICU and LOS for each intersection in the selection set and fills the values in the appro-priate fields. TransCAD then opens the node layer view in a dataview. TransCAD also launches a ICU Results Summary dialog box displaying a summary of the results, including the number of intersections evaluated. Click the Show Warnings button to see any warnings that were generated during the computation. Click Show Report to see a more detailed summary.
Technical Notes on ICU Analysis
Intersection Capacity Utilization derives from a complex algorithm designed to account for a variety of factors affecting signal performance. The ICU methodology, and likewise its implementation in TransCAD, relies on a number of underlying assumptions and complex calculations. Therefore, the user should be aware of a few technical notes regarding the procedure.
Overview of ICU Calculation
The objective of the ICU methodology is to characterize in a general and consistent way the capacity of an intersection in terms of the amount of time needed to serve critical movements, and to relate that capacity to the prevailing demand at the intersection.

Decennial Model Update CCTA Model User’s Guide
Cambridge Systematics, Inc. 9-37
Therefore, the primary calculation in the ICU method is that of a reference time for each movement. The reference time is the amount of time required to serve a given movement at 100 percent capacity. Reference times are adjusted to account for pedestrian times, pedestrian interference, minimum green times, and lost time. Thus, the methodology attempts to account for all possible factors that may delay a given movement (e.g., pedestrians crossing an adjacent link interfere with right turning traffic) without explicitly calculating intersection delay.
The method does not use a signal timing plan to determine the ICU. Thus, the global ref-erence cycle length need not be the actual cycle length at which the signal operates. Fur-thermore, it is important that the reference cycle length be the same for all intersections considered within a given analysis or project. The reference cycle length merely provides a consistent baseline, or reference point, for judging and comparing the level of service at signalized intersections.
Three alternate ICU methods are evaluated in the ICU methodology: one that considers protected left turns, a second that considers split phasing, and a third that assumes per-mitted left turns. Before the permitted and protected left turn methods are evaluated, certain conditions must be met. For instance, the protected left method is not calculated if there is a left/through shared lane. The split timing method is always available. An adjusted reference time is calculated for each available left turn option. The methodology then singles out the most favorable of the available left turn options in order to character-ize the maximum potential capacity at the intersection. Finally, the ICU is computed as the ratio of the sum of the critical adjusted reference times to the reference cycle length.
TransCAD Requirements for ICU Analysis
The calculation of ICU in TransCAD requires that a few conditions be met in order for the ICU analysis to be successful. These requirements are as follows:
1. There must be at least one through movement at the intersection,
2. There must be more than one approaching link to the intersection, and
3. Links that are denoted as centroid connectors are not considered in the analysis.
The third requirement can be bypassed. If a centroid connector is also a real roadway link, then a “0” should be present in the Centroid Connector field in the line layer database. If a “1” is present in the Centroid Connector field, then flow to and from the link will be ignored in the analysis.
Some assumptions are made about the units in the input fields. First, the units of time in the lost time and pedestrian timing fields are assumed to be seconds. Second, the units in the saturation field in the movement dataview are assumed to be vehicles per hour per lane. Third, the units in the actual flow field in the movement dataview are assumed to be vehicles per hour. Finally, the units in the pedestrian flow field are assumed to be pedes-trians per hour.