CCSA-What gets measured gets done presentation-27Mar18 … · 2018-03-23 · CCSA-What gets...
22
CCSA-What gets measured gets done presentation-27Mar18-FINAL-jls -1- © 2018 Blue Garnet CCSA 2014-Making Strategy Real-4Mar14-draft-sts ** Confidential © 2014 Blue Garnet ** 2018 CCSA Annual Conference: What gets measured gets done March 27, 2018 San Diego, CA
Transcript of CCSA-What gets measured gets done presentation-27Mar18 … · 2018-03-23 · CCSA-What gets...
CCSA-What gets measured gets done presentation-27Mar18-FINAL-jls - 1 -© 2018 Blue GarnetCCSA 2014-Making Strategy Real-4Mar14-draf t-sts** Conf ident ial © 2014 Blue Garnet **
2018 CCSA Annual Conference: What gets measured gets done
March 27, 2018San Diego, CA
CCSA-What gets measured gets done presentation-27Mar18-FINAL-jls - 2 -© 2018 Blue Garnet
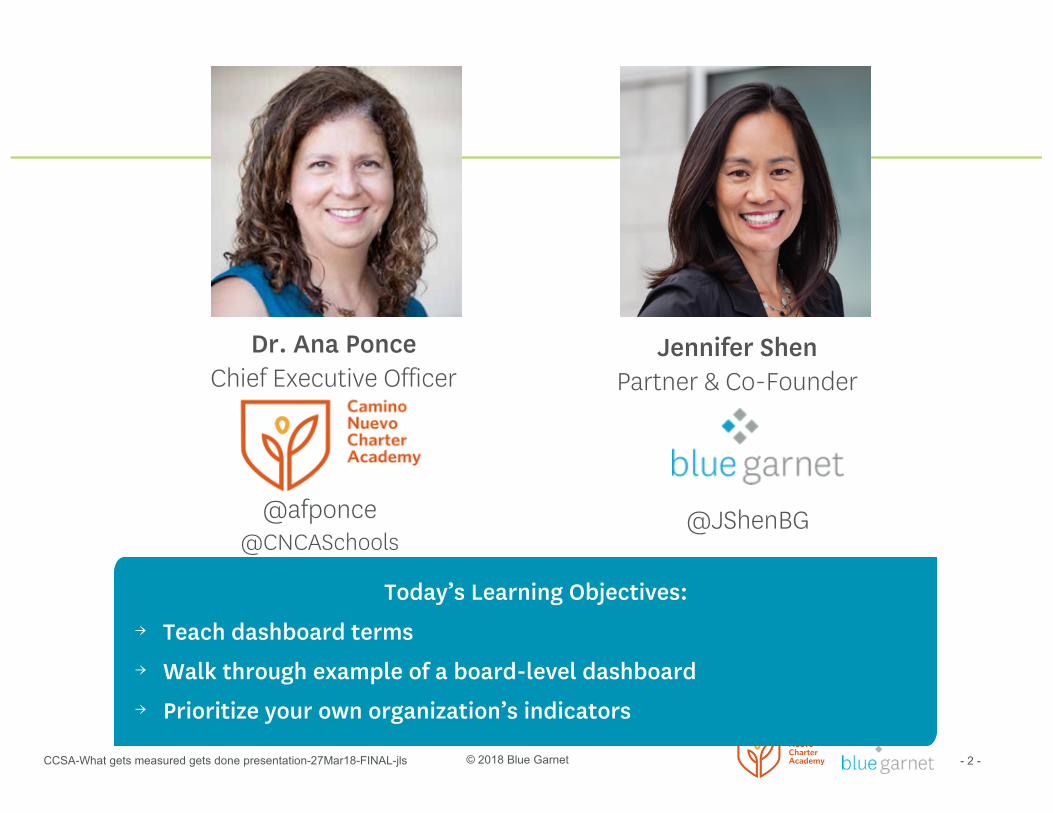
Jennifer ShenPartner & Co-Founder
Today’s Learning Objectives:
→ Teach dashboard terms
→ Walk through example of a board-level dashboard
→ Prioritize your own organization’s indicators
Dr. Ana PonceChief Executive Officer
@JShenBG@afponce@CNCASchools

CCSA-What gets measured gets done presentation-27Mar18-FINAL-jls - 3 -© 2018 Blue Garnet
Dashboards help focus on what matters most
What dashboards are (or should be)
→ Tool for leaders to inform decision-making
→ Display of info that matters most→ Information on what’s working,
and what needs to improve→ Organizational-level snapshot,
ideally showing trends over time
What dashboards are not (or should not be)
→ List of of all data collected→ A checklist→ Used for punitive purposes→ The full impact story
Different dashboards are created based upon use and audience
ACT
WATCH
CELEBRATE

CCSA-What gets measured gets done presentation-27Mar18-FINAL-jls - 4 -© 2018 Blue Garnet
First, let’s start with building a common understanding of key terms
→ Output vs. Outcome vs. Impact– Output: quantity of services or goods produced– Outcome: direct result of effort– Impact: broader, longer-term effect
→ Contribution vs. Attribution – Causality; mind your ripples– Direct vs. Indirect
→ Theory of Change– Logic behind your ends and means
→ Data terms– Measure vs. indicator– Baseline vs. target– Proxy: stand in for variable that cannot be
directly measured
Your work creates ripples…
retrospective prospective
direct outcomes
indirect outcomes
direct output

CCSA-What gets measured gets done presentation-27Mar18-FINAL-jls - 5 -© 2018 Blue Garnet
For CNCA, planning helped us with…
Engagement
Prioritization
Alignment
Culture-Building
Accountability
CCSA-What gets measured gets done presentation-27Mar18-FINAL-jls - 6 -© 2018 Blue Garnet
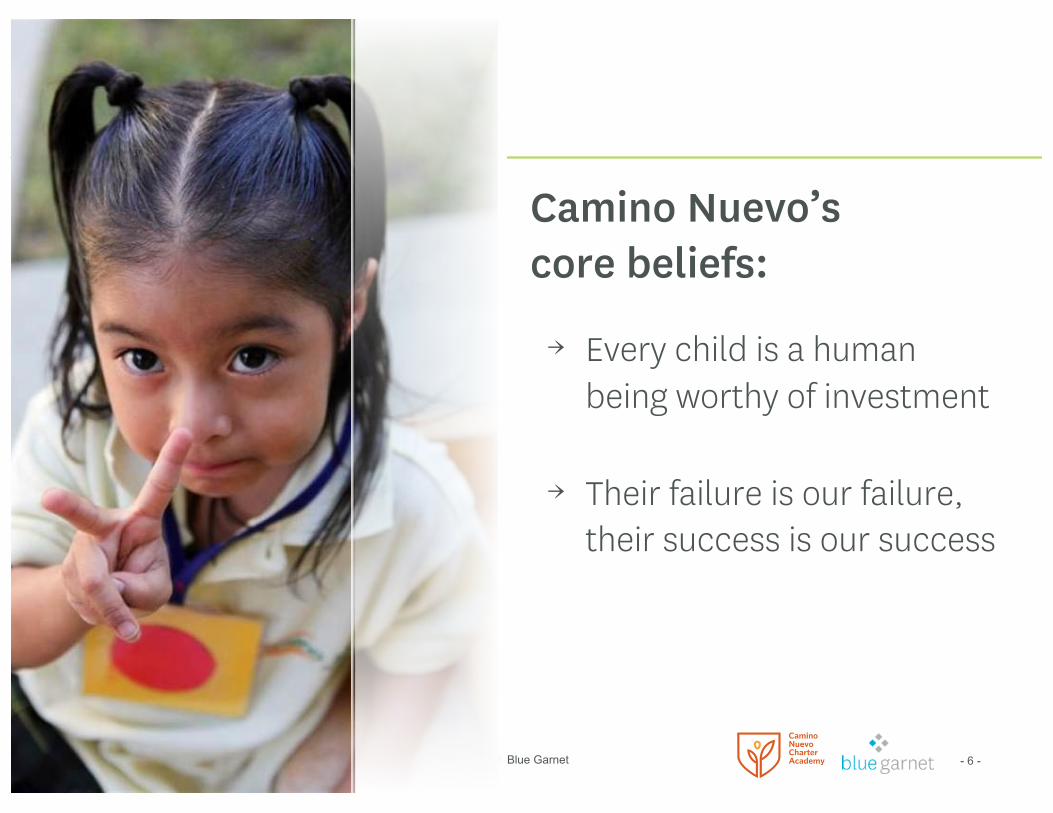
Camino Nuevo’s core beliefs:
→ Every child is a human being worthy of investment
→ Their failure is our failure, their success is our success

CCSA-What gets measured gets done presentation-27Mar18-FINAL-jls - 7 -© 2018 Blue Garnet
Together, let’s take a journey through CNCA’s performance dashboard
CNCA dashboard 1.0 (circa 2010)
Board Level: 4 pages
CNCA-2012 Board Dashboard-8Nov12-FINAL Page 2
92%
88%
0% 20% 40% 60% 80% 100%
"CNCA Leadership Team and/or Principals' Professional Learning Community meetings support my development as a leader"
"The professional adult learning community challenges me to become a more effective, reflective teacher"
48%
17% 20%
59% 65%
0%
20%
40%
60%
80%
100%
2010-11 2011-12(Y0, Baseline)
42%
70% 68%54% 55%
0%
20%
40%
60%
80%
100%
2010-11 2011-12(Y0, Baseline)
15.4%
10.4%
0%
5%
10%
15%
20%
25%
2010-11 2011-12(Y0, Baseline)
5.6%
3.7%
0%
2%
4%
6%
8%
10%
2010-11 2011-12(Y0, Baseline)
Educators and LeadersC
Organizational SustainabilityD
Place-based approachB
Percentage of eligible students, who each year…2011-12
(Y0, Baseline)2015-16
(Y5)
B1. Participate in 4+ experiential learning opportunities Not available 80%
B2. Successfully access social service & mental health resources Not available 75%
B3. Receive 1+ semester of visual or performing arts Not available 85%
D1. Private philanthropy as % of operating budget D2. Annual reserve as % of operating budgetY5 target = 25%
Academics (continued)A
A3. K-8 CST Proficiency A4. HS CST Proficiency
CNCA Strategy Business Plan 2012-17
Annual Board Performance Dashboard (Y0, 2011-12) November 2012
Y5 target= 95%
C1.
C2.
Y5 target = 93%
Percentage of teachers and leaders who believe…
Y5 Math & ELA target = 80%Y5 Reading & Writing target = 75%
Y5 target = 5%
Y5 Math & ELA target = 80%Y5 Reading & Writing target = 75%
Reading
Math
ELA
Reading
MathELA
Note: Writing data not available for 2011-12
CNCA-2012 Board Dashboard-8Nov12-FINAL! Page 1!
838!824!
868!855!
806!
779!789!
782!
802!
750!
800!
850!
900!
2010-11! 2011-12 !(Y0, Baseline)!
By 2022, 2,000 CNCA graduates are equipped with the skills, knowledge, and worldview necessary to be literate, critical thinkers and independent problem solvers.
As a result of this success, 90% have been accepted to, 80% have attended and 60% have graduated from a 4-year college within 6 years.
In order to achieve this success (“S”), CNCA must: A. Through extended investment and engagement in students, produce students who have the ability to engage in
rigorous reading, writing, critical thinking, speaking, and mathematical & scientific reasoning
B. Use a place-based approach to support the social and emotional development of students, and expose them to diverse cultural experiences and critical social perspectives
C. Recruit and develop quality educators and leaders committed to the “CNCA Way”
D. Ensure organizational sustainability with respect to financial management and human capital
CNCA Strategy Business Plan 2012-17 Annual Board Performance Dashboard (Y0, 2011-12) November 2012!
(1) This represents 43% of CNCA 12th graders graduating from 4yr college within 6yrs. In comparison, only 31% of all high school graduates in the US (and only 17% of Hispanic students) will graduate from 4yr college in 6yrs (Source: National Center for Education Statistics, 2010) (2) High school graduation rate is calculated internally Note: HSO Management Dashboard includes more details by site Note: Assessment of progress towards targets (green, yellow, red indicators) to be included beginning Y1
!
By 2022, CNCA will have cumulatively graduated 2,000 “equipped” students!
2,000!0! 488!
CNCA Graduates are Equipped, and College-Ready, College-Bound S
Y10 target = 80%!Y10 target = 90%!Y10 target = 95%!
488 total graduates (tracking of “equipped” students in development)!
Academics A
97% of 12th graders graduated HS2!
79% of 12th graders were accepted into 4yr college…!
…of which, 62% attended… !
During the 2011-12 School Year…
812! 802!
200!
300!
400!
500!
600!
700!
800!
900!
1000!
A1. API Performance by School A2. API Performance Compared to Local Schools
(Y5 target)!
(CA Y0 target)!
Elementary Schools!
K-8 Schools!
Middle Schools!
High Schools!
District Schools!Charter Schools!
CNCA!
LAUSD = 745!
= 1,000 students!
HAR!
BUR!
CAS!
CNHS!CIS!
CNCA dashboard 1.5 (circa ‘12)
Board Level: 2 pages*Expanded Mgmt Level: 11 pages
* Shared on CNCA website
Page 2CNCA-Annual Board Dashboard-2013
68% 66%
21% 19%
0%
20%
40%
60%
80%
100%
2011-12 (Y0, Baseline)
2012-13 (Y1)
88%
88%
0% 20% 40% 60% 80% 100%
"The professional adult learning community challenges me to become a more effective, reflective teacher."
Educators and LeadersC
Organizational SustainabilityD
Place-Based ApproachB
Percentage of eligible students, who each year…
B1. Participate in 4+ experiential learning opportunities
2012-13 (Y1, Baseline)
2015-16 (Y5 target)
38% 80%
B2. Receive 1+ semester of visual or performing arts 77% 85%
D1. Private philanthropy as % of operating budget D2. Annual reserve as % of operating budgetY5 target = 25%
Academics (continued)A
A3. CST ELA Proficiency A4. CST Math Proficiency
CNCA Strategy Business Plan 2012-17
Annual Board Performance Dashboard (Y1, 2012-13) November 2013
Y5 target = 93%
Percentage of teachers and leaders who believe…
Y5 Math & ELA target = 80%
Y5 target = 5%
55% 51%65% 62%
0%
20%
40%
60%
80%
100%
2011-12 (Y0, Baseline)
2012-13 (Y1)
Y5 Math & ELA target = 80%
3.7%
6.8%
0%
2%
4%
6%
8%
10%
2011-12 (Y0, Baseline)
2012-13 (Y1)
10.4%
24.6%
0%
5%
10%
15%
20%
25%
2011-12 (Y0, Baseline)
2012-13 (Y1)
42%47%48%60%
0%
20%
40%
60%
80%
100%
2011-12 (Y0, Baseline)
2012-13 (Y1)
A5. Reading Proficiency
Y5 Reading target = 75%
B3. Successfully access social service & mental health resources
2012-13 (Y1, Baseline)
2015-16 (Y5 target)
64% 75%
Percentage of identified students and families, who each year…
HSK-8
HS
K-8
K-8HS
2011-12 (Y0, Baseline)
2012-13 (Y1)
Page 1!CNCA-Annual Board Dashboard-2013!
(Y5 target)
(CA Y0 target)
824! 821!
855!866!
779!764!
790!775!
802!792!
750!
800!
850!
900!
2011-12 !(Y0, Baseline)!
2012-13 !(Y1)!
1
2 3 4 5 6 7 8 9 0
10 2 3 4 5 6 7 8 9
20 1 2 3 4
5 6 7 8 9
30 1 2 3 4 5 6 7 8 9
40 1 2 3 4 5 6 7 8 9
50 1 2 3 4 5 6 7 8 9
60 1 2 3 4 5 6 7 8 9
70 1 2 3 4 5 6 7 8 9
80 1 2 3 4 5 6 7 8 9
90 1 2 3 4 5 6 7 8 9
10
By 2022, 2,000 CNCA graduates are equipped with the skills, knowledge, and worldview necessary to be literate, critical thinkers and independent problem solvers.
As a result of this success, 90% have been accepted to, 80% have attended and 60% have graduated from a 4-year college within 6 years.
In order to achieve this success (“S”), CNCA must: A. Through extended investment and engagement in students, produce students who have the ability to engage in
rigorous reading, writing, critical thinking, speaking, and mathematical & scientific reasoning
B. Use a place-based approach to support the social and emotional development of students, and expose them to diverse cultural experiences and critical social perspectives
C. Recruit and develop quality educators and leaders committed to the “CNCA Way”
D. Ensure organizational sustainability with respect to financial management and human capital
CNCA Strategy Business Plan 2012-17 Annual Board Performance Dashboard (Y1, 2012-13) November 2013
(1) This represents 43% of CNCA 12th graders graduating from 4yr college within 6yrs. In comparison, only 31% of all high school graduates in the US (and only 17% of Hispanic students) will graduate from 4yr college in 6yrs (Source: National Center for Education Statistics, 2010) (2) High school graduation rate is calculated internally (3) API school averages calculated internally. Note: HSO Management Dashboard includes more details by site
By 2022, CNCA will have cumulatively graduated 2,000 “equipped” students
2,000 0 568
CNCA Graduates are Equipped, and College-Ready, College-Bound S
Y10 target = 80% Y10 target = 90% Y10 target = 95%
568 total graduates (tracking of “equipped” students in development)
Academics A
97% of 12th graders graduated HS2
79% of 12th graders were accepted into 4yr college…
…of which, 72% attended…
During the 2012-13 School Year…
A1. API Performance by School A2. API Performance Compared to Local Schools
HAR
BUR
CAS
CNHS
CIS
807 792
200
300
400
500
600
700
800
900
1000 Elementary Schools
K-8 Schools
Middle Schools
High Schools
District Schools
Charter Schools
CNCA
LAUSD = 749
= 1,000 students
3!
CNCA dashboard 2.0 (circa ‘13)
Board Level: 2 pages*Mgmt Level: 6 pages
Educators & LeadersC
Organizational SustainabilityD
6%9%
0%
25%
15-16 18-19Goal
2%5%
0%
25%
15-16 18-19Goal
50%
80%
0%
50%
100%
15-16 18-19Goal
90%
90%
0% 100%
Teachers
Leaders
C4-C5. Effective teachers & leaders who continue to choose to work at CNCAC1. The professional adult
learning community challenges me to become a more effective, reflective teacher:
100%
0% 100%
C3. Leaders who believe…C1-C2. Teachers who believe…
Place-Based ApproachB
100%
0%
100%
15-16 18-19Goal
58%
100%
0%
100%
15-16 18-19Goal
66%
100%
0%
100%
15-16 18-19Goal
n/a
100%
0%
100%
15-16 18-19Goal
90%
0%
100%
15-16 18-19Goal
B1. Students who believe they have the skills, tools and support to be ready for college
B2. Graduating students participating in an internship by graduation
B3. Students participating in 4+ experiential learning opportunities per year
B4. Parents who believe they have the skills, tools and support to get their child ready for college
B5. Students & families who see the school as responsive
Engagement of Parents & FamiliesExperiential Learning Opportunities
n/a
CNCA Leadership Team and/or Professional Learning opportunities support my development as a leader
67%
55%
100%
100%
0% 100%
No baseline data for 2015-16
C2. CNCA is a good place to work:
D1. Annual reserve as % of total organizational revenue
D2. Private philanthropy as % of annual operating budget
D3. CNCA 8th graders matriculating to CNCA HS
n/a
No baseline data for 2015-16
No baseline data for 2015-16
CNCA dashboard 2.5 (circa ‘16)
Board Level: 2 pagesMgmt Level: in progress

CCSA-What gets measured gets done presentation-27Mar18-FINAL-jls - 8 -© 2018 Blue Garnet
B - Place-based, whole child approachX B1 % of students who participate in at least four experiential learning
opportunities per year
N/A N/A 80% 85%
X B2 % of identified students and families that successfully access social
service & mental health resources
N/A N/A 75% 80%
X B3 % of students that receive at least one semester of visual or
performing arts per year
N/A N/A 85% 90%
C - Educators and leadersX C4 "CNCA Leadership Team and/or Principals’ Professional Learning
Community meetings support my development as a leader"
92% 93% 95% 95% Baseline is from 2011-12 EOY HSO
survey
- Change wording of question on
survey
- Original wording of metric was
"professional learning opportunities
for leaders (such as job alike PLCs,
coaching, etc) support my
professional growth"
X C3 "The professional adult learning community challenges me to
become a more effective, reflective teacher"
88% 90% 93% 95% Baseline from 2011-12 EOY Teacher
surveys
D - Organizational SustainabilityX D1 Private philanthropy % of annual operating budget 5.6% 3.7% 6% 5% 5% Baseline is from May 2012 Financials
Targets are from the Strategic
Planning Financial Models
5%
X D2 Annually maintains a reserve of X% of local organizational budget 15.4% 10.4% 12% 25% 25% Baseline is from June 2012 Financials
5 year target is 3 months' of reserves
(from the Strategic Planning Financial
Models)
25%X D3 % of eligible FTE that have been with CNCA for 3+ years (excluding
schools in operation for < 3 years)
44% 50% 60% 70% Baseline is for teachers as of Sep
2012
D4 % of staff who would like to stay at CNCA for the next 3-5 years N/A N/A 90% 95% Not currently a survey question
Behind the visual reporting tool is a dashboard excel sheet
Indicators for Board Dashboard 2010-11
2011-12 (Y0, Baseline) 1-yr Target 5-yr Target 10-yr Target Data Source
S - Graduates equippedX S1 % of HS graduates 97% 95% 95% 95% Baseline from 2011-12
X S2 % accepted to 4yr college 79% 80% 85% 90% Baseline from 2011-12
X S3 % of accepted attend 4yr college 62% 65% 75% 80% Baseline from 2010-11
X S4 % of those who attend graduate from 4yr college in 6yrs N/A N/A 50% 60%
A - Core academics, plus writing & critical thinkingK-8
X A1 Reading 0.43 53% 75% 80% Baseline data is from June 2012
X A2 Writing 75% 80% For CST, need avg scores on 4th and
7th grade CST writing assessments
X A3 Math 0.68 80% 90% Baseline data is from July 2012
X A4 ELA 0.55 80% 85% Baseline data is from July 2012
HSX A1 Reading 0.43 53% 75% 80% Baseline data is from June 2012
X A2 Writing 75% 80% For CST, need avg scores on 4th and
7th grade CST writing assessments
X A3 Math 0.17 0.20 80% 90% Baseline data is from July 2012
X A4 ELA 0.58 0.65 80% 85% Baseline data is from July 2012
X A7 Academic Performance Index: Baseline data is from October 2012
Burlington 838 824 810 850 900
Harvard 868 855 810 850 900
Castellanos 806 779 810 850 900
Cisneros 789 810 850 900
High School 782 802 810 850 900
BAR CHARTSK-8
A1 Reading 43.00 43.00 53% 75%
A2 Writing 60.00 62.00 75%
A3 Math 77.00 77.00 80%
A4 ELA 54.00 54.00 80%
HSA1 Reading 43.00 43.00 53% 75%
A2 Writing 60.00 62.00 75%
A3 Math 17.00 30.00 80%
A4 ELA 58.00 60.00 80%
B - Place-based, whole child approachX B1 % of students who participate in at least four experiential learning
opportunities per year
N/A N/A 80% 85%
X B2 % of identified students and families that successfully access social
service & mental health resources
N/A N/A 75% 80%
X B3 % of students that receive at least one semester of visual or
performing arts per year
N/A N/A 85% 90%
C - Educators and leadersX C4 "CNCA Leadership Team and/or Principals’ Professional Learning
Community meetings support my development as a leader"
92% 93% 95% 95% Baseline is from 2011-12 EOY HSO
survey
- Change wording of question on
survey
- Original wording of metric was
"professional learning opportunities
for leaders (such as job alike PLCs,
coaching, etc) support my
professional growth"
X C3 "The professional adult learning community challenges me to
become a more effective, reflective teacher"
88% 90% 93% 95% Baseline from 2011-12 EOY Teacher
surveys
D - Organizational SustainabilityX D1 Private philanthropy % of annual operating budget 5.6% 3.7% 6% 5% 5% Baseline is from May 2012 Financials
Targets are from the Strategic
Planning Financial Models
5%
X D2 Annually maintains a reserve of X% of local organizational budget 15.4% 10.4% 12% 25% 25% Baseline is from June 2012 Financials
5 year target is 3 months' of reserves
(from the Strategic Planning Financial
Models)
25%
X D3 % of eligible FTE that have been with CNCA for 3+ years (excluding
schools in operation for < 3 years)
44% 50% 60% 70% Baseline is for teachers as of Sep
2012
D4 % of staff who would like to stay at CNCA for the next 3-5 years N/A N/A 90% 95% Not currently a survey question
Indicators for Board Dashboard 2010-11
2011-12 (Y0, Baseline) 1-yr Target 5-yr Target 10-yr Target Data Source
This sheet is the working document for data collection; contains prioritized measures,
indicators, baseline, targets, sources
Backup Resource

CCSA-What gets measured gets done presentation-27Mar18-FINAL-jls - 9 -© 2018 Blue Garnet
Over time, we have learned key lessons to share
1. Must invest in people, not just a monitoring system2. Choose the right indicators (less is more, be open to non-
instructional measures)3. Ask why. Learn to ask good questions4. Engage the Board to
understand the complexity5. Collective ownerships is vital,
it takes time and a two-way relationship between site(s) and home office
CCSA-What gets measured gets done presentation-27Mar18-FINAL-jls - 10 -© 2018 Blue Garnet
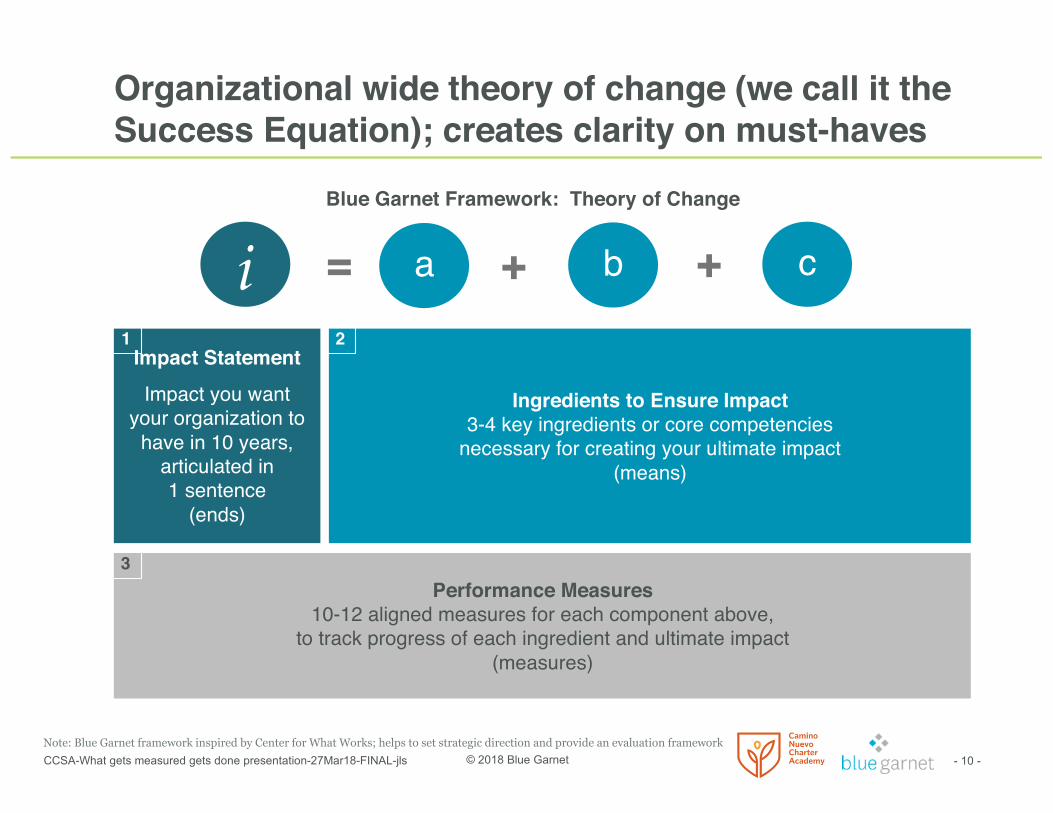
Organizational wide theory of change (we call it the Success Equation); creates clarity on must-haves
Performance Measures10-12 aligned measures for each component above,
to track progress of each ingredient and ultimate impact (measures)
Impact Statement
Impact you want your organization to
have in 10 years, articulated in 1 sentence
(ends)
Ingredients to Ensure Impact3-4 key ingredients or core competencies
necessary for creating your ultimate impact (means)
Blue Garnet Framework: Theory of Change
Note: Blue Garnet framework inspired by Center for What Works; helps to set strategic direction and provide an evaluation framework
a b c+ + = i1 2
3

CCSA-What gets measured gets done presentation-27Mar18-FINAL-jls - 11 -© 2018 Blue Garnet
Educators & LeadersC
Organizational SustainabilityD
6%8% 9%
0%
25%
15-16 16-17 18-19Goal
2% 4% 5%0%
25%
15-16 16-17 18-19Goal
50%57%
80%
0%
50%
100%
15-16 16-17 18-19Goal
C4-C5. Effective* teachers & leaders who continue to choose to work at CNCA (current data based on retention only)
C3. Leaders who believe…C1-C2***. Teachers who believe…
Place-Based ApproachB
77%100%
0%
100%
15-16 16-17 18-19Goal
58% 53%
100%
0%
100%
15-16 16-17 18-19Goal
66% 57%
100%
0%
100%
15-16 16-17 18-19Goal
*Data unavailable for given year**2016-2017 data is not yet official*** Two separate survey instruments were used in 2015-16 and 2016-17
77% 100%
15-16 16-17 18-19Goal
70%90%
0%
100%
15-16 16-17 18-19Goal
B1. Students who believe they have the skills, tools and support to be ready for college
B2. Graduating students participating in an internship by graduation
B3. Students participating in 4+ experiential learning opportunities per year
B4. Parents who believe they have the skills, tools and support to get their child ready for college
B5. Students & families who see the school as responsive
Engagement of Parents & FamiliesExperiential Learning Opportunities
*
CNCA Leadership Team and/or Professional Learning opportunities support my development as a leader
No baseline data for 2016-17
D1. Annual reserve as % of total organizational revenue
D2. Private philanthropy as % of annual operating budget
D3. CNCA 8th graders matriculating to CNCA HS
*
57%
63%
55%
67%
0% 20% 40% 60% 80%
C2. CNCA is a good place to work.
C1. The professional adult learning
community challenges me to become a more
effective, reflective teacher.
15-16 16-17
90%
90%
84%
73%
80%
71%
0% 50% 100%
Leaders
Teachers
15-16 16-17 18-19 Goal
0% 50% 100%
18-19Goal
16-17
*
3/7/18
Board-level and site-level dasbhoards are aligned to inform decision making
(SAMPLE PORTION)
Board level Dashboard
Site-level Dashboard
Board Level
Management Level
Operational / School Site Level

CCSA-What gets measured gets done presentation-27Mar18-FINAL-jls - 12 -© 2018 Blue Garnet
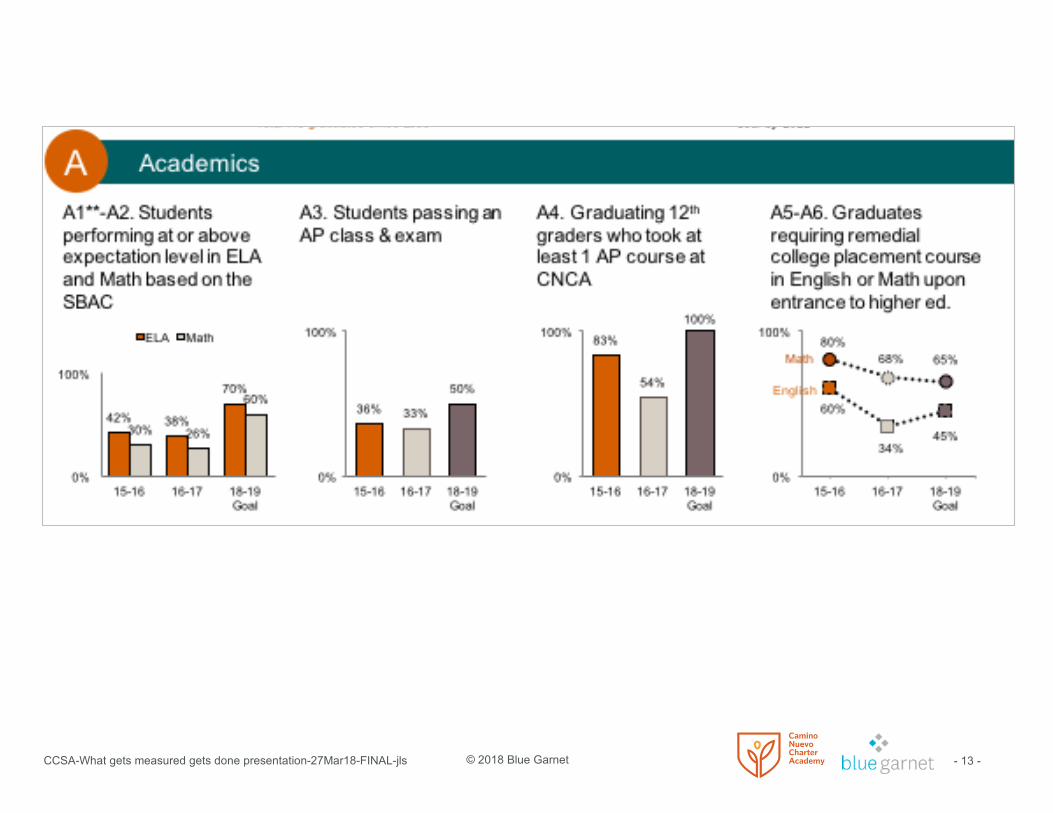
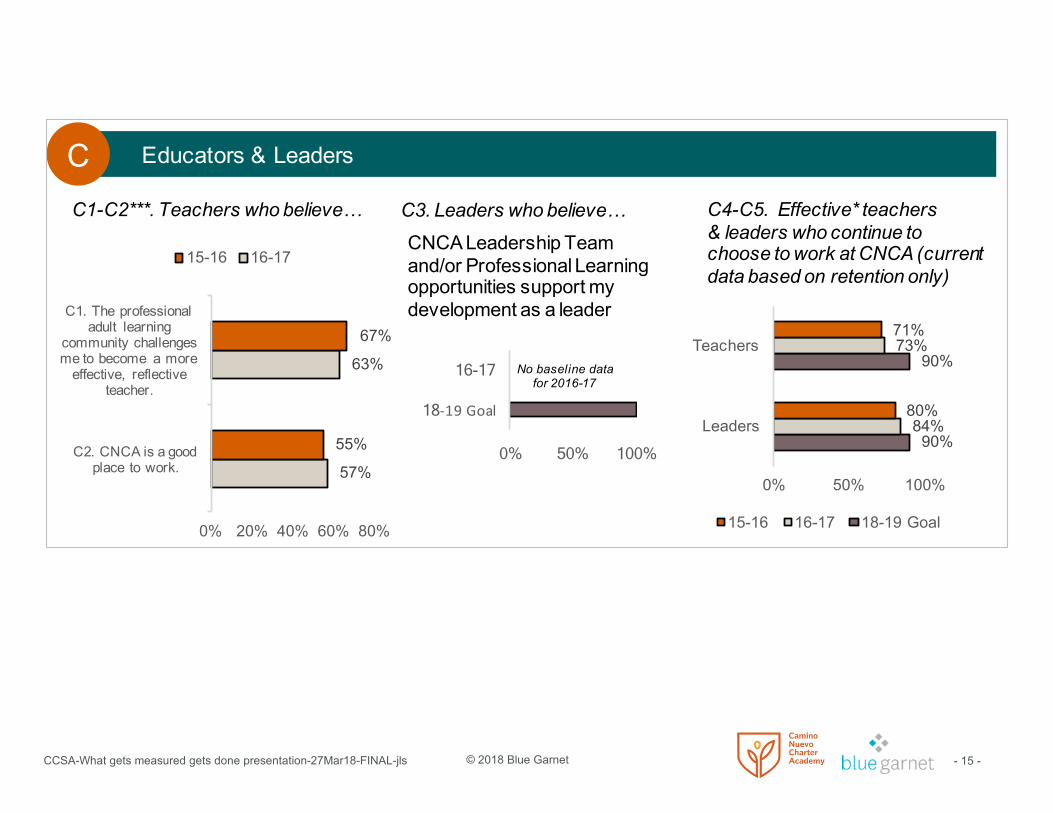
Let’s take a deeper look into the Board level dashboardCNCA Board level dashboard as of 3/7/18
CCSA-What gets measured gets done presentation-27Mar18-FINAL-jls - 13 -© 2018 Blue Garnet

CCSA-What gets measured gets done presentation-27Mar18-FINAL-jls - 14 -© 2018 Blue Garnet
Educators & LeadersC
Organizational SustainabilityD
6%8% 9%
0%
25%
15-16 16-17 18-19Goal
2% 4% 5%0%
25%
15-16 16-17 18-19Goal
50%57%
80%
0%
50%
100%
15-16 16-17 18-19Goal
C4-C5. Effective* teachers & leaders who continue to choose to work at CNCA (current data based on retention only)
C3. Leaders who believe…C1-C2***. Teachers who believe…
Place-Based ApproachB
77%100%
0%
100%
15-16 16-17 18-19Goal
58% 53%
100%
0%
100%
15-16 16-17 18-19Goal
66% 57%
100%
0%
100%
15-16 16-17 18-19Goal
*Data unavailable for given year**2016-2017 data is not yet official*** Two separate survey instruments were used in 2015-16 and 2016-17
77% 100%
15-16 16-17 18-19Goal
70%90%
0%
100%
15-16 16-17 18-19Goal
B1. Students who believe they have the skills, tools and support to be ready for college
B2. Graduating students participating in an internship by graduation
B3. Students participating in 4+ experiential learning opportunities per year
B4. Parents who believe they have the skills, tools and support to get their child ready for college
B5. Students & families who see the school as responsive
Engagement of Parents & FamiliesExperiential Learning Opportunities
*
CNCA Leadership Team and/or Professional Learning opportunities support my development as a leader
No baseline data for 2016-17
D1. Annual reserve as % of total organizational revenue
D2. Private philanthropy as % of annual operating budget
D3. CNCA 8th graders matriculating to CNCA HS
*
57%
63%
55%
67%
0% 20% 40% 60% 80%
C2. CNCA is a good place to work.
C1. The professional adult learning
community challenges me to become a more
effective, reflective teacher.
15-16 16-17
90%
90%
84%
73%
80%
71%
0% 50% 100%
Leaders
Teachers
15-16 16-17 18-19 Goal
0% 50% 100%
18-19Goal
16-17
*
3/7/18
CCSA-What gets measured gets done presentation-27Mar18-FINAL-jls - 15 -© 2018 Blue Garnet
Educators & LeadersC
Organizational SustainabilityD
6%8% 9%
0%
25%
15-16 16-17 18-19Goal
2% 4% 5%0%
25%
15-16 16-17 18-19Goal
50%57%
80%
0%
50%
100%
15-16 16-17 18-19Goal
C4-C5. Effective* teachers & leaders who continue to choose to work at CNCA (current data based on retention only)
C3. Leaders who believe…C1-C2***. Teachers who believe…
Place-Based ApproachB
77%100%
0%
100%
15-16 16-17 18-19Goal
58% 53%
100%
0%
100%
15-16 16-17 18-19Goal
66% 57%
100%
0%
100%
15-16 16-17 18-19Goal
*Data unavailable for given year**2016-2017 data is not yet official*** Two separate survey instruments were used in 2015-16 and 2016-17
77% 100%
15-16 16-17 18-19Goal
70%90%
0%
100%
15-16 16-17 18-19Goal
B1. Students who believe they have the skills, tools and support to be ready for college
B2. Graduating students participating in an internship by graduation
B3. Students participating in 4+ experiential learning opportunities per year
B4. Parents who believe they have the skills, tools and support to get their child ready for college
B5. Students & families who see the school as responsive
Engagement of Parents & FamiliesExperiential Learning Opportunities
*
CNCA Leadership Team and/or Professional Learning opportunities support my development as a leader
No baseline data for 2016-17
D1. Annual reserve as % of total organizational revenue
D2. Private philanthropy as % of annual operating budget
D3. CNCA 8th graders matriculating to CNCA HS
*
57%
63%
55%
67%
0% 20% 40% 60% 80%
C2. CNCA is a good place to work.
C1. The professional adult learning
community challenges me to become a more
effective, reflective teacher.
15-16 16-17
90%
90%
84%
73%
80%
71%
0% 50% 100%
Leaders
Teachers
15-16 16-17 18-19 Goal
0% 50% 100%
18-19Goal
16-17
*
3/7/18

CCSA-What gets measured gets done presentation-27Mar18-FINAL-jls - 16 -© 2018 Blue Garnet
Educators & LeadersC
Organizational SustainabilityD
6%8% 9%
0%
25%
15-16 16-17 18-19Goal
2% 4% 5%0%
25%
15-16 16-17 18-19Goal
50%57%
80%
0%
50%
100%
15-16 16-17 18-19Goal
C4-C5. Effective* teachers & leaders who continue to choose to work at CNCA (current data based on retention only)
C3. Leaders who believe…C1-C2***. Teachers who believe…
Place-Based ApproachB
77%100%
0%
100%
15-16 16-17 18-19Goal
58% 53%
100%
0%
100%
15-16 16-17 18-19Goal
66% 57%
100%
0%
100%
15-16 16-17 18-19Goal
*Data unavailable for given year**2016-2017 data is not yet official*** Two separate survey instruments were used in 2015-16 and 2016-17
77% 100%
15-16 16-17 18-19Goal
70%90%
0%
100%
15-16 16-17 18-19Goal
B1. Students who believe they have the skills, tools and support to be ready for college
B2. Graduating students participating in an internship by graduation
B3. Students participating in 4+ experiential learning opportunities per year
B4. Parents who believe they have the skills, tools and support to get their child ready for college
B5. Students & families who see the school as responsive
Engagement of Parents & FamiliesExperiential Learning Opportunities
*
CNCA Leadership Team and/or Professional Learning opportunities support my development as a leader
No baseline data for 2016-17
D1. Annual reserve as % of total organizational revenue
D2. Private philanthropy as % of annual operating budget
D3. CNCA 8th graders matriculating to CNCA HS
*
57%
63%
55%
67%
0% 20% 40% 60% 80%
C2. CNCA is a good place to work.
C1. The professional adult learning
community challenges me to become a more
effective, reflective teacher.
15-16 16-17
90%
90%
84%
73%
80%
71%
0% 50% 100%
Leaders
Teachers
15-16 16-17 18-19 Goal
0% 50% 100%
18-19Goal
16-17
*
3/7/18

CCSA-What gets measured gets done presentation-27Mar18-FINAL-jls - 17 -© 2018 Blue Garnet
Source: BG adapted from “Measurement as Learning” from The Bridgespan Group, Apr 2011 and “Benchmarking for Nonprofits” by Jason Saul
What makes for a good measure?
SMART Criteria for Measures
Specific – Must indicate exactly what result is expected for accurate judgment
Measurable – Must be measurable in clear quantitative or qualitative terms; reasonable costs to measure and must be credible
Accountable – Must be “owned” by someone to ensure results are produced
Results-oriented – Must measure end or intermediate outcome, or link to activity that will achieve an outcome
Time-bound – Specific time frame for results to be produced and reported, incl. baseline and targets
Other – Key terms to define include measures, indicators, baseline, targets, actuals

CCSA-What gets measured gets done presentation-27Mar18-FINAL-jls - 18 -© 2018 Blue Garnet
Questions?

CCSA-What gets measured gets done presentation-27Mar18-FINAL-jls - 19 -© 2018 Blue Garnet
Let’s stay in touch!
linkedin.com/company/camino-nuevo-charter-academy
linkedin.com/company/blue-garnet-associates
@CNCAschools@hellobluegarnet
We invite you to check out our social media pages, website, and newsletter where we post news and resources related to moving the needle for social change.
bluegarnet.net
caminonuevo.org
https://www.facebook.com/caminonuevocharteracademy/
https://www.facebook.com/hellobluegarnet/ Join our network!
bluegarnet.net/newsletter-signup

CCSA-What gets measured gets done presentation-27Mar18-FINAL-jls - 20 -© 2018 Blue Garnet

CCSA-What gets measured gets done presentation-27Mar18-FINAL-jls - 21 -© 2018 Blue Garnet
Example 1: Dashboard operationalized to build culture and engage team
Ingre-dient
Measure (or Outcome)(What we're measuring)
Indicator(How do we measure it)
i1 Ultimate Impact # and % of clients who agree that BG support has expanded their ability to create a better Southern California
A1 Secure Revenue/"Right" Client summary indicator for distribution of revenue by targets (red/yellow/green)
A2 "Right" Client/Manage Project % of clients who would recommend us to a colleague
B1 Effectiveness as Learning Org. team's rating of BG's effectiveness as a learning organization
B2 So What? Of Thought Leadership & Tools Participant change (∆) as a result of BG presentations over the last year
C1 Develop/Retain Average rating on team survey re: staff satisfaction
C2 Right Team % of staff (>1 yr) core capabilities scoring 3 or higher
D1 Financial Health Net operating margin
D2 Financial Health Operating reserve ratio
D3 Time & Billability Variance from firm-level billability target
D4 Project Management Overall profitability of projects (given "i") (include external and significant/one-off internal projects)
BG-Team Retreat 2014 Review-6Feb15-FINAL-tlc - 4 - ** Confidential © 2015 Blue Garnet **
Ingredient A: Effectively secure & manage projects for clients positioned to make lasting social change
A2: Right Client/Manage Project% of clients who would recommend
us to a colleague
89%
11%
Baseline3
(1) Summary indicator target areas: by relationship (existing/new), by type of client (N/F/C), by nature of work (S/P/R), and by business line (1:1/1:s/1:m). Green means 4/4 target areas within 10% of revenue goal, yellow means 3/4 target areas within 10% of revenue goal, red means only 1 or 2 target areas within 10% of revenue goal
(2) 2014 project wrap-up survey individual responses, n=10 (from 2 orgs, TreePeople and Weingart Foundation) (3) 2013 client satisfaction survey individual responses, n=9
A1: Secure Revenue/Right Client Distribution of revenue by target1
Baseline: Revenue within 10% of target for 2 target areas (1 area is almost within 10%, hence orange)
Target: Revenue within 10% of target for all 4 areas
2014 Results: Revenue within 10% of target for 3 target areas
100%
0%
2014 Results2
Agree
Disagree
2015 target: At least 95% of respondents would recommend us to a colleague
Blue Garnet example

CCSA-What gets measured gets done presentation-27Mar18-FINAL-jls - 22 -© 2018 Blue Garnet
Example 2: Dashboard operationalized into visual reporting tool for board use
1) Dashboard spreadsheet 2) Visual reporting tool
Operationalizing dashboard has involved some refinements to indicators (focusing on what data is meaningful and pragmatic to use)