CCQM-K50 „Polycyclic Aromatic Hydrocarbons...
47
Page 1 of 47 CCQM Intercomparison Study of Organic Analysis Working Group CCQM-K50 „Polycyclic Aromatic Hydrocarbons (PAHs) in Soil/Particulate Matter“ Draft B Report (final version May 2009) Rosemarie Philipp, Wolfram Bremser, Roland Becker and Tin Win BAM - Federal Institute for Materials Research and Testing, Berlin, Germany Michele Schantz NIST - National Institute of Standards and Technology, Gaithersburg, USA Melina Pérez Urquiza, Marco Antonio Ávila Calderón and Mauricio Maldonado Torres CENAM - Centro Nacional de Metrologia, Querétaro, Mexico David Carter and Gavin O'Connor LGC – Laboratory of the Government Chemist, Teddington, UK Berit Sejeroe-Olsen and Marina Ricci IRMM – Institute for Reference Materials and Measurements, Geel, Belgium Béatrice Lalere and Maryline Peignaux LNE - Laboratoire National de Métrologie et d’Essais, Paris, France Dal-Ho Kim KRISS – Korea Research Institute of Standards and Science, Daejeon, South Korea Nobuyasu Itoh NMIJ – National Metrology Institute of Japan, Tsukuba, Japan Siu-kay Wong and T. O. Man GL – Government Laboratory, Kowloon, Hong Kong Janaína Marques Rodrigues Caixeiro INMETRO - Instituto Nacional de Metrologia Normalização e Qualidade Industrial, Xerém, Brazil 1. Introduction For the Mutual Recognition Arrangement (MRA) developed by the CIPM, there are numerous Calibration and Measurement Capability Claims (CMCs) on PAH analysis in various matrices published in the BIPM key comparison database, Appendix C. By July 2007 such CMCs were released in Category 10 Biological fluids and materials, Subcategory 10.4 Tissues, Category 11 Food, Subcategory 11.2 Contaminants and Category 13 Sediments, soils, ores and particulates, Subcategories 13.1 Sediments, 13.2 Soils and 13.4 Particulates. Additional CMCs are being proposed and reviewed. Evidence of successful participation in formal, relevant international comparisons is needed to support these claims. At the CCQM Organic Working Group meeting held at IRMM in September 2005, results of a pilot study CCQM-P69 “PAHs in Soil/Sediment” were discussed and it was decided to proceed with a key comparison and a subsequent pilot study CCQM-K50/P69.1. CENAM and BAM agreed to serve as the coordinating laboratories. The measurand of the study was specified as amount of specific PAHs in solid matrices as extracted under exhaustive extraction conditions.
-
Upload
trinhkhuong -
Category
Documents
-
view
233 -
download
3
Transcript of CCQM-K50 „Polycyclic Aromatic Hydrocarbons...
Page 1 of 47
CCQM Intercomparison Study of Organic Analysis Working Group
CCQM-K50 „Polycyclic Aromatic Hydrocarbons (PAHs) in Soil/Particulate
Matter“ Draft B Report (final version May 2009)
Rosemarie Philipp, Wolfram Bremser, Roland Becker and Tin Win BAM - Federal Institute for Materials Research and Testing, Berlin, Germany Michele Schantz NIST - National Institute of Standards and Technology, Gaithersburg, USA Melina Pérez Urquiza, Marco Antonio Ávila Calderón and Mauricio Maldonado Torres CENAM - Centro Nacional de Metrologia, Querétaro, Mexico David Carter and Gavin O'Connor LGC – Laboratory of the Government Chemist, Teddington, UK Berit Sejeroe-Olsen and Marina Ricci IRMM – Institute for Reference Materials and Measurements, Geel, Belgium Béatrice Lalere and Maryline Peignaux LNE - Laboratoire National de Métrologie et d’Essais, Paris, France Dal-Ho Kim KRISS – Korea Research Institute of Standards and Science, Daejeon, South Korea Nobuyasu Itoh NMIJ – National Metrology Institute of Japan, Tsukuba, Japan Siu-kay Wong and T. O. Man GL – Government Laboratory, Kowloon, Hong Kong Janaína Marques Rodrigues Caixeiro INMETRO - Instituto Nacional de Metrologia Normalização e Qualidade Industrial, Xerém, Brazil
1. Introduction
For the Mutual Recognition Arrangement (MRA) developed by the CIPM, there are numerous Calibration and Measurement Capability Claims (CMCs) on PAH analysis in various matrices published in the BIPM key comparison database, Appendix C. By July 2007 such CMCs were released in Category 10 Biological fluids and materials, Subcategory 10.4 Tissues, Category 11 Food, Subcategory 11.2 Contaminants and Category 13 Sediments, soils, ores and particulates, Subcategories 13.1 Sediments, 13.2 Soils and 13.4 Particulates. Additional CMCs are being proposed and reviewed. Evidence of successful participation in formal, relevant international comparisons is needed to support these claims. At the CCQM Organic Working Group meeting held at IRMM in September 2005, results of a pilot study CCQM-P69 “PAHs in Soil/Sediment” were discussed and it was decided to proceed with a key comparison and a subsequent pilot study CCQM-K50/P69.1. CENAM and BAM agreed to serve as the coordinating laboratories. The measurand of the study was specified as amount of specific PAHs in solid matrices as extracted under exhaustive extraction conditions.
Page 2 of 47
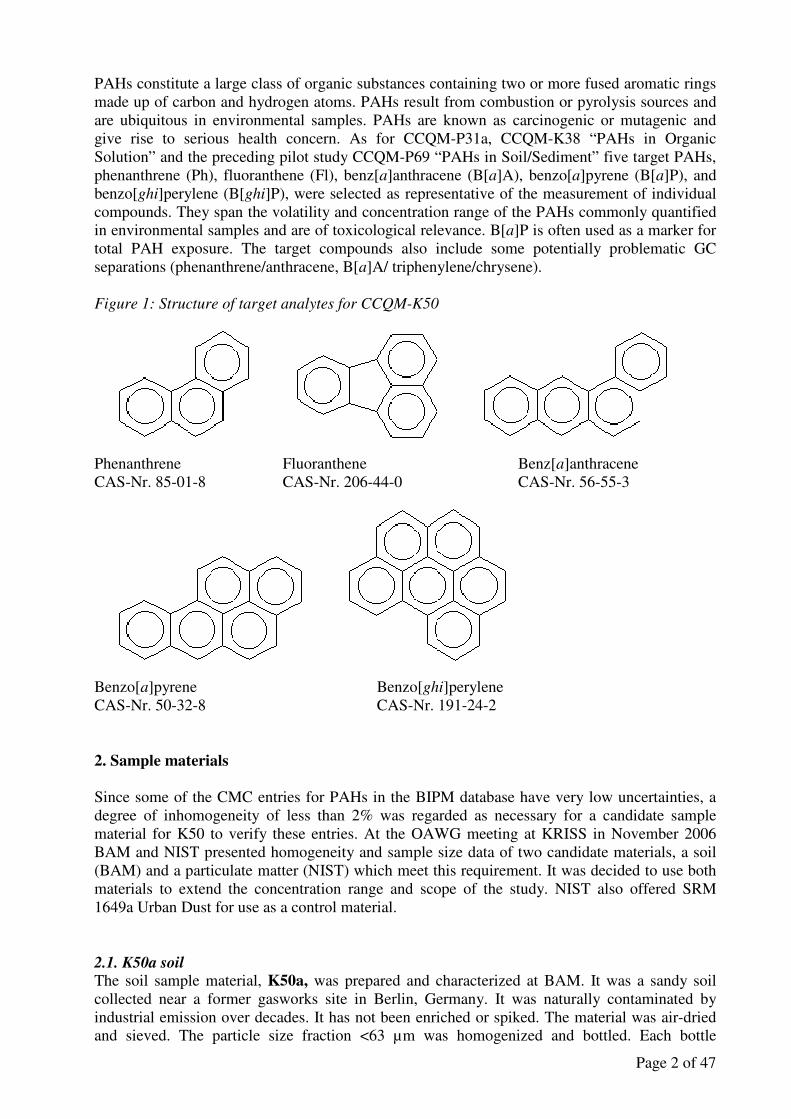
PAHs constitute a large class of organic substances containing two or more fused aromatic rings made up of carbon and hydrogen atoms. PAHs result from combustion or pyrolysis sources and are ubiquitous in environmental samples. PAHs are known as carcinogenic or mutagenic and give rise to serious health concern. As for CCQM-P31a, CCQM-K38 “PAHs in Organic Solution” and the preceding pilot study CCQM-P69 “PAHs in Soil/Sediment” five target PAHs, phenanthrene (Ph), fluoranthene (Fl), benz[a]anthracene (B[a]A), benzo[a]pyrene (B[a]P), and benzo[ghi]perylene (B[ghi]P), were selected as representative of the measurement of individual compounds. They span the volatility and concentration range of the PAHs commonly quantified in environmental samples and are of toxicological relevance. B[a]P is often used as a marker for total PAH exposure. The target compounds also include some potentially problematic GC separations (phenanthrene/anthracene, B[a]A/ triphenylene/chrysene). Figure 1: Structure of target analytes for CCQM-K50
Phenanthrene Fluoranthene Benz[a]anthracene CAS-Nr. 85-01-8 CAS-Nr. 206-44-0 CAS-Nr. 56-55-3
Benzo[a]pyrene Benzo[ghi]perylene CAS-Nr. 50-32-8 CAS-Nr. 191-24-2 2. Sample materials
Since some of the CMC entries for PAHs in the BIPM database have very low uncertainties, a degree of inhomogeneity of less than 2% was regarded as necessary for a candidate sample material for K50 to verify these entries. At the OAWG meeting at KRISS in November 2006 BAM and NIST presented homogeneity and sample size data of two candidate materials, a soil (BAM) and a particulate matter (NIST) which meet this requirement. It was decided to use both materials to extend the concentration range and scope of the study. NIST also offered SRM 1649a Urban Dust for use as a control material. 2.1. K50a soil The soil sample material, K50a, was prepared and characterized at BAM. It was a sandy soil collected near a former gasworks site in Berlin, Germany. It was naturally contaminated by industrial emission over decades. It has not been enriched or spiked. The material was air-dried and sieved. The particle size fraction <63 µm was homogenized and bottled. Each bottle

Page 3 of 47
contained about 20 g of soil in 50 mL brown glass jar with a Teflon-lined screw cap. The concentration of each of the five target PAHs in the soil was between 1 µg/g to 20 µg/g. The material was tested for homogeneity according to ISO Guide 35 (ANOVA, single factor analysis of variance, 95% level). 15 bottles of the material were used, 4 determinations per bottle were carried out using 3 g sample. Extraction was done with methanol by Accelerated Solvent method (ASE), measurement by HPLC-FLD/DAD. Figure 2: Homogeneity study for K50a soil. Symbols are the mean of 4 determinations per bottle,
uncertainty bars are the relative standard deviation of the 4 determinations. Red lines display
the ±2% level.
Phenanthrene
-8
-6
-4
-2
0
2
4
6
1 2 3 4 5 6 7 8 9 10 11 12 13 14 15bottle num be r
devia
tio
n f
rom
mea
n o
f
mean
s [
%]
Fluoranthene
-8
-6
-4
-2
0
2
4
6
1 2 3 4 5 6 7 8 9 10 11 12 13 14 15bottle num be r
devi
ati
on f
rom
mean o
f
mean
s [%
]
B enz [a ]anthracen e
-8
-6
-4
-2
0
2
4
6
1 2 3 4 5 6 7 8 9 10 11 12 13 14 15bottle num ber
devia
tio
n fro
m m
ean o
f
mea
ns [%
]

Page 4 of 47
Table 1: Results of the homogeneity study (ANOVA) of K50a soil sample
within bottle standard deviation sqrt(MSwithin)
between bottle standard deviation sqrt(MSbetween)
uncertainty between bottles
*
Ph 2,40% 1,21% 0,56%
Fl 1,13% 1,44% 0,44%
B[a]A 1,39% 1,50% 0,32%
B[a]P 2,88% 1,61% 0,66%
B[ghi]P 2,07% 1,49% 0,48% *the larger value of sbb and ubb was used
nMSwithinMSbetween
bbs −= (1)
42
MSwithin
within
bbn
MSu
ν⋅= (2)
MSwithin and MSbetween are the within and between group variances, n the number of measurements per bottle and νMSwithin the degrees of freedom within group. Results show that the material is homogeneous, the between bottle inhomogeneity is less than 2% for all analytes. The sample size study was carried out with three different sample masses (1.5 g, 3 g, 6 g). Five replicate measurements per sample mass were performed (extraction with toluene by ASE or FlexIka, measurement by GC-MS). No statistically significant dependence of analytical results on sample mass intake was observed within the mass range 1.5 g to 6 g.
B en z o[a ]pyren e
-8
-6
-4
-2
0
2
4
6
1 2 3 4 5 6 7 8 9 10 11 12 13 14 15bottle num ber
devi
ati
on
fro
m m
ean
of
means [
%]
B enz o[gh i ])pe rylen e
-8
-6
-4
-2
0
2
4
6
1 2 3 4 5 6 7 8 9 10 1 1 12 13 14 15bott le num be r
devia
tio
n f
rom
mean
of
me
an
s [
%]

Page 5 of 47
Figure 3: Sample size study for K50a soil. Symbols are the mean of 5 determinations per mass,
uncertainty bars are the relative standard deviation of the mean of replicate determinations. Red
lines display the ±2% level.
Phenanthrene
-6
-4
-2
0
2
4
1,5 3 6sample mass [g]
devia
tio
n f
rom
mean
of
mean
s [
%]
Fluoranthene
-6
-4
-2
0
2
4
1,5 3 6sample mass [g]
devia
tio
n f
rom
mean
of
mean
s [
%]
Benz[a ]anthracene
-6
-4
-2
0
2
4
1,5 3 6sample mass [g]
devia
tio
n f
rom
mean o
f
means [
%]
Benzo[a ]pyrene
-6
-4
-2
0
2
4
1,5 3 6sample mass [g]
devia
tion fro
m m
ean o
f
means [%
]
Benzo[ghi ]perylene
-6
-4
-2
0
2
4
1,5 3 6sample mass [g]
devia
tion
fro
m m
ean o
f
mean
s [
%]
2.2. K50b particulate matter The particulate sample material, K50b, was prepared and characterized at NIST. It is an air particulate which was collected in an urban area over a period in excess of 12 months using a baghouse. The material was removed from the baghouse filter bags and combined in a single lot. The lot was passed through a 63 µm sieve and mixed in a V-blender. The mean particle size of the material is 20 µm. This material has not been enriched or spiked. Each jar contains approximately 2 g of particulate. The concentration of each of the five target PAHs in the particulate is between 1 µg/g to 7 µg/g. The material was tested for homogeneity and minimum sample size using the following approach: The observed (overall) variance (Sobs
2) of repetitive analysis includes both analytical measurement (Sm
2) and subsampling (Ss2) variances.
222
smobs SSS += (3)
The analytical measurement (Sm2) variance can be estimated by processing calibration solutions
prepared so that concentrations mimic those in the samples of interest through the entire analytical procedure from extraction to analysis.
Page 6 of 47
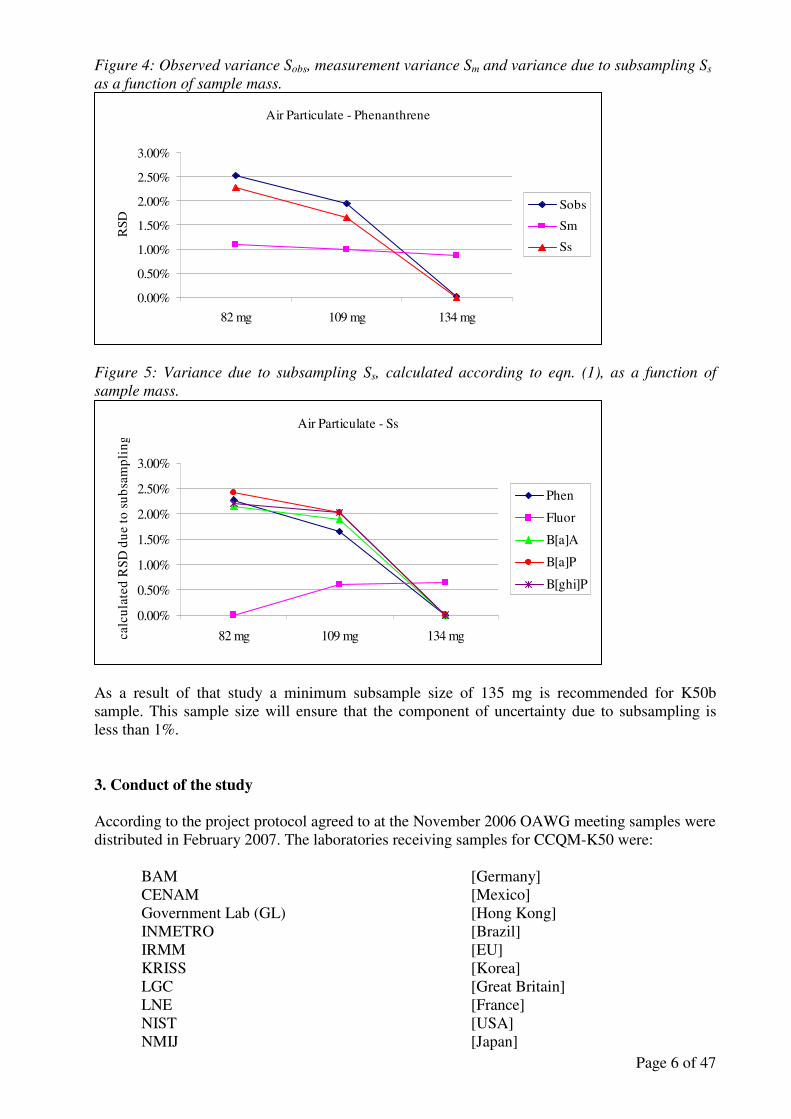
Figure 4: Observed variance Sobs, measurement variance Sm and variance due to subsampling Ss
as a function of sample mass.
Figure 5: Variance due to subsampling Ss, calculated according to eqn. (1), as a function of
sample mass.
As a result of that study a minimum subsample size of 135 mg is recommended for K50b sample. This sample size will ensure that the component of uncertainty due to subsampling is less than 1%.
3. Conduct of the study
According to the project protocol agreed to at the November 2006 OAWG meeting samples were distributed in February 2007. The laboratories receiving samples for CCQM-K50 were: BAM [Germany] CENAM [Mexico] Government Lab (GL) [Hong Kong] INMETRO [Brazil] IRMM [EU] KRISS [Korea] LGC [Great Britain] LNE [France] NIST [USA] NMIJ [Japan]
Air Particulate - Phenanthrene
0.00%
0.50%
1.00%
1.50%
2.00%
2.50%
3.00%
82 mg 109 mg 134 mg
RSD
Sobs
Sm
Ss
Air Particulate - Ss
0.00%
0.50%
1.00%
1.50%
2.00%
2.50%
3.00%
82 mg 109 mg 134 mgcalc
ulat
ed R
SD d
ue to
sub
sam
plin
g
Phen
Fluor
B[a]A
B[a]P
B[ghi]P

Page 7 of 47
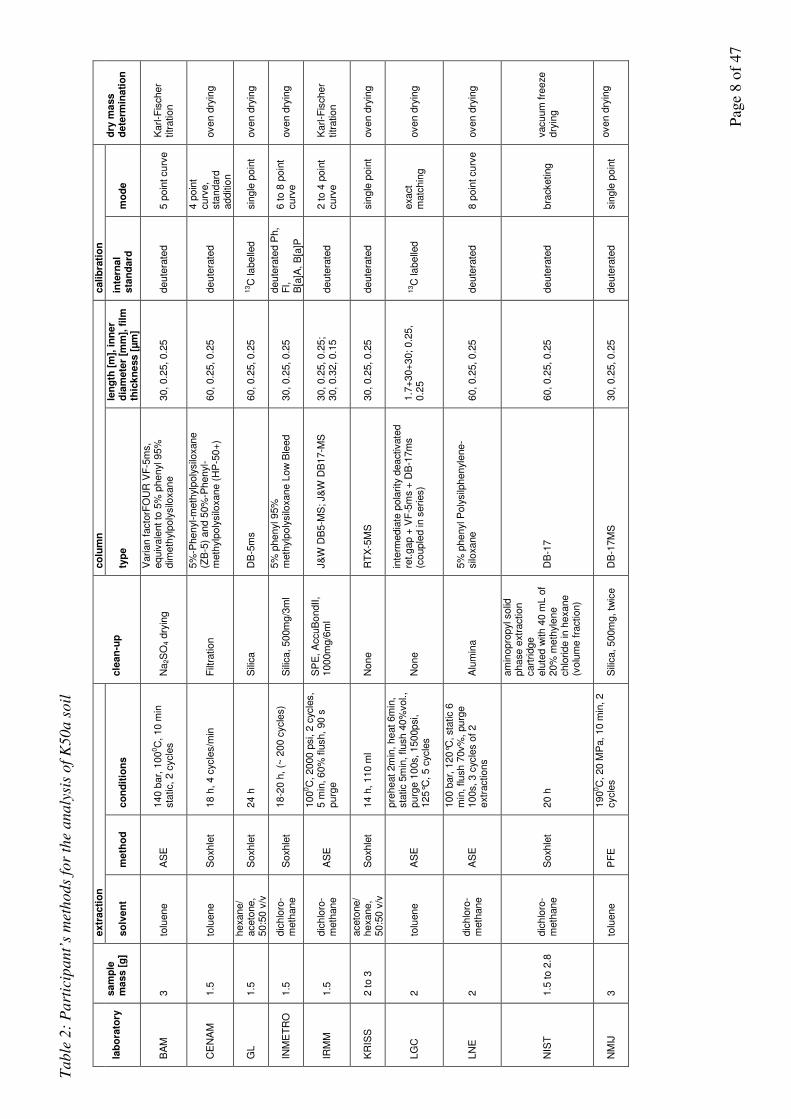
All participants returned results. KRISS and GL measured the K50a soil sample only. In parallel with CCQM-K50 another pilot study CCQM-P69.1 was initiated. Two labs received samples for this intercomparison. Each participant received two bottles of K50a, two bottles of K50b and one bottle of SRM 1649a. The exercise instructions requested the analysis of three aliquots from each of the four bottles (total of six determinations per sample). Analysis of the SRM1649a (control sample) was optional, but participants were strongly encouraged to report results for this material too. The amount of the control sample supplied to the participants was about 500 mg, which was sufficient for up to three replicate measurements. The material within the bottles was to be mixed thoroughly by stirring or shaking before subsampling. For extraction of the K50a material a sample mass between 1.5 g and 6 g was recommended. For extraction of the K50b material, the minimum sample intake was to be 135 mg. Participants were asked to use their routine analytical procedures for the determination of PAHs in solid matrices. Results were to be reported as mass fractions of the target analytes on a dry-mass basis, therefore, the residual moisture in the samples was to be determined and reported. A complete uncertainty budget was also requested.
4. Methods
All participants applied GC-MS with either deuterated or 13C isotopes as internal standards. Extractions were done by Soxhlet or Accelerated Solvent Extraction (ASE), also known as Pressurized Fluid Extraction (PFE). For calibration, certified organic solutions of PAHs (NIST CRMs) were used by BAM, GL and NIST. All other participants used neat crystalline substances from different commercial sources, among them BCR certified reference materials which were available for fluoranthene, B[a]A and B[ghi]P. For the non BCR commercial standards, all participants except INMETRO, IRMM and LNE performed a purity assessment. Details of the analytical methods and the sources of calibration standards are summarized in the following tables. Table 4: Sources of calibration standards
Phenanthrene Fluoranthene B[a]A B[a]P B[ghi]P purity assessment
BAM NIST SRM 1647d "16 priority pollutant polycyclic hydrocarbons in acetonitrile"
GL NIST SRM 2260a "36 aromatic hydrocarbons in toluene"
CENAM Chem Service Aldrich Supelco Ultra Scientific Ultra Scientific yes
INMETRO Sigma-Aldrich Sigma-Aldrich Sigma-Aldrich AccuStandard Sigma-Aldrich no
IRMM Dr Ehrenstorfer Dr Ehrenstorfer BCR271 Dr Ehrenstorfer BCR52 no
KRISS Aldrich BCR BCR Chem Service BCR yes
LGC Aldrich Aldrich BCR271 QMx labs (Dr Ehrenstorfer)
BCR52 yes
LNE Dr Ehrenstorfer Dr Ehrenstorfer Dr Ehrenstorfer Dr Ehrenstorfer Dr Ehrenstorfer no
NIST NIST SRM 2260a "36 aromatic hydrocarbons in toluene"
NMIJ Supelco TCI TCI TCI AccuStandard yes
P
age
8 of
47
Ta
ble
2:
Pa
rtic
ipa
nt’
s m
eth
od
s fo
r th
e a
na
lysi
s o
f K
50
a s
oil
e
xtr
ac
tio
n
co
lum
n
ca
lib
rati
on
lab
ora
tory
s
am
ple
m
as
s [
g]
so
lve
nt
me
tho
d
co
nd
itio
ns
c
lea
n-u
p
typ
e
len
gth
[m
], i
nn
er
dia
mete
r [m
m],
fil
m
thic
kn
ess
[µ
m]
inte
rna
l s
tan
da
rd
mo
de
dry
ma
ss
d
ete
rmin
ati
on
BA
M
3
tolu
en
e
AS
E
14
0 b
ar,
10
00C
, 1
0 m
in
sta
tic,
2 c
ycle
s
Na
2S
O4 d
ryin
g
Va
ria
n f
acto
rFO
UR
VF
-5m
s,
eq
uiv
ale
nt
to 5
% p
he
nyl 9
5%
d
ime
thylp
oly
silo
xa
ne
30
, 0.2
5,
0.2
5
de
ute
rate
d
5 p
oin
t cu
rve
K
arl
-Fis
ch
er
titr
atio
n
CE
NA
M
1.5
to
luen
e
So
xh
let
18
h,
4 c
ycle
s/m
in
Filt
ratio
n
5%
-Phe
nyl-m
eth
ylp
oly
silo
xan
e
(ZB
-5)
an
d 5
0%
-Ph
en
yl-
meth
ylp
oly
silo
xan
e (
HP
-50
+)
60
, 0.2
5,
0.2
5
de
ute
rate
d
4 p
oin
t cu
rve,
sta
nd
ard
a
dd
itio
n
ove
n d
ryin
g
GL
1
.5
he
xa
ne/
aceto
ne
, 5
0:5
0 v
/v
So
xh
let
24
h
Sili
ca
D
B-5
ms
60
, 0.2
5,
0.2
5
13C
la
be
lled
sin
gle
po
int
ove
n d
ryin
g
INM
ET
RO
1
.5
dic
hlo
ro-
meth
an
e
So
xh
let
18
-20 h
, (~
20
0 c
ycle
s)
S
ilica
, 5
00m
g/3
ml
5%
ph
en
yl 9
5%
m
eth
ylp
oly
silo
xan
e L
ow
Ble
ed
30
, 0.2
5,
0.2
5
de
ute
rate
d P
h,
Fl,
B[a
]A,
B[a
]P
6 t
o 8
po
int
cu
rve
ove
n d
ryin
g
IRM
M
1.5
d
ich
loro
-m
eth
an
e
AS
E
10
00C
, 2
000
psi,
2 c
ycle
s,
5 m
in,
60
% f
lush,
90
s
pu
rge
SP
E,
AccuB
on
dII
, 1
00
0m
g/6
ml
J&
W D
B5
-MS
; J&
W D
B1
7-M
S
3
0,
0.2
5,
0.2
5;
30
, 0.3
2,
0.1
5
de
ute
rate
d
2 t
o 4
po
int
cu
rve
K
arl
-Fis
ch
er
titr
atio
n
KR
ISS
2
to
3
aceto
ne
/ h
exa
ne,
50
:50
v/v
S
oxh
let
14
h,
11
0 m
l N
on
e
RT
X-5
MS
3
0,
0.2
5,
0.2
5
de
ute
rate
d
sin
gle
po
int
ove
n d
ryin
g
LG
C
2
tolu
en
e
AS
E
pre
he
at
2m
in,
he
at
6m
in,
sta
tic 5
min
, flu
sh
40
%vo
l.,
pu
rge 1
00s,
15
00p
si,
12
5°C
, 5 c
ycle
s
No
ne
inte
rme
dia
te p
ola
rity
dea
ctivate
d
ret.
ga
p +
VF
-5m
s +
DB
-17m
s
(co
up
led in s
eri
es)
1.7
+3
0+
30;
0.2
5,
0.2
5
13C
la
be
lled
e
xa
ct
matc
hin
g
ove
n d
ryin
g
LN
E
2
dic
hlo
ro-
meth
an
e
AS
E
10
0 b
ar,
12
0°C
, sta
tic 6
m
in,
flu
sh
70v%
, pu
rge
10
0s,
3 c
ycle
s o
f 2
extr
actio
ns
Alu
min
a
5%
ph
en
yl P
oly
silp
he
nyle
ne
-silo
xa
ne
60
, 0.2
5,
0.2
5
de
ute
rate
d
8 p
oin
t cu
rve
ove
n d
ryin
g
NIS
T
1.5
to
2.8
d
ich
loro
-m
eth
an
e
So
xh
let
20
h
am
ino
pro
pyl so
lid
ph
ase
extr
actio
n
ca
rtri
dg
e
elu
ted
with
40 m
L o
f 2
0%
me
thyle
ne
ch
lori
de in h
exa
ne
(v
olu
me
fra
ctio
n)
DB
-17
6
0,
0.2
5,
0.2
5
de
ute
rate
d
bra
cketing
vacu
um
fre
eze
d
ryin
g
NM
IJ
3
tolu
en
e
PF
E
19
00C
, 2
0 M
Pa,
10 m
in,
2
cycle
s
S
ilica
, 5
00m
g, tw
ice
D
B-1
7M
S
30
, 0.2
5,
0.2
5
de
ute
rate
d
sin
gle
po
int
ove
n d
ryin
g

P
age
9 of
47
Ta
ble
3:
Pa
rtic
ipa
nt’
s m
eth
od
s fo
r th
e a
na
lysi
s o
f K
50
b p
art
icu
late
an
d t
he
con
tro
l sa
mp
le S
RM
16
49
a
extr
acti
on
co
lum
n
cali
bra
tio
n
lab
ora
tory
sam
ple
m
ass [
g]
so
lven
t m
eth
od
co
nd
itio
ns
cle
an
-up
ty
pe
len
gth
[m
], in
ner
dia
mete
r [m
m],
fi
lm t
hic
kn
ess
[µm
]
inte
rnal
sta
nd
ard
m
od
e
dry
mass
dete
r-m
inati
on
BA
M
0.3
to
luene,
dic
hlo
ro-
meth
ane
AS
E
140 b
ar,
100
0C
, 10 m
in
sta
tic,
3 c
ycle
s
Na
2S
O4 d
ryin
g
Varian f
acto
rFO
UR
VF
-5m
s,
equiv
ale
nt
to 5
% p
henyl 95%
dim
eth
ylp
oly
silo
xane
30,
0.2
5,
0.2
5
deute
rate
d
5 p
oin
t curv
e
Karl-
Fis
cher
titr
ation
CE
NA
M
0.1
8
tolu
ene
Soxh
let
18 h
, 4 c
ycle
s/m
in
activate
d c
opper,
filtra
tion
5%
-Phenyl-m
eth
ylp
oly
silo
xane
(ZB
-5)
60,
0.2
5,
0.2
5
deute
rate
d
3 t
o 5
poin
t curv
e,
sta
ndard
additio
n
oven d
ryin
g
INM
ET
RO
0.1
5
dic
hlo
ro-
meth
ane
Soxh
let
12-1
5 h
, (~
200 c
ycle
s)
S
ilica, 500m
g/3
ml
5%
phenyl 95%
m
eth
ylp
oly
silo
xane L
ow
Ble
ed
30,
0.2
5,
0.2
5
deute
rate
d
Ph, F
l, B
[a]A
, B
[a]P
8 p
oin
t curv
e
oven d
ryin
g
IRM
M
0.1
5
dic
hlo
ro-
meth
ane
AS
E
100
0C
, 2000 p
si, 2
cycle
s, 5 m
in, 60%
flu
sh,
90 s
purg
e
SP
E, A
ccuB
ondII,
1000m
g/6
ml
J&
W D
B5-M
S; J&
W D
B17-M
S
30,
0.2
5,
0.2
5;
30,
0.3
2,
0.1
5
deute
rate
d
2 t
o 4
poin
t curv
e
Karl-
Fis
cher
titr
ation
LG
C
0.2
to
luene
AS
E
pre
heat
2m
in, heat 6m
in,
sta
tic 5
min
, flush
40%
vol., purg
e 1
00s,
1500psi, 1
25°C
, 5 c
ycle
s
None
inte
rmedia
te p
ola
rity
deactivate
d
ret.
gap +
VF
-5m
s +
DB
-17m
s
(couple
d in s
eries)
1.7
+30+
30;
0.2
5,
0.2
5
13C
labelle
d
exa
ct
matc
hin
g
oven d
ryin
g
LN
E
0.2
5
dic
hlo
ro-
meth
ane
AS
E
100 b
ar,
120°C
, sta
tic 6
m
in, flush 7
0v%
, purg
e
100s,
3 c
ycle
s o
f 2
ext
ractions
Alu
min
a
5%
phenyl P
oly
silp
henyle
ne-
silo
xane
60,
0.2
5,
0.2
5
deute
rate
d
8 p
oin
t curv
e
oven d
ryin
g
NIS
T
0.1
3 t
o
0.1
5
dic
hlo
ro-
meth
ane
Soxh
let
20 h
am
inopro
pyl solid
phase e
xtra
ction
cart
ridge
elu
ted w
ith 4
0 m
L
of
20%
meth
yle
ne
chlo
ride in h
exa
ne
(volu
me fra
ction)
DB
-17
60,
0.2
5,
0.2
5
deute
rate
d
bra
cketing
vacuum
fr
eeze d
ryin
g
NM
IJ
0.1
5
tolu
ene
PF
E
190
0C
, 20 M
Pa, 10 m
in,
2 c
ycle
s
S
ilica, 500m
g, once
DB
-17M
S
30,
0.2
5,
0.2
5
deute
rate
d
sin
gle
poin
t oven d
ryin
g

Page 10 of 47
5. Results
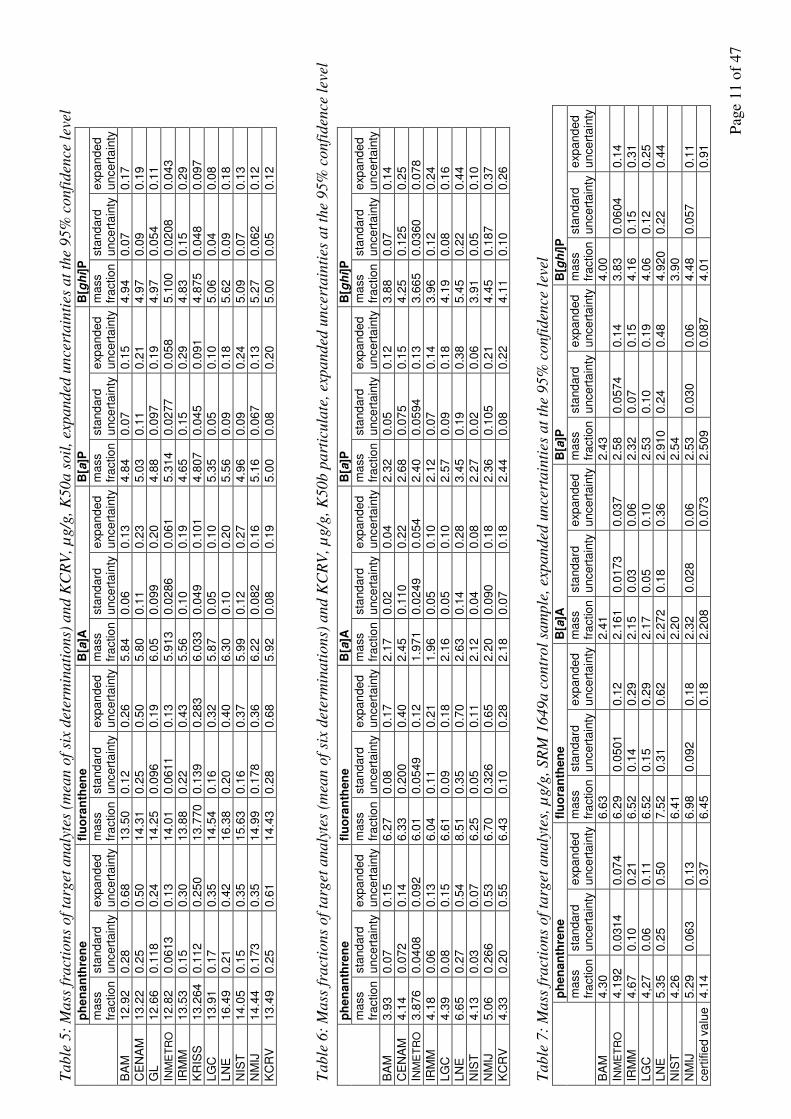
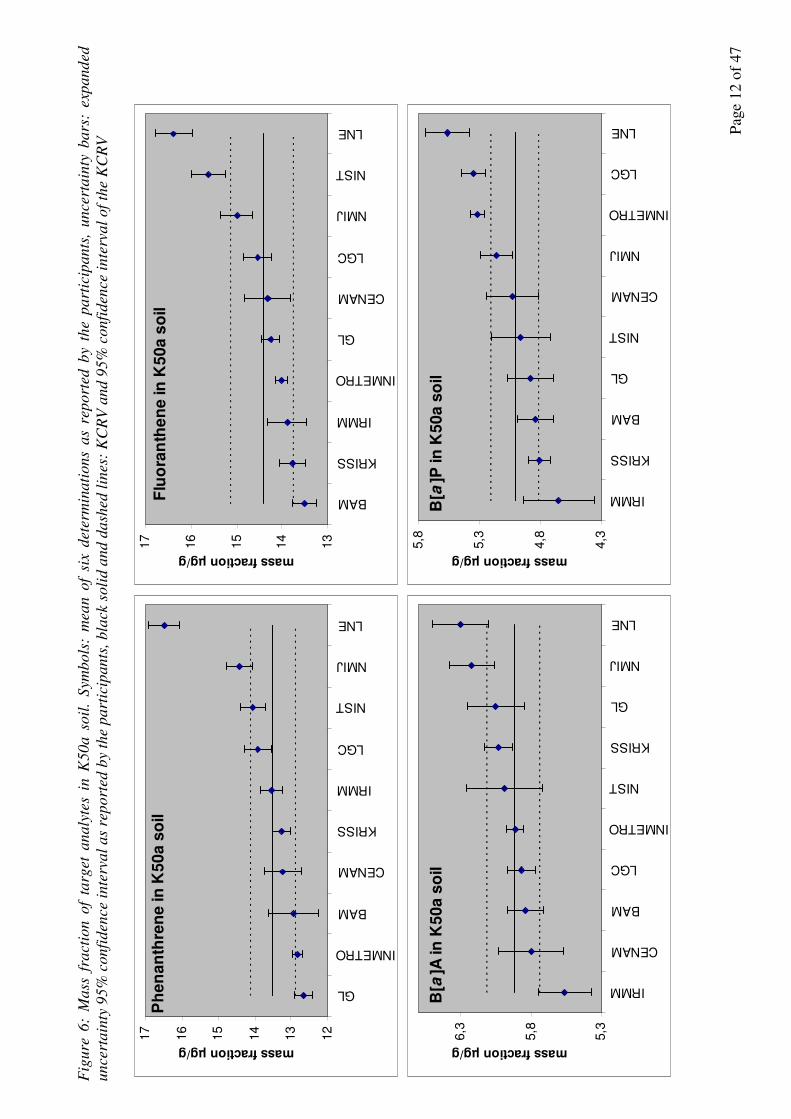
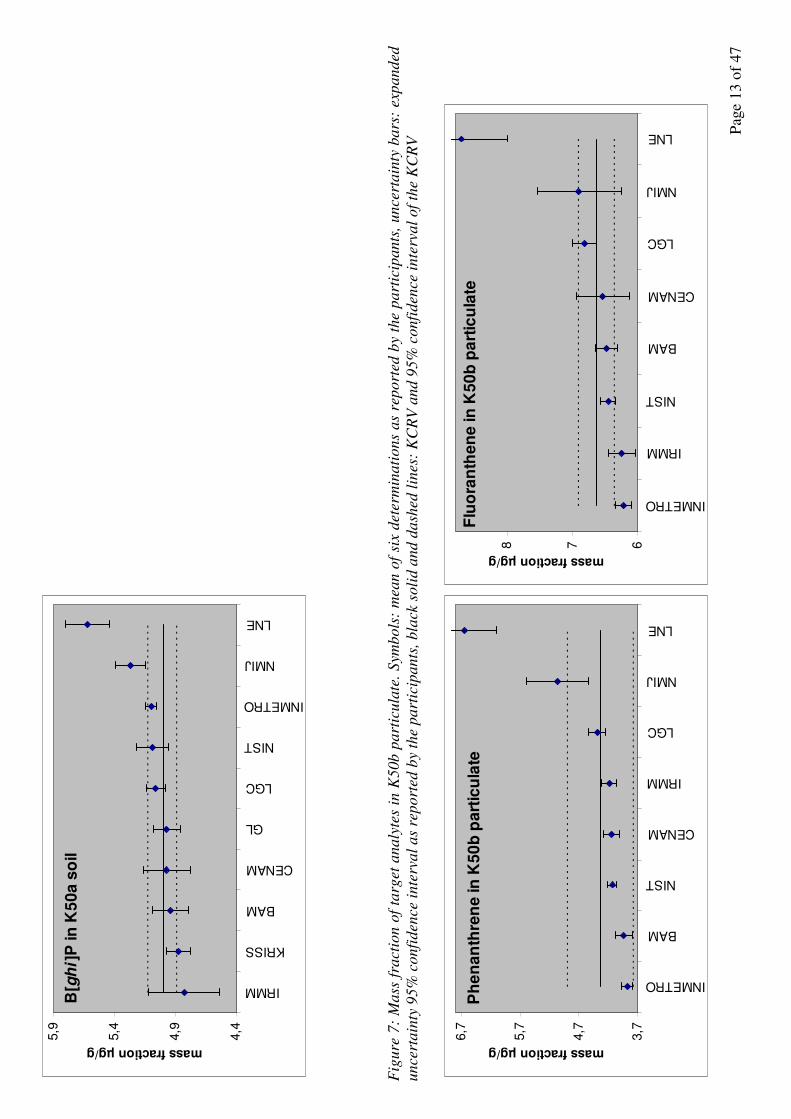
Tables 5 to 7 and figures 6 to 8 summarize the results and their standard and expanded uncertainties (95% confidence interval) as reported by the participants. Mass fractions of target analytes in K50a soil and K50b particulate are the mean of six independent determinations (three per bottle). Mass fractions in the SRM 1649a control sample are the mean of one to three determinations. Together with the analytical results the key comparison reference values (KCRV xR) and their standard and expanded uncertainties at 95% confidence level (UR) are displayed. Estimation of KCRV and uncertainty is described in section 6. INMETRO submitted two sets of data. After discussion of the preliminary results at the OAWG meeting in October 2007, INMETRO assessed the purity of their commercial PAH standards and recalculated their analytical results with respect to these purity values. The tables and figures of this report display their first submission. Revised data are summarized in appendix 1. Table 8 and figure 9 show the results of dry mass determination.
P
age
11 o
f 47
Ta
ble
5:
Ma
ss f
ract
ion
s o
f ta
rget
an
aly
tes
(mea
n o
f si
x d
eter
min
ati
on
s) a
nd
KC
RV
, µ
g/g
, K
50
a s
oil
, ex
pa
nd
ed u
nce
rta
inti
es a
t th
e 9
5%
co
nfi
den
ce l
eve
l T
ab
le 6
: M
ass
fra
ctio
ns
of
targ
et a
na
lyte
s (m
ean
of
six
det
erm
ina
tio
ns)
an
d K
CR
V,
µg
/g,
K5
0b
pa
rtic
ula
te,
exp
an
ded
un
cert
ain
ties
at
the
95
% c
on
fid
ence
leve
l
T
ab
le 7
: M
ass
fra
ctio
ns
of
targ
et a
na
lyte
s, µ
g/g
, S
RM
16
49
a c
on
tro
l sa
mp
le,
exp
an
ded
un
cert
ain
ties
at
the
95
% c
on
fid
ence
lev
el
ph
en
an
thre
ne
fl
uo
ran
then
e
B[a
]A
B[a
]P
B[g
hi]
P
ma
ss
fra
ctio
n
sta
nd
ard
u
nce
rta
inty
e
xp
an
de
d
un
ce
rta
inty
m
ass
fra
ctio
n
sta
nd
ard
u
nce
rta
inty
e
xp
an
de
d
un
ce
rta
inty
m
ass
fra
ctio
n
sta
nd
ard
u
nce
rta
inty
e
xp
an
de
d
un
ce
rta
inty
m
ass
fra
ctio
n
sta
nd
ard
u
nce
rta
inty
e
xp
an
de
d
un
ce
rta
inty
m
ass
fra
ctio
n
sta
nd
ard
u
nce
rta
inty
e
xp
an
de
d
un
ce
rta
inty
BA
M
12
.92
0
.28
0
.68
1
3.5
0
0.1
2
0.2
6
5.8
4
0.0
6
0.1
3
4.8
4
0.0
7
0.1
5
4.9
4
0.0
7
0.1
7
CE
NA
M
13
.22
0
.25
0
.50
1
4.3
1
0.2
5
0.5
0
5.8
0
0.1
1
0.2
3
5.0
3
0.1
1
0.2
1
4.9
7
0.0
9
0.1
9
GL
1
2.6
6
0.1
18
0
.24
1
4.2
5
0.0
96
0
.19
6
.05
0
.09
9
0.2
0
4.8
8
0.0
97
0
.19
4
.97
0
.05
4
0.1
1
INM
ET
RO
1
2.8
2
0.0
613
0
.13
1
4.0
1
0.0
611
0
.13
5
.91
3
0.0
286
0
.06
1
5.3
14
0
.02
77
0
.05
8
5.1
00
0
.02
08
0
.04
3
IRM
M
13
.53
0
.15
0
.30
1
3.8
8
0.2
2
0.4
3
5.5
6
0.1
0
0.1
9
4.6
5
0.1
5
0.2
9
4.8
3
0.1
5
0.2
9
KR
ISS
1
3.2
64
0
.11
2
0.2
50
1
3.7
70
0
.13
9
0.2
83
6
.03
3
0.0
49
0
.10
1
4.8
07
0
.04
5
0.0
91
4
.87
5
0.0
48
0
.09
7
LG
C
13
.91
0
.17
0
.35
1
4.5
4
0.1
6
0.3
2
5.8
7
0.0
5
0.1
0
5.3
5
0.0
5
0.1
0
5.0
6
0.0
4
0.0
8
LN
E
16
.49
0
.21
0
.42
1
6.3
8
0.2
0
0.4
0
6.3
0
0.1
0
0.2
0
5.5
6
0.0
9
0.1
8
5.6
2
0.0
9
0.1
8
NIS
T
14
.05
0
.15
0
.35
1
5.6
3
0.1
6
0.3
7
5.9
9
0.1
2
0.2
7
4.9
6
0.0
9
0.2
4
5.0
9
0.0
7
0.1
3
NM
IJ
14
.44
0
.17
3
0.3
5
14
.99
0
.17
8
0.3
6
6.2
2
0.0
82
0
.16
5
.16
0
.06
7
0.1
3
5.2
7
0.0
62
0
.12
KC
RV
1
3.4
9
0.2
5
0.6
1
14
.43
0
.28
0
.68
5
.92
0
.08
0
.19
5
.00
0
.08
0
.20
5
.00
0
.05
0
.12
ph
en
an
thre
ne
fl
uo
ran
then
e
B[a
]A
B[a
]P
B[g
hi]
P
ma
ss
fra
ctio
n
sta
nd
ard
u
nce
rta
inty
e
xp
an
de
d
un
ce
rta
inty
m
ass
fra
ctio
n
sta
nd
ard
u
nce
rta
inty
e
xp
an
de
d
un
ce
rta
inty
m
ass
fra
ctio
n
sta
nd
ard
u
nce
rta
inty
e
xp
an
de
d
un
ce
rta
inty
m
ass
fra
ctio
n
sta
nd
ard
u
nce
rta
inty
e
xp
an
de
d
un
ce
rta
inty
m
ass
fra
ctio
n
sta
nd
ard
u
nce
rta
inty
e
xp
an
de
d
un
ce
rta
inty
BA
M
3.9
3
0.0
7
0.1
5
6.2
7
0.0
8
0.1
7
2.1
7
0.0
2
0.0
4
2.3
2
0.0
5
0.1
2
3.8
8
0.0
7
0.1
4
CE
NA
M
4.1
4
0.0
72
0
.14
6
.33
0
.20
0
0.4
0
2.4
5
0.1
10
0
.22
2
.68
0
.07
5
0.1
5
4.2
5
0.1
25
0
.25
INM
ET
RO
3
.87
6
0.0
408
0
.09
2
6.0
1
0.0
549
0
.12
1
.97
1
0.0
249
0
.05
4
2.4
0
0.0
594
0
.13
3
.66
5
0.0
360
0
.07
8
IRM
M
4.1
8
0.0
6
0.1
3
6.0
4
0.1
1
0.2
1
1.9
6
0.0
5
0.1
0
2.1
2
0.0
7
0.1
4
3.9
6
0.1
2
0.2
4
LG
C
4.3
9
0.0
8
0.1
5
6.6
1
0.0
9
0.1
8
2.1
6
0.0
5
0.1
0
2.5
7
0.0
9
0.1
8
4.1
9
0.0
8
0.1
6
LN
E
6.6
5
0.2
7
0.5
4
8.5
1
0.3
5
0.7
0
2.6
3
0.1
4
0.2
8
3.4
5
0.1
9
0.3
8
5.4
5
0.2
2
0.4
4
NIS
T
4.1
3
0.0
3
0.0
7
6.2
5
0.0
5
0.1
1
2.1
2
0.0
4
0.0
8
2.2
7
0.0
2
0.0
6
3.9
1
0.0
5
0.1
0
NM
IJ
5.0
6
0.2
66
0
.53
6
.70
0
.32
6
0.6
5
2.2
0
0.0
90
0
.18
2
.36
0
.10
5
0.2
1
4.4
5
0.1
87
0
.37
KC
RV
4
.33
0
.20
0
.55
6
.43
0
.10
0
.28
2
.18
0
.07
0
.18
2
.44
0
.08
0
.22
4
.11
0
.10
0
.26
ph
en
an
thre
ne
fl
uo
ran
then
e
B[a
]A
B[a
]P
B[g
hi]
P
ma
ss
fra
ctio
n
sta
nd
ard
u
nce
rta
inty
e
xp
an
de
d
un
ce
rta
inty
m
ass
fra
ctio
n
sta
nd
ard
u
nce
rta
inty
e
xp
an
de
d
un
ce
rta
inty
m
ass
fra
ctio
n
sta
nd
ard
u
nce
rta
inty
e
xp
an
de
d
un
ce
rta
inty
m
ass
fra
ctio
n
sta
nd
ard
u
nce
rta
inty
e
xp
an
de
d
un
ce
rta
inty
m
ass
fra
ctio
n
sta
nd
ard
u
nce
rta
inty
e
xp
an
de
d
un
ce
rta
inty
BA
M
4.3
0
6.6
3
2.4
1
2.4
3
4.0
0
INM
ET
RO
4
.19
2
0.0
314
0
.07
4
6.2
9
0.0
501
0
.12
2
.16
1
0.0
173
0
.03
7
2.5
8
0.0
574
0
.14
3
.83
0
.06
04
0
.14
IRM
M
4.6
7
0.1
0
0.2
1
6.5
2
0.1
4
0.2
9
2.1
5
0.0
3
0.0
6
2.3
2
0.0
7
0.1
5
4.1
6
0.1
5
0.3
1
LG
C
4,2
7
0.0
6
0.1
1
6.5
2
0.1
5
0.2
9
2.1
7
0.0
5
0.1
0
2.5
3
0.1
0
0.1
9
4.0
6
0.1
2
0.2
5
LN
E
5.3
5
0.2
5
0.5
0
7.5
2
0.3
1
0.6
2
2.2
72
0
.18
0
.36
2
.91
0
0.2
4
0.4
8
4.9
20
0
.22
0
.44
NIS
T
4.2
6
6.4
1
2.2
0
2.5
4
3.9
0
NM
IJ
5.2
9
0.0
63
0
.13
6
.98
0
.09
2
0.1
8
2.3
2
0.0
28
0
.06
2
.53
0
.03
0
0.0
6
4.4
8
0.0
57
0
.11
ce
rtifie
d v
alu
e
4.1
4
0
.37
6
.45
0.1
8
2.2
08
0.0
73
2
.50
9
0
.08
7
4.0
1
0
.91
P
age
12 o
f 47
Fig
ure
6:
Ma
ss f
ract
ion
of
targ
et a
na
lyte
s in
K5
0a
so
il.
Sym
bo
ls:
mea
n o
f si
x d
eter
min
ati
on
s a
s re
po
rted
by
the
pa
rtic
ipa
nts
, u
nce
rta
inty
ba
rs:
exp
an
ded
un
cert
ain
ty 9
5%
co
nfi
den
ce i
nte
rva
l a
s re
po
rted
by
the
pa
rtic
ipa
nts
, b
lack
so
lid
an
d d
ash
ed l
ines
: K
CR
V a
nd
95
% c
on
fid
ence
in
terv
al
of
the
KC
RV
Ph
en
an
thre
ne
in
K5
0a
so
il
12
13
14
15
16
17
GL
INMETRO
BAM
CENAM
KRISS
IRMM
LGC
NIST
NMIJ
LNE
mass fraction µg/g
Flu
ora
nth
en
e in
K5
0a
so
il
13
14
15
16
17
BAM
KRISS
IRMM
INMETRO
GL
CENAM
LGC
NMIJ
NIST
LNE
mass fraction µg/g
B[a
]A in
K5
0a
so
il
5,3
5,8
6,3
IRMM
CENAM
BAM
LGC
INMETRO
NIST
KRISS
GL
NMIJ
LNE
mass fraction µg/g
B[a
]P in
K5
0a
so
il
4,3
4,8
5,3
5,8
IRMM
KRISS
BAM
GL
NIST
CENAM
NMIJ
INMETRO
LGC
LNE
mass fraction µg/g
P
age
13 o
f 47
B[g
hi ]
P in
K5
0a
so
il
4,4
4,9
5,4
5,9
IRMM
KRISS
BAM
CENAM
GL
LGC
NIST
INMETRO
NMIJ
LNE
mass fraction µg/g
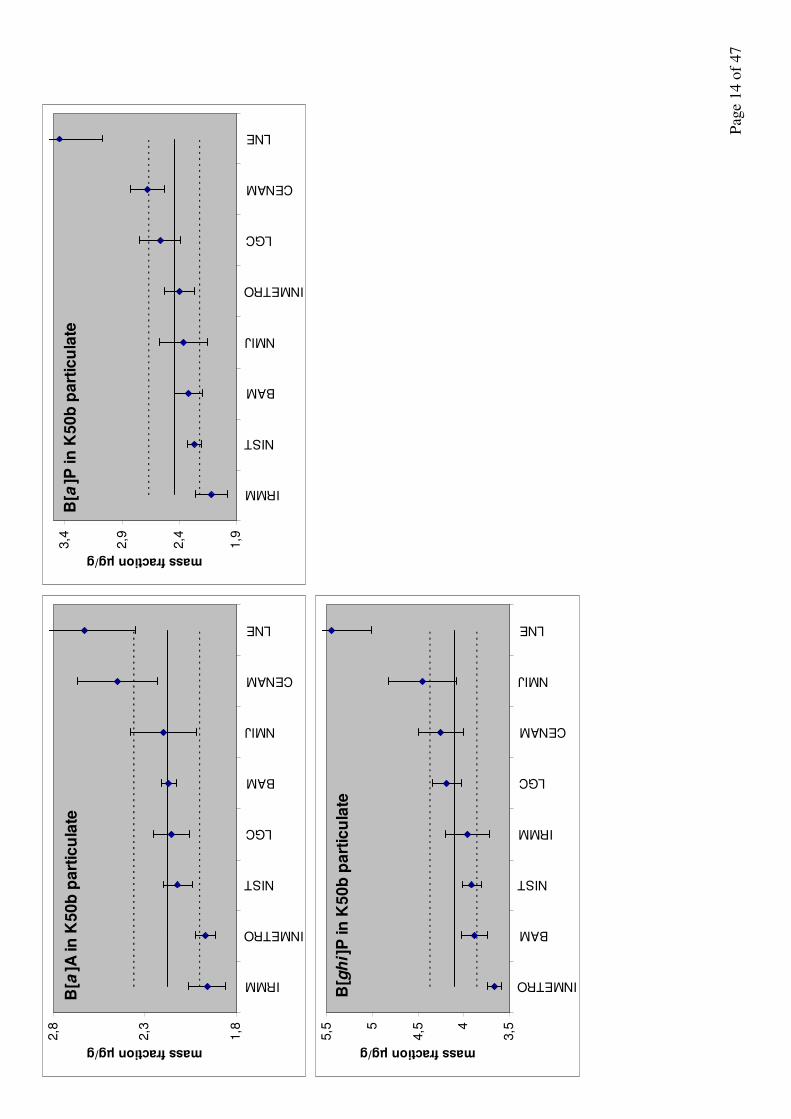
F
igu
re 7
: M
ass
fra
ctio
n o
f ta
rget
an
aly
tes
in K
50b
pa
rtic
ula
te.
Sym
bo
ls:
mea
n o
f si
x d
eter
min
ati
on
s a
s re
po
rted
by
the
pa
rtic
ipa
nts
, u
nce
rta
inty
ba
rs:
exp
an
ded
un
cert
ain
ty 9
5%
co
nfi
den
ce i
nte
rva
l a
s re
po
rted
by
the
pa
rtic
ipa
nts
, b
lack
so
lid
an
d d
ash
ed l
ines
: K
CR
V a
nd
95
% c
on
fid
ence
in
terv
al
of
the
KC
RV
Ph
en
an
thre
ne
in
K5
0b
pa
rtic
ula
te
3,7
4,7
5,7
6,7
INMETRO
BAM
NIST
CENAM
IRMM
LGC
NMIJ
LNE
mass fraction µg/g
Flu
ora
nth
en
e in
K5
0b
pa
rtic
ula
te
678
INMETRO
IRMM
NIST
BAM
CENAM
LGC
NMIJ
LNE
mass fraction µg/g
P
age
14 o
f 47
B[a
]A in
K5
0b
pa
rtic
ula
te
1,8
2,3
2,8
IRMM
INMETRO
NIST
LGC
BAM
NMIJ
CENAM
LNE
mass fraction µg/gB
[a]P
in
K5
0b
pa
rtic
ula
te
1,9
2,4
2,9
3,4
IRMM
NIST
BAM
NMIJ
INMETRO
LGC
CENAM
LNE
mass fraction µg/g
B[g
hi ]
P in
K5
0b
pa
rtic
ula
te
3,54
4,55
5,5
INMETRO
BAM
NIST
IRMM
LGC
CENAM
NMIJ
LNE
mass fraction µg/g
P
age
15 o
f 47
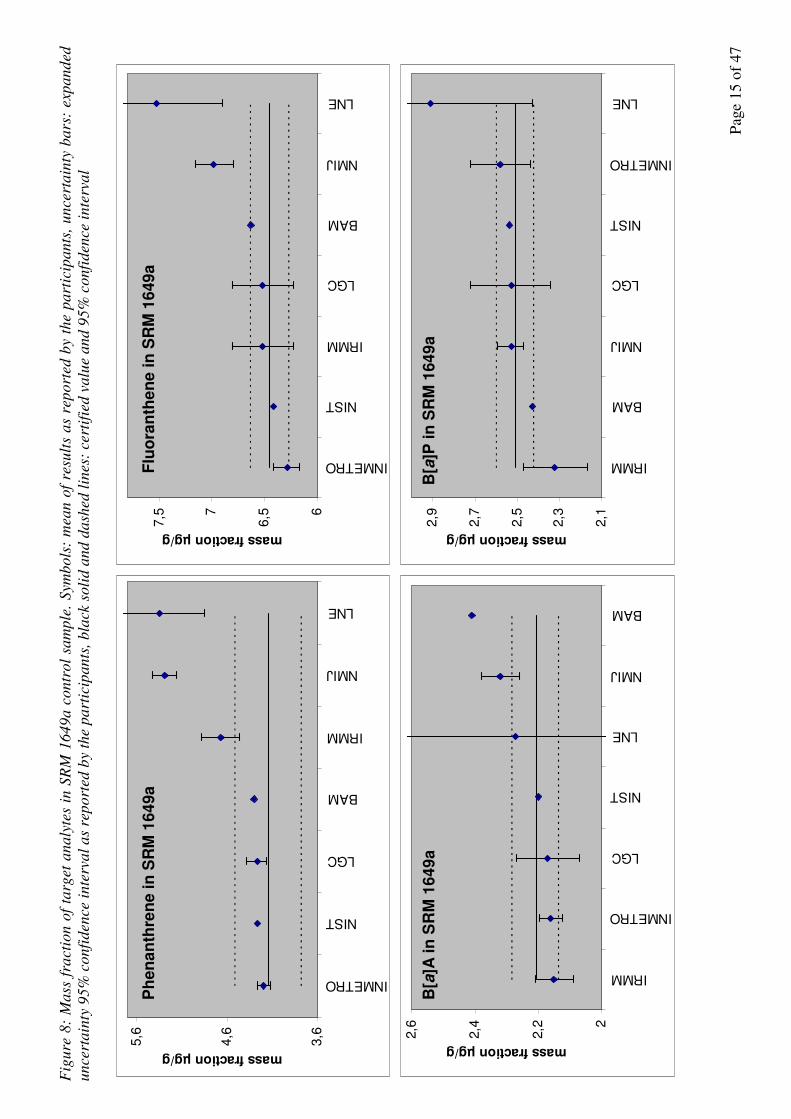
Fig
ure
8:
Ma
ss f
ract
ion
of
targ
et a
na
lyte
s in
SR
M 1
64
9a
co
ntr
ol
sam
ple
. S
ymb
ols
: m
ean
of
resu
lts
as
rep
ort
ed b
y t
he
pa
rtic
ipa
nts
, u
nce
rta
inty
ba
rs:
exp
an
ded
un
cert
ain
ty 9
5%
co
nfi
den
ce i
nte
rva
l a
s re
po
rted
by
the
pa
rtic
ipa
nts
, b
lack
so
lid
an
d d
ash
ed l
ines
: ce
rtif
ied
va
lue
an
d 9
5%
co
nfi
den
ce i
nte
rva
l
3,6
4,6
5,6
INMETRO
NIST
LGC
BAM
IRMM
NMIJ
LNE
mass fraction µg/g
6
6,57
7,5
INMETRO
NIST
IRMM
LGC
BAM
NMIJ
LNE
mass fraction µg/g
2
2,2
2,4
2,6
IRMM
INMETRO
LGC
NIST
LNE
NMIJ
BAM
mass fraction µg/g
2,1
2,3
2,5
2,7
2,9
IRMM
BAM
NMIJ
LGC
NIST
INMETRO
LNE
mass fraction µg/g
Ph
en
an
thre
ne
in
SR
M 1
64
9a
F
luo
ran
the
ne
in
SR
M 1
649
a
B[a
]A i
n S
RM
16
49
a
B[a
]P i
n S
RM
164
9a
P
age
16 o
f 47
3
3,54
4,55
5,5
INMETRO
NIST
BAM
LGC
IRMM
NMIJ
LNE
mass fraction µg/g
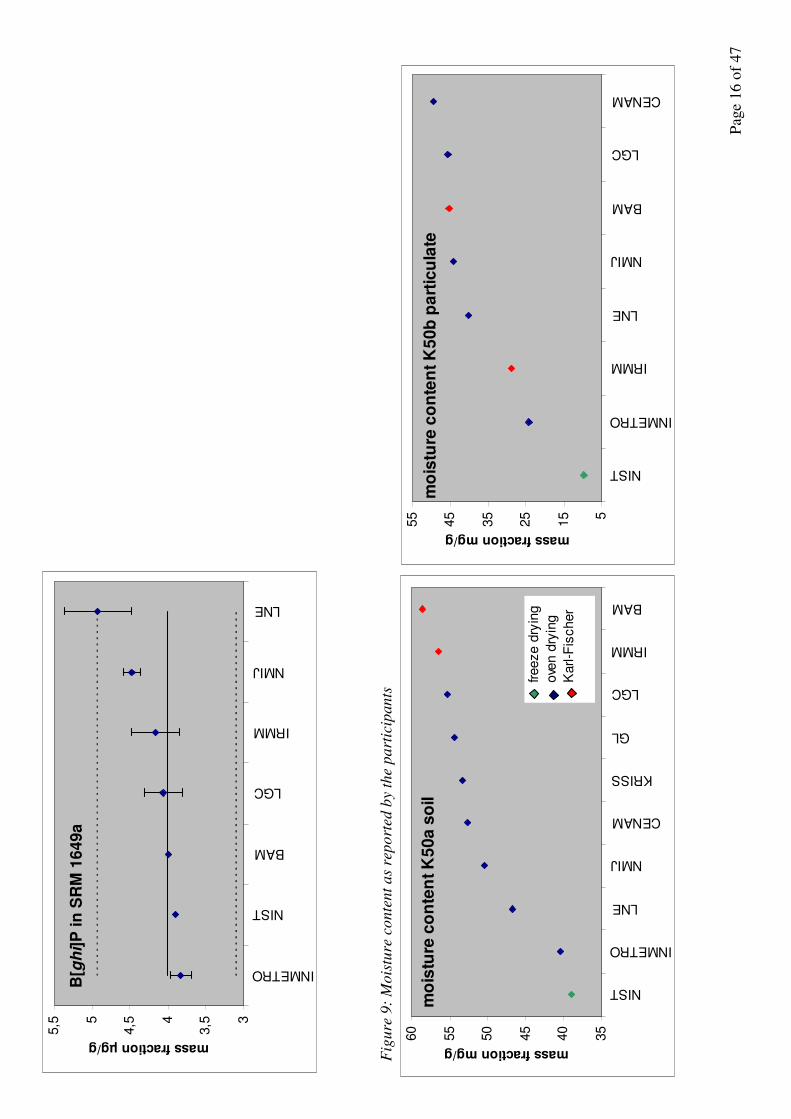
Fig
ure
9:
Mo
istu
re c
on
ten
t a
s re
po
rted
by
the
pa
rtic
ipa
nts
mo
istu
re c
on
ten
t K
50
a s
oil
35
40
45
50
55
60
NIST
INMETRO
LNE
NMIJ
CENAM
KRISS
GL
LGC
IRMM
BAM
mass fraction mg/g
freeze d
ryin
g
ove
n d
ryin
g
Karl-F
ischer
mo
istu
re c
on
ten
t K
50
b p
art
icu
late
5
15
25
35
45
55
NIST
INMETRO
IRMM
LNE
NMIJ
BAM
LGC
CENAM
mass fraction mg/g
B[g
hi]
P i
n S
RM
16
49a

Page 17 of 47
Table 8: Moisture content in mg/g as reported by the participants
* The moisture content was reported separately for the two sample jars. For the control sample NIST SRM 1649a, INMETRO, LGC and NMIJ used the moisture content indicated on the certificate. IRMM used the moisture content obtained for K50b.
5.1. Basic statistics and outlier tests The basic statistics for the data obtained on the three matrices are given in the following tables:
Table 9: Basic statistics for K50 results
Control sample
Soil sample
Air particulate
The basic statistics reveal a considerable deviation from normality for a number of analytes in all three matrices: Means and medians are different, and skewness and kurtosis significant, in
laboratory K50a soil K50b particulate NIST SRM 1649a
BAM 58.6 45.3 47.1
CENAM 52.6 49.55
GL 54.46/54.36*
INMETRO 40.52 24.29
IRMM 56.4 28.8
KRISS 53.32
LGC 55.4 45.6
LNE 46.8 40.2
NIST 39.0 9.7 12.3
NMIJ 50.8/50.0* 44.2/44.2*
Page 18 of 47
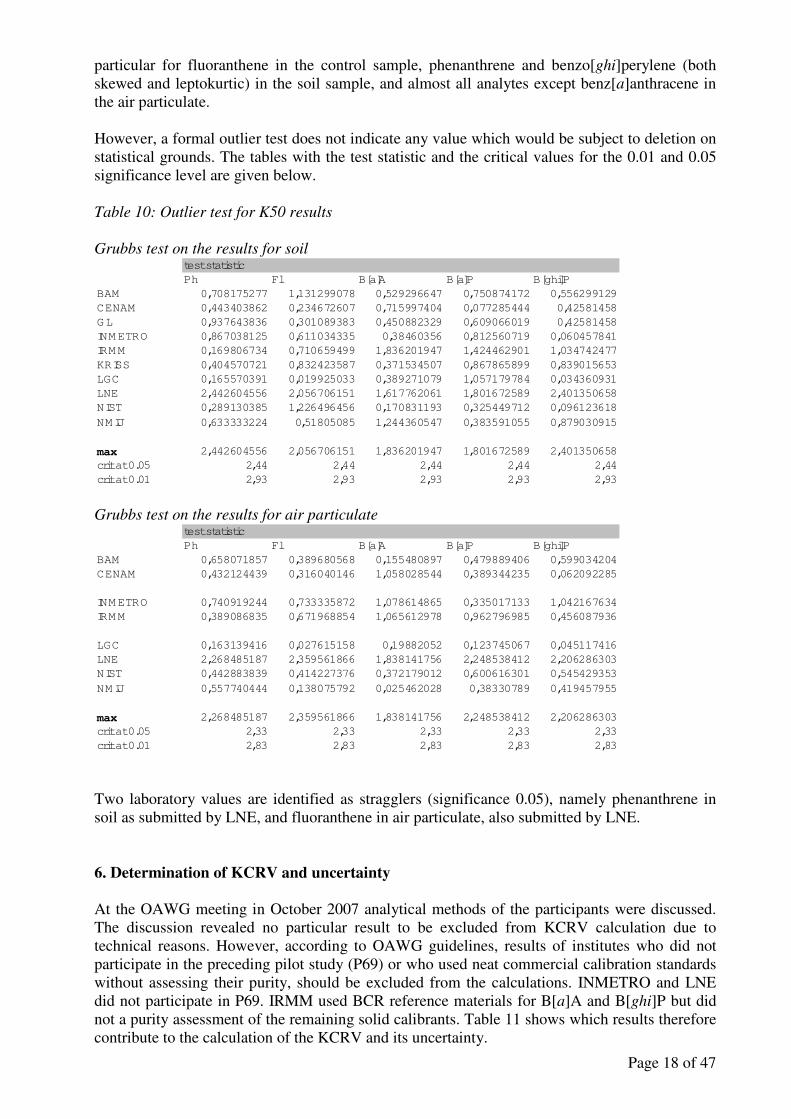
particular for fluoranthene in the control sample, phenanthrene and benzo[ghi]perylene (both skewed and leptokurtic) in the soil sample, and almost all analytes except benz[a]anthracene in the air particulate. However, a formal outlier test does not indicate any value which would be subject to deletion on statistical grounds. The tables with the test statistic and the critical values for the 0.01 and 0.05 significance level are given below.
Table 10: Outlier test for K50 results
Grubbs test on the results for soil test statistic
Ph Fl B[a]A B[a]P B[ghi]P
BAM 0,708175277 1,131299078 0,529296647 0,750874172 0,556299129
CENAM 0,443403862 0,234672607 0,715997404 0,077285444 0,42581458
GL 0,937643836 0,301089383 0,450882329 0,609066019 0,42581458
INM ETRO 0,867038125 0,611034335 0,38460356 0,812560719 0,060457841
IRM M 0,169806734 0,710659499 1,836201947 1,424462901 1,034742477
KRISS 0,404570721 0,832423587 0,371534507 0,867865899 0,839015653
LGC 0,165570391 0,019925033 0,389271079 1,057179784 0,034360931
LNE 2,442604556 2,056706151 1,617762061 1,801672589 2,401350658
NIST 0,289130385 1,226496456 0,170831193 0,325449712 0,096123618
NM IJ 0,633333224 0,51805085 1,244360547 0,383591055 0,879030915
max 2,442604556 2,056706151 1,836201947 1,801672589 2,401350658
crit at 0.05 2,44 2,44 2,44 2,44 2,44
crit at 0.01 2,93 2,93 2,93 2,93 2,93
Grubbs test on the results for air particulate test statistic
Ph Fl B[a]A B[a]P B[ghi]P
BAM 0,658071857 0,389680568 0,155480897 0,479889406 0,599034204
CENAM 0,432124439 0,316040146 1,058028544 0,389344235 0,062092285
INM ETRO 0,740919244 0,733335872 1,078614865 0,335017133 1,042167634
IRM M 0,389086835 0,671968854 1,065612978 0,962796985 0,456087936
LGC 0,163139416 0,027615158 0,19882052 0,123745067 0,045117416
LNE 2,268485187 2,359561866 1,838141756 2,248538412 2,206286303
NIST 0,442883839 0,414227376 0,372179012 0,600616301 0,545429353
NM IJ 0,557740444 0,138075792 0,025462028 0,38330789 0,419457955
max 2,268485187 2,359561866 1,838141756 2,248538412 2,206286303
crit at 0.05 2,33 2,33 2,33 2,33 2,33
crit at 0.01 2,83 2,83 2,83 2,83 2,83 Two laboratory values are identified as stragglers (significance 0.05), namely phenanthrene in soil as submitted by LNE, and fluoranthene in air particulate, also submitted by LNE.
6. Determination of KCRV and uncertainty
At the OAWG meeting in October 2007 analytical methods of the participants were discussed. The discussion revealed no particular result to be excluded from KCRV calculation due to technical reasons. However, according to OAWG guidelines, results of institutes who did not participate in the preceding pilot study (P69) or who used neat commercial calibration standards without assessing their purity, should be excluded from the calculations. INMETRO and LNE did not participate in P69. IRMM used BCR reference materials for B[a]A and B[ghi]P but did not a purity assessment of the remaining solid calibrants. Table 11 shows which results therefore contribute to the calculation of the KCRV and its uncertainty.

Page 19 of 47
Table 11: Results which contribute (+) or do not contribute (-) to the KCRV, number of
contributing results n and coverage factor k (95% confidence)
K50a soil K50b particulate
Ph Fl B[a]A B[a]P B[ghi]P Ph Fl B[a]A B[a]P B[ghi]P
BAM + + + + + + + + + +
CENAM + + + + + + + + + +
GL + + + + + not determined
INMETRO - - - - - - - - - -
IRMM - - + - + - - + - +
KRISS + + + + + not determined
LGC + + + + + + + + + +
LNE - - - - - - - - - -
NIST + + + + + + + + + +
NMIJ + + + + + + + + + +
n
k
7
2.45
7
2.45
8
2.36
7
2.45
8
2.36
5
2.78
5
2.78
6
2.57
5
2.78
6
2.57
OAWG agreed to use the arithmetic mean of eligible participant’s results for the KCRV and the standard deviation of that mean for the standard uncertainty of KCRV. Tables 5 and 6 and figures 6 and 7 display the KCRVs and their standard and expanded uncertainty at 95% confidence level together with the analytical results. One of the coordinating labs (BAM) developed an alternative approach for the KCRV which is entirely based on performance criteria and does not refer to any formal criterion. It was discussed by OAWG and it was decided to add this concept as an appendix (see appendix 2) to this report. 7. Degrees of equivalence
The degree of equivalence Di of laboratory i relative to the KCRV xR is given by a pair of terms,
Rii xxD −= (4)
and its expanded uncertainty UD at a 95% level of confidence
22RiD UUU += (5)
Xi is the result of laboratory i. Ui and UR are the expanded uncertainties of xi and xR, respectively. Tables 12 and 13 display the degrees of equivalence of all participants for the soil and particulate matter sample. Pair-wise degrees of equivalence between two laboratories were not computed for this key comparison.
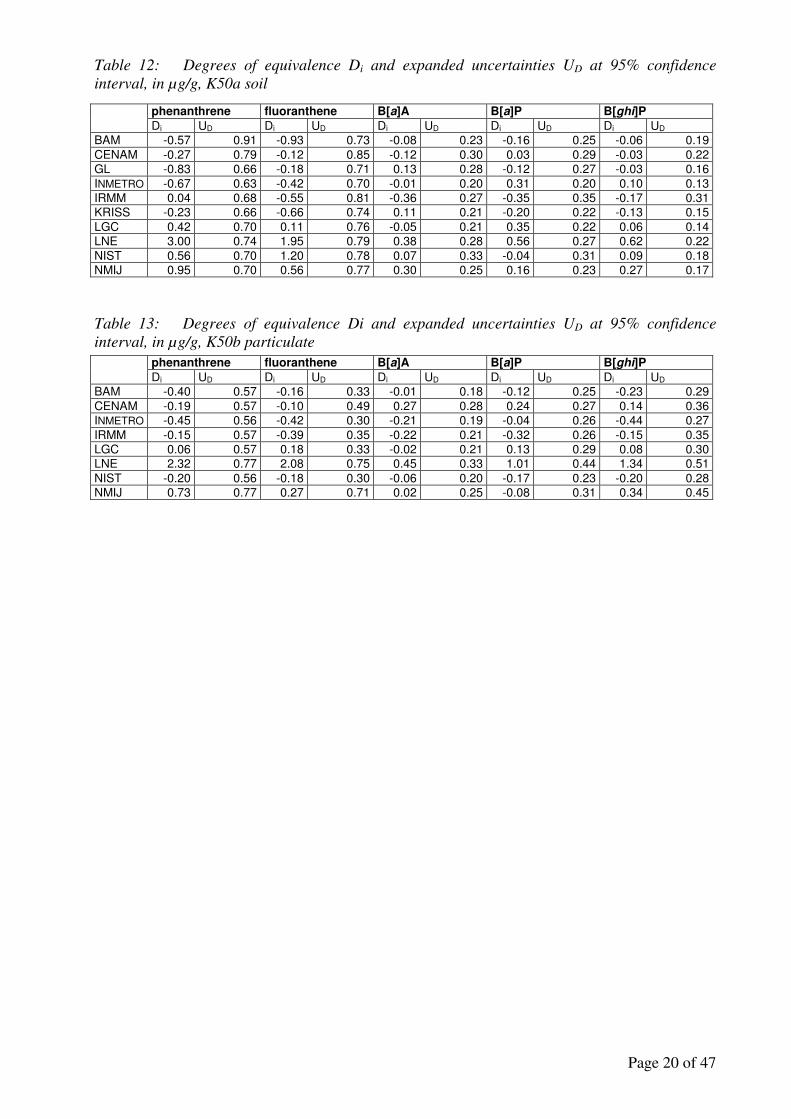
Page 20 of 47
Table 12: Degrees of equivalence Di and expanded uncertainties UD at 95% confidence interval, in µg/g, K50a soil
Table 13: Degrees of equivalence Di and expanded uncertainties UD at 95% confidence
interval, in µg/g, K50b particulate
phenanthrene fluoranthene B[a]A B[a]P B[ghi]P
Di UD Di UD Di UD Di UD Di UD
BAM -0.57 0.91 -0.93 0.73 -0.08 0.23 -0.16 0.25 -0.06 0.19
CENAM -0.27 0.79 -0.12 0.85 -0.12 0.30 0.03 0.29 -0.03 0.22
GL -0.83 0.66 -0.18 0.71 0.13 0.28 -0.12 0.27 -0.03 0.16
INMETRO -0.67 0.63 -0.42 0.70 -0.01 0.20 0.31 0.20 0.10 0.13
IRMM 0.04 0.68 -0.55 0.81 -0.36 0.27 -0.35 0.35 -0.17 0.31
KRISS -0.23 0.66 -0.66 0.74 0.11 0.21 -0.20 0.22 -0.13 0.15
LGC 0.42 0.70 0.11 0.76 -0.05 0.21 0.35 0.22 0.06 0.14
LNE 3.00 0.74 1.95 0.79 0.38 0.28 0.56 0.27 0.62 0.22
NIST 0.56 0.70 1.20 0.78 0.07 0.33 -0.04 0.31 0.09 0.18
NMIJ 0.95 0.70 0.56 0.77 0.30 0.25 0.16 0.23 0.27 0.17
phenanthrene fluoranthene B[a]A B[a]P B[ghi]P
Di UD Di UD Di UD Di UD Di UD
BAM -0.40 0.57 -0.16 0.33 -0.01 0.18 -0.12 0.25 -0.23 0.29
CENAM -0.19 0.57 -0.10 0.49 0.27 0.28 0.24 0.27 0.14 0.36
INMETRO -0.45 0.56 -0.42 0.30 -0.21 0.19 -0.04 0.26 -0.44 0.27
IRMM -0.15 0.57 -0.39 0.35 -0.22 0.21 -0.32 0.26 -0.15 0.35
LGC 0.06 0.57 0.18 0.33 -0.02 0.21 0.13 0.29 0.08 0.30
LNE 2.32 0.77 2.08 0.75 0.45 0.33 1.01 0.44 1.34 0.51
NIST -0.20 0.56 -0.18 0.30 -0.06 0.20 -0.17 0.23 -0.20 0.28
NMIJ 0.73 0.77 0.27 0.71 0.02 0.25 -0.08 0.31 0.34 0.45

P
age
21 o
f 47
Fig
ure
10
: D
egre
es o
f eq
uiv
ale
nce
an
d e
xpa
nd
ed u
nce
rta
inti
es a
t 9
5%
co
nfi
den
ce i
nte
rva
l fo
r K
50
a s
oil
, u
nif
orm
sca
lin
g o
f th
e y-
axi
s
Ph
en
an
thre
ne
in
K5
0a
so
il
-1,5
0
-0,5
0
0,5
0
1,5
0
2,5
0
GL
INMETRO
BAM
CENAM
KRISS
IRMM
LGC
NIST
NMIJ
LNE
Di µg/g
Flu
ora
nth
en
e in
K5
0a
so
il
-1,5
-0,5
0,5
1,5
2,5
BAM
KRISS
IRMM
INMETRO
GL
CENAM
LGC
NMIJ
NIST
LNE
Di µg/g
B[a
]A in
K5
0a
so
il
-1,5
-0,5
0,5
1,5
2,5
IRMM
CENAM
BAM
LGC
INMETRO
NIST
KRISS
GL
NMIJ
LNE
Di µg/g
B[a
]P in
K5
0a
so
il
-1,5
-0,5
0,5
1,5
2,5
IRMM
KRISS
BAM
GL
NIST
CENAM
NMIJ
INMETRO
LGC
LNE
Di µg/g
P
age
22 o
f 47
B[g
hi ]
P in
K5
0a
so
il
-1,5
-0,5
0,5
1,5
2,5
IRMM
KRISS
BAM
CENAM
GL
LGC
NIST
INMETRO
NMIJ
LNE
Di µg/g
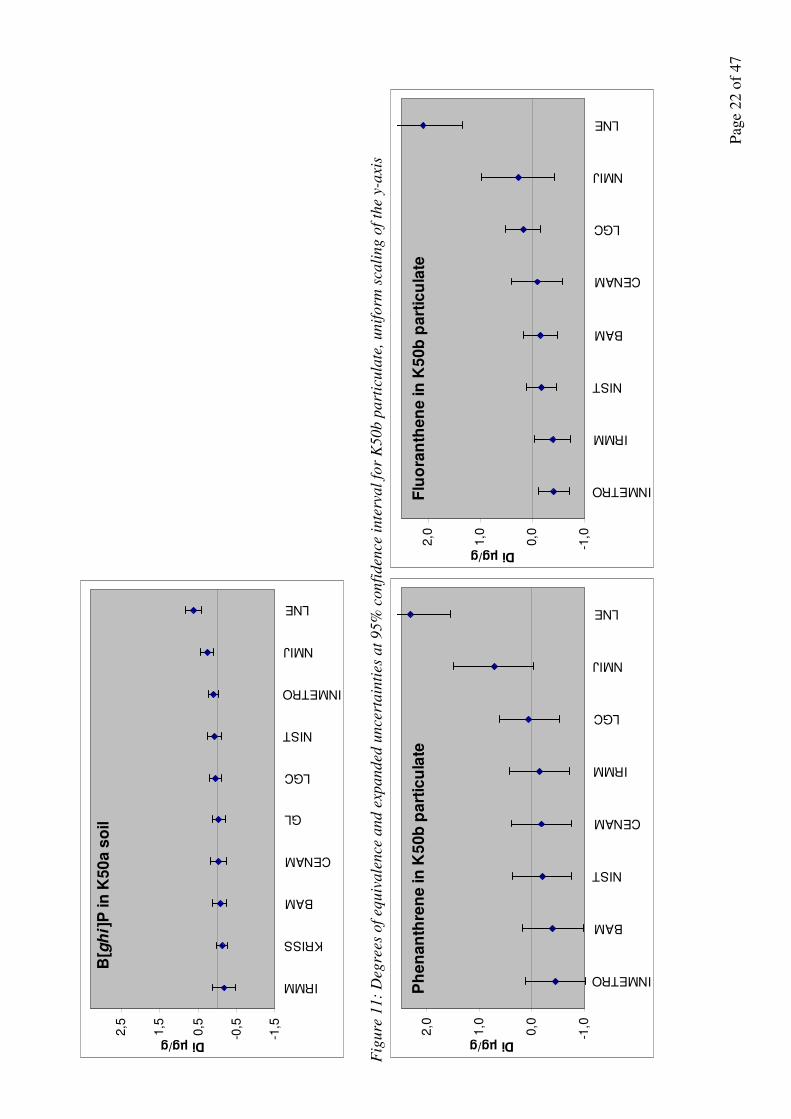
F
igu
re 1
1:
Deg
rees
of
equ
iva
len
ce a
nd
exp
an
ded
un
cert
ain
ties
at
95
% c
on
fid
ence
in
terv
al
for
K5
0b
pa
rtic
ula
te,
un
ifo
rm s
cali
ng
of
the
y-a
xis
Ph
en
an
thre
ne
in
K5
0b
pa
rtic
ula
te
-1,0
0,0
1,0
2,0
INMETRO
BAM
NIST
CENAM
IRMM
LGC
NMIJ
LNE
Di µg/g
Flu
ora
nth
en
e in
K5
0b
pa
rtic
ula
te
-1,0
0,0
1,0
2,0
INMETRO
IRMM
NIST
BAM
CENAM
LGC
NMIJ
LNE
Di µg/g

P
age
23 o
f 47
B[a
]A in
K5
0b
pa
rtic
ula
te
-1,0
0,0
1,0
2,0
IRMM
INMETRO
NIST
LGC
BAM
NMIJ
CENAM
LNE
Di µg/g
B[a
]P in
K5
0b
pa
rtic
ula
te
-1,0
0,0
1,0
2,0
IRMM
NIST
BAM
NMIJ
INMETRO
LGC
CENAM
LNE
Di µg/g
B[g
hi ]
P in
K5
0b
pa
rtic
ula
te
-1,0
0,0
1,0
2,0
INMETRO
BAM
NIST
IRMM
LGC
CENAM
NMIJ
LNE
Di µg/g
Page 24 of 47
8. Uncertainty estimation The exercise instructions requested a complete uncertainty budget. A variety of different approaches were used by the participants. The following sources of uncertainty were considered by the majority of labs:
- overall method precision, expressed as standard deviation of the mean of replicate measurements
- concentration of the calibration standard (if a solution was used) - purity of the calibration standard (if neat chemicals were used) - dry mass determination
Additional contributions from weightings were considered by LGC, LNE, INMETRO and NMIJ. NMIJ also included sample preparation efficiency and, for the particulate sample, a contribution for inhomogeneity between the two sample jars. The majority of participants calculated effective degrees of freedom according to the Welch-Satterthwaite equation, resulting in coverage factors between 2 and 3 to give 95% confidence. GL and NMIJ used a coverage factor of 2. Uncertainty budgets, as reported by the participants, are summarized in appendix 3. 9. Additional investigations
NMIJ results for all samples including the control are systematically higher than the results of the majority of participants or the certified value of the control sample. At the OAWG meeting in November 2007, NMIJ explained this finding with their more drastic extraction conditions (higher temperature and pressure of ASE). NMIJ also presented additional data on the influence of temperature and pressure on extraction efficiency of the soil sample which support this assumption. BAM and NIST agreed to perform additional measurements on the influence of ASE conditions to clarify this finding. Figure 12 displays results of BAM obtained with the K50a soil sample and figure 13 displays results of NIST obtained with the K50b particulate sample at different extraction temperatures and pressure.

Page 25 of 47
Figure 12: amount of substance, normalized to the value at 110oC/140 bar, obtained at different
ASE temperatures, two determinations per temperature, bars are the mean, error bars the two
separate results.
Figure 13: amount of substance, normalized to the value at 100
oC/140 bar, obtained at different
ASE temperature, three determinations per temperature, bars are the mean, error bars the
standard deviation.
Results for the soil sample could be treated by regression analysis. For the air particulate, only measurements at 100°C and 200°C were available. Statistically significant changes have been observed for
- phenanthrene and benz[a]anthracene in the soil sample leading to potentially higher values at higher temperatures and therefore pointing into the claimed direction, and
- benz[a]anthracene and benzo[a]pyrene in the particulate but leading to lower values at higher extraction temperatures, i.e. pointing into the opposite direction.
K50a soil
0,8
0,9
1
1,1
1,2
Ph Fl B[a]A B[a]P B[ghi]P
rela
tiv
e a
mo
un
t o
f s
ub
sta
nc
e80C /140bar
110C/140bar
140C/140bar
170C/140bar
200C/140bar
200C/200bar
K50b particulate
0,8
0,85
0,9
0,95
1
1,05
1,1
Ph F l B[a]A B[a]P B[ghi]P
rela
tiv
e a
mo
un
t o
f s
ub
sta
nc
e
100C /140bar
200C/140bar

Page 26 of 47
For the study on the soil samples, the F statistic is given in the table below, and the regression parameters intercept and slope and their uncertainties for those analytes with significant changes. Only results obtained at 140 bar and different temperatures (figure 12) were included in the regression. Table 14: Results of the regression analysis for the soil sample
The data do not show a uniform tendency of PAH concentration with ASE temperature. Instead, it is dependent on the type of sample and analyte. Furthermore, at higher temperatures, processes like decomposition or conversion of higher molecular PAHs into lower molecular PAHs or pyrolysis of organic matter can not be completely excluded. A peculiar smell of burnt organic matter was observed for the soil extracts at 200oC. The total organic carbon content of the soil is rather high ((18.1±0.3) mg/g). Because of these findings, OAWG agreed to use the mean of eligible participant’s results instead of the median as KCRV. This includes the component of any temperature differences observed and assumes all values are credible. NMIJ also reported a between bottle inhomogeneity of the particulate matter sample of about 4% to 5% depending on the analyte. This could not be confirmed by additional measurements by NIST (figure 14). The material is a candidate NIST CRM and has undergone extensive assessment when bottled, and this degree of heterogeneity was not observed. Figure 14: Additional homogeneity assessment for K50b particulate, 2 determinations out of 10
bottles, 125 mg sample intake
0
1000
2000
3000
4000
5000
6000
7000
0 500 1000 1500 2000 2500 3000 3500 4000
bottle#
conc
(ng/
g)
phenanthrene
fluoranthene
B[a]A
B[a]P
B[ghi]P
Page 27 of 47
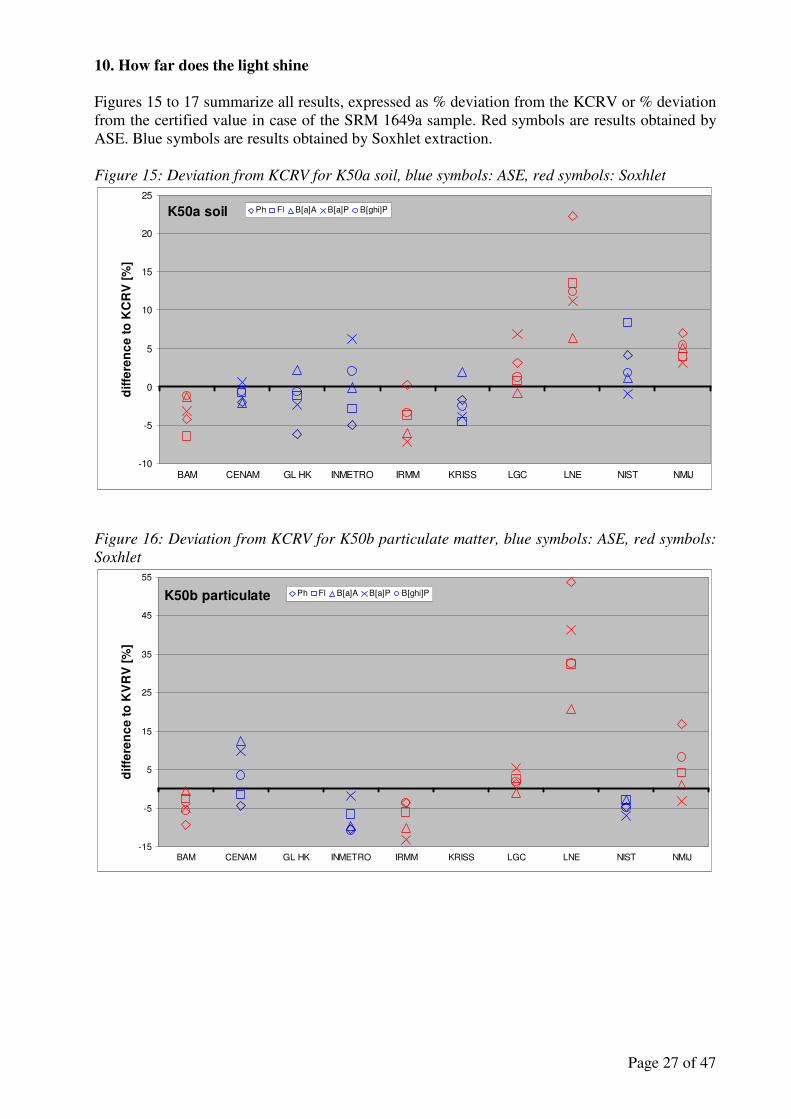
10. How far does the light shine Figures 15 to 17 summarize all results, expressed as % deviation from the KCRV or % deviation from the certified value in case of the SRM 1649a sample. Red symbols are results obtained by ASE. Blue symbols are results obtained by Soxhlet extraction. Figure 15: Deviation from KCRV for K50a soil, blue symbols: ASE, red symbols: Soxhlet
K50a soil
-10
-5
0
5
10
15
20
25
BAM CENAM GL HK INMETRO IRMM KRISS LGC LNE NIST NMIJ
dif
fere
nc
e t
o K
CR
V [
%]
Ph Fl B[a]A B[a]P B[ghi]P
Figure 16: Deviation from KCRV for K50b particulate matter, blue symbols: ASE, red symbols:
Soxhlet
K50b particulate
-15
-5
5
15
25
35
45
55
BAM CENAM GL HK INMETRO IRMM KRISS LGC LNE NIST NMIJ
dif
fere
nc
e t
o K
VR
V [
%]
Ph Fl B[a]A B[a]P B[ghi]P

Page 28 of 47
Figure 17: Deviation from the certified value for SRM 1649a control sample, blue symbols: ASE,
red symbols: Soxhlet
control sample SRM 1649a
-10
-5
0
5
10
15
20
25
30
BAM CENAM GL HK INMETRO IRMM KRISS LGC LNE NIST NMIJ
dif
fere
nc
e t
o t
he
ce
rtif
ied
va
lue
[%
] Ph Fl B[a]A B[a]P B[ghi]P
With a few exceptions, participants agree within the range ± 5% from the KCRV for the soil and ± 10% from the KCRV for the particulate in analysing five selected PAHs. CMC claims based on measurements in this study could be applied to other solid matrices (e.g. sediment, sewage sludge, waste) and to extracts of these matrices provided that the concentration range is similar and extraction/clean-up steps are similar to the ones performed in this study. When extending the claim to other solid matrices, extraction efficiency should be studied and it should be demonstrated that extraction efficiency effects are negligible for the particular material. CMC claims based on measurements in this study could be applied to other PAHs provided that the concentration range is similar to the one in this study.

Page 29 of 47
Appendix 1: Revised INMETRO data
After initial discussion of the results at the OAWG meeting in Braunschweig in October 2007, INMETRO assessed the purity of their commercial neat chemical PAH standards and recalculated their analytical results with respect to these purity values. Purity assessment was done by GC-FID on two columns with different polarity. Revised data were submitted to the coordinators in February 2008. These data are summarized below. K50a soil mean combined
uncertainty expanded unc. (95% CI)
[µg/g] [µg/g] [µg/g] Phenanthrene 12.74 0.0689 0.14 Fluoranthene 13.97 0.0699 0.14 Benz[a]anthracene 5.871 0.0319 0.067 Benzo[a]pyrene 5.281 0.0305 0.063 Benzo[ghi]perylene 5.054 0.0241 0.049 K50b particulate mean combined
uncertainty expanded unc. (95% CI)
[µg/g] [µg/g] [µg/g] Phenanthrene 3.853 0.0430 0.095 Fluoranthene 5.99 0.0550 0.12 Benz[a]anthracene 1.957 0.0250 0.054 Benzo[a]pyrene 2.38 0.0594 0.13 Benzo[ghi]perylene 3.632 0.0359 0.078 Control SRM 1649a mean combined
uncertainty expanded unc. (95% CI)
[µg/g] [µg/g] [µg/g] Phenanthrene 4.166 0.0312 0.074 Fluoranthene 6.27 0.0500 0.12 Benz[a]anthracene 2.146 0.0172 0.037 Benzo[a]pyrene 2.57 0.0571 0.14 Benzo[ghi]perylene 3.79 0.0598 0.14 Uncertainties: K50a soil
Sources of uncertainty Ph Fl B[a]A B[a]P B[ghi]P repeatability of area 3.58E-05 3.59E-08 2.02E-08 1.76E-08 1.54E-08 mass of sample 8.00E-08 8.77E-11 3.68E-11 3.31E-11 3.17E-11 mass of IS added into the sample
2.41E-08 2.52E-08 3.99E-08 2.58E-08 2.47E-08
repeatability of analysis
0.04012 0.04660 0.02679 0.02328 0.01522
calibration curve 0.04592 0.03928 0.009306 0.01475 0.01384 purity of standard 0.03135 0.03427 0.01452 0.01298 0.01251
Page 30 of 47
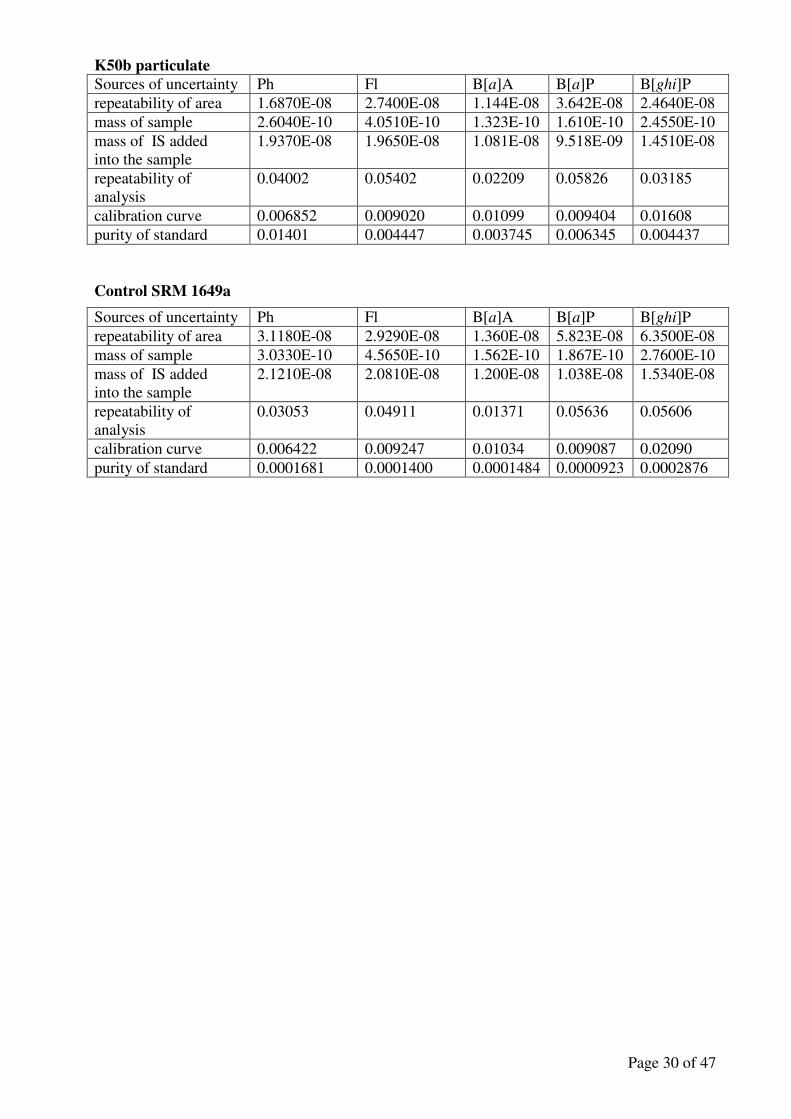
K50b particulate
Sources of uncertainty Ph Fl B[a]A B[a]P B[ghi]P repeatability of area 1.6870E-08 2.7400E-08 1.144E-08 3.642E-08 2.4640E-08 mass of sample 2.6040E-10 4.0510E-10 1.323E-10 1.610E-10 2.4550E-10 mass of IS added into the sample
1.9370E-08 1.9650E-08 1.081E-08 9.518E-09 1.4510E-08
repeatability of analysis
0.04002 0.05402 0.02209 0.05826 0.03185
calibration curve 0.006852 0.009020 0.01099 0.009404 0.01608 purity of standard 0.01401 0.004447 0.003745 0.006345 0.004437 Control SRM 1649a
Sources of uncertainty Ph Fl B[a]A B[a]P B[ghi]P repeatability of area 3.1180E-08 2.9290E-08 1.360E-08 5.823E-08 6.3500E-08 mass of sample 3.0330E-10 4.5650E-10 1.562E-10 1.867E-10 2.7600E-10 mass of IS added into the sample
2.1210E-08 2.0810E-08 1.200E-08 1.038E-08 1.5340E-08
repeatability of analysis
0.03053 0.04911 0.01371 0.05636 0.05606
calibration curve 0.006422 0.009247 0.01034 0.009087 0.02090 purity of standard 0.0001681 0.0001400 0.0001484 0.0000923 0.0002876

Page 31 of 47
Appendix 2: Alternative Estimation of KCR value and uncertainty
1. Introduction
Degrees of equivalence (DoE) are a measure of laboratory performance and widely used for the assessment of CCQM key comparisons and pilot studies. In a wider sense, they serve as confirmation for CMC claims made by the corresponding laboratories. The DoE of a laboratory result Xlab is composed from two single values, namely the difference of the laboratory result and the reference value Xref, and the uncertainty of this difference. Both values can conveniently be combined into an En value according to
),(2)()(2)(2 22reflabreflab
labref
labref
labref
n
XXuXuXu
XX
XXu
XXE
⋅−+⋅
−=
−⋅
−= (1)
being ),( reflab XXu the covariance. The KCR value and uncertainty play a major part in the
assignment of DoE's and should thus be most reliable. Self-consistent data assessment following the Paule-Mandel [1] or Birge [2] approaches using weighted means and direct uncertainty propagation is not appropriate in the case of KC50 given the still considerable biases between laboratories, even in the largest-consistent-subset philosophy developed by Cox [3]. Basic ideas of the named approaches can however be taken on board, leading to the following principles of KCR value and uncertainty estimation:
(1) Only well-performing laboratories shall contribute to the KCR value and uncertainty. (2) The maximum possible number of well-performing laboratories (from the total number of
participants) shall be the basis for the KCR value and uncertainty. (3) Performance of a laboratory shall be assessed by its compatibility with the derived KCR
value and uncertainty. (4) Performance of a laboratory shall be assessed for all analytes and samples under
investigation. (5) Except in cases where considerable influence of a physical constraint is to be expected,
residual biases of the well-performing and thus contributing laboratories shall be random with decreasing with distance from the centre probabilities of occurrence for the set, i.e. follow a symmetric, bell-shaped distribution. The unbiased location estimator for the KCR value is the classical mean while the classical variance might over- or underestimate the dispersion (depending on the kurtosis of the distribution).
(6) Non-contributing laboratories are assigned a DoE referring to the KCR value and uncertainty defined by the contributing laboratories.
A measure of compatibility according to principle (3) is a statistic frequently called the zeta score ζ
)()( 22reflab
labref
lab
XuXu
XX
+
−=ζ (2)
which closely resembles the En value (except the sign and the factor of 2 in the denominator). Sums of a certain number ν of squared squared zeta scores follow a chi square distribution with ν degrees of freedom, a fact which will be used in assessing compatibility of laboratory values with the KCR value and uncertainty. Note that the test statistic for the (single) Grubbs outlier test is different from eqn. 2 since it refers to the standard deviation of the data distribution according to
Page 32 of 47
p
labref
labs
XXt
−= (3)
The value of this test statistic is then compared with the tabulated critical values for the Grubbs test. Requirement (4) is a consequence of the fact that the outcome of the KC shall underpin, in a representative manner, CMC claims for PAH measurements and possibly similar other environmental contaminants, but as a minimum for the 16 EPA PAH. A well-performing laboratory shall thus perform on all 5 selected analytes in the manner defined by requirement (3). An analyte-by-analyte inclusion or exclusion of laboratories to or from the group of contributing laboratories is not encouraged here. Requirement (5) mentions cases with a (physical) constraint. This refers to e.g. ultra-trace (or ultra-high purity) analysis and values obtained close to the LOQ of a method. It may also refer to methods including processes of considerable non-linearity (growth processes as e.g. involved in microbiological methods). In these cases, suitable data transformation is required before an assessment. Experience shows that for a (sub-)set of laboratory values complying with the requirements (3) and (4), most often the normality assumption cannot be rejected on statistical grounds, so not only the (valid for any symmetric distribution) mean but also the classical standard deviation are good estimators. Note that the requirement of bias randomness for the set of laboratory data does not alter the systematic character of the bias for the individual laboratory. Note also that this KCR value and uncertainty estimation is entirely based on performance criteria and does not refer to any formal criterion (NMI, designated lab, participation in the preceding pilot study etc.). 2. Scrutinising the data
Data as given in the KC50 draft A report have been submitted by the participating laboratories for 5 selected PAH in a control sample, a soil and in particulate matter. Numbers of participating laboratories were different for the three samples, with a maximum number for the soil matrix sample. Basic statistics reveal a considerable deviation from a normal distribution. A Grubbs outlier test according to eqn. (3) identifies the values of LNE for phenanthrene in soil and fluoranthene in air particulate as stragglers (see Table 10, clause 5.1.). 2.1. Checking laboratory performance
Pre-selection of contributing laboratories should identify laboratories revealing systematic bias for all analytes and all matrices. An influence of systematic bias is assumed if a laboratory reports low or high values consistently for all analyse under investigation. This may conveniently be illustrated by a cluster analysis using Euclidean distance as the metric. Laboratories consistently reporting low or high values will be grouped into a separate cluster. Furthermore, cluster analysis shows similarities or dissimilarities between the laboratories. Dendrograms using the 5 analyte values reported as the variables are shown below for the three samples. Ward linkage has been used for collating the clusters.
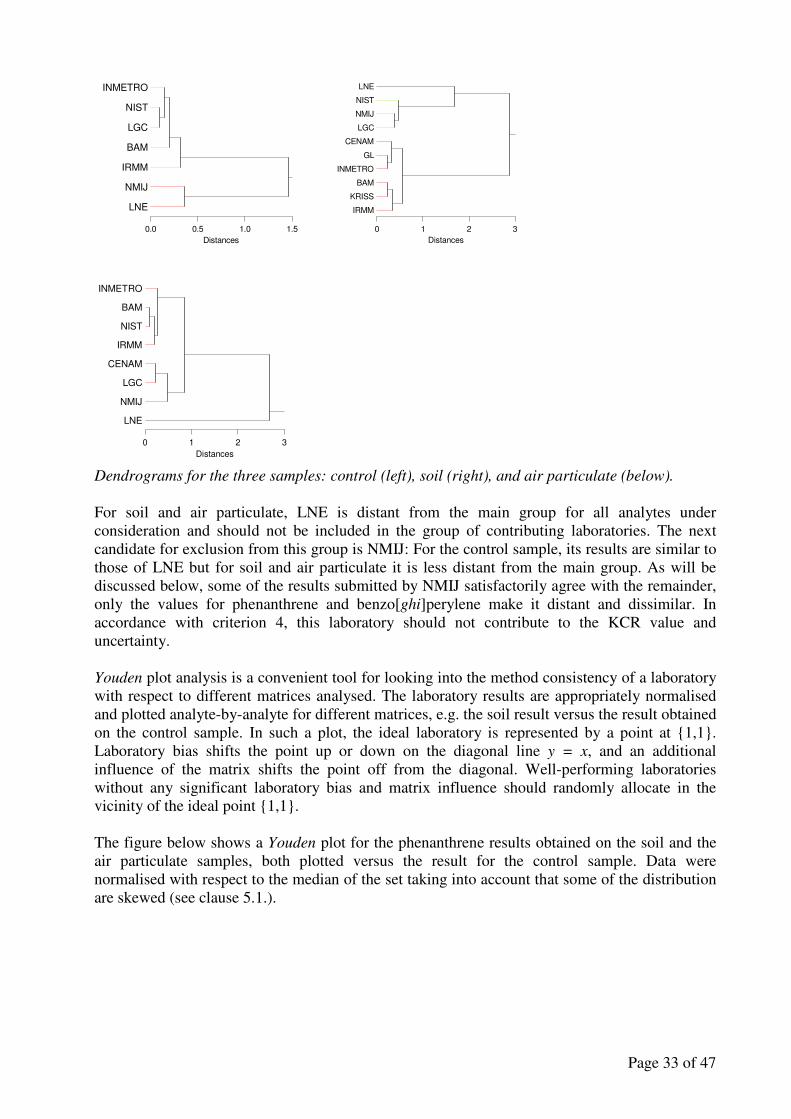
Page 33 of 47
0.0 0.5 1.0 1.5
Distances
BAM
INMETRO
IRMM
LGC
LNE
NIST
NMIJ
0 1 2 3
Distances
BAM
CENAM
GL
INMETRO
IRMM
KRISS
LGC
LNE
NIST
NMIJ
0 1 2 3
Distances
BAM
CENAM
INMETRO
IRMM
LGC
LNE
NIST
NMIJ
Dendrograms for the three samples: control (left), soil (right), and air particulate (below). For soil and air particulate, LNE is distant from the main group for all analytes under consideration and should not be included in the group of contributing laboratories. The next candidate for exclusion from this group is NMIJ: For the control sample, its results are similar to those of LNE but for soil and air particulate it is less distant from the main group. As will be discussed below, some of the results submitted by NMIJ satisfactorily agree with the remainder, only the values for phenanthrene and benzo[ghi]perylene make it distant and dissimilar. In accordance with criterion 4, this laboratory should not contribute to the KCR value and uncertainty. Youden plot analysis is a convenient tool for looking into the method consistency of a laboratory with respect to different matrices analysed. The laboratory results are appropriately normalised and plotted analyte-by-analyte for different matrices, e.g. the soil result versus the result obtained on the control sample. In such a plot, the ideal laboratory is represented by a point at {1,1}. Laboratory bias shifts the point up or down on the diagonal line y = x, and an additional influence of the matrix shifts the point off from the diagonal. Well-performing laboratories without any significant laboratory bias and matrix influence should randomly allocate in the vicinity of the ideal point {1,1}. The figure below shows a Youden plot for the phenanthrene results obtained on the soil and the air particulate samples, both plotted versus the result for the control sample. Data were normalised with respect to the median of the set taking into account that some of the distribution are skewed (see clause 5.1.).

Page 34 of 47
0.85
1
1.15
0.9 1 1.1 1.2 1.3
phenanthrene (control)
phenanthrene (soil)
0.85
1
1.15
1.3
1.45
1.6
0.9 1 1.1 1.2 1.3
phenanthrene (control)
phenanthrene (particulate)
Youden plot for phenanthrene in soil and particulate versus the phenanthrene result for the
control sample.
Two laboratories, namely LNE and NMIJ reveal systematic laboratory bias (high values for all samples) and an additional influence from the matrix (LNE for the air particulate, NMIJ for the control). For all other analytes, the results of the Youden plot analysis are similar. The following tables list the laboratories which are allocated within 10% from the point {1,1} and thus candidates for inclusion in the group of contributing laboratories. Results of the Youden plot analysis: Well-performing laboratories
soil vs control
phenanthrene fluoranthene B(a)A B(a)P B(ghi)P
BAM BAM BAM BAM BAM
INM ETRO INMETRO INM ETRO INM ETRO INM ETRO
IRM M IRMM IRM M IRM M IRM M
LGC LGC LGC LG C LGC
LNE
NIST NIST NIST NIST NIST
NMIJ NM IJ NM IJ particulate vs control
phenanthrene fluoranthene B(a)A B(a)P B(ghi)P
BAM BAM BAM BAM BAM
INM ETRO INMETRO INM ETRO INM ETRO INM ETRO
IRM M IRMM IRM M IRM M IRM M
LGC LGC LGC LG C LGC
NIST NIST NIST NIST NIST
NMIJ NM IJ NM IJ A core group of only 5 laboratories complies with requirement (4). However, CENAM, KRISS and GL didn't submit values for the control sample (since this was optional), so they couldn't be considered in the above Youden plot analysis. But CENAM performs well for both the soil and the particulate. This will be considered separately in clause 3. 2.2. Impact of method layout
The cluster analysis described above revealed a division of the laboratory results into two subgroups (and one distant laboratory). Although all laboratories used GC-MS for separation and detection, the layout of the extraction and clean-up (if applicable) steps was different. If one groups the method layout details into the two clusters, the picture shown in the following two tables is obtained.
BAM
LNE
NMIJ NIST
LGC IRMM
INMETRO BAM INMETRO
LGC
LNE
NMIJ
IRMM
NIST

Page 35 of 47
For the soil sample, no clear influence of one or a group of method parameters can be derived from the table. Neither the extraction method, the solvent nor the clean-up step may serve as a distinctive criterion between the groups. CENAM, GL, and INMETRO which are closest in the cluster analysis all used Soxhlet extraction but this indication is too weak to be significant. Moreover, in laboratory group 2, Soxhlet has also been used for extraction. Method details clustered according to the results obtained on the soil and air particulate
samples
For the air particulate sample, one might recognise a certain impact of the extraction solvent distinguishing group 1 using dichloromethane from group 2 where toluene has been used. 3. Defining the contributing laboratories on the basis of zeta scores
A core group of 5 contributing laboratories, namely BAM, INMETRO, IRMM, LGC and NIST, has been identified on the basis of cluster and Youden plot analysis. These laboratories are further scrutinised using the zeta score performance measure. The reference value is the mean of means of the laboratories included (requirement 5), and the uncertainty of the difference is combined from the uncertainty statement of the laboratory and the standard deviation of the mean. For all laboratories and all analytes, the zeta scores according to equation (2), and the sum
∑=
=5
1
2,
2
k
klablab ζζ (4)
of 2
,klabζ over all k analytes are calculated. This zeta square is assessed against the critical value
for a chi square distribution with 5 (= number of terms in the sum) degrees of freedom which is 11.07 at the 95% confidence level. Laboratories grossly exceeding the critical value will be excluded from the group. The remaining laboratories (which were not in the core group at the beginning) are sequentially included in the group using all possible combinations. Assessment of the set of data as a whole is done on the basis of the average 2ζ over all included laboratories
according to
n
n
lab
lab∑== 1
2
2
ζ
ζ (5)
Page 36 of 47
(with n being the number of included laboratories) by comparing it with the same critical value given above. 3.1. Control sample
For the control sample, only the core group remains after exclusion for technical reasons of LNE and NMIJ. Mean and standard deviation of the mean are
and the average zeta square is 9.20, still below the critical value. The reference value for the selected laboratories is in excellent agreement with the values certified for the control sample
as can clearly be seen from the normalized errors En which are all (much) smaller than unity. Individual 2
labζ slightly exceed the critical value for IRMM and INMETRO, most probably due to
an underestimation of the uncertainty of the laboratory. Replacement of the individual estimate by the average uncertainty stated by all contributing laboratories makes almost all 2
labζ smaller
than the critical value.
3.2. Soil For the core group, the average zeta square is 11.62 and exceeds the critical value. Bearing in mind the fact that CENAM didn't participate in Youden plot analysis but was conveniently accommodated in the main laboratory cluster, INMETRO is excluded, and CENAM included in a new core group (core*). This yields an average zeta square of 10.23 which is satisfactory. The inclusion of more laboratories (according to requirement (1)) increases the average zeta square above the permissible limit as shown in the figure below. The accepted contributing laboratories are BAM, CENAM, IRMM, LGC and NIST, and the KCR values and uncertainties calculated for this core* group of laboratories then are:
3.3. Air particulate
Here the same as in the case of the soil sample applies. For the core* group of BAM, CENAM, IRMM, LGC and NIST, an average zeta square of 10.21 is calculated which satisfies the compatibility criterion. If CENAM is replaced by INMETRO, the average zeta square increases to an unsatisfactory level of 12.58. If INMETRO is added to the core* group, this yields average zeta square of 14.34. Thus, the KCR value and uncertainty are calculated from the data of BAM, CENAM, IRMM, LGC and NIST as:

Page 37 of 47
0.9
1
1.1
1.2
1.3
1.4
1.5
1.6
core
core - INMETRO + CENAM
core* + KRISS
core* + INMETRO
core* + GL
core + INMETRO, KRISS
core + INMETRO, GL
core* + GL, KRISS
all
standardised average zeta square
Standardised (with respect to the critical value) zeta squares for different combinations of
contributing laboratories, soil analysis.
4. Assigning degrees of equivalence
Degrees of equivalence are calculated according to equation (1) for all participating laboratories using the KCR values and uncertainties determined under clauses 3.1. to 3.3.
4.1. En values for the original data
The following tables display the En values for the original data not corrected for any observed influence of temperature on the extraction efficiency. En for the control sample
En for soil
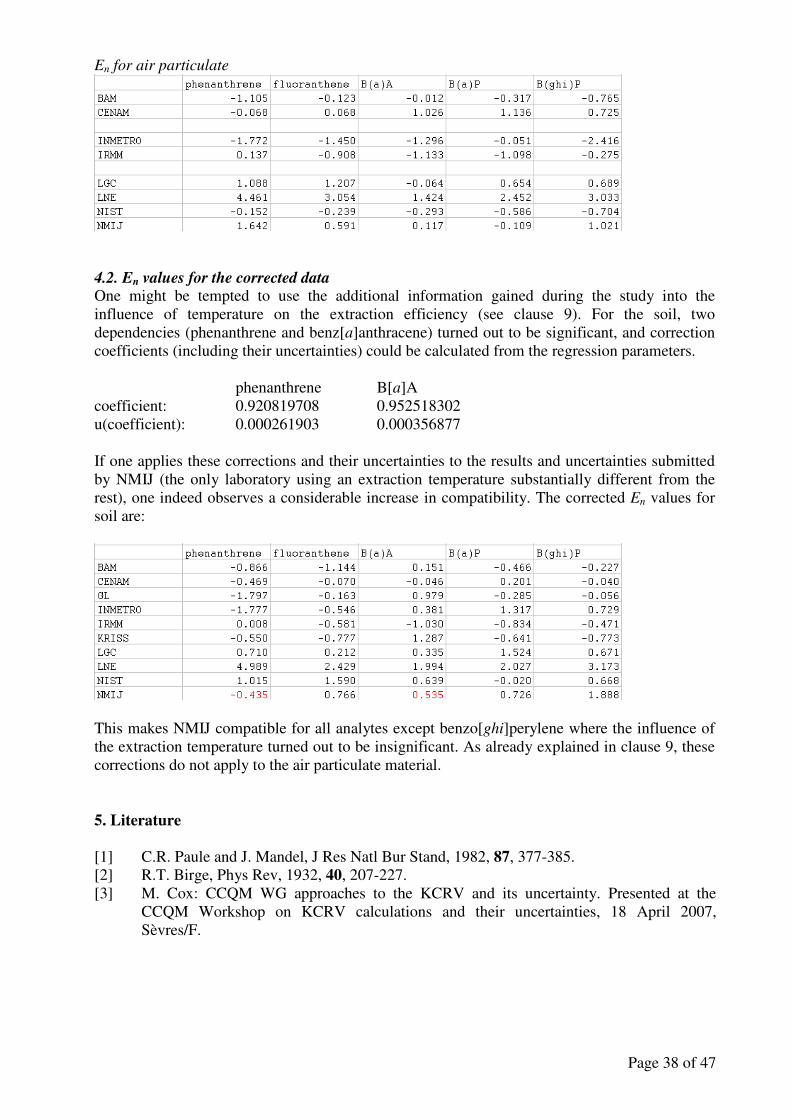
Page 38 of 47
En for air particulate
4.2. En values for the corrected data
One might be tempted to use the additional information gained during the study into the influence of temperature on the extraction efficiency (see clause 9). For the soil, two dependencies (phenanthrene and benz[a]anthracene) turned out to be significant, and correction coefficients (including their uncertainties) could be calculated from the regression parameters. phenanthrene B[a]A coefficient: 0.920819708 0.952518302 u(coefficient): 0.000261903 0.000356877 If one applies these corrections and their uncertainties to the results and uncertainties submitted by NMIJ (the only laboratory using an extraction temperature substantially different from the rest), one indeed observes a considerable increase in compatibility. The corrected En values for soil are:
This makes NMIJ compatible for all analytes except benzo[ghi]perylene where the influence of the extraction temperature turned out to be insignificant. As already explained in clause 9, these corrections do not apply to the air particulate material. 5. Literature
[1] C.R. Paule and J. Mandel, J Res Natl Bur Stand, 1982, 87, 377-385. [2] R.T. Birge, Phys Rev, 1932, 40, 207-227. [3] M. Cox: CCQM WG approaches to the KCRV and its uncertainty. Presented at the CCQM Workshop on KCRV calculations and their uncertainties, 18 April 2007, Sèvres/F.

Page 39 of 47
Appendix 3: Uncertainty budgets, as reported by the participants BAM
source standard uncertainty
method precision standard deviation of the mean of 6 results concentration calibrant solution certified, NIST SRM 1647d dry mass correction factor standard deviation of mean of results of Karl-Fischer titration uncertainty budget K50a soil mean
µg/g method precision µg/g
uncertainty calibrant µg/g
uncertainty dry mass µg/g
combined uncertainty µg/g
coverage factor
U95%CI µg/g
U95%CI %
Ph 12,92 0,26 0,10 0,005 0,28 2,45 0,68 5,3 Fl 13,50 0,09 0,08 0,005 0,12 2,14 0,26 1,9 B[a]A 5,84 0,05 0,02 0,002 0,06 2,36 0,13 2,2 B[a]P 4,84 0,05 0,03 0,002 0,07 2,23 0,15 3,1 B[ghi]P 4,94 0,03 0,08 0,002 0,09 1,99 0,17 3,4 uncertainty budget K50b particulate mean
µg/g method precision µg/g
uncertainty calibrant µg/g
uncertainty dry mass µg/g
combined uncertainty µg/g
coverage factor
U95%CI µg/g
U95%CI %
Ph 3,93 0,05 0,03 0,002 0,07 2,31 0,15 3,8 Fl 6,27 0,06 0,04 0,002 0,08 2,31 0,17 2,7 B(a)A 2,17 0,01 0,01 0,001 0,02 2,26 0,04 1,8 B(a)P 2,32 0,05 0,02 0,001 0,05 2,45 0,12 5,2 B(ghi)P 3,88 0,03 0,06 0,002 0,07 1,99 0,14 3,6
CENAM
Quantification was done via calibration curves with internal standard using two different columns and via standard addition. The following uncertainty sources were taken into account: For measurements with calibration curve and internal standard:
- uncertainty of the interpolated value in the calibration curve - uncertainty of repeatability and reproducibility of sample measurement
For measurements with standard addition, calibration curve and internal standard:
- uncertainty of intercept or target value in the calibration curve - uncertainty of reproducibility and repeatability of sample measurement - uncertainty of calibration standard SRM DMR 275a - uncertainty of preparation of calibration solutions - uncertainty of quantification method

Page 40 of 47
( ) ( )222resultsRFst RSDRSD)u(cckU ++⋅⋅=
Government Lab Hong Kong
CCQM-K50a soil Ph Fl B[a]A B[a]P B[ghi]P Measured Value (mean) µg/g 12,66 14,25 6,05 4,88 4,97 Uncertainty components (expressed as relative standard uncertainty)
Precision of measurements 0,007674 0,004233 0,013841 0,008429 0,008896 (including sample extraction, cleanup and analysis)
Calibration standards 0,005186 0,005226 0,008834 0,018047 0,006086 Moisture content 0,000667 0,000667 0,000667 0,000667 0,000667 Rel. Combined Standard Unc. 0,009286 0,006758 0,016433 0,019929 0,010799 Combined Standard Unc. (µg/g) 0,118 0,096 0,099 0,097 0,054 k 2 2 2 2 2 Expanded Uncertainty as % 1,86 1,35 3,29 3,99 2,16 Expanded Uncertainty (µg/g) 0,24 0,19 0,20 0,19 0,11
INMETRO
K50a soil Sources of uncertainty Ph Fl B[a]A B[a]P B[ghi]P Repeatability of area 3,5996E-08 3,6043E-08 2,0379E-08 1,7713E-08 1,5568E-08 mass of sample 8,0464E-11 8,7959E-11 3,7109E-11 3,3350E-11 3,2008E-11 mass of IS added into the sample 2,4228E-08 2,5240E-08 4,0197E-08 2,5933E-08 2,4890E-08 repeatability of analysis 4,0364E-02 4,6751E-02 2,6985E-02 2,3423E-02 1,5356E-02 calibration curve 4,6202E-02 3,9406E-02 9,3735E-03 1,4841E-02 1,3962E-02 Purity of standard 6,6677E-05 4,8578E-05 1,6121E-04 0,0000E+00 1,1826E-04
K50b particulate
IRMM
U: expanded uncertainty k: coverage factor, k=2 c: average concentration of the analyte u(cst): uncertainty of the standards used RSDRF: relative standard deviation of response factors determined RSDresults: relative standard deviation of results (analyte concentration)
Sources of uncertainty Ph Fl B[a]A B[a]P B[ghi]P Repeatability of area 1,6971E-08 2,7493E-08 1,1522E-08 3,6651E-08 2,4868E-08 mass of sample 2,6194E-10 4,0647E-10 1,3322E-10 1,6196E-10 2,4769E-10 mass of IS added into the sample 1,9488E-08 1,9714E-08 1,0891E-08 9,5770E-09 1,4647E-08 repeatability of analysis 4,0264E-02 5,4197E-02 2,2249E-02 5,8628E-02 3,2137E-02 calibration curve 6,8932E-03 9,0493E-03 1,1069E-02 9,4623E-03 1,6231E-02 purity of standard 2,0161E-05 2,0848E-05 5,3748E-05 0,0000E+00 8,4986E-05

Page 41 of 47
KRISS Measurement equation: C : concentration of analyte in sample
fdry: dry mass correction factor Msample : weight of sample taken for analysis
Mis-sol,spiked: weight of isotope labelled standard solution spiked to sample taken for analysis
Cs-sol: concentration of standard solution
Ms-sol, std: weight of standard solution added to STD Mix
Mis-sol,sptd: weight of isotope labelled standard solution added to STD Mix
ARsample : area ratio of the analyte to the isotope labelled analogue from GC/MS-SIM measurement of sample
ARstd : area ratio of the analyte peak to the isotope labelled analogue from GC/MS-SIM measurement of STD Mix
Uncertainty sources: Xi sources Rel. unc (%) v
fdry Repeated maesurement 0,0389 5
Msample included in between bottle variation 0,003 Large
Mis-sol,spiked included in between bottle variation 0,02 Large
Csol purity , repeatability of gravimetric preparation 0.1~0.6 Large
Ms-sol, std/Mis-sol, std from standard deviation of R.F. of STD Mix 0.2 ~0.5 4
ARstd s/sqrt(n) of 6 repeated GC/MS run 0.05 ~0.5 5
ARsample s/sqrt(n) of 3 repeated GC/MS run 0.2~1.0 2
Measurement results and uncertainty: Ph Fl B[a]A B[a]P B[ghi]P Sample K50-#10
Aliquot 10-1 concentration(mg/g) 12,634 13,080 5,721 4,559 4,622
unc, rel% 0,78% 1,29% 0,88% 0,92% 1,07%
veff 10
6
9
10
6
Aliquot 10-2 concentration(mg/g) 12,546 12,992 5,709 4,533 4,607
unc, rel% 0,68% 1,01% 0,75% 0,91% 1,07%
veff 9
8
13
10
6
Aliquot 10-3 concentration(mg/g) 12,636 13,007 5,745 4,585 4,603
unc, rel% 0,60% 1,47% 0,69% 0,62% 1,11%
veff 3
5
5
5
7
pooled unc, rel% 0,57% 0,95% 0,71% 0,80% 0,97%
veff of pooled unc. 22
19
27
25
19
stdsolisstdsmaple
solsstdsolssmaplespikedsolis
dryMARM
CMARMfC
,
,,
−
−−−
∗∗
∗∗∗∗=
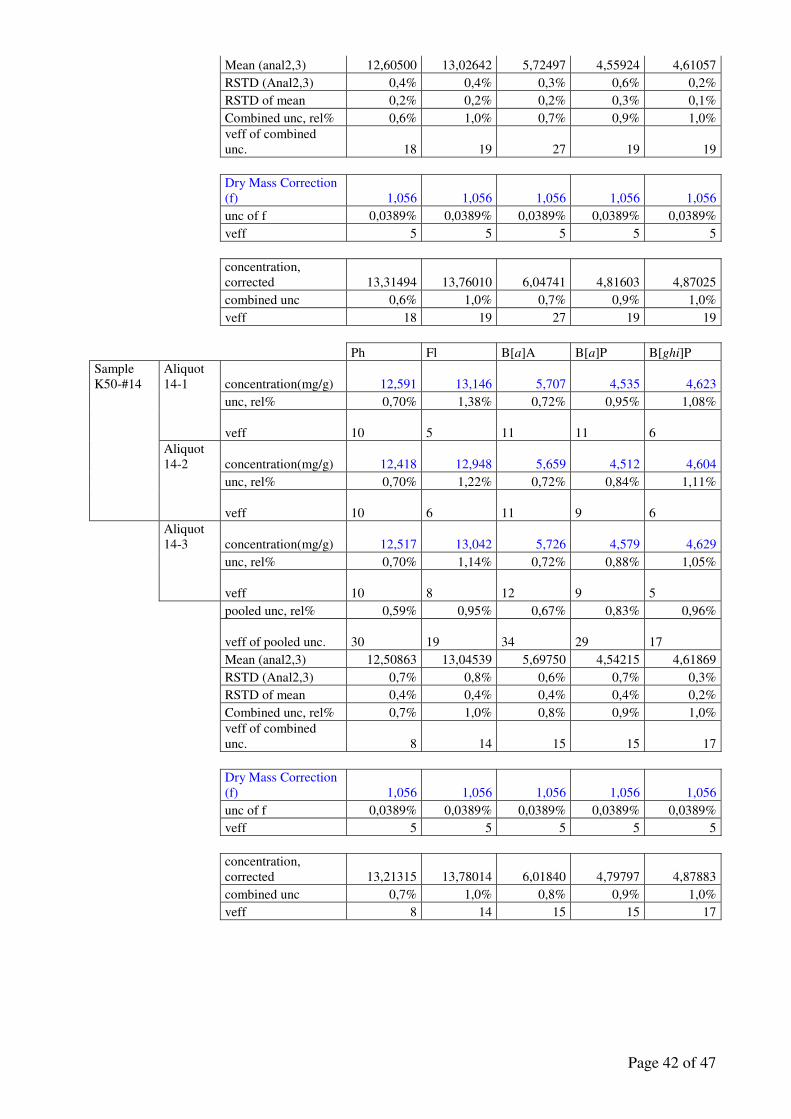
Page 42 of 47
Mean (anal2,3) 12,60500 13,02642 5,72497 4,55924 4,61057 RSTD (Anal2,3) 0,4% 0,4% 0,3% 0,6% 0,2% RSTD of mean 0,2% 0,2% 0,2% 0,3% 0,1% Combined unc, rel% 0,6% 1,0% 0,7% 0,9% 1,0%
veff of combined unc. 18 19 27 19 19
Dry Mass Correction (f) 1,056 1,056 1,056 1,056 1,056
unc of f 0,0389% 0,0389% 0,0389% 0,0389% 0,0389% veff 5 5 5 5 5
concentration, corrected 13,31494 13,76010 6,04741 4,81603 4,87025
combined unc 0,6% 1,0% 0,7% 0,9% 1,0% veff 18 19 27 19 19 Ph Fl B[a]A B[a]P B[ghi]P Sample K50-#14
Aliquot 14-1 concentration(mg/g) 12,591 13,146 5,707 4,535 4,623
unc, rel% 0,70% 1,38% 0,72% 0,95% 1,08%
veff 10
5
11
11
6
Aliquot 14-2 concentration(mg/g) 12,418 12,948 5,659 4,512 4,604
unc, rel% 0,70% 1,22% 0,72% 0,84% 1,11%
veff 10
6
11
9
6
Aliquot 14-3 concentration(mg/g) 12,517 13,042 5,726 4,579 4,629
unc, rel% 0,70% 1,14% 0,72% 0,88% 1,05%
veff 10
8
12
9
5
pooled unc, rel% 0,59% 0,95% 0,67% 0,83% 0,96%
veff of pooled unc. 30
19
34
29
17
Mean (anal2,3) 12,50863 13,04539 5,69750 4,54215 4,61869 RSTD (Anal2,3) 0,7% 0,8% 0,6% 0,7% 0,3% RSTD of mean 0,4% 0,4% 0,4% 0,4% 0,2% Combined unc, rel% 0,7% 1,0% 0,8% 0,9% 1,0%
veff of combined unc. 8 14 15 15 17
Dry Mass Correction (f) 1,056 1,056 1,056 1,056 1,056
unc of f 0,0389% 0,0389% 0,0389% 0,0389% 0,0389% veff 5 5 5 5 5
concentration, corrected 13,21315 13,78014 6,01840 4,79797 4,87883
combined unc 0,7% 1,0% 0,8% 0,9% 1,0% veff 8 14 15 15 17
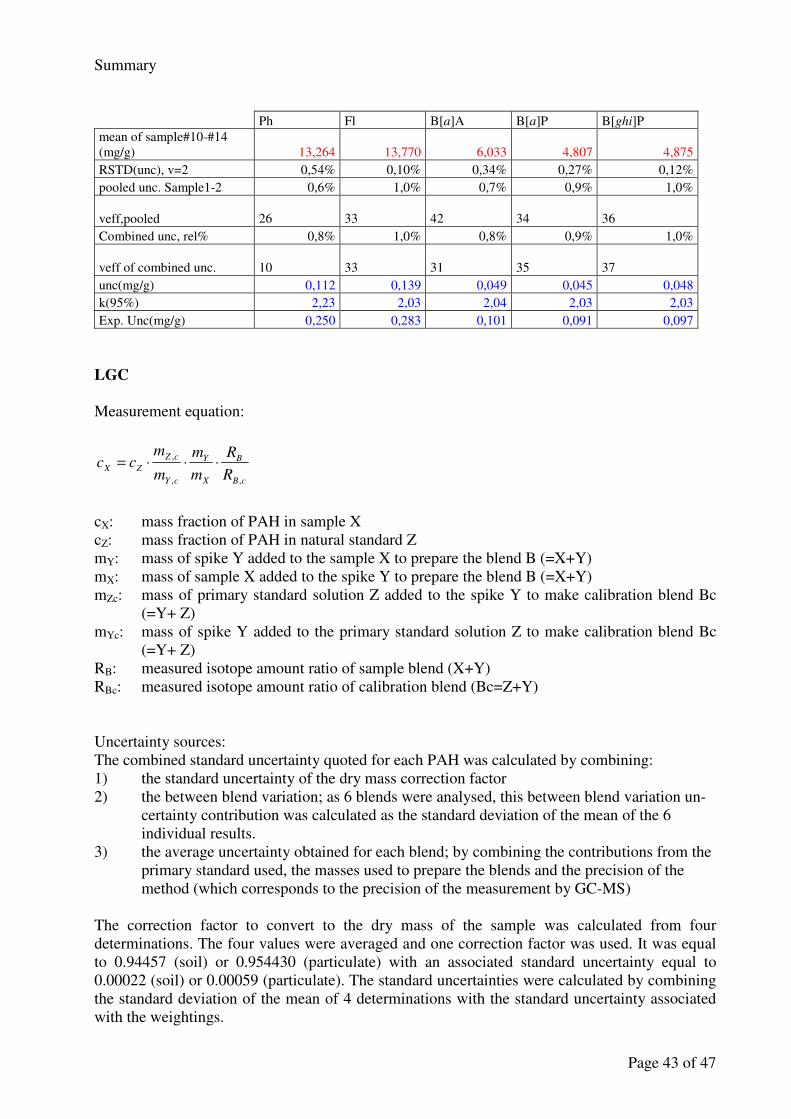
Page 43 of 47
Summary Ph Fl B[a]A B[a]P B[ghi]P mean of sample#10-#14 (mg/g) 13,264 13,770 6,033 4,807 4,875 RSTD(unc), v=2 0,54% 0,10% 0,34% 0,27% 0,12% pooled unc. Sample1-2 0,6% 1,0% 0,7% 0,9% 1,0%
veff,pooled 26
33
42
34
36
Combined unc, rel% 0,8% 1,0% 0,8% 0,9% 1,0%
veff of combined unc. 10
33
31
35
37
unc(mg/g) 0,112 0,139 0,049 0,045 0,048 k(95%) 2,23 2,03 2,04 2,03 2,03 Exp. Unc(mg/g) 0,250 0,283 0,101 0,091 0,097
LGC
Measurement equation:
cX: mass fraction of PAH in sample X cZ: mass fraction of PAH in natural standard Z mY: mass of spike Y added to the sample X to prepare the blend B (=X+Y) mX: mass of sample X added to the spike Y to prepare the blend B (=X+Y) mZc: mass of primary standard solution Z added to the spike Y to make calibration blend Bc (=Y+ Z) mYc: mass of spike Y added to the primary standard solution Z to make calibration blend Bc (=Y+ Z) RB: measured isotope amount ratio of sample blend (X+Y) RBc: measured isotope amount ratio of calibration blend (Bc=Z+Y) Uncertainty sources: The combined standard uncertainty quoted for each PAH was calculated by combining: 1) the standard uncertainty of the dry mass correction factor 2) the between blend variation; as 6 blends were analysed, this between blend variation un- certainty contribution was calculated as the standard deviation of the mean of the 6 individual results. 3) the average uncertainty obtained for each blend; by combining the contributions from the primary standard used, the masses used to prepare the blends and the precision of the method (which corresponds to the precision of the measurement by GC-MS) The correction factor to convert to the dry mass of the sample was calculated from four determinations. The four values were averaged and one correction factor was used. It was equal to 0.94457 (soil) or 0.954430 (particulate) with an associated standard uncertainty equal to 0.00022 (soil) or 0.00059 (particulate). The standard uncertainties were calculated by combining the standard deviation of the mean of 4 determinations with the standard uncertainty associated with the weightings.
cB
B
X
Y
cY
cZ
ZXR
R
m
m
m
mcc
,,
, ⋅⋅⋅=
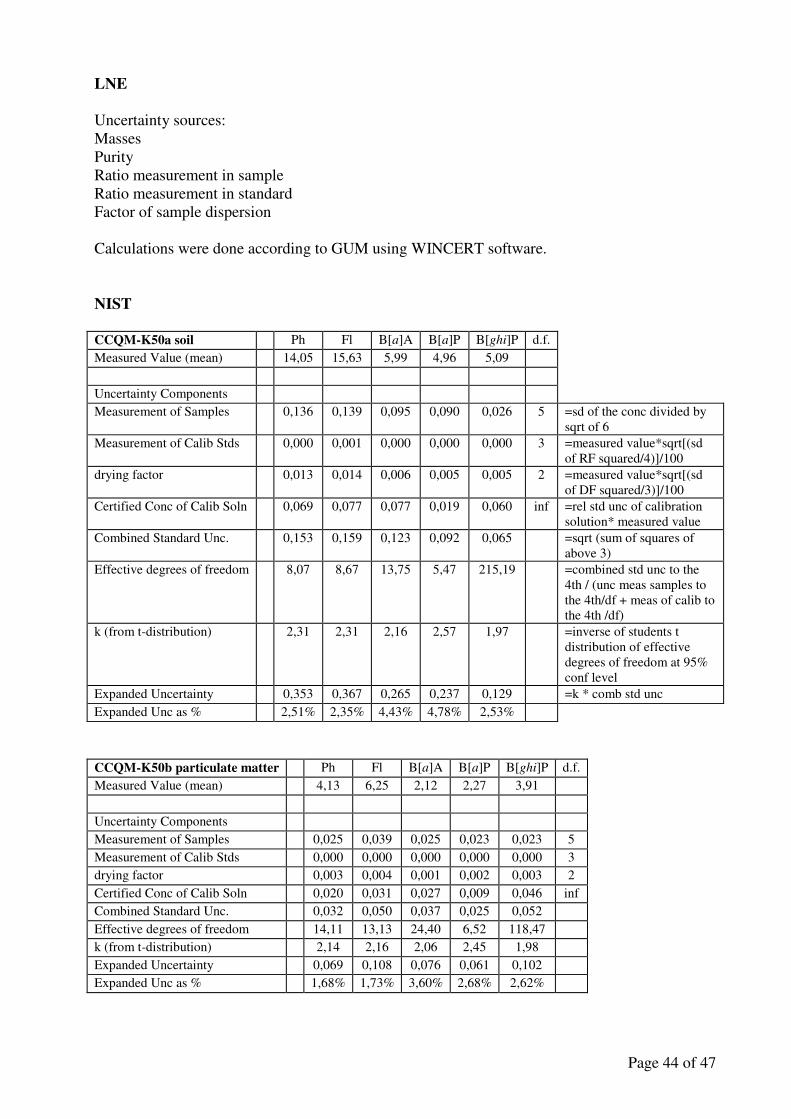
Page 44 of 47
LNE Uncertainty sources: Masses Purity Ratio measurement in sample Ratio measurement in standard Factor of sample dispersion Calculations were done according to GUM using WINCERT software. NIST CCQM-K50a soil Ph Fl B[a]A B[a]P B[ghi]P d.f. Measured Value (mean) 14,05 15,63 5,99 4,96 5,09 Uncertainty Components Measurement of Samples 0,136 0,139 0,095 0,090 0,026 5 =sd of the conc divided by
sqrt of 6 Measurement of Calib Stds 0,000 0,001 0,000 0,000 0,000 3 =measured value*sqrt[(sd
of RF squared/4)]/100 drying factor 0,013 0,014 0,006 0,005 0,005 2 =measured value*sqrt[(sd
of DF squared/3)]/100 Certified Conc of Calib Soln 0,069 0,077 0,077 0,019 0,060 inf =rel std unc of calibration
solution* measured value Combined Standard Unc. 0,153 0,159 0,123 0,092 0,065 =sqrt (sum of squares of
above 3) Effective degrees of freedom 8,07 8,67 13,75 5,47 215,19 =combined std unc to the
4th / (unc meas samples to the 4th/df + meas of calib to the 4th /df)
k (from t-distribution) 2,31 2,31 2,16 2,57 1,97 =inverse of students t distribution of effective degrees of freedom at 95% conf level
Expanded Uncertainty 0,353 0,367 0,265 0,237 0,129 =k * comb std unc Expanded Unc as % 2,51% 2,35% 4,43% 4,78% 2,53%
CCQM-K50b particulate matter Ph Fl B[a]A B[a]P B[ghi]P d.f. Measured Value (mean) 4,13 6,25 2,12 2,27 3,91 Uncertainty Components Measurement of Samples 0,025 0,039 0,025 0,023 0,023 5 Measurement of Calib Stds 0,000 0,000 0,000 0,000 0,000 3 drying factor 0,003 0,004 0,001 0,002 0,003 2 Certified Conc of Calib Soln 0,020 0,031 0,027 0,009 0,046 inf Combined Standard Unc. 0,032 0,050 0,037 0,025 0,052 Effective degrees of freedom 14,11 13,13 24,40 6,52 118,47 k (from t-distribution) 2,14 2,16 2,06 2,45 1,98 Expanded Uncertainty 0,069 0,108 0,076 0,061 0,102 Expanded Unc as % 1,68% 1,73% 3,60% 2,68% 2,62%

Page 45 of 47
NMIJ
Measurement equation:
Canal = [Fprep(sample) * R(sample) - R(blank)] * [ Mcal * Ccal * Msur(sample) * Fsur(sample) * Fsur(dilute)] / [Fmoist * Msample * Msur(calibration)] Canal: concentration of analyte in the sample (dry mass-basis), Fprep(sample): efficiency of sample preparation, R(sample): ratio Rsample / Rcalibration, Rsample: ratio of peak area of analyte / surrogate observed for the sample solution, Rcalibration: ratio of peak area of analyte / surrogate observed for the calibration solution, R(blank): ratio Rblank / Rcalibration, Rblank: ratio of peak area of analyte / surrogate observed for the blank solution, Rcalibration: ratio of peak area of analyte / surrogate observed for the calibration solution, Mcal: mass of the standard solution of analytes taken for preparation of the calibration solution, Type A uncertainty (reproducibility of weighing, n=10) and type B uncertainty (linearity of weighing, certificate of calibration) were combined. Ccal: concentration of analyte in the calibration solution, u(Ccal): uncertainty of concentration in calibration solution prepared from neat chemicals Msur(sample): mass of the surrogates solution added to the sample, Type B uncertainties (linearity and reproducibility of weighing, certificate of calibration) were combined. Fsur(sample): correction factor of adding surrogates solution on the sample, Type A uncertainty (reproducibility of weighing, n=10) and type B uncertainty (linearity of weighing, certificate of calibration) were combined. Fsur(dilute): correction factor of preparing surrogates solution on the sample, Type A uncertainty (reproducibility of weighing, n=10) and type B uncertainty (linearity of weighing, certificate of calibration) were combined. Fmoist: correction factor concerning moisture content in the sample, Type A uncertainty (reproducibility, subsamples: n=3 (soil), n=2 particulate) and type B uncertainty (linearity and reproducibility of weighing, certificate of calibration) were combined. Msample: mass of the sample taken for analysis, Type B uncertainties (linearity and reproducibility of weighing, certificate of calibration) were combined. Msur(calibration): mass of the undiluted surrogates solution taken for preparation of the calibration solution, Type A uncertainty (reproducibility of weighing, n=10) and type B uncertainty (linearity of weighing, certificate of calibration) were combined. Since there was no significant difference between the two bottles of the soil sample, uncertainties obtained from two bottles were combined.

Page 46 of 47
Budget K50a soil:
Value, xi
Uncertainty, u(xi)
degree of freedom
type of uncertainty
Fprep(sample): Phenanthrene 1,00000 0,00238 9 A Fprep(sample): Fluoranthene 1,00000 0,00222 9 A Fprep(sample): Benz[a]anthracene 1,00000 0,00531 9 A Fprep(sample): Benzo[a]pyrene 1,00000 0,00391 9 A Fprep(sample): Benzo[ghi]perylene 1,00000 0,00203 9 A R(sample): Phenanthrene 0,99665 0,00222 9 A R(sample): Fluoranthene 1,00880 0,00206 9 A R(sample): Benz[a]anthracene 0,96759 0,00236 9 A R(sample): Benzo[a]pyrene 0,95241 0,00417 9 A R(sample): Benzo[ghi]perylene 0,97965 0,00168 9 A R(blank): Phenanthrene 0,00026 0,00001 2 A R(blank): Fluoranthene 0,00036 0,00001 2 A R(blank): Benz[a]anthracene 0,00034 0,00001 2 A R(blank): Benzo[a]pyrene 0,00025 0,00001 2 A R(blank): Benzo[ghi]perylene 0,00032 0,00001 2 A Mcal: Phenanthrene (mg) 667,72 0,69981 large A + B Mcal: Fluoranthene (mg) 667,72 0,28979 large A + B Mcal: Benz[a]anthracene (mg) 667,72 0,51498 large A + B Mcal: Benzo[a]pyrene (mg) 667,72 0,39725 large A + B Mcal: Benzo[ghi]perylene (mg) 667,72 0,25032 large A + B Ccal: Phenanthrene (µg/g) 48,312 0,40276 large A + B Ccal: Fluoranthene (µg/g) 49,031 0,40876 large A + B Ccal: Benz[a]anthracene (µg/g) 21,179 0,17656 large A + B Ccal: Benzo[a]pyrene (µg/g) 17,650 0,14714 large A + B Ccal: Benzo[ghi]perylene (µg/g) 17,548 0,14629 large A + B Msur(sample) (mg) 2456,75 2,9075 large A + B Msur(calibration) 405,40 2,2297 large A + B Fsur(sample) 1,00000 0,00080 large A + B Fsur(dilute) 0,21532 0,00118 large A + B Fmoist 0,94958 0,00030 large A + B
Msample (mg) 3044,92 0,09006 large B
Concentration
(µg/g)
combined uncertainty
(µg/g) k
expanded uncertainty
(µg/g) Phenanthrene 14,44 0,173 2 0,35 Fluoranthene 14,99 0,178 2 0,36 Benz[a]anthracene 6,22 0,082 2 0,16 Benzo[a]pyrene 5,16 0,067 2 0,13 Benzo[ghi]perylene 5,27 0,062 2 0,12
For the particulate matter sample a significant difference between the results obtained for the two bottles was observed. Therefore, this difference was added to the uncertainty budget. Budget K50b particulate
Value, xi
Uncertainty, u(xi)
degree of freedom
type of uncertainty
Fprep(sample): Phenanthrene 1,00000 0,00167 4 A Fprep(sample): Fluoranthene 1,00000 0,00463 4 A Fprep(sample): Benz[a]anthracene 1,00000 0,00212 4 A Fprep(sample): Benzo[a]pyrene 1,00000 0,00372 4 A Fprep(sample): Benzo[ghi]perylene 1,00000 0,00239 4 A R(sample): Phenanthrene 1,09126 0,00192 4 A R(sample): Fluoranthene 1,05364 0,00606 4 A
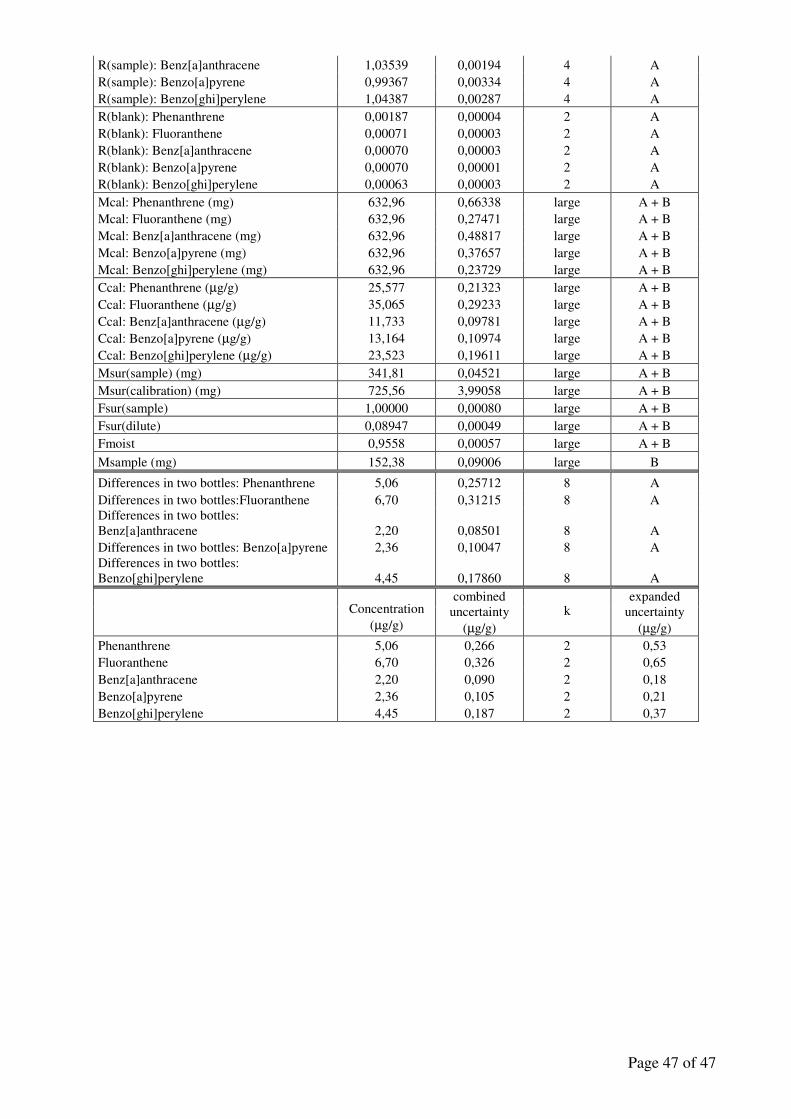
Page 47 of 47
R(sample): Benz[a]anthracene 1,03539 0,00194 4 A R(sample): Benzo[a]pyrene 0,99367 0,00334 4 A R(sample): Benzo[ghi]perylene 1,04387 0,00287 4 A R(blank): Phenanthrene 0,00187 0,00004 2 A R(blank): Fluoranthene 0,00071 0,00003 2 A R(blank): Benz[a]anthracene 0,00070 0,00003 2 A R(blank): Benzo[a]pyrene 0,00070 0,00001 2 A R(blank): Benzo[ghi]perylene 0,00063 0,00003 2 A Mcal: Phenanthrene (mg) 632,96 0,66338 large A + B Mcal: Fluoranthene (mg) 632,96 0,27471 large A + B Mcal: Benz[a]anthracene (mg) 632,96 0,48817 large A + B Mcal: Benzo[a]pyrene (mg) 632,96 0,37657 large A + B Mcal: Benzo[ghi]perylene (mg) 632,96 0,23729 large A + B Ccal: Phenanthrene (µg/g) 25,577 0,21323 large A + B Ccal: Fluoranthene (µg/g) 35,065 0,29233 large A + B Ccal: Benz[a]anthracene (µg/g) 11,733 0,09781 large A + B Ccal: Benzo[a]pyrene (µg/g) 13,164 0,10974 large A + B Ccal: Benzo[ghi]perylene (µg/g) 23,523 0,19611 large A + B Msur(sample) (mg) 341,81 0,04521 large A + B Msur(calibration) (mg) 725,56 3,99058 large A + B Fsur(sample) 1,00000 0,00080 large A + B Fsur(dilute) 0,08947 0,00049 large A + B Fmoist 0,9558 0,00057 large A + B
Msample (mg) 152,38 0,09006 large B
Differences in two bottles: Phenanthrene 5,06 0,25712 8 A Differences in two bottles:Fluoranthene 6,70 0,31215 8 A Differences in two bottles: Benz[a]anthracene 2,20 0,08501 8 A Differences in two bottles: Benzo[a]pyrene 2,36 0,10047 8 A Differences in two bottles: Benzo[ghi]perylene 4,45 0,17860 8 A
Concentration
(µg/g)
combined uncertainty
(µg/g) k
expanded uncertainty
(µg/g) Phenanthrene 5,06 0,266 2 0,53 Fluoranthene 6,70 0,326 2 0,65 Benz[a]anthracene 2,20 0,090 2 0,18 Benzo[a]pyrene 2,36 0,105 2 0,21 Benzo[ghi]perylene 4,45 0,187 2 0,37