CCLS Mathematics Grade 7 Curriculum Guide -...
34
MOUNT VERNON CITY SCHOOL DISTRICT CCLS Mathematics Grade 7 Curriculum Guide THIS HANDBOOK IS FOR THE IMPLEMENTATION OF THE GRADE 7 MATHEMATICS CURRICULUM IN MOUNT VERNON. 2015-2016
Transcript of CCLS Mathematics Grade 7 Curriculum Guide -...

MOUNT VERNON CITY SCHOOL DISTRICT
CCLS MathematicsGrade 7
Curriculum Guide
THIS HANDBOOK IS FOR THE IMPLEMENTATION OF THE GRADE 7MATHEMATICS CURRICULUM IN MOUNT VERNON.
2015-2016

2
Mount Vernon City School District
Board of Education
Adriane SaundersPresident
Serigne GningueVice President
Board TrusteesCharmaine FearonRosemarie Jarosz
Micah J.B. McOwenOmar McDowell
Darcy MillerWanda WhiteLesly Zamor
Superintendent of SchoolsDr. Kenneth Hamilton
Deputy SuperintendentDr. Jeff Gorman
Assistant Superintendent of BusinessKen Silver
Assistant Superintendent of Human ResourcesDenise Gagne-Kurpiewski
Administrator of Mathematics and Science (K-12)Dr. Satish Jagnandan

3
TABLE OF CONTENTS
I. COVER …..……………………………………....... 1
II. MVCSD BOARD OF EDUCATION …..……………………………………....... 2
III. TABLE OF CONTENTS …..……………………………………....... 3
IV. IMPORTANT DATES …..……………………………………....... 4
V. VISION STATEMENT …..……………………………………....... 5
VI. PHILOSOPHY OF MATHEMATICS CURRICULUM ……………. 6
VII. NYS GRADE 7 COMMON CORE LEARNING STANDARDS ……………..7
VII. MVCSD GRADE 7 MATHEMATICS PACING GUIDE …………... 15
VIII. WORD WALL …………... 28
IX. SETUP OF A MATHEMATICS CLASSROOM …………... 29
X. SECONDARY GRADING POLICY …………... 30
XI. SAMPLE NOTEBOOK RUBRIC …………... 31
XII. CLASSROOM AESTHETICS …………... 32
XIII. SYSTEMATIC DESIGN OF A MATHEMATICS LESSON …………... 33

4
IMPORTANT DATES 2015-16
REPORT CARD – 10 WEEK PERIOD
MARKINGPERIOD
MARKINGPERIODBEGINS
INTERIMPROGRESSREPORTS
MARKINGPERIOD
ENDS
DURATION REPORT CARDDISTRIBUTION
MP 1 September 8,2015
October 9,2015
November 13,2015
10 weeks Week ofNov. 23, 2015
MP 2 November 16,2015
December 18,2015
January 29,2016
10 weeks Week ofFebruary 8, 2016
MP 3 February 1,2016
March 11,2016
April 15,2016
9 weeks Week ofApril 25, 2016
MP 4 April 18,2016
May 20,2016
June 23,2016
10 weeks Last Day of SchoolJune 23, 2016
The Parent Notification Policy states “Parent(s) / guardian(s) or adult students are
to be notified, in writing, at any time during a grading period when it is apparent -
that the student may fail or is performing unsatisfactorily in any course or grade
level. Parent(s) / guardian(s) are also to be notified, in writing, at any time during
the grading period when it becomes evident that the student's conduct or effort
grades are unsatisfactory.”

5
VISION STATEMENT
True success comes from co-accountability and co-responsibility. In a coherentinstructional system, everyone is responsible for student learning and studentachievement. The question we need to constantly ask ourselves is, "How are ourstudents doing?"
The starting point for an accountability system is a set of standards andbenchmarks for student achievement. Standards work best when they are welldefined and clearly communicated to students, teachers, administrators, andparents. The focus of a standards-based education system is to provide commongoals and a shared vision of what it means to be educated. The purposes of aperiodic assessment system are to diagnose student learning needs, guideinstruction and align professional development at all levels of the system.
The primary purpose of this Instructional Guide is to provide teachers andadministrators with a tool for determining what to teach and assess. Morespecifically, the Instructional Guide provides a "road map" and timeline forteaching and assessing the Common Core Learning Standards.
I ask for your support in ensuring that this tool is utilized so students are able tobenefit from a standards-based system where curriculum, instruction, andassessment are aligned. In this system, curriculum, instruction, and assessment aretightly interwoven to support student learning and ensure ALL students have equalaccess to a rigorous curriculum.
We must all accept responsibility for closing the achievement gap and improvingstudent achievement for all of our students.
Dr. Satish Jagnandan
Administrator for Mathematics and Science (K-12)
6
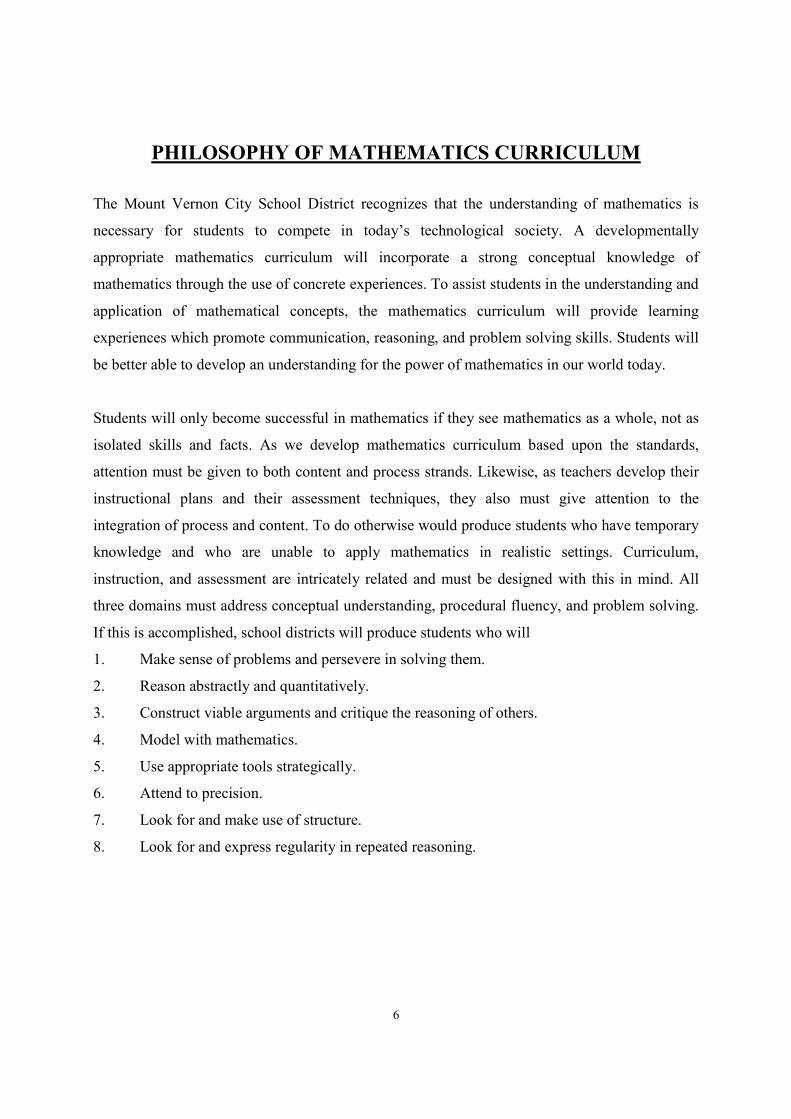
PHILOSOPHY OF MATHEMATICS CURRICULUM
The Mount Vernon City School District recognizes that the understanding of mathematics is
necessary for students to compete in today’s technological society. A developmentally
appropriate mathematics curriculum will incorporate a strong conceptual knowledge of
mathematics through the use of concrete experiences. To assist students in the understanding and
application of mathematical concepts, the mathematics curriculum will provide learning
experiences which promote communication, reasoning, and problem solving skills. Students will
be better able to develop an understanding for the power of mathematics in our world today.
Students will only become successful in mathematics if they see mathematics as a whole, not as
isolated skills and facts. As we develop mathematics curriculum based upon the standards,
attention must be given to both content and process strands. Likewise, as teachers develop their
instructional plans and their assessment techniques, they also must give attention to the
integration of process and content. To do otherwise would produce students who have temporary
knowledge and who are unable to apply mathematics in realistic settings. Curriculum,
instruction, and assessment are intricately related and must be designed with this in mind. All
three domains must address conceptual understanding, procedural fluency, and problem solving.
If this is accomplished, school districts will produce students who will
1. Make sense of problems and persevere in solving them.
2. Reason abstractly and quantitatively.
3. Construct viable arguments and critique the reasoning of others.
4. Model with mathematics.
5. Use appropriate tools strategically.
6. Attend to precision.
7. Look for and make use of structure.
8. Look for and express regularity in repeated reasoning.
7
New York State P-12 Common Core Learning Standards forMathematics
Mathematics - Grade 7: Introduction
In Grade 7, instructional time should focus on four critical areas: (1) developing understanding of and applyingproportional relationships; (2) developing understanding of operations with rational numbers and working withexpressions and linear equations; (3) solving problems involving scale drawings and informal geometricconstructions, and working with two- and three-dimensional shapes to solve problems involving area, surface area,and volume; and (4) drawing inferences about populations based on samples.
1. Students extend their understanding of ratios and develop understanding of proportionality to solve single- andmulti-step problems. Students use their understanding of ratios and proportionality to solve a wide variety ofpercent problems, including those involving discounts, interest, taxes, tips, and percent increase or decrease.Students solve problems about scale drawings by relating corresponding lengths between the objects or by usingthe fact that relationships of lengths within an object are preserved in similar objects. Students graphproportional relationships and understand the unit rate informally as a measure of the steepness of the relatedline, called the slope. They distinguish proportional relationships from other relationships.
2. Students develop a unified understanding of number, recognizing fractions, decimals (that have a finite or arepeating decimal representation), and percents as different representations of rational numbers. Students extendaddition, subtraction, multiplication, and division to all rational numbers, maintaining the properties ofoperations and the relationships between addition and subtraction, and multiplication and division. By applyingthese properties, and by viewing negative numbers in terms of everyday contexts (e.g., amounts owed ortemperatures below zero), students explain and interpret the rules for adding, subtracting, multiplying, anddividing with negative numbers. They use the arithmetic of rational numbers as they formulate expressions andequations in one variable and use these equations to solve problems.
3. Students continue their work with area from Grade 6, solving problems involving the area and circumference ofa circle and surface area of three-dimensional objects. In preparation for work on congruence and similarity inGrade 8 they reason about relationships among two-dimensional figures using scale drawings and informalgeometric constructions, and they gain familiarity with the relationships between angles formed by intersectinglines. Students work with three-dimensional figures, relating them to two-dimensional figures by examiningcross-sections. They solve real-world and mathematical problems involving area, surface area, and volume oftwo- and three-dimensional objects composed of triangles, quadrilaterals, polygons, cubes and right prisms.
4. Students build on their previous work with single data distributions to compare two data distributions andaddress questions about differences between populations. They begin informal work with random sampling togenerate data sets and learn about the importance of representative samples for drawing inferences.
Mathematical Practices
1. Make sense of problems and persevere in solvingthem.2. Reason abstractly and quantitatively.3. Construct viable arguments and critique the reasoningof others.
4. Model with mathematics.5. Use appropriate tools strategically.6. Attend to precision.7. Look for and make use of structure.8. Look for and express regularity in repeated reasoning.
8
Grade 7 Overview
Ratios and Proportional Relationships• Analyze proportional relationships and usethem to solve real-world and mathematicalproblems.
The Number System• Apply and extend previous understandingsof operations with fractions to add, subtract,multiply, and divide rational numbers.
Expressions and Equations• Use properties of operations to generateequivalent expressions.• Solve real-life and mathematical problemsusing numerical and algebraic expressions andequations.
Geometry• Draw, construct and describe geometricalfigures and describe the relationships betweenthem.• Solve real-life and mathematical problemsinvolving angle measure, area, surface area,and volume.
Statistics and Probability• Use random sampling to draw inferences abouta population.• Draw informal comparative inferences abouttwo populations.• Investigate chance processes and develop, use,and evaluate probability models.
Ratios & Proportional Relationships 7.RP
Analyze proportional relationships and use them to solve real-world and mathematical problems.1. Compute unit rates associated with ratios of fractions, including ratios of lengths, areas and other quantities
measured in like or different units. For example, if a person walks 1/2 mile in each 1/4 hour, compute the unitrate as the complex fraction 1/2/1/4 miles per hour, equivalently 2 miles per hour.
2. Recognize and represent proportional relationships between quantities.a. Decide whether two quantities are in a proportional relationship, e.g., by testing for equivalent ratios in a
table or graphing on a coordinate plane and observing whether the graph is a straight line through theorigin.
b. Identify the constant of proportionality (unit rate) in tables, graphs, equations, diagrams, and verbaldescriptions of proportional relationships.
c. Represent proportional relationships by equations. For example, if total cost t is proportional to the numbern of items purchased at a constant price p, the relationship between the total cost and the number of itemscan be expressed as t = pn.
d. Explain what a point (x, y) on the graph of a proportional relationship means in terms of the situation, withspecial attention to the points (0, 0) and (1, r) where r is the unit rate.
3. Use proportional relationships to solve multistep ratio and percent problems. Examples: simple interest, tax,markups and markdowns, gratuities and commissions, fees, percent increase and decrease, percent error.
The Number System 7.NS
Apply and extend previous understandings of operations with fractions to add, subtract, multiply, and dividerational numbers.1. Apply and extend previous understandings of addition and subtraction to add and subtract rational numbers;
represent addition and subtraction on a horizontal or vertical number line diagram.a. Describe situations in which opposite quantities combine to make 0. For example, a hydrogen atom has 0
charge because its two constituents are oppositely charged.b. Understand p + q as the number located a distance |q| from p, in the positive or negative direction
depending on whether q is positive or negative. Show that a number and its opposite have a sum of 0 (areadditive inverses). Interpret sums of rational numbers by describing real-world contexts.
c. Understand subtraction of rational numbers as adding the additive inverse, p – q = p + (–q). Show that thedistance between two rational numbers on the number line is the absolute value of their difference, andapply this principle in real-world contexts.
d. Apply properties of operations as strategies to add and subtract rational numbers.

9
2. Apply and extend previous understandings of multiplication and division and of fractions to multiply and dividerational numbers.a. Understand that multiplication is extended from fractions to rational numbers by requiring that operations
continue to satisfy the properties of operations, particularly the distributive property, leading to productssuch as (–1)(–1) = 1 and the rules for multiplying signed numbers. Interpret products of rational numbersby describing real-world contexts.
b. Understand that integers can be divided, provided that the divisor is not zero, and every quotient of integers(with non-zero divisor) is a rational number. If p and q are integers, then –(p/q) = (–p)/q = p/(–q). Interpretquotients of rational numbers by describing real-world contexts.
c. Apply properties of operations as strategies to multiply and divide rational numbers.d. Convert a rational number to a decimal using long division; know that the decimal form of a rational
number terminates in 0s or eventually repeats.3. Solve real-world and mathematical problems involving the four operations with rational numbers.1
_________________1 Computations with rational numbers extend the rules for manipulating fractions to complex fractions.
Expressions & Equations 7.EE
Use properties of operations to generate equivalent expressions.1. Apply properties of operations as strategies to add, subtract, factor, and expand linear expressions with rational
coefficients.2. Understand that rewriting an expression in different forms in a problem context can shed light on the problem
and how the quantities in it are related. For example, a + 0.05a = 1.05a means that “increase by 5%” is thesame as “multiply by 1.05.”
Solve real-life and mathematical problems using numerical and algebraic expressions and equations.3. Solve multi-step real-life and mathematical problems posed with positive and negative rational numbers in any
form (whole numbers, fractions, and decimals), using tools strategically. Apply properties of operations tocalculate with numbers in any form; convert between forms as appropriate; and assess the reasonableness ofanswers using mental computation and estimation strategies. For example: If a woman making $25 an hour getsa 10% raise, she will make an additional 1/10 of her salary an hour, or $2.50, for a new salary of $27.50. If youwant to place a towel bar 9 3/4 inches long in the center of a door that is 27 1/2 inches wide, you will need toplace the bar about 9 inches from each edge; this estimate can be used as a check on the exact computation.
4. Use variables to represent quantities in a real-world or mathematical problem, and construct simple equationsand inequalities to solve problems by reasoning about the quantities.a. Solve word problems leading to equations of the form px + q = r and p(x + q) = r, where p, q, and r are
specific rational numbers. Solve equations of these forms fluently. Compare an algebraic solution to anarithmetic solution, identifying the sequence of the operations used in each approach. For example, theperimeter of a rectangle is 54 cm. Its length is 6 cm. What is its width?
b. Solve word problems leading to inequalities of the form px + q > r or px + q < r, where p, q, and r arespecific rational numbers. Graph the solution set of the inequality and interpret it in the context of theproblem. For example: As a salesperson, you are paid $50 per week plus $3 per sale. This week you wantyour pay to be at least $100. Write an inequality for the number of sales you need to make, and describe thesolutions.
Geometry 7.G
Draw construct, and describe geometrical figures and describe the relationships between them.1. Solve problems involving scale drawings of geometric figures, including computing actual lengths and areas
from a scale drawing and reproducing a scale drawing at a different scale.2. Draw (freehand, with ruler and protractor, and with technology) geometric shapes with given conditions. Focus
on constructing triangles from three measures of angles or sides, noticing when the conditions determine aunique triangle, more than one triangle, or no triangle.
10
3. Describe the two-dimensional figures that result from slicing three-dimensional figures, as in plane sections ofright rectangular prisms and right rectangular pyramids.
Solve real-life and mathematical problems involving angle measure, area, surface area, and volume.4. Know the formulas for the area and circumference of a circle and use them to solve problems; give an informal
derivation of the relationship between the circumference and area of a circle.5. Use facts about supplementary, complementary, vertical, and adjacent angles in a multi-step problem to write
and solve simple equations for an unknown angle in a figure.6. Solve real-world and mathematical problems involving area, volume and surface area of two- and three-
dimensional objects composed of triangles, quadrilaterals, polygons, cubes, and right prisms.
Statistics & Probability 7.SP
Use random sampling to draw inferences about a population.1. Understand that statistics can be used to gain information about a population by examining a sample of the
population; generalizations about a population from a sample are valid only if the sample is representative ofthat population. Understand that random sampling tends to produce representative samples and support validinferences.
2. Use data from a random sample to draw inferences about a population with an unknown characteristic ofinterest. Generate multiple samples (or simulated samples) of the same size to gauge the variation in estimatesor predictions. For example, estimate the mean word length in a book by randomly sampling words from thebook; predict the winner of a school election based on randomly sampled survey data. Gauge how far off theestimate or prediction might be.
Draw informal comparative inferences about two populations.3. Informally assess the degree of visual overlap of two numerical data distributions with similar variabilities,
measuring the difference between the centers by expressing it as a multiple of a measure of variability. Forexample, the mean height of players on the basketball team is 10 cm greater than the mean height of players onthe soccer team, about twice the variability (mean absolute deviation) on either team; on a dot plot, theseparation between the two distributions of heights is noticeable.
4. Use measures of center and measures of variability for numerical data from random samples to draw informalcomparative inferences about two populations. For example, decide whether the words in a chapter of aseventh-grade science book are generally longer than the words in a chapter of a fourth-grade science book.
Investigate chance processes and develop, use, and evaluate probability models.5. Understand that the probability of a chance event is a number between 0 and 1 that expresses the likelihood of
the event occurring. Larger numbers indicate greater likelihood. A probability near 0 indicates an unlikelyevent, a probability around 1/2 indicates an event that is neither unlikely nor likely, and a probability near 1indicates a likely event.
6. Approximate the probability of a chance event by collecting data on the chance process that produces it andobserving its long-run relative frequency, and predict the approximate relative frequency given the probability.For example, when rolling a number cube 600 times, predict that a 3 or 6 would be rolled roughly 200 times,but probably not exactly 200 times.
7. Develop a probability model and use it to find probabilities of events. Compare probabilities from a model toobserved frequencies; if the agreement is not good, explain possible sources of the discrepancy.a. Develop a uniform probability model by assigning equal probability to all outcomes, and use the model to
determine probabilities of events. For example, if a student is selected at random from a class, find theprobability that Jane will be selected and the probability that a girl will be selected.
b. Develop a probability model (which may not be uniform) by observing frequencies in data generated froma chance process. For example, find the approximate probability that a spinning penny will land heads upor that a tossed paper cup will land open-end down. Do the outcomes for the spinning penny appear to beequally likely based on the observed frequencies?
8. Find probabilities of compound events using organized lists, tables, tree diagrams, and simulation.a. Understand that, just as with simple events, the probability of a compound event is the fraction of outcomes
in the sample space for which the compound event occurs.

11
b. Represent sample spaces for compound events using methods such as organized lists, tables and treediagrams. For an event described in everyday language (e.g., “rolling double sixes”), identify the outcomesin the sample space which compose the event.
c. Design and use a simulation to generate frequencies for compound events. For example, use random digitsas a simulation tool to approximate the answer to the question: If 40% of donors have type A blood, what isthe probability that it will take at least 4 donors to find one with type A blood?

12
Grade 7 Common Core Mathematics Test Cluster Emphases
Cluster Emphases for Instruction on the 2013 Grade 7 Common Core Mathematics TestCluster Emphasis Recommended Instructional
TimeApproximate Number of Test
PointsMajor 65–75% 70–80%
Supporting 15–25% 10–20%Additional 5–15% 5–10%
CCLS Standard Content
Emphasis
Ratios and Proportional Relationships
7.RP.1 Compute unit rates associated with ratios of fractions, including ratios of lengths, areas
and other quantities measured in like or different units.
Major
7.RP.2 Recognize and represent proportional relationships between quantities Major
7.RP.3 Use proportional relationships to solve multistep ratio and percent problems Major
The Number System
7.NS.1 Apply and extend previous understandings of addition and subtraction to add and
subtract rational numbers; represent addition and subtraction on a horizontal or vertical
number line diagram
Major
7.NS.2 Apply and extend previous understandings of multiplication and division and of fractions
to multiply and divide rational numbers.
Major
7.NS.3 Solve real-world and mathematical problems involving the four operations with rational
numbers
Major
Expressions and Equations
7.EE.1 Apply properties of operations as strategies to add, subtract, factor, and expand linear
expressions with rational coefficients.
Major
7.EE.2 Understand that rewriting an expression in different forms in a problem context can shed
light on the problem and how the quantities in it are related.
Major
7.EE.3 Solve multi-step real-life and mathematical problems posed with positive and negative
rational numbers in any form (whole numbers, fractions, and decimals), using tools
strategically. Apply properties of operations to calculate with numbers in any form;
convert between forms as appropriate; and assess the reasonableness of answers using
mental computation and estimation strategies.
Major
7.EE.4 Use variables to represent quantities in a real-world or mathematical problem, and
construct simple equations and inequalities to solve problems by reasoning about the
quantities.
a. Solve word problems leading to equations of the form px + q = r and p(x + q) = r,
where p, q, and r are specific rational numbers. Solve equations of these forms fluently.
Compare an algebraic solution to an arithmetic solution, identifying the sequence of the
operations used in each approach.
b. Solve word problems leading to inequalities of the form px + q > r or px + q < r,
where p, q, and r are specific rational numbers. Graph the solution set of the inequality
and interpret it in the context of the problem.
Major
Geometry
7.G.1 Solve problems involving scale drawings of geometric figures, such as computing actual
lengths and areas from a scale drawing and reproducing a scale drawing at a different
scale.
Additional

13
7.G.2 Draw (freehand, with ruler and protractor, and with technology) geometric shapes with
given conditions. Focus on constructing triangles from three measures of angles or sides,
noticing when the conditions determine a unique triangle, more than one triangle, or no
triangle.
Additional
Post
7.G.3 Describe the two-dimensional figures that result from slicing three-dimensional figures,
as in plane sections of right rectangular prisms and right rectangular pyramids.
Additional
Post
7.G.4 Know the formulas for the area and circumference of a circle and solve problems; give
an informal derivation of the relationship between the circumference and area of a circle.
Additional
7.G.5 Use facts about supplementary, complementary, vertical, and adjacent angles in a multi-
step problem to write and use them to solve simple equations for an unknown angle in a
figure
Additional
Post
7.G.6 Solve real-world and mathematical problems involving area, volume and surface area of
two- and three-dimensional objects composed of triangles, quadrilaterals, polygons,
cubes, and right prisms
Additional
Post
Statistics and Probability
6.SP.1 Recognize a statistical question as one that anticipates variability in the data related to
the question and accounts for it in the answers.
Additional
6.SP.2 Understand that a set of data collected to answer a statistical question has a distribution
which can be described by its center, spread, and overall shape
Additional
6.SP.3 Recognize that a measure of center for a numerical data set summarizes all of its values
with a single number, while a measure of variation describes how its values vary with a
single number
Additional
6.SP.4 Display numerical data in plots on a number line, including dot plots, histograms, and
box plots
Additional
6.SP.5 Summarize numerical data sets in relation to their context, such as by:
a. Reporting the number of observations
b. Describing the nature of the attribute under investigation, including how it was measured and its
units of measurement.
c. Giving quantitative measures of center (median and/or mean) and variability (interquartile range
and/or mean absolute deviation), as well as describing any overall pattern and any striking
deviations from the overall pattern with reference to the context in which the data were gathered.
d. Relating the choice of measures of center and variability to the shape of the data distribution and
the context in which the data were gathered.
Additional
7.SP.1 Understand that statistics can be used to gain information about a population by
examining a sample of the population; generalizations about a population from a sample
are valid only if the sample is representative of that population. Understand that random
sampling tends to produce representative samples and support valid inferences.
Supporting
7.SP.2 Use data from a random sample to draw inferences about a population with an unknown
characteristic of interest. Generate multiple samples (or simulated samples) of the same
size to gauge the variation in estimates or predictions
Supporting
7.SP.3 Informally assess the degree of visual overlap of two numerical data distributions with
similar variabilities, measuring the difference between the centers by expressing it as a
multiple of a measure of variability.
Additional
7.SP.4 Use measures of center and measures of variability for numerical data from random
samples to draw informal comparative inferences about two populations.
Additional
7.SP.5 Understand that the probability of a chance event is a number between 0 and 1 that
expresses the likelihood of the event occurring. Larger numbers indicate greater
likelihood.
Supporting

14
7.SP.6 Approximate the probability of a chance event by collecting data on the chance process
that produces it and observing its long-run relative frequency, and predict the
approximate relative frequency given the probability.
Supporting
7.SP.7 Develop a probability model and use it to find probabilities of events. Compare
probabilities from a model to observed frequencies; if the agreement is not good, explain
possible sources of the discrepancy
Supporting
7.SP.8 Find probabilities of compound events using organized lists, tables, tree diagrams, and
simulation.
Supporting
= Standards recommended for greater emphasis
Post = Standards recommended for instruction in May-June

15
MATHEMATICS 7 PACING GUIDE
This guide using NYS Grade 7 Mathematics CCLS Modules was created to provide teachers with a time frame to complete theGrade 7 New York State Mathematics Curriculum.
Module Unit Title Standards Days Month i-Ready Lessons
1Ratios and Proportional
Relationships7.RP.1, 7.RP.2, 7.RP.3, 7.EE.4, 7.G.1 26 Sept. 8 – Oct. 19
Topic A – 10; Topic B – 11;Topic C – 9, 12, 13; Topic D – 22
2 Rational Numbers7.NS.1, 7.NS.2, 7.NS.3, 7.EE.2,
7.EE.426 Oct. 20 – Nov. 25
Topic A – 1, 2, 3, 7; Topic B – 4,5, 6; Topic C - 8
3 Expressions and Equations7.EE.1, 7.EE.2, 7.EE.3, 7.EE.4, 7.G.4,
7.G.5, 7.G.631 Nov. 30 – Jan. 21
Topic A – 14, 15; Topic B – 16,17, 18; Topic C – 20, 21, 23, 24
4Percent and Proportional
Relationships7.RP.1, 7.RP.2, 7.RP.3, 7.EE.3, 7.G.1 23 Jan. 22 – Mar. 1
Topic A – 12; Topic B – 13;Topic C – 22; Topic D – 12, 13
5 Statistics and Probability7.SP.1, 7.SP.2, 7.SP.3, 7.SP.4, 7.SP.5,
7.SP.6, 7.SP.7, 7.SP.824 Mar. 2 – Apr. 12
Topic A – 30, 31, 33; Topic B –32; Topic C – 26, 27; Topic D –
28, 29
NYSED GRADE 7 MATHEMATICS TEST: WEDNESDAY, APRIL 13 – FRIDAY, APRIL 15, 2016
6 Geometry 7.G.2, 7.G.3, 7.G.5, 7.G.6 43 Apr. 18 – June 17Topic A – 18; Topic B – 19;
Topic C – 25; Topic D – 20, 21,24; Topic E – 23
Red – End of Module Assessment PeriodGreen – Priority Standards account for approximately 70-80% of number of test points.
Note that the curriculum assumes that each school day includes 40-45 minutes of math: 30-35 minutes on the day’s Session, and 5-10 minutes on Fluencyactivities. Designed to fit within the calendar of a typical school year, grade 7 includes a total of 139 lessons. This provides some leeway for going further withparticular ideas and/or accommodating local circumstances. Although pacing will vary somewhat in response to variations in school calendars, needs of students,your school's years of experience with the curriculum, and other local factors, following the suggested pacing and sequence will ensure that students benefit fromthe way mathematical ideas are introduced, developed, and revisited across the year.

16
Module Unit Title Standards Days Month i-Ready Lessons
1Ratios and Proportional
Relationships7.RP.1, 7.RP.2, 7.RP.3,
7.EE.4, 7.G.126 Sept. 8 – Oct. 19
Topic A – 10; Topic B – 11; TopicC – 9, 12, 13; Topic D – 22
In Module 1, students build on their Grade 6 experiences with ratios, unit rates, and fraction division to analyze proportionalrelationships. They decide whether two quantities are in a proportional relationship, identify constants of proportionality, andrepresent the relationship by equations. These skills are then applied to real-world problems including scale drawings.
Standards Topics Days
7.RP.2a A Proportional RelationshipsLesson 1: An Experience in Relationships as Measuring RateLesson 2: Proportional RelationshipsLessons 3–4: Identifying Proportional and Non-Proportional Relationships in TablesLessons 5–6: Identifying Proportional and Non-Proportional Relationships in Graphs
6
7.RP.2b7.RP.2c7.RP.2d7.EE.4a
B Unit Rate and the Constant of ProportionalityLesson 7: Unit Rate as the Constant of ProportionalityLessons 8–9: Representing Proportional Relationships with EquationsLesson 10: Interpreting Graphs of Proportional Relationships
4
Mid-Module Assessment: Topics A through B (assessment 1 day, remediation or furtherapplications 1 day)
2
7.RP.17.RP.37.EE.4a
C Ratios and Rates Involving FractionsLessons 11–12: Ratios of Fractions and Their Unit RatesLesson 13: Finding Equivalent Ratios Given the Total QuantityLesson 14: Multistep Ratio ProblemsLesson 15: Equations of Graphs of Proportional Relationships Involving Fractions
5
7.RP.2b7.G.1
D Ratios of Scale DrawingsLesson 16: Relating Scale Drawings to Ratios and Rates
7
17
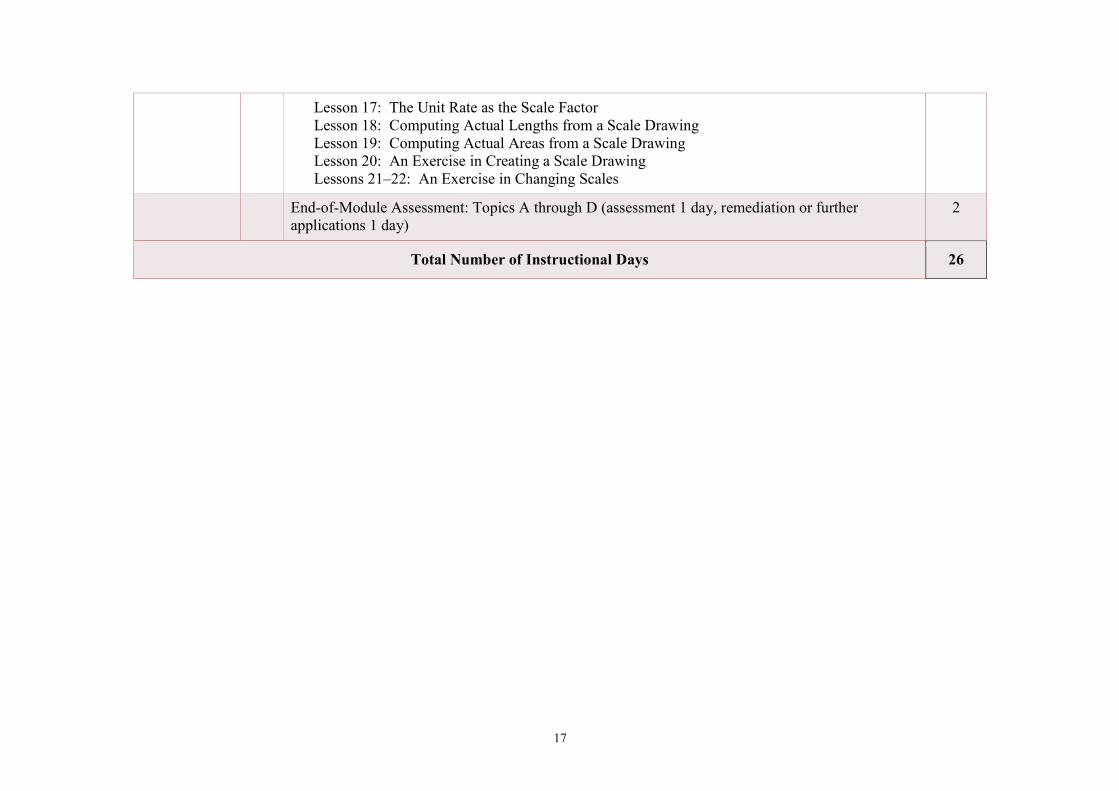
Lesson 17: The Unit Rate as the Scale FactorLesson 18: Computing Actual Lengths from a Scale DrawingLesson 19: Computing Actual Areas from a Scale DrawingLesson 20: An Exercise in Creating a Scale DrawingLessons 21–22: An Exercise in Changing Scales
End-of-Module Assessment: Topics A through D (assessment 1 day, remediation or furtherapplications 1 day)
2
Total Number of Instructional Days 26
18
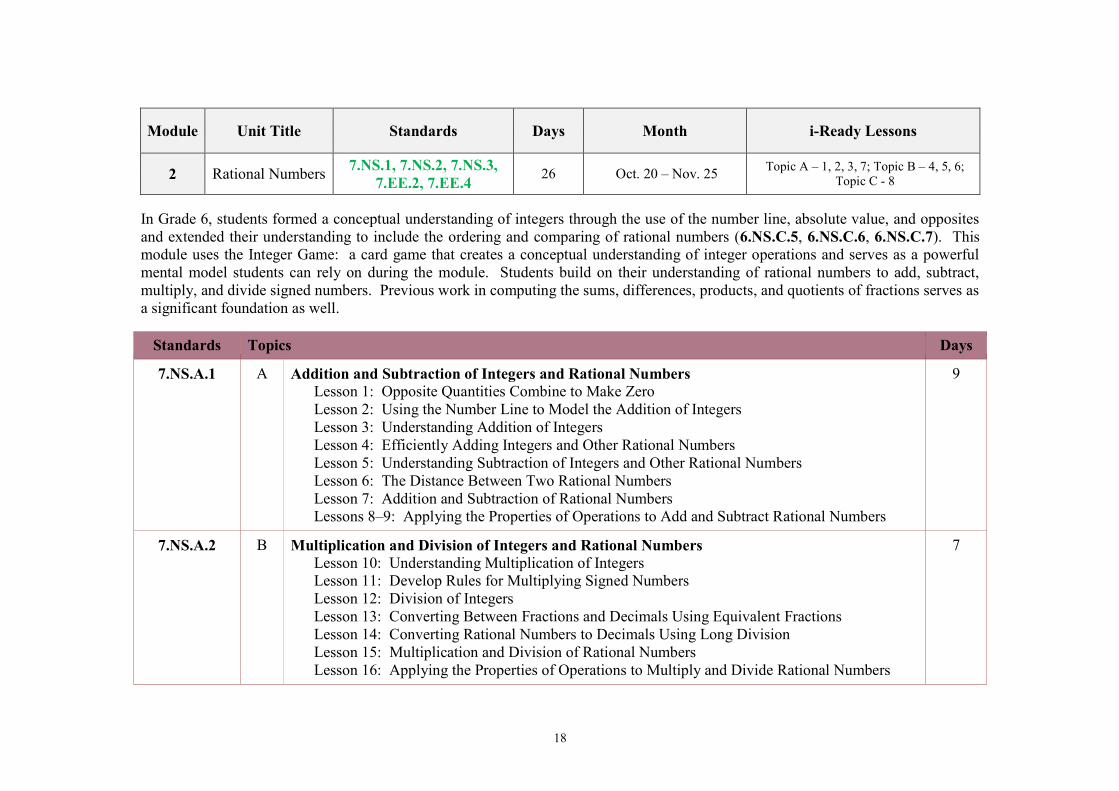
Module Unit Title Standards Days Month i-Ready Lessons
2 Rational Numbers7.NS.1, 7.NS.2, 7.NS.3,
7.EE.2, 7.EE.426 Oct. 20 – Nov. 25
Topic A – 1, 2, 3, 7; Topic B – 4, 5, 6;Topic C - 8
In Grade 6, students formed a conceptual understanding of integers through the use of the number line, absolute value, and oppositesand extended their understanding to include the ordering and comparing of rational numbers (6.NS.C.5, 6.NS.C.6, 6.NS.C.7). Thismodule uses the Integer Game: a card game that creates a conceptual understanding of integer operations and serves as a powerfulmental model students can rely on during the module. Students build on their understanding of rational numbers to add, subtract,multiply, and divide signed numbers. Previous work in computing the sums, differences, products, and quotients of fractions serves asa significant foundation as well.
Standards Topics Days
7.NS.A.1 A Addition and Subtraction of Integers and Rational NumbersLesson 1: Opposite Quantities Combine to Make ZeroLesson 2: Using the Number Line to Model the Addition of IntegersLesson 3: Understanding Addition of IntegersLesson 4: Efficiently Adding Integers and Other Rational NumbersLesson 5: Understanding Subtraction of Integers and Other Rational NumbersLesson 6: The Distance Between Two Rational NumbersLesson 7: Addition and Subtraction of Rational NumbersLessons 8–9: Applying the Properties of Operations to Add and Subtract Rational Numbers
9
7.NS.A.2 B Multiplication and Division of Integers and Rational NumbersLesson 10: Understanding Multiplication of IntegersLesson 11: Develop Rules for Multiplying Signed NumbersLesson 12: Division of IntegersLesson 13: Converting Between Fractions and Decimals Using Equivalent FractionsLesson 14: Converting Rational Numbers to Decimals Using Long DivisionLesson 15: Multiplication and Division of Rational NumbersLesson 16: Applying the Properties of Operations to Multiply and Divide Rational Numbers
7

19
Mid-Module Assessment: Topics A through B (assessment 1 day, remediation or furtherapplications 1 day)
2
7.NS.A.37.EE.A.27.EE.B.4a
C Applying Operations with Rational Numbers to Expressions and EquationsLesson 17: Comparing Tape Diagram Solutions to Algebraic SolutionsLessons 18–19: Writing, Evaluating, and Finding Equivalent Expressions with RationalNumbersLesson 20: Investments—Performing Operations with Rational NumbersLesson 21: If-Then Moves with Integer Number CardsLessons 22–23: Solving Equations Using Algebra
5
End-of-Module Assessment: Topics A through C (assessment 1 day, remediation or furtherapplications 2 days)
3
Total Number of Instructional Days 26
20
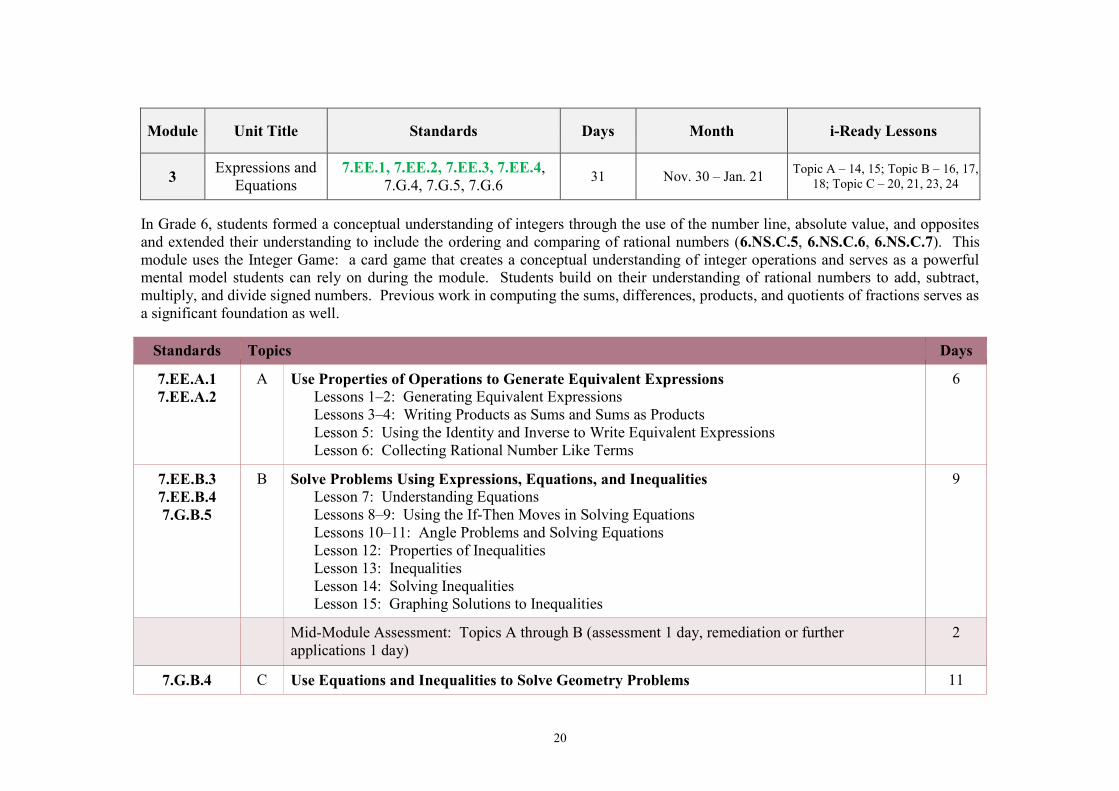
Module Unit Title Standards Days Month i-Ready Lessons
3Expressions and
Equations7.EE.1, 7.EE.2, 7.EE.3, 7.EE.4,
7.G.4, 7.G.5, 7.G.631 Nov. 30 – Jan. 21
Topic A – 14, 15; Topic B – 16, 17,18; Topic C – 20, 21, 23, 24
In Grade 6, students formed a conceptual understanding of integers through the use of the number line, absolute value, and oppositesand extended their understanding to include the ordering and comparing of rational numbers (6.NS.C.5, 6.NS.C.6, 6.NS.C.7). Thismodule uses the Integer Game: a card game that creates a conceptual understanding of integer operations and serves as a powerfulmental model students can rely on during the module. Students build on their understanding of rational numbers to add, subtract,multiply, and divide signed numbers. Previous work in computing the sums, differences, products, and quotients of fractions serves asa significant foundation as well.
Standards Topics Days
7.EE.A.17.EE.A.2
A Use Properties of Operations to Generate Equivalent ExpressionsLessons 1–2: Generating Equivalent ExpressionsLessons 3–4: Writing Products as Sums and Sums as ProductsLesson 5: Using the Identity and Inverse to Write Equivalent ExpressionsLesson 6: Collecting Rational Number Like Terms
6
7.EE.B.37.EE.B.47.G.B.5
B Solve Problems Using Expressions, Equations, and InequalitiesLesson 7: Understanding EquationsLessons 8–9: Using the If-Then Moves in Solving EquationsLessons 10–11: Angle Problems and Solving EquationsLesson 12: Properties of InequalitiesLesson 13: InequalitiesLesson 14: Solving InequalitiesLesson 15: Graphing Solutions to Inequalities
9
Mid-Module Assessment: Topics A through B (assessment 1 day, remediation or furtherapplications 1 day)
2
7.G.B.4 C Use Equations and Inequalities to Solve Geometry Problems 11
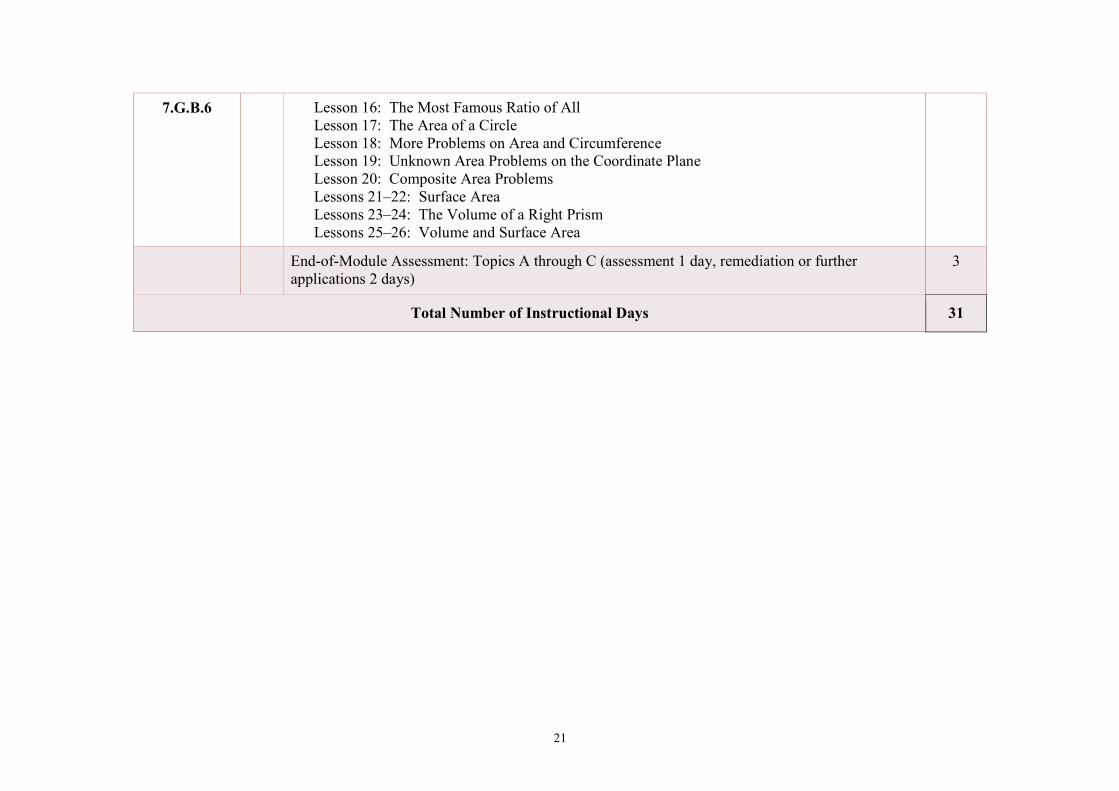
21
7.G.B.6 Lesson 16: The Most Famous Ratio of AllLesson 17: The Area of a CircleLesson 18: More Problems on Area and CircumferenceLesson 19: Unknown Area Problems on the Coordinate PlaneLesson 20: Composite Area ProblemsLessons 21–22: Surface AreaLessons 23–24: The Volume of a Right PrismLessons 25–26: Volume and Surface Area
End-of-Module Assessment: Topics A through C (assessment 1 day, remediation or furtherapplications 2 days)
3
Total Number of Instructional Days 31

22
Module Unit Title Standards Days Month i-Ready Lessons
4Percent and Proportional
Relationships7.RP.1, 7.RP.2, 7.RP.3,
7.EE.3, 7.G.123 Jan. 22 – Mar. 1
Topic A – 12; Topic B – 13; Topic C –22; Topic D – 12, 13
In Module 4, students deepen their understanding of ratios and proportional relationships from Module 1 (7.RP.A.1, 7.RP.A.2,7.RP.A.3, 7.EE.B.4, 7.G.A.1) by solving a variety of percent problems. They convert between fractions, decimals, and percents tofurther develop a conceptual understanding of percent (introduced in Grade 6 Module 1) and use algebraic expressions and equations
to solve multi-step percent problems (7.EE.B.3). An initial focus on relating to “the whole” serves as a foundation for students.Students begin the module by solving problems without using a calculator to develop an understanding of the reasoning underlying thecalculations. Material in early lessons is designed to reinforce students’ understanding by having them use mental math and basiccomputational skills. To develop a conceptual understanding, students will use visual models and equations, building on their earlierwork with these. As the lessons and topics progress and students solve multi-step percent problems algebraically with numbers thatare not as compatible, teachers may let students use calculators so that their computational work does not become a distraction. Thiswill also be noted in the teacher’s lesson materials.
Standards Topics Days
7.RP.A.1,7.RP.A.2c,7.RP.A.3
A Finding the WholeLesson 1: PercentLesson 2: Part of a Whole as a PercentLesson 3: Comparing Quantities with PercentLesson 4: Percent Increase and DecreaseLesson 5: Finding One-Hundred Percent Given Another PercentLesson 6: Fluency with Percents
6
7.RP.A.17.RP.A.27.RP.A.37.EE.B.3
B Percent Problems Including More than One WholeLesson 7: Markup and Markdown ProblemsLesson 8: Percent Error ProblemsLesson 9: Problem-Solving when the Percent ChangesLesson 10: Simple InterestLesson 11: Tax, Commissions, Fees, and Other Real-World Percent Problems
5

23
Mid-Module Assessment: Topics A through B (assessment 1 day, remediation or furtherapplications 1 day)
2
7.RP.A.2b7.G.A.1
C Scale DrawingsLesson 12: The Scale Factor as a Percent for a Scale DrawingLesson 13: Changing ScalesLesson 14: Computing Actual Lengths from a Scale DrawingLesson 15: Solving Area Problems Using Scale Drawings
4
7.RP.A.2c7.RP.A.37.EE.B.3
D Population, Mixture, and Counting Problems Involving PercentsLesson 16: Population ProblemsLesson 17: Mixture ProblemsLesson 18: Counting Problems
3
End-of-Module Assessment: Topics A through D (assessment 1 day, remediation or furtherapplications 2 days)
3
Total Number of Instructional Days 22
24
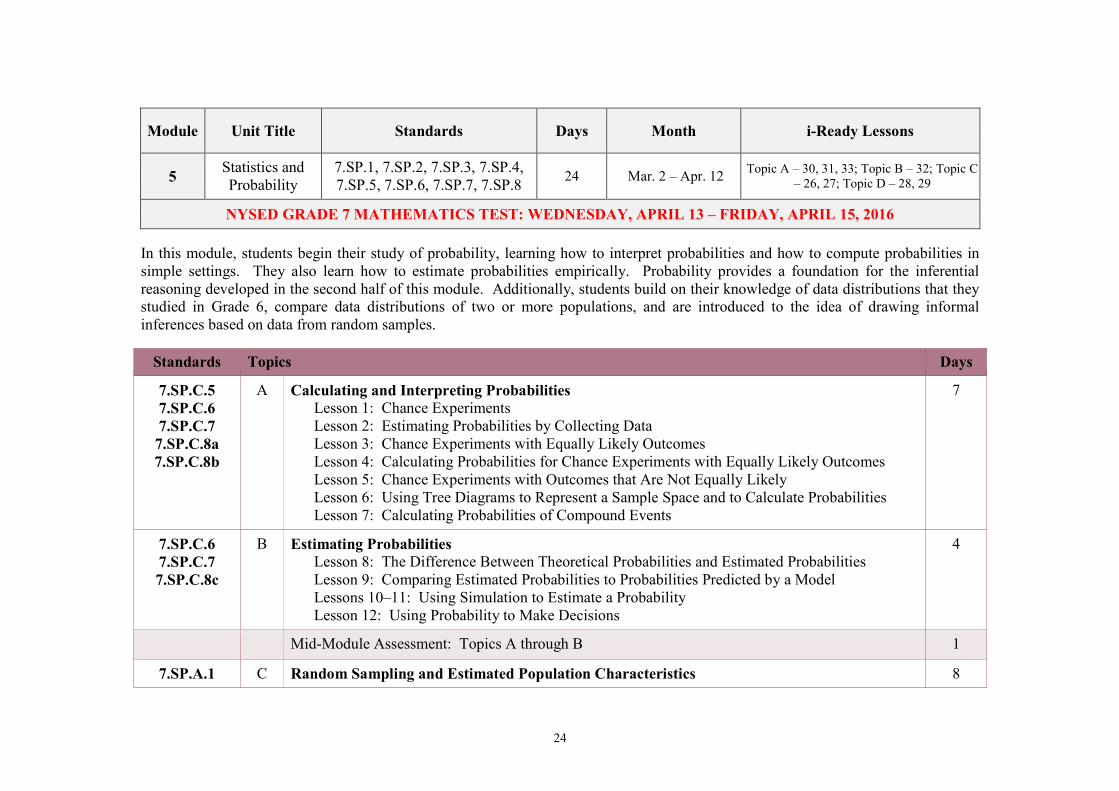
Module Unit Title Standards Days Month i-Ready Lessons
5Statistics andProbability
7.SP.1, 7.SP.2, 7.SP.3, 7.SP.4,7.SP.5, 7.SP.6, 7.SP.7, 7.SP.8
24 Mar. 2 – Apr. 12Topic A – 30, 31, 33; Topic B – 32; Topic C
– 26, 27; Topic D – 28, 29
NYSED GRADE 7 MATHEMATICS TEST: WEDNESDAY, APRIL 13 – FRIDAY, APRIL 15, 2016
In this module, students begin their study of probability, learning how to interpret probabilities and how to compute probabilities insimple settings. They also learn how to estimate probabilities empirically. Probability provides a foundation for the inferentialreasoning developed in the second half of this module. Additionally, students build on their knowledge of data distributions that theystudied in Grade 6, compare data distributions of two or more populations, and are introduced to the idea of drawing informalinferences based on data from random samples.
Standards Topics Days
7.SP.C.57.SP.C.67.SP.C.77.SP.C.8a7.SP.C.8b
A Calculating and Interpreting ProbabilitiesLesson 1: Chance ExperimentsLesson 2: Estimating Probabilities by Collecting DataLesson 3: Chance Experiments with Equally Likely OutcomesLesson 4: Calculating Probabilities for Chance Experiments with Equally Likely OutcomesLesson 5: Chance Experiments with Outcomes that Are Not Equally LikelyLesson 6: Using Tree Diagrams to Represent a Sample Space and to Calculate ProbabilitiesLesson 7: Calculating Probabilities of Compound Events
7
7.SP.C.67.SP.C.77.SP.C.8c
B Estimating ProbabilitiesLesson 8: The Difference Between Theoretical Probabilities and Estimated ProbabilitiesLesson 9: Comparing Estimated Probabilities to Probabilities Predicted by a ModelLessons 10–11: Using Simulation to Estimate a ProbabilityLesson 12: Using Probability to Make Decisions
4
Mid-Module Assessment: Topics A through B 1
7.SP.A.1 C Random Sampling and Estimated Population Characteristics 8

25
7.SP.A.2 Lesson 13: Populations, Samples, and Generalizing from a Sample to a PopulationLesson 14: Selecting a SampleLesson 15: Random SamplingLesson 16: Methods for Selecting a Random SampleLesson 17: Sampling VariabilityLesson 18: Estimating a Population MeanLesson 19: Understanding Variability when Estimating a Population ProportionLesson 20: Estimating a Population Proportion
7.SP.B.37.SP.B.4
D Topic D: Comparing PopulationsLesson 21: Why Worry About Sampling Variability?Lessons 22–23: Using Sample Data to Decide if Two Population Means Are Different
2
End-of-Module Assessment: Topics A through D (assessment 1 day, remediation or furtherapplications 1 day)
2
Total Number of Instructional Days 24

26
Module Unit Title Standards Days Month i-Ready Lessons
6 Geometry 7.G.2, 7.G.3, 7.G.5, 7.G.6 43 Apr. 18 – June 17Topic A – 18; Topic B – 19; Topic C – 25;
Topic D – 20, 21, 24; Topic E – 23
In Module 6, students delve further into several geometry topics they have been developing over the years. Grade 7 presents some ofthese topics (e.g., angles, area, surface area, and volume) in the most challenging form students have experienced yet. Module 6assumes students understand the basics; the goal is to build a fluency in these difficult problems. The remaining topics (i.e., workingon constructing triangles and taking slices (or cross sections) of three-dimensional figures) are new to students.
Standards Topics Days
7.G.B.5 A Unknown AnglesLesson 1: Complementary and Supplementary AnglesLessons 2–4: Solve for Unknown Angles using Equations
6
7.G.A.2 B Constructing TrianglesLesson 5: Unique TrianglesLesson 6: Drawing Geometric ShapesLesson 7: Drawing ParallelogramsLesson 8: Drawing Triangles
Lesson 9: Conditions for a Unique Triangle―Three Sides and Two Sides and the Included AngleLesson 10: Conditions for a Unique Triangle—Two Angles and a Given SideLesson 11: Conditions on Measurements that Determine a Triangle
Lesson 12: Unique Triangles―Two Sides and a Non-Included Angle Lessons 13–14: Checking for Identical TrianglesLesson 15: Using Unique Triangles to Solve Real-World and Mathematical Problems
14
Mid-Module Assessment: Topics A through B (assessment 1 day, remediation or furtherapplications 1 day)
2
7.G.A.3 C Slicing Solids 6

27
Lessons 16: Slicing a Right Rectangular Prism with a PlaneLesson 17: Slicing a Right Rectangular Pyramid with a PlaneLesson 18: Slicing on an AngleLesson 19: Understanding Three-Dimensional Figures
7.G.B.6 D Problems Involving Area and Surface AreaLesson 20: Real-World Area ProblemsLesson 21: Mathematical Area ProblemsLesson 22: Area Problems with Circular RegionsLessons 23–24: Surface Area
7
7.G.B.6 E Problems Involving VolumeLesson 25: Volume of Right PrismsLesson 26: Volume of Composite Three-Dimensional ObjectsLesson 27: Real-World Volume Problems
5
End-of-Module Assessment: Topics C through E (assessment 1 day, remediation or furtherapplications 2 days)
3
Total Number of Instructional Days 43

WORD WALLS ARE DESIGNED …
to promote group learning support the teaching of important general principles about words and how they work Foster reading and writing in content area Provide reference support for children during their reading and writing Promote independence on the part of young students as they work with words Provide a visual map to help children remember connections between words and the
characteristics that will help them form categories Develop a growing core of words that become part of their vocabulary
Important Notice A Mathematics Word Wall must be present in every mathematics classroom.
Math Word Wall
Create a math wordwall
Place math words onyour current wordwall but highlightthem in some way.

29
SETUP OF THE MATHEMATICS CLASSROOM
I. Prerequisites for a Mathematics Classroom Teacher Schedule Class List Seating Chart Code of Conduct / Discipline Grade Level Common Core Learning Standards (CCLS) Updated Mathematics Student Work Mathematics Grading Policy Mathematics Diagrams, Charts, Posters, etc. Grade Level Number Line Grade Level Mathematics Word Wall Mathematics Portfolios Mathematics Center with Manipulatives (Grades K - 12)
II. Updated Student WorkA section of the classroom must display recent student work. This can be of anytype of assessment, graphic organizer, and writing activity. Teacher feedback mustbe included on student’s work.
III. Board Set-UpEvery day, teachers must display the Lesson # and Title, Objective(s), CommonCore Learning Standard(s), Opening Exercise and Homework. At the start ofthe class, students are to copy this information and immediately begin on theFluency Activity or Opening Exercise.
IV. Spiraling HomeworkHomework is used to reinforce daily learning objectives. The secondary purposeof homework is to reinforce objectives learned earlier in the year. Theassessments are cumulative, spiraling homework requires students to reviewcoursework throughout the year.
Student’s Name: School:
Teacher’s Name: Date:
Lesson # and Title:
Objective(s)
CCLS:
Opening Exercise:

30
SECONDARY MATHEMATICS GRADING POLICY
This course of study includes different components, each of which are assigned the
following percentages to comprise a final grade. I want you--the student--to understand
that your grades are not something that I give you, but rather, a reflection of the work
that you give to me.
COMPONENTS
1. Common Assessments → 35%
2. Quizzes → 20%
3. Homework → 20%
4. Notebook and/or Journal → 10%
5. Classwork / Class Participation → 15%
o Class participation will play a significant part in the determination of your
grade. Class participation will include the following: attendance, punctuality
to class, contributions to the instructional process, effort, contributions during
small group activities and attentiveness in class.
Important Notice
As per MVCSD Board Resolution 06-71, the Parent Notification Policy states
“Parent(s) / guardian(s) or adult students are to be notified, in writing, at any time during
a grading period when it is apparent - that the student may fail or is performing
unsatisfactorily in any course or grade level. Parent(s) / guardian(s) are also to be
notified, in writing, at any time during the grading period when it becomes evident that
the student's conduct or effort grades are unsatisfactory.”

31
SAMPLE NOTEBOOK SCORING RUBRIC
Student Name:
_________________________________________________
Teacher Name:
___________________________________________
Criteria 4 3 2 1 Points
Completion ofRequired Sections
All requiredsections arecomplete.
One requiredsection ismissing.
Two or threerequired sections
are missing.
More than threerequired sections
are missing.
Missing SectionsNo sections of
the notebook aremissing.
One sections ofthe notebook is
missing.
Two sections of thenotebook are
missing.
Three or moresections of thenotebook are
missing.
Headers / Footers
No requiredheader(s) and/or
footer(s) aremissing within
notebook.
One or tworequired
header(s) and/orfooter(s) are
missing withinnotebook.
Three or fourrequired header(s)and/or footer(s) are
missing withinnotebook.
More than fourrequired header(s)and/or footer(s) are
missing withinnotebook.
Organization
All assignmentand/or notes arekept in a logical
or numericalsequence.
One or twoassignments
and/or notes arenot in a logical or
numericalsequence.
Three or Fourassignments and/ornotes are not in a
logical ornumericalsequence.
More than fourassignments and/ornotes are not in a
logical ornumericalsequence.
NeatnessOverall notebookis kept very neat.
Overall notebookis kept in asatisfactorycondition.
Overall notebook iskept in a below
satisfactorycondition.
Overall notebook isunkept and very
disorganized.
Total
Teacher’s Comments:

32
CLASSROOM AESTHETICS
“PRINT–RICH” ENVIRONMENT CONDUCIVE TO LEARNING
TEACHER NAME: _________________________________________________________
COURSE / PERIOD: _________________________________________________________
ROOM: _________________________________________________________
CHECKLISTYES NO
Teacher Schedule
Class List
Seating Chart
Code of Conduct / Discipline
Grade Level Mathematics CCLS
Mathematics Grading Policy
Mathematics Diagrams, Posters, Displays, etc.
Grade Level Number Line
Updated Student Work (Projects, Assessments, Writing, etc.)
Updated Student Portfolios
Updated Grade Level Mathematics Word-Wall
Mathematics Centers with Manipulatives
Organization of Materials
Cleanliness
Principal Signature: _________________________________________ Date: ____________
Asst. Pri. Signature: _________________________________________ Date: ____________

33
SYSTEMATIC DESIGN OF A MATHEMATICS LESSON
What are the components of a Mathematics Block?
ComponentFluency Practice Information processing theory supports the view that automaticity in math facts is
fundamental to success in many areas of higher mathematics. Without the ability to retrievefacts directly or automatically, students are likely to experience a high cognitive load as theyperform a range of complex tasks. The added processing demands resulting from inefficientmethods such as counting (vs. direct retrieval) often lead to declarative and procedural errors.Accurate and efficient retrieval of basic math facts is critical to a student’s success inmathematics.
Opening Exercise - Whole Group This can be considered the motivation or Do Now of the lesson It should set the stage for the day's lesson Introduction of a new concept, built on prior knowledge Open-ended problemsConceptual Development - Whole Group (Teacher Directed, Student Centered) Inform students of what they are going to do. Refer to Objectives. Refer to the Key Words
(Word Wall) Define the expectations for the work to be done Provide various demonstrations using modeling and multiple representations (i.e. model a
strategy and your thinking for problem solving, model how to use a ruler to measure items,model how to use inch graph paper to find the perimeter of a polygon,)
Relate to previous work Provide logical sequence and clear explanations Provide medial summaryApplication Problems - Cooperative Groups, Pairs, Individuals, (Student Interaction &Engagement, Teacher Facilitated) Students try out the skill or concept learned in the conceptual development Teachers circulate the room, conferences with the students and assesses student work (i.e.
teacher asks questions to raise the level of student thinking) Students construct knowledge around the key idea or content standard through the use of
problem solving strategies, manipulatives, accountable/quality talk, writing, modeling,technology applied learning
Student Debrief - Whole Group (Teacher Directed, Student Centered) Students discuss their work and explain their thinking Teacher asks questions to help students draw conclusions and make references Determine if objective(s) were achieved Students summarize what was learned Allow students to reflect, share (i.e. read from journal)Homework/Enrichment - Whole Group (Teacher Directed, Student Centered) Homework is a follow-up to the lesson which may involve skill practice, problem solving
and writing

34
Homework, projects or enrichment activities should be assigned on a daily basis. SPIRALLING OF HOMEWORK - Teacher will also assign problems / questions pertaining to
lessons taught in the past
Remember: Assessments are on-going based on students’ responses.Assessment: Independent Practice (It is on-going! Provide formal assessment whennecessary / appropriate) Always write, use and allow students to generate Effective Questions for optimal learning Based on assessment(s), Re-teach the skill, concept or content using alternative strategies
and approaches
Important Notice
All lessons must be numbered with corresponding homework. For example, lesson #1 will
corresponded to homework #1 and so on.
Writing assignments at the end of the lesson (closure) bring great benefits. Not only do they
enhance students' general writing ability, but they also increase both the understanding of
content while learning the specific vocabulary of the disciplines.
Spiraling Homework
o Homework is used to reinforce daily learning objectives. The secondary purpose of
homework is to reinforce objectives learned earlier in the year. The assessments are
cumulative, spiraling homework requires students to review coursework throughout the
year.
Manipulative must be incorporated in all lessons. With students actively involved in
manipulating materials, interest in mathematics will be aroused. Using manipulative
materials in teaching mathematics will help students learn:
a. to relate real world situations to mathematics symbolism.
b. to work together cooperatively in solving problems.
c. to discuss mathematical ideas and concepts.
d. to verbalize their mathematics thinking.
e. to make presentations in front of a large group.
f. that there are many different ways to solve problems.
g. that mathematics problems can be symbolized in many different ways.
h. that they can solve mathematics problems without just following teachers' directions.