CCentral & Eastern European Strategyentral & Eastern ... · Please note the risk notifi cations...
68
Please note the risk notifications and explanations at the end of this document Central & Eastern European Strategy Central & Eastern European Strategy 4 th quarter 2016 www.raiffeisenresearch.com Monetary tailwind continues Expansionary ECB with spillover effects ... … supportive for equities and bonds in CEE Neutral positioning for major CE/SEE currencies Russia to overcome recession only gradually
Transcript of CCentral & Eastern European Strategyentral & Eastern ... · Please note the risk notifi cations...
Please note the risk notifi cations and explanations at the end of this document
Central & Eastern European StrategyCentral & Eastern European Strategy4th quarter 2016
www.raiffeisenresearch.com
Monetary tailwind continues
Expansionary ECB with spillover effects ...
… supportive for equities and bonds in CEE
Neutral positioning for major CE/SEE currencies
Russia to overcome recession only gradually
2 Please note the risk notifi cations and explanations at the end of this document
Content
Executive summary: Expansive monetary policy for the forseeable future in CEE as well 3Forecasts CEE incl. Austria 4Asset allocation CEE incl. Austria 6Focus on monetary policy 10Focus on economics 11Focus on FX 12Focus on LCY bonds 13Austria 14CE: Poland 16 Hungary 18 Czech Republic 20 Slovakia 22 Slovenia 24SEE: Bulgaria 25 Romania 26 Croatia 28 Serbia 30 Bosnia and Herzegovina 31 Albania 32EE: Belarus 33 Russia 34 Ukraine 36Turkey 38Sovereign Eurobonds 40Corporate Eurobonds 42Equity markets 44Technical analysis 50Equity markets: Sector weightings in comparison 52Sectors 53Equities – top picks 55Risk notifi cations and explanations 60Disclaimer 66Imprint 67
Central & Eastern European Strategy
Explanation:e ... estimate (current year)f ... forecastp ... preliminary figures n.v. ... no value
AbbreviationsCurrencies and CountriesALL Albanian lekBAM Bosnian markaBGN Bulgarian levBYN Belarusian roubelCZK Czech korunaHUF Hungarian forintHRK Croatian kunaPLN Polish zlotyRON Romanian leuRSD Serbian dinarRUB Russian roubleTRY Turkish liraUAH Ukrainian hryvnia
Economic abbreviations %-chg Percentage change (not in percentage points)avg averagebp basis pointsC/A Current AccountCPI Consumer Price IndexECB European Central BankFCY Foreign CurrencyFDI Foreign Direct InvestmentsFX Foreign ExchangeFY Full yearGB Government bondGDP Gross Domestic ProductHCPI Harmonized Consumer Price IndexLCY Local Currency
mmav month moving averagemom month on monthMP Monetary policyMPC Monetary policy councilO/N overnight rate pp percentage pointsPMI Purchasing Manager IndexPPI Producer Price IndexQE Quantitativ easingqoq quarter on quarterqtd quarter to dateREPO Repurchase agreementT/B Trade BalanceULC Unit Labour CostsUST US Treasury bondYC yield curveyoy year on yearytd year-to-date
Sovereign Bond marketsCZGB Czech local currency government bonds HGB Hungarian local currency government bondsPOLGB Polish local currency government bondsROMGB Romanian local currency government bondsTURKGB Turkish local currency government bonds
Stock Exchange IndicesATX Austrian stock indexBET Romanian stock indexBIST National 100 Turkish stock indexBUX Hungarian stock indexPX Czech stock indexMICEX Russian stock indexWIG 20 Polish stock index
Fixed income indicesEMBIG JP Morgan Emerging Markets Bond Index GlobalCEMBI JP Morgan Corporate Emerging Markets Bond Index
Equity relatedDY Dividend yieldEBIT Earnings before interest and taxes EBITDA earnings before interest, taxes, depreciation, and amortization EBT earnings before taxesEPS earnings per shareEG Earnings growthLTG Long term (earnings) growthNIBD Net interest bearing debt P/B Price book ratioP/E ratio Price earnings ratio RoE Return on equityROCE Return on capital employedRS Recommendation suspendedUR Under Revision
Euro area (EA) Austria, Belgium, Cyprus, Estonia, Finland, France, Germany, Greece, Ireland, Italy, Latvia, Lithuania, Luxembourg, Malta, Netherlands, Portu-gal, Slovenia, Slovakia, Spain
CE Central European countries – Poland, Hungary, Czech Republic, Slovakia, Slovenia
SEE South East European countries – Albania, Bosnia and Herzegovina, Bulgaria, Croatia, Kosovo, Ro-mania, Serbia
EE Eastern Europe (Russia, Ukraine, Belarus)CEE Central and Eastern Europe (CE + SEE + EE)
3Please note the risk notifi cations and explanations at the end of this document
Executive summary
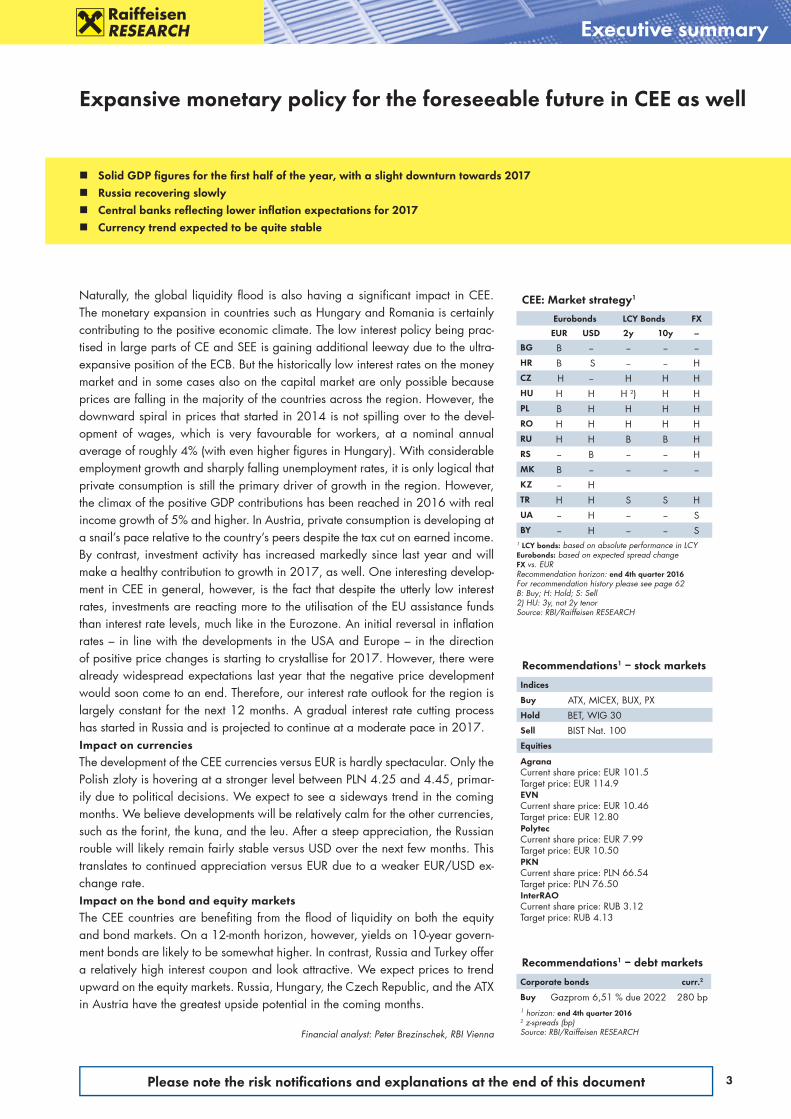
Naturally, the global liquidity flood is also having a significant impact in CEE. The monetary expansion in countries such as Hungary and Romania is certainly contributing to the positive economic climate. The low interest policy being prac-tised in large parts of CE and SEE is gaining additional leeway due to the ultra-expansive position of the ECB. But the historically low interest rates on the money market and in some cases also on the capital market are only possible because prices are falling in the majority of the countries across the region. However, the downward spiral in prices that started in 2014 is not spilling over to the devel-opment of wages, which is very favourable for workers, at a nominal annual average of roughly 4% (with even higher figures in Hungary). With considerable employment growth and sharply falling unemployment rates, it is only logical that private consumption is still the primary driver of growth in the region. However, the climax of the positive GDP contributions has been reached in 2016 with real income growth of 5% and higher. In Austria, private consumption is developing at a snail’s pace relative to the country’s peers despite the tax cut on earned income. By contrast, investment activity has increased markedly since last year and will make a healthy contribution to growth in 2017, as well. One interesting develop-ment in CEE in general, however, is the fact that despite the utterly low interest rates, investments are reacting more to the utilisation of the EU assistance funds than interest rate levels, much like in the Eurozone. An initial reversal in inflation rates – in line with the developments in the USA and Europe – in the direction of positive price changes is starting to crystallise for 2017. However, there were already widespread expectations last year that the negative price development would soon come to an end. Therefore, our interest rate outlook for the region is largely constant for the next 12 months. A gradual interest rate cutting process has started in Russia and is projected to continue at a moderate pace in 2017. Impact on currenciesThe development of the CEE currencies versus EUR is hardly spectacular. Only the Polish zloty is hovering at a stronger level between PLN 4.25 and 4.45, primar-ily due to political decisions. We expect to see a sideways trend in the coming months. We believe developments will be relatively calm for the other currencies, such as the forint, the kuna, and the leu. After a steep appreciation, the Russian rouble will likely remain fairly stable versus USD over the next few months. This translates to continued appreciation versus EUR due to a weaker EUR/USD ex-change rate.Impact on the bond and equity marketsThe CEE countries are benefiting from the flood of liquidity on both the equity and bond markets. On a 12-month horizon, however, yields on 10-year govern-ment bonds are likely to be somewhat higher. In contrast, Russia and Turkey offer a relatively high interest coupon and look attractive. We expect prices to trend upward on the equity markets. Russia, Hungary, the Czech Republic, and the ATX in Austria have the greatest upside potential in the coming months.
Financial analyst: Peter Brezinschek, RBI Vienna
Expansive monetary policy for the foreseeable future in CEE as well
Recommendations1 – debt markets
Corporate bonds curr.2
Buy Gazprom 6,51 % due 2022 280 bp1 horizon: end 4th quarter 20162 z-spreads (bp)Source: RBI/Raiffeisen RESEARCH
Recommendations1 – stock markets
Indices
Buy ATX, MICEX, BUX, PXHold BET, WIG 30Sell BIST Nat. 100Equities
AgranaCurrent share price: EUR 101.5Target price: EUR 114.9EVNCurrent share price: EUR 10.46Target price: EUR 12.80PolytecCurrent share price: EUR 7.99Target price: EUR 10.50PKNCurrent share price: PLN 66.54Target price: PLN 76.50InterRAOCurrent share price: RUB 3.12Target price: RUB 4.13
Solid GDP fi gures for the fi rst half of the year, with a slight downturn towards 2017 Russia recovering slowly Central banks refl ecting lower infl ation expectations for 2017 Currency trend expected to be quite stable
CEE: Market strategy1
Eurobonds LCY Bonds FX
EUR USD 2y 10y --
BG B -- -- -- --HR B S -- -- HCZ H -- H H HHU H H H 2) H HPL B H H H HRO H H H H HRU H H B B HRS -- B -- -- HMK B -- -- -- --KZ -- HTR H H S S HUA -- H -- -- SBY -- H -- -- S
1 LCY bonds: based on absolute performance in LCYEurobonds: based on expected spread changeFX vs. EURRecommendation horizon: end 4th quarter 2016For recommendation history please see page 62B: Buy; H: Hold; S: Sell2) HU: 3y, not 2y tenorSource: RBI/Raiffeisen RESEARCH
4 Please note the risk notifi cations and explanations at the end of this document
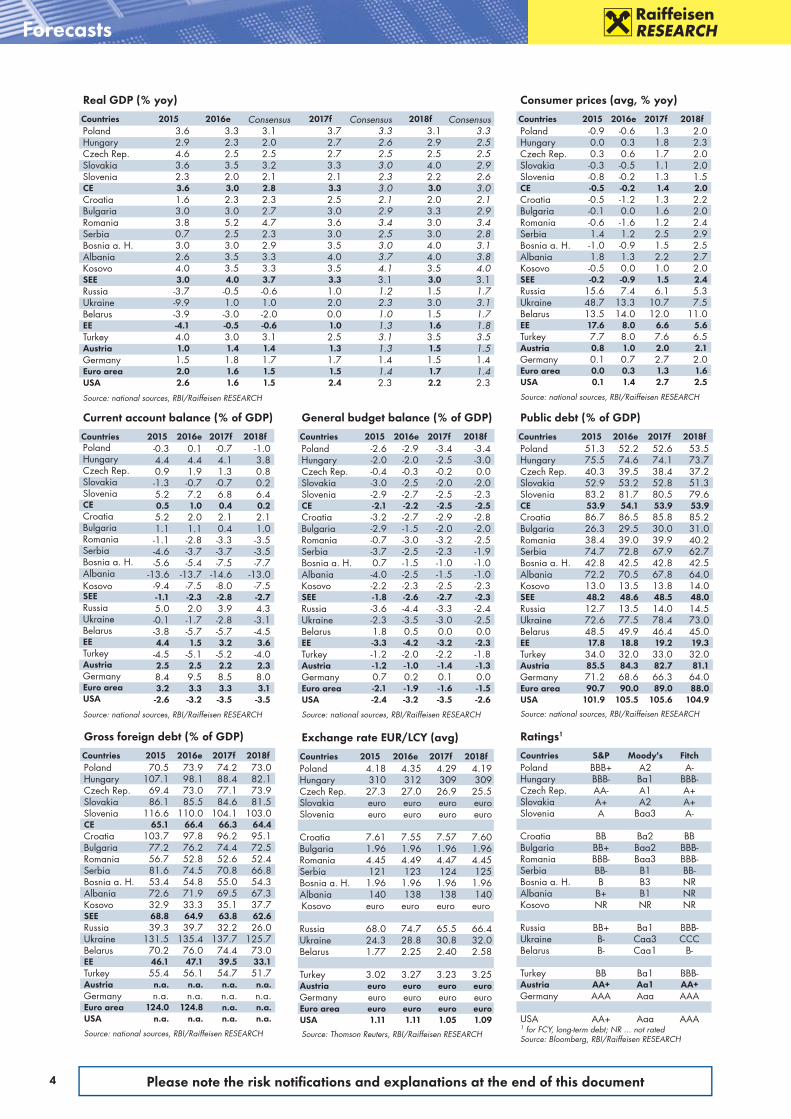
Consumer prices (avg, % yoy)
Countries 2015 2016e 2017f 2018fPoland -0.9 -0.6 1.3 2.0Hungary 0.0 0.3 1.8 2.3Czech Rep. 0.3 0.6 1.7 2.0Slovakia -0.3 -0.5 1.1 2.0Slovenia -0.8 -0.2 1.3 1.5CE -0.5 -0.2 1.4 2.0Croatia -0.5 -1.2 1.3 2.2Bulgaria -0.1 0.0 1.6 2.0Romania -0.6 -1.6 1.2 2.4Serbia 1.4 1.2 2.5 2.9Bosnia a. H. -1.0 -0.9 1.5 2.5Albania 1.8 1.3 2.2 2.7Kosovo -0.5 0.0 1.0 2.0SEE -0.2 -0.9 1.5 2.4Russia 15.6 7.4 6.1 5.3Ukraine 48.7 13.3 10.7 7.5Belarus 13.5 14.0 12.0 11.0EE 17.6 8.0 6.6 5.6Turkey 7.7 8.0 7.6 6.5Austria 0.8 1.0 2.0 2.1Germany 0.1 0.7 2.7 2.0Euro area 0.0 0.3 1.3 1.6USA 0.1 1.4 2.7 2.5
Source: national sources, RBI/Raiffeisen RESEARCH
Current account balance (% of GDP)
Countries 2015 2016e 2017f 2018fPoland -0.3 0.1 -0.7 -1.0Hungary 4.4 4.4 4.1 3.8Czech Rep. 0.9 1.9 1.3 0.8Slovakia -1.3 -0.7 -0.7 0.2Slovenia 5.2 7.2 6.8 6.4CE 0.5 1.0 0.4 0.2Croatia 5.2 2.0 2.1 2.1Bulgaria 1.1 1.1 0.4 1.0Romania -1.1 -2.8 -3.3 -3.5Serbia -4.6 -3.7 -3.7 -3.5Bosnia a. H. -5.6 -5.4 -7.5 -7.7Albania -13.6 -13.7 -14.6 -13.0Kosovo -9.4 -7.5 -8.0 -7.5SEE -1.1 -2.3 -2.8 -2.7Russia 5.0 2.0 3.9 4.3Ukraine -0.1 -1.7 -2.8 -3.1Belarus -3.8 -5.7 -5.7 -4.5EE 4.4 1.5 3.2 3.6Turkey -4.5 -5.1 -5.2 -4.0Austria 2.5 2.5 2.2 2.3Germany 8.4 9.5 8.5 8.0Euro area 3.2 3.3 3.3 3.1USA -2.6 -3.2 -3.5 -3.5
Source: national sources, RBI/Raiffeisen RESEARCH
Forecasts
General budget balance (% of GDP)
Countries 2015 2016e 2017f 2018fPoland -2.6 -2.9 -3.4 -3.4Hungary -2.0 -2.0 -2.5 -3.0Czech Rep. -0.4 -0.3 -0.2 0.0Slovakia -3.0 -2.5 -2.0 -2.0Slovenia -2.9 -2.7 -2.5 -2.3CE -2.1 -2.2 -2.5 -2.5Croatia -3.2 -2.7 -2.9 -2.8Bulgaria -2.9 -1.5 -2.0 -2.0Romania -0.7 -3.0 -3.2 -2.5Serbia -3.7 -2.5 -2.3 -1.9Bosnia a. H. 0.7 -1.5 -1.0 -1.0Albania -4.0 -2.5 -1.5 -1.0Kosovo -2.2 -2.3 -2.5 -2.3SEE -1.8 -2.6 -2.7 -2.3Russia -3.6 -4.4 -3.3 -2.4Ukraine -2.3 -3.5 -3.0 -2.5Belarus 1.8 0.5 0.0 0.0EE -3.3 -4.2 -3.2 -2.3Turkey -1.2 -2.0 -2.2 -1.8Austria -1.2 -1.0 -1.4 -1.3Germany 0.7 0.2 0.1 0.0Euro area -2.1 -1.9 -1.6 -1.5USA -2.4 -3.2 -3.5 -2.6
Source: national sources, RBI/Raiffeisen RESEARCH
Public debt (% of GDP)
Countries 2015 2016e 2017f 2018fPoland 51.3 52.2 52.6 53.5Hungary 75.5 74.6 74.1 73.7Czech Rep. 40.3 39.5 38.4 37.2Slovakia 52.9 53.2 52.8 51.3Slovenia 83.2 81.7 80.5 79.6CE 53.9 54.1 53.9 53.9Croatia 86.7 86.5 85.8 85.2Bulgaria 26.3 29.5 30.0 31.0Romania 38.4 39.0 39.9 40.2Serbia 74.7 72.8 67.9 62.7Bosnia a. H. 42.8 42.5 42.8 42.5Albania 72.2 70.5 67.8 64.0Kosovo 13.0 13.5 13.8 14.0SEE 48.2 48.6 48.5 48.0Russia 12.7 13.5 14.0 14.5Ukraine 72.6 77.5 78.4 73.0Belarus 48.5 49.9 46.4 45.0EE 17.8 18.8 19.2 19.3Turkey 34.0 32.0 33.0 32.0Austria 85.5 84.3 82.7 81.1Germany 71.2 68.6 66.3 64.0Euro area 90.7 90.0 89.0 88.0USA 101.9 105.5 105.6 104.9
Source: national sources, RBI/Raiffeisen RESEARCH
Gross foreign debt (% of GDP)
Countries 2015 2016e 2017f 2018fPoland 70.5 73.9 74.2 73.0Hungary 107.1 98.1 88.4 82.1Czech Rep. 69.4 73.0 77.1 73.9Slovakia 86.1 85.5 84.6 81.5Slovenia 116.6 110.0 104.1 103.0CE 65.1 66.4 66.3 64.4Croatia 103.7 97.8 96.2 95.1Bulgaria 77.2 76.2 74.4 72.5Romania 56.7 52.8 52.6 52.4Serbia 81.6 74.5 70.8 66.8Bosnia a. H. 53.4 54.8 55.0 54.3Albania 72.6 71.9 69.5 67.3Kosovo 32.9 33.3 35.1 37.7SEE 68.8 64.9 63.8 62.6Russia 39.3 39.7 32.2 26.0Ukraine 131.5 135.4 137.7 125.7Belarus 70.2 76.0 74.4 73.0EE 46.1 47.1 39.5 33.1Turkey 55.4 56.1 54.7 51.7Austria n.a. n.a. n.a. n.a.Germany n.a. n.a. n.a. n.a.Euro area 124.0 124.8 n.a. n.a.USA n.a. n.a. n.a. n.a.
Source: national sources, RBI/Raiffeisen RESEARCH
Exchange rate EUR/LCY (avg)
Countries 2015 2016e 2017f 2018fPoland 4.18 4.35 4.29 4.19Hungary 310 312 309 309Czech Rep. 27.3 27.0 26.9 25.5Slovakia euro euro euro euroSlovenia euro euro euro euro
Croatia 7.61 7.55 7.57 7.60Bulgaria 1.96 1.96 1.96 1.96Romania 4.45 4.49 4.47 4.45Serbia 121 123 124 125Bosnia a. H. 1.96 1.96 1.96 1.96Albania 140 138 138 140Kosovo euro euro euro euro
Russia 68.0 74.7 65.5 66.4Ukraine 24.3 28.8 30.8 32.0Belarus 1.77 2.25 2.40 2.58
Turkey 3.02 3.27 3.23 3.25Austria euro euro euro euroGermany euro euro euro euroEuro area euro euro euro euroUSA 1.11 1.11 1.05 1.09
Source: Thomson Reuters, RBI/Raiffeisen RESEARCH
Ratings1
Countries S&P Moody's FitchPoland BBB+ A2 A-Hungary BBB- Ba1 BBB-Czech Rep. AA- A1 A+Slovakia A+ A2 A+Slovenia A Baa3 A-
Croatia BB Ba2 BBBulgaria BB+ Baa2 BBB-Romania BBB- Baa3 BBB-Serbia BB- B1 BB-Bosnia a. H. B B3 NRAlbania B+ B1 NRKosovo NR NR NR
Russia BB+ Ba1 BBB-Ukraine B- Caa3 CCCBelarus B- Caa1 B-
Turkey BB Ba1 BBB-Austria AA+ Aa1 AA+Germany AAA Aaa AAA
USA AA+ Aaa AAA1 for FCY, long-term debt; NR ... not ratedSource: Bloomberg, RBI/Raiffeisen RESEARCH
Real GDP (% yoy)
Countries 2015 2016e Consensus 2017f Consensus 2018f ConsensusPoland 3.6 3.3 3.1 3.7 3.3 3.1 3.3Hungary 2.9 2.3 2.0 2.7 2.6 2.9 2.5Czech Rep. 4.6 2.5 2.5 2.7 2.5 2.5 2.5Slovakia 3.6 3.5 3.2 3.3 3.0 4.0 2.9Slovenia 2.3 2.0 2.1 2.1 2.3 2.2 2.6CE 3.6 3.0 2.8 3.3 3.0 3.0 3.0Croatia 1.6 2.3 2.3 2.5 2.1 2.0 2.1Bulgaria 3.0 3.0 2.7 3.0 2.9 3.3 2.9Romania 3.8 5.2 4.7 3.6 3.4 3.0 3.4Serbia 0.7 2.5 2.3 3.0 2.5 3.0 2.8Bosnia a. H. 3.0 3.0 2.9 3.5 3.0 4.0 3.1Albania 2.6 3.5 3.3 4.0 3.7 4.0 3.8Kosovo 4.0 3.5 3.3 3.5 4.1 3.5 4.0SEE 3.0 4.0 3.7 3.3 3.1 3.0 3.1Russia -3.7 -0.5 -0.6 1.0 1.2 1.5 1.7Ukraine -9.9 1.0 1.0 2.0 2.3 3.0 3.1Belarus -3.9 -3.0 -2.0 0.0 1.0 1.5 1.7EE -4.1 -0.5 -0.6 1.0 1.3 1.6 1.8Turkey 4.0 3.0 3.1 2.5 3.1 3.5 3.5Austria 1.0 1.4 1.4 1.3 1.3 1.5 1.5Germany 1.5 1.8 1.7 1.7 1.4 1.5 1.4Euro area 2.0 1.6 1.5 1.5 1.4 1.7 1.4USA 2.6 1.6 1.5 2.4 2.3 2.2 2.3Source: national sources, RBI/Raiffeisen RESEARCH
5Please note the risk notifi cations and explanations at the end of this document
Exchange rate forecast
Countries 21-Sep1 Dec-16 Mar-17 Sep-17vs EURPoland 4.30 4.35 4.30 4.25Hungary 308.33 315.0 310.0 305.0Czech R. 27.02 27.0 27.0 27.0Croatia 7.51 7.60 7.60 7.55Romania 4.45 4.50 4.45 4.45Serbia 123.52 124.0 123.0 124.0Albania 136.99 137.5 137.0 139.0
vs USDRussia 64.3 65.0 63.0 61.0Ukraine 25.94 29.00 29.00 30.00Belarus 1.94 2.25 2.27 2.31Turkey 2.98 3.10 3.10 3.05
EUR/USD 1.11 1.08 1.07 1.051 5:00 p.m. (CEST)Source: Thomson Reuters, RBI/Raiffeisen RESEARCH
2y LCY yield forecast
Countries 21-Sep1 Dec-16 Mar-17 Sep-17Poland 1.75 1.7 1.8 2.2Hungary* 1.32 1.1 1.0 1.3Czech R. -0.46 -0.5 -0.3 -0.6Croatia 1.48 1.7 1.7 1.8Romania* 1.55 1.6 1.7 1.9Russia 8.67 8.8 8.4 8.2Turkey 8.79 10.0 9.5 8.3
Austria -0.58 -0.7 -0.7 -0.6Germany -0.65 -0.7 -0.7 -0.6USA 0.79 1.0 1.0 1.2
1 5:00 p.m. (CEST); * 3y LCY yieldsSource: Thomson Reuters, RBI/Raiffeisen RESEARCH
Key interest rate forecast
Countries 21-Sep1 Dec-16 Mar-17 Sep-17Poland 1.50 1.50 1.50 1.75Hungary 0.90 0.90 0.90 0.90Czech R. 0.05 0.05 0.05 0.05Romania 1.75 1.75 1.75 1.75Russia 10.00 10.00 9.50 8.50Turkey 7.50 7.50 7.50 7.50
Euro area 0.00 0.00 0.00 0.00USA 0.50 0.75 0.75 1.001 5:00 p.m. (CEST)Source: Thomson Reuters, RBI/Raiffeisen RESEARCH
Forecasts
3m money market rate forecast
Countries 21-Sep1 Dec-16 Mar-17 Sep-17Poland 1.71 1.65 1.65 1.85Hungary 0.89 0.85 0.80 0.80Czech R. 0.29 0.30 0.30 0.30Croatia 0.87 0.89 0.90 0.90Romania 0.71 0.70 0.85 1.15Russia 10.56 10.80 10.10 9.10Turkey 9.31 9.80 9.20 8.00
Euro area -0.30 -0.30 -0.30 -0.30USA 0.87 1.15 1.15 1.401 5:00 p.m. (CEST)Source: Thomson Reuters, RBI/Raiffeisen RESEARCH
Spreads 10y LCY bonds over Bund
Countries 21-Sep1 Dec-16 Mar-17 Sep-17Poland 292 310 300 290Hungary 296 260 245 245Czech R. 35 20 20 -10Croatia 349 330 310 300Romania 304 300 290 290Russia 823 810 760 730Turkey 958 1040 980 860
Austria 25 20 20 25USA 173 180 160 160
1 5:00 p.m. (CEST); all values in bpSource: Thomson Reuters, RBI/Raiffeisen RESEARCH
10y LCY yield forecast
Countries 21-Sep1 Dec-16 Mar-17 Sep-17Poland 2.86 3.2 3.3 3.4Hungary 2.90 2.7 2.8 3.0Czech R. 0.29 0.3 0.5 0.4Croatia 3.43 3.4 3.4 3.5Romania 2.98 3.1 3.2 3.4Russia 8.17 8.2 7.9 7.8Turkey 9.52 10.5 10.1 9.1
Austria 0.20 0.3 0.5 0.8Germany -0.06 0.1 0.3 0.5USA 1.67 1.9 1.9 2.1
1 5:00 p.m. (CEST)Source: Thomson Reuters, RBI/Raiffeisen RESEARCH
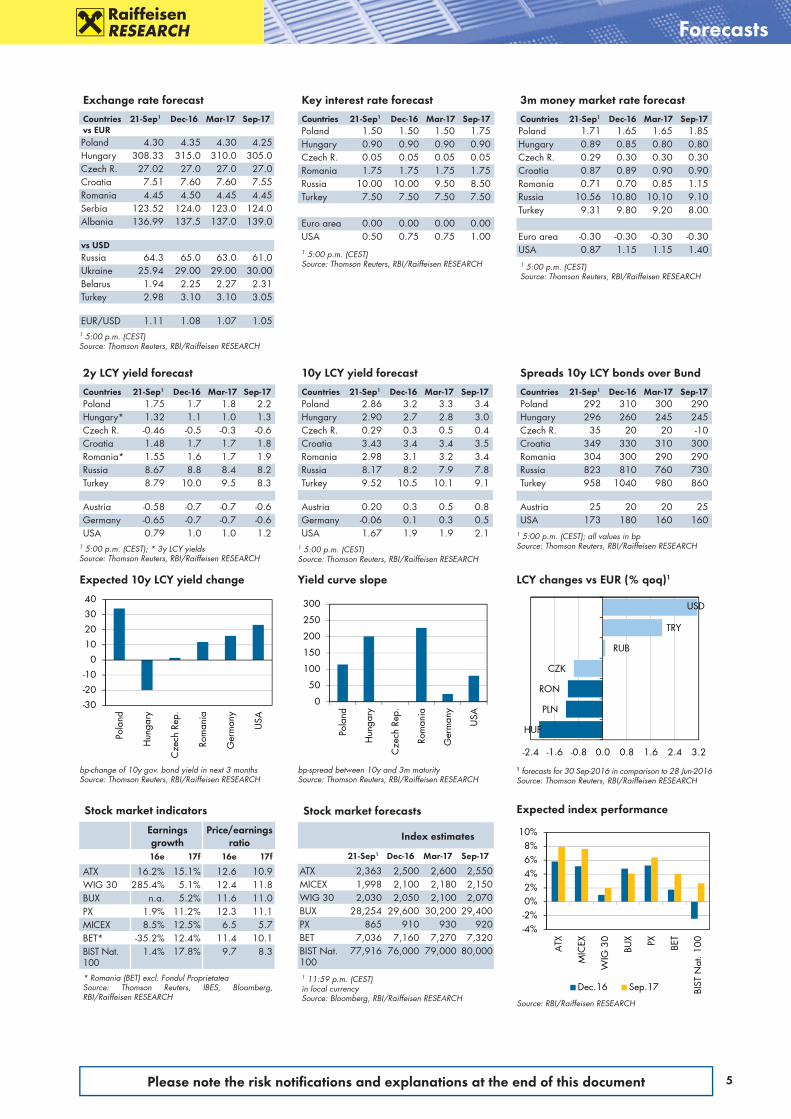
Yield curve slope
bp-spread between 10y and 3m maturitySource: Thomson Reuters, RBI/Raiffeisen RESEARCH
0
50
100
150
200
250
300
Pola
nd
Hun
gary
Cze
ch R
ep.
Rom
ania
Ger
man
y
USA
LCY changes vs EUR (% qoq)1
1 forecasts for 30 Sep-2016 in comparison to 28 Jun-2016Source: Thomson Reuters, RBI/Raiffeisen RESEARCH
USD
TRY
RUB
CZK
RON
PLN
HUF
-2.4 -1.6 -0.8 0.0 0.8 1.6 2.4 3.2
Expected 10y LCY yield change
bp-change of 10y gov. bond yield in next 3 monthsSource: Thomson Reuters, RBI/Raiffeisen RESEARCH
-30
-20
-10
0
10
20
30
40
Pola
nd
Hun
gary
Cze
ch R
ep.
Rom
ania
Ger
man
y
USA
Expected index performance
Source: RBI/Raiffeisen RESEARCH
-4%-2%0%2%4%6%8%
10%
ATX
MIC
EX
WIG
30
BUX PX BET
BIST
Nat
. 100
Dec.16 Sep.17
Stock market indicators
Earnings growth
Price/earnings ratio
16e 17f 16e 17f
ATX 16.2% 15.1% 12.6 10.9 WIG 30 285.4% 5.1% 12.4 11.8 BUX n.a. 5.2% 11.6 11.0 PX 1.9% 11.2% 12.3 11.1 MICEX 8.5% 12.5% 6.5 5.7 BET* -35.2% 12.4% 11.4 10.1 BIST Nat. 100
1.4% 17.8% 9.7 8.3
* Romania (BET) excl. Fondul ProprietateaSource: Thomson Reuters, IBES, Bloomberg, RBI/Raiffeisen RESEARCH
Stock market forecasts
Index estimates
21-Sep1 Dec-16 Mar-17 Sep-17
ATX 2,363 2,500 2,600 2,550MICEX 1,998 2,100 2,180 2,150WIG 30 2,030 2,050 2,100 2,070BUX 28,254 29,600 30,200 29,400PX 865 910 930 920BET 7,036 7,160 7,270 7,320BIST Nat. 100
77,916 76,000 79,000 80,000
1 11:59 p.m. (CEST)in local currencySource: Bloomberg, RBI/Raiffeisen RESEARCH
6 Please note the risk notifi cations and explanations at the end of this document
Asset allocation – performance
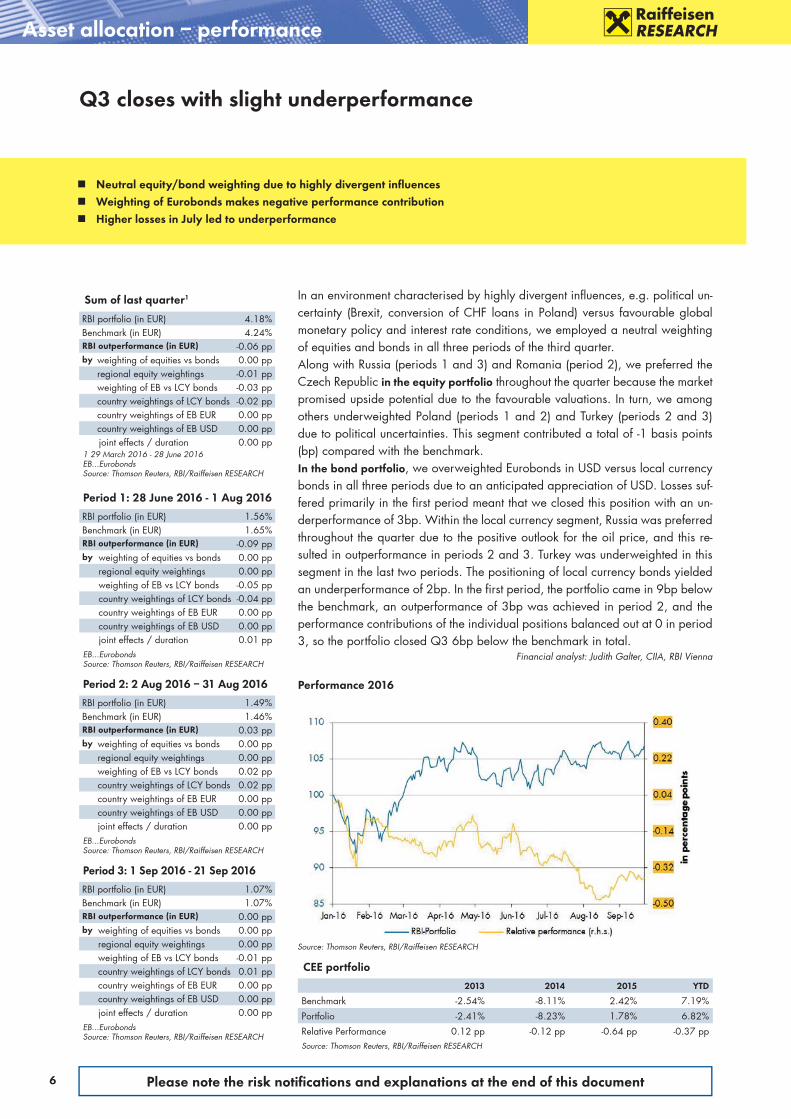
Sum of last quarter1
RBI portfolio (in EUR) 4.18%Benchmark (in EUR) 4.24%RBI outperformance (in EUR) -0.06 ppby weighting of equities vs bonds 0.00 pp
regional equity weightings -0.01 ppweighting of EB vs LCY bonds -0.03 ppcountry weightings of LCY bonds -0.02 ppcountry weightings of EB EUR 0.00 ppcountry weightings of EB USD 0.00 ppjoint effects / duration 0.00 pp
1 29 March 2016 - 28 June 2016EB...EurobondsSource: Thomson Reuters, RBI/Raiffeisen RESEARCH
Q3 closes with slight underperformance
Period 1: 28 June 2016 - 1 Aug 2016
RBI portfolio (in EUR) 1.56%Benchmark (in EUR) 1.65%RBI outperformance (in EUR) -0.09 ppby weighting of equities vs bonds 0.00 pp
regional equity weightings 0.00 ppweighting of EB vs LCY bonds -0.05 ppcountry weightings of LCY bonds -0.04 ppcountry weightings of EB EUR 0.00 ppcountry weightings of EB USD 0.00 ppjoint effects / duration 0.01 pp
EB...Eurobonds Source: Thomson Reuters, RBI/Raiffeisen RESEARCH
Period 2: 2 Aug 2016 – 31 Aug 2016
RBI portfolio (in EUR) 1.49%Benchmark (in EUR) 1.46%RBI outperformance (in EUR) 0.03 ppby weighting of equities vs bonds 0.00 pp
regional equity weightings 0.00 ppweighting of EB vs LCY bonds 0.02 ppcountry weightings of LCY bonds 0.02 ppcountry weightings of EB EUR 0.00 ppcountry weightings of EB USD 0.00 ppjoint effects / duration 0.00 pp
EB...Eurobonds Source: Thomson Reuters, RBI/Raiffeisen RESEARCH
Period 3: 1 Sep 2016 - 21 Sep 2016
RBI portfolio (in EUR) 1.07%Benchmark (in EUR) 1.07%RBI outperformance (in EUR) 0.00 ppby weighting of equities vs bonds 0.00 pp
regional equity weightings 0.00 ppweighting of EB vs LCY bonds -0.01 ppcountry weightings of LCY bonds 0.01 ppcountry weightings of EB EUR 0.00 ppcountry weightings of EB USD 0.00 ppjoint effects / duration 0.00 pp
EB...Eurobonds Source: Thomson Reuters, RBI/Raiffeisen RESEARCH
Performance 2016
Source: Thomson Reuters, RBI/Raiffeisen RESEARCH
Neutral equity/bond weighting due to highly divergent infl uences Weighting of Eurobonds makes negative performance contribution Higher losses in July led to underperformance
In an environment characterised by highly divergent influences, e.g. political un-certainty (Brexit, conversion of CHF loans in Poland) versus favourable global monetary policy and interest rate conditions, we employed a neutral weighting of equities and bonds in all three periods of the third quarter.Along with Russia (periods 1 and 3) and Romania (period 2), we preferred the Czech Republic in the equity portfolio throughout the quarter because the market promised upside potential due to the favourable valuations. In turn, we among others underweighted Poland (periods 1 and 2) and Turkey (periods 2 and 3) due to political uncertainties. This segment contributed a total of -1 basis points (bp) compared with the benchmark. In the bond portfolio, we overweig hted Eurobonds in USD versus local currency bonds in all three periods due to an anticipated appreciation of USD. Losses suf-fered primarily in the first period meant that we closed this position with an un-derperformance of 3bp. Within the local currency segment, Russia was preferred throughout the quarter due to the positive outlook for the oil price, and this re-sulted in outperformance in periods 2 and 3. Turkey was underweighted in this segment in the last two periods. The positioning of local currency bonds yielded an underperformance of 2bp. In the first period, the portfolio came in 9bp below the benchmark, an outperformance of 3bp was achieved in period 2, and the performance contributions of the individual positions balanced out at 0 in period 3, so the portfolio closed Q3 6bp below the benchmark in total.
Financial analyst: Judith Galter, CIIA, RBI Vienna
CEE portfolio
2013 2014 2015 YTD
Benchmark -2.54% -8.11% 2.42% 7.19%
Portfolio -2.41% -8.23% 1.78% 6.82%
Relative Performance 0.12 pp -0.12 pp -0.64 pp -0.37 ppSource: Thomson Reuters, RBI/Raiffeisen RESEARCH

7Please note the risk notifi cations and explanations at the end of this document
Asset allocation – total portfolio
Neutral weighting going into the fourth quarter
Historical volatility & performance (%)
Equities1 BondsVolatility2 Performance ytd Performance 5y3 Volatility2 Performance ytd Performance 5y3
Countries EUR LCY EUR LCY EUR LCY EUR LCY EUR LCY EUR LCY
Czech Republic 17.2 17.2 -10.6 -10.6 -8.1 -6.6 1.1 0.9 1.4 1.4 3.1 4.8
Hungary 15.5 14.1 20.5 17.6 7.3 8.6 4.5 1.6 7.8 5.2 8.1 9.4
Poland 17.7 15.1 -5.9 -5.8 -3.8 -4.3 7.5 2.7 1.4 2.0 6.8 6.2
Romania 11.6 11.2 6.5 4.7 12.3 13.1 1.9 0.1 1.8 0.1 1.6 2.4
Russia 17.4 12.2 22.2 13.1 -4.5 2.8 12.7 3.2 24.7 12.5 -2.2 8.2
Turkey 30.6 24.4 4.3 9.0 -1.0 5.0 14.3 6.3 7.6 12.5 2.0 8.1
Croatia 8.2 8.1 15.8 13.8 -2.9 -2.8 3.7 3.9 10.2 8.3 7.8 7.9
CEE 13.1 - 7.2 - - - 2.9 - 4.2 - - -1 MSCI indices2 Three months volatility annualised3 Five-year annual returnLCY…local currencySource: Thomson Reuters, RBI/Raiffeisen RESEARCH
CEE portfolio weightings Q3 2016
LCY…local currency, EB ... Eurobonds[-] , [+] = Over-/underweight versus benchmark[0] = No over/-underweight versus benchmarkSource: RBI/Raiffeisen RESEARCH
Risk-return (%)
Local currency 1 MSCI EM Eastern Europe in euroSource: Thomson Reuters, RBI/Raiffeisen RESEARCH
Hunt for returns supporting riskier asset classes Diverging performance expected between the largest CEE equity markets High carry and stable currencies make CEE government bonds attractive
Equities: 50% [0 pp]
LCY-bonds: 42.5%
[+2.5 pp]
EB USD: 4% [-1 pp]
EB EUR: 3.5% [-1.5 pp]
MICEX
WIG 30
PX
BUX
Dow Jones Euro
STOXX 50
CEE1
BET
-4
-2
0
2
4
6
8 18 28Expe
cted
3 m
onth
per
form
ance
in %
Historical 1y volatility in %
The waning political uncertainty that was triggered by the Brexit vote in June has cleared the stage for an evergreen in the international investment world: the hunt for returns. The low interest rate environment that are persisting in many parts of the world and the solid global economy are likely to have a positive effect on riskier asset classes such as equities and spread products (corporate bonds, CEE and global EM government bonds) in the coming quarter. We anticipate that the ECB will announce the extension of its purchasing programme by the end of the year. And the next step towards the normalisation of interest rates in the USA that we expect in December should cause no more long-term distortions for the risk-ier asset classes.
However, this does not translate directly into an overweighting of CEE equities in our portfolio. Because there are differences in our performance expectations within CEE equities, especially with regards to the benchmark heavyweights. While we anticipate gains in Russia, the markets will likely move sideways in Poland and downwards in Turkey. Local factors like the development of the oil price and political uncertainty will play a large role here. This means that an ob-vious outperformance of CEE equities over CEE bonds can, therefore, not be pre-dicted. Especially because the higher carry of CEE government bonds will likely continue to attract interest from international investors. In addition, we expect a stable to slightly positive currency performance in the coming quarter for most CEE countries.
All in all, we recommend a neutral weighting of equities versus bonds in our CEE portfolio.
Financial analyst: Judith Galter, CIIA, RBI Vienna
8 Please note the risk notifi cations and explanations at the end of this document
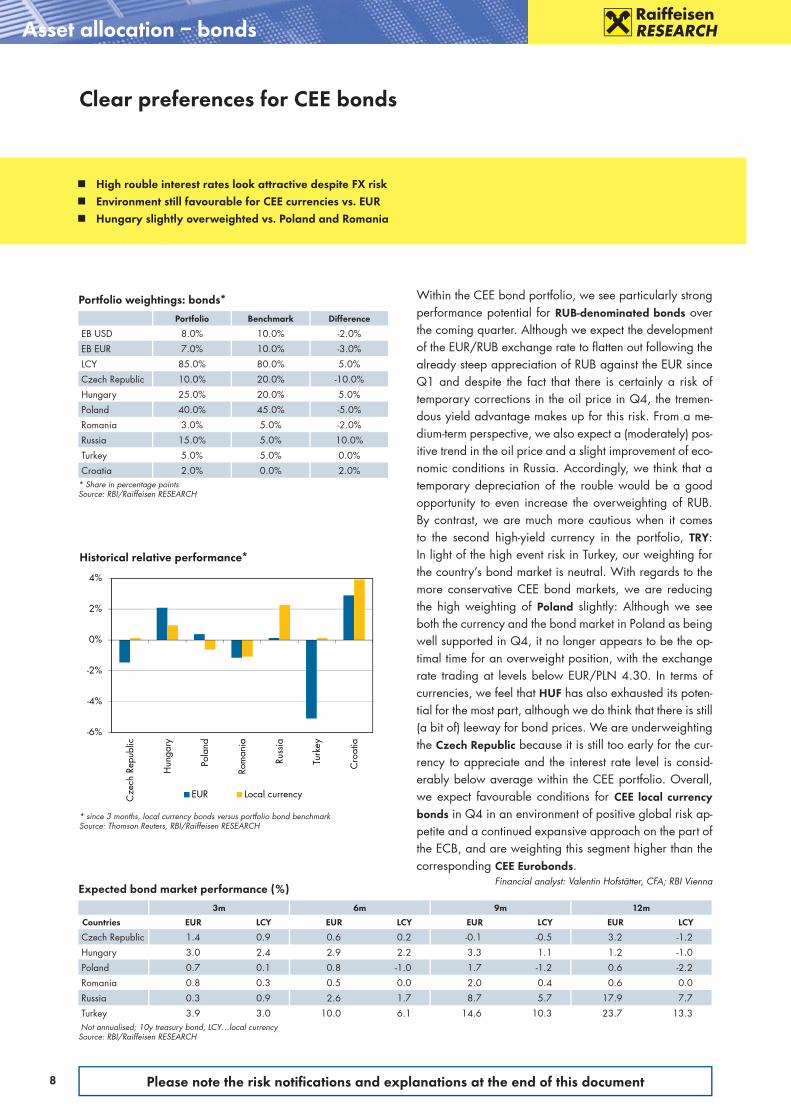
Asset allocation – bonds
Clear preferences for CEE bonds
Expected bond market performance (%)
3m 6m 9m 12m
Countries EUR LCY EUR LCY EUR LCY EUR LCY
Czech Republic 1.4 0.9 0.6 0.2 -0.1 -0.5 3.2 -1.2
Hungary 3.0 2.4 2.9 2.2 3.3 1.1 1.2 -1.0
Poland 0.7 0.1 0.8 -1.0 1.7 -1.2 0.6 -2.2
Romania 0.8 0.3 0.5 0.0 2.0 0.4 0.6 0.0
Russia 0.3 0.9 2.6 1.7 8.7 5.7 17.9 7.7
Turkey 3.9 3.0 10.0 6.1 14.6 10.3 23.7 13.3 Not annualised; 10y treasury bond, LCY…local currencySource: RBI/Raiffeisen RESEARCH
-6%
-4%
-2%
0%
2%
4%
Cze
ch R
epub
lic
Hun
gary
Pola
nd
Rom
ania
Russ
ia
Turk
ey
Cro
atia
EUR Local currency
Historical relative performance*
* since 3 months, local currency bonds versus portfolio bond benchmarkSource: Thomson Reuters, RBI/Raiffeisen RESEARCH
High rouble interest rates look attractive despite FX risk Environment still favourable for CEE currencies vs. EUR Hungary slightly overweighted vs. Poland and Romania
Portfolio weightings: bonds*
Portfolio Benchmark Difference
EB USD 8.0% 10.0% -2.0%
EB EUR 7.0% 10.0% -3.0%
LCY 85.0% 80.0% 5.0%
Czech Republic 10.0% 20.0% -10.0%
Hungary 25.0% 20.0% 5.0%
Poland 40.0% 45.0% -5.0%
Romania 3.0% 5.0% -2.0%
Russia 15.0% 5.0% 10.0%
Turkey 5.0% 5.0% 0.0%
Croatia 2.0% 0.0% 2.0%* Share in percentage pointsSource: RBI/Raiffeisen RESEARCH
Within the CEE bond portfolio, we see particularly strong performance potential for RUB-denominated bonds over the coming quarter. Although we expect the development of the EUR/RUB exchange rate to flatten out following the already steep appreciation of RUB against the EUR since Q1 and despite the fact that there is certainly a risk of temporary corrections in the oil price in Q4, the tremen-dous yield advantage makes up for this risk. From a me-dium-term perspective, we also expect a (moderately) pos-itive trend in the oil price and a slight improvement of eco-nomic conditions in Russia. Accordingly, we think that a temporary depreciation of the rouble would be a good opportunity to even increase the overweighting of RUB. By contrast, we are much more cautious when it comes to the second high-yield currency in the portfolio, TRY: In light of the high event risk in Turkey, our weighting for the country’s bond market is neutral. With regards to the more conservative CEE bond markets, we are reducing the high weighting of Poland slightly: Although we see both the currency and the bond market in Poland as being well supported in Q4, it no longer appears to be the op-timal time for an overweight position, with the exchange rate trading at levels below EUR/PLN 4.30. In terms of currencies, we feel that HUF has also exhausted its poten-tial for the most part, although we do think that there is still (a bit of) leeway for bond prices. We are underweighting the Czech Republic because it is still too early for the cur-rency to appreciate and the interest rate level is consid-erably below average within the CEE portfolio. Overall, we expect favourable conditions for CEE local currency bonds in Q4 in an environment of positive global risk ap-petite and a continued expansive approach on the part of the ECB, and are weighting this segment higher than the corresponding CEE Eurobonds.
Financial analyst: Valentin Hofstätter, CFA; RBI Vienna
9Please note the risk notifi cations and explanations at the end of this document
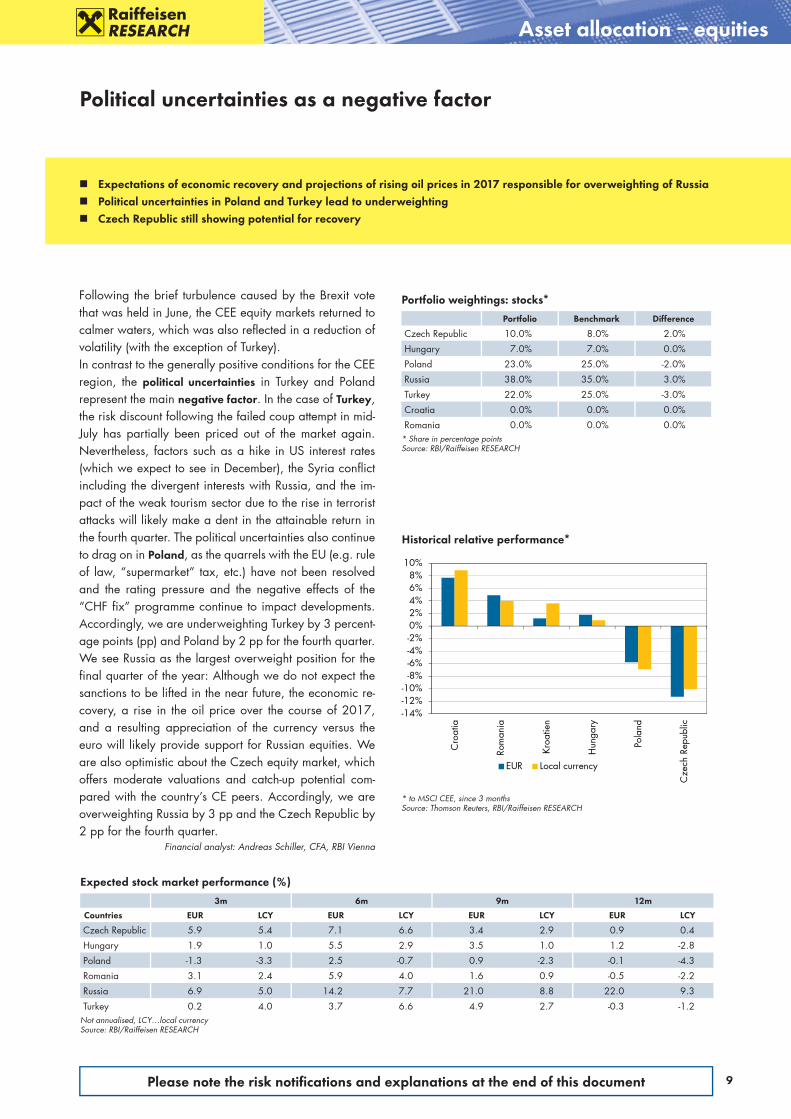
Asset allocation – equities
Political uncertainties as a negative factor
Expectations of economic recovery and projections of rising oil prices in 2017 responsible for overweighting of Russia Political uncertainties in Poland and Turkey lead to underweighting Czech Republic still showing potential for recovery
Expected stock market performance (%)
3m 6m 9m 12m
Countries EUR LCY EUR LCY EUR LCY EUR LCY
Czech Republic 5.9 5.4 7.1 6.6 3.4 2.9 0.9 0.4
Hungary 1.9 1.0 5.5 2.9 3.5 1.0 1.2 -2.8
Poland -1.3 -3.3 2.5 -0.7 0.9 -2.3 -0.1 -4.3
Romania 3.1 2.4 5.9 4.0 1.6 0.9 -0.5 -2.2
Russia 6.9 5.0 14.2 7.7 21.0 8.8 22.0 9.3
Turkey 0.2 4.0 3.7 6.6 4.9 2.7 -0.3 -1.2Not annualised, LCY…local currencySource: RBI/Raiffeisen RESEARCH
-14%-12%-10%
-8%-6%-4%-2%0%2%4%6%8%
10%
Cro
atia
Rom
ania
Kroa
tien
Hun
gary
Pola
nd
Cze
ch R
epub
lic
EUR Local currency
Historical relative performance*
* to MSCI CEE, since 3 monthsSource: Thomson Reuters, RBI/Raiffeisen RESEARCH
Following the brief turbulence caused by the Brexit vote that was held in June, the CEE equity markets returned to calmer waters, which was also reflected in a reduction of volatility (with the exception of Turkey). In contrast to the generally positive conditions for the CEE region, the political uncertainties in Turkey and Poland represent the main negative factor. In the case of Turkey, the risk discount following the failed coup attempt in mid-July has partially been priced out of the market again. Nevertheless, factors such as a hike in US interest rates (which we expect to see in December), the Syria conflict including the divergent interests with Russia, and the im-pact of the weak tourism sector due to the rise in terrorist attacks will likely make a dent in the attainable return in the fourth quarter. The political uncertainties also continue to drag on in Poland, as the quarrels with the EU (e.g. rule of law, “supermarket” tax, etc.) have not been resolved and the rating pressure and the negative effects of the “CHF fix” programme continue to impact developments. Accordingly, we are underweighting Turkey by 3 percent-age points (pp) and Poland by 2 pp for the fourth quarter.We see Russia as the largest overweight position for the final quarter of the year: Although we do not expect the sanctions to be lifted in the near future, the economic re-covery, a rise in the oil price over the course of 2017, and a resulting appreciation of the currency versus the euro will likely provide support for Russian equities. We are also optimistic about the Czech equity market, which offers moderate valuations and catch-up potential com-pared with the country’s CE peers. Accordingly, we are overweighting Russia by 3 pp and the Czech Republic by 2 pp for the fourth quarter.
Financial analyst: Andreas Schiller, CFA, RBI Vienna
Portfolio weightings: stocks*
Portfolio Benchmark Difference
Czech Republic 10.0% 8.0% 2.0%
Hungary 7.0% 7.0% 0.0%
Poland 23.0% 25.0% -2.0%
Russia 38.0% 35.0% 3.0%
Turkey 22.0% 25.0% -3.0%
Croatia 0.0% 0.0% 0.0%
Romania 0.0% 0.0% 0.0%* Share in percentage pointsSource: RBI/Raiffeisen RESEARCH
10 Please note the risk notifi cations and explanations at the end of this document
Focus on monetary policy
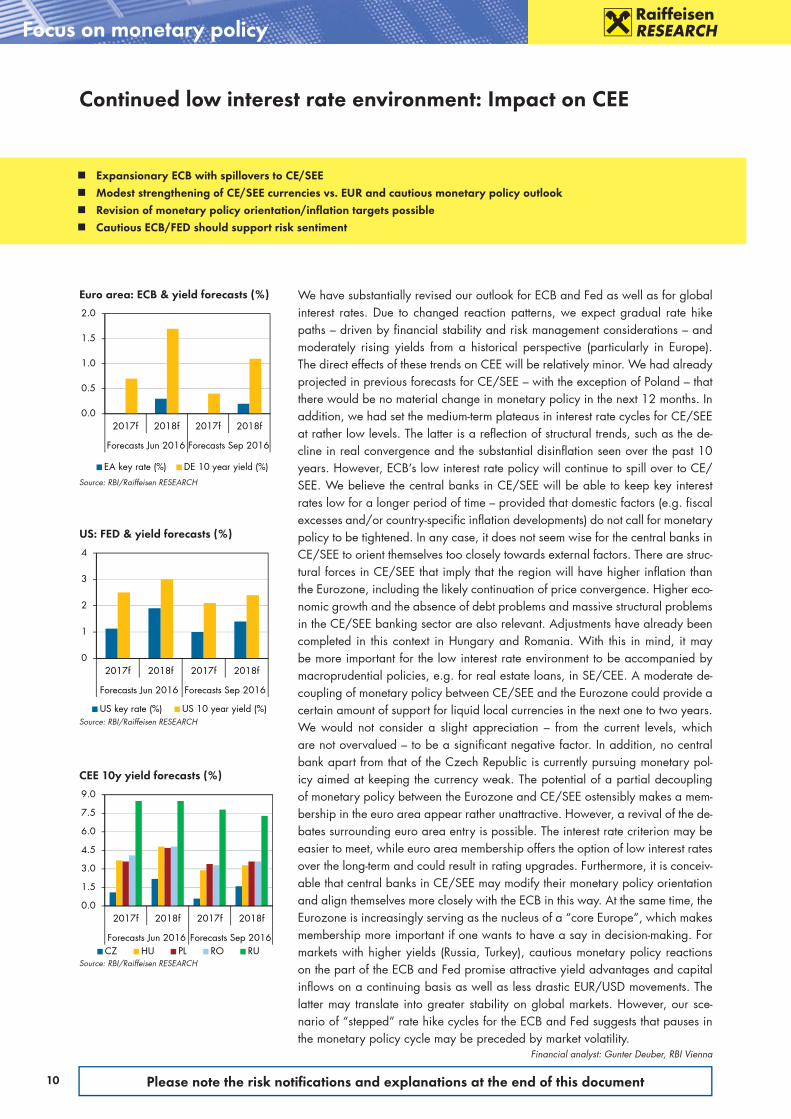
We have substantially revised our outlook for ECB and Fed as well as for global interest rates. Due to changed reaction patterns, we expect gradual rate hike paths – driven by financial stability and risk management considerations – and moderately rising yields from a historical perspective (particularly in Europe). The direct effects of these trends on CEE will be relatively minor. We had already projected in previous forecasts for CE/SEE – with the exception of Poland – that there would be no material change in monetary policy in the next 12 months. In addition, we had set the medium-term plateaus in interest rate cycles for CE/SEE at rather low levels. The latter is a reflection of structural trends, such as the de-cline in real convergence and the substantial disinflation seen over the past 10 years. However, ECB’s low interest rate policy will continue to spill over to CE/SEE. We believe the central banks in CE/SEE will be able to keep key interest rates low for a longer period of time – provided that domestic factors (e.g. fiscal excesses and/or country-specific inflation developments) do not call for monetary policy to be tightened. In any case, it does not seem wise for the central banks in CE/SEE to orient themselves too closely towards external factors. There are struc-tural forces in CE/SEE that imply that the region will have higher inflation than the Eurozone, including the likely continuation of price convergence. Higher eco-nomic growth and the absence of debt problems and massive structural problems in the CE/SEE banking sector are also relevant. Adjustments have already been completed in this context in Hungary and Romania. With this in mind, it may be more important for the low interest rate environment to be accompanied by macroprudential policies, e.g. for real estate loans, in SE/CEE. A moderate de-coupling of monetary policy between CE/SEE and the Eurozone could provide a certain amount of support for liquid local currencies in the next one to two years. We would not consider a slight appreciation – from the current levels, which are not overvalued – to be a significant negative factor. In addition, no central bank apart from that of the Czech Republic is currently pursuing monetary pol-icy aimed at keeping the currency weak. The potential of a partial decoupling of monetary policy between the Eurozone and CE/SEE ostensibly makes a mem-bership in the euro area appear rather unattractive. However, a revival of the de-bates surrounding euro area entry is possible. The interest rate criterion may be easier to meet, while euro area membership offers the option of low interest rates over the long-term and could result in rating upgrades. Furthermore, it is conceiv-able that central banks in CE/SEE may modify their monetary policy orientation and align themselves more closely with the ECB in this way. At the same time, the Eurozone is increasingly serving as the nucleus of a “core Europe”, which makes membership more important if one wants to have a say in decision-making. For markets with higher yields (Russia, Turkey), cautious monetary policy reactions on the part of the ECB and Fed promise attractive yield advantages and capital inflows on a continuing basis as well as less drastic EUR/USD movements. The latter may translate into greater stability on global markets. However, our sce-nario of “stepped” rate hike cycles for the ECB and Fed suggests that pauses in the monetary policy cycle may be preceded by market volatility.
Financial analyst: Gunter Deuber, RBI Vienna
Continued low interest rate environment: Impact on CEE
CEE 10y yield forecasts (%)
Source: RBI/Raiffeisen RESEARCH
0.0
1.5
3.0
4.5
6.0
7.5
9.0
2017f 2018f 2017f 2018f
Forecasts Jun 2016 Forecasts Sep 2016CZ HU PL RO RU
Euro area: ECB & yield forecasts (%)
Source: RBI/Raiffeisen RESEARCH
0.0
0.5
1.0
1.5
2.0
2017f 2018f 2017f 2018f
Forecasts Jun 2016 Forecasts Sep 2016
EA key rate (%) DE 10 year yield (%)
US: FED & yield forecasts (%)
Source: RBI/Raiffeisen RESEARCH
0
1
2
3
4
2017f 2018f 2017f 2018f
Forecasts Jun 2016 Forecasts Sep 2016
US key rate (%) US 10 year yield (%)
Expansionary ECB with spillovers to CE/SEE Modest strengthening of CE/SEE currencies vs. EUR and cautious monetary policy outlook Revision of monetary policy orientation/infl ation targets possible Cautious ECB/FED should support risk sentiment

11Please note the risk notifi cations and explanations at the end of this document
Focus on economics
CEE GDP growth (% qoq)
Russia from Q4 2015: RBI estimatesSource: Bloomberg, RBI/Raiffeisen RESEARCH
-0.2
0.9 1.0 0.91.5
0.4
-2.0
-1.0
0.0
1.0
2.0
RU CZ HU PL RO DE
Q2 15 Q3 15 Q4 15Q1 16 Q2 16
GDP contributions Q1 2016 (pp)
Source: Thomson Reuters, RBI/Raiffeisen RESEARCH
2.6
2.63.0
3.72.7
-5
0
5
10
CZ HU PL SK SIPrivate households GovernmentInvestments InventoriesNet Exports GDP (% yoy)
Recent CPI trend (% yoy)
Source: Bloomberg, RBI/Raiffeisen RESEARCH
-4.0
-2.0
0.0
2.0
Sep-14 Mar-15 Sep-15 Mar-16
CE Min CE MaxPoland Euro areaRomania
CE/SEE with confi dent outlook, gradual recovery in EE
GDP data for CE in Q2 considerably stronger after temporary slump in Q1; Poland somewhat disappointing Expected robust growth of around 3% in CE and SEE in the coming two years Slow recovery in Russia/Ukraine, no strong growth drivers seen yet Still very little infl ation in CE but normalisation tendencies in the coming two years
The economic situation in Central Europe (CE) has improved again in the second quarter after the weak start to 2016. Growth rates jumped back to levels around 1% p.q. (seasonally adjusted). We expect continued robust growth in the region, but somewhat below levels from 2015. We anticipate stronger consumer de-mand in Poland in the second half of the year, which should bring GDP growth for the year as a whole to at least 3.3% p.a. (down from our previous projection of 3.5%). We adjusted our 2016 growth estimate for the Czech Republic and Hungary upwards minimally to 2.5% and 2.3% p.a., respectively. Slovakia will see high growth of 3.5% p.a. this year. In Southeastern Europe (SEE), Romania is a standout with a booming domestic economy. The economy has grown by 3% in seasonally adjusted terms since the beginning of the year (1.5% p.q. in each quarter), so we have upped our projection for 2016 from 4% to 5.2%. By con-trast, Serbia disappointed in the second quarter while Croatia and Bulgaria ex-hibited good dynamics. We expect continued stable growth rates in CE and SEE in 2017 and 2018 with an average GDP increase of around 3%, supported in part by continued stable development in the Eurozone and Germany. Growth in Turkey recently slowed somewhat from 1% p.q. and more in 2015 to 0.7% and 0.3% p.q. in Q1 and Q2 2016. The volatile political situation has made us more cautious and we now only expect growth of 2.5% p.a. in 2017.
The gradual economic recovery is continuing in Russia and Ukraine. Our projec-tion for Russia remains unchanged at -0.5% p.a. this year and 1% p.a. in 2017. We have slightly lowered our 2016 growth projection for Ukraine (from 1.5% to 1.0%) and are leaving our 2017 projection at 2% p.a. Belarus is being impacted heavily by the flagging demand from Russia, so we are reducing our estimate for 2016 from -2% to -3% and our 2017 estimate from 1% to 0%.
Infl ation is still weak in Central Europe (CE), and the expected increase through higher energy prices has not yet materialised. This has again forced us to (slightly) lower our projection for this year. This mean that prices will fall further in Poland, Slovakia, and Slovenia in 2016 while prices will rise in the Czech Republic and Hungary. We are maintaining our projection for inflation rates of above 1% in 2017 and just under 2% in 2018. This will be driven in part by energy price effects and a certain degree of price pressure from rising wages and a robust economy. We also expect inflation rates in Southeastern Europe (SEE) to climb to around 2% in 2017 and over 2% in 2018. The signs are pointing to disinfl ation in Russia and Ukraine. Relatively stable currencies, weak demand, and a fairly restrictive interest rate policy have facilitated a decline to current single-digit lev-els. While we expect an increase in Ukraine, inflation in Russia should fall further towards 5–6% in 2017 unless the economy is hit by a new shock.
Financial analyst: Andreas Schwabe, CFA, RBI Vienna

12 Please note the risk notifi cations and explanations at the end of this document
The uncertainty triggered by the Brexit vote proved to be short-lived in the third quarter. But while CZK and HUF exhibited rapid calming with diminishing volatil-ity versus the euro, PLN saw persistent elevated volatility over the entire quarter, especially because of internal issues. The substantial recovery of EUR/PLN after the presentation of the plan for the conversion of foreign-currency loans was only brief, as expected. Compared to CE exchange rates things were similar for the SEE currencies in the third quarter, and volatility here was also very low as antic-ipated. In EE, the Russian rouble continued to correlate strongly with the oil price but ended the quarter nearly unchanged versus the USD. The Ukrainian hryvnia fell as projected, especially as a result of a new flare-up of tensions with Russia.
We still expect that especially the CE and SEE currencies will show ongoing sta-bility versus the euro in the fourth quarter of 2016, thus showing low volatility versus the euro. An exception could again be expected for the Polish zloty, which is likely to exhibit somewhat elevated volatility levels in the fourth quarter. We remain neutral on all CE and SEE currencies versus the euro for Q4, while ex-pecting some PLN trading opportunities during the quarter because of increased zloty fluctuations (we see EUR/PLN in a range of 4.45–4.25). Because of the pro-jected EUR/USD trend, we have a sell recommendation for the CE and SEE cur-rencies versus the USD for the fourth quarter.
Assuming an impending key rate hike in the USA for late 2016 and a resulting stronger USD versus the euro, the EE currencies should see some support against the euro. While we expect USD/RUB to remain mostly unchanged in the fourth quarter thanks to a more stable oil price, the RUB should strengthen against the euro because of the EUR/USD movement. The stronger USD is unlikely to be enough to enable the UAH and BYN to outperform the euro, however, so these are still a sell versus the euro and USD for Q4. Because of the high level of USD debt in the Turkish economy, the lira should trend weaker versus the USD in the fourth quarter given the possible US rate hike, so we would tend to sell the lira. We only see a sideways movement of TRY versus the euro.
While we are maintaining our neutral stance for all CE and SEE currencies versus the euro at a 12-month horizon (September 2017), we have a sell recommen-dation for all of them versus the USD because of the substantial EUR/USD trend. Due in part to our expectations for a further recovery of the oil price, we have a buy recommendation for the Russian rouble at a 12-month horizon versus the USD and even more so versus the euro. While the Turkish lira is expected to be slightly negative versus the USD, it is a 12-month horizon buy versus the euro be-cause of the EUR/USD trend. UAH and BYN remain a sell both versus the USD and euro at a 12-month horizon.
Financial analyst: Wolfgang Ernst, CEFA, RBI Vienna
Brexit effects short-lived, all eyes on the Fed
Negative effects from the Brexit vote did not last CE and SEE currencies should be stable versus the euro for the most part Continued high correlation between Russian rouble and oil price EUR/USD trend dominating recommendations
Focus on FX
Projections LCY vs EUR
Source: Bloomberg, RBI/Raiffeisen RESEARCH
Projections LCY vs USD
Source: Bloomberg, RBI/Raiffeisen RESEARCH
-20% -10% 0% 10%
USD/UAH
USD/HUF
USD/HRK
USD/PLN
USD/RON
USD/TRY
USD/CZK
USD/RUB
Dec-16 Sep-17
LCY
depr
ecia
tion
agai
nst U
SD
RUB correlation with oil
Source: Thomson Reuters, RBI/Raiffeisen RESEARCH
50
60
70
80
9020
30
40
50
60
Jan-16 May-16 Sep-16
Crude oil, brent (USD per barrel)
USD/RUB (inv., r.h.s.)
-5% 0% 5% 10% 15%
EUR/HUFEUR/HRKEUR/PLN
EUR/RONEUR/TRYEUR/RSDEUR/CZKEUR/RUBEUR/USD
Dec-16 Sep-17
LCY
appr
ecia
tion
agai
nst E
UR
13Please note the risk notifi cations and explanations at the end of this document
Endurance of tight valuations in the cards
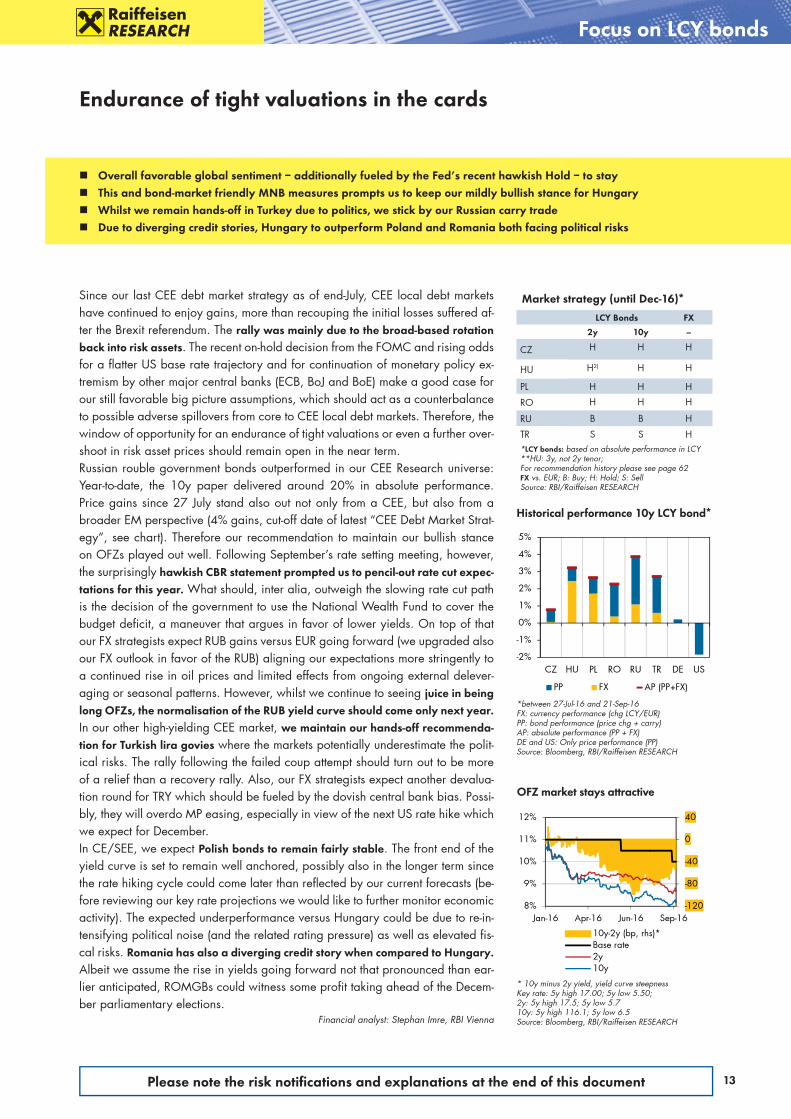
Since our last CEE debt market strategy as of end-July, CEE local debt markets have continued to enjoy gains, more than recouping the initial losses suffered af-ter the Brexit referendum. The rally was mainly due to the broad-based rotation back into risk assets. The recent on-hold decision from the FOMC and rising odds for a flatter US base rate trajectory and for continuation of monetary policy ex-tremism by other major central banks (ECB, BoJ and BoE) make a good case for our still favorable big picture assumptions, which should act as a counterbalance to possible adverse spillovers from core to CEE local debt markets. Therefore, the window of opportunity for an endurance of tight valuations or even a further over-shoot in risk asset prices should remain open in the near term. Russian rouble government bonds outperformed in our CEE Research universe: Year-to-date, the 10y paper delivered around 20% in absolute performance. Price gains since 27 July stand also out not only from a CEE, but also from a broader EM perspective (4% gains, cut-off date of latest “CEE Debt Market Strat-egy”, see chart). Therefore our recommendation to maintain our bullish stance on OFZs played out well. Following September’s rate setting meeting, however, the surprisingly hawkish CBR statement prompted us to pencil-out rate cut expec-tations for this year. What should, inter alia, outweigh the slowing rate cut path is the decision of the government to use the National Wealth Fund to cover the budget deficit, a maneuver that argues in favor of lower yields. On top of that our FX strategists expect RUB gains versus EUR going forward (we upgraded also our FX outlook in favor of the RUB) aligning our expectations more stringently to a continued rise in oil prices and limited effects from ongoing external delever-aging or seasonal patterns. However, whilst we continue to seeing juice in being long OFZs, the normalisation of the RUB yield curve should come only next year.In our other high-yielding CEE market, we maintain our hands-off recommenda-tion for Turkish lira govies where the markets potentially underestimate the polit-ical risks. The rally following the failed coup attempt should turn out to be more of a relief than a recovery rally. Also, our FX strategists expect another devalua-tion round for TRY which should be fueled by the dovish central bank bias. Possi-bly, they will overdo MP easing, especially in view of the next US rate hike which we expect for December.In CE/SEE, we expect Polish bonds to remain fairly stable. The front end of the yield curve is set to remain well anchored, possibly also in the longer term since the rate hiking cycle could come later than reflected by our current forecasts (be-fore reviewing our key rate projections we would like to further monitor economic activity). The expected underperformance versus Hungary could be due to re-in-tensifying political noise (and the related rating pressure) as well as elevated fis-cal risks. Romania has also a diverging credit story when compared to Hungary. Albeit we assume the rise in yields going forward not that pronounced than ear-lier anticipated, ROMGBs could witness some profit taking ahead of the Decem-ber parliamentary elections.
Financial analyst: Stephan Imre, RBI Vienna
Overall favorable global sentiment – additionally fueled by the Fed’s recent hawkish Hold – to stay This and bond-market friendly MNB measures prompts us to keep our mildly bullish stance for Hungary Whilst we remain hands-off in Turkey due to politics, we stick by our Russian carry trade Due to diverging credit stories, Hungary to outperform Poland and Romania both facing political risks
Focus on LCY bonds
Historical performance 10y LCY bond*
*between 27-Jul-16 and 21-Sep-16FX: currency performance (chg LCY/EUR)PP: bond performance (price chg + carry) AP: absolute performance (PP + FX)DE and US: Only price performance (PP)Source: Bloomberg, RBI/Raiffeisen RESEARCH
-2%
-1%
0%
1%
2%
3%
4%
5%
CZ HU PL RO RU TR DE US
PP FX AP (PP+FX)
OFZ market stays attractive
* 10y minus 2y yield, yield curve steepnessKey rate: 5y high 17.00; 5y low 5.50; 2y: 5y high 17.5; 5y low 5.710y: 5y high 116.1; 5y low 6.5Source: Bloomberg, RBI/Raiffeisen RESEARCH
-120
-80
-40
0
40
8%
9%
10%
11%
12%
Jan-16 Apr-16 Jun-16 Sep-16
10y-2y (bp, rhs)*Base rate2y10y
Market strategy (until Dec-16)*
LCY Bonds FX
2y 10y --
CZ H H H
HU H2) H H
PL H H H
RO H H H
RU B B H
TR S S H*LCY bonds: based on absolute performance in LCY**HU: 3y, not 2y tenor; For recommendation history please see page 62 FX vs. EUR; B: Buy; H: Hold; S: SellSource: RBI/Raiffeisen RESEARCH
14 Please note the risk notifi cations and explanations at the end of this document
Austria
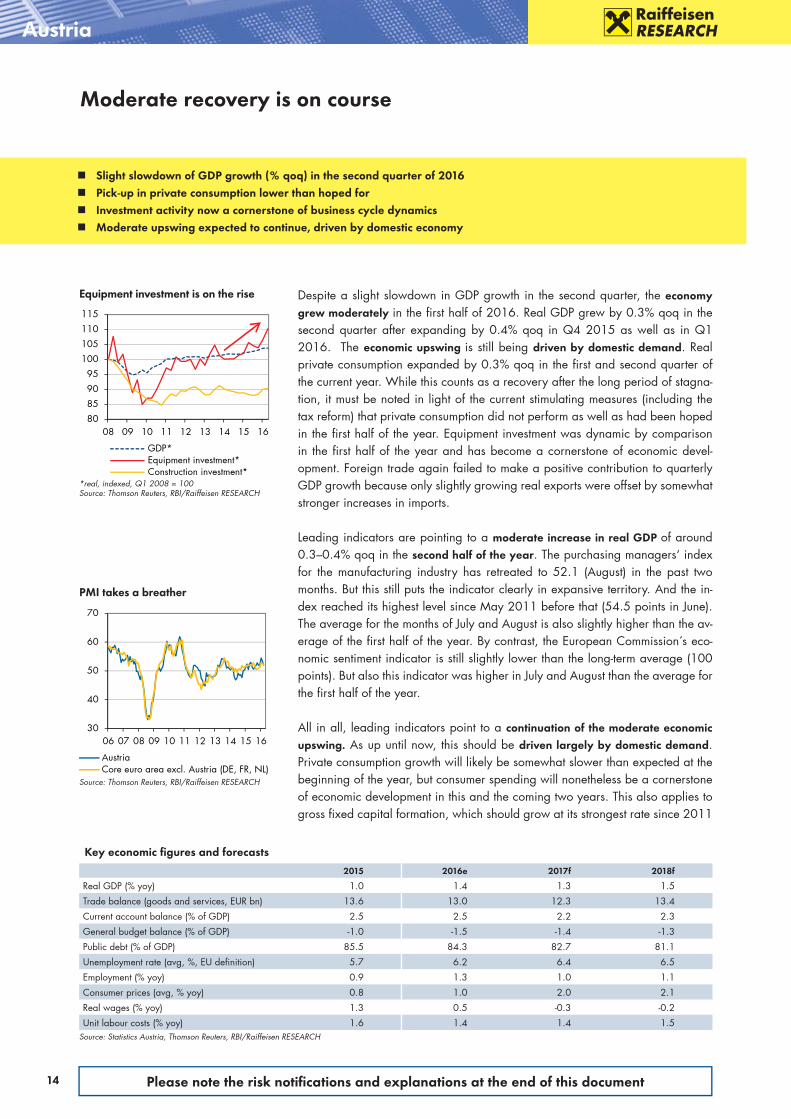
Despite a slight slowdown in GDP growth in the second quarter, the economy grew moderately in the first half of 2016. Real GDP grew by 0.3% qoq in the second quarter after expanding by 0.4% qoq in Q4 2015 as well as in Q1 2016. The economic upswing is still being driven by domestic demand. Real private consumption expanded by 0.3% qoq in the first and second quarter of the current year. While this counts as a recovery after the long period of stagna-tion, it must be noted in light of the current stimulating measures (including the tax reform) that private consumption did not perform as well as had been hoped in the first half of the year. Equipment investment was dynamic by comparison in the first half of the year and has become a cornerstone of economic devel-opment. Foreign trade again failed to make a positive contribution to quarterly GDP growth because only slightly growing real exports were offset by somewhat stronger increases in imports.
Leading indicators are pointing to a moderate increase in real GDP of around 0.3–0.4% qoq in the second half of the year. The purchasing managers‘ index for the manufacturing industry has retreated to 52.1 (August) in the past two months. But this still puts the indicator clearly in expansive territory. And the in-dex reached its highest level since May 2011 before that (54.5 points in June). The average for the months of July and August is also slightly higher than the av-erage of the first half of the year. By contrast, the European Commission´s eco-nomic sentiment indicator is still slightly lower than the long-term average (100 points). But also this indicator was higher in July and August than the average for the first half of the year.
All in all, leading indicators point to a continuation of the moderate economic upswing. As up until now, this should be driven largely by domestic demand. Private consumption growth will likely be somewhat slower than expected at the beginning of the year, but consumer spending will nonetheless be a cornerstone of economic development in this and the coming two years. This also applies to gross fixed capital formation, which should grow at its strongest rate since 2011
Moderate recovery is on course
Equipment investment is on the rise
*real, indexed, Q1 2008 = 100Source: Thomson Reuters, RBI/Raiffeisen RESEARCH
Key economic fi gures and forecasts
2015 2016e 2017f 2018f
Real GDP (% yoy) 1.0 1.4 1.3 1.5
Trade balance (goods and services, EUR bn) 13.6 13.0 12.3 13.4
Current account balance (% of GDP) 2.5 2.5 2.2 2.3
General budget balance (% of GDP) -1.0 -1.5 -1.4 -1.3
Public debt (% of GDP) 85.5 84.3 82.7 81.1
Unemployment rate (avg, %, EU definition) 5.7 6.2 6.4 6.5
Employment (% yoy) 0.9 1.3 1.0 1.1
Consumer prices (avg, % yoy) 0.8 1.0 2.0 2.1
Real wages (% yoy) 1.3 0.5 -0.3 -0.2
Unit labour costs (% yoy) 1.6 1.4 1.4 1.5Source: Statistics Austria, Thomson Reuters, RBI/Raiffeisen RESEARCH
80859095
100105110115
08 09 10 11 12 13 14 15 16
GDP*Equipment investment*Construction investment*
Slight slowdown of GDP growth (% qoq) in the second quarter of 2016 Pick-up in private consumption lower than hoped for Investment activity now a cornerstone of business cycle dynamics Moderate upswing expected to continue, driven by domestic economy
PMI takes a breather
Source: Thomson Reuters, RBI/Raiffeisen RESEARCH
30
40
50
60
70
06 07 08 09 10 11 12 13 14 15 16
AustriaCore euro area excl. Austria (DE, FR, NL)
15Please note the risk notifi cations and explanations at the end of this document
Austria
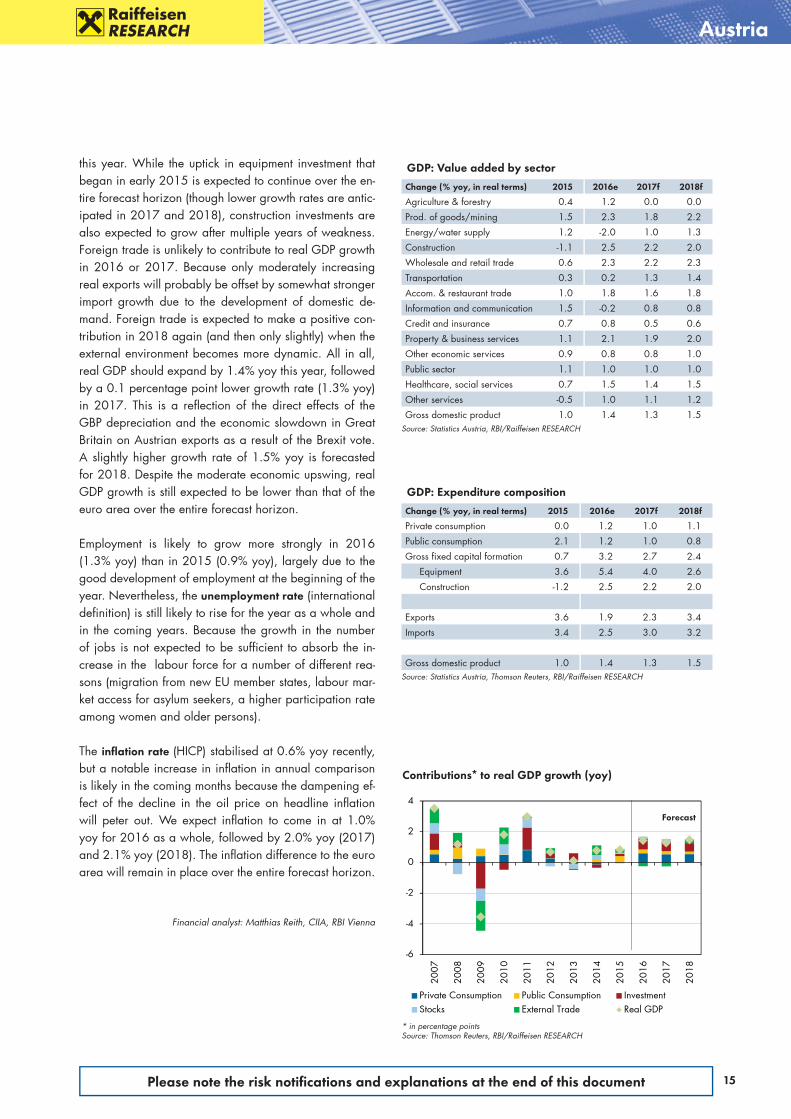
this year. While the uptick in equipment investment that began in early 2015 is expected to continue over the en-tire forecast horizon (though lower growth rates are antic-ipated in 2017 and 2018), construction investments are also expected to grow after multiple years of weakness. Foreign trade is unlikely to contribute to real GDP growth in 2016 or 2017. Because only moderately increasing real exports will probably be offset by somewhat stronger import growth due to the development of domestic de-mand. Foreign trade is expected to make a positive con-tribution in 2018 again (and then only slightly) when the external environment becomes more dynamic. All in all, real GDP should expand by 1.4% yoy this year, followed by a 0.1 percentage point lower growth rate (1.3% yoy) in 2017. This is a reflection of the direct effects of the GBP depreciation and the economic slowdown in Great Britain on Austrian exports as a result of the Brexit vote. A slightly higher growth rate of 1.5% yoy is forecasted for 2018. Despite the moderate economic upswing, real GDP growth is still expected to be lower than that of the euro area over the entire forecast horizon.
Employment is likely to grow more strongly in 2016 (1.3% yoy) than in 2015 (0.9% yoy), largely due to the good development of employment at the beginning of the year. Nevertheless, the unemployment rate (international definition) is still likely to rise for the year as a whole and in the coming years. Because the growth in the number of jobs is not expected to be sufficient to absorb the in-crease in the labour force for a number of different rea-sons (migration from new EU member states, labour mar-ket access for asylum seekers, a higher participation rate among women and older persons).
The infl ation rate (HICP) stabilised at 0.6% yoy recently, but a notable increase in inflation in annual comparison is likely in the coming months because the dampening ef-fect of the decline in the oil price on headline inflation will peter out. We expect inflation to come in at 1.0% yoy for 2016 as a whole, followed by 2.0% yoy (2017) and 2.1% yoy (2018). The inflation difference to the euro area will remain in place over the entire forecast horizon.
Financial analyst: Matthias Reith, CIIA, RBI Vienna
GDP: Expenditure composition
Change (% yoy, in real terms) 2015 2016e 2017f 2018f
Private consumption 0.0 1.2 1.0 1.1
Public consumption 2.1 1.2 1.0 0.8
Gross fixed capital formation 0.7 3.2 2.7 2.4
Equipment 3.6 5.4 4.0 2.6
Construction -1.2 2.5 2.2 2.0
Exports 3.6 1.9 2.3 3.4
Imports 3.4 2.5 3.0 3.2
Gross domestic product 1.0 1.4 1.3 1.5Source: Statistics Austria, Thomson Reuters, RBI/Raiffeisen RESEARCH
GDP: Value added by sector
Change (% yoy, in real terms) 2015 2016e 2017f 2018f
Agriculture & forestry 0.4 1.2 0.0 0.0
Prod. of goods/mining 1.5 2.3 1.8 2.2
Energy/water supply 1.2 -2.0 1.0 1.3
Construction -1.1 2.5 2.2 2.0
Wholesale and retail trade 0.6 2.3 2.2 2.3
Transportation 0.3 0.2 1.3 1.4
Accom. & restaurant trade 1.0 1.8 1.6 1.8
Information and communication 1.5 -0.2 0.8 0.8
Credit and insurance 0.7 0.8 0.5 0.6
Property & business services 1.1 2.1 1.9 2.0
Other economic services 0.9 0.8 0.8 1.0
Public sector 1.1 1.0 1.0 1.0
Healthcare, social services 0.7 1.5 1.4 1.5
Other services -0.5 1.0 1.1 1.2
Gross domestic product 1.0 1.4 1.3 1.5Source: Statistics Austria, RBI/Raiffeisen RESEARCH
Contributions* to real GDP growth (yoy)
* in percentage pointsSource: Thomson Reuters, RBI/Raiffeisen RESEARCH
-6
-4
-2
0
2
4
2007
2008
2009
2010
2011
2012
2013
2014
2015
2016
2017
2018
Private Consumption Public Consumption InvestmentStocks External Trade Real GDP
Forecast

16 Please note the risk notifi cations and explanations at the end of this document
0
2
4
6
8
0
1
2
3
4
2012
2013
2014
2015
2016
e
2017
f
2018
f
Real GDP (% yoy)Industrial output (% yoy, r.h.s.)
Real GDP (% yoy)
Source: Thomson Reuters, RBI/Raiffeisen RESEARCH
Poland
Waiting for EU funds
Forecast
Key economic fi gures and forecasts
2012 2013 2014 2015 2016e 2017f 2018f
Nominal GDP (EUR bn) 389.4 394.8 410.7 427.8 427.8 458.1 493.3
Real GDP (% yoy) 1.6 1.3 3.3 3.6 3.3 3.7 3.1
Industrial output (% yoy) 0.8 1.8 3.5 4.9 4.0 6.0 5.0
Unemployment rate (avg, %) 12.8 13.5 12.3 10.5 9.1 8.5 8.2
Nominal industrial wages (% yoy) 3.4 2.9 3.7 3.5 4.5 4.8 3.5
Producer prices (avg, % yoy) 3.3 -1.3 -1.5 -1.7 -0.3 2.0 2.0
Consumer prices (avg, % yoy) 3.7 0.9 0.0 -0.9 -0.6 1.3 2.0
Consumer prices (eop, % yoy) 2.4 0.7 -1.0 -0.5 0.7 1.8 2.3
General budget balance (% of GDP) -3.7 -4.0 -3.3 -2.6 -2.9 -3.4 -3.4
Public debt (% of GDP) 54.4 55.7 50.5 51.3 52.2 52.6 53.5
Current account balance (% of GDP) -3.5 -1.3 -2.0 -0.3 0.1 -0.7 -1.0
Official FX reserves (EUR bn) 82.6 77.1 83.0 87.4 92.0 95.0 98.0
Gross foreign debt (% of GDP) 71.4 70.4 71.1 70.5 73.9 74.2 73.0
EUR/PLN (avg) 4.18 4.20 4.19 4.18 4.35 4.29 4.19
USD/PLN (avg) 3.26 3.16 3.16 3.77 3.92 4.09 3.84
Source: Thomson Reuters, RBI/Raiffeisen RESEARCH
Forecast
Economic outlookDelays in the absorption of EU funds and declining investment activity in the pub-lic sector seem to be key factors affecting the Polish economy. After a surprisingly weak result for Q1, the rebound in Q2 was only marginal. This, however, doesn’t change our optimistic view of the Polish economy. A later use of EU funds does not mean that related investment projects will not materialise, but that they might occur in 2017 and afterwards. Even if investment activity in the priva te sector re-mains lower than in the previous years, gross fixed capital formation should stay flat in Q3 and rise modestly already in Q4. This means that the negative con-tribution of investments in H1 will turn slightly positive in H2 2016 and signifi-cantly positive in 2017. The main growth driver for the next 2–3 quarters will be private consumption. This should benefit from higher social transfers (the 500+ programme) that started in Q2 but that were cumulated in June and thus had no chance to significantly influence private consumption in Q2 already. As the so-cial transfers should significantly improve the financial situation of poorer fami-lies, they can also change the structure of private consumption more in favour of services. Apart from social transfers, the situation on the labour market suggests upcoming improvements in private consumption. New historical lows in the un-employment rate are making it more and more difficult to fill vacancies. This ris-ing discrepancy between competences being sought on the labour market and the profile of the average unemployed person suggest that the downward trend in unemployment will slow on the one hand and that wage pressure will acceler-ate on the other. Higher wages and stronger private consumption should finally generate some demand-driven inflationary pressure that could emerge in the mid-dle of 2017. CPI should turn positive at year-end already, however, triggered mainly by the low base effect in fuel and food prices.
Financial analysts: Marta Petka-Zagajewska, Raiffeisen Polbank, Warsaw
Falling investments keeping GDP growth below our expectations With rising social transfers, higher private consumption should trigger higher GDP growth Labour market improvement to lead to wage pressure and refl ation Local FX and FI markets to remain well supported
48
50
52
54
56
58-5
-4
-3
-2
-1
0
2012
2013
2014
2015
2016
e
2017
f
2018
f
General budget balance (% of GDP)Public debt (% of GDP, r.h.s.)
Budget balance and public debt
Source: Thomson Reuters, RBI/Raiffeisen RESEARCH

17Please note the risk notifi cations and explanations at the end of this document
4.0
4.1
4.2
4.3
4.4
4.5
Sep-14Mar-15Sep-15Mar-16Sep-16Mar-17
EUR/PLN (eop)
Poland
Exchange rate development
EUR/PLN: 5y high 4.56, 5y low 3.99Source: Bloomberg, RBI/Raiffeisen RESEARCH
PLN yield development (%)
10y PLN T-bond yield: 5y high 6.11, 5y low 2.00Source: Thomson Reuters, RBI/Raiffeisen RESEARCH
Fore
cast
Exchange rate forecasts
21-Sep1 Dec-16 Mar-17 Jun-17 Sep-17
EUR/PLN 4.30 4.35 4.30 4.30 4.25
Cons. 4.32 4.30 4.29 4.30
USD/PLN 3.86 4.03 4.02 4.22 4.05
Cons. 3.95 3.98 4.00 3.971 5:00 p.m. (CEST)Source: Bloomberg, RBI/Raiffeisen RESEARCH
Interest rate forecasts (%)
21-Sep1 Dec-16 Mar-17 Jun-17 Sep-17
Key rate 1.50 1.50 1.50 1.50 1.75
Consensus 1.45 1.45 1.40 1.55
3 month2 1.71 1.65 1.65 1.65 1.85
Consensus 1.66 1.68 1.72 1.801 5:00 p.m. (CEST) 2 Offered rateSource: Bloomberg, RBI/Raiffeisen RESEARCH
Yield forecasts (%)
21-Sep1 Dec-16 Mar-17 Jun-17 Sep-17
2y T-bond2 1.75 1.7 1.8 2.0 2.2
Consensus 1.7 1.9 1.9 2.1
10y T-bond2 2.86 3.2 3.3 3.4 3.4
Consensus 2.9 3.0 3.2 3.31 5:00 p.m. (CEST) 2 Bid yieldSource: Bloomberg, RBI/Raiffeisen RESEARCH
Financial market outlookThe Polish zloty witnessed elevated volatility throughout the third quarter, trad-ing in a range of 4.25–4.45 to the euro. Peer exchange rates quickly managed to regain the strength they lost following the Brexit vote, and the zloty remained volatile, after having seen some short-term support following a less-negative-than-feared FX loan conversion plan, and persisted at elevated levels. This PLN devel-opment can be explained by the political change with the corresponding risks arising from numerous sides (conflict with the EU over rule of law, budget disci-pline, FX loan conversion, rating pressure, etc.). We expect this basic picture to continue in the fourth quarter as well, seeing elevated volatility in comparison with peers for PLN around levels of EUR/PLN 4.35. But given that the political risks seem largely priced into the exchange rate by now, we do not expect sus-tained additional weakening of the zloty from that side. Then again, short-term market hiccups due to political statements should be expected. It should also be kept in mind that the zloty can still be regarded a risk proxy for CEE, thus show-ing strong reaction to unsupportive external news flow.During this summer, the Polish debt market more than recouped the initial losses suffered after the Brexit referendum, in line with its regional peers. The rally was mainly due to the broad-based rotation back into risk assets. In Poland’s case, a certain easing of local political and related near-term rating risks added impetus to the risk-on trade. Concerning global backdrop for EM debt markets, the win-dow of opportunity for continued tight valuations or even a further overshooting of risk asset prices should remain open in the near term. In terms of local drivers, rate cut bets revived from time to time on disappointing GDP and inflation devel-opments. This is helping to anchor the front end of the POLGB curve at least in the medium term. Nevertheless, we maintain our call of a fi rst 25 bp rate hike at the end of September 2017, though our conviction has decreased (before re-viewing our key rate projections, we would like to further monitor economic ac-tivity, especially in terms of the private consumption boom that we expect due to increased social benefits). However, compared with short-end LCY yields, those at the back end of the curve should inch-up higher from their current low levels (especially in 2017). Upward pressure on PLN yields should also emerge at the short end of the curve due to re-intensifying political noise (and the related rat-ing pressure) as well as increasing fiscal risks. One trigger could be the expira-tion of the three-month deadline set by the European Commission in connection with the constitutional crisis, but overall, the yield trajectory should be flatter than earlier anticipated.
Financial analysts: Wolfgang Ernst,CEFA, Stephan Imre, RBI Vienna
1.5
2.0
2.5
3.0
3.5
Sep-14Mar-15Sep-15Mar-16Sep-16Mar-17
10y PLN T-bond yield (%)
Fore
cast

18 Please note the risk notifi cations and explanations at the end of this document
-4
0
4
8
-2
0
2
4
2012
2013
2014
2015
2016
e
2017
f
2018
f
Real GDP (% yoy)Industrial output (% yoy, r.h.s.)
Real GDP (% yoy)
Source: Thomson Reuters, RBI/Raiffeisen RESEARCH
Hungary
Fiscal growth stimulus ahead
Forecast
Forecast
Key economic fi gures and forecasts
2012 2013 2014 2015 2016e 2017f 2018f
Nominal GDP (EUR bn) 99.0 101.3 104.2 108.8 112.6 120.5 127.2
Real GDP (% yoy) -1.7 1.9 3.7 2.9 2.3 2.7 2.9
Industrial output (% yoy) -1.7 -3.5 5.3 6.3 2.4 4.5 4.5
Unemployment rate (avg, %) 10.9 10.3 7.9 6.9 5.3 4.6 4.5
Nominal industrial wages (% yoy) -0.7 4.4 4.0 5.3 7.0 7.5 7.0
Producer prices (avg, % yoy) 4.3 0.7 -0.4 -0.7 -1.0 3.0 2.2
Consumer prices (avg, % yoy) 5.7 1.7 -0.2 0.0 0.3 1.8 2.3
Consumer prices (eop, % yoy) 5.0 0.4 -0.9 0.9 1.1 2.2 2.3
General budget balance (% of GDP) -2.1 -2.3 -2.5 -2.0 -2.0 -2.5 -3.0
Public debt (% of GDP) 78.3 76.8 76.2 75.5 74.6 74.1 73.7
Current account balance (% of GDP) 1.9 4.1 3.9 4.4 4.4 4.1 3.8
Official FX reserves (EUR bn) 33.9 33.8 34.7 30.5 26.0 24.0 22.0
Gross foreign debt (% of GDP) 129.0 118.4 114.8 107.1 98.1 88.4 82.1
EUR/HUF (avg) 289.2 296.8 308.7 309.9 312.3 308.8 309.4
USD/HUF (avg) 225.1 223.6 232.8 279.4 281.3 294.0 283.8
Source: Thomson Reuters, RBI/Raiffeisen RESEARCH
Economic outlookGDP growth came in at 1.8% yoy and 1.0% qoq in Q2 (adjusted for seasonal factors and working days). Growth was driven by consumption (both household and government) and by improving net exports while gross fixed capital forma-tion declined by 20% yoy. On the production side, services, industry, and agricul-ture performed well while construction declined dramatically. The reason for such negative data for investments is the weak absorption of EU funds, namely very high base data for 2015 and lacklustre activity in 2016 so far. The good news is that manufacturing industry investments kept growing, so we see such a bad data print as a one-off event. At the same time, it is not healthy for any economy to de-pend on one-off and mainly external factors (i.e. EU funds in Q2, or one large car maker in Q1) to such a large extent. But the current account balance is still expected to stay at a substantial surplus going forward, though the turnaround in investment activity and the continuation of consumption growth might margin-ally deteriorate the positive numbers. Looking ahead, we expect slightly acceler-ating economic growth for the remainder of the year helped by the fading of the negative one-off impacts and new capacities coming into operation in the man-ufacturing industry. Additionally, the government is prepared to stimulate growth with additional measures. As the Hungarian tax system was re-designed in pre-vious years and its weight was shifted from labour-type taxes to consumption-re-lated ones, the public budget is benefitting from the current growth pattern and there is some room for fiscal loosening. The fiscal package is expected to be an-nounced in the autumn and will most likely include extended public sector wage increases and public sector investments, and possibly cuts in the social security tax. Such measures would generally impact 2017 GDP growth, though. We fore-cast the acceleration of GDP dynamics and expect 2.7% growth for next year.
Financial analyst: Zoltán Török, Raiffeisen Bank Zrt., Budapest
Consumption and improving net exports behind GDP growth, fi scal stimulus in the pipeline Investments collapsed – dri ven by a lack of utilisation of EU funds Key rate bottoms out at 0.9% – and will stay there for some time, creating stable backdrop for HGBs EUR/HUF will likely trade in a range of 310–315 over the coming months
68
71
74
77
80
83-4
-2
0
2012
2013
2014
2015
2016
e
2017
f
2018
f
General budget balance (% of GDP)Public debt (% of GDP, r.h.s.)
Budget balance and public debt
Source: Thomson Reuters, RBI/Raiffeisen RESEARCH

19Please note the risk notifi cations and explanations at the end of this document
Hungary
295
300
305
310
315
320
Sep-14Mar-15Sep-15Mar-16Sep-16Mar-17
EUR/HUF (eop)
Exchange rate development
EUR/HUF: 5y high 321, 5y low 275Source: Thomson Reuters, RBI/Raiffeisen RESEARCH
2.5
3.0
3.5
4.0
4.5
5.0
Sep-14Mar-15Sep-15 Mar-16Sep-16Mar-17
10y HUF T-bond yield (%)
HUF yield development (%)
10y HUF T-bond yield: 5y high 10.83, 5y low 2.82Source: Thomson Reuters, RBI/Raiffeisen RESEARCH
Fore
cast
Exchange rate forecasts21-Sep1 Dec-16 Mar-17 Jun-17 Sep-17
EUR/HUF 308.33 315 310 310 305
Cons. 312 312 312 312
USD/HUF 276.77 292 290 304 290
Cons. 283 286 290 2871 5:00 p.m. (CEST)Source: Bloomberg, RBI/Raiffeisen RESEARCH
Interest rate forecasts (%)
21-Sep1 Dec-16 Mar-17 Jun-17 Sep-17
Key rate 0.90 0.90 0.90 0.90 0.90
Consensus 0.90 0.90 0.85 0.95
3 month2 0.89 0.85 0.80 0.80 0.80
Consensus 0.82 0.83 0.85 0.881 5:00 p.m. (CEST) 2 Offered rateSource: Bloomberg, RBI/Raiffeisen RESEARCH
Yield forecasts (%)
21-Sep1 Dec-16 Mar-17 Jun-17 Sep-17
3y T-bond2 1,32 1,1 1,0 1,2 1,3
Consensus n.v. n.v. n.v. n.v.
10y T-bond2 2,90 2,7 2,8 2,9 3,0
Consensus 2,85 2,91 2,96 2,971 5:00 p.m. (CEST) 2 Bid yieldSource: Bloomberg, RBI/Raiffeisen RESEARCH
Financial market outlookHaving ended its latest rate-cutting cycle in May, the National Bank of Hungary (MNB) announced a fresh round of stimulus measures this summer to ease mon-etary conditions in a further bid to stimulate the economy and lower refinanc-ing costs. From the autumn, the MNB will limit access to its main sterilisation in-strument – tenders for three-month deposits will be held monthly rather than each week and a cap will be imposed on the amount of excess liquidity banks can deposit. These two steps are aimed at reducing borrowing costs without cutting rates, confi rming our expectations that the key rate will remain at 0.9% until at least 2018. Since the announcement of the changes to the liquidity framework, money market rates and bonds have been falling even lower. Short-term inter-bank interest rates have dropped quite sharply and are trading 5–10 bp below the base rate when writing this report – but we don’t see much room for further decline. The reaction of the HGB market as a whole was mixed. Shorter-term yields have reached all-time lows but longer-term rates have not fallen as much, so the yield curve has exhibited a bullish steepening. Despite that, we believe that HGBs will remain attractive in the long run as yield-hunting investors return to the market. The 10y maturity is expected to hit new record lows below 2.7% in 2016. Hun-gary’s CDS premiums have also declined, with the 5y maturity down to 131 bp, the lowest in one and a half years compared with the 141 bp it stood at when the central bank announced it would impose a cap on the 3m facility back in July. In past years, considerable progress has been made in the reduction of external vulnerabilities, though room for further improvement remained. The country’s risk premium is expected to decline further in the coming months. Overall, we main-tain our mildly bullish stance on HGBs due to the central bank’s new measures aimed at channelling liquidity into the financial markets that may force banks to buy more government debt, and because of the favourable external environment that is characterised by an aggressive hunt for yields. Specifically, there could be some room left for further gains for 10y HUF government bonds.After experiencing elevated levels at the start of the quarter due to the Brexit vote, HUF quickly regained strength. Ever since, the forint has been able to stabilise with low volatility, moving towards the bottom of its current EUR/HUF 310–15 trading range. The risks are currently more or less balanced, both to the upside and downside. While volatility is expected to remain low, any movements out-side of this trading range should be short-lived in our view. In this context, we see no reason to change our forecast that EUR/HUF will likely remain in this trading range over the coming months.
Financial analyst: Gergely Pálffy, Raiffeisen Bank Zrt., Budapest
Fore
cast
20 Please note the risk notifi cations and explanations at the end of this document
-2
0
2
4
6
8
10
-1
0
1
2
3
4
5
2012
2013
2014
2015
2016
e
2017
f
2018
f
Real GDP (% yoy)Industrial output (% yoy, r.h.s.)
Czech Republic
Real GDP (% yoy)
Source: Thomson Reuters, RBI/Raiffeisen RESEARCH
Firms battle over new employees with higher wage offers
Forecast
Forecast
Key economic fi gures and forecasts
2012 2013 2014 2015 2016e 2017f 2018f
Nominal GDP (EUR bn) 160.8 156.9 156.6 167.0 174.5 183.3 200.8
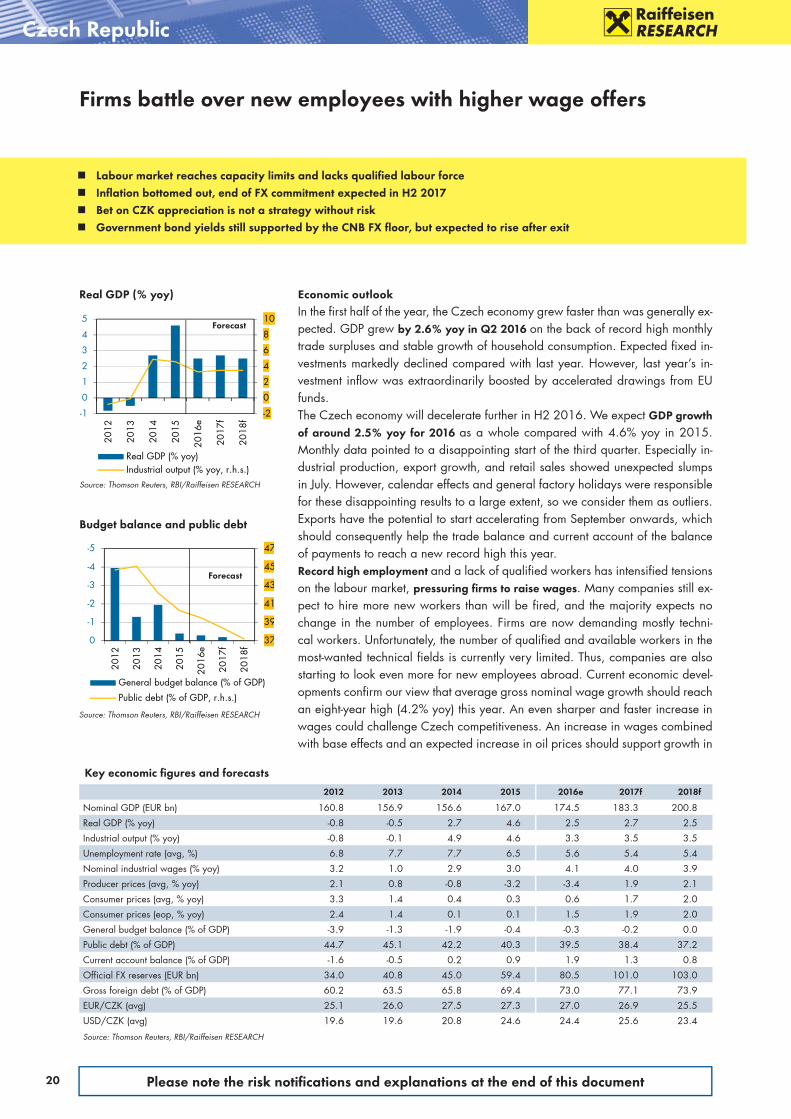
Real GDP (% yoy) -0.8 -0.5 2.7 4.6 2.5 2.7 2.5
Industrial output (% yoy) -0.8 -0.1 4.9 4.6 3.3 3.5 3.5
Unemployment rate (avg, %) 6.8 7.7 7.7 6.5 5.6 5.4 5.4
Nominal industrial wages (% yoy) 3.2 1.0 2.9 3.0 4.1 4.0 3.9
Producer prices (avg, % yoy) 2.1 0.8 -0.8 -3.2 -3.4 1.9 2.1
Consumer prices (avg, % yoy) 3.3 1.4 0.4 0.3 0.6 1.7 2.0
Consumer prices (eop, % yoy) 2.4 1.4 0.1 0.1 1.5 1.9 2.0
General budget balance (% of GDP) -3.9 -1.3 -1.9 -0.4 -0.3 -0.2 0.0
Public debt (% of GDP) 44.7 45.1 42.2 40.3 39.5 38.4 37.2
Current account balance (% of GDP) -1.6 -0.5 0.2 0.9 1.9 1.3 0.8
Official FX reserves (EUR bn) 34.0 40.8 45.0 59.4 80.5 101.0 103.0
Gross foreign debt (% of GDP) 60.2 63.5 65.8 69.4 73.0 77.1 73.9
EUR/CZK (avg) 25.1 26.0 27.5 27.3 27.0 26.9 25.5
USD/CZK (avg) 19.6 19.6 20.8 24.6 24.4 25.6 23.4
Source: Thomson Reuters, RBI/Raiffeisen RESEARCH
Labour market reaches capacity limits and lacks qualifi ed labour force Infl ation bottomed out, end of FX commitment expected in H2 2017 Bet on CZK appreciation is not a strategy without risk Government bond yields still supported by the CNB FX fl oor, but expected to rise after exit
Economic outlookIn the first half of the year, the Czech economy grew faster than was generally ex-pected. GDP grew by 2.6% yoy in Q2 2016 on the back of record high monthly trade surpluses and stable growth of household consumption. Expected fixed in-vestments markedly declined compared with last year. However, last year’s in-vestment inflow was extraordinarily boosted by accelerated drawings from EU funds. The Czech economy will decelerate further in H2 2016. We expect GDP growth of around 2.5% yoy for 2016 as a whole compared with 4.6% yoy in 2015. Monthly data pointed to a disappointing start of the third quarter. Especially in-dustrial production, export growth, and retail sales showed unexpected slumps in July. However, calendar effects and general factory holidays were responsible for these disappointing results to a large extent, so we consider them as outliers. Exports have the potential to start accelerating from September onwards, which should consequently help the trade balance and current account of the balance of payments to reach a new record high this year. Record high employment and a lack of qualified workers has intensified tensions on the labour market, pressuring fi rms to raise wages. Many companies still ex-pect to hire more new workers than will be fired, and the majority expects no change in the number of employees. Firms are now demanding mostly techni-cal workers. Unfortunately, the number of qualified and available workers in the most-wanted technical fields is currently very limited. Thus, companies are also starting to look even more for new employees abroad. Current economic devel-opments confirm our view that average gross nominal wage growth should reach an eight-year high (4.2% yoy) this year. An even sharper and faster increase in wages could challenge Czech competitiveness. An increase in wages combined with base effects and an expected increase in oil prices should support growth in
37
39
41
43
45
47-5
-4
-3
-2
-1
0
2012
2013
2014
2015
2016
e
2017
f
2018
f
General budget balance (% of GDP)
Public debt (% of GDP, r.h.s.)
Budget balance and public debt
Source: Thomson Reuters, RBI/Raiffeisen RESEARCH

21Please note the risk notifi cations and explanations at the end of this document
26.8
27.0
27.2
27.4
27.6
27.8
28.0
Sep-14Mar-15Sep-15Mar-16Sep-16Mar-17
EUR/CZK (eop)
Czech Republic
Exchange rate development
EUR/CZK: 5y high 28.35, 5y low 24.36Source: Thomson Reuters, RBI/Raiffeisen RESEARCH
0.0
0.2
0.4
0.6
0.8
1.0
1.2
1.4
Sep-14Mar-15Sep-15Mar-16Sep-16Mar-17
10y CZK T-bond yield (%)
CZK yield development (%)
10y CZK T-bond yield: 5y high 4.45, 5y low 0.24Source: Thomson Reuters, RBI/Raiffeisen RESEARCH
Fore
cast
Exchange rate forecasts
21-Sep1 Dec-16 Mar-17 Jun-17 Sep-17
EUR/CZK 27.02 27.00 27.00 27.00 27.00
Cons. 27.00 27.00 27.00 27.00
USD/CZK 24.26 25.00 25.23 26.47 25.71
Cons. 24.54 24.75 24.90 24.301 5:00 p.m. (CEST)Source: Bloomberg, RBI/Raiffeisen RESEARCH
Interest rate forecasts (%)
21-Sep1 Dec-16 Mar-17 Jun-17 Sep-17
Key rate 0.05 0.05 0.05 0.05 0.05
Consensus 0.05 0.05 0.05 0.10
3 month2 0.29 0.30 0.30 0.30 0.30
Consensus 0.27 0.26 0.27 0.291 5:00 p.m. (CEST) 2 Offered rateSource: Bloomberg, RBI/Raiffeisen RESEARCH
Yield forecasts (%)
21-Sep1 Dec-16 Mar-17 Jun-17 Sep-17
2y T-bond -0.46 -0.5 -0.3 -0.4 -0.6
Consensus -0.2 -0.2 -0.1 0.0
10y T-bond 0.29 0.3 0.5 0.4 0.4
Consensus 0.4 0.5 0.6 0.71 5:00 p.m. (CEST) Source: Bloomberg, RBI/Raiffeisen RESEARCH
consumer inflation to above 1.5% by year-end. We expect the 2% infl ation tar-get to be reached in Q1 2017.
Financial analysts: Daniela Miluèka, Raiffeisenbank a.s., Prague
Financial market outlookWithin the intervention regime of the Czech National Bank, the amount of for-eign exchange reserves increased to above EUR 70 billion, i.e. above 40% of GDP. The amount was slightly below EUR 60 billion at the beginning of 2016. We continue to expect that the amount of foreign reserves will increase to EUR 80 billion (50% GDP) by the beginning of 2017. The development of FX reserves itself is not a reason (at least so far) why the CNB should be pushed to a faster exit from the intervention regime. The key variable will be inflation and its out-look. We continue to expect that CPI inflation will reach 2% by the end of Q1 2017. CNB governor Jiri Rusnok mentioned that inflation does not necessarily have to reach 2% before the CZK will be allowed to appreciate. It is the inflation outlook that will be important. Nevertheless, even without monetary policy tight-ening, inflation will be unlikely to rise quickly above the 2% target. Moreover, we assume that the ECB will not start the QE tapering process before the second half of 2017. Exiting the CNB intervention regime under the ECB QE program is imaginable, but would be rather uncomfortable for the CNB. Therefore, we have shifted our expectation for an exit from the FX commitment to Q4 2017. Gover-nor Rusnok once specifically stated he would rather not exit during the summer holiday. Although never explicitly said, the parliamentary elections in October 2017 might also play some role in monetary policy decision making. In terms of the time of the exit, we expect a scenario of a sudden end to the commitment and no new explicit FX floor, but the CNB being ready to intervene if the appre-ciation or depreciation is too great. In any case, we warn of increased volatility during that period of time.The market distortion caused by interventions led to several periods of declining FX forwards and negative short-term government bond yields. As we get closer to the exit, the speculation on CZK appreciation might intensify and Czech gov-ernment bond yields might be pushed even lower. Nevertheless, betting on CZK appreciation in a market distorted by interventions is not a strategy without risk. Taking into account our macroeconomic forecast and the assertion of the CNB that the commitment should be abandoned when there is a need for monetary policy tightening, we expect CZK appreciation of about 3%–5% after the exit. Short-term vol atility may be significantly higher than that. Should the speculative pressure on CZK become too great, the CNB might cut interest rates into nega-tive territory – but we do not include this in our base case scenario. After the exit, government bond yields should increase as foreign investors will probably sell part of their holdings in order to take the possible FX profits.
Financial analysts: Michal Brozka, Raiffeisenbank a.s., Prague
Fore
cast
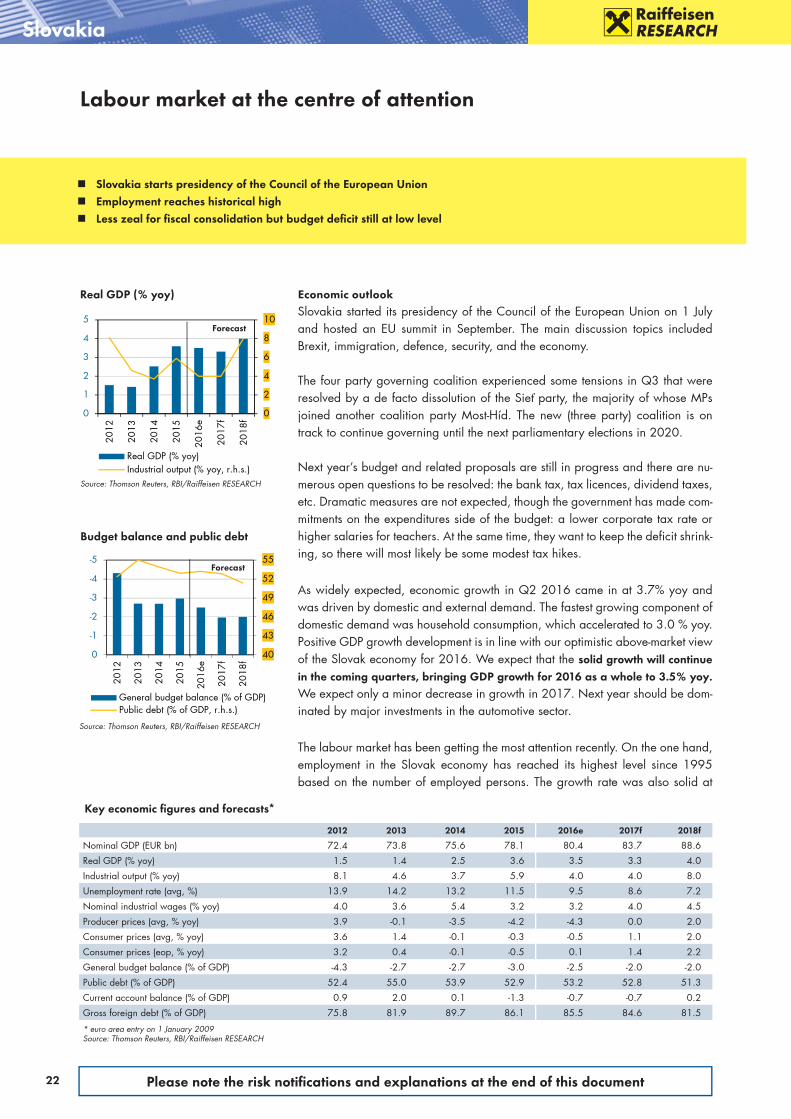
22 Please note the risk notifi cations and explanations at the end of this document
Slovakia
Source: Thomson Reuters, RBI/Raiffeisen RESEARCH
40
43
46
49
52
55-5
-4
-3
-2
-1
0
2012
2013
2014
2015
2016
e
2017
f
2018
f
General budget balance (% of GDP)Public debt (% of GDP, r.h.s.)
Budget balance and public debt
Source: Thomson Reuters, RBI/Raiffeisen RESEARCH
Forecast
0
2
4
6
8
10
0
1
2
3
4
5
2012
2013
2014
2015
2016
e
2017
f
2018
f
Real GDP (% yoy)Industrial output (% yoy, r.h.s.)
Labour market at the centre of attention
Forecast
Real GDP (% yoy)
Slovakia starts presidency of the Council of the European Union Employment reaches historical high Less zeal for fi scal consolidation but budget defi cit still at low level
Key economic fi gures and forecasts*
2012 2013 2014 2015 2016e 2017f 2018f
Nominal GDP (EUR bn) 72.4 73.8 75.6 78.1 80.4 83.7 88.6
Real GDP (% yoy) 1.5 1.4 2.5 3.6 3.5 3.3 4.0
Industrial output (% yoy) 8.1 4.6 3.7 5.9 4.0 4.0 8.0
Unemployment rate (avg, %) 13.9 14.2 13.2 11.5 9.5 8.6 7.2
Nominal industrial wages (% yoy) 4.0 3.6 5.4 3.2 3.2 4.0 4.5
Producer prices (avg, % yoy) 3.9 -0.1 -3.5 -4.2 -4.3 0.0 2.0
Consumer prices (avg, % yoy) 3.6 1.4 -0.1 -0.3 -0.5 1.1 2.0
Consumer prices (eop, % yoy) 3.2 0.4 -0.1 -0.5 0.1 1.4 2.2
General budget balance (% of GDP) -4.3 -2.7 -2.7 -3.0 -2.5 -2.0 -2.0
Public debt (% of GDP) 52.4 55.0 53.9 52.9 53.2 52.8 51.3
Current account balance (% of GDP) 0.9 2.0 0.1 -1.3 -0.7 -0.7 0.2
Gross foreign debt (% of GDP) 75.8 81.9 89.7 86.1 85.5 84.6 81.5
* euro area entry on 1 January 2009Source: Thomson Reuters, RBI/Raiffeisen RESEARCH
Economic outlook Slovakia started its presidency of the Council of the European Union on 1 July and hosted an EU summit in September. The main discussion topics included Brexit, immigration, defence, security, and the economy.
The four party governing coalition experienced some tensions in Q3 that were resolved by a de facto dissolution of the Sieť party, the majority of whose MPs joined another coalition party Most-Híd. The new (three party) coalition is on track to continue governing until the next parliamentary elections in 2020.
Next year’s budget and related proposals are still in progress and there are nu-merous open questions to be resolved: the bank tax, tax licences, dividend taxes, etc. Dramatic measures are not expected, though the government has made com-mitments on the expenditures side of the budget: a lower corporate tax rate or higher salaries for teachers. At the same time, they want to keep the deficit shrink-ing, so there will most likely be some modest tax hikes.
As widely expected, economic growth in Q2 2016 came in at 3.7% yoy and was driven by domestic and external demand. The fastest growing component of domestic demand was household consumption, which accelerated to 3.0 % yoy. Positive GDP growth development is in line with our optimistic above-market view of the Slovak economy for 2016. We expect that the solid growth will continue in the coming quarters, bringing GDP growth for 2016 as a whole to 3.5% yoy. We expect only a minor decrease in growth in 2017. Next year should be dom-inated by major investments in the automotive sector.
The labour market has been getting the most attention recently. On the one hand, employment in the Slovak economy has reached its highest level since 1995 based on the number of employed persons. The growth rate was also solid at

23Please note the risk notifi cations and explanations at the end of this document
-5
0
5
10
15
2012
2013
2014
2015
2016
e
2017
f
2018
f
Unemployment rate (avg, %)Consumer prices (avg, % yoy)
Infl ation outlook
Source: Bloomberg, RBI/Raiffeisen RESEARCH
Slovakia
0
1
2
3
4
5-6
-4
-2
0
2
4
2012
2013
2014
2015
2016
e
2017
f
2018
f
Current account (% of GDP)
Net FDI (% of GDP, r.h.s.)
Current account and FDI infl ows
Source: Thomson Reuters, RBI/Raiffeisen RESEARCH
Forecast
Forecast
2.3% yoy in Q2 2016. On the other hand, the unemployment rate is still rela-tively high, coming in at 9.4% in July – 2 pp higher than the low posted in 2008. The main reason for the elevated unemployment is the higher participation rate. The most visible increase in the participation rate is in the 55–65 age group, which may be due to the extension of the retirement age.
August consumer inflation stood at -0.8% yoy, up from -0.9% in July and showing the first signs of a possible recovery. The main drivers of the negative inflation are lower energy prices (falling oil prices in 2015–2016 are only gradually reflected in regulated energy prices) and lower food prices, as VAT on selected food items was reduced from 20% to 10%. Core inflation (headline ex food, alcohol, to-bacco, and energy) plateaued at 1% yoy in May and decreased to 0.8% yoy in July. We expect headline infl ation to recover marginally in late 2016, approach-ing 0% by the end of 2016. Infl ation should come in slightly above 1% in 2017.
The public finance deficit should be around 2.5% of GDP in 2016. In the first half of the year, the government recorded a significantly smaller deficit on a cash basis than last year (EUR 736 mn in 2016 versus EUR 1,343 mn in 2015) due to improved tax collection and lower spending, opening possibilities for even stronger financial consolidation. However, the government has already made commitments on the expenditure side of the budget (increasing teachers’ wages, increasing pensions, etc.), so we expect the pace of consolidation to be sluggish with defi cits hovering at around 2.0% in 2017 and 2018.
Financial analysts: Boris Fojtík (+421 2 5919 2833), Tibor Lörincz (+421 2 5919 2079), Tatra banka, a.s. Bratislava
Financial market outlookThe development of Slovakian government bonds is still being driven by the ECB’s bond purchases. The yield for a ten-year maturity fell by around 30 bp over the past three months, and is now moving in a range of 0.30% to 0.45%. The spread compared with the German benchmark also narrowed and is now only 50 bp for a ten-year bond. This distinguishes Slovakia clearly from the southern euro countries, where the spreads narrowed much less substantially in the same period. While this development reflects Slovakia’s better fundamental data to a certain extent, it is most likely due to the scarcity of Slovakian govern-ment bonds as a result of the ECB’s purchasing programme. In August, the ECB and NBS together already held close to 20% of the total outstanding government bond volume (as opposed to 8% for Italy and 11% for Spain). In this, the demand from the central banks has a marked effect on a Slovakian government bond mar-ket of modest size and limited liquidity. This limited supply is likely to continue in the 4th quarter given our expectation of a decrease in net issue volume. Nev-ertheless, we see almost no downside potential for spreads on Slovakian govern-ment bonds. The discrepancy between the risk premium and the rating difference is already considerable at the current level.
Financial analyst: Patrick Krizan, RBI Vienna
0.0
0.2
0.4
0.6
0.8
1.0
Apr-16 Jun-16 Aug-16
SK Yield 10Y SK-DE 10Y Spread
Yield and Spread*
*in basis pointsSource: Thomson Reuters, RBI/Raiffeisen RESEARCH

24 Please note the risk notifi cations and explanations at the end of this document
-2-10123456
-4-3-2-101234
2012
2013
2014
2015
2016
e
2017
f
2018
f
Real GDP (% yoy)Industrial output (% yoy, r.h.s.)
Economy on a stable course
Slovenia
0
20
40
60
80
100-15
-12
-9
-6
-3
0
2012
2013
2014
2015
2016
e
2017
f
2018
f
General budget balance (% of GDP)Public debt (% of GDP, r.h.s.)
Real GDP (% yoy)
Source: Thomson Reuters, RBI/Raiffeisen RESEARCH
Budget balance and public debt
Source: Thomson Reuters, RBI/Raiffeisen RESEARCH
Forecast
Fore
cast
Economic conditions in H2 expected to be similarly positive as in H1 GDP growth should benefi t from stronger domestic demand in 2017 and 2018 Infl ation for 2016 as a whole still negative due to oil price effect, then to rise Little potential for further decline in government bond risk premiums despite ECB purchases
Key economic fi gures and forecasts*
2012 2013 2014 2015 2016e 2017f 2018f
Nominal GDP (EUR bn) 36.0 35.9 37.3 38.6 39.3 40.6 42.1
Real GDP (% yoy) -2.7 -1.1 3.1 2.3 2.0 2.1 2.2
Industrial output (% yoy) -1.1 -0.9 2.2 5.6 4.6 4.0 4.5
Unemployment rate (avg, %) 8.9 10.1 9.7 9.0 8.1 7.8 7.6
Nominal industrial wages (% yoy) 2.6 2.8 3.3 2.1 2.0 2.2 2.5
Producer prices (avg, % yoy) 1.0 0.3 -1.1 -0.5 -0.9 1.0 1.2
Consumer prices (avg, % yoy) 2.8 1.9 0.4 -0.8 -0.2 1.3 1.5
Consumer prices (eop, % yoy) 3.1 0.9 -0.1 -0.6 0.8 1.9 1.2
General budget balance (% of GDP) -4.1 -15.0 -5.0 -2.9 -2.7 -2.5 -2.3
Public debt (% of GDP) 53.9 71.0 81.0 83.2 81.7 80.5 79.6
Current account balance (% of GDP) 2.6 4.8 6.2 5.2 7.2 6.8 6.4
Gross foreign debt (% of GDP) 119.1 116.6 124.6 116.6 110.0 104.1 103.0
* euro area entry on 1 January 2007Source: Thomson Reuters, RBI/Raiffeisen RESEARCH
Real GDP expanded by 0.5% qoq in the second quarter, matching the pace of the first three months. But while foreign trade was a pillar of economic develop-ment in the previous quarters, it made a negative contribution to GDP growth in the second quarter. By contrast, equipment investment and private consumption provided key impulses, the latter growing at the fastest rate (% qoq) since Q4 13. The second half of the year is expected to exhibit similar economic dynam-ics as the fi rst half of the year, implying a real GDP growth forecast of 2.0% yoy for the year as a whole. For the subsequent years, we expect to see a slight ac-celeration of GDP growth. While gross fixed capital formation is expected to hamper GDP growth in 2016 as a whole due to weak public investments, pos-itive contributions should come from private consumption and again from for-eign trade. Even though the key impetus should come from foreign trade again in 2017 and 2018, domestic demand (private consumption, investments) will likely play a more important role than before. Infl ation fell back into negative territory (August: -0.2% yoy) in the middle of the year after briefly rising above zero. This dip should be short-lived, however, because the abatement of the dampening ef-fect of the oil price decline (% yoy) is expected to bring a noticeable increase in inflation (% yoy) in the coming months. The ECB’s bond purchases continue to be the key driver of the development of yields for Slovenian government bonds. Due to the combination of limited sup-ply and high demand from the central banks, risk premiums versus the German benchmark bonds fell more strongly than in the southern euro countries. Despite the stable economic situation and a positive rating trend – Moody’s raised its outlook from Baa3 stable to positive – we currently see little room for risk pre-miums to fall further. Demand pressure from the central banks should diminish somewhat in Q4 because the net issuance volume in EUR is likely to increase in the coming months as USD debt is bought back and replaced by bonds denom-inated in euro.
Financial analysts: Matthias Reith, CIIA; Patrick Krizan, RBI Vienna

25Please note the risk notifi cations and explanations at the end of this document
Policy of cheap money works
Bulgaria
Household consumption strongest GDP driver Banking sector in good condition after AQR and stress testing exercise Positive labour market and public fi nance developments First signals of sustainable growth in lending
Real GDP (% yoy)
Source: Thomson Reuters, RBI/Raiffeisen RESEARCH
16
20
24
28
32-4
-3
-2
-1
0
2012
2013
2014
2015
2016
e
2017
f
2018
fGeneral budget balance (% of GDP)Public debt (% of GDP, r.h.s.)
Budget balance and public debt
Source: Bloomberg, RBI/Raiffeisen RESEARCH
Forecast
-10123456
0.00.51.01.52.02.53.03.5
2012
2013
2014
2015
2016
e
2017
f
2018
f
Real GDP (% yoy)Industrial output (% yoy, r.h.s.)
Key economic fi gures and forecasts
2012 2013 2014 2015 2016e 2017f 2018f
Nominal GDP (EUR bn) 41.7 41.9 42.7 44.2 45.9 48.4 51.1
Real GDP (% yoy) 0.2 1.3 1.5 3.0 3.0 3.0 3.3
Industrial output (% yoy) -0.4 -0.1 1.9 2.8 3.8 4.2 5.0
Unemployment rate (avg, %) 12.3 12.9 11.4 9.2 8.0 7.8 7.6
Nominal industrial wages (% yoy) 12.7 0.7 1.5 8.7 10.6 8.2 6.7
Producer prices (avg, % yoy) 4.2 -1.4 -1.2 -1.9 -0.5 1.0 1.6
Consumer prices (avg, % yoy) 3.0 0.9 -1.4 -0.1 0.0 1.6 2.0
Consumer prices (eop, % yoy) 4.2 -1.6 -0.9 -0.4 0.3 2.3 3.0
General budget balance (% of GDP) -0.4 -1.8 -3.6 -2.9 -1.5 -2.0 -2.0
Public debt (% of GDP) 17.6 18.1 26.9 26.3 29.5 30.0 31.0
Current account balance (% of GDP) -0.2 1.9 1.2 1.1 1.1 0.4 1.0
Official FX reserves (EUR bn) 15.6 14.4 16.6 20.4 23.5 21.2 22.4
Gross foreign debt (% of GDP) 90.5 88.1 93.1 77.2 76.2 74.4 72.5
EUR/BGN (avg) 1.96 1.96 1.96 1.96 1.96 1.96 1.96
USD/BGN (avg) 1.52 1.47 1.47 1.76 1.76 1.86 1.79
Source: Thomson Reuters, RBI/Raiffeisen RESEARCH
In H1 2016, real GDP grew faster than anticipated by 3.0% yoy, matching the pace of growth in 2015. The main drivers were household consumption, con-tributing 1.6pp, and investments at 1.4pp. Net exports weakened, adding only 0.4pp to GDP, while government consumption narrowed by 0.6pp. Indeed, the cheaper money coming from the ECB’s ongoing QE policy led to an increase in household consumption, which is pushing GDP growth. It is expected that this trend will continue to drive GDP in H2 (projected 3.0% real GDP growth in 2016). Otherwise, despite the current weak absorption of EU funds, lower inter-est rates on business loans will moderately encourage private investments in Q3 and Q4. Furthermore, the record budget surplus (BGN 3.3 bn as of July) will be spent in H2 (deficit 2.5% of GDP according to budget law), which will also stim-ulate growth. Current improvements in the labour market (8.0% eop unemploy-ment rate in Q2) are expected to continue at a moderate pace for the rest of this year and in H1 2017, reflecting the positive GDP dynamics.The banking sector remained in good condition thanks to growth in lending. Moreover, the results of the AQR and stress testing demonstrated the sector’s strong capital position. Nearly all banks also showed healthy capital positions in adverse scenario simulations. The presidential elections in November are expected to confirm the current GERB-dominated status quo, as the GERB-supported independent candidate is likely to win. This means that the government will probably remain stable over medium term. The external environment is becoming more and more complicated, how-ever. On top of the chronic military conflict in the Middle East, neighbouring Turkey was shaken by a failed military putsch, the consequences of which will likely extend into the medium term. The possible worsening of relations with the EU could increase external risks for Bulgaria, as it represents a major part of the EU’s border with Turkey.
Financial analyst: Emil S. Kalchev, Raiffeisenbank (Bulgaria) EAD, Sofia
Forecast
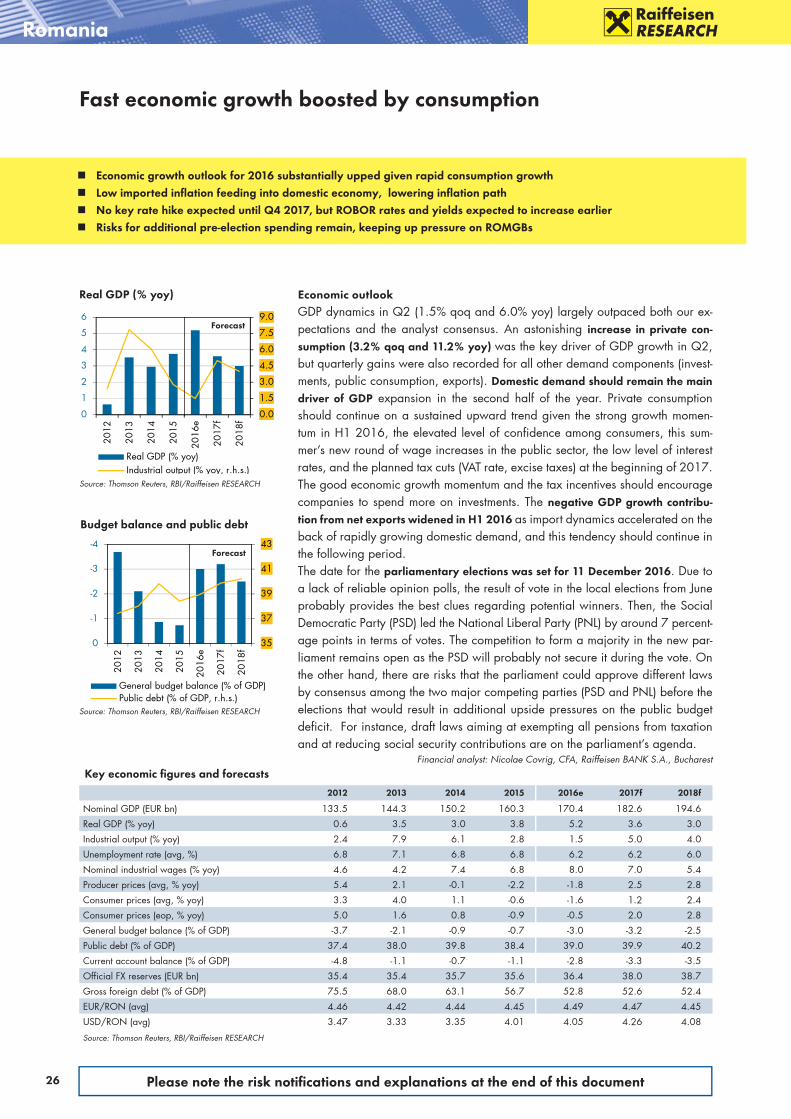
26 Please note the risk notifi cations and explanations at the end of this document
0.0
1.5
3.0
4.5
6.0
7.5
9.0
0
1
2
3
4
5
6
2012
2013
2014
2015
2016
e
2017
f
2018
f
Real GDP (% yoy)Industrial output (% yoy, r.h.s.)
Romania
Real GDP (% yoy)
Source: Thomson Reuters, RBI/Raiffeisen RESEARCH
Fast economic growth boosted by consumption
Forecast
35
37
39
41
43-4
-3
-2
-1
0
2012
2013
2014
2015
2016
e
2017
f
2018
f
General budget balance (% of GDP)Public debt (% of GDP, r.h.s.)
Budget balance and public debt
Source: Thomson Reuters, RBI/Raiffeisen RESEARCH
Forecast
Key economic fi gures and forecasts
2012 2013 2014 2015 2016e 2017f 2018f
Nominal GDP (EUR bn) 133.5 144.3 150.2 160.3 170.4 182.6 194.6
Real GDP (% yoy) 0.6 3.5 3.0 3.8 5.2 3.6 3.0
Industrial output (% yoy) 2.4 7.9 6.1 2.8 1.5 5.0 4.0
Unemployment rate (avg, %) 6.8 7.1 6.8 6.8 6.2 6.2 6.0
Nominal industrial wages (% yoy) 4.6 4.2 7.4 6.8 8.0 7.0 5.4
Producer prices (avg, % yoy) 5.4 2.1 -0.1 -2.2 -1.8 2.5 2.8
Consumer prices (avg, % yoy) 3.3 4.0 1.1 -0.6 -1.6 1.2 2.4
Consumer prices (eop, % yoy) 5.0 1.6 0.8 -0.9 -0.5 2.0 2.8
General budget balance (% of GDP) -3.7 -2.1 -0.9 -0.7 -3.0 -3.2 -2.5
Public debt (% of GDP) 37.4 38.0 39.8 38.4 39.0 39.9 40.2
Current account balance (% of GDP) -4.8 -1.1 -0.7 -1.1 -2.8 -3.3 -3.5
Official FX reserves (EUR bn) 35.4 35.4 35.7 35.6 36.4 38.0 38.7
Gross foreign debt (% of GDP) 75.5 68.0 63.1 56.7 52.8 52.6 52.4
EUR/RON (avg) 4.46 4.42 4.44 4.45 4.49 4.47 4.45
USD/RON (avg) 3.47 3.33 3.35 4.01 4.05 4.26 4.08
Source: Thomson Reuters, RBI/Raiffeisen RESEARCH
Economic growth outlook for 2016 substantially upped given rapid consumption growth Low imported infl ation feeding into domestic economy, lowering infl ation path No key rate hike expected until Q4 2017, but ROBOR rates and yields expected to increase earlier Risks for additional pre-election spending remain, keeping up pressure on ROMGBs
Economic outlookGDP dynamics in Q2 (1.5% qoq and 6.0% yoy) largely outpaced both our ex-pectations and the analyst consensus. An astonishing increase in private con-sumption (3.2% qoq and 11.2% yoy) was the key driver of GDP growth in Q2, but quarterly gains were also recorded for all other demand components (invest-ments, public consumption, exports). Domestic demand should remain the main driver of GDP expansion in the second half of the year. Private consumption should continue on a sustained upward trend given the strong growth momen-tum in H1 2016, the elevated level of confidence among consumers, this sum-mer’s new round of wage increases in the public sector, the low level of interest rates, and the planned tax cuts (VAT rate, excise taxes) at the beginning of 2017. The good economic growth momentum and the tax incentives should encourage companies to spend more on investments. The negative GDP growth contribu-tion from net exports widened in H1 2016 as import dynamics accelerated on the back of rapidly growing domestic demand, and this tendency should continue in the following period. The date for the parliamentary elections was set for 11 December 2016. Due to a lack of reliable opinion polls, the result of vote in the local elections from June probably provides the best clues regarding potential winners. Then, the Social Democratic Party (PSD) led the National Liberal Party (PNL) by around 7 percent-age points in terms of votes. The competition to form a majority in the new par-liament remains open as the PSD will probably not secure it during the vote. On the other hand, there are risks that the parliament could approve different laws by consensus among the two major competing parties (PSD and PNL) before the elections that would result in additional upside pressures on the public budget deficit. For instance, draft laws aiming at exempting all pensions from taxation and at reducing social security contributions are on the parliament’s agenda.
Financial analyst: Nicolae Covrig, CFA, Raiffeisen BANK S.A., Bucharest
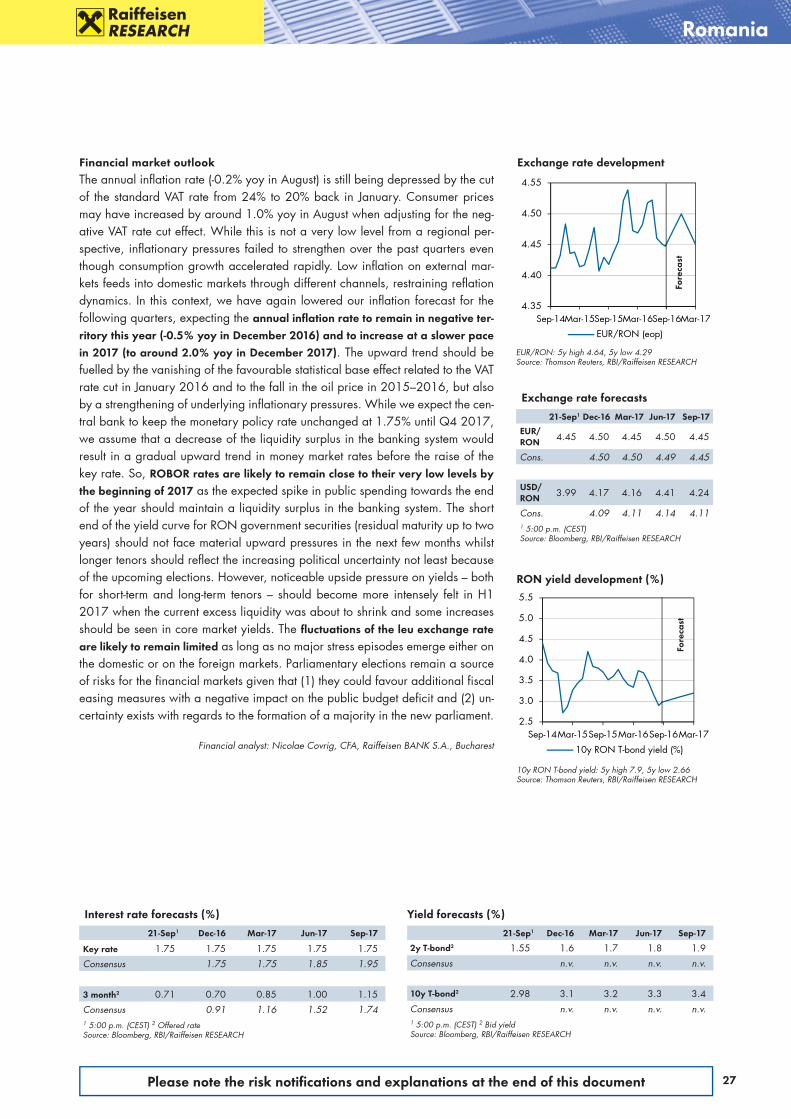
27Please note the risk notifi cations and explanations at the end of this document
Romania
4.35
4.40
4.45
4.50
4.55
Sep-14Mar-15Sep-15Mar-16Sep-16Mar-17
EUR/RON (eop)
Exchange rate development
EUR/RON: 5y high 4.64, 5y low 4.29Source: Thomson Reuters, RBI/Raiffeisen RESEARCH
2.5
3.0
3.5
4.0
4.5
5.0
5.5
Sep-14Mar-15Sep-15Mar-16Sep-16Mar-17
10y RON T-bond yield (%)
RON yield development (%)
10y RON T-bond yield: 5y high 7.9, 5y low 2.66Source: Thomson Reuters, RBI/Raiffeisen RESEARCH
Fore
cast
Exchange rate forecasts
21-Sep1 Dec-16 Mar-17 Jun-17 Sep-17
EUR/RON 4.45 4.50 4.45 4.50 4.45
Cons. 4.50 4.50 4.49 4.45
USD/RON 3.99 4.17 4.16 4.41 4.24
Cons. 4.09 4.11 4.14 4.111 5:00 p.m. (CEST)Source: Bloomberg, RBI/Raiffeisen RESEARCH
Interest rate forecasts (%)
21-Sep1 Dec-16 Mar-17 Jun-17 Sep-17
Key rate 1.75 1.75 1.75 1.75 1.75
Consensus 1.75 1.75 1.85 1.95
3 month2 0.71 0.70 0.85 1.00 1.15
Consensus 0.91 1.16 1.52 1.741 5:00 p.m. (CEST) 2 Offered rateSource: Bloomberg, RBI/Raiffeisen RESEARCH
Yield forecasts (%)
21-Sep1 Dec-16 Mar-17 Jun-17 Sep-17
2y T-bond2 1.55 1.6 1.7 1.8 1.9
Consensus n.v. n.v. n.v. n.v.
10y T-bond2 2.98 3.1 3.2 3.3 3.4
Consensus n.v. n.v. n.v. n.v.1 5:00 p.m. (CEST) 2 Bid yieldSource: Bloomberg, RBI/Raiffeisen RESEARCH
Financial market outlook The annual inflation rate (-0.2% yoy in August) is still being depressed by the cut of the standard VAT rate from 24% to 20% back in January. Consumer prices may have increased by around 1.0% yoy in August when adjusting for the neg-ative VAT rate cut effect. While this is not a very low level from a regional per-spective, inflationary pressures failed to strengthen over the past quarters even though consumption growth accelerated rapidly. Low inflation on external mar-kets feeds into domestic markets through different channels, restraining reflation dynamics. In this context, we have again lowered our inflation forecast for the following quarters, expecting the annual infl ation rate to remain in negative ter-ritory this year (-0.5% yoy in December 2016) and to increase at a slower pace in 2017 (to around 2.0% yoy in December 2017). The upward trend should be fuelled by the vanishing of the favourable statistical base effect related to the VAT rate cut in January 2016 and to the fall in the oil price in 2015–2016, but also by a strengthening of underlying inflationary pressures. While we expect the cen-tral bank to keep the monetary policy rate unchanged at 1.75% until Q4 2017, we assume that a decrease of the liquidity surplus in the banking system would result in a gradual upward trend in money market rates before the raise of the key rate. So, ROBOR rates are likely to remain close to their very low levels by the beginning of 2017 as the expected spike in public spending towards the end of the year should maintain a liquidity surplus in the banking system. The short end of the yield curve for RON government securities (residual maturity up to two years) should not face material upward pressures in the next few months whilst longer tenors should reflect the increasing political uncertainty not least because of the upcoming elections. However, noticeable upside pressure on yields – both for short-term and long-term tenors – should become more intensely felt in H1 2017 when the current excess liquidity was about to shrink and some increases should be seen in core market yields. The fl uctuations of the leu exchange rate are likely to remain limited as long as no major stress episodes emerge either on the domestic or on the foreign markets. Parliamentary elections remain a source of risks for the financial markets given that (1) they could favour additional fiscal easing measures with a negative impact on the public budget deficit and (2) un-certainty exists with regards to the formation of a majority in the new parliament.
Financial analyst: Nicolae Covrig, CFA, Raiffeisen BANK S.A., Bucharest
Fore
cast
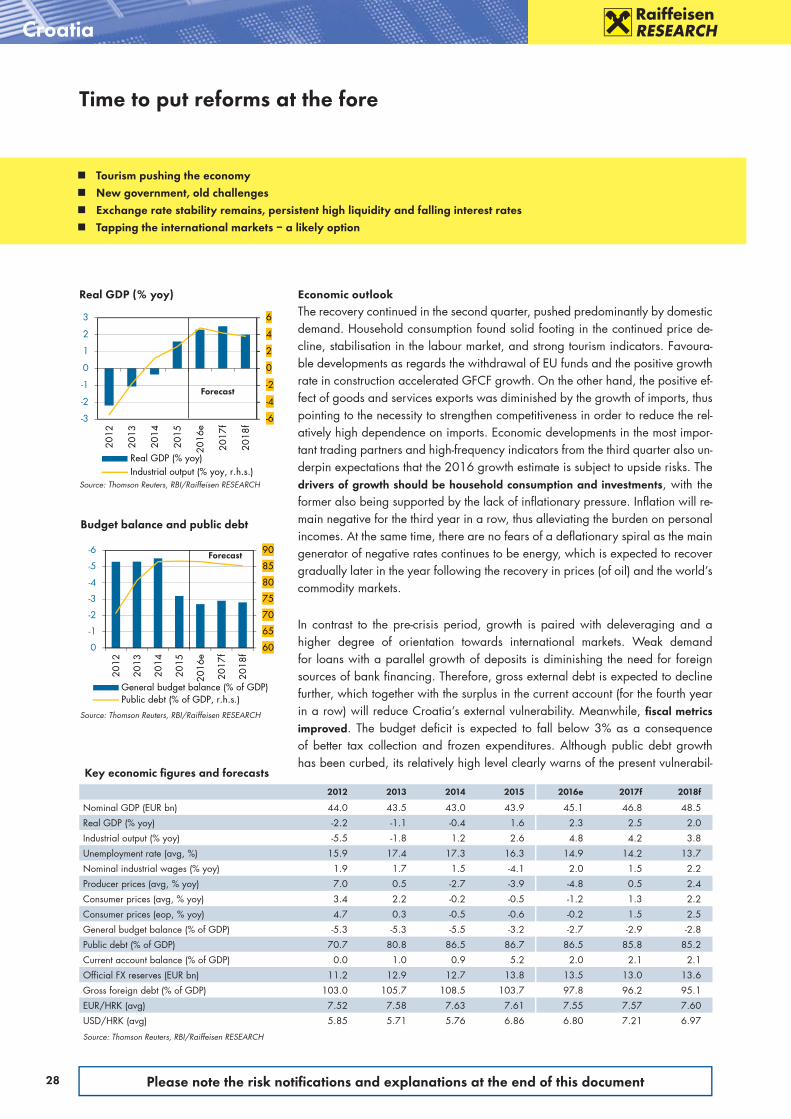
28 Please note the risk notifi cations and explanations at the end of this document
-6
-4
-2
0
2
4
6
-3
-2
-1
0
1
2
3
2012
2013
2014
2015
2016
e
2017
f
2018
f
Real GDP (% yoy)Industrial output (% yoy, r.h.s.)
60
65
70
75
80
85
90-6
-5
-4
-3
-2
-1
0
2012
2013
2014
2015
2016
e
2017
f
2018
f
General budget balance (% of GDP)Public debt (% of GDP, r.h.s.)
Real GDP (% yoy)
Source: Thomson Reuters, RBI/Raiffeisen RESEARCH
Time to put reforms at the fore
Budget balance and public debt
Source: Thomson Reuters, RBI/Raiffeisen RESEARCH
Forecast
Forecast
Key economic fi gures and forecasts
2012 2013 2014 2015 2016e 2017f 2018f
Nominal GDP (EUR bn) 44.0 43.5 43.0 43.9 45.1 46.8 48.5
Real GDP (% yoy) -2.2 -1.1 -0.4 1.6 2.3 2.5 2.0
Industrial output (% yoy) -5.5 -1.8 1.2 2.6 4.8 4.2 3.8
Unemployment rate (avg, %) 15.9 17.4 17.3 16.3 14.9 14.2 13.7
Nominal industrial wages (% yoy) 1.9 1.7 1.5 -4.1 2.0 1.5 2.2
Producer prices (avg, % yoy) 7.0 0.5 -2.7 -3.9 -4.8 0.5 2.4
Consumer prices (avg, % yoy) 3.4 2.2 -0.2 -0.5 -1.2 1.3 2.2
Consumer prices (eop, % yoy) 4.7 0.3 -0.5 -0.6 -0.2 1.5 2.5
General budget balance (% of GDP) -5.3 -5.3 -5.5 -3.2 -2.7 -2.9 -2.8
Public debt (% of GDP) 70.7 80.8 86.5 86.7 86.5 85.8 85.2
Current account balance (% of GDP) 0.0 1.0 0.9 5.2 2.0 2.1 2.1
Official FX reserves (EUR bn) 11.2 12.9 12.7 13.8 13.5 13.0 13.6
Gross foreign debt (% of GDP) 103.0 105.7 108.5 103.7 97.8 96.2 95.1
EUR/HRK (avg) 7.52 7.58 7.63 7.61 7.55 7.57 7.60
USD/HRK (avg) 5.85 5.71 5.76 6.86 6.80 7.21 6.97
Source: Thomson Reuters, RBI/Raiffeisen RESEARCH
Tourism pushing the economy New government, old challenges Exchange rate stability remains, persistent high liquidity and falling interest rates Tapping the international markets – a likely option
Croatia
Economic outlookThe recovery continued in the second quarter, pushed predominantly by domestic demand. Household consumption found solid footing in the continued price de-cline, stabilisation in the labour market, and strong tourism indicators. Favoura-ble developments as regards the withdrawal of EU funds and the positive growth rate in construction accelerated GFCF growth. On the other hand, the positive ef-fect of goods and services exports was diminished by the growth of imports, thus pointing to the necessity to strengthen competitiveness in order to reduce the rel-atively high dependence on imports. Economic developments in the most impor-tant trading partners and high-frequency indicators from the third quarter also un-derpin expectations that the 2016 growth estimate is subject to upside risks. The drivers of growth should be household consumption and investments, with the former also being supported by the lack of inflationary pressure. Inflation will re-main negative for the third year in a row, thus alleviating the burden on personal incomes. At the same time, there are no fears of a deflationary spiral as the main generator of negative rates continues to be energy, which is expected to recover gradually later in the year following the recovery in prices (of oil) and the world’s commodity markets.
In contrast to the pre-crisis period, growth is paired with deleveraging and a higher degree of orientation towards international markets. Weak demand for loans with a parallel growth of deposits is diminishing the need for foreign sources of bank financing. Therefore, gross external debt is expected to decline further, which together with the surplus in the current account (for the fourth year in a row) will reduce Croatia’s external vulnerability. Meanwhile, fi scal metrics improved. The budget deficit is expected to fall below 3% as a consequence of better tax collection and frozen expenditures. Although public debt growth has been curbed, its relatively high level clearly warns of the present vulnerabil-

29Please note the risk notifi cations and explanations at the end of this document
7.45
7.50
7.55
7.60
7.65
7.70
Sep-14Mar-15Sep-15Mar-16Sep-16Mar-17EUR/HRK (eop)
3.0
3.2
3.4
3.6
3.8
4.0
4.2
4.4
Sep-14Mar-15Sep-15Mar-16Sep-16Mar-1710y HRK T-bond yield (%)
Croatia
Exchange rate development
EUR/HRK: 5y high 7.72, 5y low 7.39Source: Thomson Reuters, RBI/Raiffeisen RESEARCH
HRK yield development (%)
10y HRK T-bond yield: 5y high 7.47, 5y low 3.01Source: Thomson Reuters, RBI/Raiffeisen RESEARCH
Exchange rate forecasts
21-Sep1 Dec-16 Mar-17 Jun-17 Sep-17
EUR/HRK 7.51 7.60 7.60 7.50 7.55
Cons. 7.54 7.54 7.55 7.56
USD/HRK 6.74 7.04 7.10 7.35 7.19
Cons. 6.85 6.88 6.92 6.951 5:00 p.m. (CEST)Source: Bloomberg, RBI/Raiffeisen RESEARCH
Yield forecasts (%)
21-Sep1 Dec-16 Mar-17 Jun-17 Sep-17
2y T-bond 1.48 1.7 1.7 1.7 1.8
Consensus n.v. n.v. n.v. n.v.
10y T-bond 3.43 3.4 3.4 3.4 3.5
Consensus n.v. n.v. n.v. n.v.1 5:00 p.m. (CEST) Source: Bloomberg, RBI/Raiffeisen RESEARCH
Fore
cast
Interest rate forecast (%)
21-Sep1 Dec-16 Mar-17 Jun-17 Sep-17
3 month2 0.87 0.89 0.90 0.90 0.901 5:00 p.m. (CEST) 2 Offered rateSource: Bloomberg, RBI/Raiffeisen RESEARCH
ity and necessity to tackle the deep-seated structural weaknesses. Therefore, the new government is faced with the old challenge: how to boost growth and keep fiscal consolidation on track. Without public sector reforms and improvements in the investment climate, the former will fail especially in the medium to long term.
Financial market outlookThe peak of the tourist season combined with more favourable fiscal risks, the FCY inflow (from borrowing and/or EU funds), and the positive net foreign posi-tion of banks supported the HRK during the summer months. As expected, EUR/HRK did not fall below 7.45, in part due to the steady demand for euros that arises with the growth of imports. At the end of the summer, the kuna should ex-hibit a common mild depreciation trend, with the upward EUR/HRK movement being expected to last until the end of the year. So, after several years of slight HRK depreciation, 2016 confirmed that in the case of Croatia, a recovery in eco-nomic activity is mostly accompanied by the strengthening of the local currency. Amid such conditions, monetary policy remains expansive – thus ensuring the li-quidity of the financial system and a further lowering of interest rates. Money market rates and yields on the sovereign curve reached new historical lows and will remain there in the quarters to come.
In terms of refi nancing, 2017 could be far more challenging than 2016. Only H1 2017 shows a sizeable amount of sovereign maturities (February: HRK 5.5 bn; April: USD 1.5 bn). Refinancing needs are elevated over the coming years (about 20% of GDP). Despite ample liquidity on the local market, solid absorption by large institutional investors (e.g. pension funds), and the willingness of banks to lend to the state, we think that refinancing needs cannot be fully covered on the domestic market. Moreover, banking exposure to the central government already accounts for 20% of assets and we see a limited willingness to boost exposures further. Sovereign limits of many (major) local banks are also set up in coordina-tion with their foreign parents. Any further political volatility is likely to add to an already risk-averse attitude. However, local banking sector balance sheet struc-tures have to be taken into account as well. Local banks have to cope with chang-ing capital requirements (CRR, CRD IV). Until 2019, only LCY investments in gov-ernment debt are unlimited. But deposits in FCY (EUR) dominate on the funding side. The growing demand for LCY loans in the private sector leaves some room for additional government financing, but in FCY only.Tapping the international markets – which would require decent investor confi-dence – will be a must rather than an option. We have no doubt that Croatia will meet all the obligations, but the main question is price. In respect of pricing, one of the crucial factors will be political stability, especially in the case of an eco-nomic slowdown.
Financial analyst: Z. Živkoviæ Matijeviæ, Raiffeisenbank Austria d.d., Zagreb
Fore
cast
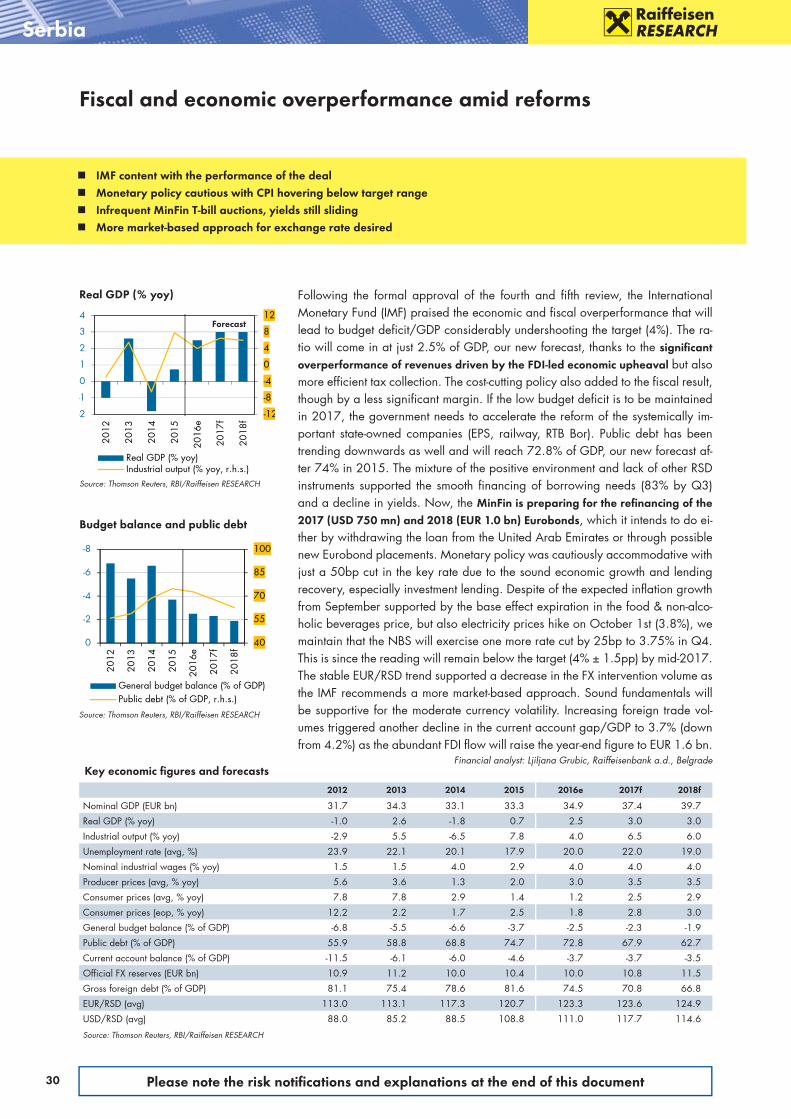
30 Please note the risk notifi cations and explanations at the end of this document
Key economic fi gures and forecasts
2012 2013 2014 2015 2016e 2017f 2018f
Nominal GDP (EUR bn) 31.7 34.3 33.1 33.3 34.9 37.4 39.7
Real GDP (% yoy) -1.0 2.6 -1.8 0.7 2.5 3.0 3.0
Industrial output (% yoy) -2.9 5.5 -6.5 7.8 4.0 6.5 6.0
Unemployment rate (avg, %) 23.9 22.1 20.1 17.9 20.0 22.0 19.0
Nominal industrial wages (% yoy) 1.5 1.5 4.0 2.9 4.0 4.0 4.0
Producer prices (avg, % yoy) 5.6 3.6 1.3 2.0 3.0 3.5 3.5
Consumer prices (avg, % yoy) 7.8 7.8 2.9 1.4 1.2 2.5 2.9
Consumer prices (eop, % yoy) 12.2 2.2 1.7 2.5 1.8 2.8 3.0
General budget balance (% of GDP) -6.8 -5.5 -6.6 -3.7 -2.5 -2.3 -1.9
Public debt (% of GDP) 55.9 58.8 68.8 74.7 72.8 67.9 62.7
Current account balance (% of GDP) -11.5 -6.1 -6.0 -4.6 -3.7 -3.7 -3.5
Official FX reserves (EUR bn) 10.9 11.2 10.0 10.4 10.0 10.8 11.5
Gross foreign debt (% of GDP) 81.1 75.4 78.6 81.6 74.5 70.8 66.8
EUR/RSD (avg) 113.0 113.1 117.3 120.7 123.3 123.6 124.9
USD/RSD (avg) 88.0 85.2 88.5 108.8 111.0 117.7 114.6
Source: Thomson Reuters, RBI/Raiffeisen RESEARCH
Following the formal approval of the fourth and fifth review, the International Monetary Fund (IMF) praised the economic and fiscal overperformance that will lead to budget deficit/GDP considerably undershooting the target (4%). The ra-tio will come in at just 2.5% of GDP, our new forecast, thanks to the signifi cant overperformance of revenues driven by the FDI-led economic upheaval but also more efficient tax collection. The cost-cutting policy also added to the fiscal result, though by a less significant margin. If the low budget deficit is to be maintained in 2017, the government needs to accelerate the reform of the systemically im-portant state-owned companies (EPS, railway, RTB Bor). Public debt has been trending downwards as well and will reach 72.8% of GDP, our new forecast af-ter 74% in 2015. The mixture of the positive environment and lack of other RSD instruments supported the smooth financing of borrowing needs (83% by Q3) and a decline in yields. Now, the MinFin is preparing for the refi nancing of the 2017 (USD 750 mn) and 2018 (EUR 1.0 bn) Eurobonds, which it intends to do ei-ther by withdrawing the loan from the United Arab Emirates or through possible new Eurobond placements. Monetary policy was cautiously accommodative with just a 50bp cut in the key rate due to the sound economic growth and lending recovery, especially investment lending. Despite of the expected inflation growth from September supported by the base effect expiration in the food & non-alco-holic beverages price, but also electricity prices hike on October 1st (3.8%), we maintain that the NBS will exercise one more rate cut by 25bp to 3.75% in Q4. This is since the reading will remain below the target (4% ± 1.5pp) by mid-2017. The stable EUR/RSD trend supported a decrease in the FX intervention volume as the IMF recommends a more mar ket-based approach. Sound fundamentals will be supportive for the moderate currency volatility. Increasing foreign trade vol-umes triggered another decline in the current account gap/GDP to 3.7% (down from 4.2%) as the abundant FDI flow will raise the year-end figure to EUR 1.6 bn.
Financial analyst: Ljiljana Grubic, Raiffeisenbank a.d., Belgrade
Fiscal and economic overperformance amid reforms
Serbia
IMF content with the performance of the deal Monetary policy cautious with CPI hovering below target range Infrequent MinFin T-bill auctions, yields still sliding More market-based approach for exchange rate desired
-12
-8
-4
0
4
8
12
-2
-1
0
1
2
3
4
2012
2013
2014
2015
2016
e
2017
f
2018
f
Real GDP (% yoy)Industrial output (% yoy, r.h.s.)
Real GDP (% yoy)
Source: Thomson Reuters, RBI/Raiffeisen RESEARCH
Forecast
40
55
70
85
100-8
-6
-4
-2
0
2012
2013
2014
2015
2016
e
2017
f
2018
f
General budget balance (% of GDP)Public debt (% of GDP, r.h.s.)
Budget balance and public debt
Source: Thomson Reuters, RBI/Raiffeisen RESEARCH

31Please note the risk notifi cations and explanations at the end of this document
Key economic fi gures and forecasts
2012 2013 2014 2015 2016e 2017f 2018f
Nominal GDP (EUR bn) 13.4 13.7 14.0 14.6 15.2 16.0 17.1
Real GDP (% yoy) -0.9 2.4 1.1 3.0 3.0 3.5 4.0
Industrial output (% yoy) -5.2 6.7 0.1 2.6 5.0 6.5 8.0
Unemployment rate (avg, %) 28.0 27.5 27.5 27.7 25.4 24.0 23.0
Nominal industrial wages (% yoy) 2.2 -0.5 0.3 0.0 3.0 5.0 5.5
Producer prices (avg, % yoy) 1.3 -2.2 -0.2 0.6 1.5 2.5 3.0
Consumer prices (avg, % yoy) 2.1 -0.1 -0.9 -1.0 -0.9 1.5 2.5
Consumer prices (eop, % yoy) 1.8 -1.2 0.0 -1.3 -0.5 2.0 2.8
General budget balance (% of GDP) -2.0 -2.2 -2.0 0.7 -1.5 -1.0 -1.0
Public debt (% of GDP) 40.3 39.6 43.0 42.8 42.5 42.8 42.5
Current account balance (% of GDP) -9.1 -5.3 -7.5 -5.6 -5.4 -7.5 -7.7
Official FX reserves (EUR bn) 3.3 3.6 4.0 4.4 4.6 4.7 4.9
Gross foreign debt (% of GDP) 52.2 52.2 51.8 53.4 54.8 55.0 54.3
EUR/BAM (avg) 1.96 1.96 1.96 1.96 1.96 1.96 1.96
USD/BAM (avg) 1.52 1.47 1.47 1.76 1.76 1.86 1.79
Source: Thomson Reuters, RBI/Raiffeisen RESEARCH
Political developments at centre stage in 2016
Bosnia and Herzegovina
EU accepted membership application First tranche of the IMF Extended Fund Facility allocated to B&H Positive real GDP assessment for 2016–2018 remains intact B&H facing fourth straight year of defl ation in 2016
37
39
41
43
45-3
-2
-1
0
1
2012
2013
2014
2015
2016
e
2017
f
2018
f
General budget balance (% of GDP)Public debt (% of GDP, r.h.s.)
Real GDP (% yoy)
Source: Thomson Reuters, RBI/Raiffeisen RESEARCH
Budget balance and public debt
Source: Thomson Reuters, RBI/Raiffeisen RESEARCH
Forecast
-6-4-20246810
-2-1012345
2012
2013
2014
2015
2016
e
2017
f
2018
f
Real GDP (% yoy)Industrial output (% yoy, r.h.s.)
Forecast
Especially the third quarter of 2016 was dominated by political events, deci-sions, and rising tensions. On 20 September 2016 EU member states accepted Bosnia and Herzegovina’s membership application. The European Commission will now determine whether Bosnia meets criteria to become a candidate coun-try, a process that could take a year. The Executive Board of the IMF approved the Extended Fund Facility (EFF) to B&H in the amount of EUR 550 mn, with the first tranche of EUR 79 mn already being allocated to the country. However, due to the time-consuming process for the quarterly reviews of the agreed measures/reforms by the IMF mission, we believe that B&H will not receive the second tranche in Q4. Hence, we see the amendment of the budgets of FB&H and RS as inevitable in the beginning of Q4. Our baseline scenario for this year with a real GDP increase of around 3.0% yoy remains unchanged. Economic growth re-mained solid in early 2016 as real GDP advanced by 2.1% yoy and 1.3% qoq in Q1 2016. Real GDP should remain on an upward trend in following quarters as most of the macroeconomic indicators published on a monthly basis (industry, exports, and retail sales) climbed to higher levels in Q2 and Q3. On a negative note, inflation is still very low, and B&H is facing its fourth straight year of defla-tion. Our positive assessment for the medium term also remains unchanged, with real GDP likely reaching its peak of 4.0% yoy in 2018. The economic momentum is expected to be driven by most of the GDP categories, but exports and gross in-vestments should be at the forefront with growth rates of 6.2% yoy and 7.2% on average in 2016–2018. Exports should benefit from the positive dynamics in the EU (primarily Germany), while investment is mostly related to the energy sector and infrastructure projects. Nevertheless, the main risk for such a scenario (espe-cially for announced investments) remains the persistent fragile political stability.
Financial analyst: Srebrenko Fatušiæ, Raiffeisen Bank d.d., Sarajevo
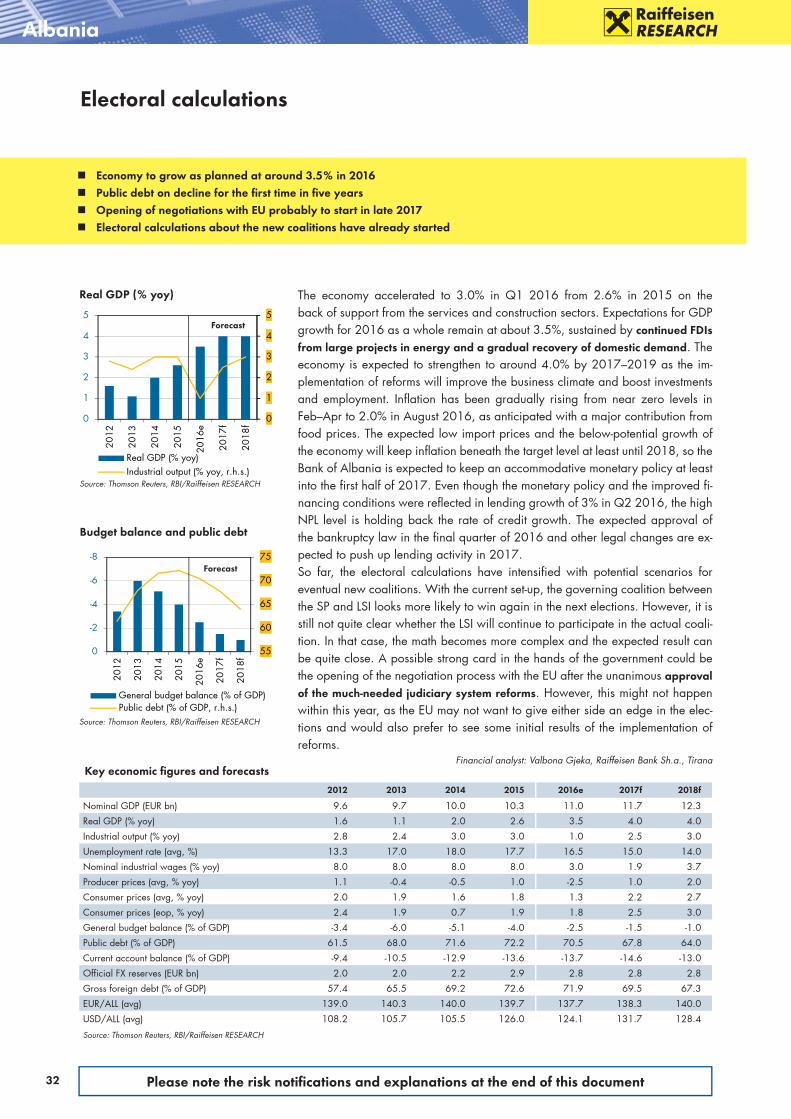
32 Please note the risk notifi cations and explanations at the end of this document
Key economic fi gures and forecasts
2012 2013 2014 2015 2016e 2017f 2018f
Nominal GDP (EUR bn) 9.6 9.7 10.0 10.3 11.0 11.7 12.3
Real GDP (% yoy) 1.6 1.1 2.0 2.6 3.5 4.0 4.0
Industrial output (% yoy) 2.8 2.4 3.0 3.0 1.0 2.5 3.0
Unemployment rate (avg, %) 13.3 17.0 18.0 17.7 16.5 15.0 14.0
Nominal industrial wages (% yoy) 8.0 8.0 8.0 8.0 3.0 1.9 3.7
Producer prices (avg, % yoy) 1.1 -0.4 -0.5 1.0 -2.5 1.0 2.0
Consumer prices (avg, % yoy) 2.0 1.9 1.6 1.8 1.3 2.2 2.7
Consumer prices (eop, % yoy) 2.4 1.9 0.7 1.9 1.8 2.5 3.0
General budget balance (% of GDP) -3.4 -6.0 -5.1 -4.0 -2.5 -1.5 -1.0
Public debt (% of GDP) 61.5 68.0 71.6 72.2 70.5 67.8 64.0
Current account balance (% of GDP) -9.4 -10.5 -12.9 -13.6 -13.7 -14.6 -13.0
Official FX reserves (EUR bn) 2.0 2.0 2.2 2.9 2.8 2.8 2.8
Gross foreign debt (% of GDP) 57.4 65.5 69.2 72.6 71.9 69.5 67.3
EUR/ALL (avg) 139.0 140.3 140.0 139.7 137.7 138.3 140.0
USD/ALL (avg) 108.2 105.7 105.5 126.0 124.1 131.7 128.4
Source: Thomson Reuters, RBI/Raiffeisen RESEARCH
Electoral calculations
Albania
Economy to grow as planned at around 3.5% in 2016 Public debt on decline for the fi rst time in fi ve years Opening of negotiations with EU probably to start in late 2017 Electoral calculations about the new coalitions have already started
55
60
65
70
75-8
-6
-4
-2
0
2012
2013
2014
2015
2016
e
2017
f
2018
f
General budget balance (% of GDP)Public debt (% of GDP, r.h.s.)
Real GDP (% yoy)
Source: Thomson Reuters, RBI/Raiffeisen RESEARCH
Budget balance and public debt
Source: Thomson Reuters, RBI/Raiffeisen RESEARCH
Forecast
Forecast
0
1
2
3
4
5
0
1
2
3
4
5
2012
2013
2014
2015
2016
e
2017
f
2018
f
Real GDP (% yoy)Industrial output (% yoy, r.h.s.)
The economy accelerated to 3.0% in Q1 2016 from 2.6% in 2015 on the back of support from the services and construction sectors. Expectations for GDP growth for 2016 as a whole remain at about 3.5%, sustained by continued FDIs from large projects in energy and a gradual recovery of domestic demand. The economy is expected to strengthen to around 4.0% by 2017–2019 as the im-plementation of reforms will improve the business climate and boost investments and employment. Inflation has been gradually rising from near zero levels in Feb–Apr to 2.0% in August 2016, as anticipated with a major contribution from food prices. The expected low import prices and the below-potential growth of the economy will keep inflation beneath the target level at least until 2018, so the Bank of Albania is expected to keep an accommodative monetary policy at least into the first half of 2017. Even though the monetary policy and the improved fi-nancing conditions were reflected in lending growth of 3% in Q2 2016, the high NPL level is holding back the rate of credit growth. The expected approval of the bankruptcy law in the final quarter of 2016 and other legal changes are ex-pected to push up lending activity in 2017.So far, the electoral calculations have intensified with potential scenarios for eventual new coalitions. With the current set-up, the governing coalition between the SP and LSI looks more likely to win again in the next elections. However, it is still not quite clear whether the LSI will continue to part icipate in the actual coali-tion. In that case, the math becomes more complex and the expected result can be quite close. A possible strong card in the hands of the government could be the opening of the negotiation process with the EU after the unanimous approval of the much-needed judiciary system reforms. However, this might not happen within this year, as the EU may not want to give either side an edge in the elec-tions and would also prefer to see some initial results of the implementation of reforms.
Financial analyst: Valbona Gjeka, Raiffeisen Bank Sh.a., Tirana

33Please note the risk notifi cations and explanations at the end of this document
Recession continuing, but BYN stable amid tightened policies
Belarus
-8
-4
0
4
8
-4
-2
0
2
4
2012
2013
2014
2015
2016
e
2017
f
2018
f
Real GDP (% yoy)Industrial output (% yoy, r.h.s.)
25
30
35
40
45
50
550.0
0.5
1.0
1.5
2.0
2.5
3.0
2012
2013
2014
2015
2016
e
2017
f
2018
fGeneral budget balance (% of GDP)Public debt (% of GDP, r.h.s.)
Real GDP (% yoy)
Source: Thomson Reuters, RBI/Raiffeisen RESEARCH
Budget balance and public debt
Source: Thomson Reuters, RBI/Raiffeisen RESEARCH
Forecast
Forecast
Key economic fi gures and forecasts
2012 2013 2014 2015 2016e 2017f 2018f
Nominal GDP (EUR bn) 49.4 54.9 57.2 49.1 42.7 44.8 47.0
Real GDP (% yoy) 1.7 1.0 1.7 -3.9 -3.0 0.0 1.5
Industrial output (% yoy) 5.8 -4.9 2.0 -6.6 0.0 1.5 2.0
Unemployment rate (avg, %) 0.5 0.5 0.5 1.0 1.5 2.0 2.0
Nominal industrial wages (% yoy) 93.8 35.2 20.1 7.6 8.0 10.0 10.0
Producer prices (avg, % yoy) 76.0 13.6 12.8 16.8 14.5 12.5 11.0
Consumer prices (avg, % yoy) 59.2 18.3 18.1 13.5 14.0 12.0 11.0
Consumer prices (eop, % yoy) 21.8 16.5 16.2 12.0 12.0 11.0 9.0
General budget balance (% of GDP) 0.5 0.2 1.0 1.8 0.5 0.0 0.0
Public debt (% of GDP) 31.3 32.5 34.1 48.5 49.9 46.4 45.0
Current account balance (% of GDP) -2.9 -10.0 -6.8 -3.8 -5.7 -5.7 -4.5
Official FX reserves (EUR bn) 6.1 4.8 4.2 3.8 2.6 2.8 2.8
Gross foreign debt (% of GDP) 51.9 51.8 52.6 70.2 76.0 74.4 73.0
EUR/BYN (avg) 1.07 1.18 1.36 1.77 2.25 2.40 2.58
USD/BYN (avg) 0.84 0.89 1.02 1.60 2.03 2.29 2.37
Source: Thomson Reuters, RBI/Raiffeisen RESEARCH
Falling exports and weak domestic demand are keeping the economy in reces-sion. GDP contracted by 2.7% over the first 7 months of 2016, industrial output is down by 2%, and capital investment plummet by more than 20%; retail sales dropped by 2%. We cut our GDP forecast from -2% to -3% yoy for the full year 2016. Moreover, we see now only 0% growth yoy in 2017 (instead of 1% yoy).The foreign trade surplus returned (USD 64 million for the first 7 months of 2016), but is substantially lower than a year ago. Trade results are still poor as exports have continued to fall (by 16% yoy for January–July 2016). The BYN exchange rate has fluctuated within a range of ±4% since the beginning of the summer, hav-ing appreciated from early July. The cumulated ytd loss in the BYN’s value came to around 8% vs. EUR, 5% vs. USD, and 18% vs. RUB. At the end of July, Belarus received the second USD 300 million tranche of the EFSD USD 2 billion loan. The country’s FX reserves were also well reinforced by the FX bond placement in the internal market, oil export duties, and FX purch ases by the national bank. While real wages fell by 5% yoy in July, households continued selling FX savings (USD 1.2 billion in the first 8 months of 2016 on a net basis). We forecast BYN depre-ciation of around 7% vs. EUR by the end of the year given the country’s rather high FX debt obligations. The rate cutting cycle continued as the national bank announced a further reduc-tion of the refi nancing rate to 18% as of 17 August 2016 (the fourth rate cut this year from an initial 25%). Inflation is on a downward trend with CPI around 12% yoy and deflation in August due to tight policies and a decline in external prices. We are therefore adjusting our infl ation forecast downwards slightly to 14% for 2016. In line with FX market liberalisation efforts, the regulator has curtailed the mandatory FX surrender rate from 30% to 20% this September and intends to cancel the FX surrender rule gradually from 2016 to 2020 and to revoke the ex-isting FX purchase limits for companies.
Financial analyst: Natalya Chernogorova, Priorbank Open Joint-Stock Company, Minsk
Falling exports and weak domestic demand perpetuating recessionary environment BYN fl uctuations minor amid prudent policies and EFSD support, high debt obligations still to weigh on BYN Slight trade surplus returns Rate cutting cycle continues as infl ation subsides
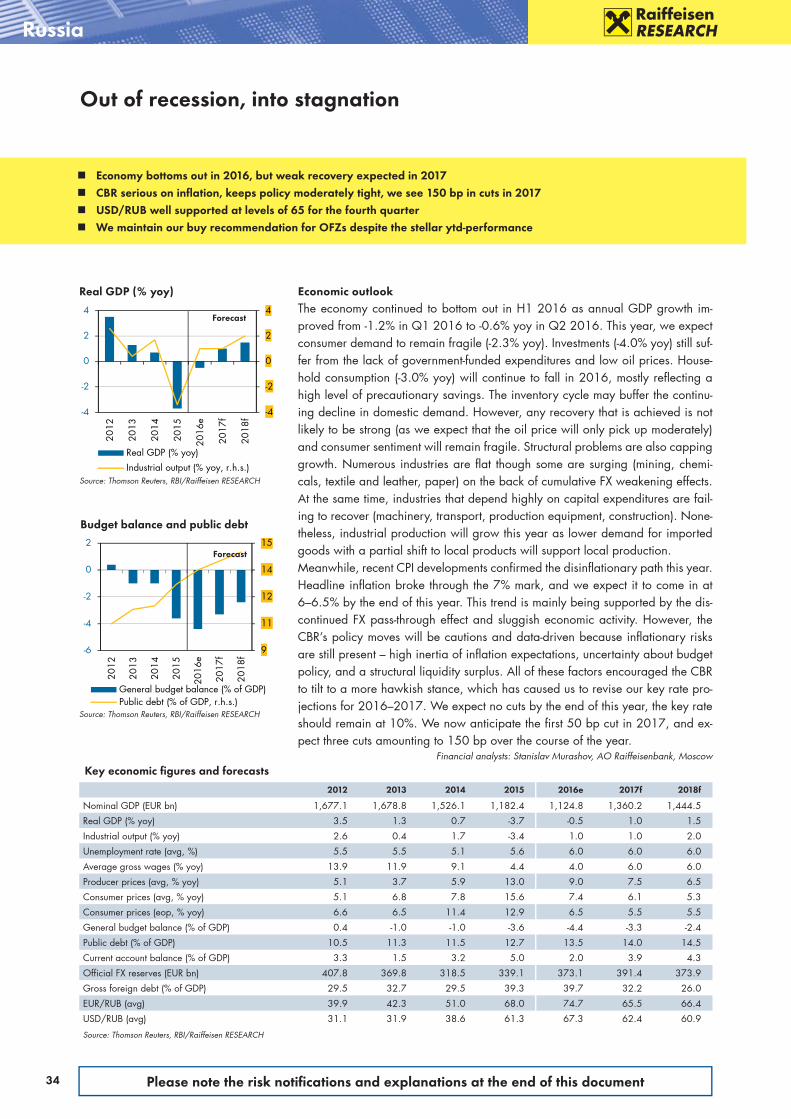
34 Please note the risk notifi cations and explanations at the end of this document
Russia
Real GDP (% yoy)
Source: Thomson Reuters, RBI/Raiffeisen RESEARCH
9
11
12
14
15
-6
-4
-2
0
2
2012
2013
2014
2015
2016
e
2017
f
2018
f
General budget balance (% of GDP)Public debt (% of GDP, r.h.s.)
Budget balance and public debt
Source: Thomson Reuters, RBI/Raiffeisen RESEARCH
Forecast
-4
-2
0
2
4
-4
-2
0
2
4
2012
2013
2014
2015
2016
e
2017
f
2018
f
Real GDP (% yoy)Industrial output (% yoy, r.h.s.)
Key economic fi gures and forecasts
2012 2013 2014 2015 2016e 2017f 2018f
Nominal GDP (EUR bn) 1,677.1 1,678.8 1,526.1 1,182.4 1,124.8 1,360.2 1,444.5
Real GDP (% yoy) 3.5 1.3 0.7 -3.7 -0.5 1.0 1.5
Industrial output (% yoy) 2.6 0.4 1.7 -3.4 1.0 1.0 2.0
Unemployment rate (avg, %) 5.5 5.5 5.1 5.6 6.0 6.0 6.0
Average gross wages (% yoy) 13.9 11.9 9.1 4.4 4.0 6.0 6.0
Producer prices (avg, % yoy) 5.1 3.7 5.9 13.0 9.0 7.5 6.5
Consumer prices (avg, % yoy) 5.1 6.8 7.8 15.6 7.4 6.1 5.3
Consumer prices (eop, % yoy) 6.6 6.5 11.4 12.9 6.5 5.5 5.5
General budget balance (% of GDP) 0.4 -1.0 -1.0 -3.6 -4.4 -3.3 -2.4
Public debt (% of GDP) 10.5 11.3 11.5 12.7 13.5 14.0 14.5
Current account balance (% of GDP) 3.3 1.5 3.2 5.0 2.0 3.9 4.3
Official FX reserves (EUR bn) 407.8 369.8 318.5 339.1 373.1 391.4 373.9
Gross foreign debt (% of GDP) 29.5 32.7 29.5 39.3 39.7 32.2 26.0
EUR/RUB (avg) 39.9 42.3 51.0 68.0 74.7 65.5 66.4
USD/RUB (avg) 31.1 31.9 38.6 61.3 67.3 62.4 60.9
Source: Thomson Reuters, RBI/Raiffeisen RESEARCH
Economic outlookThe economy continued to bottom out in H1 2016 as annual GDP growth im-proved from -1.2% in Q1 2016 to -0.6% yoy in Q2 2016. This year, we expect consumer demand to remain fragile (-2.3% yoy). Investments (-4.0% yoy) still suf-fer from the lack of government-funded expenditures and low oil prices. House-hold consumption (-3.0% yoy) will continue to fall in 2016, mostly reflecting a high level of precautionary savings. The inventory cycle may buffer the continu-ing decline in domestic demand. However, any recovery that is achieved is not likely to be strong (as we expect that the oil price will only pick up moderately) and consumer sentiment will remain fragile. Structural problems are also capping growth. Numerous industries are flat though some are surging (mining, chemi-cals, textile and leather, paper) on the back of cumulative FX weakening effects. At the same time, industries that depend highly on capital expenditures are fail-ing to recover (machinery, transport, production equipment, construction). None-theless, industrial production will grow this year as lower demand for imported goods with a partial shift to local products will support local production. Meanwhile, recent CPI developments confirmed the disinflationary path this year. Headline inflation broke through the 7% mark, and we expect it to come in at 6–6.5% by the end of this year. This trend is mainly being supported by the dis-continued FX pass-through effect and sluggish economic activity. However, the CBR’s policy moves will be cautions and data-driven because inflationary risks are still present – high inertia of inflation expectations, uncertainty about budget policy, and a structural liquidity surplus. All of these factors encouraged the CBR to tilt to a more hawkish stance, which has caused us to revise our key rate pro-jections for 2016–2017. We expect no cuts by the end of this year, the key rate should remain at 10%. We now anticipate the first 50 bp cut in 2017, and ex-pect three cuts amounting to 150 bp over the course of the year.
Financial analysts: Stanislav Murashov, AO Raiffeisenbank, Moscow
Out of recession, into stagnation
Economy bottoms out in 2016, but weak recovery expected in 2017 CBR serious on infl ation, keeps policy moderately tight, we see 150 bp in cuts in 2017 USD/RUB well supported at levels of 65 for the fourth quarter We maintain our buy recommendation for OFZs despite the stellar ytd-performance
Forecast

35Please note the risk notifi cations and explanations at the end of this document
8
9
10
11
12
13
14
15
Sep-14 Mar-15 Sep-15 Mar-16 Sep-16 Mar-17
10y RUB T-bond yield (%)
30
40
50
60
70
80
Sep-14 Mar-15 Sep-15 Mar-16 Sep-16 Mar-17
USD/RUB (eop)
Exchange rate development
USD/RUB: 5y high 84.24, 5y low 29.0Source: Thomson Reuters, RBI/Raiffeisen RESEARCH
RUB yield development (%)
10y RUB T-bond yield: 5y high 16.24, 5y low 6.44Source: Thomson Reuters, RBI/Raiffeisen RESEARCH
Russia
Exchange rate forecasts
21-Sep1 Dec-16 Mar-17 Jun-17 Sep-17
EUR/RUB 71.59 70.2 67.4 64.3 64.1
Cons. 71.9 70.6 69.8 71.0
USD/RUB 64.27 65.0 63.0 63.0 61.0
Cons. 65.0 64.5 64.0 64.01 5:00 p.m. (CEST)Source: Bloomberg, RBI/Raiffeisen RESEARCH
Interest rate forecasts (%)
21-Sep1 Dec-16 Mar-17 Jun-17 Sep-17
Key rate 10.00 10.00 9.50 9.00 8.50
Consensus 9.6 9.1 8.6 8.1
3 month2 10.56 10.80 10.10 9.60 9.10
n.v. n.v. n.v. n.v.1 5:00 p.m. (CEST) 2 Offered rateSource: Bloomberg, RBI/Raiffeisen RESEARCH
Yield forecasts (%)
21-Sep1 Dec-16 Mar-17 Jun-17 Sep-17
2y T-bond2 8.67 8.80 8.40 8.30 8.20
Consensus n.v. n.v. n.v. n.v.
10y T-bond2 8.17 8.20 7.90 7.70 7.80
Consensus n.v. n.v. n.v. n.v.1 5:00 p.m. (CEST) 2 Bid yieldSource: Bloomberg, RBI/Raiffeisen RESEARCH
Fore
cast
Financial market outlookDespite dividend payments in Q3 2016 and a shrinking current account balance in yoy-terms (from USD 50.2 bn for 8m 2015 to USD 14.6 bn for 8m 2016), USD/RUB demonstrated surprisingly low sensitivity to oil prices with a change of only USD 9 per bbl Brent translated to only RUB 4 in the exchange rate. We attribute this to external factors, as interest rates close to zero in the US and at zero in the EU are pushing investors to EM debt in the search for yields. This fac-tor was reflected in the BoP: In August, the private sector brought USD 1.1 bil-lion net into Russia. The dividends paid to non-residents were apparently rein-vested in the local market. Also, local banks decreased their FX liquidity cushion quite willingly in order to meet client demand for FX (this willingness is based on low rates abroad and the ability to get FX REPO from the CBR if needed). Thus, a visible deterioration of the current account (in yoy terms) is being compensated for by an inflow of speculative investments (seen in most GEMs) that is support-ing RUB. With the oil price at USD 47.3 per bbl, we feel that USD/RUB would be RUB 2 cheaper (at RUB 67 per USD) without this support. This situation could change in the event of a substantial oil price decline (to USD 35 per bbl) or a more aggressive Fed funds rate hike cycle (such a scenario is not priced in, and we do not expect it). RUB is likely to be supported by a seasonal improvement of the current account in Q4, all other things being equal (from USD -1.8 bn in Q3 to USD +4 bn, our estimate).In Q3, yields on 10y OFZs touched 7.9% YTM, which is 80 bp lower than in June 2016. The reasons behind such significant curve tightening were 1) a growing liquidity excess coming through the budget channel and spreading through the system, 2) high appetite from foreign investors and 3) only few issues by high-quality companies. Among other global EM government bonds, OFZs are of-fering one of the highest real yields (~300 bp for 3–5y and ~250 bp for 10y) which – given slowing CPI growth (tending to 6%+ by year end) – is creating some potential for further yield reductions. Such high real yields are being sup-ported by a relatively tight CBR monetary policy aimed at reaching the 4% CPI target by year-end 2017. Recent CBR depo actions revealed a liquidity glut at local banks (not only the major institutions) with the costs of funding well below the key rate. Given that the Ministry of Finance may reconsider upping the bor-rowing programme for Q4, we recommend buying OFZs on the belly. Neverthe-less, the still attractive carry shoul d compensate for the limited potential of price gains, so we maintain our “buy” recommendation for shorter- and longer-end OFZs as well. RUONIA-linked floaters also appear to be a good option for buy-ing into the market.
Financial analysts: Denis Poryvay, AO Raiffeisenbank, Moscow
Fore
cast

36 Please note the risk notifi cations and explanations at the end of this document
-14
-10
-6
-2
2
6
10
-12
-9
-6
-3
0
3
6
2012
2013
2014
2015
2016
e
2017
f
2018
f
Real GDP (% yoy)Industrial output (% yoy, r.h.s.)
20
32
44
56
68
80-5
-4
-3
-2
-1
0
2012
2013
2014
2015
2016
e
2017
f
2018
f
General budget balance (% of GDP)Public debt (% of GDP, r.h.s.)
Real GDP (% yoy)
Source: Thomson Reuters, RBI/Raiffeisen RESEARCH
Progress in the IMF programme with a stalled economy
Budget balance and public debt
Source: Thomson Reuters, RBI/Raiffeisen RESEARCH
Forecast
Forecast
Key economic fi gures and forecasts
2012 2013 2014 2015 2016e 2017f 2018f
Nominal GDP (EUR bn) 135.2 135.3 99.9 81.4 79.8 84.4 89.8
Real GDP (% yoy) 0.2 0.0 -6.6 -9.9 1.0 2.0 3.0
Industrial output (% yoy) -0.7 -4.3 -10.1 -13.0 2.0 4.0 4.0
Unemployment rate (avg, %) 8.2 7.8 9.7 9.5 9.0 9.0 8.5
Nominal industrial wages (% yoy) 14.8 7.9 6.0 20.5 14.6 15.0 10.0
Producer prices (avg, % yoy) 3.6 -0.1 17.1 36.0 17.4 12.4 6.9
Consumer prices (avg, % yoy) 0.6 -0.2 12.1 48.7 13.3 10.7 7.5
Consumer prices (eop, % yoy) -0.2 0.5 24.9 43.3 11.0 9.0 6.0
General budget balance (% of GDP) -3.8 -4.4 -4.9 -2.3 -3.5 -3.0 -2.5
Public debt (% of GDP) 37.1 40.7 52.9 72.6 77.5 78.4 73.0
Current account balance (% of GDP) -8.2 -9.2 -3.5 -0.1 -1.7 -2.8 -3.1
Official FX reserves (EUR bn) 18.6 14.8 6.2 12.2 14.8 17.1 16.5
Gross foreign debt (% of GDP) 76.5 79.3 95.2 131.5 135.4 137.7 125.7
EUR/UAH (avg) 10.4 10.8 15.9 24.3 28.8 30.8 32.0
USD/UAH (avg) 8.1 8.2 12.0 22.0 25.9 29.4 29.4
Source: Thomson Reuters, RBI/Raiffeisen RESEARCH
Political outlookUkraine’s economy is drifting on the back of slow reforms, a considerable de-lay in external financing, and a tense geopolitical situation. As a result, GDP in-creased by a modest 0.6% qoq in Q2 or by 1.3% yoy. On the one hand, indus-trial production and retail sales are quite poor. On the other, agriculture and con-struction performed well. Nevertheless, considering these factors, we decided to downgrade our GDP forecast from 1.5% yoy to 1% yoy for 2016 while our pro-jection for 2017 remained unchanged at +2% yoy. Seasonal effects and small supply shocks keep inflation at a relatively low level of 8.4% yoy in August. Moreover, the effect of the increase in tariffs was much smaller than we expected. However, given the low base effect and expected pressure on the FX market, we see inflation accelerating to 11% yoy by the end of 2016 (a lower level than pre-viously projected). Meanwhile, the deterioration of trade relations with the Rus-sian Federation, volatile global commodity prices, and still weak industrial pro-duction led to a current account deficit of USD 540 million from January to July. The financial account was maintained by FDI inflows (mainly artificial as they oc-curred due to the conversion of debt into authorised capital by foreign banks) and a significant decline in foreign currency outside the banking sector. As a re-sult, a surplus of USD 1 billion was posted for the financial account, and the bal-ance of payments surplus amounted to USD 500 million. Taking seasonal growth of energy imports into account, we expect the C/A deficit to grow further to USD 1.5 billion (or 1.7% of GDP).
Financial analysts: Sergii Drobot, Raiffeisen Bank Aval Public Joint Stock Company, Kiev
GDP expansion low given lack of clear growth drivers Infl ation dynamics surpassed our expectations Second IMF programme review successfully passed, linked fi nancing unlocked National bank keeps liberalising the market while UAH devaluation is expected
Ukraine

37Please note the risk notifi cations and explanations at the end of this document
0
2
4
6
8
10-10
-8
-6
-4
-2
0
2012
2013
2014
2015
2016
e
2017
f
2018
f
Current account (% of GDP)Net FDI (% of GDP, r.h.s.)
0
50
100
150
2012
2013
2014
2015
2016
e
2017
f
2018
f
Public debt (% of GDP)Gross foreign debt (% of GDP)
Current account and FDI infl ows
Source: State Statistics Committee of Ukraine, RBI/Raiffeisen RESEARCH
Public and external debt
Source: State Statistics Committee of Ukraine, RBI/Raiffeisen RESEARCH
Forecast
Ukraine
Exchange rate forecasts
21-Sep1 Dec-16 Mar-17 Jun-17 Sep-17
EUR/UAH 28.90 31.32 31.03 29.58 31.50
Cons. 30.45 30.31 30.11 30.36
USD/UAH 25.94 29.00 29.00 29.00 30.00
Cons. 27.00 28.00 28.50 28.501 5:00 p.m. (CEST)Source: Bloomberg, RBI/Raiffeisen RESEARCH
Financial market outlookOn 14 September, the IMF Executive Board finalised the second review under the EFF programme. The Board praised certain progress in reforms and economic stabilisation while noting that additional efforts should still be made in some ar-eas, specifically reforming the pension and tax systems and combatting corrup-tion. In the meantime, Ukraine received the second tranche worth USD 1 billion (cut from USD 1.7 billion) and the issue of US-guaranteed bonds worth USD 1 billion is now unlocked. Thus, gross international reserves (USD 14.1 billion at the end of August) may be replenished by about USD 2 billion in the near fu-ture, which will in turn increase confidence on the FX market (at least temporar-ily). Nevertheless, we expect hryvnia devaluation (controlled by the regulator via FX market measures) by the end of 2016 due to seasonal factors and a still weak economy.
The National Bank of Ukraine continued easing its monetary policy against the backdrop of favourable inflation dynamics. From July to September, the regula-tor cut the key policy rate by another 1.5 pp to 15% (or by 7 pp since the begin-ning of 2016). Considering the expected growth of pressure on the FX market and inflation acceleration, we think that this was the last cut this year. Liberalisa-tion has also touched certain restrictions on the FX market. Specifically, the daily limit for FCY cash withdrawals has been increased from UAH 100,000 to UAH 250,000 (equivalent). In addition, the National Bank has allowed domestic com-panies to buy foreign currency to repay loans from foreign investors even if their own FCY account is worth over USD 25,000. According to the regulator, these steps will not lead to the growth of FX market volatility.
Financial analysts: Sergii Drobot, Raiffeisen Bank Aval Public Joint Stock Company, Kiev
Fore
cast
-10
0
10
20
30
40
50
2012
2013
2014
2015
2016
e
2017
f
2018
f
Consumer prices (avg, % yoy)
Infl ation outlook
Source: State Statistics Committee of Ukraine, RBI/Raiffeisen RESEARCH
Forecast
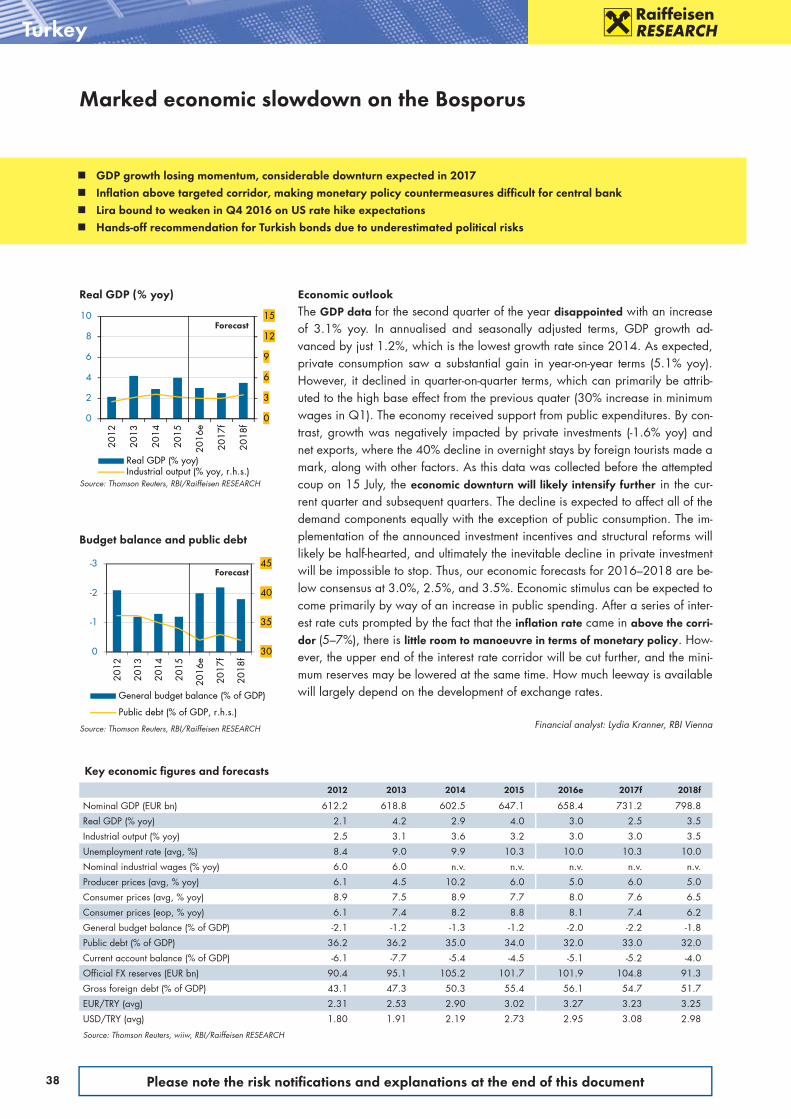
38 Please note the risk notifi cations and explanations at the end of this document
Turkey
30
35
40
45-3
-2
-1
0
2012
2013
2014
2015
2016
e
2017
f
2018
f
General budget balance (% of GDP)
Public debt (% of GDP, r.h.s.)
0
3
6
9
12
15
0
2
4
6
8
10
2012
2013
2014
2015
2016
e
2017
f
2018
f
Real GDP (% yoy)Industrial output (% yoy, r.h.s.)
Economic outlookThe GDP data for the second quarter of the year disappointed with an increase of 3.1% yoy. In annualised and seasonally adjusted terms, GDP growth ad-vanced by just 1.2%, which is the lowest growth rate since 2014. As expected, private consumption saw a substantial gain in year-on-year terms (5.1% yoy). However, it declined in quarter-on-quarter terms, which can primarily be attrib-uted to the high base effect from the previous quater (30% increase in minimum wages in Q1). The economy received support from public expenditures. By con-trast, growth was negatively impacted by private investments (-1.6% yoy) and net exports, where the 40% decline in overnight stays by foreign tourists made a mark, along with other factors. As this data was collected before the attempted coup on 15 July, the economic downturn will likely intensify further in the cur-rent quarter and subsequent quarters. The decline is expected to affect all of the demand components equally with the exception of public consumption. The im-plementation of the announced investment incentives and structural reforms will likely be half-hearted, and ultimately the inevitable decline in private investment will be impossible to stop. Thus, our economic forecasts for 2016–2018 are be-low consensus at 3.0%, 2.5%, and 3.5%. Economic stimulus can be expected to come primarily by way of an increase in public spending. After a series of inter-est rate cuts prompted by the fact that the infl ation rate came in above the corri-dor (5–7%), there is little room to manoeuvre in terms of monetary policy. How-ever, the upper end of the interest rate corridor will be cut further, and the mini-mum reserves may be lowered at the same time. How much leeway is available will largely depend on the development of exchange rates.
Financial analyst: Lydia Kranner, RBI Vienna
Forecast
Forecast
Key economic fi gures and forecasts
2012 2013 2014 2015 2016e 2017f 2018f
Nominal GDP (EUR bn) 612.2 618.8 602.5 647.1 658.4 731.2 798.8
Real GDP (% yoy) 2.1 4.2 2.9 4.0 3.0 2.5 3.5
Industrial output (% yoy) 2.5 3.1 3.6 3.2 3.0 3.0 3.5
Unemployment rate (avg, %) 8.4 9.0 9.9 10.3 10.0 10.3 10.0
Nominal industrial wages (% yoy) 6.0 6.0 n.v. n.v. n.v. n.v. n.v.
Producer prices (avg, % yoy) 6.1 4.5 10.2 6.0 5.0 6.0 5.0
Consumer prices (avg, % yoy) 8.9 7.5 8.9 7.7 8.0 7.6 6.5
Consumer prices (eop, % yoy) 6.1 7.4 8.2 8.8 8.1 7.4 6.2
General budget balance (% of GDP) -2.1 -1.2 -1.3 -1.2 -2.0 -2.2 -1.8
Public debt (% of GDP) 36.2 36.2 35.0 34.0 32.0 33.0 32.0
Current account balance (% of GDP) -6.1 -7.7 -5.4 -4.5 -5.1 -5.2 -4.0
Official FX reserves (EUR bn) 90.4 95.1 105.2 101.7 101.9 104.8 91.3
Gross foreign debt (% of GDP) 43.1 47.3 50.3 55.4 56.1 54.7 51.7
EUR/TRY (avg) 2.31 2.53 2.90 3.02 3.27 3.23 3.25
USD/TRY (avg) 1.80 1.91 2.19 2.73 2.95 3.08 2.98
Source: Thomson Reuters, wiiw, RBI/Raiffeisen RESEARCH
GDP growth losing momentum, considerable downturn expected in 2017 Infl ation above targeted corridor, making monetary policy countermeasures diffi cult for central bank Lira bound to weaken in Q4 2016 on US rate hike expectations Hands-off recommendation for Turkish bonds due to underestimated political risks
Source: Thomson Reuters, RBI/Raiffeisen RESEARCH
Real GDP (% yoy)
Source: Thomson Reuters, RBI/Raiffeisen RESEARCH
Budget balance and public debt
Marked economic slowdown on the Bosporus
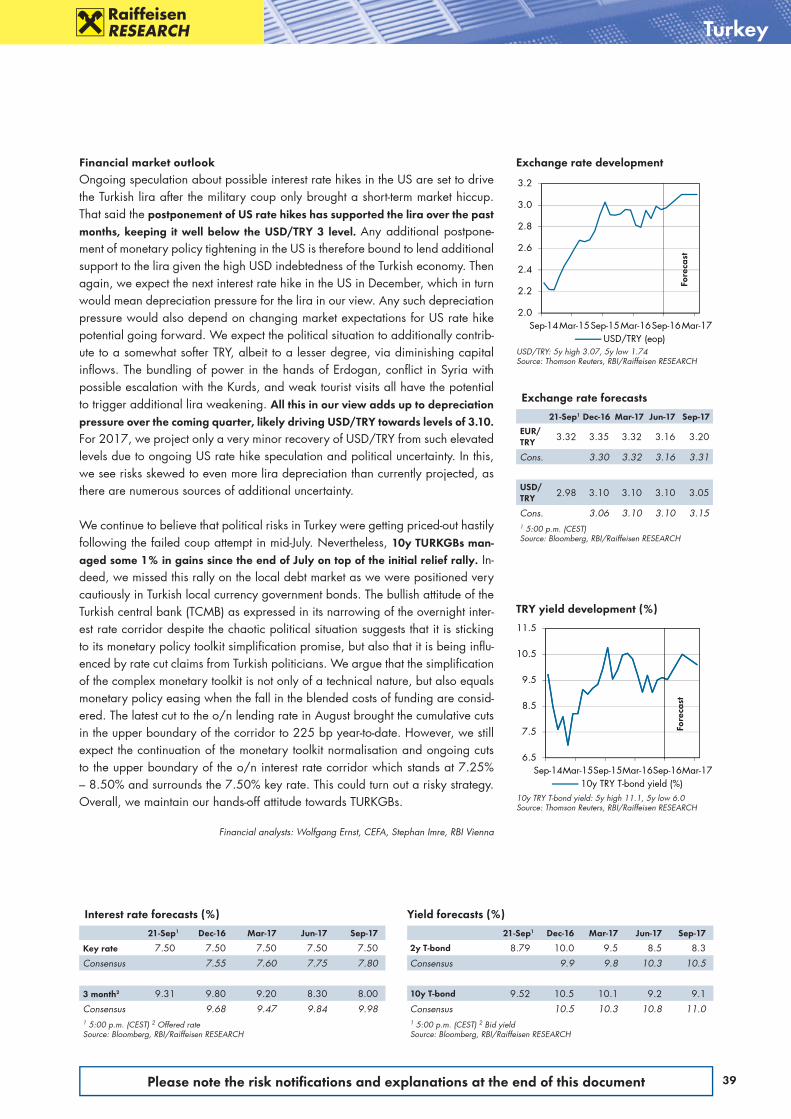
39Please note the risk notifi cations and explanations at the end of this document
2.0
2.2
2.4
2.6
2.8
3.0
3.2
Sep-14Mar-15Sep-15Mar-16Sep-16Mar-17USD/TRY (eop)
USD/TRY: 5y high 3.07, 5y low 1.74Source: Thomson Reuters, RBI/Raiffeisen RESEARCH
Exchange rate development
6.5
7.5
8.5
9.5
10.5
11.5
Sep-14Mar-15Sep-15Mar-16Sep-16Mar-1710y TRY T-bond yield (%)
10y TRY T-bond yield: 5y high 11.1, 5y low 6.0Source: Thomson Reuters, RBI/Raiffeisen RESEARCH
TRY yield development (%)
Turkey
Fore
cast
Exchange rate forecasts
21-Sep1 Dec-16 Mar-17 Jun-17 Sep-17
EUR/TRY 3.32 3.35 3.32 3.16 3.20
Cons. 3.30 3.32 3.16 3.31
USD/TRY 2.98 3.10 3.10 3.10 3.05
Cons. 3.06 3.10 3.10 3.151 5:00 p.m. (CEST)Source: Bloomberg, RBI/Raiffeisen RESEARCH
Interest rate forecasts (%)
21-Sep1 Dec-16 Mar-17 Jun-17 Sep-17
Key rate 7.50 7.50 7.50 7.50 7.50
Consensus 7.55 7.60 7.75 7.80
3 month2 9.31 9.80 9.20 8.30 8.00
Consensus 9.68 9.47 9.84 9.981 5:00 p.m. (CEST) 2 Offered rateSource: Bloomberg, RBI/Raiffeisen RESEARCH
Yield forecasts (%)
21-Sep1 Dec-16 Mar-17 Jun-17 Sep-17
2y T-bond 8.79 10.0 9.5 8.5 8.3
Consensus 9.9 9.8 10.3 10.5
10y T-bond 9.52 10.5 10.1 9.2 9.1
Consensus 10.5 10.3 10.8 11.01 5:00 p.m. (CEST) 2 Bid yieldSource: Bloomberg, RBI/Raiffeisen RESEARCH
Financial market outlookOngoing speculation about possible interest rate hikes in the US are set to drive the Turkish lira after the military coup only brought a short-term market hiccup. That said the postponement of US rate hikes has supported the lira over the past months, keeping it well below the USD/TRY 3 level. Any additional postpone-ment of monetary policy tightening in the US is therefore bound to lend additional support to the lira given the high USD indebtedness of the Turkish economy. Then again, we expect the next interest rate hike in the US in December, which in turn would mean depreciation pressure for the lira in our view. Any such depreciation pressure would also depend on changing market expectations for US rate hike potential going forward. We expect the political situation to additionally contrib-ute to a somewhat softer TRY, albeit to a lesser degree, via diminishing capital inflows. The bundling of power in the hands of Erdogan, conflict in Syria with possible escalation with the Kurds, and weak tourist visits all have the potential to trigger additional lira weakening. All this in our view adds up to depreciation pressure over the coming quarter, likely driving USD/TRY towards levels of 3.10. For 2017, we project only a very minor recovery of USD/TRY from such elevated levels due to ongoing US rate hike speculation and political uncertainty. In this, we see risks skewed to even more lira depreciation than currently projected, as there are numerous sources of additional uncertainty.
We continue to believe that political risks in Turkey were getting priced-out hastily following the failed coup attempt in mid-July. Nevertheless, 10y TURKGBs man-aged some 1% in gains since the end of July on top of the initial relief rally. In-deed, we missed this rally on the local debt market as we were positioned very cautiously in Turkish local currency government bonds. The bullish attitude of the Turkish central bank (TCMB) as expressed in its narrowing of the overnight inter-est rate corridor despite the chaotic political situation suggests that it is sticking to its monetary policy toolkit simplification promise, but also that it is being influ-enced by rate cut claims from Turkish politicians. We argue that the simplification of the complex moneta ry toolkit is not only of a technical nature, but also equals monetary policy easing when the fall in the blended costs of funding are consid-ered. The latest cut to the o/n lending rate in August brought the cumulative cuts in the upper boundary of the corridor to 225 bp year-to-date. However, we still expect the continuation of the monetary toolkit normalisation and ongoing cuts to the upper boundary of the o/n interest rate corridor which stands at 7.25% – 8.50% and surrounds the 7.50% key rate. This could turn out a risky strategy. Overall, we maintain our hands-off attitude towards TURKGBs.
Financial analysts: Wolfgang Ernst, CEFA, Stephan Imre, RBI Vienna
Fore
cast
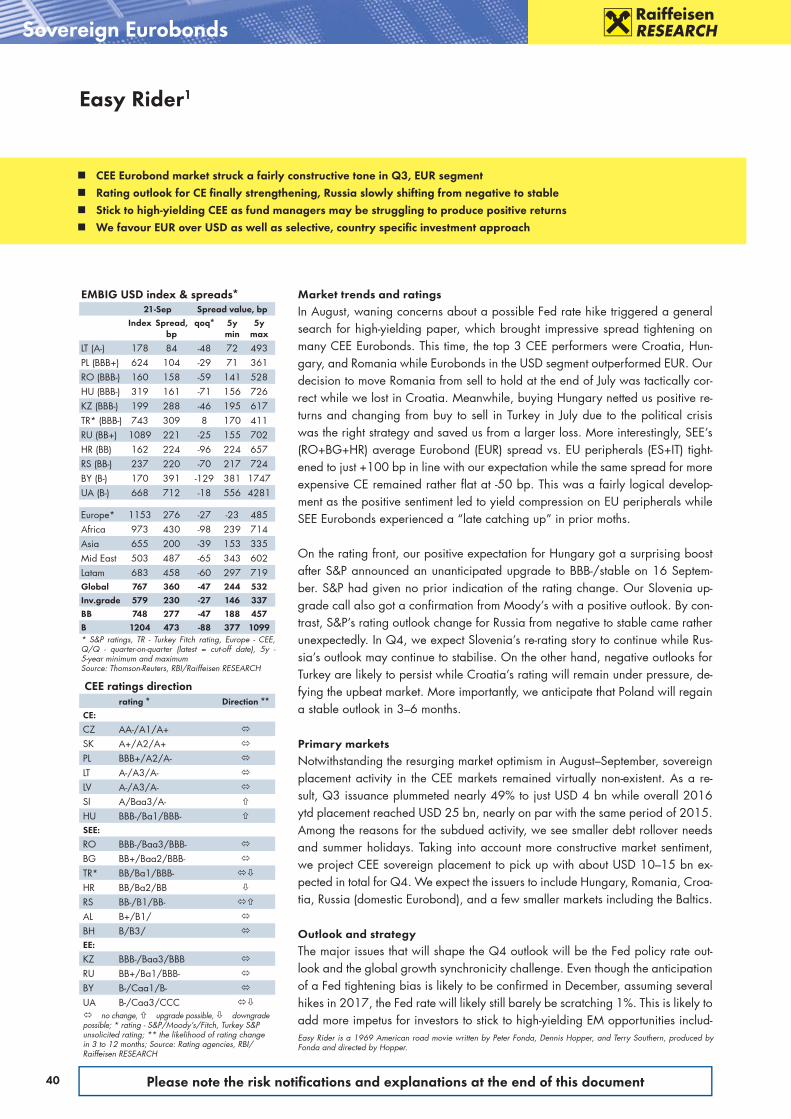
40 Please note the risk notifi cations and explanations at the end of this document
Sovereign Eurobonds
Market trends and ratingsIn August, waning concerns about a possible Fed rate hike triggered a general search for high-yielding paper, which brought impressive spread tightening on many CEE Eurobonds. This time, the top 3 CEE performers were Croatia, Hun-gary, and Romania while Eurobonds in the USD segment outperformed EUR. Our decision to move Romania from sell to hold at the end of July was tactically cor-rect while we lost in Croatia. Meanwhile, buying Hungary netted us positive re-turns and changing from buy to sell in Turkey in July due to the political crisis was the right strategy and saved us from a larger loss. More interestingly, SEE’s (RO+BG+HR) average Eurobond (EUR) spread vs. EU peripherals (ES+IT) tight-ened to just +100 bp in line with our expectation while the same spread for more expensive CE remained rather flat at -50 bp. This was a fairly logical develop-ment as the positive sentiment led to yield compression on EU peripherals while SEE Eurobonds experienced a “late catching up” in prior moths.
On the rating front, our positive expectation for Hungary got a surprising boost after S&P announced an unanticipated upgrade to BBB-/stable on 16 Septem-ber. S&P had given no prior indication of the rating change. Our Slovenia up-grade call also got a confirmation from Moody’s with a positive outlook. By con-trast, S&P’s rating outlook change for Russia from negative to stable came rather unexpectedly. In Q4, we expect Slovenia’s re-rating story to continue while Rus-sia’s outlook may continue to stabilise. On the other hand, negative outlooks for Turkey are likely to persist while Croatia’s rating will remain under pressure, de-fying the upbeat market. More importantly, we anticipate that Poland will regain a stable outlook in 3–6 months.
Primary marketsNotwithstanding the resurging market optimism in August–September, sovereign placement activity in the CEE markets remained virtually non-existent. As a re-sult, Q3 issuance plummeted nearly 49% to just USD 4 bn while overall 2016 ytd placement reached USD 25 bn, nearly on par with the same period of 2015. Among the reasons for the subdued activity, we see smaller debt rollover needs and summer holidays. Taking into account more constructive market sentiment, we project CEE sovereign placement to pick up with about USD 10–15 bn ex-pected in total for Q4. We expect the issuers to include Hungary, Romania, Croa-tia, Russia (domestic Eurobond), and a few smaller markets including the Baltics.
Outlook and strategyThe major issues that will shape the Q4 outlook will be the Fed policy rate out-look and the global growth synchronicity challenge. Even though the anticipation of a Fed tightening bias is likely to be confirmed in December, assuming several hikes in 2017, the Fed rate will likely still barely be scratching 1%. This is likely to add more impetus for investors to stick to high-yielding EM opportunities includ-
Easy Rider1
CEE Eurobond market struck a fairly constructive tone in Q3, EUR segment Rating outlook for CE fi nally strengthening, Russia slowly shifting from negative to stable Stick to high-yielding CEE as fund managers may be struggling to produce positive returns We favour EUR over USD as well as selective, country specifi c investment approach
EMBIG USD index & spreads*21-Sep Spread value, bp
Index Spread, bp
qoq* 5y min
5y max
LT (A-) 178 84 -48 72 493PL (BBB+) 624 104 -29 71 361RO (BBB-) 160 158 -59 141 528HU (BBB-) 319 161 -71 156 726KZ (BBB-) 199 288 -46 195 617TR* (BBB-) 743 309 8 170 411RU (BB+) 1089 221 -25 155 702HR (BB) 162 224 -96 224 657RS (BB-) 237 220 -70 217 724BY (B-) 170 391 -129 381 1747UA (B-) 668 712 -18 556 4281
Europe* 1153 276 -27 -23 485Africa 973 430 -98 239 714Asia 655 200 -39 153 335Mid East 503 487 -65 343 602Latam 683 458 -60 297 719Global 767 360 -47 244 532Inv.grade 579 230 -27 146 337BB 748 277 -47 188 457B 1204 473 -88 377 1099* S&P ratings, TR - Turkey Fitch rating, Europe - CEE, Q/Q - quarter-on-quarter (latest = cut-off date), 5y - 5-year minimum and maximumSource: Thomson-Reuters, RBI/Raiffeisen RESEARCH
CEE ratings directionrating * Direction **
CE:
CZ AA-/A1/A+
SK A+/A2/A+
PL BBB+/A2/A-
LT A-/A3/A-
LV A-/A3/A-
SI A/Baa3/A-
HU BBB-/Ba1/BBB-
SEE:
RO BBB-/Baa3/BBB-
BG BB+/Baa2/BBB-
TR* BB/Ba1/BBB-
HR BB/Ba2/BB
RS BB-/B1/BB-
AL B+/B1/
BH B/B3/
EE:
KZ BBB-/Baa3/BBB
RU BB+/Ba1/BBB-
BY B-/Caa1/B-
UA B-/Caa3/CCC
no change, upgrade possible, downgrade possible; * rating - S&P/Moody’s/Fitch, Turkey S&P unsolicited rating; ** the likelihood of rating change in 3 to 12 months; Source: Rating agencies, RBI/Raiffeisen RESEARCH
Easy Rider is a 1969 American road movie written by Peter Fonda, Dennis Hopper, and Terry Southern, produced by Fonda and directed by Hopper.

41Please note the risk notifi cations and explanations at the end of this document
Sovereign Eurobonds
1.0
2.0
3.0
4.0
3.0
5.3
7.5
9.8
Sep-11 May-13 Jan-15 Sep-16
EMBIG USD UST 10Y (r.h.scale)
CEE EMBIG vs. UST 10y yields, %*
* JPM EMBI Global index familySource: Thomson Reuters, Bloomberg, RBI/Raiffeisen RESEARCH
Benchmark Eurobond forecast and performance
Spread Range Spread Range Spread Range
Issue Rating Dur. 21-Sep Dec-16 min. max. Perf. (%)
Mar-17 min. max. Perf. (%)
Jun-17 min. max. Perf. (%)
LT 6.625% due 22 USD A- 4.6 85 80 76 83 0.2 85 82 88 0.4 89 86 92 0.2
LT 4.85% due 18 EUR A- 1.3 48 45 43 50 0.0 50 47 55 -0.1 53 51 58 -0.1
PL 3% due 23 USD BBB+ 5.9 73 70 68 74 0.2 75 74 79 0.4 80 78 84 0.1
PL 4.5% due 22 EUR BBB+ 4.8 55 50 48 54 0.2 55 53 59 0.1 58 56 62 -0.1
RO 4.375% due 23 USD BBB- 6.0 104 115 99 123 -0.7 125 109 133 -0.7 128 112 136 -0.9
RO 4.875% due 19 EUR BBB- 2.9 78 80 78 82 -0.1 85 83 86 -0.2 89 88 91 -0.3
HU 5.375% due 23 USD BBB- 5.5 113 105 100 108 0.4 112 106 114 0.6 116 111 119 0.3
HU 3.875% due 20 EUR BBB- 3.2 77 65 56 69 0.4 71 62 75 0.2 73 64 77 0.2
BG 2% due 22 EUR BB+ 5.2 179 160 147 173 1.0 175 162 188 -0.1 184 170 197 -0.5
TR 3.25% due 23* USD BBB- 5.8 237 250 240 298 -0.8 288 278 335 -2.4 315 306 363 -4.0
TR 5.125% due 20* EUR BBB- 3.3 276 300 283 316 -0.8 323 306 339 -1.6 339 321 354 -2.1
RU 4.5% due 22 USD BB+ 4.8 180 190 183 194 -0.5 201 194 205 -0.6 210 203 214 -1.0
HR 5.5% due 23 USD BB 5.4 197 210 205 219 -0.7 225 221 234 -1.0 238 234 247 -1.7
HR 3.875% due 22 EUR BB 5.1 288 270 257 334 0.9 317 304 382 -1.4 351 338 416 -3.2
RS 7.25% due 21 USD BB- 4.2 231 220 216 224 0.5 233 229 237 0.3 245 241 249 -0.2
BY 8.95% due 18 USD B- 1.2 418 440 425 448 -0.3 466 451 474 -0.5 487 471 494 -0.8
UA 7.75% due 27 USD B- 7.1 674 700 691 709 -1.9 740 731 749 -4.1 777 768 786 -6.7* USD bond spreads to UST notes, EUR bond spreads to German Bunds, Perf. as cumulative return of gross prices up to forecast horizon, countries sorted by S&P rating, Turkey - Fitch ratingSource: Bloomberg, S&P, Fitch, RBI/Raiffeisen RESEARCH
-200
-100
0
100
Sep-11 May-13 Jan-15 Sep-16
CE/SEE vs. EUP spread (bp)*
* spread in basis points between CE/SEE and EU Periph-eral (EUP) average 5y (duration adjusted) yields, CE/SEE - Czech, Hungary, Latvia, Lithuania, Poland, Roma-nia EUR Eurobonds, EUP - Italy + Spain average 5y yieldsSource: Bloomberg, RBI/Raiffeisen RESEARCH
ing CEE as fund managers will be struggling to produce positive returns. In this light, we remain fairly constructive on high-yielding SEE and, partially, EE, while we also see some selective cherry picking in CE. On the other hand, we are be-coming more sceptical about CEE value as compared with EU peripherals since CE and SEE spreads have tightened substantially in the recent past. Also, we fa-vour EUR over USD based on the fact that the relative underperformance of the former in the past may create more opportunities.
Based on our rating expectations, we like Slovenian USD Eurobonds as their gap is likely to continue to narrow on the back of strong fiscal and economic perfor-mance. From a technical standpoint, we find Poland’s Eurobonds to be relatively cheap on a 3m z-score basis while a possible change from a negative to stable outlook would favour PL as domestic policy risks are likely abating. Assuming more yield hunting ahead in Q4, we see more value in smaller SEE markets in-cluding Serbia and Bulgaria. In Serbia, further macro policy advances could be rewarded with rating upgrades while we see more long-term potential in Serbia (USD) comparing it with shorter-dated Turkey, despite the already tight spread. We also expect Bulgaria to demonstrate better catching up after missing perfor-mance in the past since better growth prospects and tighter fiscal management are garnering praise from rating agencies. Meanwhile, we see some relative value opportunity in Croatia as its EUR Eurobonds are carrying higher spreads than USD paper. In particular, at about minus 85bp the spread of HR USD Eu-robond vs. similar duration EUR would be 20-40bp rich so we recommend sell-ing HR USD Eurobond to buy EUR paper. We see fewer options in EE as Russia’s spread is already tight, which caps any upside from a possible rating outlook improvement. In Ukraine, uncertainty about reforms and economic management may prevent the IMF programme from going forward, so a higher spread on UA Eurobonds would be appropriate. Last but not least, we are moving Turkey from sell to hold on the back of the temporary stabilisation of domestic politics and rel-atively stable economy.
Financial analyst: Gintaras Shlizhyus, RBI Vienna
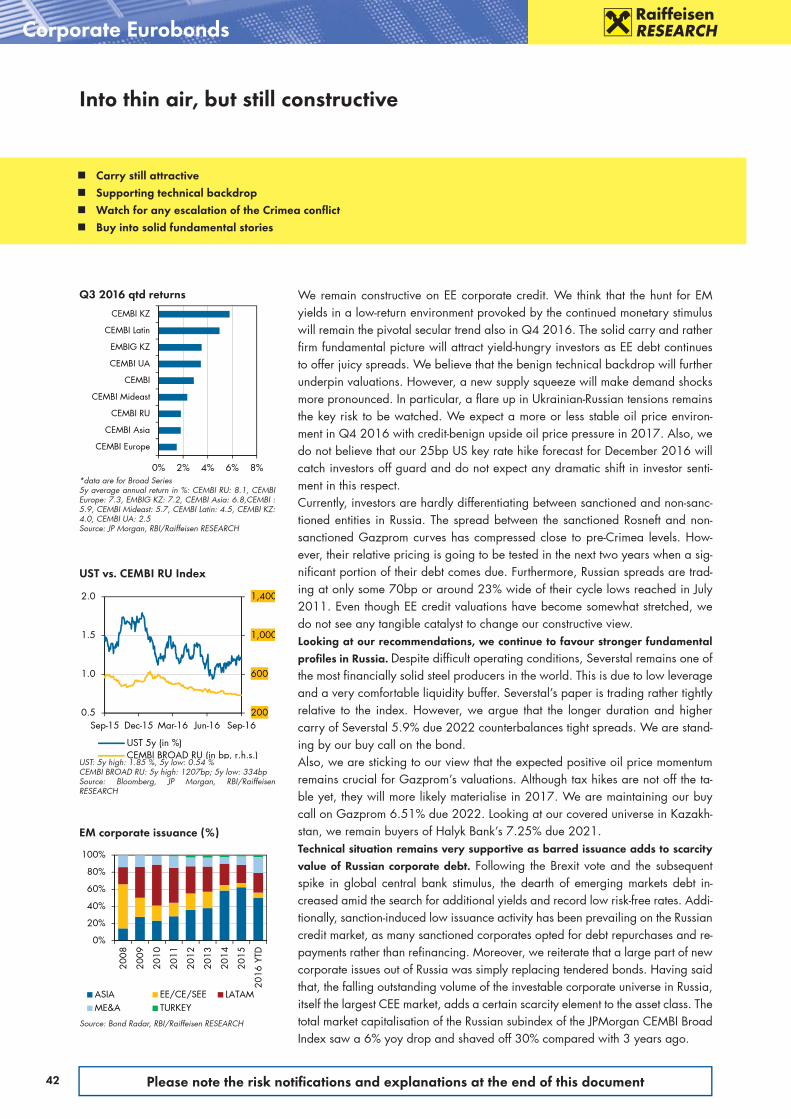
42 Please note the risk notifi cations and explanations at the end of this document
Corporate Eurobonds
0% 2% 4% 6% 8%
CEMBI Europe
CEMBI Asia
CEMBI RU
CEMBI Mideast
CEMBI
CEMBI UA
EMBIG KZ
CEMBI Latin
CEMBI KZ
Q3 2016 qtd returns
*data are for Broad Series 5y average annual return in %: CEMBI RU: 8.1, CEMBI Europe: 7.3, EMBIG KZ: 7.2, CEMBI Asia: 6.8,CEMBI : 5.9, CEMBI Mideast: 5.7, CEMBI Latin: 4.5, CEMBI KZ: 4.0, CEMBI UA: 2.5 Source: JP Morgan, RBI/Raiffeisen RESEARCH
We remain constructive on EE corporate credit. We think that the hunt for EM yields in a low-return environment provoked by the continued monetary stimulus will remain the pivotal secular trend also in Q4 2016. The solid carry and rather firm fundamental picture will attract yield-hungry investors as EE debt continues to offer juicy spreads. We believe that the benign technical backdrop will further underpin valuations. However, a new supply squeeze will make demand shocks more pronounced. In particular, a flare up in Ukrainian-Russian tensions remains the key risk to be watched. We expect a more or less stable oil price environ-ment in Q4 2016 with credit-benign upside oil price pressure in 2017. Also, we do not believe that our 25bp US key rate hike forecast for December 2016 will catch investors off guard and do not expect any dramatic shift in investor senti-ment in this respect.Currently, investors are hardly differentiating between sanctioned and non-sanc-tioned entities in Russia. The spread between the sanctioned Rosneft and non-sanctioned Gazprom curves has compressed close to pre-Crimea levels. How-ever, their relative pricing is going to be tested in the next two years when a sig-nificant portion of their debt comes due. Furthermore, Russian spreads are trad-ing at only some 70bp or around 23% wide of their cycle lows reached in July 2011. Even though EE credit valuations have become somewhat stretched, we do not see any tangible catalyst to change our constructive view.Looking at our recommendations, we continue to favour stronger fundamental profi les in Russia. Despite difficult operating conditions, Severstal remains one of the most financially solid steel producers in the world. This is due to low leverage and a very comfortable liquidity buffer. Severstal’s paper is trading rather tightly relative to the index. However, we argue that the longer duration and higher carry of Severstal 5.9% due 2022 counterbalances tight spreads. We are stand-ing by our buy call on the bond. Also, we are sticking to our view that the expected positive oil price momentum remains crucial for Gazprom’s valuations. Although tax hikes are not off the ta-ble yet, they will more likely materialise in 2017. We are maintaining our buy call on Gazprom 6.51% due 2022. Looking at our covered universe in Kazakh-stan, we remain buyers of Halyk Bank’s 7.25% due 2021.Technical situation remains very supportive as barred issuance adds to scarcity value of Russian corporate debt. Following the Brexit vote and the subsequent spike in global central bank stimulus, the dearth of emerging markets debt in-creased amid the search for additional yields and record low risk-free rates. Addi-tionally, sanction-induced low issuance activity has been prevailing on the Russian credit market, as many sanctioned corporates opted for debt repurchases and re-payments rather than refinancing. Moreover, we reiterate that a large part of new corporate issues out of Russia was simply replacing tendered bonds. Having said that, the falling outstanding volume of the investable corporate universe in Russia, itself the largest CEE market, adds a certain scarcity element to the asset class. The total market capitalisation of the Russian subindex of the JPMorgan CEMBI Broad Index saw a 6% yoy drop and shaved off 30% compared with 3 years ago.
Into thin air, but still constructive
Carry still attractive Supporting technical backdrop Watch for any escalation of the Crimea confl ict Buy into solid fundamental stories
0%
20%
40%
60%
80%
100%
2008
2009
2010
2011
2012
2013
2014
2015
2016
YTD
ASIA EE/CE/SEE LATAMME&A TURKEY
Source: Bond Radar, RBI/Raiffeisen RESEARCH
EM corporate issuance (%)
UST vs. CEMBI RU Index
UST: 5y high: 1.85 %, 5y low: 0.54 %CEMBI BROAD RU: 5y high: 1207bp; 5y low: 334bpSource: Bloomberg, JP Morgan, RBI/Raiffeisen RESEARCH
200
600
1,000
1,400
0.5
1.0
1.5
2.0
Sep-15 Dec-15 Mar-16 Jun-16 Sep-16
UST 5y (in %)CEMBI BROAD RU (in bp, r.h.s.)

43Please note the risk notifi cations and explanations at the end of this document
In addition, valuations are being supported by record fund inflows into the EM debt funds. These inflows totalled USD 14 bn in July according to EPFR Global data and Bloomberg.On the other hand, the new supply squeeze translates into higher sensitivity of spreads to demand swings. In particular, changes in the oil price, geopolitical events, and the possibility of another flare-up of Russian-Ukrainian skirmishes re-main the main risk factors. Corporate issuance in CEE outpaced that in the broader EM space yoy. Year-to-date primary market activity in the EM space has been less vigorous than in 2015. Global EM saw a 8% yoy drop in corporate issuance in the first nine months of 2016, to an equivalent of USD 192 bn. Looking at the geographical distribution, Asia remained the largest issuer market with a 50% market share, ahead of Latin America (23%), the Middle East and Africa (18%), CEE (6%), and Turkey (3%). The situation in the CEE remit was more benign compared with the wider EM picture. Despite decent pick-up yoy, issuance has not yet reached pre-crisis levels. Issuance in the CEE space stood at USD 11.3 bn in the first nine months of 2016 compared with USD 6.5 bn in the same period last year, for a 74% increase yoy. In Q3, ytd new issuance in CEE reached USD 3.3 bn (Q3 ytd 2015: USD 1.6 bn, +94% yoy), however it still lags behind pre-crises levels (Q3 2014: USD 3.5 bn). This year’s summer lull has apparently ended as Septem-ber saw a noteworthy pick-up in Russian deal flow. We are reiterating our view that unsanctioned entities have retained their market access and that the hunt for yields and eroding funding costs will spark more issuance going forward.Speaking of returns, EE credits displayed quite a mixed performance pattern.On the one hand, the best-performing market in the quarter-to-date has been Ka-zakh non-quasi sovereign corporates returning 5.8%, followed by Latin America (5.0%), both outperforming the EM benchmark index (2.9%) by a wide margin. On the other hand, Russia failed to shine returning a mere 1.8% and thus un-derperforming, Kazakh quasi-sovereign credits (3.5%), the Middle East (2.3%), and Asia (1.8%). The key performance contributors in the Kazakh non-quasi-sov-ereign segment were Halyk Bank and Zhaikmunai. We believe that the hunt for yields, focus on better quality credits, and a stabilisation of the KZT/USD ex-change rate after the depreciation/rebound wave in 2015–2016 were amongst the key performance drivers in Kazakhstan. Key reasons for the mediocre perfor-mance of Russian credits included the August escalation of the military tensions in Crimea after the alleged terrorist activities following the shootouts that presum-ably killed two Russian servicemen. Also, a falling oil price and rising US Treasury yields added a certain degree of negative pricing pressure. In the period under review, the oil price had quite a volatile downward trading pattern while US Treasury rates edged up by about 30bp in the most relevant 3–5y segment.The bottoming-out of US oil output, which was followed by OPEC production freeze speculations, has been behind the increase in oil price volatility qtd, which was in turn reflected in the weaker performance of Russian credits relative to other EM heavyweights. To recap, the Brent price plummeted to USD 40 and while the trend has reversed following the rebound back to 46, the performance of Russian credits was nega-tively affected in the process. Our oil analyst forecasts an average Brent price of USD 45 in Q4 2016, a slight decrease from the USD 47 forecast for Q3 2016. However, we count on positive price momentum in 2017, which remains a sup-porting factor for Russian credit valuations.
Financial analyst: Martin Kutny, CFA; RBI Vienna
200
600
1,000
1,400
1,800-180
-120
-60
0
60
Sep-09 Sep-11 Sep-13 Sep-15# upgrades - # downgrades
JP Morgan CEMBI BROAD RU (in bp,reverse order, r.h.s.)
CEMBI BROAD: 5y high: 571bp; 5y low: 296bpSource: Bloomberg, JP Morgan, RBI/Raiffeisen RESEARCH
Rating drift in Russia
0
100
200
300
400
500
2004
2005
2006
2007
2008
2009
2010
2011
2012
2013
2014
2015
2016
YTD
USD
bn
ASIA EE/CE/SEE LATAMME&A TURKEY
Source: Bond Radar, Bloomberg, RBI/Raiffeisen RESEARCH
EM corporate issuance
Selected EE Eurobonds
Issuer ISIN Maturity Yield in %
Evraz XS0618905219 27/04/18 3.8
Gazprom XS0708813810 23/01/21 3.9
Sberbank XS0799357354 28/06/19 3.0
Vimpel-Com
XS0587031096 02/02/21 4.7
Source: Bloomberg, RBI/Raiffeisen RESEARCH
Corporate Eurobonds
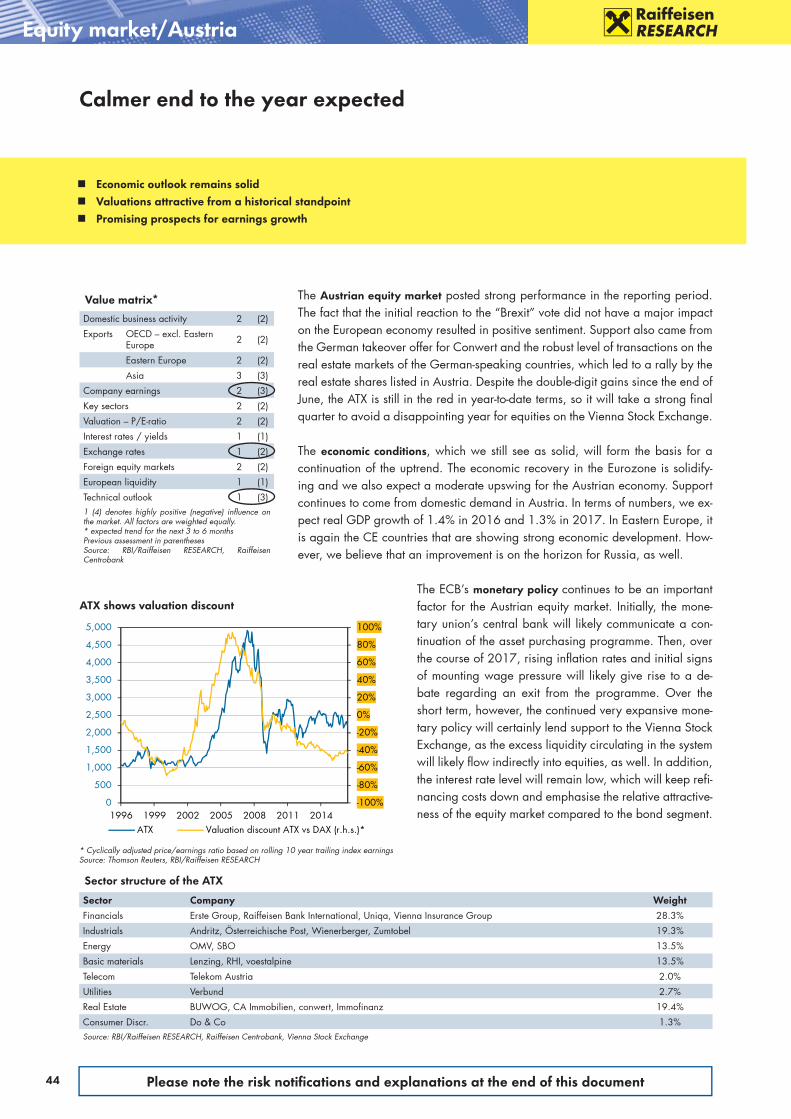
44 Please note the risk notifi cations and explanations at the end of this document
Value matrix*
Domestic business activity 2 (2)
Exports OECD – excl. Eastern Europe 2 (2)
Eastern Europe 2 (2)
Asia 3 (3)
Company earnings 2 (3)
Key sectors 2 (2)
Valuation – P/E-ratio 2 (2)
Interest rates / yields 1 (1)
Exchange rates 1 (2)
Foreign equity markets 2 (2)
European liquidity 1 (1)
Technical outlook 1 (3)1 (4) denotes highly positive (negative) influence on the market. All factors are weighted equally.* expected trend for the next 3 to 6 monthsPrevious assessment in parenthesesSource: RBI/Raiffeisen RESEARCH, Raiffeisen Centrobank
Equity market/Austria
Sector structure of the ATX
Sector Company WeightFinancials Erste Group, Raiffeisen Bank International, Uniqa, Vienna Insurance Group 28.3%
Industrials Andritz, Österreichische Post, Wienerberger, Zumtobel 19.3%
Energy OMV, SBO 13.5%
Basic materials Lenzing, RHI, voestalpine 13.5%
Telecom Telekom Austria 2.0%
Utilities Verbund 2.7%
Real Estate BUWOG, CA Immobilien, conwert, Immofinanz 19.4%
Consumer Discr. Do & Co 1.3%Source: RBI/Raiffeisen RESEARCH, Raiffeisen Centrobank, Vienna Stock Exchange
The Austrian equity market posted strong performance in the reporting period. The fact that the initial reaction to the “Brexit” vote did not have a major impact on the European economy resulted in positive sentiment. Support also came from the German takeover offer for Conwert and the robust level of transactions on the real estate markets of the German-speaking countries, which led to a rally by the real estate shares listed in Austria. Despite the double-digit gains since the end of June, the ATX is still in the red in year-to-date terms, so it will take a strong final quarter to avoid a disappointing year for equities on the Vienna Stock Exchange.
The economic conditions, which we still see as solid, will form the basis for a continuation of the uptrend. The economic recovery in the Eurozone is solidify-ing and we also expect a moderate upswing for the Austrian economy. Support continues to come from domestic demand in Austria. In terms of numbers, we ex-pect real GDP growth of 1.4% in 2016 and 1.3% in 2017. In Eastern Europe, it is again the CE countries that are showing strong economic development. How-ever, we believe that an improvement is on the horizon for Russia, as well.
The ECB’s monetary policy continues to be an important factor for the Austrian equity market. Initially, the mone-tary union’s central bank will likely communicate a con-tinuation of the asset purchasing programme. Then, over the course of 2017, rising inflation rates and initial signs of mounting wage pressure will likely give rise to a de-bate regarding an exit from the programme. Over the short term, however, the continued very expansive mone-tary policy will certainly lend support to the Vienna Stock Exchange, as the excess liquidity circulating in the system will likely flow indirectly into equities, as well. In addition, the interest rate level will remain low, which will keep refi-nancing costs down and emphasise the relative attractive-ness of the equity market compared to the bond segment.
Calmer end to the year expected
-100%
-80%
-60%
-40%
-20%
0%
20%
40%
60%
80%
100%
0
500
1,000
1,500
2,000
2,500
3,000
3,500
4,000
4,500
5,000
1996 1999 2002 2005 2008 2011 2014ATX Valuation discount ATX vs DAX (r.h.s.)*
ATX shows valuation discount
* Cyclically adjusted price/earnings ratio based on rolling 10 year trailing index earningsSource: Thomson Reuters, RBI/Raiffeisen RESEARCH
Economic outlook remains solid Valuations attractive from a historical standpoint Promising prospects for earnings growth
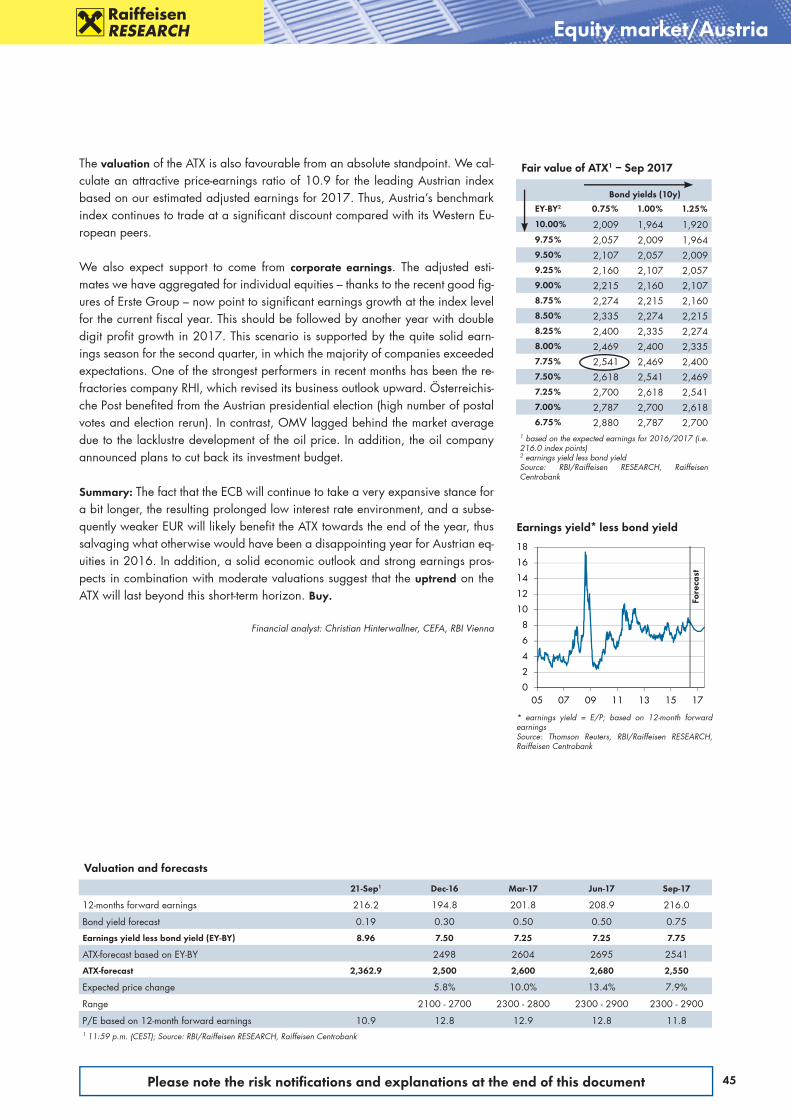
45Please note the risk notifi cations and explanations at the end of this document
Fair value of ATX1 – Sep 2017
Bond yields (10y)
EY-BY2 0.75% 1.00% 1.25%
10.00% 2,009 1,964 1,9209.75% 2,057 2,009 1,9649.50% 2,107 2,057 2,0099.25% 2,160 2,107 2,0579.00% 2,215 2,160 2,1078.75% 2,274 2,215 2,1608.50% 2,335 2,274 2,2158.25% 2,400 2,335 2,2748.00% 2,469 2,400 2,3357.75% 2,541 2,469 2,4007.50% 2,618 2,541 2,4697.25% 2,700 2,618 2,5417.00% 2,787 2,700 2,6186.75% 2,880 2,787 2,700
1 based on the expected earnings for 2016/2017 (i.e. 216.0 index points)2 earnings yield less bond yieldSource: RBI/Raiffeisen RESEARCH, Raiffeisen Centrobank
Valuation and forecasts
21-Sep1 Dec-16 Mar-17 Jun-17 Sep-17
12-months forward earnings 216.2 194.8 201.8 208.9 216.0
Bond yield forecast 0.19 0.30 0.50 0.50 0.75
Earnings yield less bond yield (EY-BY) 8.96 7.50 7.25 7.25 7.75
ATX-forecast based on EY-BY 2498 2604 2695 2541
ATX-forecast 2,362.9 2,500 2,600 2,680 2,550
Expected price change 5.8% 10.0% 13.4% 7.9%
Range 2100 - 2700 2300 - 2800 2300 - 2900 2300 - 2900
P/E based on 12-month forward earnings 10.9 12.8 12.9 12.8 11.81 11:59 p.m. (CEST); Source: RBI/Raiffeisen RESEARCH, Raiffeisen Centrobank
Earnings yield* less bond yield
* earnings yield = E/P; based on 12-month forward earningsSource: Thomson Reuters, RBI/Raiffeisen RESEARCH, Raiffeisen Centrobank
0
2
4
6
8
10
12
14
16
18
05 07 09 11 13 15 17Fo
reca
st
Equity market/Austria
The valuation of the ATX is also favourable from an absolute standpoint. We cal-culate an attractive price-earnings ratio of 10.9 for the leading Austrian index based on our estimated adjusted earnings for 2017. Thus, Austria’s benchmark index continues to trade at a significant discount compared with its Western Eu-ropean peers.
We also expect support to come from corporate earnings. The adjusted esti-mates we have aggregated for individual equities – thanks to the recent good fig-ures of Erste Group – now point to significant earnings growth at the index level for the current fiscal year. This should be followed by another year with double digit profit growth in 2017. This scenario is supported by the quite solid earn-ings season for the second quarter, in which the majority of companies exceeded expectations. One of the strongest performers in recent months has been the re-fractories company RHI, which revised its business outlook upward. Österreichis-che Post benefited from the Austrian presidential election (high number of postal votes and election rerun). In contrast, OMV lagged behind the market average due to the lacklustre development of the oil price. In addition, the oil company announced plans to cut back its investment budget.
Summary: The fact that the ECB will continue to take a very expansive stance for a bit longer, the resulting prolonged low interest rate environment, and a subse-quently weaker EUR will likely benefit the ATX towards the end of the year, thus salvaging what otherwise would have been a disappointing year for Austrian eq-uities in 2016. In addition, a solid economic outlook and strong earnings pros-pects in combination with moderate valuations suggest that the uptrend on the ATX will last beyond this short-term horizon. Buy.
Financial analyst: Christian Hinterwallner, CEFA, RBI Vienna
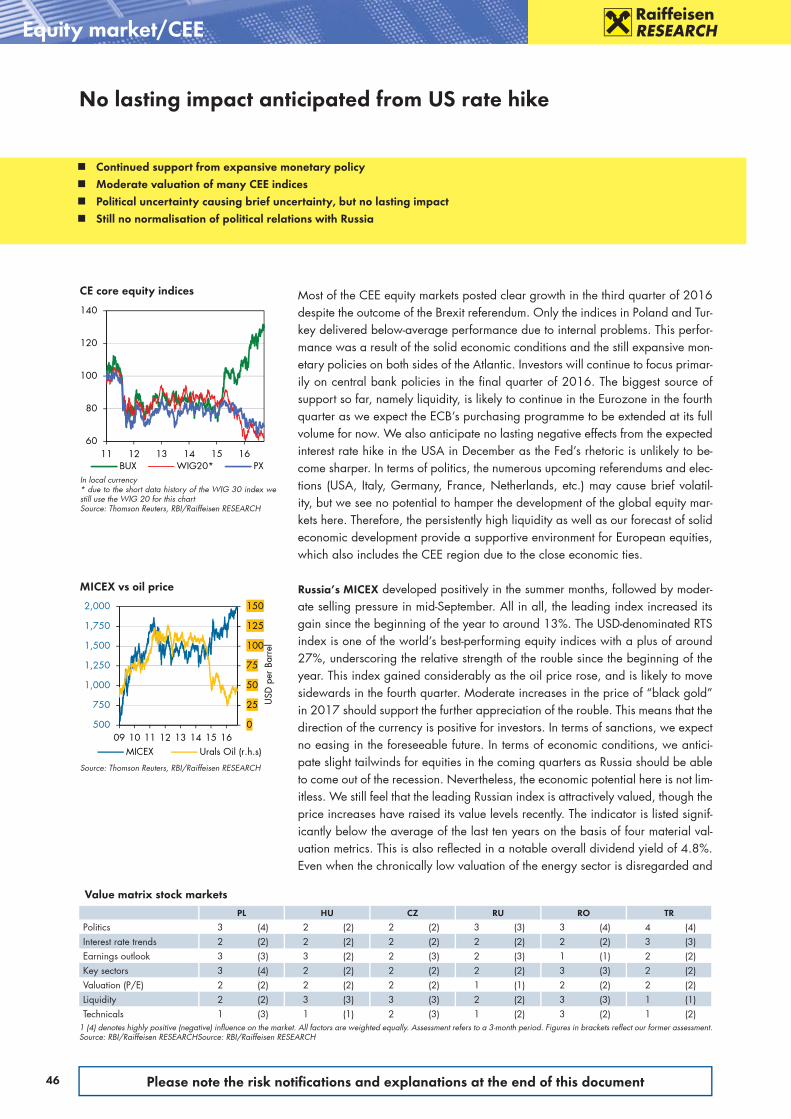
46 Please note the risk notifi cations and explanations at the end of this document
0
25
50
75
100
125
150
500
750
1,000
1,250
1,500
1,750
2,000
09 10 11 12 13 14 15 16
USD
per
Bar
rel
MICEX Urals Oil (r.h.s)
MICEX vs oil price
Source: Thomson Reuters, RBI/Raiffeisen RESEARCH
Equity market/CEE
Most of the CEE equity markets posted clear growth in the third quarter of 2016 despite the outcome of the Brexit referendum. Only the indices in Poland and Tur-key delivered below-average performance due to internal problems. This perfor-mance was a result of the solid economic conditions and the still expansive mon-etary policies on both sides of the Atlantic. Investors will continue to focus primar-ily on central bank policies in the final quarter of 2016. The biggest source of support so far, namely liquidity, is likely to continue in the Eurozone in the fourth quarter as we expect the ECB’s purchasing programme to be extended at its full volume for now. We also anticipate no lasting negative effects from the expected interest rate hike in the USA in December as the Fed’s rhetoric is unlikely to be-come sharper. In terms of politics, the numerous upcoming referendums and elec-tions (USA, Italy, Germany, France, Netherlands, etc.) may cause brief volatil-ity, but we see no potential to hamper the development of the global equity mar-kets here. Therefore, the persistently high liquidity as well as our forecast of solid economic development provide a supportive environment for European equities, which also includes the CEE region due to the close economic ties.
Russia’s MICEX developed positively in the summer months, followed by moder-ate selling pressure in mid-September. All in all, the leading index increased its gain since the beginning of the year to around 13%. The USD-denominated RTS index is one of the world’s best-performing equity indices with a plus of around 27%, underscoring the relative strength of the rouble since the beginning of the year. This index gained considerably as the oil price rose, and is likely to move sidewards in the fourth quarter. Moderate increases in the price of “black gold” in 2017 should support the further appreciation of the rouble. This means that the direction of the currency is positive for investors. In terms of sanctions, we expect no easing in the foreseeable future. In terms of economic conditions, we antici-pate slight tailwinds for equities in the coming quarters as Russia should be able to come out of the recession. Nevertheless, the economic potential here is not lim-itless. We still feel that the leading Russian index is attractively valued, though the price increases have raised its value levels recently. The indicator is listed signif-icantly below the average of the last ten years on the basis of four material val-uation metrics. This is also reflected in a notable overall dividend yield of 4.8%. Even when the chronically low valuation of the energy sector is disregarded and
No lasting impact anticipated from US rate hike
Value matrix stock markets
PL HU CZ RU RO TR
Politics 3 (4) 2 (2) 2 (2) 3 (3) 3 (4) 4 (4)Interest rate trends 2 (2) 2 (2) 2 (2) 2 (2) 2 (2) 3 (3)Earnings outlook 3 (3) 3 (2) 2 (3) 2 (3) 1 (1) 2 (2)Key sectors 3 (4) 2 (2) 2 (2) 2 (2) 3 (3) 2 (2)Valuation (P/E) 2 (2) 2 (2) 2 (2) 1 (1) 2 (2) 2 (2)Liquidity 2 (2) 3 (3) 3 (3) 2 (2) 3 (3) 1 (1)Technicals 1 (3) 1 (1) 2 (3) 1 (2) 3 (2) 1 (2)
1 (4) denotes highly positive (negative) influence on the market. All factors are weighted equally. Assessment refers to a 3-month period. Figures in brackets reflect our former assessment.Source: RBI/Raiffeisen RESEARCHSource: RBI/Raiffeisen RESEARCH
Continued support from expansive monetary policy Moderate valuation of many CEE indices Political uncertainty causing brief uncertainty, but no lasting impact Still no normalisation of political relations with Russia
60
80
100
120
140
11 12 13 14 15 16BUX WIG20* PX
In local currency* due to the short data history of the WIG 30 index we still use the WIG 20 for this chartSource: Thomson Reuters, RBI/Raiffeisen RESEARCH
CE core equity indices

47Please note the risk notifi cations and explanations at the end of this document
a justified political risk premium is applied, the market seems to be cheap. The consensus expectations for earnings growth in 2017 and 2018, both of which are well into double-digit territory, also make us optimistic. All in all, we see up-side potential for the MICEX in Q4 and one year out. Buy.
The Polish equity index WIG 30 grew in the third quarter of 2016 but is still trail-ing its CEE peers. This is not due to the country’s solid economic performance (expected GDP growth in 2016: 3.3% and 2017f: 3.7%), but due to the contin-ued political uncertainty. Even though the current proposal for the “CHF fix” pro-gramme is softer than expected and now aims at a “voluntary” and delayed con-version variant instead of the feared mandatory conversion, the details are still a source of uncertainty. The “voluntary” component is to be based on managed in-centives, and foreign currency loans will have to be backed by substantially more capital in future. This is intended to motivate the banks to offer their customers at-tractive terms for converting their loans. Because of the regulatory pressure, the uncertainties in the banking sector have not diminished, and the banks are likely to begin forming the necessary reserves when the law is passed as opposed to waiting until it comes into force. Aside from the CHF issue, the EU Commission has blocked the progressive retail tax that was introduced on 1 September for the time being. Because of the benefits it provides to small and medium-sized busi-nesses, a review is to clarify whether it represents a government subvention that is prohibited under EU law. In fundamental terms, earnings should grow by around
Indices in performance comparison
2007 2008 2009 2010 2011 2012 2013 2014 2015 21-Sep-161
ATX 1.1% -61.2% 42.5% 16.4% -34.9% 26.9% 6.1% -15.2% 11.0% -1.4%
BUX 5.6% -53.3% 73.4% 0.5% -20.4% 7.1% 2.2% -10.4% 43.8% 18.1%WIG 20** 5.2% -48.2% 33.5% 14.9% -21.9% 20.4% -7.0% -3.5% -19.7% -5.4%
PX 14.2% -52.7% 30.2% 9.6% -25.6% 14.0% -4.8% -4.3% 1.0% -9.6%
MICEX 11.5% -67.2% 121.1% 23.2% -16.9% 5.2% 2.0% -7.1% 26.1% 13.4%
BET 22.1% -70.5% 61.7% 12.3% -17.7% 18.7% 26.1% 9.1% -1.1% 0.5%
BIST Nat. 100 42.0% -51.6% 96.6% 24.9% -22.3% 52.6% -13.3% 26.4% -16.3% 8.6%
CECE Composite Index 10.5% -53.7% 40.5% 15.7% -29.1% 25.7% -9.6% -6.0% -12.4% -2.7%
DAX 22.3% -40.4% 23.8% 16.1% -14.7% 29.1% 25.5% 2.7% 9.6% -2.9%
Euro Stoxx 50 6.8% -44.4% 21.1% -5.8% -17.1% 13.8% 17.9% 1.2% 3.8% -8.7%
S&P 500 3.5% -38.5% 23.5% 12.8% 0.0% 13.4% 29.6% 11.4% -0.7% 5.8%
MSCI World 2.8% -40.1% 22.8% 7.8% -7.6% 13.1% 26.3% 7.7% 0.2% 1.2%In local currency1 11:59 p.m. (CEST)2 Due to the short data history of the WIG 30 index we still use the WIG 20Source: Bloomberg, Thomson Reuters, RBI/Raiffeisen RESEARCH
Stock market indicators
Earnings growth Price/earnings ratio Dividend yield15 16e 17f 15 16e 17f 16e
ATX 44.3% 16.2% 15.1% 14.4 12.6 10.9 3.0%
WIG 30 -56.5% 285.4% 5.1% 47.7 12.4 11.8 3.6%
BUX n.a. n.a. 5.2% n.a. 11.6 11.0 2.7%
PX n.a. 1.9% 11.2% 19.8 12.3 11.1 5.7%
MICEX 17.2% 8.5% 12.5% 8.1 6.5 5.7 4.8%
BET* -43.1% -35.2% 12.4% 10.7 11.4 10.1 4.6%
BIST Nat. 100 -10.3% 1.4% 17.8% 9.3 9.7 8.3 3.1%* Romania (BET) excl. Fondul ProprietateaSource: Thomson Reuters, IBES, Bloomberg, RBI/Raiffeisen RESEARCH
Expected index performance
Source: RBI/Raiffeisen RESEARCH
-4%-2%0%2%4%6%8%
10%
ATX
MIC
EX
WIG
30
BUX PX BET
BIST
Nat
. 100
Dec.16 Sep.17
Equity market/CEE
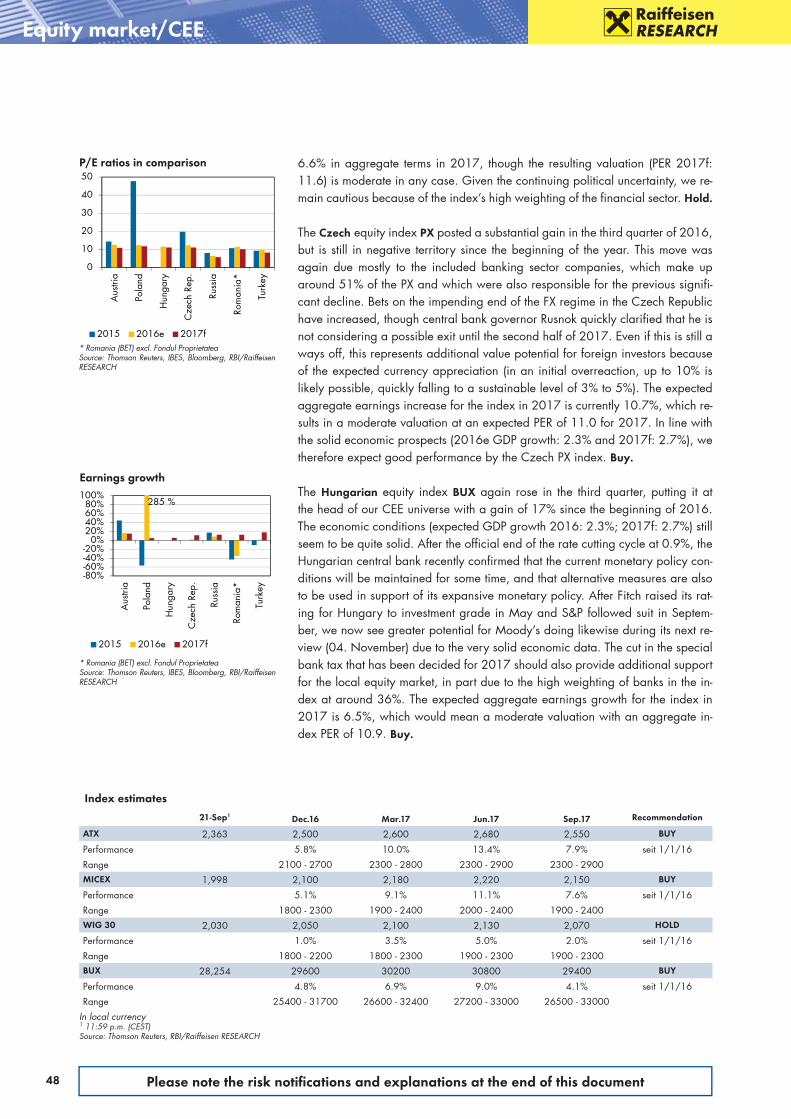
48 Please note the risk notifi cations and explanations at the end of this document
Equity market/CEE
6.6% in aggregate terms in 2017, though the resulting valuation (PER 2017f: 11.6) is moderate in any case. Given the continuing political uncertainty, we re-main cautious because of the index’s high weighting of the financial sector. Hold.
The Czech equity index PX posted a substantial gain in the third quarter of 2016, but is still in negative territory since the beginning of the year. This move was again due mostly to the included banking sector companies, which make up around 51% of the PX and which were also responsible for the previous signifi-cant decline. Bets on the impending end of the FX regime in the Czech Republic have increased, though central bank governor Rusnok quickly clarified that he is not considering a possible exit until the second half of 2017. Even if this is still a ways off, this represents additional value potential for foreign investors because of the expected currency appreciation (in an initial overreaction, up to 10% is likely possible, quickly falling to a sustainable level of 3% to 5%). The expected aggregate earnings increase for the index in 2017 is currently 10.7%, which re-sults in a moderate valuation at an expected PER of 11.0 for 2017. In line with the solid economic prospects (2016e GDP growth: 2.3% and 2017f: 2.7%), we therefore expect good performance by the Czech PX index. Buy.
The Hungarian equity index BUX again rose in the third quarter, putting it at the head of our CEE universe with a gain of 17% since the beginning of 2016. The economic conditions (expected GDP growth 2016: 2.3%; 2017f: 2.7%) still seem to be quite solid. After the official end of the rate cutting cycle at 0.9%, the Hungarian central bank recently confirmed that the current monetary policy con-ditions will be maintained for some time, and that alternative measures are also to be used in support of its expansive monetary policy. After Fitch raised its rat-ing for Hungary to investment grade in May and S&P followed suit in Septem-ber, we now see greater potential for Moody’s doing likewise during its next re-view (04. November) due to the very solid economic data. The cut in the special bank tax that has been decided for 2017 should also provide additional support for the local equity market, in part due to the high weighting of banks in the in-dex at around 36%. The expected aggregate earnings growth for the index in 2017 is 6.5%, which would mean a moderate valuation with an aggregate in-dex PER of 10.9. Buy.
Index estimates
21-Sep1 Dec.16 Mar.17 Jun.17 Sep.17 Recommendation
ATX 2,363 2,500 2,600 2,680 2,550 BUY
Performance 5.8% 10.0% 13.4% 7.9% seit 1/1/16
Range 2100 - 2700 2300 - 2800 2300 - 2900 2300 - 2900MICEX 1,998 2,100 2,180 2,220 2,150 BUY
Performance 5.1% 9.1% 11.1% 7.6% seit 1/1/16
Range 1800 - 2300 1900 - 2400 2000 - 2400 1900 - 2400WIG 30 2,030 2,050 2,100 2,130 2,070 HOLD
Performance 1.0% 3.5% 5.0% 2.0% seit 1/1/16
Range 1800 - 2200 1800 - 2300 1900 - 2300 1900 - 2300BUX 28,254 29600 30200 30800 29400 BUY
Performance 4.8% 6.9% 9.0% 4.1% seit 1/1/16
Range 25400 - 31700 26600 - 32400 27200 - 33000 26500 - 33000In local currency1 11:59 p.m. (CEST)Source: Thomson Reuters, RBI/Raiffeisen RESEARCH
0
10
20
30
40
50
Aus
tria
Pola
nd
Hun
gary
Cze
ch R
ep.
Russ
ia
Rom
ania
*
Turk
ey
2015 2016e 2017f
P/E ratios in comparison
* Romania (BET) excl. Fondul ProprietateaSource: Thomson Reuters, IBES, Bloomberg, RBI/Raiffeisen RESEARCH
-80%-60%-40%-20%
0%20%40%60%80%
100%
Aus
tria
Pola
nd
Hun
gary
Cze
ch R
ep.
Russ
ia
Rom
ania
*
Turk
ey
2015 2016e 2017f
285 %
Earnings growth
* Romania (BET) excl. Fondul ProprietateaSource: Thomson Reuters, IBES, Bloomberg, RBI/Raiffeisen RESEARCH

49Please note the risk notifi cations and explanations at the end of this document
0
100
200
300
400
Turk
ey
Russ
ia
Pola
nd
Aus
tria
Hun
gary
Cze
ch R
ep.
Rom
ania
Cro
atia
2015 End of August 2016
0,44
bn
0,51
bn
1,26
bn
1,35
bn
04080
120160200240280
Russ
ia
Turk
ey
Pola
nd
Aus
tria
Cze
ch R
ep.
Rom
ania
Hun
gary
453.
6
Market capitalisation overview
In EUR bn; cut.off date: 21 September 2016Source: FESE, WFE, ZSE, RBI/Raiffeisen RESEARCH
Avg. daily turnover (EUR mn)
Source: FESE, WFE, ZSE, RBI/Raiffeisen RESEARCH
Index estimates
21-Sep1 Dec.16 Mar.17 Jun.17 Sep.17 Recommendation
PX 865 910 930 950 920 BUY
Performance 5.2% 7.5% 9.9% 6.4% seit 1/1/16
Range 800 - 1000 800 - 1000 800 - 1100 800 - 1100BET 7,036 7,160 7,270 7,470 7,320 HOLD
Performance 1.8% 3.3% 6.2% 4.0% seit 1/1/16
Range 6300 - 7700 6400 - 7800 6500 - 8000 6600 - 8000BIST Nat. 100 77,916 76000 79000 82000 80000 SELL
Performance -2.5% 1.4% 5.2% 2.7% seit 1/1/16
Range 68400 - 83400 68400 - 84600 71100 - 87800 72000 - 87800In local currency1 11:59 p.m. (CEST)Source: Thomson Reuters, RBI/Raiffeisen RESEARCH
The BIST National 100 was able to recover part of the losses it incurred following the attempted coup in July. However, Erdogan’s authoritarian leadership style im-plies substantial political uncertainty and risks for international investors, so Fitch changed its rating outlook to negative. Moody’ s downgraded its rating assess-ment by one grade to Ba1. We also see a problem in the foreign-currency debt of companies, which has risen by close to 12%: Rising US interest rates and an associated weakening of the TRY will boost refinancing costs. Combined with the expected economic slowdown, we see the plus of 17.7% that is projected for cor-porate earnings in 2017 as overly ambitious. The Turkish equity index is already listing at a valuation discount in international and historical comparison (PER: 8.1), so we only expect a small decline in the coming quarter. Sell.
The Romanian equity index BET posted a gain of 7.1% in the second quarter, but is down by 0.8% since the beginning of the year. The economic outlook for Ro-mania remains positive, however, with projected GDP growth of 5.2% p.a. for 2016 and 3.6% for 2017. Uncertainty about the outcome of the parliamentary elections on 11 December could temporarily increase volatility on the Romanian equity market, but we anticipate no long-term negative effects here. Somewhat farther out, the loose fiscal policy (VAT cut, 19% minimum wage increase) should cause inflation to rise in 2017, which would result in a tightening of monetary policy in the second half of 2017 and could dampen the development of the BET somewhat in 2017. In valuation terms, the BET is in line with its historical aver-age at a 2016e PER of 11.3. All in all, we see risks on the rise (short term: possi-ble rating downgrade, political uncertainty; long term: tighter monetary policy), so we are cautious about the current quarter and at a one-year horizon. Hold.
Financial analysts: Andreas Schiller, CFA, Christian Hinterwallner, CEFA, Judith Galter, CIIA, Nina Neubauer-Kukiæ, CIIA, RBI Vienna
Equity market/CEE
80
110
140
170
2011 2012 2013 2014 2015 2016
BET BIST National 100
Indices in comparison
Source: Bloomberg, RBI/Raiffeisen RESEARCH

50 Please note the risk notifi cations and explanations at the end of this document
ATX
.ATX, 21/09/2016, 08:55 a.m. (CEST), 5y high: 2,729, 5y low: 1,653Source: Thomson Reuters, RBI/Raiffeisen RESEARCH
BIST National 100
.XU100, 21/09/2016 10:15 a.m. CEST, 5y high: 93,179, 5y-low: 49,622Source: Thomson Reuters, RBI/Raiffeisen RESEARCH
BUX
.BUX, 21/09/2016, 11:15 a.m. (CEST), 5y high 28,643, 5y low 14,930Source: Thomson Reuters, RBI/Raiffeisen RESEARCH
Stock Markets: Topside breakouts
Technical analysis
ATX
Last: 2,403 ˜BULLISHTwo bullish patterns, e.g., a Double Bottom and a Flag, do hint at the third’s topside confirmation at 2,590. This third one is a Symmetrical Triangle with bands 1,980 and 2,590 (blue lines). The topside confirmation should make it a bullish reversal and the next respective targets thus should be 2,730 and 3,010.
Long -> 2,560 – 2,730Stop 2,260
BIST National 100
Last: 79.530 ˜BULLISHThe current congestion should end with a bullish signal at 86,990 subsequent to this also the major resistance 91,560 should get crossed. This would clear headroom towards 98,830, while in case of failure at 84,430 – 86,990 a retracement towards 80,000 would set in. Most likely it would be chance to buy at the cheap as an advance should be due anyway.
Position: Buy 80,260 -> 84,430 – 86,990Stop 75,550
BUX
Last: 28,249 ˜BULLISHSince April a pattern per se to be neutral to be rated, a so-called “Diamond” (grey lines), is being formed. For a buy-signal it would have to cross 26,600, the Diamond’s center line, first and both 27,480, the pattern’s high, and 27,930 (-> 28,690 – 29,450) subsequently, while 25,505 (-> 24,150 – 23,270) would have to hold firm.
Position:Buy 26,600 -> 27,480 – 27,930Stop 25,050
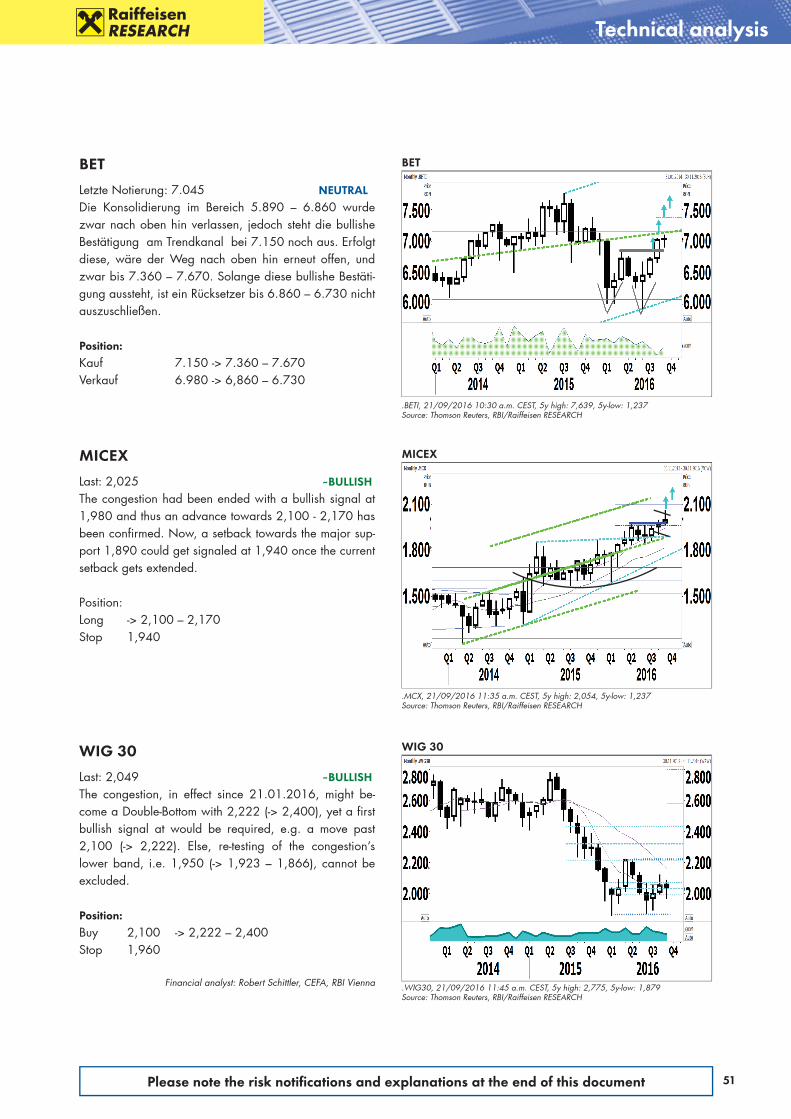
51Please note the risk notifi cations and explanations at the end of this document
Technical analysis
BET
.BETI, 21/09/2016 10:30 a.m. CEST, 5y high: 7,639, 5y-low: 1,237Source: Thomson Reuters, RBI/Raiffeisen RESEARCH
MICEX
.MCX, 21/09/2016 11:35 a.m. CEST, 5y high: 2,054, 5y-low: 1,237Source: Thomson Reuters, RBI/Raiffeisen RESEARCH
WIG 30
.WIG30, 21/09/2016 11:45 a.m. CEST, 5y high: 2,775, 5y-low: 1,879Source: Thomson Reuters, RBI/Raiffeisen RESEARCH
BET
Letzte Notierung: 7.045 NEUTRALDie Konsolidierung im Bereich 5.890 – 6.860 wurde zwar nach oben hin verlassen, jedoch steht die bullishe Bestätigung am Trendkanal bei 7.150 noch aus. Erfolgt diese, wäre der Weg nach oben hin erneut offen, und zwar bis 7.360 – 7.670. Solange diese bullishe Bestäti-gung aussteht, ist ein Rücksetzer bis 6.860 – 6.730 nicht auszuschließen.
Position:Kauf 7.150 -> 7.360 – 7.670Verkauf 6.980 -> 6,860 – 6.730
MICEX
Last: 2,025 ˜BULLISHThe congestion had been ended with a bullish signal at 1,980 and thus an advance towards 2,100 - 2,170 has been confirmed. Now, a setback towards the major sup-port 1,890 could get signaled at 1,940 once the current setback gets extended.
Position: Long -> 2,100 – 2,170Stop 1,940
WIG 30
Last: 2,049 ˜BULLISHThe congestion, in effect since 21.01.2016, might be-come a Double-Bottom with 2,222 (-> 2,400), yet a first bullish signal at would be required, e.g. a move past 2,100 (-> 2,222). Else, re-testing of the congestion’s lower band, i.e. 1,950 (-> 1,923 – 1,866), cannot be excluded.
Position:Buy 2,100 -> 2,222 – 2,400Stop 1,960
Financial analyst: Robert Schittler, CEFA, RBI Vienna

52 Please note the risk notifi cations and explanations at the end of this document
Energy17.12% Materials
9.73%
Consumer Discretionary
8.44%
Consumer Staples3.58%
Financials44.82%
Telecom2.13%
IT3.95%
Industrials0.69%
Utilities8.67% Real Estate
0.86%
Sector weightings Poland, WIG 30
Dom. market cap.: EUR 125,79 bn (Source: Bloomberg; 09/21/2016)
Source: Thomson Reuters, RBI/Raiffeisen RESEARCH
Materials2.85%
Consumer Discretionary5.71%
Consumer Staples6.74%
Financials58.55%
Telecommunications6.31%
Utilities19.84%
Energy48.49%
Materials13.12%
Industrials1.03%
Consumer Discretionary0.92%
Consumer Staples6.87%
Financials21.39%
IT1.22%
Telecommunications4.57%
Utilities2.41%
Sector weightings Czech Republic, PX
Source: Thomson Reuters, RBI/Raiffeisen RESEARCH
Sector weightings Hungary, BUX Sector weightings Russia, MICEX
Sector weightings Romania, BET Sector weightings Turkey, BIST National 100
Sector weightings in comparison
Dom. market cap.: EUR 21,86 bn (Source: Bloomberg; 09/21/2016)
Energy25.33% Materials
0.26%
Industrials0.78%
Consumer Staples0.31%
Financials37.22%
Health Care25.24%
Real Estate0.66%
Telecommunications9.59%
Utilities0.62%
Dom. market cap.: EUR 18,85 bn (Source: Bloomberg; 09/21/2016) Dom. market cap.: EUR 453,57 bn (Source: WFE; 09/21/2016)
Source: Thomson Reuters, RBI/Raiffeisen RESEARCH Source: Thomson Reuters, RBI/Raiffeisen RESEARCH
Energy32.69%
Utilities13.79%
Financials32.89%
Investment Fund20.62%
Dom. market cap.: EUR 14,81 bn (Source: Bloomberg; 09/21/2016)
Energy4.46% Materials
9.99%
Industrials14.81%
Consumer Discretiona7.33%
Consumer Staples12.83%
Financials38.50%
Telecommunications6.27%
IT0.35%
Utilities1.04%
Health Care0.08%
Real Estate4.34%
Dom. market cap.: EUR 170,6 bn (Source: Bloomberg; 09/21/2016)
Source: Bloomberg, RBI/Raiffeisen RESEARCH Source: Thomson Reuters, RBI/Raiffeisen RESEARCH
Equities – region overview

53Please note the risk notifi cations and explanations at the end of this document
Banks: Low yield/low risk environment
EBS
OTP
PKO
BZW
GNB
PEOMBK
MILALR
BHWBRD
TLV
KOMB
00.20.40.60.8
11.21.41.61.8
0% 5% 10% 15%
P/B
2016
e
RoE 2016e
Source: Bloomberg, Raiffeisen Centrobank estimates
P/B - RoE 2016e regression
-0.3
-0.2
-0.1
0
0.1
0.2
0.3
Alio
rG
NB
Kom
ercn
iPe
kao
Erste BRD
PKO
BP
Bank
Mill
.H
andl
owy
BZ W
BKm
Bank TLV
OTP
Source: Bloomberg, Raiffeisen Centrobank
YTD stocks performance (in %) We reiterate Erste as our preferred banking stock in our CEE coverage universe underpinned by sound capitalisation, potentially higher dividends and lower CoR in H2 16. After a recent meeting with the management of OTP, we feel fine with our assumptions: loan growth should bottom out in Hungary in H2, there is potential for M&A activity, NIM should stabilise and risk costs are expected to stay low.
Following the rebound on the back of the initial expectations for a more modest CHF solution plan that was outlined by the President‘s Office in early August we would remain cautious on the performance of Polish banks in Q4 16 due to: 1) likely less supportive news-flow on the CHF plan as recent critics from the NBP and banks point to technical/legal uncertainties with a potentially higher sec-tor burden from FX spread reimbursements, 2) an expected temporary increase of risk weights for FX mortgage loans as a tool to „encourage“ banks to convert CHF loans into PLN, 3) potential weakness of local macro indicators (low invest-ments, deflationary environment) that may stoke speculations about interest rate cuts in the short term. On the other hand, Q3 16 should demonstrate a relatively solid sector picture in terms of moderate core revenue growth, low cost of risk and stable C/I. However, we do not see any fundamental triggers that may allow for a re-rating of PL banks. We believe that the market has already largely priced in the sale of an up to a 33% stake in Pekao by UniCredit. Citing local media, PKO and Alior have placed a joint binding offer for Raiffeisen assets; in case of a successful agreement, we cannot rule out that Alior may go for another rights issue in order to digest the acquisition.
We see a muted development of Romanian banks’ share prices in Q4 16. Un-til the general elections, there might be some reticence of investors due to the risk of other populist measures. Once we pass the elections in early December, we would expect a better performance by the end of the year. Strong economic growth should keep investors’ interest in them alive. From a regional perspective their valuation is in line with that of their peers.
Financial analysts: Jovan Sikimic, Stefan Maxian, CFA
This analysis created by Raiffeisen Centrobank AG is presented to you by Raiffeisen Bank International AG. Supervisory authority: Financial Market Authority FMA, Otto-Wagner-Platz 5, A-1090 Vienna.
Banks
Polish banks should demonstrate a solid earnings picture in Q3 16 We see muted sentiment towards Romanian banks due to the upcoming elections Erste remains out top pick in the region
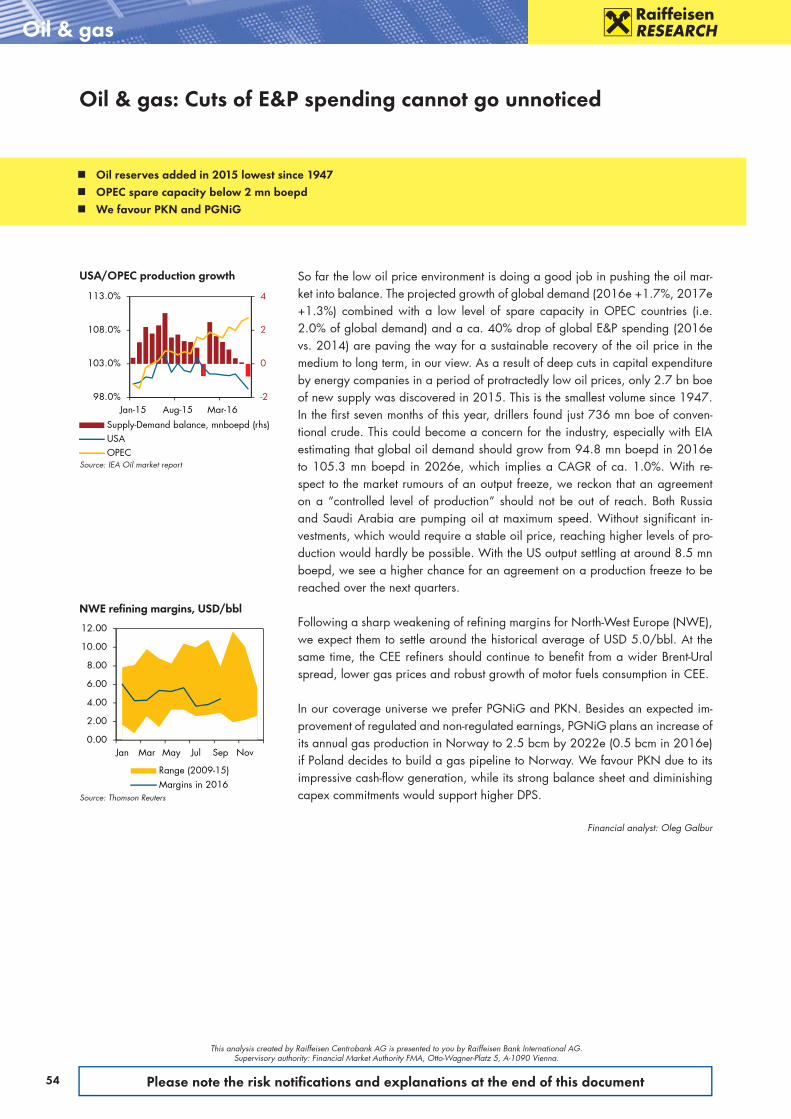
54 Please note the risk notifi cations and explanations at the end of this document
Oil & gas: Cuts of E&P spending cannot go unnoticed
0.00
2.00
4.00
6.00
8.00
10.00
12.00
Jan Mar May Jul Sep Nov
Range (2009-15)Margins in 2016
Source: Thomson Reuters
NWE refi ning margins, USD/bbl
So far the low oil price environment is doing a good job in pushing the oil mar-ket into balance. The projected growth of global demand (2016e +1.7%, 2017e +1.3%) combined with a low level of spare capacity in OPEC countries (i.e. 2.0% of global demand) and a ca. 40% drop of global E&P spending (2016e vs. 2014) are paving the way for a sustainable recovery of the oil price in the medium to long term, in our view. As a result of deep cuts in capital expenditure by energy companies in a period of protractedly low oil prices, only 2.7 bn boe of new supply was discovered in 2015. This is the smallest volume since 1947. In the first seven months of this year, drillers found just 736 mn boe of conven-tional crude. This could become a concern for the industry, especially with EIA estimating that global oil demand should grow from 94.8 mn boepd in 2016e to 105.3 mn boepd in 2026e, which implies a CAGR of ca. 1.0%. With re-spect to the market rumours of an output freeze, we reckon that an agreement on a “controlled level of production” should not be out of reach. Both Russia and Saudi Arabia are pumping oil at maximum speed. Without significant in-vestments, which would require a stable oil price, reaching higher levels of pro-duction would hardly be possible. With the US output settling at around 8.5 mn boepd, we see a higher chance for an agreement on a production freeze to be reached over the next quarters.
Following a sharp weakening of refining margins for North-West Europe (NWE), we expect them to settle around the historical average of USD 5.0/bbl. At the same time, the CEE refiners should continue to benefit from a wider Brent-Ural spread, lower gas prices and robust growth of motor fuels consumption in CEE.
In our coverage universe we prefer PGNiG and PKN. Besides an expected im-provement of regulated and non-regulated earnings, PGNiG plans an increase of its annual gas production in Norway to 2.5 bcm by 2022e (0.5 bcm in 2016e) if Poland decides to build a gas pipeline to Norway. We favour PKN due to its impressive cash-flow generation, while its strong balance sheet and diminishing capex commitments would support higher DPS.
Financial analyst: Oleg Galbur
This analysis created by Raiffeisen Centrobank AG is presented to you by Raiffeisen Bank International AG. Supervisory authority: Financial Market Authority FMA, Otto-Wagner-Platz 5, A-1090 Vienna.
Oil & gas
Oil reserves added in 2015 lowest since 1947 OPEC spare capacity below 2 mn boepd We favour PKN and PGNiG
-2
0
2
4
98.0%
103.0%
108.0%
113.0%
Jan-15 Aug-15 Mar-16Supply-Demand balance, mnboepd (rhs)USAOPEC
Source: IEA Oil market report
USA/OPEC production growth

55Please note the risk notifi cations and explanations at the end of this document
Equities
Given the strong rally of global sugar prices we believe that European sugar prices will catch up accordingly. That should be very positive for the group´s Sugar sales and margins and hence we think that consensus earnings expecta-tions could move upwards. The group has entered into exclusive talks to acquire Sunoko, the leading Serbian producer of sugar. We see additional significant earnings upside for the group if the management can sign this potential takeover.
We project a CAGR of group revenues of 1.7% until 2018/19e driven by fur-ther improvements of product prices and additional shipments from the enlarged Austrian starch plant (+130 ktons p.a.) in Aschach. Moreover we forecast an improvement of EBITDA margins from 7.6% last year to 8.3% over the medium term. This has to do with positive effects from higher prices in the Sugar and Fruit segments and additional cost-savings effects at the Austrian sugar operations.
For fiscal 2016/17e we project an unchanged DPS of EUR 4.0 followed by a DPS of EUR 4.2 in 2017/18e and EUR 4.4 in 2018/19e, which leads to steady growth of dividends and an attractive yield. We project free cash flow of EUR 80 mn on average over the entire forecast period, which implies a solid base for the continuation of this attrac-tive dividend policy.
Global sugar prices have been climb-ing to a current level of EUR 525/ton, which is far above the European sugar price level of EUR 436/ton in August 2016. The European level of sugar prices has been following the global price level in the past and we have no reason to believe that this time will be different. This, in turn, should be very beneficial to the group´s Sugar sales and margins in the near term. AGRANA has contracted ca. 75% of its sugar production for one year for-ward, which means that it does not im-mediately benefit from a sugar price recovery, but it will reap the full fruits in the next fiscal year.
Financial analyst: Christian Bader
Key ratios
2015 2016e 2017f 2018f
EPS 5.82 7.16 7.95 7.95
P/E ratio 13.8 14.2 12.8 12.8
Operating CF per share 4.40 11.10 13.63 14.00
Price cash flow 18.3 9.1 7.4 7.3
Book value per share 80.57 83.73 87.48 91.23
Price book value 1.0 1.2 1.2 1.1
Dividend yield 5.0% 4.1% 4.1% 4.3%
ROE 7.3% 8.7% 9.3% 8.9%
ROCE 5.4% 6.7% 7.2% 6.9%
EV/EBITDA 6.8 7.5 7.0 6.9Source: Agrana, Raiffeisen Centrobank estimates
Agrana: More triggers in the Sugar business ahead
Income statement & balance sheet (IFRS)
in EUR mn 2015 2016e 2017f 2018f
Income statement
Consolidated sales 2,478 2,610 2,650 2,670
EBITDA 190 215 224 223
EBIT 104 128 137 136
EBT 104 135 150 150
Net profit b.m. 81 105 117 116
Net profit a.m. 83 102 113 113
Balance sheet
Total assets 2,243 2,345 2,410 2,471
Shareholders' equity 1,144 1,189 1,242 1,296
Goodwill 226 226 226 226
NIBD 395 409 370 326Source: Agrana, Raiffeisen Centrobank estimates
This analysis created by Raiffeisen Centrobank AG is presented to you by Raiffeisen Bank International AG. Supervisory authority: Financial Market Authority FMA, Otto-Wagner-Platz 5, A-1090 Vienna.
Current share price: EUR 101.5 Target price: EUR 114.9 Market capitalisation: EUR 1,442 mn
65
75
85
95
105
115
Sep-15 Jan-16 Mai-16 Sep-16
AGRANA ATXagrana: 5y high: 115.1, 5y low: 69.0ATX: 5y high: 2729.07, 5y low: 1652.79Source: Bloomberg
Agrana vs. ATX

56 Please note the risk notifi cations and explanations at the end of this document
This analysis created by Raiffeisen Centrobank AG is presented to you by Raiffeisen Bank International AG. Supervisory authority: Financial Market Authority FMA, Otto-Wagner-Platz 5, A-1090 Vienna.
Equities
EVN is on track to achieve at least a stable result for the year, and its reliable div-idend policy contributes to making the stock a solid dividend play. At the same time, the restructuring measures of E.ON and RWE are likely to attract increasing attention to the Austrian utility as well. The two German energy giants have spun off their generation activities into Uniper and RWE (new), respectively. In the same vein, they have separated their network operations and retail distribution businesses into E.ON (new) and Innogy. Their stock market flotations increase the number of peer group companies on the market.
EVN posted a fairly successful performance in the first three quarters of FY 15/16e. EBITDA in the generation business remained stable despite declining wholesale prices, and in the Austrian network business the result was 13% up on the back of higher tariffs due to increased capex and higher gas sales volumes. Thanks to lower procurement costs, margins also improved in combined energy distribution (including EnergieAllianz) despite falling end customer prices. The re-
covery continues in South-Eastern Eu-rope as well. Only the environmental services business displays receding re-sults because of the languishing pro-ject business. Overall, EBITDA includ-ing investments climbed by 5.7% (ex-cluding investments: 11.2%). For the current business year we anticipate a slight drop in the operating result be-cause of potential allowances in Q4. All told, however, we expect a slight increase in net profit and a stable div-idend of EUR 0.42.
Investors have somewhat lost sight of EVN due to the low free float of the share and because of the group’s di-versified, yet mostly regulated busi-ness. This might be about to change now, and the company’s attractive val-uation should take centre-stage – not least because regulated utilities have outperformed the market since 2012 and the stable earnings profile justifies higher valuation levels.
Financial analyst: Teresa Schinwald
EVN: Germany’s new utility listings are shining a spotlight on EVN
EVN: 5y high: 12.66, 5y low: 9.169ATX: 5y high: 2729.07, 5y low: 1652.79 Source: Bloomberg
EVN vs. ATX
8.5
9.0
9.5
10.0
10.5
11.0
11.5
Sep-15 Jan-16 Mai-16 Sep-16
EVN ATX
Current share price: EUR 10.46 Target price: EUR 12.80 Market capitalisation: EUR 1,859 mn
Key ratios
2015 2016e 2017f 2018f
EPS 0.83 0.86 0.88 0.95
P/E ratio 11.8 12.1 11.8 11.0
Operating CF per share 2.88 2.59 2.55 2.78
Price cash flow 3.4 4.0 4.1 3.8
Book value per share 13.13 13.70 14.29 14.95
Price book value 0.8 0.8 0.7 0.7
Dividend yield 4.3% 4.0% 4.0% 4.0%
ROE 6.3% 6.4% 6.3% 6.5%
ROCE 5.9% 5.6% 5.7% 5.9%
EV/EBITDA 3.6 4.4 4.4 5.7Source: EVN, Raiffeisen Centrobank estimates
Income statement & balance sheet (IFRS)
in EUR mn 2015 2016e 2017f 2018f
Income statement
Consolidated sales 2,136 2,055 1,988 2,005
EBITDA 442 422 429 446
EBIT 127 127 156 167
EBT 208 205 217 238
Net profit b.m. 191 182 192 210
Net profit a.m. 148 153 157 169
Balance sheet
Total assets 6,501 6,450 6,536 6,679
Shareholders' equity 2,335 2,436 2,541 2,658
Goodwill 56 56 56 56
NIBD 1,231 1,258 1,280 1,274Source: EVN, Raiffeisen Centrobank estimates
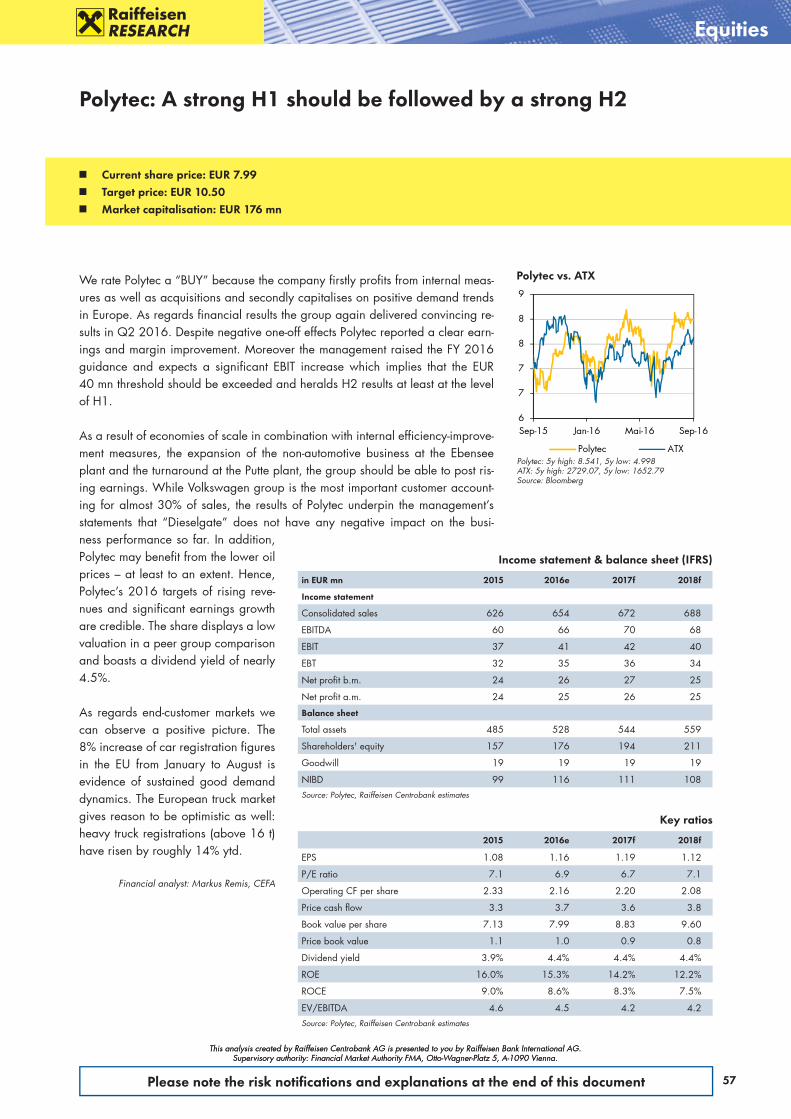
57Please note the risk notifi cations and explanations at the end of this document
This analysis created by Raiffeisen Centrobank AG is presented to you by Raiffeisen Bank International AG. Supervisory authority: Financial Market Authority FMA, Otto-Wagner-Platz 5, A-1090 Vienna.
Equities
This analysis created by Raiffeisen Centrobank AG is presented to you by Raiffeisen Bank International AG. Supervisory authority: Financial Market Authority FMA, Otto-Wagner-Platz 5, A-1090 Vienna.
We rate Polytec a “BUY” because the company firstly profits from internal meas-ures as well as acquisitions and secondly capitalises on positive demand trends in Europe. As regards financial results the group again delivered convincing re-sults in Q2 2016. Despite negative one-off effects Polytec reported a clear earn-ings and margin improvement. Moreover the management raised the FY 2016 guidance and expects a significant EBIT increase which implies that the EUR 40 mn threshold should be exceeded and heralds H2 results at least at the level of H1.
As a result of economies of scale in combination with internal efficiency-improve-ment measures, the expansion of the non-automotive business at the Ebensee plant and the turnaround at the Putte plant, the group should be able to post ris-ing earnings. While Volkswagen group is the most important customer account-ing for almost 30% of sales, the results of Polytec underpin the management’s statements that “Dieselgate” does not have any negative impact on the busi-ness performance so far. In addition, Polytec may benefit from the lower oil prices – at least to an extent. Hence, Polytec’s 2016 targets of rising reve-nues and significant earnings growth are credible. The share displays a low valuation in a peer group comparison and boasts a dividend yield of nearly 4.5%.
As regards end-customer markets we can observe a positive picture. The 8% increase of car registration figures in the EU from January to August is evidence of sustained good demand dynamics. The European truck market gives reason to be optimistic as well: heavy truck registrations (above 16 t) have risen by roughly 14% ytd.
Financial analyst: Markus Remis, CEFA
Polytec: A strong H1 should be followed by a strong H2
Key ratios
2015 2016e 2017f 2018f
EPS 1.08 1.16 1.19 1.12
P/E ratio 7.1 6.9 6.7 7.1
Operating CF per share 2.33 2.16 2.20 2.08
Price cash flow 3.3 3.7 3.6 3.8
Book value per share 7.13 7.99 8.83 9.60
Price book value 1.1 1.0 0.9 0.8
Dividend yield 3.9% 4.4% 4.4% 4.4%
ROE 16.0% 15.3% 14.2% 12.2%
ROCE 9.0% 8.6% 8.3% 7.5%
EV/EBITDA 4.6 4.5 4.2 4.2Source: Polytec, Raiffeisen Centrobank estimates
Income statement & balance sheet (IFRS)
in EUR mn 2015 2016e 2017f 2018f
Income statement
Consolidated sales 626 654 672 688
EBITDA 60 66 70 68
EBIT 37 41 42 40
EBT 32 35 36 34
Net profit b.m. 24 26 27 25
Net profit a.m. 24 25 26 25
Balance sheet
Total assets 485 528 544 559
Shareholders' equity 157 176 194 211
Goodwill 19 19 19 19
NIBD 99 116 111 108Source: Polytec, Raiffeisen Centrobank estimates
Current share price: EUR 7.99 Target price: EUR 10.50 Market capitalisation: EUR 176 mn
6
7
7
8
8
9
Sep-15 Jan-16 Mai-16 Sep-16
Polytec ATXPolytec: 5y high: 8.541, 5y low: 4.998ATX: 5y high: 2729.07, 5y low: 1652.79Source: Bloomberg
Polytec vs. ATX
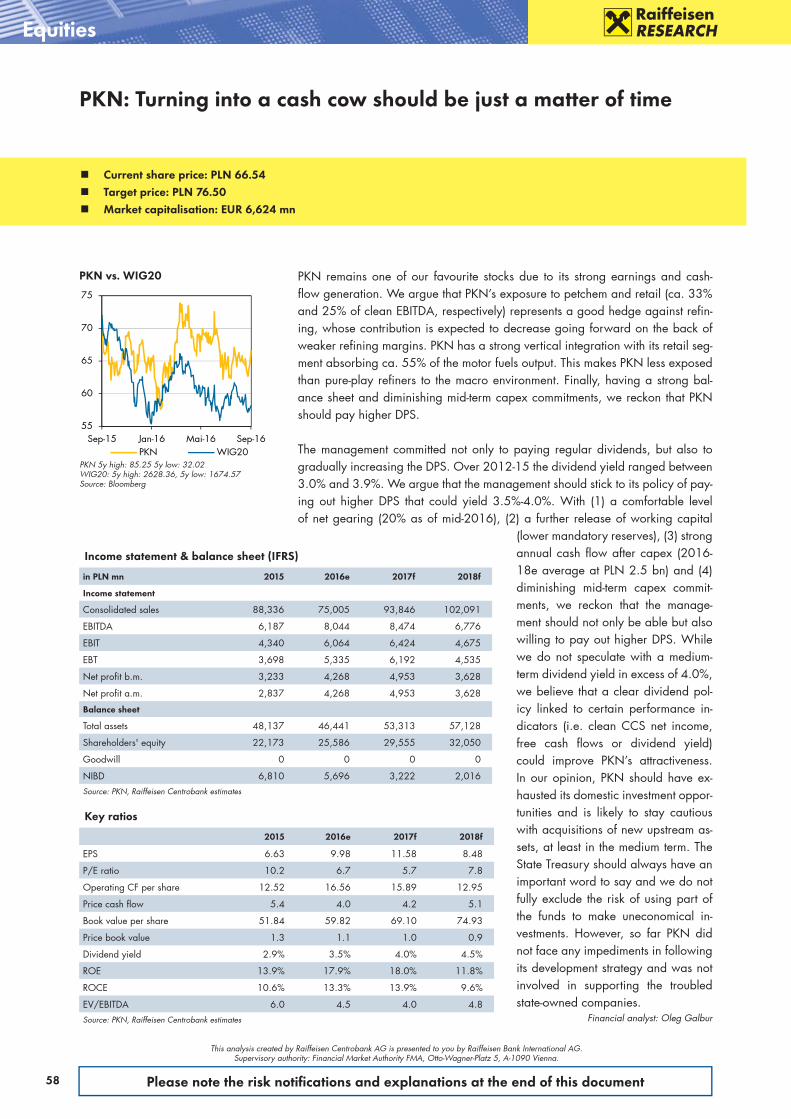
58 Please note the risk notifi cations and explanations at the end of this document
This analysis created by Raiffeisen Centrobank AG is presented to you by Raiffeisen Bank International AG. Supervisory authority: Financial Market Authority FMA, Otto-Wagner-Platz 5, A-1090 Vienna.
Equities
PKN remains one of our favourite stocks due to its strong earnings and cash-flow generation. We argue that PKN’s exposure to petchem and retail (ca. 33% and 25% of clean EBITDA, respectively) represents a good hedge against refin-ing, whose contribution is expected to decrease going forward on the back of weaker refining margins. PKN has a strong vertical integration with its retail seg-ment absorbing ca. 55% of the motor fuels output. This makes PKN less exposed than pure-play refiners to the macro environment. Finally, having a strong bal-ance sheet and diminishing mid-term capex commitments, we reckon that PKN should pay higher DPS.
The management committed not only to paying regular dividends, but also to gradually increasing the DPS. Over 2012-15 the dividend yield ranged between 3.0% and 3.9%. We argue that the management should stick to its policy of pay-ing out higher DPS that could yield 3.5%-4.0%. With (1) a comfortable level of net gearing (20% as of mid-2016), (2) a further release of working capital
(lower mandatory reserves), (3) strong annual cash flow after capex (2016-18e average at PLN 2.5 bn) and (4) diminishing mid-term capex commit-ments, we reckon that the manage-ment should not only be able but also willing to pay out higher DPS. While we do not speculate with a medium-term dividend yield in excess of 4.0%, we believe that a clear dividend pol-icy linked to certain performance in-dicators (i.e. clean CCS net income, free cash flows or dividend yield) could improve PKN’s attractiveness. In our opinion, PKN should have ex-hausted its domestic investment oppor-tunities and is likely to stay cautious with acquisitions of new upstream as-sets, at least in the medium term. The State Treasury should always have an important word to say and we do not fully exclude the risk of using part of the funds to make uneconomical in-vestments. However, so far PKN did not face any impediments in following its development strategy and was not involved in supporting the troubled state-owned companies.
Financial analyst: Oleg Galbur
PKN: Turning into a cash cow should be just a matter of time
PKN 5y high: 85.25 5y low: 32.02WIG20: 5y high: 2628.36, 5y low: 1674.57Source: Bloomberg
PKN vs. WIG20
55
60
65
70
75
Sep-15 Jan-16 Mai-16 Sep-16PKN WIG20
Current share price: PLN 66.54 Target price: PLN 76.50 Market capitalisation: EUR 6,624 mn
Key ratios
2015 2016e 2017f 2018f
EPS 6.63 9.98 11.58 8.48
P/E ratio 10.2 6.7 5.7 7.8
Operating CF per share 12.52 16.56 15.89 12.95
Price cash flow 5.4 4.0 4.2 5.1
Book value per share 51.84 59.82 69.10 74.93
Price book value 1.3 1.1 1.0 0.9
Dividend yield 2.9% 3.5% 4.0% 4.5%
ROE 13.9% 17.9% 18.0% 11.8%
ROCE 10.6% 13.3% 13.9% 9.6%
EV/EBITDA 6.0 4.5 4.0 4.8Source: PKN, Raiffeisen Centrobank estimates
Income statement & balance sheet (IFRS)
in PLN mn 2015 2016e 2017f 2018f
Income statement
Consolidated sales 88,336 75,005 93,846 102,091
EBITDA 6,187 8,044 8,474 6,776
EBIT 4,340 6,064 6,424 4,675
EBT 3,698 5,335 6,192 4,535
Net profit b.m. 3,233 4,268 4,953 3,628
Net profit a.m. 2,837 4,268 4,953 3,628
Balance sheet
Total assets 48,137 46,441 53,313 57,128
Shareholders' equity 22,173 25,586 29,555 32,050
Goodwill 0 0 0 0
NIBD 6,810 5,696 3,222 2,016Source: PKN, Raiffeisen Centrobank estimates
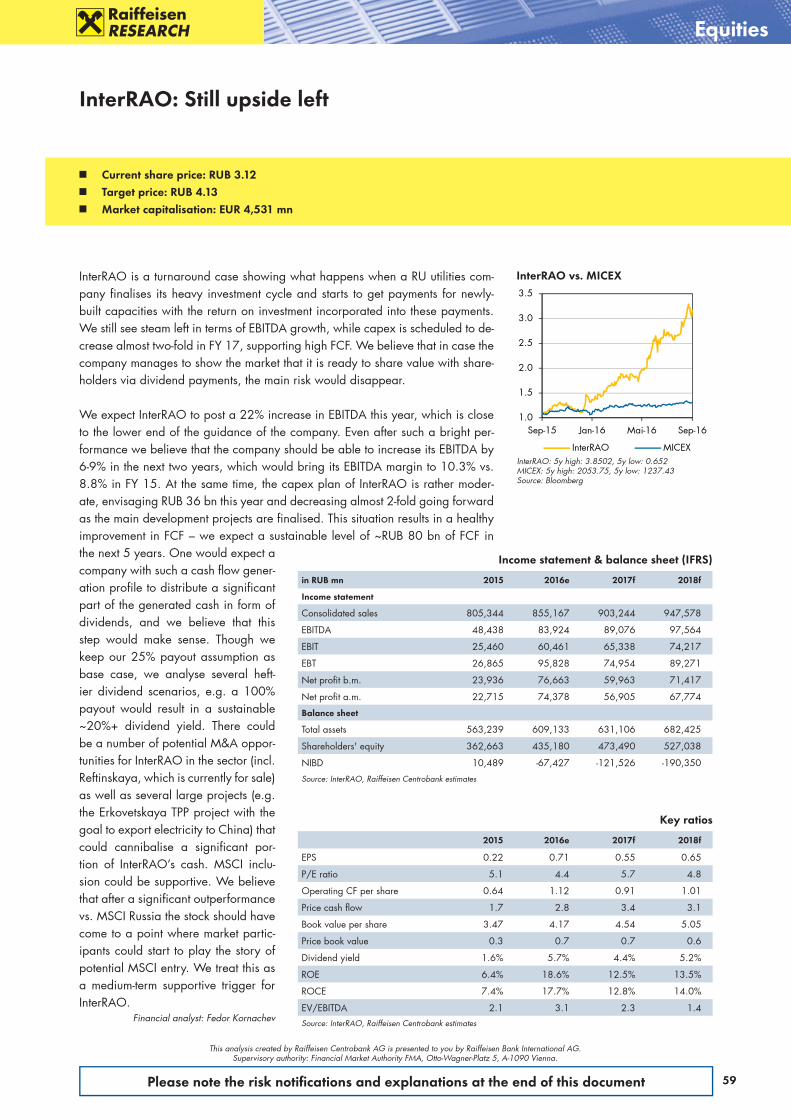
59Please note the risk notifi cations and explanations at the end of this document
This analysis created by Raiffeisen Centrobank AG is presented to you by Raiffeisen Bank International AG. Supervisory authority: Financial Market Authority FMA, Otto-Wagner-Platz 5, A-1090 Vienna.
InterRAO is a turnaround case showing what happens when a RU utilities com-pany finalises its heavy investment cycle and starts to get payments for newly-built capacities with the return on investment incorporated into these payments. We still see steam left in terms of EBITDA growth, while capex is scheduled to de-crease almost two-fold in FY 17, supporting high FCF. We believe that in case the company manages to show the market that it is ready to share value with share-holders via dividend payments, the main risk would disappear.
We expect InterRAO to post a 22% increase in EBITDA this year, which is close to the lower end of the guidance of the company. Even after such a bright per-formance we believe that the company should be able to increase its EBITDA by 6-9% in the next two years, which would bring its EBITDA margin to 10.3% vs. 8.8% in FY 15. At the same time, the capex plan of InterRAO is rather moder-ate, envisaging RUB 36 bn this year and decreasing almost 2-fold going forward as the main development projects are finalised. This situation results in a healthy improvement in FCF – we expect a sustainable level of ~RUB 80 bn of FCF in the next 5 years. One would expect a company with such a cash flow gener-ation profile to distribute a significant part of the generated cash in form of dividends, and we believe that this step would make sense. Though we keep our 25% payout assumption as base case, we analyse several heft-ier dividend scenarios, e.g. a 100% payout would result in a sustainable ~20%+ dividend yield. There could be a number of potential M&A oppor-tunities for InterRAO in the sector (incl. Reftinskaya, which is currently for sale) as well as several large projects (e.g. the Erkovetskaya TPP project with the goal to export electricity to China) that could cannibalise a significant por-tion of InterRAO’s cash. MSCI inclu-sion could be supportive. We believe that after a significant outperformance vs. MSCI Russia the stock should have come to a point where market partic-ipants could start to play the story of potential MSCI entry. We treat this as a medium-term supportive trigger for InterRAO.
Financial analyst: Fedor Kornachev
InterRAO: Still upside left
Equities
1.0
1.5
2.0
2.5
3.0
3.5
Sep-15 Jan-16 Mai-16 Sep-16
InterRAO MICEXInterRAO: 5y high: 3.8502, 5y low: 0.652MICEX: 5y high: 2053.75, 5y low: 1237.43Source: Bloomberg
InterRAO vs. MICEX
Key ratios
2015 2016e 2017f 2018f
EPS 0.22 0.71 0.55 0.65
P/E ratio 5.1 4.4 5.7 4.8
Operating CF per share 0.64 1.12 0.91 1.01
Price cash flow 1.7 2.8 3.4 3.1
Book value per share 3.47 4.17 4.54 5.05
Price book value 0.3 0.7 0.7 0.6
Dividend yield 1.6% 5.7% 4.4% 5.2%
ROE 6.4% 18.6% 12.5% 13.5%
ROCE 7.4% 17.7% 12.8% 14.0%
EV/EBITDA 2.1 3.1 2.3 1.4Source: InterRAO, Raiffeisen Centrobank estimates
Income statement & balance sheet (IFRS)
in RUB mn 2015 2016e 2017f 2018f
Income statement
Consolidated sales 805,344 855,167 903,244 947,578
EBITDA 48,438 83,924 89,076 97,564
EBIT 25,460 60,461 65,338 74,217
EBT 26,865 95,828 74,954 89,271
Net profit b.m. 23,936 76,663 59,963 71,417
Net profit a.m. 22,715 74,378 56,905 67,774
Balance sheet
Total assets 563,239 609,133 631,106 682,425
Shareholders' equity 362,663 435,180 473,490 527,038
NIBD 10,489 -67,427 -121,526 -190,350
Source: InterRAO, Raiffeisen Centrobank estimates
Current share price: RUB 3.12 Target price: RUB 4.13 Market capitalisation: EUR 4,531 mn
60
Risk notifi cations and explanations
Risk notifi cations and explanations
Warnings Figures on performance refer to the past. Past performance is not a reliable indicator for future results and the develop-
ment of a financial instrument, a financial index or a securities service. This is particularly true in cases when the finan-cial instrument, financial index or securities service has been offered for less than 12 months. In particular, this very short comparison period is not a reliable indicator for future results.
Performance of a financial instrument, a financial index or a securities service is reduced by commissions, fees and other charges, which depend on the individual circumstances of the investor.
The return on an investment in a financial instrument, a financial or securities service can rise or fall due to exchange rate fluctuations.
Forecasts of future performance are based purely on estimates and assumptions. Actual future performance may devi-ate from the forecast. Consequently, forecasts are not a reliable indicator for future results and the development of a fi-nancial instrument, a financial index or a securities service.
The information and recommendations in this publication which are contributed by analysts from RBI’s subsidiary banks or from Raiffeisen Centrobank (“RCB”) are disseminated unaltered under RBI’s responsibility.
A description of the concepts and methods used in the preparation of financial analyses is available under: www.raiffeisenresearch.com/concept_and_methods
Detailed information on sensitivity analyses (procedure for checking the stability of potential assumptions made in the con-text of financial analyses) is available under: www.raiffeisenresearch.com/sensitivity_analysis
Disclosure of circumstances and interests which may jeopardise the objectivity of RBI:www.raiffeisenresearch.com/disclosuresobjectivity
The distribution of all recommendations relating to the 3 months prior to the publications date (column A), as well as the distribution of recommendations in the context of which services of investment fi rms set out in Sections A (investment services and activities) and B (ancillary services) of Annex I of Directive 2014/65/EU of the European Parliament and of the Council (“special services”) have been provided in the past 12 months (column B). Investment recommendation Column A
Basis: All recommendations for all fi nancial instruments (last 3 months)
Column BBasis: Recommendations for fi nancial instruments of all issuers, for which
special services were rendered in the last 12 months
Buy recommendations 47.3 57.4
Hold recommendations 35.5 3.0
Sell recommendations 17.2 39.6
Detailed information on recommendations concerning financial instruments or issuers disseminated during a period of 12 month prior to this publication (acc. to Art. 4 (1) i) Commission Delegated Regulation (EU) 2016/958 of 9.3.2016) is avail-able under: https://raiffeisenresearch.com/web/rbi-research-portal/recommendation_history

61
Disclosure
Recommendations history for 12 monthsGAZPROM Start of coverage 17.04.2008
Date of recommendation RecommendationGAZPRU 4.950% due 2022 16.10.2015 SellGAZPRU 8.265% due 2034 10.02.2016 BuyGAZPRU 8.265% due 2034 28.04.2016 BuyGAZPRU 6.51% due 2022 14.07.2016 BuyHALYK SAVINGS BANK-KAZAK Start of coverage 17.04.2008
Date of recommendation RecommendationHSBKKZ 7.25% due 2021 28.04.2016 BuyHSBKKZ 7.25% due 2021 14.07.2016 BuySeverstal Start of coverage 14.05.2008
Date of recommendation RecommendationCHMFRU 5.9% due 2022 28.04.2016 BuyCHMFRU 5.9% due 2022 14.07.2016 Buy
Corporate Credits
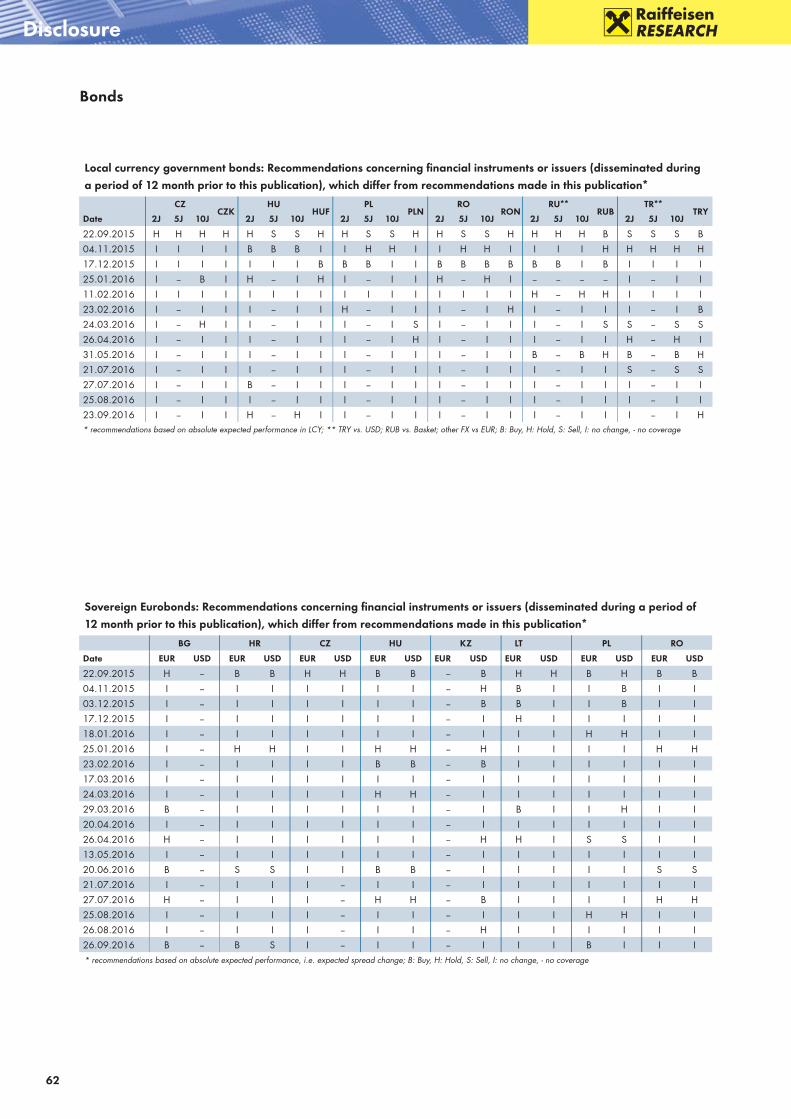
62
Disclosure
Bonds
Local currency government bonds: Recommendations concerning fi nancial instruments or issuers (disseminated during a period of 12 month prior to this publication), which differ from recommendations made in this publication*
CZCZK
HUHUF
PLPLN
RORON
RU**RUB
TR**TRY
Date 2J 5J 10J 2J 5J 10J 2J 5J 10J 2J 5J 10J 2J 5J 10J 2J 5J 10J
22.09.2015 H H H H H S S H H S S H H S S H H H H B S S S B04.11.2015 I I I I B B B I I H H I I H H I I I I H H H H H17.12.2015 I I I I I I I B B B I I B B B B B B I B I I I I25.01.2016 I -- B I H -- I H I -- I I H -- H I -- -- -- -- I -- I I11.02.2016 I I I I I I I I I I I I I I I I H -- H H I I I I23.02.2016 I -- I I I -- I I H -- I I I -- I H I -- I I I -- I B24.03.2016 I -- H I I -- I I I -- I S I -- I I I -- I S S -- S S26.04.2016 I -- I I I -- I I I -- I H I -- I I I -- I I H -- H I31.05.2016 I -- I I I -- I I I -- I I I -- I I B -- B H B -- B H21.07.2016 I -- I I I -- I I I -- I I I -- I I I -- I I S -- S S27.07.2016 I -- I I B -- I I I -- I I I -- I I I -- I I I -- I I25.08.2016 I -- I I I -- I I I -- I I I -- I I I -- I I I -- I I23.09.2016 I -- I I H -- H I I -- I I I -- I I I -- I I I -- I H* recommendations based on absolute expected performance in LCY; ** TRY vs. USD; RUB vs. Basket; other FX vs EUR; B: Buy, H: Hold, S: Sell, I: no change, - no coverage
Sovereign Eurobonds: Recommendations concerning fi nancial instruments or issuers (disseminated during a period of 12 month prior to this publication), which differ from recommendations made in this publication*
BG HR CZ HU KZ LT PL RO
Date EUR USD EUR USD EUR USD EUR USD EUR USD EUR USD EUR USD EUR USD
22.09.2015 H -- B B H H B B -- B H H B H B B04.11.2015 I -- I I I I I I -- H B I I B I I03.12.2015 I -- I I I I I I -- B B I I B I I17.12.2015 I -- I I I I I I -- I H I I I I I18.01.2016 I -- I I I I I I -- I I I H H I I25.01.2016 I -- H H I I H H -- H I I I I H H23.02.2016 I -- I I I I B B -- B I I I I I I17.03.2016 I -- I I I I I I -- I I I I I I I24.03.2016 I -- I I I I H H -- I I I I I I I29.03.2016 B -- I I I I I I -- I B I I H I I20.04.2016 I -- I I I I I I -- I I I I I I I26.04.2016 H -- I I I I I I -- H H I S S I I13.05.2016 I -- I I I I I I -- I I I I I I I20.06.2016 B -- S S I I B B -- I I I I I S S21.07.2016 I -- I I I -- I I -- I I I I I I I27.07.2016 H -- I I I -- H H -- B I I I I H H25.08.2016 I -- I I I -- I I -- I I I H H I I26.08.2016 I -- I I I -- I I -- H I I I I I I26.09.2016 B -- B S I -- I I -- I I I B I I I* recommendations based on absolute expected performance, i.e. expected spread change; B: Buy, H: Hold, S: Sell, I: no change, - no coverage

Equities
63
Disclosure
Single stocksEVN: 5y high: EUR 12.66 (17/01/2013), 5y low: EUR 9.169 (21/05/2012)Recommendation history01.02.2002 (Initiation date) Rating Target Price Prev. day's close Upside26.08.2016 Buy 12.80 10.43 22.7%31.03.2016 Buy 12.80 10.04 27.5%01.12.2015 Buy 12.40 10.05 23.4%30.03.2015 Buy 12.40 10.42 19.0%03.12.2014 Buy 12.20 10.45 16.7%
Polytec: 5y high: EUR 8.541 (20/06/2014), 5y low: EUR 4.998 (04/10/2011)Recommendation history10.08.2007 (Initiation date) Rating Target Price Prev. day's close Upside03.08.2016 Buy 10.50 7.53 39.4%06.04.2016 Buy 9.50 7.58 25.3%09.11.2015 Buy 9.00 7.31 23.1%07.05.2015 Buy 10.00 8.35 19.8%13.03.2015 Buy 9.00 7.37 22.1%07.10.2014 Buy 8.00 6.39 25.2%
AGRANA: 5y high: EUR 115.1 (12/06/2013), 5y low: EUR 69 (23/10/2014)Recommendation history24.02.2004 (Initiation date) Rating Target Price Prev. day's close Upside07.07.2016 Buy 114.90 94.90 21.1%23.05.2016 Buy 109.00 90.35 20.6%13.01.2016 Buy 109.00 88.45 23.2%19.11.2015 Buy 109.00 82.59 32.0%09.10.2015 Buy 95.00 77.99 21.8%10.09.2015 Buy 95.00 75.87 25.2%02.04.2015 Hold 84.50 79.20 6.7%14.10.2014 Hold 82.00 73.00 12.3%
PKN: 5y high: PLN 85.25 (20/08/2015), 5y low: PLN 32.02 (05/06/2012)Recommendation history
Sovereign Eurobonds: Recommendations concerning fi nancial instruments or issuers (disseminated during a period of 12 month prior to this publication), which differ from recommendations made in this publication*
RU RS SK SI TR UA BY MK
Date EUR USD EUR USD EUR USD EUR USD EUR USD EUR USD EUR USD EUR USD
22.09.2015 H H – S H -- H -- S S H H -- S H --04.11.2015 B B – I I -- I -- H H -- I – H I --03.12.2015 H H – I I -- I -- H I -- S -- I I --17.12.2015 I I – I I -- I -- B I -- I -- I I --25.01.2016 B B – I I -- B -- I B -- I – I B --23.02.2016 I I – H I -- I -- I I -- I -- I I --17.03.2016 H H – I I -- I -- I I -- I -- I I --24.03.2016 I I – I I -- I -- I I -- I -- I I --29.03.2016 I I – I I -- I -- I I -- H -- I I --20.04.2016 I I – I I I I I – I – I H --26.04.2016 I I – B I -- I -- I I -- I – I I --13.05.2016 I I – I I -- I B H H -- I – I I --20.06.2016 I I – I I -- I -- B I -- I – I I --21.07.2016 I I – I I -- I I S S -- I – I I --27.07.2016 B B – I S -- I I I I -- I – I B --25.08.2016 I I – I I -- I I I I -- I – I I --26.08.2016 H H – H H -- H I I I -- I – I I --26.09.2016 I I – B I -- I I H H -- I – I I --* recommendations based on absolute expected performance, i.e. expected spread change; B: Buy, H: Hold, S: Sell, I: no change, - no coverage
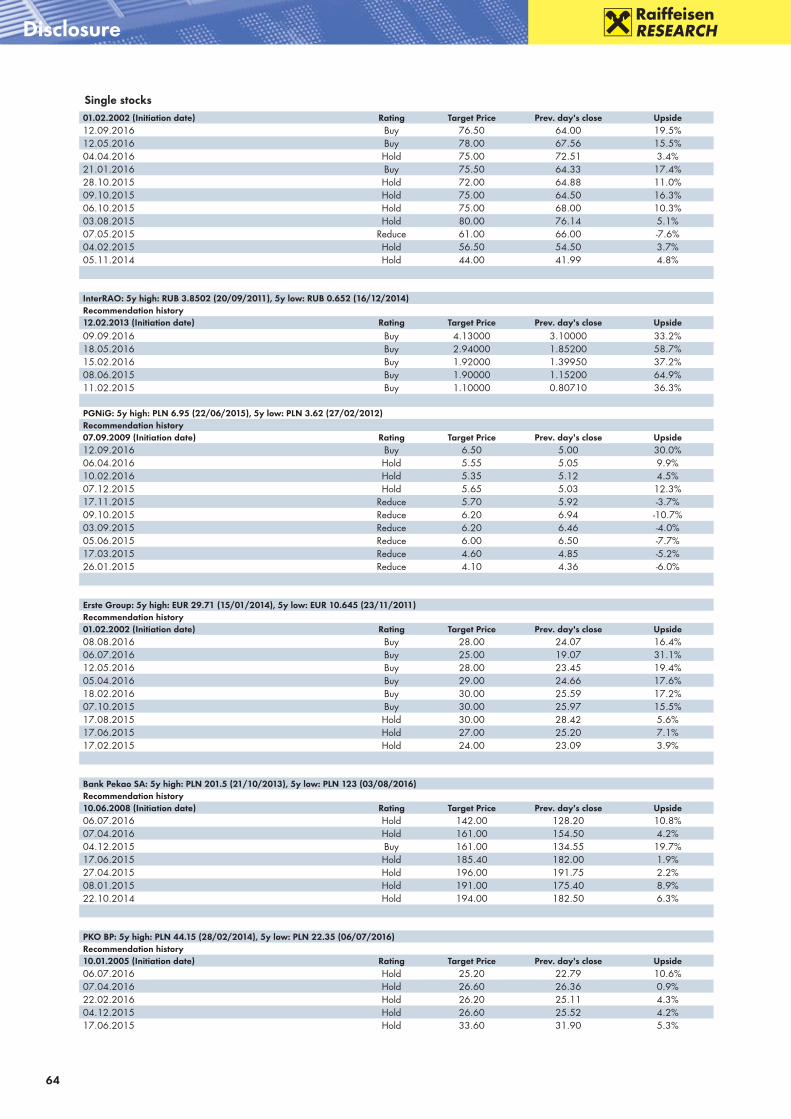
64
Disclosure
Single stocks01.02.2002 (Initiation date) Rating Target Price Prev. day's close Upside12.09.2016 Buy 76.50 64.00 19.5%12.05.2016 Buy 78.00 67.56 15.5%04.04.2016 Hold 75.00 72.51 3.4%21.01.2016 Buy 75.50 64.33 17.4%28.10.2015 Hold 72.00 64.88 11.0%09.10.2015 Hold 75.00 64.50 16.3%06.10.2015 Hold 75.00 68.00 10.3%03.08.2015 Hold 80.00 76.14 5.1%07.05.2015 Reduce 61.00 66.00 -7.6%04.02.2015 Hold 56.50 54.50 3.7%05.11.2014 Hold 44.00 41.99 4.8%
InterRAO: 5y high: RUB 3.8502 (20/09/2011), 5y low: RUB 0.652 (16/12/2014)Recommendation history12.02.2013 (Initiation date) Rating Target Price Prev. day's close Upside
09.09.2016 Buy 4.13000 3.10000 33.2%18.05.2016 Buy 2.94000 1.85200 58.7%15.02.2016 Buy 1.92000 1.39950 37.2%08.06.2015 Buy 1.90000 1.15200 64.9%11.02.2015 Buy 1.10000 0.80710 36.3% PGNiG: 5y high: PLN 6.95 (22/06/2015), 5y low: PLN 3.62 (27/02/2012)Recommendation history07.09.2009 (Initiation date) Rating Target Price Prev. day's close Upside12.09.2016 Buy 6.50 5.00 30.0%06.04.2016 Hold 5.55 5.05 9.9%10.02.2016 Hold 5.35 5.12 4.5%07.12.2015 Hold 5.65 5.03 12.3%17.11.2015 Reduce 5.70 5.92 -3.7%09.10.2015 Reduce 6.20 6.94 -10.7%03.09.2015 Reduce 6.20 6.46 -4.0%05.06.2015 Reduce 6.00 6.50 -7.7%17.03.2015 Reduce 4.60 4.85 -5.2%26.01.2015 Reduce 4.10 4.36 -6.0%
Erste Group: 5y high: EUR 29.71 (15/01/2014), 5y low: EUR 10.645 (23/11/2011)Recommendation history01.02.2002 (Initiation date) Rating Target Price Prev. day's close Upside08.08.2016 Buy 28.00 24.07 16.4%06.07.2016 Buy 25.00 19.07 31.1%12.05.2016 Buy 28.00 23.45 19.4%05.04.2016 Buy 29.00 24.66 17.6%18.02.2016 Buy 30.00 25.59 17.2%07.10.2015 Buy 30.00 25.97 15.5%17.08.2015 Hold 30.00 28.42 5.6%17.06.2015 Hold 27.00 25.20 7.1%17.02.2015 Hold 24.00 23.09 3.9%
Bank Pekao SA: 5y high: PLN 201.5 (21/10/2013), 5y low: PLN 123 (03/08/2016)Recommendation history10.06.2008 (Initiation date) Rating Target Price Prev. day's close Upside06.07.2016 Hold 142.00 128.20 10.8%07.04.2016 Hold 161.00 154.50 4.2%04.12.2015 Buy 161.00 134.55 19.7%17.06.2015 Hold 185.40 182.00 1.9%27.04.2015 Hold 196.00 191.75 2.2%08.01.2015 Hold 191.00 175.40 8.9%22.10.2014 Hold 194.00 182.50 6.3%
PKO BP: 5y high: PLN 44.15 (28/02/2014), 5y low: PLN 22.35 (06/07/2016)Recommendation history10.01.2005 (Initiation date) Rating Target Price Prev. day's close Upside06.07.2016 Hold 25.20 22.79 10.6%07.04.2016 Hold 26.60 26.36 0.9%22.02.2016 Hold 26.20 25.11 4.3%04.12.2015 Hold 26.60 25.52 4.2%17.06.2015 Hold 33.60 31.90 5.3%
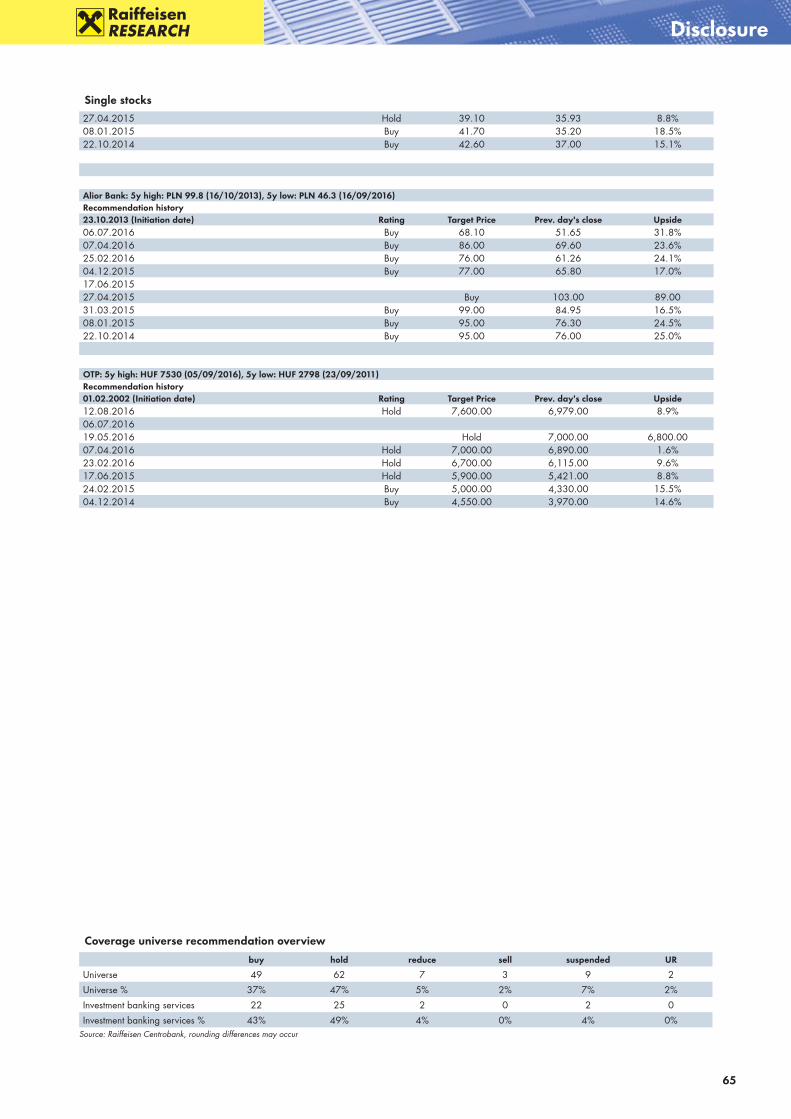
65
Disclosure
Coverage universe recommendation overview
buy hold reduce sell suspended UR
Universe 49 62 7 3 9 2
Universe % 37% 47% 5% 2% 7% 2%
Investment banking services 22 25 2 0 2 0
Investment banking services % 43% 49% 4% 0% 4% 0%Source: Raiffeisen Centrobank, rounding differences may occur
Single stocks
27.04.2015 Hold 39.10 35.93 8.8%08.01.2015 Buy 41.70 35.20 18.5%22.10.2014 Buy 42.60 37.00 15.1%
Alior Bank: 5y high: PLN 99.8 (16/10/2013), 5y low: PLN 46.3 (16/09/2016)Recommendation history23.10.2013 (Initiation date) Rating Target Price Prev. day's close Upside06.07.2016 Buy 68.10 51.65 31.8%07.04.2016 Buy 86.00 69.60 23.6%25.02.2016 Buy 76.00 61.26 24.1%04.12.2015 Buy 77.00 65.80 17.0%17.06.201527.04.2015 Buy 103.00 89.0031.03.2015 Buy 99.00 84.95 16.5%08.01.2015 Buy 95.00 76.30 24.5%22.10.2014 Buy 95.00 76.00 25.0%
OTP: 5y high: HUF 7530 (05/09/2016), 5y low: HUF 2798 (23/09/2011)Recommendation history01.02.2002 (Initiation date) Rating Target Price Prev. day's close Upside12.08.2016 Hold 7,600.00 6,979.00 8.9%06.07.201619.05.2016 Hold 7,000.00 6,800.0007.04.2016 Hold 7,000.00 6,890.00 1.6%23.02.2016 Hold 6,700.00 6,115.00 9.6%17.06.2015 Hold 5,900.00 5,421.00 8.8%24.02.2015 Buy 5,000.00 4,330.00 15.5%04.12.2014 Buy 4,550.00 3,970.00 14.6%
66
Disclaimer
Disclaimer Financial AnalysisResponsible for this publication: Raiffeisen Bank International AG („RBI“)
RBI is a credit institution according to §1 Banking Act (Bankwesengesetz) with the registered office Am Stadtpark 9, 1030 Vienna, Austria.
Raiffeisen RESEARCH is an organisational unit of RBI.
Supervisory authority: As a credit institution (acc. to § 1 Austrian Banking Act; Bankwesengesetz) Raiffeisen Bank International AG is subject to the supervision by the Austrian Financial Market Authority (FMA, Finanzmarktaufsicht) and the National Bank of Austria (OeNB, Oesterreichische Nationalbank). Addition-ally, RBI is subject to the supervision by the European Central Bank (ECB), which undertakes such supervision within the Single Supervisory Mechanism (SSM), which consists of the ECB and the national responsible authorities (Council Regulation (EU) No 1024/2013 - SSM Regulation). Unless set out herein explicitly otherwise, references to legal norms refer to norms enacted by the Republic of Austria.
This document is for information purposes and may not be reproduced or distributed to other persons without RBI’s permission. This document constitutes neither a solicitation of an offer nor a prospectus in the sense of the Austrian Capital Market Act (Kapitalmarktgesetz) or the Austrian Stock Exchange Act (Börsege-setz) or any other comparable foreign law. An investment decision in respect of a financial instrument, a financial product or an investment (all hereinafter “product”) must be made on the basis of an approved, published prospectus or the complete documentation for such a product in question, and not on the ba-sis of this document.
This document does not constitute a personal recommendation to buy or sell financial instruments in the sense of the Austrian Securities Supervision Act (Wertpa-pieraufsichtsgesetz). Neither this document nor any of its components shall form the basis for any kind of contract or commitment whatsoever. This document is not a substitute for the necessary advice on the purchase or sale of a financial instrument, a financial product or advice on an investment. In respect of the sale or purchase of one of the above mentioned products, your banking advisor can provide individualised advice suitable for investments and financial products.
This analysis is fundamentally based on generally available information and not on confidential information which the party preparing the analysis has ob-tained exclusively on the basis of his/her client relationship to a person.
Unless otherwise expressly stated in this publication, RBI deems all of the information to be reliable, but does not make any assurances regarding its accuracy and completeness.
In emerging markets, there may be higher settlement and custody risk as compared to markets with established infrastructure. The liquidity of stocks/financial instruments may be influenced, amongst others, by the number of market makers. Both of these circumstances can result in elevated risk in relation to the safety of investments made in consideration of the information contained in this document.
The information in this publication is current as per the latter’s creation date. It may be outdated by future developments, without the publication being changed.
Unless otherwise expressly stated (www.raiffeisenresearch.com/special_compensation), the analysts employed by RBI are not compensated for specific in-vestment banking transactions. Compensation of the author or authors of this report is based (amongst other things) on the overall profitability of RBI, which includes, inter alia, earnings from investment banking and other transactions of RBI. In general, RBI forbids its analysts and persons reporting to the analysts from acquiring securities or other financial instruments of any enterprise which is covered by the analysts, unless such acquisition is authorised in advance by RBI’s Compliance Department.
RBI has put in place the following organisational and administrative agreements, including information barriers, to impede or prevent conflicts of interest in re-lation to recommendations: RBI has designated fundamentally binding confidentiality zones. These are typically units within credit institutions, which are iso-lated from other units by organisational measures governing the exchange of information, because compliance-relevant information is continuously or tempo-rarily handled in these zones. Compliance-relevant information may fundamentally not leave a confidentiality zone and is to be treated as strictly confidential in internal business operations, including interaction with other units. This does not apply to the transfer of information necessary for usual business operations. Such transfer of information is limited, however, to what is absolutely necessary (need-to-know principle). The exchange of compliance-relevant information be-tween two confidentiality zones may only occur with the involvement of the Compliance Officer.
SPECIAL REGULATIONS FOR THE UNITED KINGDOM OF GREAT BRITAIN AND NORTHERN IRELAND (UK):
This document does not constitute either a public offer in the meaning of the Austrian Capital Market Act (Kapitalmarktgesetz; hereinafter „KMG“) nor a pro-spectus in the meaning of the KMG or of the Austrian Stock Exchange Act (Börsegesetz). Furthermore, this document does not intend to recommend the pur-chase or the sale of securities or investments in the meaning of the Austrian Supervision of Securities Act (Wertpapieraufsichtsgesetz). This document shall not replace the necessary advice concerning the purchase or the sale of securities or investments. For any advice concerning the purchase or the sale of securities of investments kindly contact your RAIFFEISENBANK. This publication has been either approved or issued by RBI in order to promote its investment business. Raif-feisen Bank International AG (“RBI”), London Branch is authorised by the Austrian Financial Market Authority and subject to limited regulation by the Financial Conduct Authority (“FCA”). Details about the extent of its regulation by the FCA are available on request. This publication is not intended for investors who are Retail Customers within the meaning of the FCA rules and shall therefore not be distributed to them. Neither the information nor the opinions expressed herein constitute or are to be construed as an offer or solicitation of an offer to buy (or sell) investments. RBI may have affected an Own Account Transaction within the meaning of FCA rules in any investment mentioned herein or related investments and/or may have a position or holding in such investments as a result. RBI may have been, or might be, acting as a manager or co-manager of a public offering of any securities mentioned in this report or in any related security.
SPECIFIC RESTRICTIONS FOR THE UNITED STATES OF AMERICA AND CANADA: This document may not be transmitted to, or distributed within, the United States of America or Canada or their respective territories or possessions, nor may it be distributed to any U.S. person or any person resident in Canada, unless it is provided directly through RB International Markets (USA) LLC (“RBIM”), a U.S. registered broker-dealer, and subject to the terms set forth below.
SPECIFIC INFORMATION FOR THE UNITED STATES OF AMERICA AND CANADA: This research document is intended only for institutional investors and is not subject to all of the independence and disclosure standards that may be applicable to research documents prepared for retail investors. This report was provided to you by RB International Markets (USA) LLC (RBIM), a U.S. registered broker-dealer, but was prepared by our non-U.S. affiliate Raiffeisen Bank In-ternational AG (RBI). Any order for the purchase or sale of securities covered by this report must be placed with RBIM. You can reach RBIM at 1133, Avenue of the Americas, 16th floor, New York, NY 10036, phone +1 212-600-2588. This document was prepared outside the United States by one or more analysts who may not have been subject to rules regarding the preparation of reports and the independence of research analysts comparable to those in effect in the United States. The analyst or analysts who prepared this research (i) are not registered or qualified as research analysts with the Financial Industry Regulatory Authority (“FINRA”) in the United States, and (ii) are not allowed to be associated persons of RBIM and are therefore not subject to FINRA regulations, includ-ing regulations related to the conduct or independence of research analysts.
The opinions, estimates and projections contained in this report are those of RBI only as of the date of this report and are subject to change without notice. The information contained in this report has been compiled from sources believed to be reliable by RBI, but no representation or warranty, express or implied, is made by RBI or its affiliated companies or any other person as to the report’s accuracy, completeness or correctness. Securities which are not registered in the United States may not be offered or sold, directly or indirectly, within the United States or to U.S. persons (within the meaning of Regulation S under the Secu-rities Act of 1933 [“the Securities Act”]), except pursuant to an exemption under the Securities Act. This report does not constitute an offer with respect to the purchase or sale of any security within the meaning of Section 5 of the Securities Act and neither shall this report nor anything contained herein form the ba-sis of, or be relied upon in connection with, any contract or commitment whatsoever. This report provides general information only. In Canada it may only be distributed to persons who are resident in Canada and who, by virtue of their exemption from the prospectus requirements of the applicable provincial or ter-ritorial securities laws, are entitled to conduct trades in the securities described herein.
EU REGULATION NO 833/2014 CONCERNING RESTRICTIVE MEASURES IN VIEW OF RUSSIA’S ACTIONS DESTABILISING THE SITUATION IN UKRAINE
Please note that research is done and recommendations are given only in respect of financial instruments which are not affected by the sanctions under EU reg-ulation no 833/2014 concerning restrictive measures in view of Russia’s actions destabilising the situation in Ukraine, as amended from time to time, i.e. fi-nancial instruments which have been issued before 1 August 2014.
We wish to call to your attention that the acquisition of financial instruments with a term exceeding 30 days issued after 31 July 2014 is prohibited under EU regulation no 833/2014 concerning restrictive measures in view of Russia’s actions destabilising the situation in Ukraine, as amended from time to time. No opinion is given with respect to such prohibited financial instruments.
INFORMATION REGARDING THE PRINCIPALITY OF LIECHTENSTEIN: COMMISSION DIRECTIVE 2003/125/EC of 22 December 2003 implementing Direc-tive 2003/6/EC of the European Parliament and of the Council as regards the fair presentation of investment recommendations and the disclosure of conflicts of interest has been incorporated into national law in the Principality of Liechtenstein by the Finanzanalyse-Marktmissbrauchs-Verordnung.
If any term of this Disclaimer is found to be illegal, invalid or unenforceable under any applicable law, such term shall, insofar as it is severable from the re-maining terms, be deemed omitted from this Disclaimer. It shall in no way affect the legality, validity or enforceability of the remaining terms.

67
Imprint
ImprintInformation requirements pursuant to the Austrian E-Commerce Act
Raiffeisen Bank International AG
Registered Offi ce: Am Stadtpark 9, 1030 Vienna
Postal address: 1010 Vienna, POB 50
Phone: +43-1-71707-0 Fax: + 43-1-71707-1848
Company Register Number: FN 122119m at the Commercial Court of Vienna
VAT Identifi cation Number: UID ATU 57531200
Austrian Data Processing Register: Data processing register number (DVR): 4002771
S.W.I.F.T.-Code: RZBA AT WW
Supervisory Authorities: As a credit institution (acc. to § 1 Austrian Banking Act; Bankwesengesetz) Raiffeisen Bank International AG is subject to the supervision by the Austrian Financial Market Authority (FMA, Finanzmarktaufsicht) and the National Bank of Austria (OeNB, Oesterreichische Nationalbank). Additionally, RBI is subject to the supervision by the European Central Bank (ECB), which undertakes such supervision within the Single Supervisory Mechanism (SSM), which consists of the ECB and the national responsible authorities (Council Regulation (EU) No 1024/2013 - SSM Regulation). Unless set out herein explicitly otherwise, references to legal norms refer to norms enacted by the Republic of Austria..
Membership: Austrian Federal Economic Chamber, Federal Bank and Insurance Sector, Raiffeisen Association
Statement pursuant to the Austrian Media Act
Publisher and editorial offi ce of this publication: Raiffeisen Bank International AG, Am Stadtpark 9, A-1030 Vienna
Media Owner of this publication: Raiffeisen RESEARCH – Verein zur Verbreitung von volkswirtschaftlichen Analysen und Finanzmarktana-lysen, Am Stadtpark 9, A-1030 Vienna
Executive Committee of Raiffeisen RESEARCH – Verein zur Verbreitung von volkswirtschaftlichen Analysen und Finanzmarktanalysen:
Mag. Peter Brezinschek (Chairman), Mag. Helge Rechberger (Vice-Chairman)
Raiffeisen RESEARCH – Verein zur Verbreitung von volkswirtschaftlichen Analysen und Finanzmarktanalysen is constituted as state-
registered society. Purpose and activity are (inter alia), the distribution of analysis, data, forecasts and reports and similar publications
related to the Austrian and international economy as well as fi nancial markets.
Basic tendency of the content of this publication
Presentation of activities of Raiffeisen Bank International AG and its subsidiaries in the area of conducting analysis related to the Austrian and international economy as well as the financial markets.
Publishing of analysis according to various methods of analyses covering economics, interest rates and currencies, government and
corporate bonds, equities as well as commodities with a regional focus on the euro area Producer of this publication: Holzer Druck, 1100 Vienna, Buchengasse 79
Cut-off for data: 21 September 2016 / Cover photo: Peter Brezinschek / Design: Kathrin Koøinek, Birgit Bachhofner
Editor: Andreas Schwabe, CFA, RBI Vienna; Completed: 30 September 2016, 8:00 AM CEST; First dissemination: 3 Oct 2016, 9:30 PM CEST
Completed in German language: 27/09/2016, 1:00 PM CEST; First dissemination in German language: 28/09/2016, 12:00 AM CEST
Detailed disclosure and disclaimer on the aforementioned companies as well as on the „coverage universe“ of Raiffeisen Centrobank pursuant to § 48 Stock Exchange Act: http://www.rcb.at.https://www.rcb.at/index.php?id=869&L=1
Österreich: Raiffeisen Bank International AG (RBI AG)
Research Sales and Operations (RSOP)Werner Weingraber (Head)Birgit BachhofnerBjörn ChybaKathrin KoøinekAndreas MannsparthAleksandra SrejicMarion StadlerMartin Stelzeneder, FA*Arno Supper Marion Wannenmacher
Retail Research ManagerVeronika Lammer, FA* Helge Rechberger, FA*
Market Strategy / Quant ResearchValentin Hofstätter, FA* (Head)Florian Acker, FA*Judith Galter, FA* Christian Hinterwallner, FA* Thomas Keil, FA*Christoph Klaper, FA*Dagmar König, FA*Nina Neubauer-Kukiæ, FA* Andreas Schiller, FA*
Robert Schittler, FA* Stefan Theußl, FA*
Economics / Fixed Income / FX ResearchGunter Deuber, FA* (Head)Jörg Angelé, FA*Wolfgang Ernst, FA* Stephan Imre, FA*Lydia Kranner, FA*Patrick Krizan, FA*Matthias Reith, FA*Elena Romanova, FA*Andreas Schwabe, FA* Gintaras Shlizhyus, FA*Gottfried Steindl, FA* Martin Stelzeneder, FA*
Equity Company ResearchConnie Gaisbauer, FA* (Head)Aaron Alber, FA*Hannes Loacker, FA*Johannes Mattner, FA*Christine Nowak, FA* Leopold Salcher, FA* Christoph Vahs, FA*
Credit Company Research Jörg Bayer, FA* (Head)Eva-Maria Grosse, FA*Michael Heller, FA*Martin Kutny, FA*Stefan Memmer, FA* Werner Schmitzer, FA*Jürgen Walter, FA*
Company Research: Raiffeisen Centrobank AGStefan Maxian, FA* (Head)
Christian Bader, FA*Oleg Galbur, FA*Jakub Krawczyk, FA*Bernd Maurer, FA*Dominik Niszcz, FA*Markus Remis, FA*Teresa Schinwald, FA*Jovan Sikimic, FA*Arno Supper, FA*
Albania: Raiffeisen Bank Sh.A.Joan Canaj, FA*Valbona Gjeka, FA*
Belarus: Priorbank Open Joint-Stock CompanyOleg Leontev, FA*Vasily Pirogovsky, FA*Olga Laschevskaya, FA*Natalya Chernogorova, FA*
Bosnia & Herzegovina: Raiffeisen Bank dd Bosna i HercegovinaIvona Zametica, FA*Srebrenko Fatusic, FA*
Bulgaria: Raiffeisenbank (Bulgaria) Sole-owned Joint Stock CompanyEmil S. Kalchev, FA*
Croatia: Raiffeisenbank Austria d.d.Zrinka Zivkovic Matijevic, FA*Nada Harambasic-Nereau, FA*Marijana Cigic, FA*Elizabeta Sabolek-Resano-vic, FA*Tomislava Ujevic, FA* Ana Turudic, FA*
Czech Republic: Raiffeisen-bank a.s.Helena Horska, FA*Monika Junicke, FA*Daniela Miluèka, FA*Lenka Kalivodova, FA*
Hungary: Raiffeisen Bank Zrt.Zoltán Török, FA*Gergely Pálffy, FA*Levente Blahó, FA*
Kosovo: Raiffeisen Bank Kosovo J.S.C.Arta Kastrati, FA*Antigona Limani, FA*
Poland: Raiffeisen Bank Polska S.A.Marta Petka-Zagajewska, FA*Mateusz Namysl, FA*
Romania: RAIFFEISEN BANK S.A.Ionut Dumitru, FA*Nicolae Covrig, FA* Alexandru Combei, FA*Iuliana Mocanu, FA*Catalin Diaconu, FA*Silvia Rosca, FA*
Russia: AO Raiffeisenbank AustriaAnastasia Baykova, FA*Denis Poryvay, FA*Anton Pletenev, FA*Konstantin Yuminov, FA*Sergey Libin, FA*Andrey Polischuk, FA*Fedor Kornachev, FA*Natalia Kolupaeva, FA*Stanislav Murashov, FA*
Serbia: Raiffeisen banka a.d. BeogradLjiljana Grubic, FA*
Slovakia: Tatra banka, a.s.Robert Prega, FA*Juraj Valachy, FA*Boris Fojtik, FA*
Ukraine: Raiffeisen Bank Aval Public Joint Stock CompanySergii Drobot, FA*
* FA ... Financial analyst
Global Raiffeisen RESEARCH Team: Peter Brezinschek (Head)
Company: Disclosure:Agrana 3,5,22EVN 3,22Polytec 3,5,22
Company: Disclosure:PKN -InterRAO -
Raiffeisen Bank International AG
Institutional Equity Sales, Vienna Klaus della Torre Tel: +43 1 515 20 472
Merger & AquisitionsKlaus Imhof Tel: +43 1 51520-770
Raiffeisen CENTROBANK AG
Commercial banks
International Desk
CEO Susanne Höllinger Tel.: +43 1 534 51 333
Director Private Banking (Austria)Alexander Firon Tel.: +43 1 534 51 213
Director Private Banking (RUS/CIS)William Sinclair Tel.: +43 1 534 51 231
EO
Director Private Banking (CE/SEE)Krisztian Slanicz Tel.: +43 1 534 51 603
Institutional Clients Herwig Wolf Tel.: +43 1 534 51 261
Kathrein Privatbank Aktiengesellschaft
Raiffeisen Bank International AGGroup Capital Markets: Nicolaus Hagleitner Tel.: +431 71707-1467Investmentbanking Products: Marcus Offenhuber Tel.: +431 71707-1147Investmentbanking Products: Matthias Renner Tel.: +431 71707-2123
RB International Markets (USA) LCCStefan Gabriele Tel.: +1 212 835 2328
AL: Raiffeisen Bank Sh.a.Mirela Borici Tel.: +355 4 2381000-1074
BH: Raiffeisen Bank d.d. Bosna i HercegovinaReuf Sulejmanovic Tel.: +387 33 287-449
BG: Raiffeisenbank (Bulgaria) EADBoyan Petkov Tel.: +359 2 91985-635
BY: Priorbank JSCTreasury: Svetlana N Gulkovich Tel.: +375 17 2899080Investmentbanking: Oleg Leontev Tel.: +375 17 2899251
CZ: Raiffeisenbank a.s.Milan Fischer Tel.: +420 234 40-1145
HR: Raiffeisenbank Austria d.d.Robert Mamic Tel.: +385 1 4695-076
HU: Raiffeisen Bank Zrt.Gabor Liener Tel.: +36 1 484-4304
KO: Raiffeisen Bank Kosovo J.S.C.Berat Isa Tel.: +381 38 222222 229
PL: Raiffeisen Bank Polska S.A.Miroslaw Winiarsczyk Tel.: +48 22 585 3710
RO: Raiffeisen Bank S.A.Aurelian Mihailescu Tel.: +40 21 3061221
RU: AO RaiffeisenbankCapital Markets: Sergey Shchepilov Tel.: +7 495 721 9977Investmentbanking: Oleg Gordienko Tel.: +7 495 721 9900
SI: Raiffeisen Banka d.d.Marko Stolica Tel.: +386 22293183
SK: Tatra banka, a.s. Peter Augustin Tel.: +421 2 5919-1313
SR: Raiffeisen banka a.d. Branko Novakovic Tel.: +381 11 2207131
UA: Raiffeisen Bank Aval Vladimir Kravchenko Tel.: +380 44 49542 20
Markets & Investment Banking
Raiffeisen Bank International AG, ViennaCorporate Customers: Joseph Eberle Tel.: +43 1 71707 1487Financial Institutions: Axel Summer Tel.: +43 1 71707 1476
RBI London BranchMatthias Renner Tel.: +44 20 7933 8001Graham Page Tel.: +44 20 7933 8108
RBI Beijing Branch Terence Lee Tel.: +86 10 8531-9007
RBI Singapore BranchKlaus Krombass Tel.: +65 6305 6024
AL: Raiffeisen Bank Sh.a.Jorida Zaimi Tel.: +355 4 2381 445 2865
AT: Raiffeisen Bank International AGRudolf Lercher Tel.: +43 1 71707 3537
BH: Raiffeisen Bank d.d. Bosna i HercegovinaVildana Sijamhodzic Tel.: +387 33 287 283
BG: Raiffeisenbank (Bulgaria) EADIrena Krentcheva Tel.: +359 2 9198 5826
BY: Priorbank JSCOksana Alekseychenko P: +375 17 289 9453
CZ: Raiffeisenbank a.s.Roman Lagler Tel.: +420 234 40 1728
HR: Raiffeisenbank Austria d.d.Wolfgang Woehry Tel.: +385 1 4566 462
HU: Raiffeisen Bank Zrt.Lászlo Volosinovsky Tel.: +36 1 484 4639
KO: Raiffeisen Bank Kosovo J.S.C.Valerija Mustafa Tel.: +381 38 22 22 22 255
PL: Raiffeisen Bank Polska S.A.Krzysztof Lubkiewicz Tel.: +48 22 585 2534
RO: Raiffeisen Bank S.A.Aurel Voicescu Tel.: +40 764 601 847
RU: AO RaiffeisenbankMaria Maevskaya Tel.: +7 495 775 5230
SI: Raiffeisen Banka d.d.Simona Vizintin Tel.: +386 2 22 93 159
SK: Tatra banka, a.s. Mirco Ribis Tel.: +421 2 5919 1846
SR: Raiffeisen banka a.d.Sofija Davidovic Tel.: +381 11 220 7807
UA: Raiffeisen Bank Aval Andreas Kettlgruber Tel.: +38 044 495 41 10