“CCC CCCC ”””” SSSS BBBB &&&& MMMM EEEE HHHH ... and ethnic minorities... · EEEEthnic...
50
“CONNECTING ONNECTING ONNECTING ONNECTING COMMUNITIES OMMUNITIES OMMUNITIES OMMUNITIES” Southampton outhampton outhampton outhampton’s ’s ’s ’s Black lack lack lack & Minority inority inority inority Ethnic thnic thnic thnic Housing ousing ousing ousing Needs eeds eeds eeds Research esearch esearch esearch 2006 2006 2006 2006
Transcript of “CCC CCCC ”””” SSSS BBBB &&&& MMMM EEEE HHHH ... and ethnic minorities... · EEEEthnic...
““““CCCCONNECTINGONNECTINGONNECTINGONNECTING CCCCOMMUNITIESOMMUNITIESOMMUNITIESOMMUNITIES”””” SSSSouthamptonouthamptonouthamptonouthampton’s’s’s’s BBBBlacklacklacklack &&&& MMMMinorityinorityinorityinority
EEEEthnicthnicthnicthnic HHHHousingousingousingousing NNNNeedseedseedseeds RRRResearchesearchesearchesearch 2006200620062006
Shelina Permalloo Final Draft: 04.08.06
2
RRRResearching the HHHHousing NNNNeeds &&&& AAAAspirations of the BBBBlack & MMMMinority
EEEEthnic CCCCommunities in SSSSouthampton
Written Written Written Written &&&& Compiled by Compiled by Compiled by Compiled by
Shelina Permalloo Shelina Permalloo Shelina Permalloo Shelina Permalloo
On behalf of Southampton’s Housing Partnership:
Shelina Permalloo Final Draft: 04.08.06
3
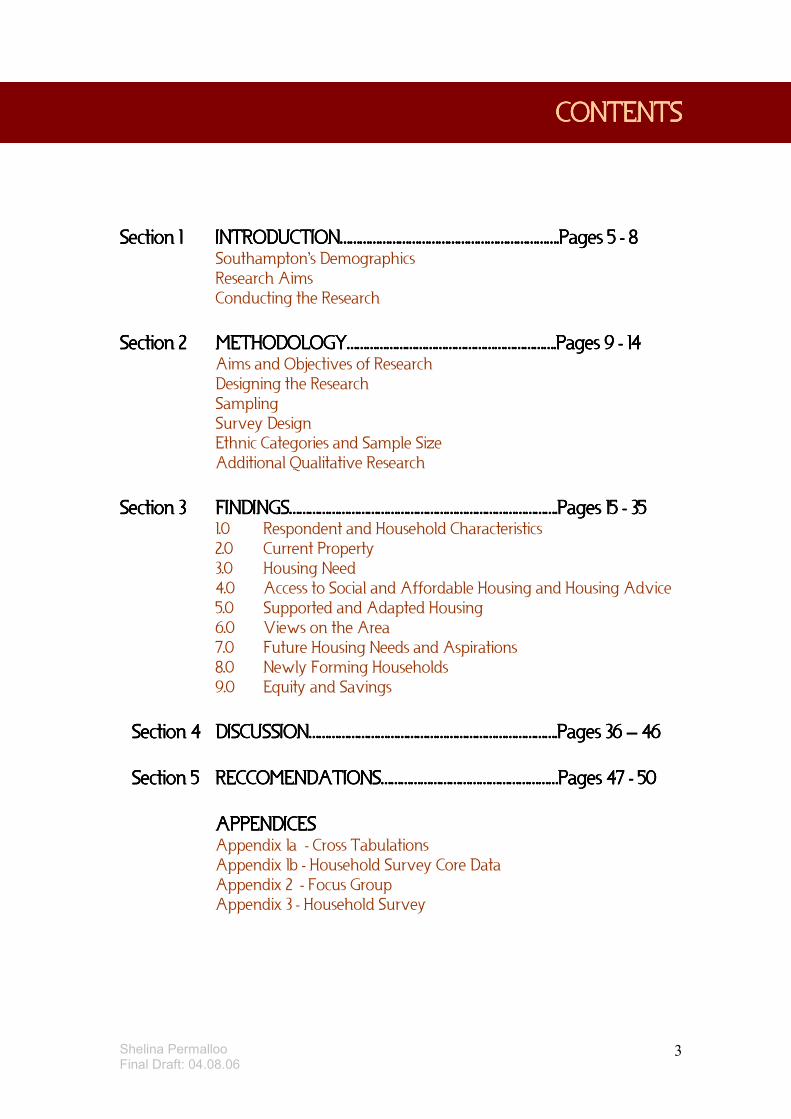
CONTENTSCONTENTSCONTENTSCONTENTS
Section 1Section 1Section 1Section 1 INTRODUCTION………………………………………………………….Pages 5 INTRODUCTION………………………………………………………….Pages 5 INTRODUCTION………………………………………………………….Pages 5 INTRODUCTION………………………………………………………….Pages 5 ---- 8 8 8 8 Southampton’s Demographics Research Aims Conducting the Research
SeSeSeSection 2ction 2ction 2ction 2 METHODOLOGY……………………………………………………….Pages 9 METHODOLOGY……………………………………………………….Pages 9 METHODOLOGY……………………………………………………….Pages 9 METHODOLOGY……………………………………………………….Pages 9 ---- 14 14 14 14 Aims and Objectives of Research Designing the Research Sampling Survey Design Ethnic Categories and Sample Size Additional Qualitative Research
Section 3Section 3Section 3Section 3 FINDINGS………………………………………………………………………FINDINGS………………………………………………………………………FINDINGS………………………………………………………………………FINDINGS……………………………………………………………………….Pages 15 .Pages 15 .Pages 15 .Pages 15 ---- 35 35 35 35
1.0 Respondent and Household Characteristics 2.0 Current Property 3.0 Housing Need 4.0 Access to Social and Affordable Housing and Housing Advice 5.0 Supported and Adapted Housing 6.0 Views on the Area 7.0 Future Housing Needs and Aspirations 8.0 Newly Forming Households 9.0 Equity and Savings
Section 4Section 4Section 4Section 4 DISCUSSION………………………………………………………………….Pages 36 DISCUSSION………………………………………………………………….Pages 36 DISCUSSION………………………………………………………………….Pages 36 DISCUSSION………………………………………………………………….Pages 36 –––– 46 46 46 46
Section 5Section 5Section 5Section 5 RECCOMENDATIONS………………………………………………Pages 47 RECCOMENDATIONS………………………………………………Pages 47 RECCOMENDATIONS………………………………………………Pages 47 RECCOMENDATIONS………………………………………………Pages 47 ---- 50 50 50 50
APPENDICESAPPENDICESAPPENDICESAPPENDICES Appendix 1a - Cross Tabulations Appendix 1b - Household Survey Core Data Appendix 2 - Focus Group Appendix 3 - Household Survey

Shelina Permalloo Final Draft: 04.08.06
4
INTRODUCTIONINTRODUCTIONINTRODUCTIONINTRODUCTION
Section 1 Section 1 Section 1 Section 1
Shelina Permalloo Final Draft: 04.08.06
5
INTRODUCTIONINTRODUCTIONINTRODUCTIONINTRODUCTION
Southampton’s Housing Partnership comprises of the following members; First Atlantic Housing Group, Hyde Housing Association, Raglan Housing Association, Southampton City Council, Swaythling Housing Association, and Western Challenge Housing Association. Southampton’s Housing Partnership applied for a Community Training and Enabling Grant (CTEG) from the Housing Corporation (HC) in order to joint fund a project to promote race equality within social housing across the City. The grant application was successful and Southampton’s Black and Minority Ethnic (BME) Housing Project began in October 2004. Swaythling Housing Society housed the project worker on behalf of the partnership. Southampton’s Housing Project was funded to support the active involvement of BME communities in Registered Social Landlord (RSL) development, community and tenant participation, regeneration strategies, increased BME employment across the social housing sector within the city, increased BME representation on both board level and working groups operating within the social and affordable housing sector, and finally to set up an independent BME housing steering group who would be a sounding board for all BME housing issues across the City. A project worker was employed for 2 years to support the work of the steering group, and to conduct research that would provide evidence of Southampton’s BME housing circumstances. As the second major piece of BME housing research conducted in the City it was imperative that the research be robust and comprehensive to ensure that Southampton’s social housing sector would be able to meet the needs of this diverse BME community.
Shelina Permalloo Final Draft: 04.08.06
6
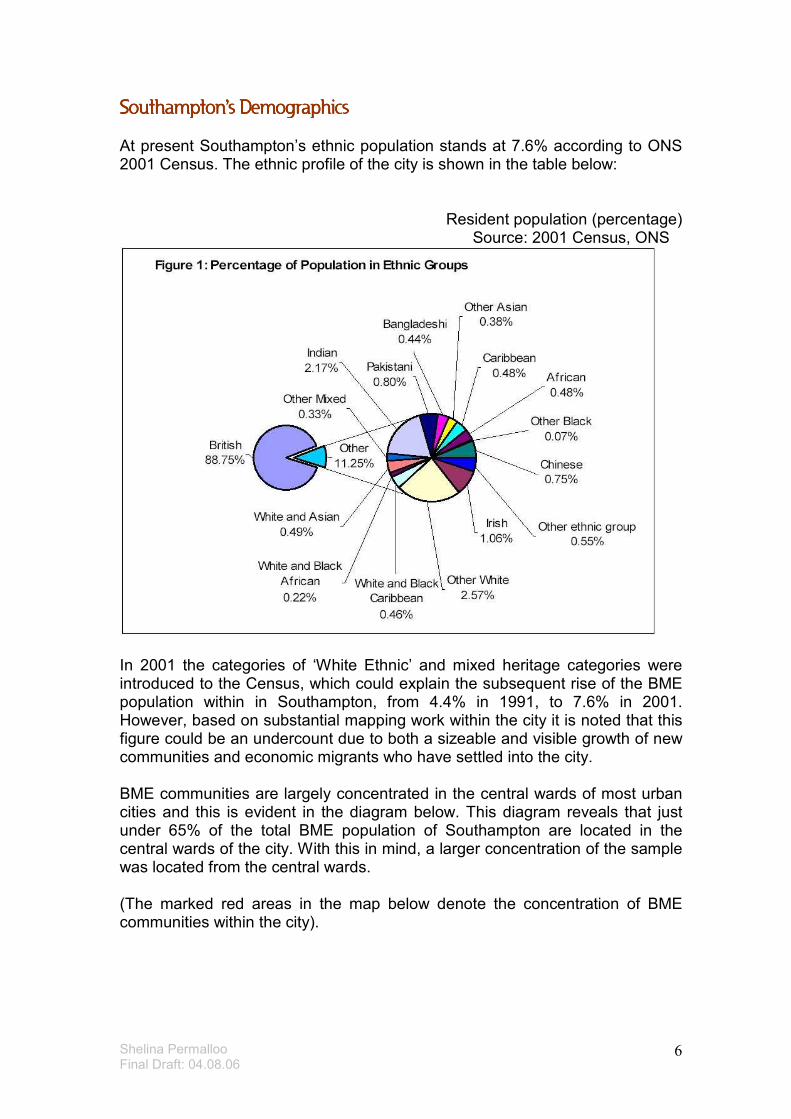
Southampton’s DemographicsSouthampton’s DemographicsSouthampton’s DemographicsSouthampton’s Demographics At present Southampton’s ethnic population stands at 7.6% according to ONS 2001 Census. The ethnic profile of the city is shown in the table below:
Resident population (percentage) Source: 2001 Census, ONS
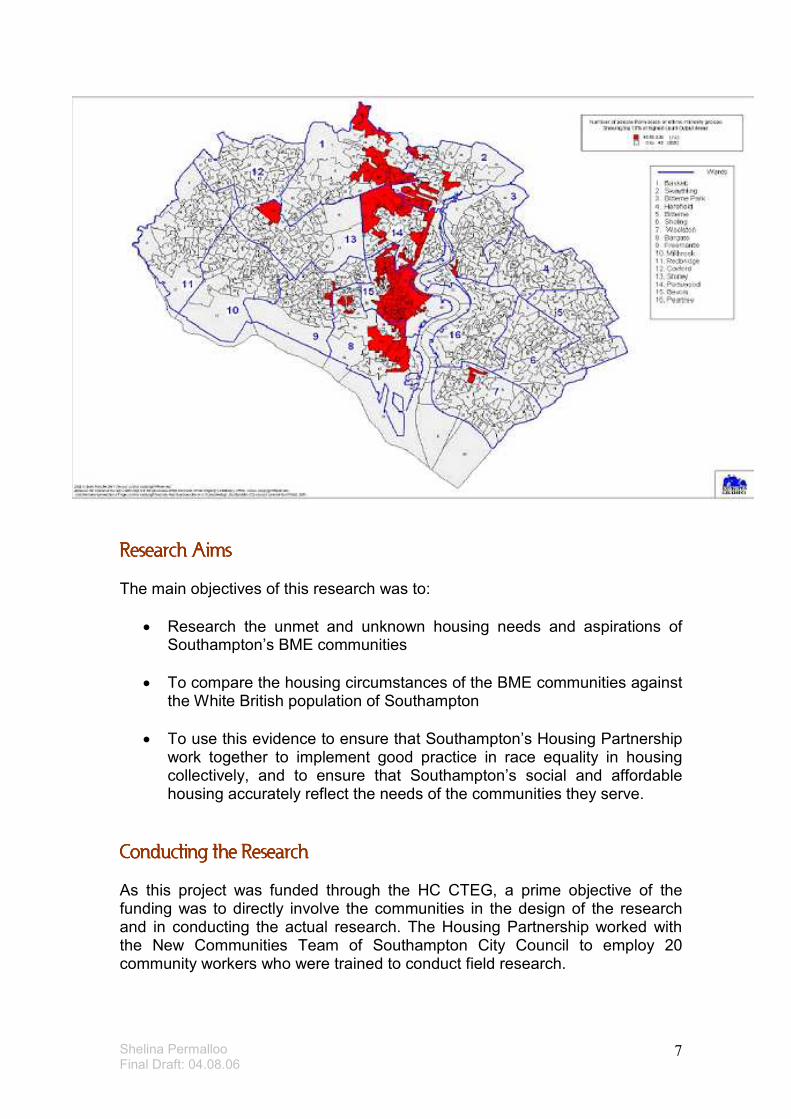
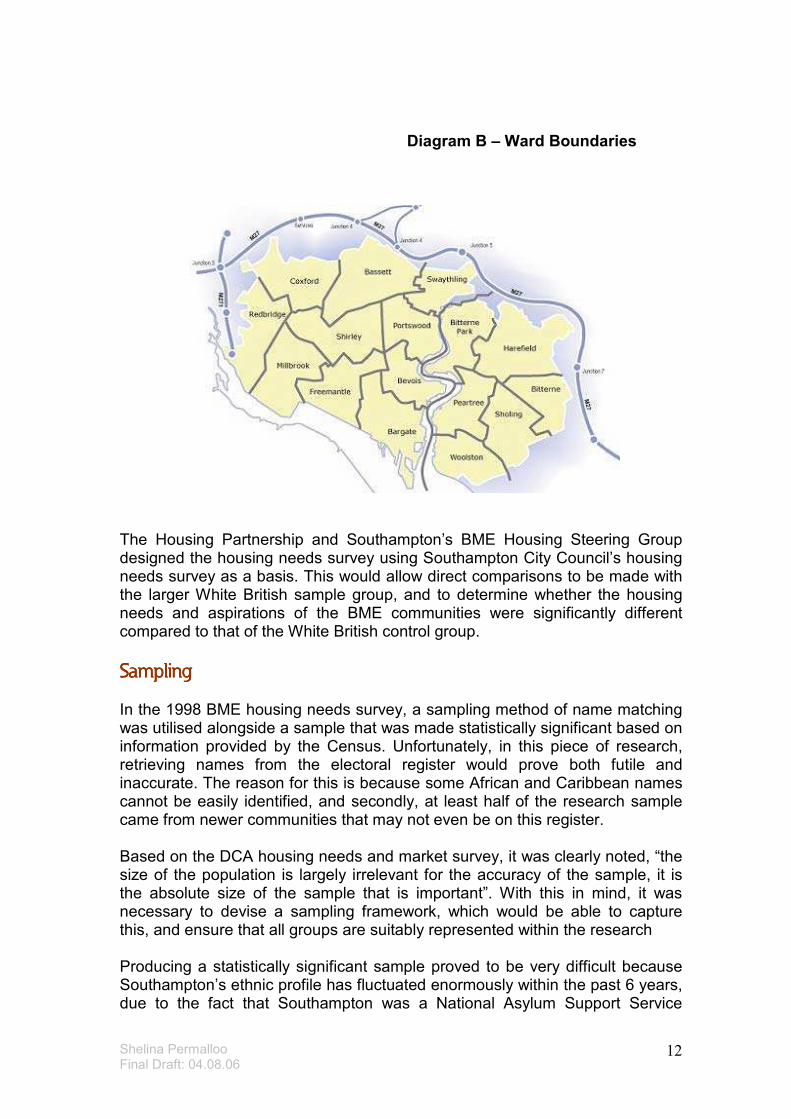
In 2001 the categories of ‘White Ethnic’ and mixed heritage categories were introduced to the Census, which could explain the subsequent rise of the BME population within in Southampton, from 4.4% in 1991, to 7.6% in 2001. However, based on substantial mapping work within the city it is noted that this figure could be an undercount due to both a sizeable and visible growth of new communities and economic migrants who have settled into the city. BME communities are largely concentrated in the central wards of most urban cities and this is evident in the diagram below. This diagram reveals that just under 65% of the total BME population of Southampton are located in the central wards of the city. With this in mind, a larger concentration of the sample was located from the central wards. (The marked red areas in the map below denote the concentration of BME communities within the city).
Shelina Permalloo Final Draft: 04.08.06
7
Research AimsResearch AimsResearch AimsResearch Aims The main objectives of this research was to:
• Research the unmet and unknown housing needs and aspirations of Southampton’s BME communities
• To compare the housing circumstances of the BME communities against the White British population of Southampton
• To use this evidence to ensure that Southampton’s Housing Partnership work together to implement good practice in race equality in housing collectively, and to ensure that Southampton’s social and affordable housing accurately reflect the needs of the communities they serve.
Conducting the ResearchConducting the ResearchConducting the ResearchConducting the Research As this project was funded through the HC CTEG, a prime objective of the funding was to directly involve the communities in the design of the research and in conducting the actual research. The Housing Partnership worked with the New Communities Team of Southampton City Council to employ 20 community workers who were trained to conduct field research.
Shelina Permalloo Final Draft: 04.08.06
8
The research was conducted in two phases to ensure that everyone would be represented in the research. The first phase comprised of 674 BME household surveys, which began in January 2006 and ended in March 2006, and the second phase comprised of seven additional qualitative focus groups that were all completed in April 2006. Using the results of Southampton City Council’s housing needs and market study conducted by David Couttie Associates (DCA) direct comparisons can be drawn with the larger White British sample of the city. Using this study as a base we are able to determine the difference in housing circumstances between Southampton’s BME communities and the White British community.
Shelina Permalloo Final Draft: 04.08.06
9
METHODOLOGYMETHODOLOGYMETHODOLOGYMETHODOLOGY
Section 2Section 2Section 2Section 2
Shelina Permalloo Final Draft: 04.08.06
10
SURVEY METHODOLOGYSURVEY METHODOLOGYSURVEY METHODOLOGYSURVEY METHODOLOGY
Aims and Objectives of ResearchAims and Objectives of ResearchAims and Objectives of ResearchAims and Objectives of Research Prior to 2006 a BME housing needs survey was conducted in 1998 in partnership with Raglan Housing Association, Presentation Housing Association and Southampton City Council. This was the first report of its kind within the City. Due to recent migration trends including the prominence of asylum-seeking communities and economic migrants, it was imperative to provide Southampton’s Housing Partnership with a holistic and accurate picture of current housing needs and aspirations of Southampton’s BME communities in order to inform the housing strategy 2007 – 2012. Southampton’s Housing Partnership wanted to produce research that would be able to capture both the unmet and unknown housing aspirations of the BME communities within Southampton. This research needed to cover both the traditionally established BME communities of the City, and also the newer BME communities, which included both asylum and refugee communities and economic migrants. The key aim of the research is to use the evidence obtained to develop a city- wide housing strategy and action plan, which will enable the housing partnership to work together strategically to improve race equality within social housing in the city. The information provided will also inform the Council’s housing strategy and provide an evidence base for developing social and affordable housing units across the city.
Designing the ResearchDesigning the ResearchDesigning the ResearchDesigning the Research The traditional approach when conducting housing needs studies is to employ a market research company to conduct the research. However, it has been noted to be more beneficial if members of the local BME community are involved in the field research. Benefits for the research are: increasing the opportunity for members of the local community to engage in flexible employment, increase the direct involvement of members of the BME communities in both the process and the outcome of the research, and finally, to allow individuals to develop new skills and experience. Working in partnership with the New Communities Team of Southampton City Council, 24 community workers were employed and trained in conducting field research. The workers derived from a variety of BME backgrounds, and had the skills to be able to speak more than one community language as detailed in diagram A. The research method of snowballing was adopted which is a research method used in qualitative research to target remote or hidden communities. This is achieved through existing research subjects recruiting from a circle of aquaintances, thus creating a rolling snowball effect causing the sample population to increase. This method was advantageous due to the fact
Shelina Permalloo Final Draft: 04.08.06
11
that some communities comprised of both legal and illegal migrants, and in order to gain accurate information about the composition of the groups being researched, it was essential that the workers employed were both recognised, and trusted within the communities that they were a part of.
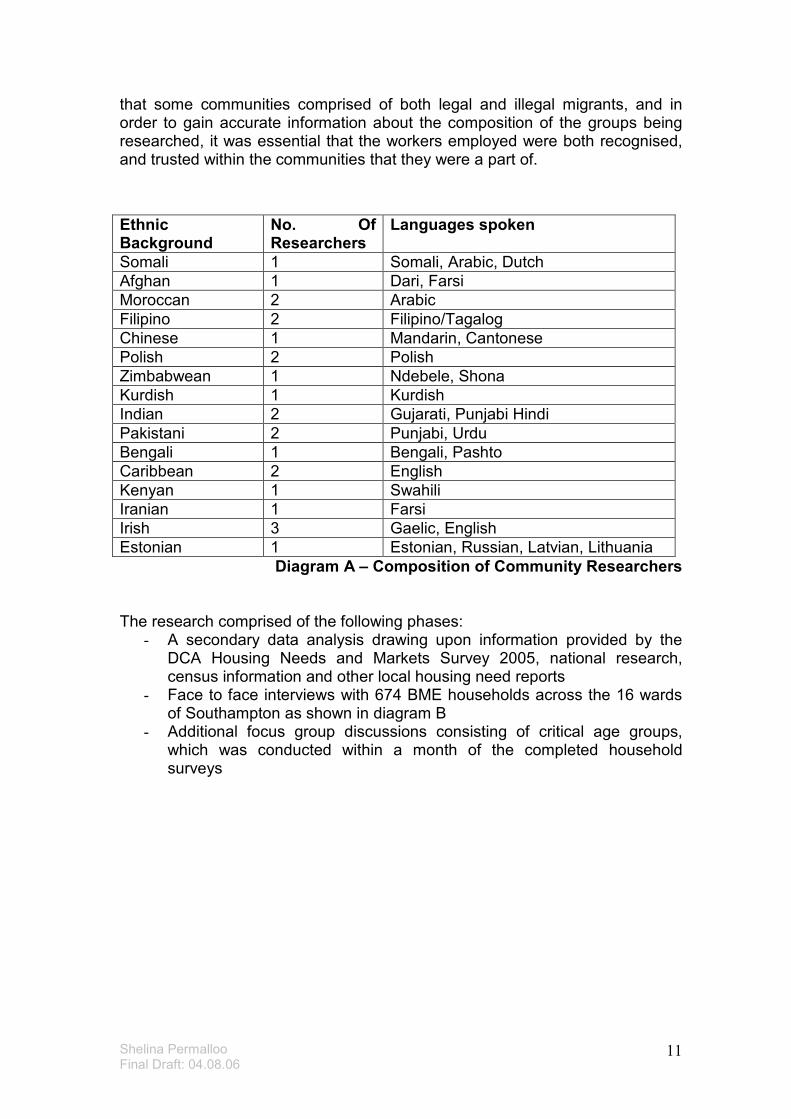
Diagram A – Composition of Community Researchers The research comprised of the following phases: - A secondary data analysis drawing upon information provided by the
DCA Housing Needs and Markets Survey 2005, national research, census information and other local housing need reports
- Face to face interviews with 674 BME households across the 16 wards of Southampton as shown in diagram B
- Additional focus group discussions consisting of critical age groups, which was conducted within a month of the completed household surveys
Ethnic Background
No. Of Researchers
Languages spoken
Somali 1 Somali, Arabic, Dutch
Afghan 1 Dari, Farsi
Moroccan 2 Arabic
Filipino 2 Filipino/Tagalog
Chinese 1 Mandarin, Cantonese
Polish 2 Polish
Zimbabwean 1 Ndebele, Shona
Kurdish 1 Kurdish
Indian 2 Gujarati, Punjabi Hindi
Pakistani 2 Punjabi, Urdu
Bengali 1 Bengali, Pashto
Caribbean 2 English
Kenyan 1 Swahili
Iranian 1 Farsi
Irish 3 Gaelic, English
Estonian 1 Estonian, Russian, Latvian, Lithuania
Shelina Permalloo Final Draft: 04.08.06
12
Diagram B – Ward Boundaries
The Housing Partnership and Southampton’s BME Housing Steering Group designed the housing needs survey using Southampton City Council’s housing needs survey as a basis. This would allow direct comparisons to be made with the larger White British sample group, and to determine whether the housing needs and aspirations of the BME communities were significantly different compared to that of the White British control group.
SamplingSamplingSamplingSampling In the 1998 BME housing needs survey, a sampling method of name matching was utilised alongside a sample that was made statistically significant based on information provided by the Census. Unfortunately, in this piece of research, retrieving names from the electoral register would prove both futile and inaccurate. The reason for this is because some African and Caribbean names cannot be easily identified, and secondly, at least half of the research sample came from newer communities that may not even be on this register. Based on the DCA housing needs and market survey, it was clearly noted, “the size of the population is largely irrelevant for the accuracy of the sample, it is the absolute size of the sample that is important”. With this in mind, it was necessary to devise a sampling framework, which would be able to capture this, and ensure that all groups are suitably represented within the research Producing a statistically significant sample proved to be very difficult because Southampton’s ethnic profile has fluctuated enormously within the past 6 years, due to the fact that Southampton was a National Asylum Support Service
Shelina Permalloo Final Draft: 04.08.06
13
(NASS) distribution area, and also with the recently arriving economic migrants. In consultation with both the public sector and voluntary and community organisations, an accurate figure of the total number of BME groups was difficult to ascertain. Hence, in order to get over this obstacle it was decided that for each significant ethnic group, a target sample size of 50 completed household interviews was agreed, regardless of the apparent size of the community. The field workers had to ensure that the sample they provided was diverse in terms of age and gender, and that the households covered as many of the 16 wards of the City. However, at this point it must noted that some communities only cover 1 partnership area, and may comprise only of men aged between 18 – 35. Therefore, as far as possible, diversity was sought.
Survey DesignSurvey DesignSurvey DesignSurvey Design The household survey was designed in 7 sections using a statistical software package called SNAP. A full version of the household survey can be found in the appendices attached.
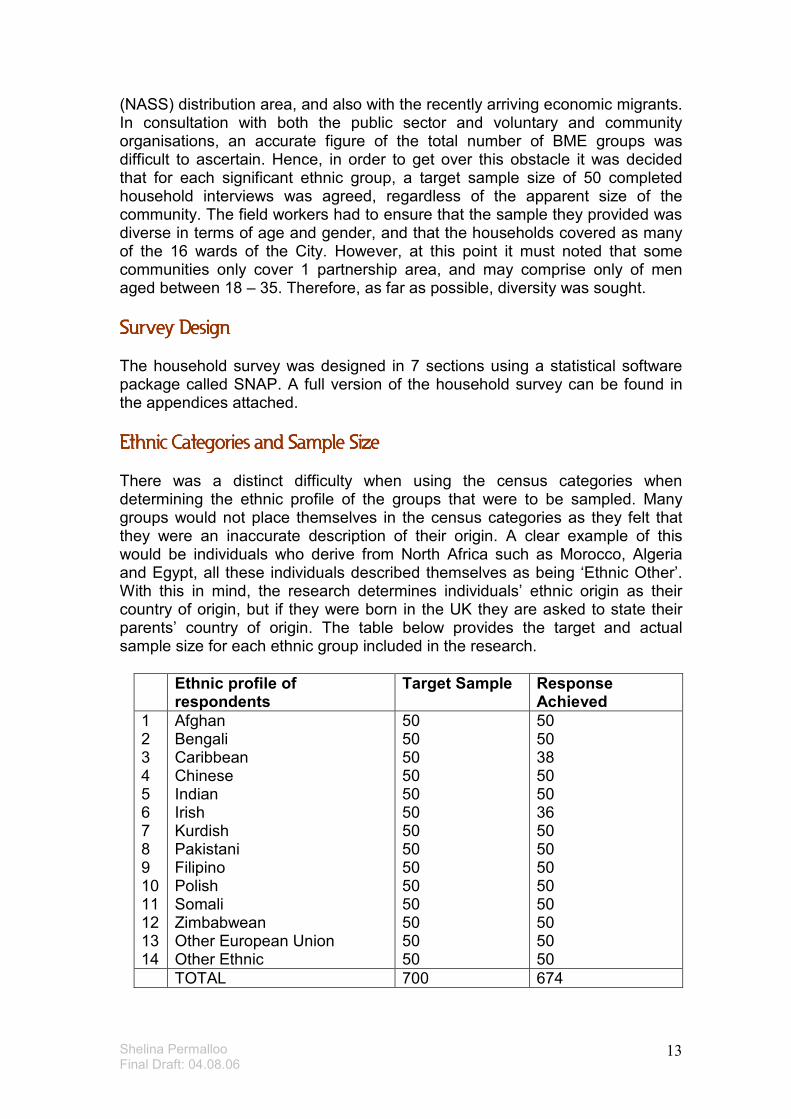
Ethnic Categories and Sample SizeEthnic Categories and Sample SizeEthnic Categories and Sample SizeEthnic Categories and Sample Size There was a distinct difficulty when using the census categories when determining the ethnic profile of the groups that were to be sampled. Many groups would not place themselves in the census categories as they felt that they were an inaccurate description of their origin. A clear example of this would be individuals who derive from North Africa such as Morocco, Algeria and Egypt, all these individuals described themselves as being ‘Ethnic Other’. With this in mind, the research determines individuals’ ethnic origin as their country of origin, but if they were born in the UK they are asked to state their parents’ country of origin. The table below provides the target and actual sample size for each ethnic group included in the research.
Ethnic profile of respondents
Target Sample Response Achieved
1 2 3 4 5 6 7 8 9 10 11 12 13 14
Afghan Bengali Caribbean Chinese Indian Irish Kurdish Pakistani Filipino Polish Somali Zimbabwean Other European Union Other Ethnic
50 50 50 50 50 50 50 50 50 50 50 50 50 50
50 50 38 50 50 36 50 50 50 50 50 50 50 50
TOTAL 700 674
Shelina Permalloo Final Draft: 04.08.06
14
The overall achieved response rate was 96.3%, however there was some difficulty in obtaining the target sample size for both the Irish and Caribbean community. This is similar to the response provided in the 1998 BME household study, where the Caribbean community had a low response rate due to perceived lack of benefit for being involved in the study. There is a possibility that this could be the same reason as to why there was a low response rate from this community within this study. With the Irish community they noted that they did not perceive themselves to be a minority ethnic group and therefore were reluctant to be involved in the study.
Additional Qualitative ResearchAdditional Qualitative ResearchAdditional Qualitative ResearchAdditional Qualitative Research
A series of discussion groups were held after the primary phase of research was complete. The idea of these discussion groups was to find out more about groups that were under-represented within the household survey, and people approaching critical life ages, for example, young people wishing to move out, older people who may be in need of supportive housing etc. Trained members of the local community, who had the skills to speak a community language, conducted the additional qualitative research. Seven additional focus groups were organised with the following members of the community:
• Somali women aged 18 – 35
• Asian women aged 18 – 35
• Caribbean Elders 60+
• Asian Elders 60+
• Kurdish men aged 18 – 35
• Polish mixed gender group aged 18 – 35
• Mixed BME mixed gender group ages 18 - 35 The findings extracted from this additional qualitative research have been integrated in the overall findings of this report

Shelina Permalloo Final Draft: 04.08.06
15
FINDINGSFINDINGSFINDINGSFINDINGS
Section 3Section 3Section 3Section 3
Shelina Permalloo Final Draft: 04.08.06
16
3.03.03.03.0 FINDINGSFINDINGSFINDINGSFINDINGS
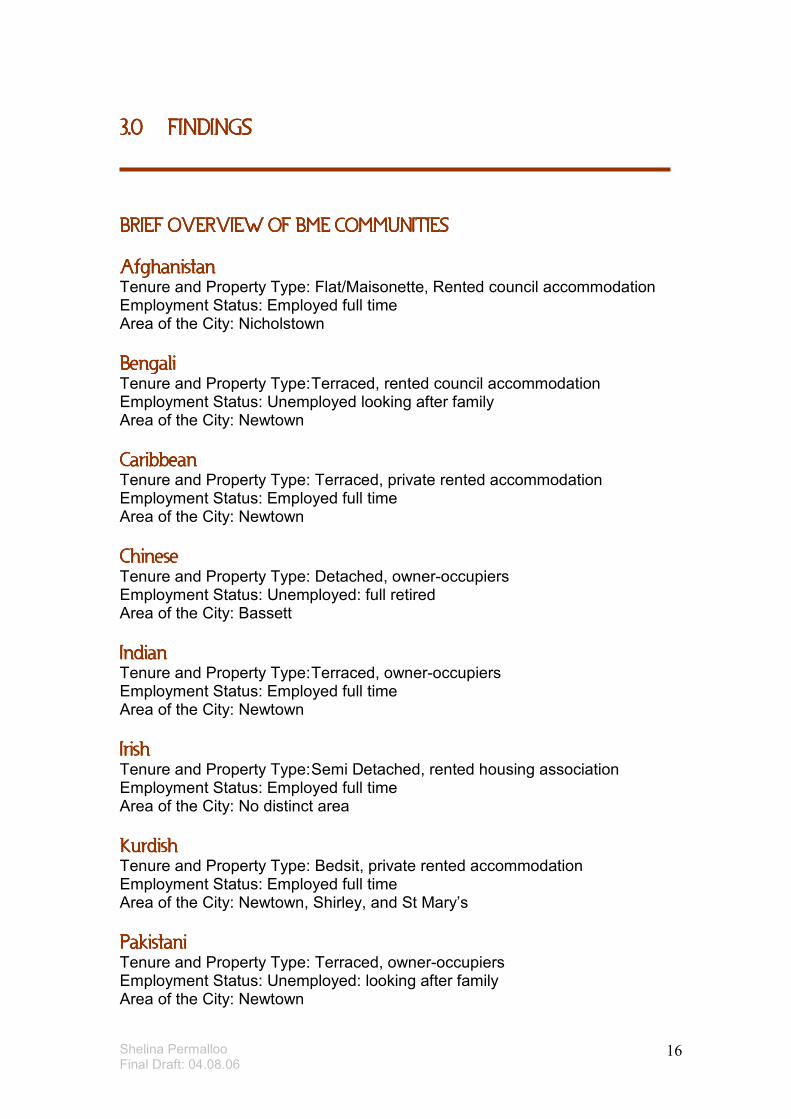
BRIEF OVERVIEW OF BME COMMUNITIESBRIEF OVERVIEW OF BME COMMUNITIESBRIEF OVERVIEW OF BME COMMUNITIESBRIEF OVERVIEW OF BME COMMUNITIES
AfghanistanAfghanistanAfghanistanAfghanistan Tenure and Property Type: Flat/Maisonette, Rented council accommodation Employment Status: Employed full time Area of the City: Nicholstown
BengaliBengaliBengaliBengali Tenure and Property Type: Terraced, rented council accommodation Employment Status: Unemployed looking after family Area of the City: Newtown
CaribbeanCaribbeanCaribbeanCaribbean Tenure and Property Type: Terraced, private rented accommodation Employment Status: Employed full time Area of the City: Newtown
ChineseChineseChineseChinese Tenure and Property Type: Detached, owner-occupiers Employment Status: Unemployed: full retired Area of the City: Bassett
IndianIndianIndianIndian Tenure and Property Type: Terraced, owner-occupiers Employment Status: Employed full time Area of the City: Newtown
IrishIrishIrishIrish Tenure and Property Type: Semi Detached, rented housing association Employment Status: Employed full time Area of the City: No distinct area
KurdishKurdishKurdishKurdish Tenure and Property Type: Bedsit, private rented accommodation Employment Status: Employed full time Area of the City: Newtown, Shirley, and St Mary’s
PakistaniPakistaniPakistaniPakistani Tenure and Property Type: Terraced, owner-occupiers Employment Status: Unemployed: looking after family Area of the City: Newtown
Shelina Permalloo Final Draft: 04.08.06
17
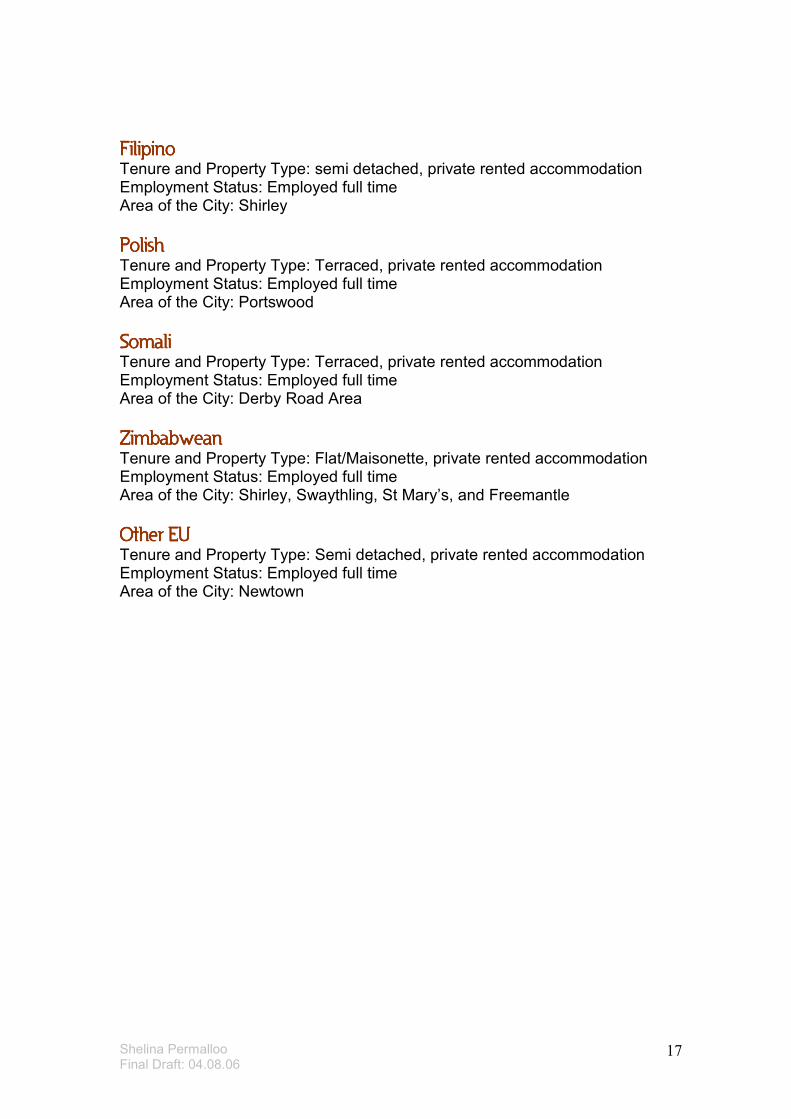
FilipinoFilipinoFilipinoFilipino
Tenure and Property Type: semi detached, private rented accommodation Employment Status: Employed full time Area of the City: Shirley
PolishPolishPolishPolish Tenure and Property Type: Terraced, private rented accommodation Employment Status: Employed full time Area of the City: Portswood
SomaliSomaliSomaliSomali Tenure and Property Type: Terraced, private rented accommodation Employment Status: Employed full time Area of the City: Derby Road Area
ZimbabweanZimbabweanZimbabweanZimbabwean Tenure and Property Type: Flat/Maisonette, private rented accommodation Employment Status: Employed full time Area of the City: Shirley, Swaythling, St Mary’s, and Freemantle
Other EUOther EUOther EUOther EU Tenure and Property Type: Semi detached, private rented accommodation Employment Status: Employed full time Area of the City: Newtown
Shelina Permalloo Final Draft: 04.08.06
18
1.1.1.1. RESPONDENT AND HOUSEHOLD CHARACTERISTICSRESPONDENT AND HOUSEHOLD CHARACTERISTICSRESPONDENT AND HOUSEHOLD CHARACTERISTICSRESPONDENT AND HOUSEHOLD CHARACTERISTICS
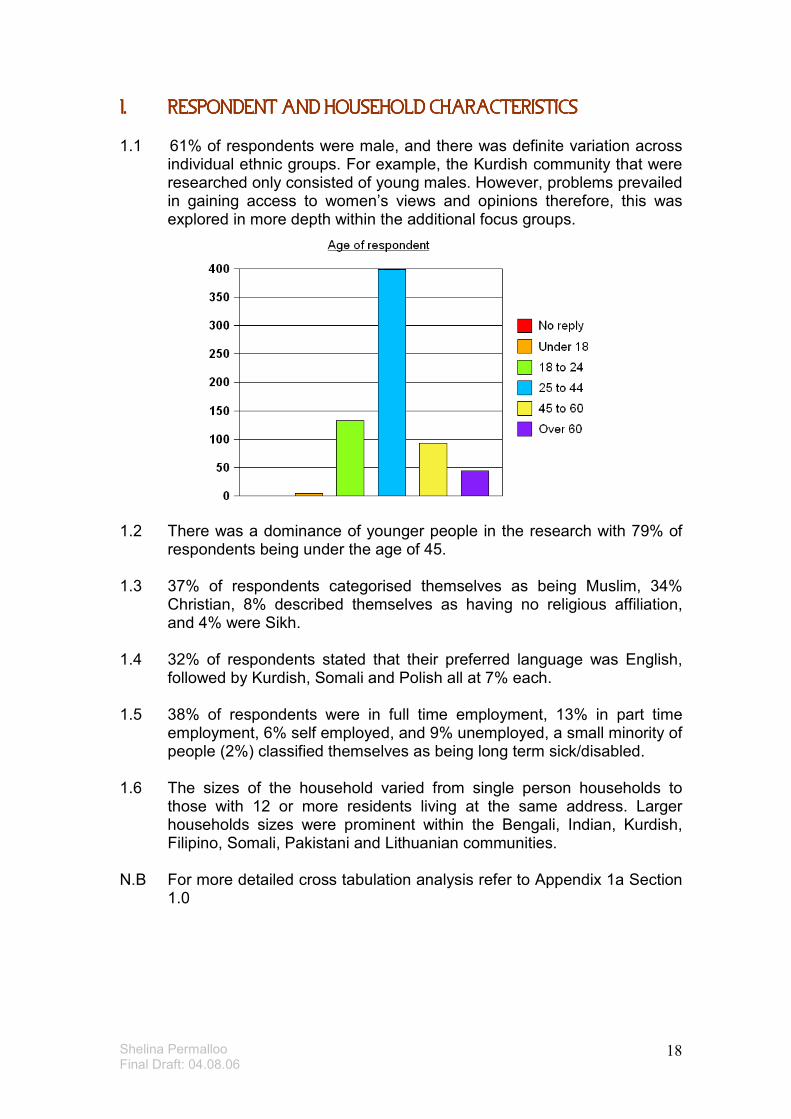
1.1 61% of respondents were male, and there was definite variation across individual ethnic groups. For example, the Kurdish community that were researched only consisted of young males. However, problems prevailed in gaining access to women’s views and opinions therefore, this was explored in more depth within the additional focus groups.
1.2 There was a dominance of younger people in the research with 79% of
respondents being under the age of 45. 1.3 37% of respondents categorised themselves as being Muslim, 34%
Christian, 8% described themselves as having no religious affiliation, and 4% were Sikh.
1.4 32% of respondents stated that their preferred language was English,
followed by Kurdish, Somali and Polish all at 7% each. 1.5 38% of respondents were in full time employment, 13% in part time
employment, 6% self employed, and 9% unemployed, a small minority of people (2%) classified themselves as being long term sick/disabled.
1.6 The sizes of the household varied from single person households to
those with 12 or more residents living at the same address. Larger households sizes were prominent within the Bengali, Indian, Kurdish, Filipino, Somali, Pakistani and Lithuanian communities.
N.B For more detailed cross tabulation analysis refer to Appendix 1a Section
1.0
Shelina Permalloo Final Draft: 04.08.06
19
2.02.02.02.0 CURRENT PROPERTYCURRENT PROPERTYCURRENT PROPERTYCURRENT PROPERTY
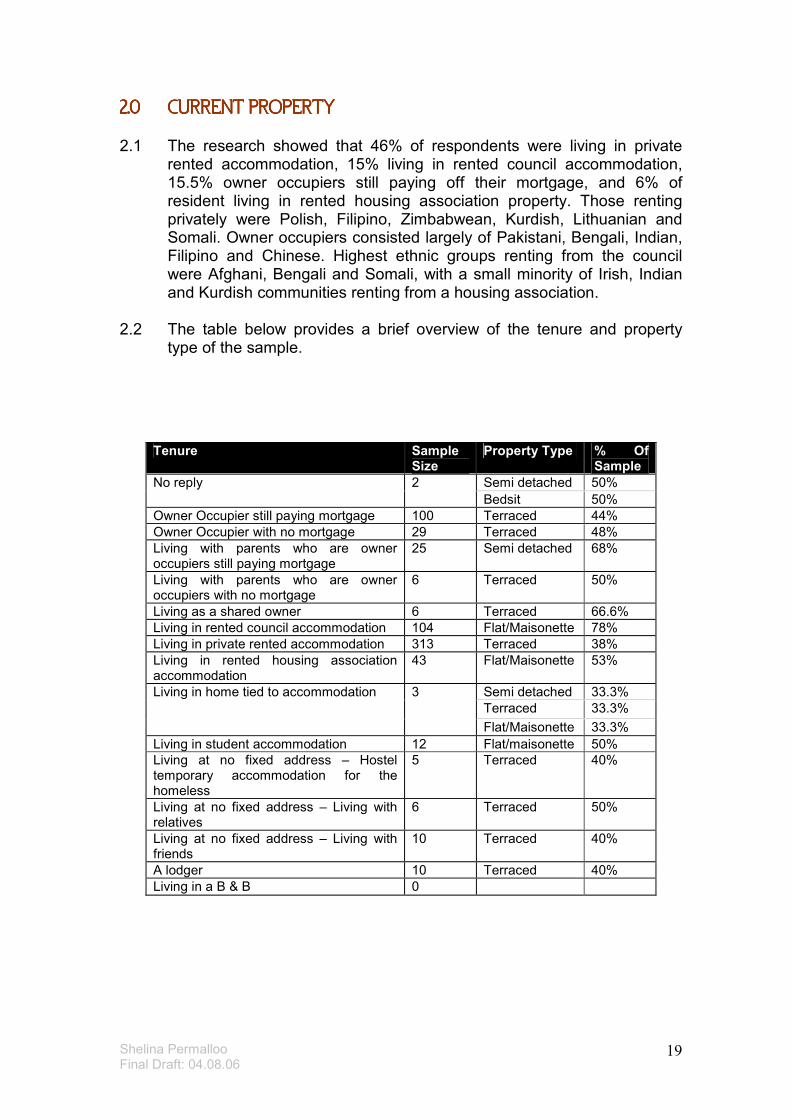
2.1 The research showed that 46% of respondents were living in private rented accommodation, 15% living in rented council accommodation, 15.5% owner occupiers still paying off their mortgage, and 6% of resident living in rented housing association property. Those renting privately were Polish, Filipino, Zimbabwean, Kurdish, Lithuanian and Somali. Owner occupiers consisted largely of Pakistani, Bengali, Indian, Filipino and Chinese. Highest ethnic groups renting from the council were Afghani, Bengali and Somali, with a small minority of Irish, Indian and Kurdish communities renting from a housing association.
2.2 The table below provides a brief overview of the tenure and property type of the sample.
Tenure Sample Size
Property Type % Of Sample
Semi detached 50% No reply 2
Bedsit 50%
Owner Occupier still paying mortgage 100 Terraced 44%
Owner Occupier with no mortgage 29 Terraced 48%
Living with parents who are owner occupiers still paying mortgage
25 Semi detached 68%
Living with parents who are owner occupiers with no mortgage
6 Terraced 50%
Living as a shared owner 6 Terraced 66.6%
Living in rented council accommodation 104 Flat/Maisonette 78%
Living in private rented accommodation 313 Terraced 38%
Living in rented housing association accommodation
43 Flat/Maisonette 53%
Semi detached 33.3%
Terraced 33.3%
Living in home tied to accommodation 3
Flat/Maisonette 33.3%
Living in student accommodation 12 Flat/maisonette 50%
Living at no fixed address – Hostel temporary accommodation for the homeless
5 Terraced 40%
Living at no fixed address – Living with relatives
6 Terraced 50%
Living at no fixed address – Living with friends
10 Terraced 40%
A lodger 10 Terraced 40%
Living in a B & B 0
Shelina Permalloo Final Draft: 04.08.06
20
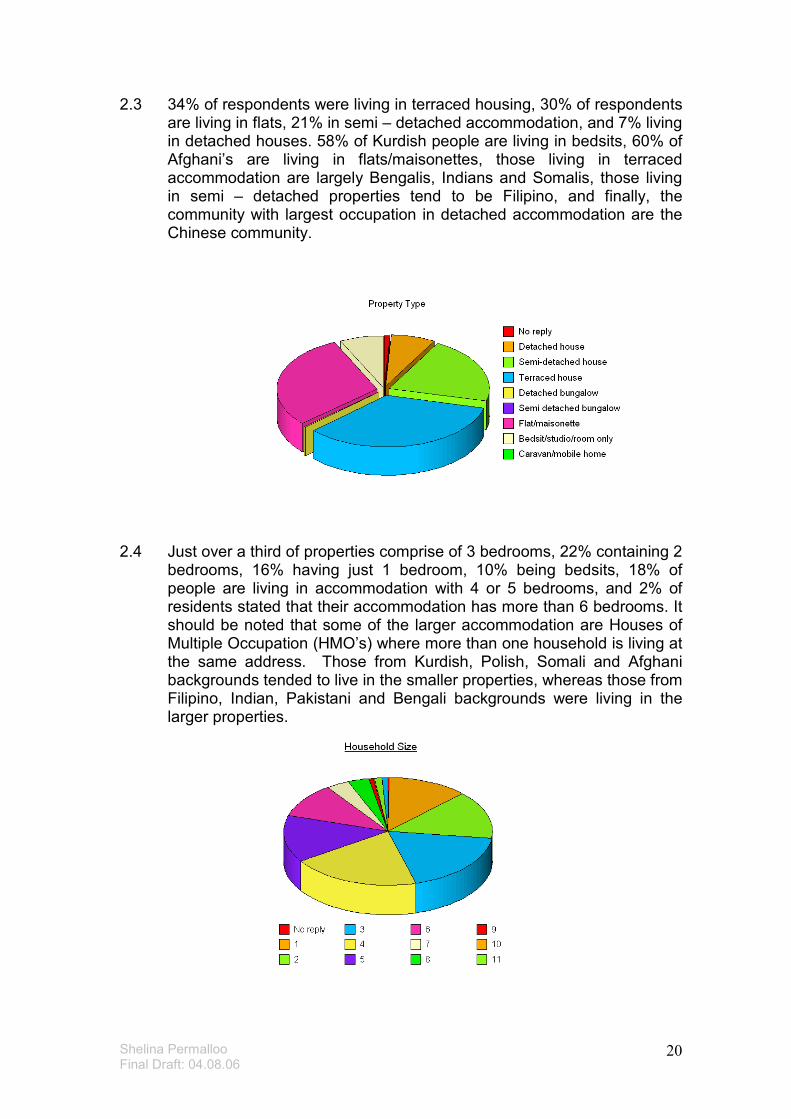
2.3 34% of respondents were living in terraced housing, 30% of respondents are living in flats, 21% in semi – detached accommodation, and 7% living in detached houses. 58% of Kurdish people are living in bedsits, 60% of Afghani’s are living in flats/maisonettes, those living in terraced accommodation are largely Bengalis, Indians and Somalis, those living in semi – detached properties tend to be Filipino, and finally, the community with largest occupation in detached accommodation are the Chinese community.
2.4 Just over a third of properties comprise of 3 bedrooms, 22% containing 2 bedrooms, 16% having just 1 bedroom, 10% being bedsits, 18% of people are living in accommodation with 4 or 5 bedrooms, and 2% of residents stated that their accommodation has more than 6 bedrooms. It should be noted that some of the larger accommodation are Houses of Multiple Occupation (HMO’s) where more than one household is living at the same address. Those from Kurdish, Polish, Somali and Afghani backgrounds tended to live in the smaller properties, whereas those from Filipino, Indian, Pakistani and Bengali backgrounds were living in the larger properties.
Shelina Permalloo Final Draft: 04.08.06
21
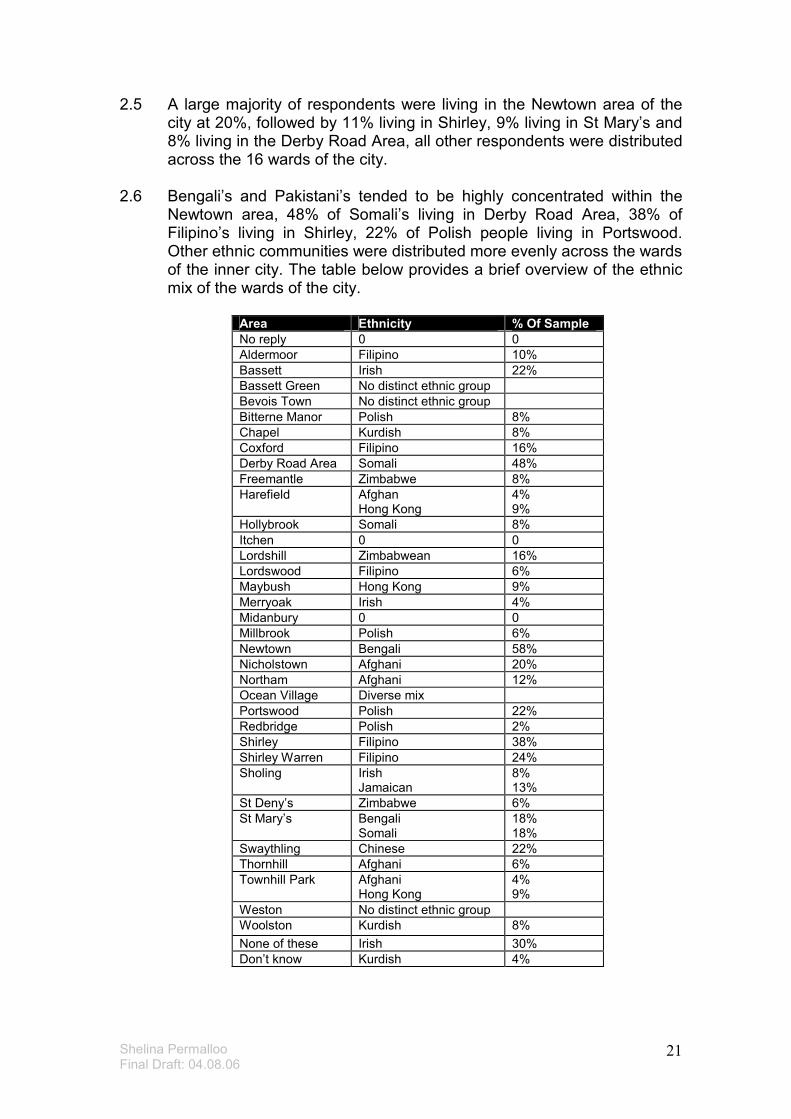
2.5 A large majority of respondents were living in the Newtown area of the city at 20%, followed by 11% living in Shirley, 9% living in St Mary’s and 8% living in the Derby Road Area, all other respondents were distributed across the 16 wards of the city.
2.6 Bengali’s and Pakistani’s tended to be highly concentrated within the Newtown area, 48% of Somali’s living in Derby Road Area, 38% of Filipino’s living in Shirley, 22% of Polish people living in Portswood. Other ethnic communities were distributed more evenly across the wards of the inner city. The table below provides a brief overview of the ethnic mix of the wards of the city.
Area Ethnicity % Of Sample
No reply 0 0
Aldermoor Filipino 10%
Bassett Irish 22%
Bassett Green No distinct ethnic group
Bevois Town No distinct ethnic group
Bitterne Manor Polish 8%
Chapel Kurdish 8%
Coxford Filipino 16%
Derby Road Area Somali 48%
Freemantle Zimbabwe 8%
Harefield Afghan Hong Kong
4% 9%
Hollybrook Somali 8%
Itchen 0 0
Lordshill Zimbabwean 16%
Lordswood Filipino 6%
Maybush Hong Kong 9%
Merryoak Irish 4%
Midanbury 0 0
Millbrook Polish 6%
Newtown Bengali 58%
Nicholstown Afghani 20%
Northam Afghani 12%
Ocean Village Diverse mix
Portswood Polish 22%
Redbridge Polish 2%
Shirley Filipino 38%
Shirley Warren Filipino 24%
Sholing Irish Jamaican
8% 13%
St Deny’s Zimbabwe 6%
St Mary’s Bengali Somali
18% 18%
Swaythling Chinese 22%
Thornhill Afghani 6%
Townhill Park Afghani Hong Kong
4% 9%
Weston No distinct ethnic group
Woolston Kurdish 8%
None of these Irish 30%
Don’t know Kurdish 4%
Shelina Permalloo Final Draft: 04.08.06
22
2.7 66% of respondents, who stated that their previous home was privately rented, are still living in the private rented sector, 16% are now renting off the council, 9% are now owner occupiers. 88% of respondents who said that they were owner occupiers, have remained owner occupiers.
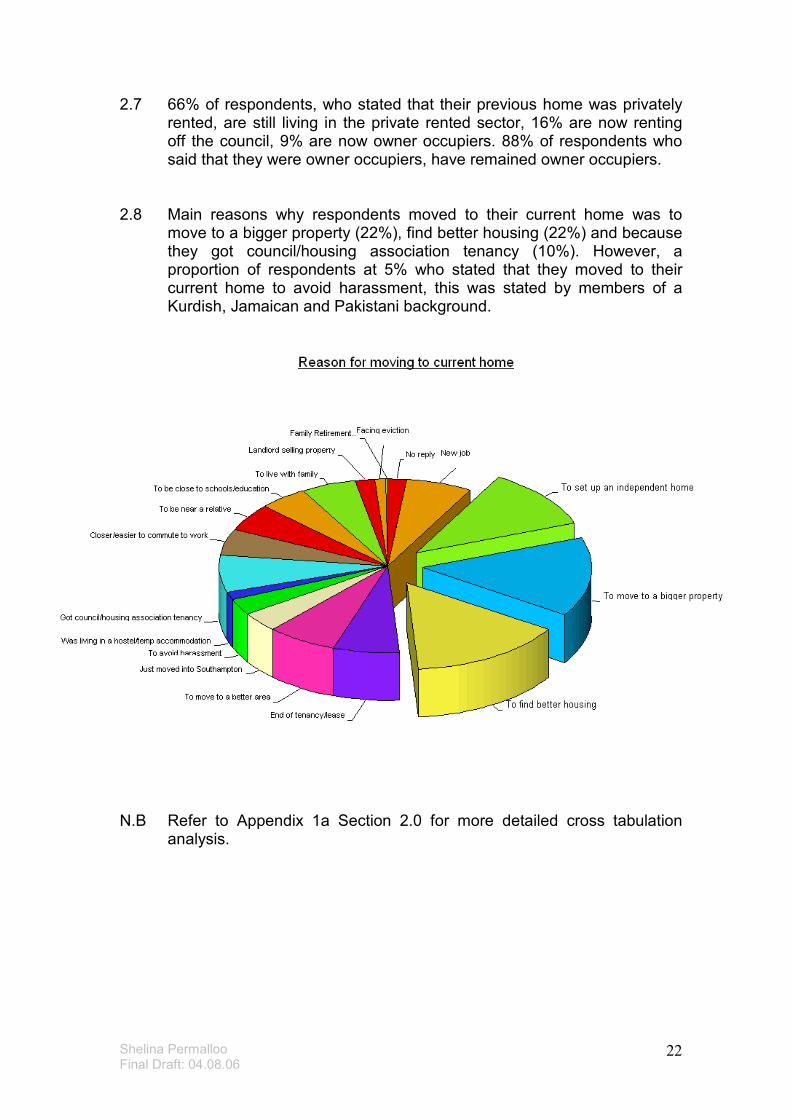
2.8 Main reasons why respondents moved to their current home was to move to a bigger property (22%), find better housing (22%) and because they got council/housing association tenancy (10%). However, a proportion of respondents at 5% who stated that they moved to their current home to avoid harassment, this was stated by members of a Kurdish, Jamaican and Pakistani background.
N.B Refer to Appendix 1a Section 2.0 for more detailed cross tabulation analysis.
Shelina Permalloo Final Draft: 04.08.06
23
3.03.03.03.0 HOUSING NEEDHOUSING NEEDHOUSING NEEDHOUSING NEED
This section provides a brief breakdown of what the research identified in regards to housing needs. Generally housing need is identified by the extent to which households have to either share facilities with other households, or their access to basic facilities. 3.1 99% of respondents had access to a bath/shower, 84% had central
heating, 77% had double-glazing, 77% had a smoke alarm, 62% had access to a garden, 44% had loft insulation, and 13% had a burglar alarm.
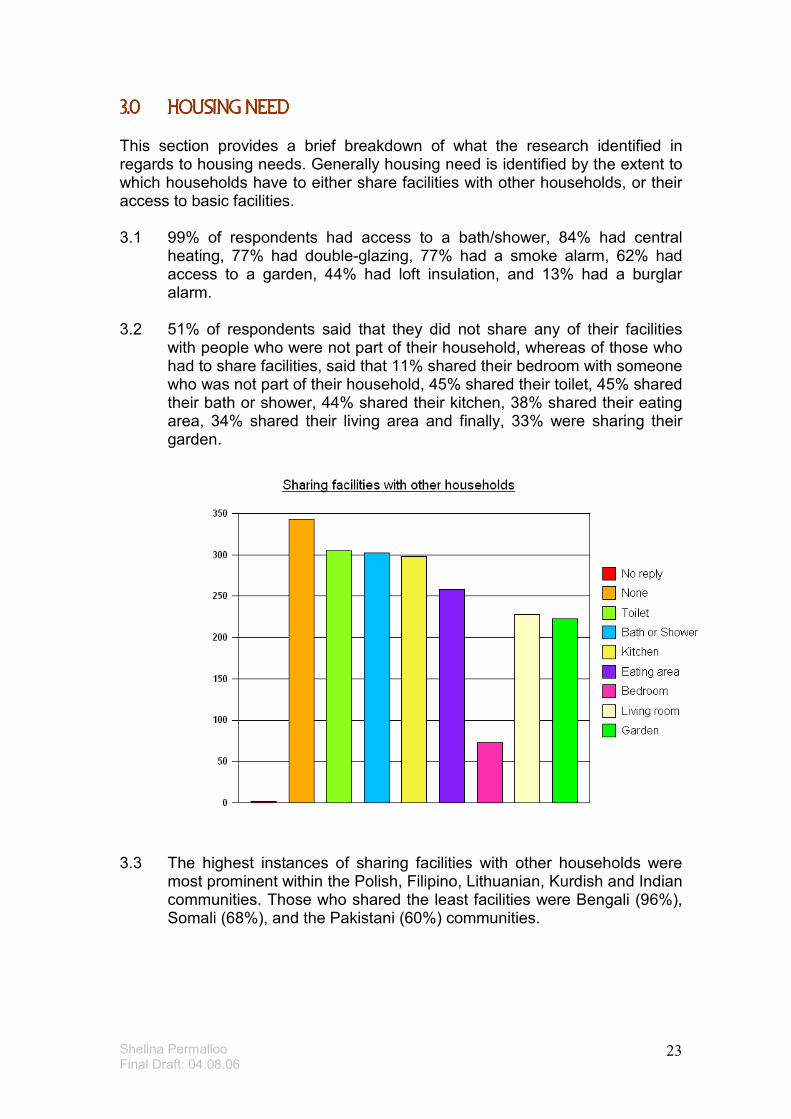
3.2 51% of respondents said that they did not share any of their facilities
with people who were not part of their household, whereas of those who had to share facilities, said that 11% shared their bedroom with someone who was not part of their household, 45% shared their toilet, 45% shared their bath or shower, 44% shared their kitchen, 38% shared their eating area, 34% shared their living area and finally, 33% were sharing their garden.
3.3 The highest instances of sharing facilities with other households were
most prominent within the Polish, Filipino, Lithuanian, Kurdish and Indian communities. Those who shared the least facilities were Bengali (96%), Somali (68%), and the Pakistani (60%) communities.
Shelina Permalloo Final Draft: 04.08.06
24
Extract taken from the young female Somali focus group: “We don’t like to share anything with people who are not of the same ethnic background, as Muslims it’s difficult to share a kitchen with people due to alcohol and pork being used on the premises, that’s why we don’t choose to live in shared homes and always share with other Somali’s”
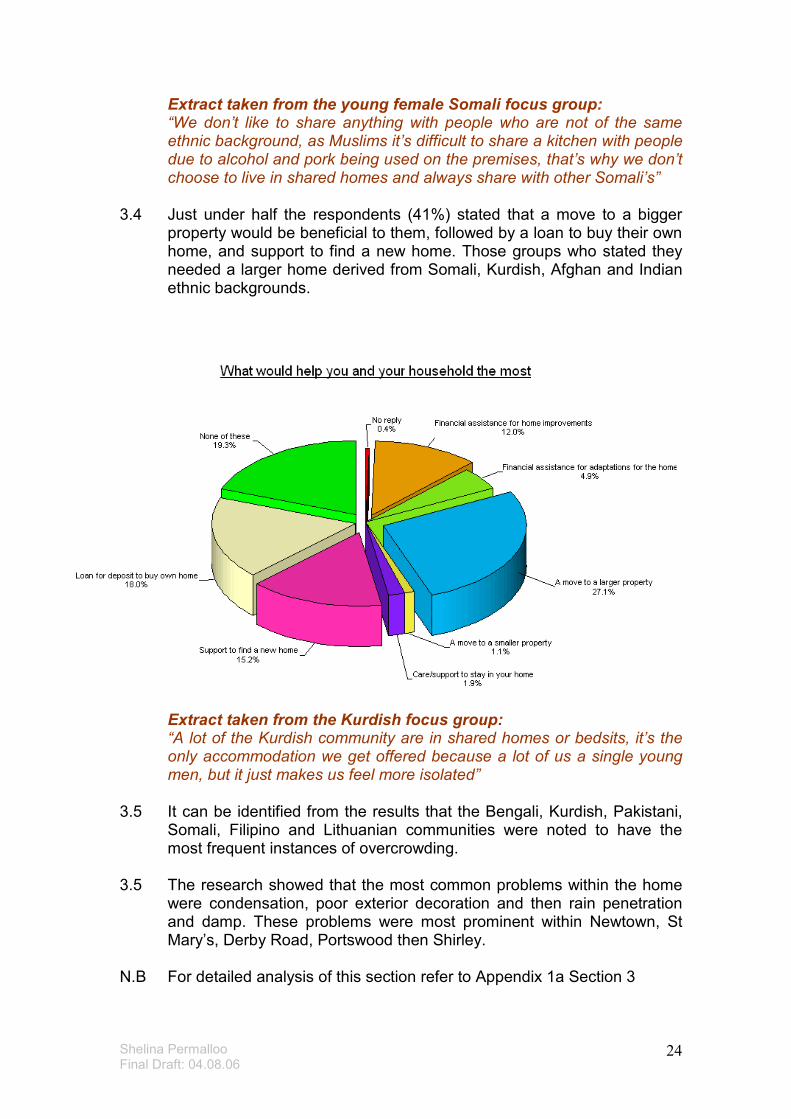
3.4 Just under half the respondents (41%) stated that a move to a bigger
property would be beneficial to them, followed by a loan to buy their own home, and support to find a new home. Those groups who stated they needed a larger home derived from Somali, Kurdish, Afghan and Indian ethnic backgrounds.
Extract taken from the Kurdish focus group:
“A lot of the Kurdish community are in shared homes or bedsits, it’s the only accommodation we get offered because a lot of us a single young men, but it just makes us feel more isolated”
3.5 It can be identified from the results that the Bengali, Kurdish, Pakistani, Somali, Filipino and Lithuanian communities were noted to have the most frequent instances of overcrowding.
3.5 The research showed that the most common problems within the home
were condensation, poor exterior decoration and then rain penetration and damp. These problems were most prominent within Newtown, St Mary’s, Derby Road, Portswood then Shirley.
N.B For detailed analysis of this section refer to Appendix 1a Section 3
Shelina Permalloo Final Draft: 04.08.06
25
4.04.04.04.0 ACCESS TO SOCIAL AND AFFORDABLE HOUSING, AND ACCESS TO SOCIAL AND AFFORDABLE HOUSING, AND ACCESS TO SOCIAL AND AFFORDABLE HOUSING, AND ACCESS TO SOCIAL AND AFFORDABLE HOUSING, AND HOUSING ADVICEHOUSING ADVICEHOUSING ADVICEHOUSING ADVICE
4.1 70% of all respondents said they were not currently on the social and
affordable housing register. However there were some distinct ethnic groups that are currently on the housing register; 84% of Somali’s were on the list, followed by 70% Afghani’s, 54% Bengali’s, 52% Kurd’s and then 26% of Zimbabwean’s.
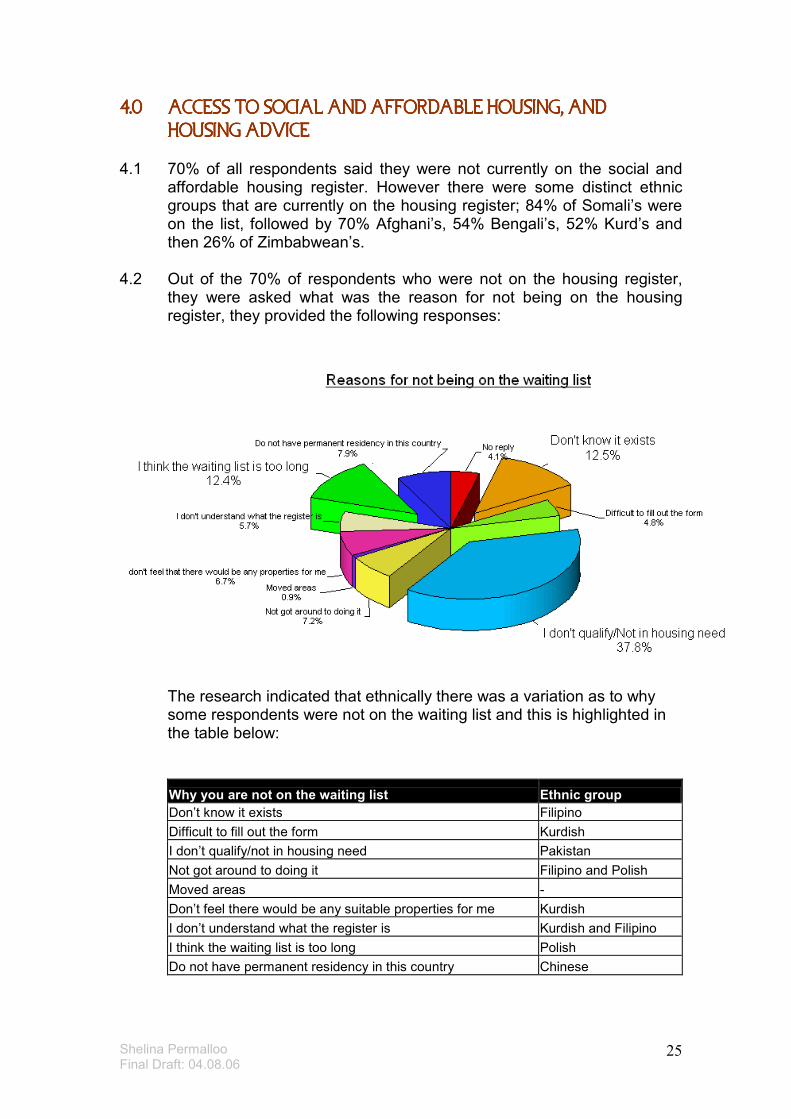
4.2 Out of the 70% of respondents who were not on the housing register,
they were asked what was the reason for not being on the housing register, they provided the following responses:
The research indicated that ethnically there was a variation as to why some respondents were not on the waiting list and this is highlighted in the table below:
Why you are not on the waiting list Ethnic group
Don’t know it exists Filipino
Difficult to fill out the form Kurdish
I don’t qualify/not in housing need Pakistan
Not got around to doing it Filipino and Polish
Moved areas -
Don’t feel there would be any suitable properties for me Kurdish
I don’t understand what the register is Kurdish and Filipino
I think the waiting list is too long Polish
Do not have permanent residency in this country Chinese
Shelina Permalloo Final Draft: 04.08.06
26
Extract taken from the Eastern European focus group: “I don’t know what the council does and I don’t know much about housing in the city, I think we would really benefit from someone from our community who would be able to provide us with general housing advice, since most of us don’t read or speak English the private landlords take advantage of us, it would really help if there was someone who could give us this information. I don’t know about the council, but then because I have a short term employment visa I don’t think I qualify”
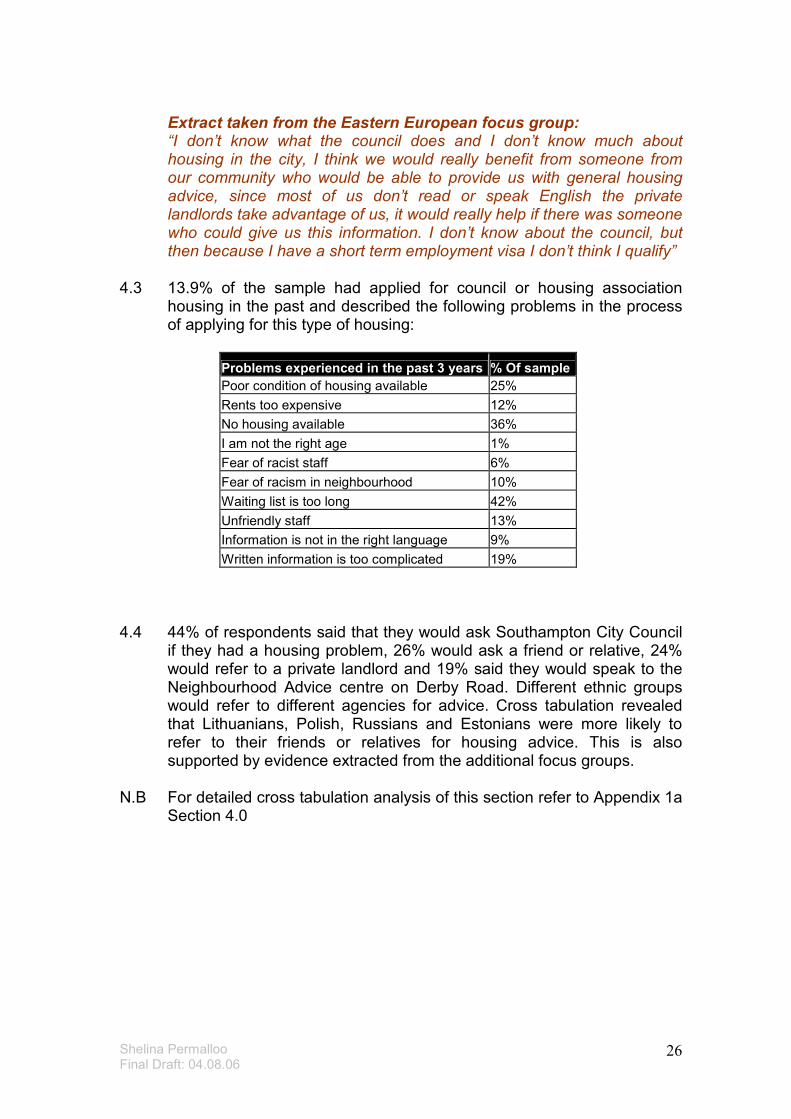
4.3 13.9% of the sample had applied for council or housing association
housing in the past and described the following problems in the process of applying for this type of housing:
Problems experienced in the past 3 years % Of sample
Poor condition of housing available 25%
Rents too expensive 12%
No housing available 36%
I am not the right age 1%
Fear of racist staff 6%
Fear of racism in neighbourhood 10%
Waiting list is too long 42%
Unfriendly staff 13%
Information is not in the right language 9%
Written information is too complicated 19%
4.4 44% of respondents said that they would ask Southampton City Council
if they had a housing problem, 26% would ask a friend or relative, 24% would refer to a private landlord and 19% said they would speak to the Neighbourhood Advice centre on Derby Road. Different ethnic groups would refer to different agencies for advice. Cross tabulation revealed that Lithuanians, Polish, Russians and Estonians were more likely to refer to their friends or relatives for housing advice. This is also supported by evidence extracted from the additional focus groups.
N.B For detailed cross tabulation analysis of this section refer to Appendix 1a
Section 4.0
Shelina Permalloo Final Draft: 04.08.06
27
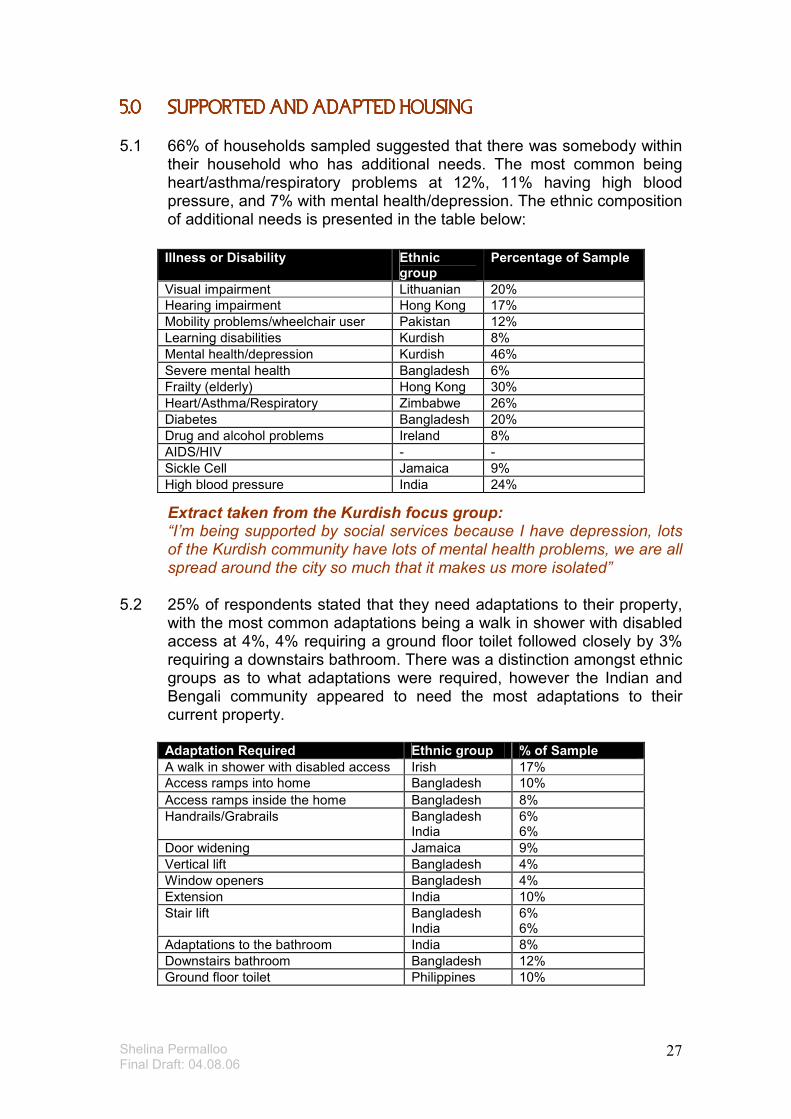
5.05.05.05.0 SUPPORTED AND ADAPTED HOUSINGSUPPORTED AND ADAPTED HOUSINGSUPPORTED AND ADAPTED HOUSINGSUPPORTED AND ADAPTED HOUSING 5.1 66% of households sampled suggested that there was somebody within
their household who has additional needs. The most common being heart/asthma/respiratory problems at 12%, 11% having high blood pressure, and 7% with mental health/depression. The ethnic composition of additional needs is presented in the table below:
Extract taken from the Kurdish focus group: “I’m being supported by social services because I have depression, lots of the Kurdish community have lots of mental health problems, we are all spread around the city so much that it makes us more isolated”
5.2 25% of respondents stated that they need adaptations to their property,
with the most common adaptations being a walk in shower with disabled access at 4%, 4% requiring a ground floor toilet followed closely by 3% requiring a downstairs bathroom. There was a distinction amongst ethnic groups as to what adaptations were required, however the Indian and Bengali community appeared to need the most adaptations to their current property.
Illness or Disability Ethnic group
Percentage of Sample
Visual impairment Lithuanian 20%
Hearing impairment Hong Kong 17%
Mobility problems/wheelchair user Pakistan 12%
Learning disabilities Kurdish 8%
Mental health/depression Kurdish 46%
Severe mental health Bangladesh 6%
Frailty (elderly) Hong Kong 30%
Heart/Asthma/Respiratory Zimbabwe 26%
Diabetes Bangladesh 20%
Drug and alcohol problems Ireland 8%
AIDS/HIV - -
Sickle Cell Jamaica 9%
High blood pressure India 24%
Adaptation Required Ethnic group % of Sample
A walk in shower with disabled access Irish 17%
Access ramps into home Bangladesh 10%
Access ramps inside the home Bangladesh 8%
Handrails/Grabrails Bangladesh India
6% 6%
Door widening Jamaica 9%
Vertical lift Bangladesh 4%
Window openers Bangladesh 4%
Extension India 10%
Stair lift Bangladesh India
6% 6%
Adaptations to the bathroom India 8%
Downstairs bathroom Bangladesh 12%
Ground floor toilet Philippines 10%
Shelina Permalloo Final Draft: 04.08.06
28
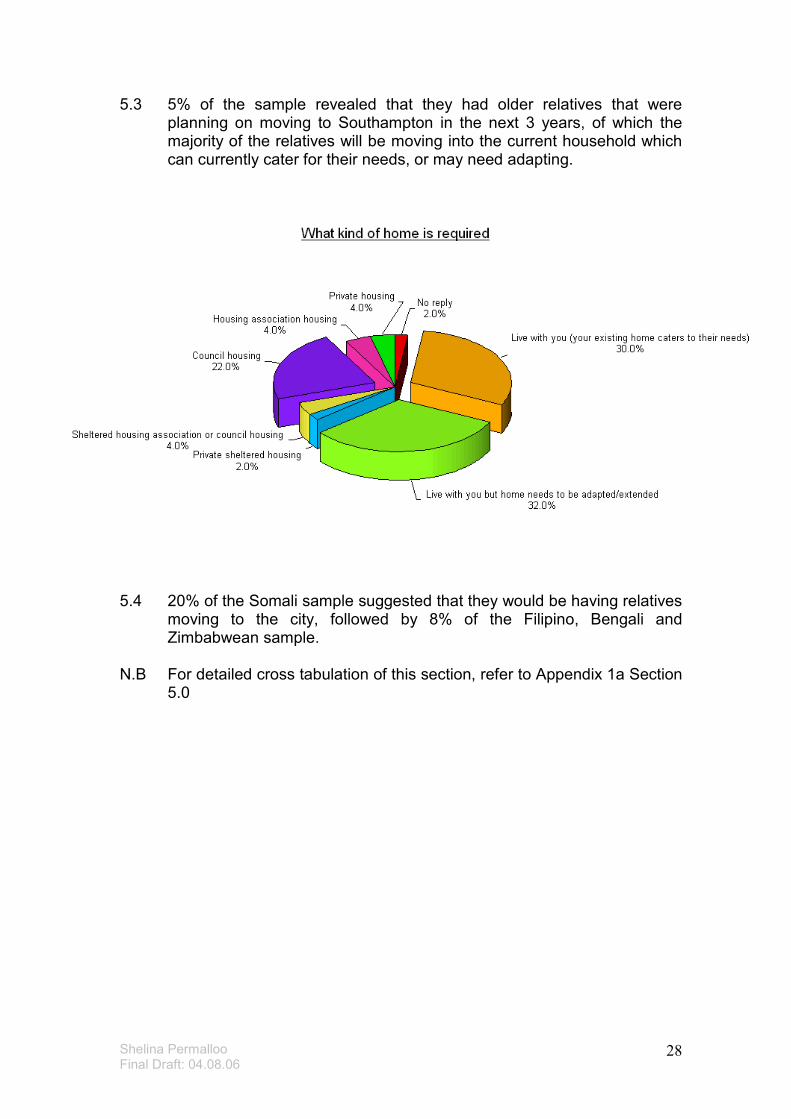
5.3 5% of the sample revealed that they had older relatives that were planning on moving to Southampton in the next 3 years, of which the majority of the relatives will be moving into the current household which can currently cater for their needs, or may need adapting.
5.4 20% of the Somali sample suggested that they would be having relatives
moving to the city, followed by 8% of the Filipino, Bengali and Zimbabwean sample.
N.B For detailed cross tabulation of this section, refer to Appendix 1a Section
5.0
Shelina Permalloo Final Draft: 04.08.06
29
6.06.06.06.0 VIEWS ON THE AREAVIEWS ON THE AREAVIEWS ON THE AREAVIEWS ON THE AREA 6.1 66% of all respondents were either very happy or fairly happy with the
area that they currently living in, 16% were neither happy nor unhappy, and 17% were either fairly unhappy or very unhappy. The ethnic groups that appeared happiest with their area of residence were Bengali’s, Somali’s and Filipino’s. The ethnic groups that were dissatisfied with their area were the Kurdish, Afghans and the Polish.
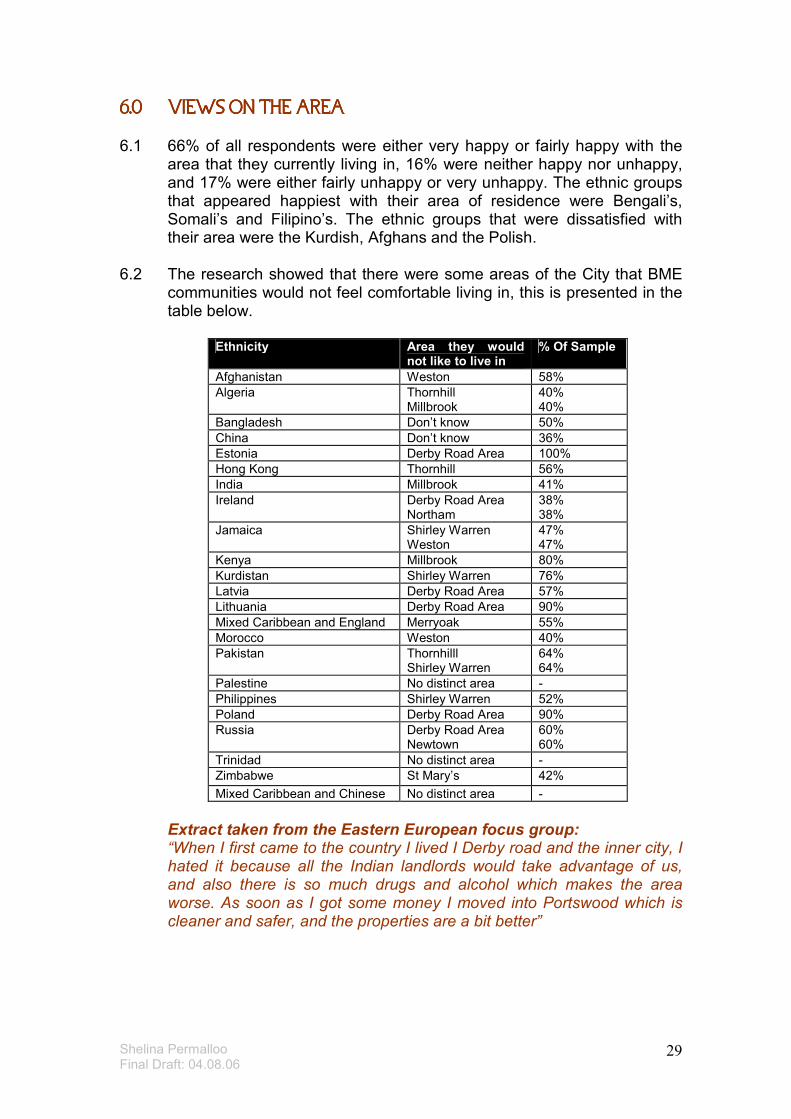
6.2 The research showed that there were some areas of the City that BME communities would not feel comfortable living in, this is presented in the table below.
Ethnicity Area they would
not like to live in % Of Sample
Afghanistan Weston 58%
Algeria Thornhill Millbrook
40% 40%
Bangladesh Don’t know 50%
China Don’t know 36%
Estonia Derby Road Area 100%
Hong Kong Thornhill 56%
India Millbrook 41%
Ireland Derby Road Area Northam
38% 38%
Jamaica Shirley Warren Weston
47% 47%
Kenya Millbrook 80%
Kurdistan Shirley Warren 76%
Latvia Derby Road Area 57%
Lithuania Derby Road Area 90%
Mixed Caribbean and England Merryoak 55%
Morocco Weston 40%
Pakistan Thornhilll Shirley Warren
64% 64%
Palestine No distinct area -
Philippines Shirley Warren 52%
Poland Derby Road Area 90%
Russia Derby Road Area Newtown
60% 60%
Trinidad No distinct area -
Zimbabwe St Mary’s 42%
Mixed Caribbean and Chinese No distinct area -
Extract taken from the Eastern European focus group: “When I first came to the country I lived I Derby road and the inner city, I hated it because all the Indian landlords would take advantage of us, and also there is so much drugs and alcohol which makes the area worse. As soon as I got some money I moved into Portswood which is cleaner and safer, and the properties are a bit better”
Shelina Permalloo Final Draft: 04.08.06
30
6.3 We asked respondents to state what is important to them when making decisions about where they would like to live. A staggering 93% of respondents said that to be safe from race harassment and anti social behaviour was the most important to them, followed by being close to family and friends (84%), and then being close to public transport (83%).
6.4 Generally respondents liked their area they lived in because it was close
to shops (50%), good public transport links (31%) and the area was quiet and peaceful (22%). Through cross tabulation analysis we can identify which areas scored the highest for the reasons mentioned in the table below:
What they like about the area they live in
Area
Area well maintained Shirley
Good public transport Shirley
Safe area/low in crime Shirley
Quiet/peaceful Shirley
Close to shops Newtown
Close to family Newtown
Good local leisure facilities Newtown
Good neighbours Shirley and Newtown
Close to place of worship Newtown
Close to childcare facilities Newtown
Close to schools Newtown
No opinion of the area St Mary’s
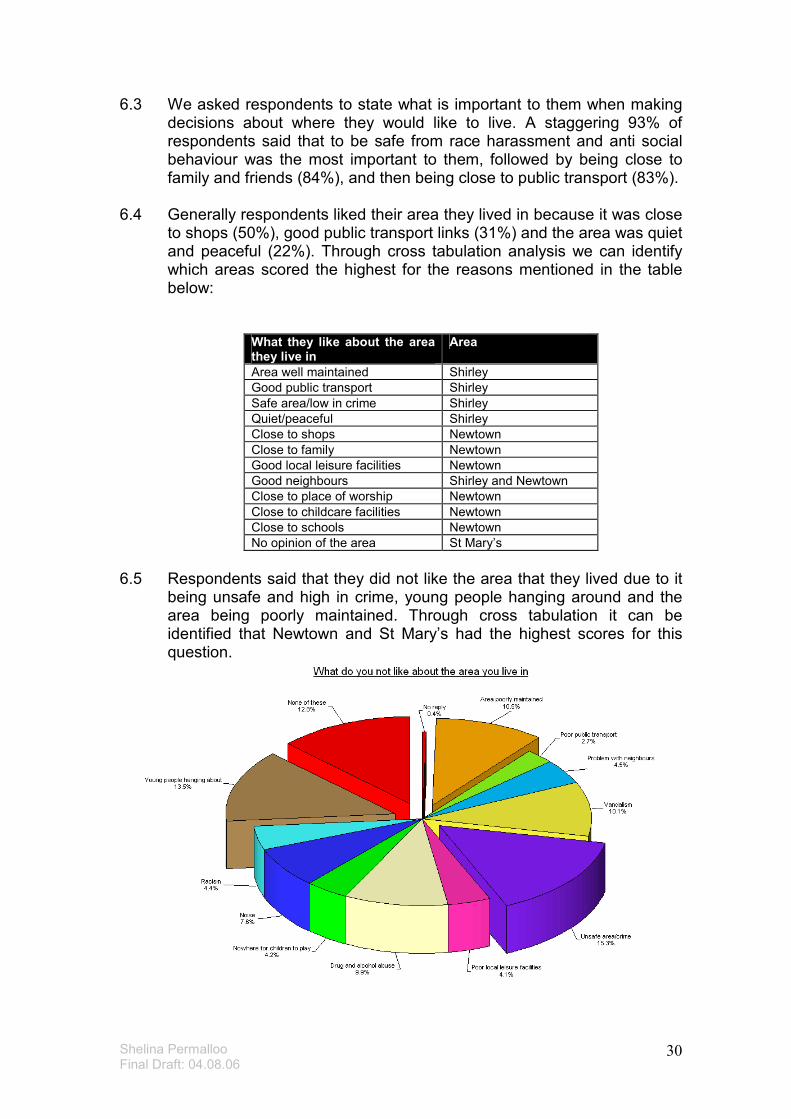
6.5 Respondents said that they did not like the area that they lived due to it
being unsafe and high in crime, young people hanging around and the area being poorly maintained. Through cross tabulation it can be identified that Newtown and St Mary’s had the highest scores for this question.
Shelina Permalloo Final Draft: 04.08.06
31
Extract taken from the Caribbean Elders focus group: “I love my home and I love where I live but the only thing that ruins it is the young people hanging around my streets at night, they have nothing to do so they cause trouble, its because nowadays the parents are working late to try and pay their bills, so the kids don’t have no respect because their parents aren’t at home and so they don’t get any discipline, if parents could be at home more then this wouldn’t be happening” Extract taken from the Asian Elders focus group: “Back in the day parents would be at home with their kids sharing a meal a day, but now mortgages are so high, and parents have so much to pay out that they can’t be with their kids. The problem is children are running around the streets causing havoc, if there were more things for kids to do then there would be less violence around”
N.B For detailed cross tabulation analysis, refer to Appendix 1a Section 6.0
Shelina Permalloo Final Draft: 04.08.06
32
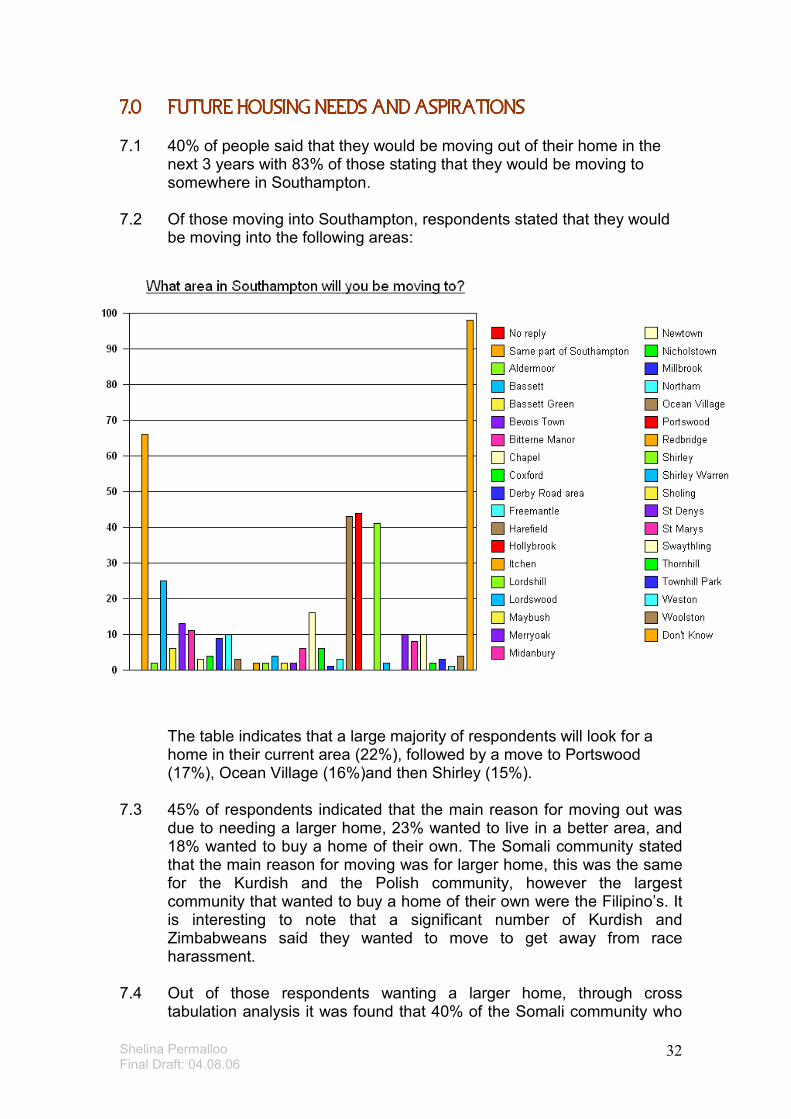
7.07.07.07.0 FUTURE HOUSING NEEDS AND ASPIRATIONSFUTURE HOUSING NEEDS AND ASPIRATIONSFUTURE HOUSING NEEDS AND ASPIRATIONSFUTURE HOUSING NEEDS AND ASPIRATIONS 7.1 40% of people said that they would be moving out of their home in the
next 3 years with 83% of those stating that they would be moving to somewhere in Southampton.
7.2 Of those moving into Southampton, respondents stated that they would
be moving into the following areas:
The table indicates that a large majority of respondents will look for a home in their current area (22%), followed by a move to Portswood (17%), Ocean Village (16%)and then Shirley (15%).
7.3 45% of respondents indicated that the main reason for moving out was
due to needing a larger home, 23% wanted to live in a better area, and 18% wanted to buy a home of their own. The Somali community stated that the main reason for moving was for larger home, this was the same for the Kurdish and the Polish community, however the largest community that wanted to buy a home of their own were the Filipino’s. It is interesting to note that a significant number of Kurdish and Zimbabweans said they wanted to move to get away from race harassment.
7.4 Out of those respondents wanting a larger home, through cross
tabulation analysis it was found that 40% of the Somali community who
Shelina Permalloo Final Draft: 04.08.06
33
said that they needed a larger home were currently on the council’s housing register, and 24% of the Kurdish community who said that they needed a larger home were also on the council’s housing register. The largest community who were in need of a larger home and were not on the housing register were the Polish (26%), followed shortly by the Filipino community (26%), and then the Indian Community (10%).
7.5 Of those who were unable to move said that is was because there was a
lack of affordable homes to rent, 20% said that they could not raise the deposit to buy a home, and 18% said that they were unable to buy/move to another home.
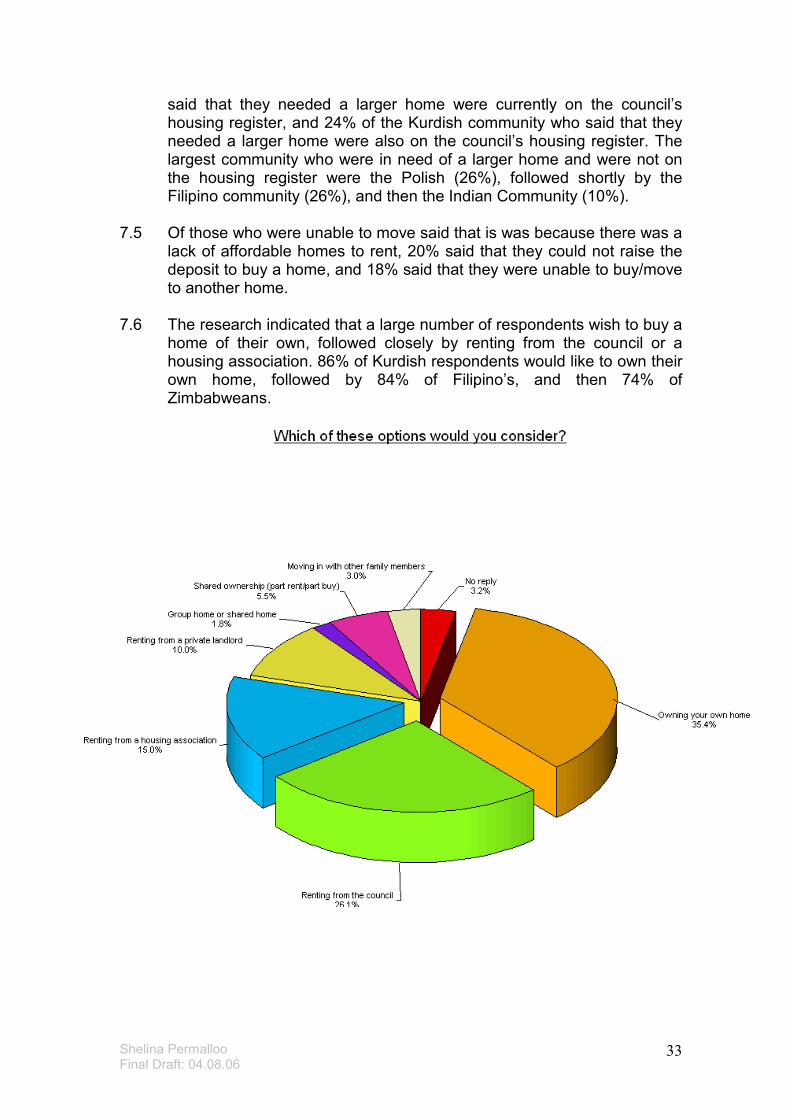
7.6 The research indicated that a large number of respondents wish to buy a
home of their own, followed closely by renting from the council or a housing association. 86% of Kurdish respondents would like to own their own home, followed by 84% of Filipino’s, and then 74% of Zimbabweans.
Shelina Permalloo Final Draft: 04.08.06
34
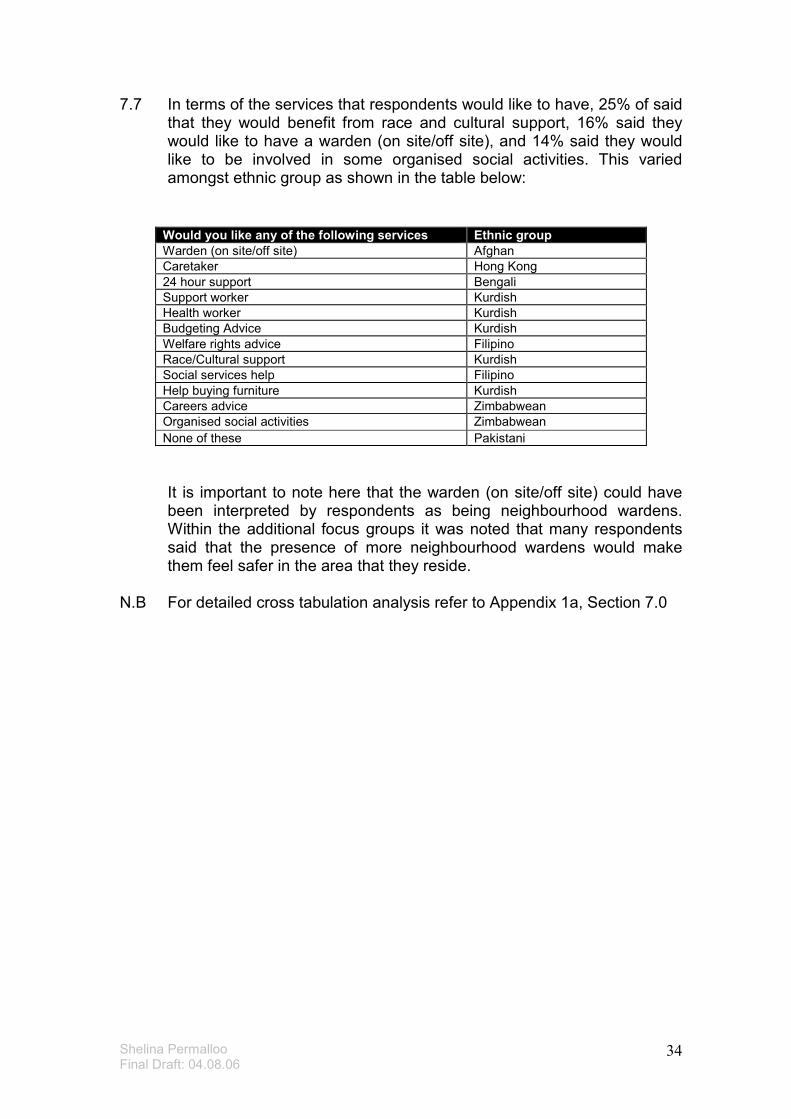
7.7 In terms of the services that respondents would like to have, 25% of said that they would benefit from race and cultural support, 16% said they would like to have a warden (on site/off site), and 14% said they would like to be involved in some organised social activities. This varied amongst ethnic group as shown in the table below:
It is important to note here that the warden (on site/off site) could have been interpreted by respondents as being neighbourhood wardens. Within the additional focus groups it was noted that many respondents said that the presence of more neighbourhood wardens would make them feel safer in the area that they reside.
N.B For detailed cross tabulation analysis refer to Appendix 1a, Section 7.0
Would you like any of the following services Ethnic group
Warden (on site/off site) Afghan
Caretaker Hong Kong
24 hour support Bengali
Support worker Kurdish
Health worker Kurdish
Budgeting Advice Kurdish
Welfare rights advice Filipino
Race/Cultural support Kurdish
Social services help Filipino
Help buying furniture Kurdish
Careers advice Zimbabwean
Organised social activities Zimbabwean
None of these Pakistani
Shelina Permalloo Final Draft: 04.08.06
35
8.08.08.08.0 NEWLY FORMING HOUSEHOLDSNEWLY FORMING HOUSEHOLDSNEWLY FORMING HOUSEHOLDSNEWLY FORMING HOUSEHOLDS 8.1 11% of respondents said that members of their household will be moving
out within the next 3 years, of those, 41% will be a friend, 36% will be a child aged 16+, and 15% will be a relative. 57% of those moving out are aged 20 – 29, 23% are aged 30 – 44, and 15% are aged 16 – 19. The ethnic composition is predominantly Filipino (25%), Zimbabwean (7.5%), Lithuanian (11%). Most of those moving out plan to do so in less than a year (54%).
8.2 43% of respondents moving out have not put themselves on any lists,
30% don’t know if they are on any list, and 21% have put themselves on the council housing register, 4% are on another council waiting list, 2% are on a housing association waiting list.
8.3 31% are likely to move to a private rented accommodation and 26%
would like to be owner-occupiers, respondents have suggested that 28% would like to move to a flat/maisonette, 16% would like to move to a semi-detached property, and 10% would like to move to terraced accommodation.
8.4 Most respondents will need either a 1 bedroom property (25%), or a 2
bedroom property (25%), and some have said they will need a 3 bedroom property (20%). A proportion of respondents at 5% have suggested that they will need a 4-bedroom property.
8.5 Newly forming households are most likely to want a property in Shirley,
Portswood, Ocean Village and Bassett. The reasons for moving to these areas are: to be closer to work, nearer to family and the quality of the neighbourhood.
Extract taken from a mixed BME younger persons focus group: “Its just not affordable anymore, house prices just keep going up and so does council tax, if I haven’t got one thing to think about its another, and its not like I’m getting paid anymore. I just don’t think I’ll ever be able to afford a place on my own, I’m lucky I have a partner that I rent with, but if I was single I don’t think id be able to do anything. I know that there’s special deals for people wanting to get on the property ladder but I just don’t think that the information is clear enough or even advertised enough – you just don’t get to hear about it”
N.B For more detail on this section and cross tabulation analysis please refer
to section 8.0 of Appendix 1a.
Shelina Permalloo Final Draft: 04.08.06
36
9.09.09.09.0 SAVINGS, EQUITY AND RECEIPT OF FINANCIAL SUPPORTSAVINGS, EQUITY AND RECEIPT OF FINANCIAL SUPPORTSAVINGS, EQUITY AND RECEIPT OF FINANCIAL SUPPORTSAVINGS, EQUITY AND RECEIPT OF FINANCIAL SUPPORT N.B: Please note that a large number of respondents either refused to answer
questions on this section, or did not know the answer, as they may not have been the head of the household. Those who refused to answer may have refused for a number of reasons, such as lack of trust as to where the information would go, uncertainty regarding immigration status, or perhaps, some of the respondents were illegal immigrants and did not want to disclose such information. Therefore, findings of this section may not be a true representation of the current situation for BME communities of the city.
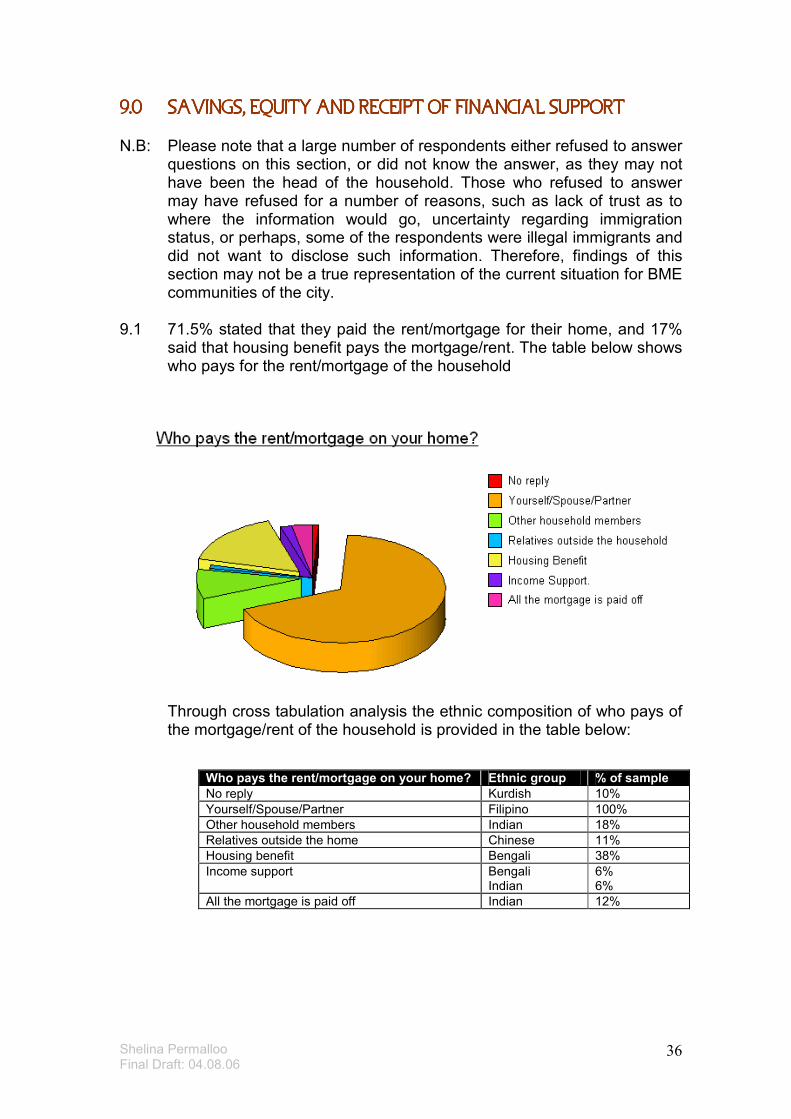
9.1 71.5% stated that they paid the rent/mortgage for their home, and 17%
said that housing benefit pays the mortgage/rent. The table below shows who pays for the rent/mortgage of the household
Through cross tabulation analysis the ethnic composition of who pays of the mortgage/rent of the household is provided in the table below:
Who pays the rent/mortgage on your home? Ethnic group % of sample
No reply Kurdish 10%
Yourself/Spouse/Partner Filipino 100%
Other household members Indian 18%
Relatives outside the home Chinese 11%
Housing benefit Bengali 38%
Income support Bengali Indian
6% 6%
All the mortgage is paid off Indian 12%
Shelina Permalloo Final Draft: 04.08.06
37
9.2 20% of respondents had below £1,000 in savings, 10% had between £1, 000.01 - £3,000, and 2.2% had between £3,000.01 - £5,000. The Filipino
and the Chinese community appeared to have the highest amount of savings
9.3 2.2% of respondents stated that the equity value on their current home is
between £100,000.01 - £150,000, 1.3% said that it was between £75,000.01 - £150,000, 1.3% said that it was above £150,000, and 1.2% said that it was below £1000,00. Of those that answered the ethnic groups with the highest equity value were Filipino, Indian and Pakistani.
9.4 A significant amount of people refused to answer the question on income
with 35% refusing to answer, and 29% stating that they did not know. However, of those who answered, 7% stated that they brought home £1000,01 - £1,500 a week, 5% bringing home £1,500.01 - £2000,00, and 4.1% bringing home £900.01 - £1000.00 a week. The Filipino community stated that they brought home the highest salaries, followed closely by the Polish community, with the Kurdish community bringing home the lowest.
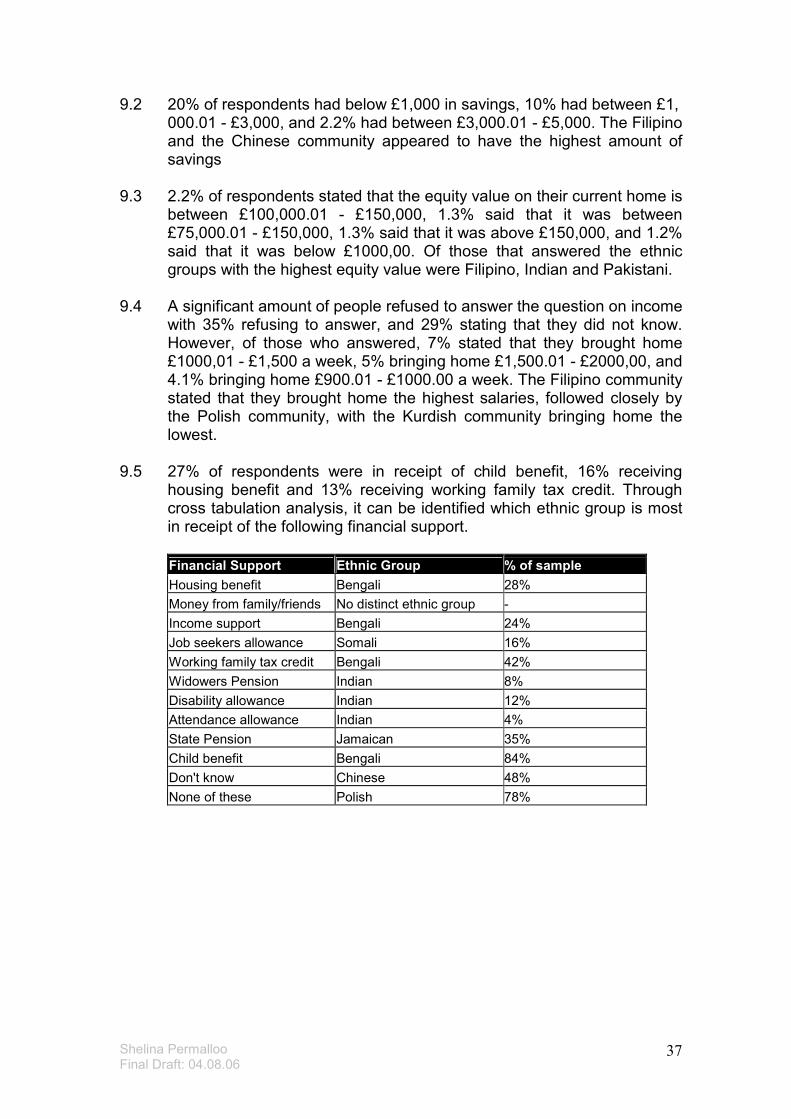
9.5 27% of respondents were in receipt of child benefit, 16% receiving
housing benefit and 13% receiving working family tax credit. Through cross tabulation analysis, it can be identified which ethnic group is most in receipt of the following financial support.
Financial Support Ethnic Group % of sample
Housing benefit Bengali 28%
Money from family/friends No distinct ethnic group -
Income support Bengali 24%
Job seekers allowance Somali 16%
Working family tax credit Bengali 42%
Widowers Pension Indian 8%
Disability allowance Indian 12%
Attendance allowance Indian 4%
State Pension Jamaican 35%
Child benefit Bengali 84%
Don't know Chinese 48%
None of these Polish 78%

Shelina Permalloo Final Draft: 04.08.06
38
DISCUSSION DISCUSSION DISCUSSION DISCUSSION
Section 4 Section 4 Section 4 Section 4
Shelina Permalloo Final Draft: 04.08.06
39
DISCUSSIONDISCUSSIONDISCUSSIONDISCUSSION
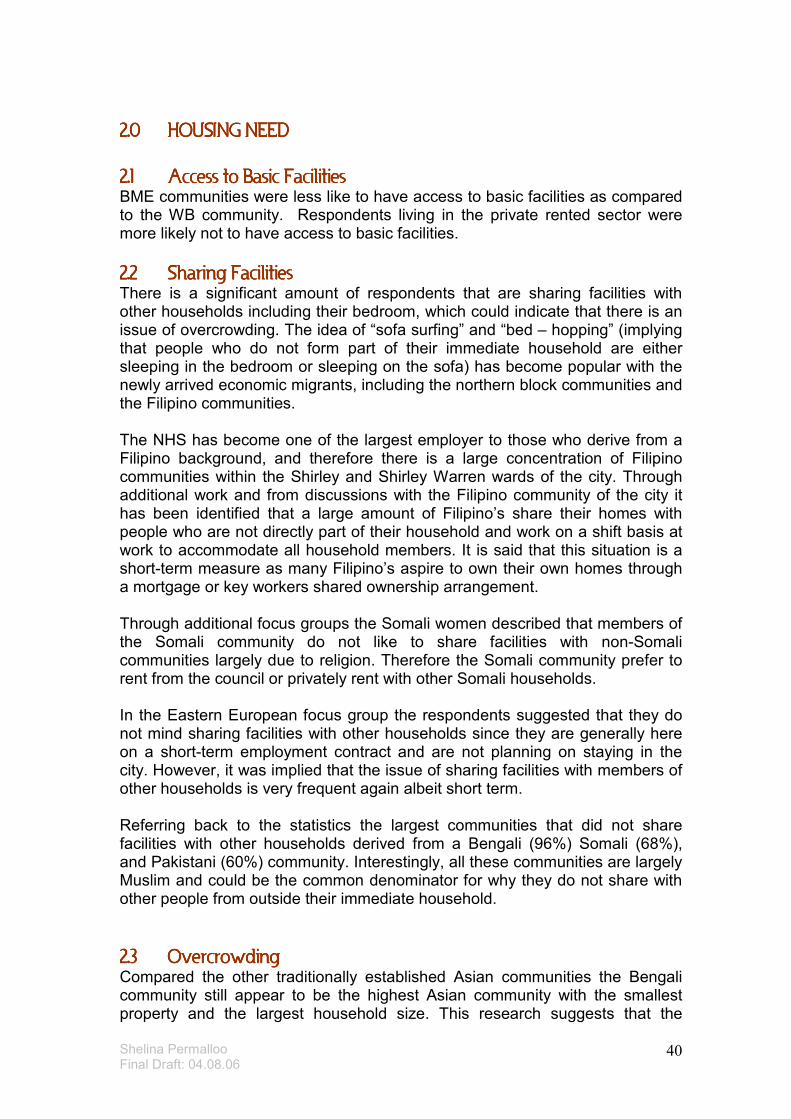
1.01.01.01.0 CURRENT PROPERTYCURRENT PROPERTYCURRENT PROPERTYCURRENT PROPERTY 1.11.11.11.1 Property TypeProperty TypeProperty TypeProperty Type
34.5% of White British (WB) respondents were living in a flat/maisonette, followed by a semi-detached house (28.1%), and then terraced accommodation (23.5%). This report identifies that there was a larger proportion of BME respondents living in terraced accommodation, followed by flats, then semi – detached accommodation.
1.21.21.21.2 TenureTenureTenureTenure WB respondents who were owner-occupiers were more likely to live in semi detached accommodation, compared BME owner-occupiers who were more likely to be living in terraced accommodation. WB respondents appear to have a higher number of bedrooms in their property in comparison to the BME community.
1.31.31.31.3 The Private SectorThe Private SectorThe Private SectorThe Private Sector A large majority of the respondents were living in the private rented sector, the DCA survey suggests that the private rented sector is used as a stepping-stone to other tenure options. However, this research shows that respondents who currently live in the private rented sector lived previously in the private rented sector, and only 16% of respondents moved from private rented accommodation into rented council accommodation. This suggests that at the moment the private rented sector is stagnant for BME communities, and is not being used a mechanism for future home ownership. A possible reason for this could be that some respondents may not have permanent residency within this country, or perhaps are waiting for the results of their residency and therefore may not be eligible for home ownership options.
1.41.41.41.4 Reasons for Moving to Current PropertyReasons for Moving to Current PropertyReasons for Moving to Current PropertyReasons for Moving to Current Property Most respondents across tenures said that they moved to their present home to find a bigger property and better housing. However, 5% of respondents who were mainly Kurdish, Jamaican and Pakistani, said that they moved to avoid harassment. Through additional focus group discussion, it was identified that a large number of Kurdish people felt that both the WB community and the police were hostile, and racist incidents were left unresolved. The Somali focus group participants also stated that incidents of anti social and racist behaviour would not be resolved due to animosity felt towards the police. There Is a need for further research into this, as present data is not sufficient.
Shelina Permalloo Final Draft: 04.08.06
40
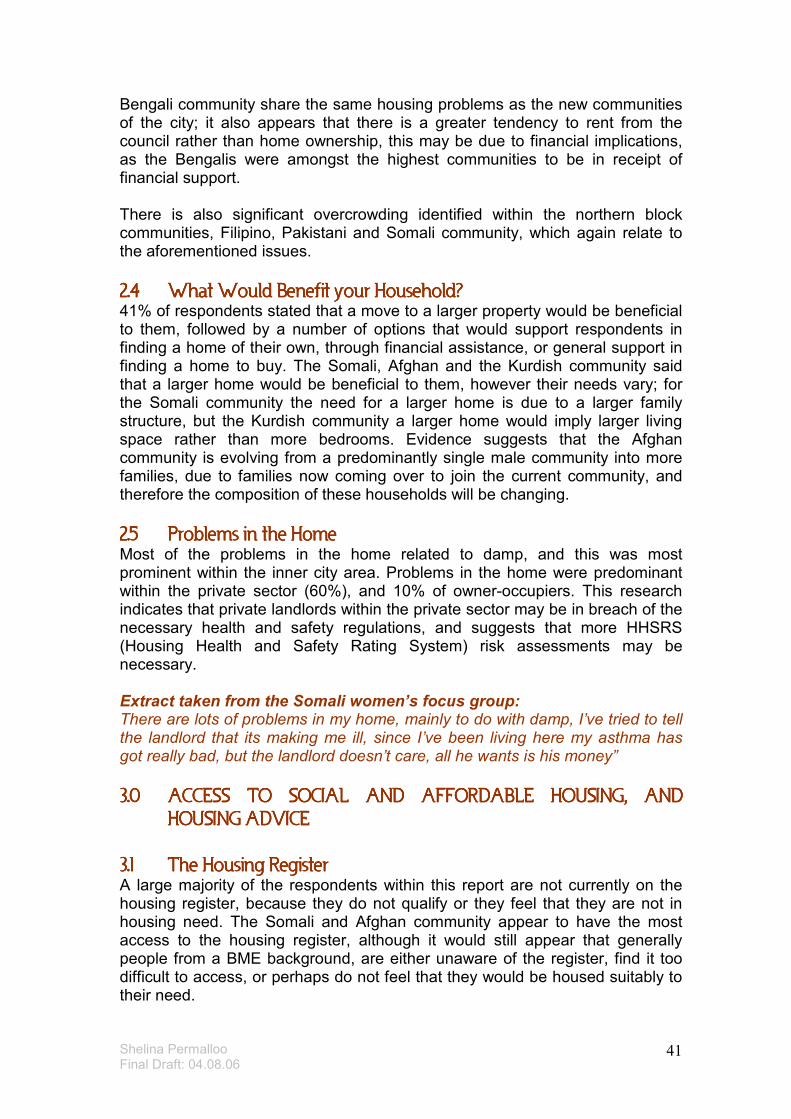
2.02.02.02.0 HOUSING NEEDHOUSING NEEDHOUSING NEEDHOUSING NEED 2.12.12.12.1 Access to Basic FacilitiesAccess to Basic FacilitiesAccess to Basic FacilitiesAccess to Basic Facilities BME communities were less like to have access to basic facilities as compared to the WB community. Respondents living in the private rented sector were more likely not to have access to basic facilities.
2.22.22.22.2 Sharing FacilitiesSharing FacilitiesSharing FacilitiesSharing Facilities There is a significant amount of respondents that are sharing facilities with other households including their bedroom, which could indicate that there is an issue of overcrowding. The idea of “sofa surfing” and “bed – hopping” (implying that people who do not form part of their immediate household are either sleeping in the bedroom or sleeping on the sofa) has become popular with the newly arrived economic migrants, including the northern block communities and the Filipino communities. The NHS has become one of the largest employer to those who derive from a Filipino background, and therefore there is a large concentration of Filipino communities within the Shirley and Shirley Warren wards of the city. Through additional work and from discussions with the Filipino community of the city it has been identified that a large amount of Filipino’s share their homes with people who are not directly part of their household and work on a shift basis at work to accommodate all household members. It is said that this situation is a short-term measure as many Filipino’s aspire to own their own homes through a mortgage or key workers shared ownership arrangement. Through additional focus groups the Somali women described that members of the Somali community do not like to share facilities with non-Somali communities largely due to religion. Therefore the Somali community prefer to rent from the council or privately rent with other Somali households. In the Eastern European focus group the respondents suggested that they do not mind sharing facilities with other households since they are generally here on a short-term employment contract and are not planning on staying in the city. However, it was implied that the issue of sharing facilities with members of other households is very frequent again albeit short term. Referring back to the statistics the largest communities that did not share facilities with other households derived from a Bengali (96%) Somali (68%), and Pakistani (60%) community. Interestingly, all these communities are largely Muslim and could be the common denominator for why they do not share with other people from outside their immediate household.
2.32.32.32.3 OvercrowdingOvercrowdingOvercrowdingOvercrowding Compared the other traditionally established Asian communities the Bengali community still appear to be the highest Asian community with the smallest property and the largest household size. This research suggests that the
Shelina Permalloo Final Draft: 04.08.06
41
Bengali community share the same housing problems as the new communities of the city; it also appears that there is a greater tendency to rent from the council rather than home ownership, this may be due to financial implications, as the Bengalis were amongst the highest communities to be in receipt of financial support. There is also significant overcrowding identified within the northern block communities, Filipino, Pakistani and Somali community, which again relate to the aforementioned issues.
2.42.42.42.4 What Would Benefit your Household?What Would Benefit your Household?What Would Benefit your Household?What Would Benefit your Household? 41% of respondents stated that a move to a larger property would be beneficial to them, followed by a number of options that would support respondents in finding a home of their own, through financial assistance, or general support in finding a home to buy. The Somali, Afghan and the Kurdish community said that a larger home would be beneficial to them, however their needs vary; for the Somali community the need for a larger home is due to a larger family structure, but the Kurdish community a larger home would imply larger living space rather than more bedrooms. Evidence suggests that the Afghan community is evolving from a predominantly single male community into more families, due to families now coming over to join the current community, and therefore the composition of these households will be changing.
2.52.52.52.5 Problems in the HomeProblems in the HomeProblems in the HomeProblems in the Home Most of the problems in the home related to damp, and this was most prominent within the inner city area. Problems in the home were predominant within the private sector (60%), and 10% of owner-occupiers. This research indicates that private landlords within the private sector may be in breach of the necessary health and safety regulations, and suggests that more HHSRS (Housing Health and Safety Rating System) risk assessments may be necessary. Extract taken from the Somali women’s focus group: There are lots of problems in my home, mainly to do with damp, I’ve tried to tell the landlord that its making me ill, since I’ve been living here my asthma has got really bad, but the landlord doesn’t care, all he wants is his money”
3.03.03.03.0 ACCESS TO SOCIAL AND AFFORDABLE HOUSING, AND ACCESS TO SOCIAL AND AFFORDABLE HOUSING, AND ACCESS TO SOCIAL AND AFFORDABLE HOUSING, AND ACCESS TO SOCIAL AND AFFORDABLE HOUSING, AND HOUSING ADVICEHOUSING ADVICEHOUSING ADVICEHOUSING ADVICE
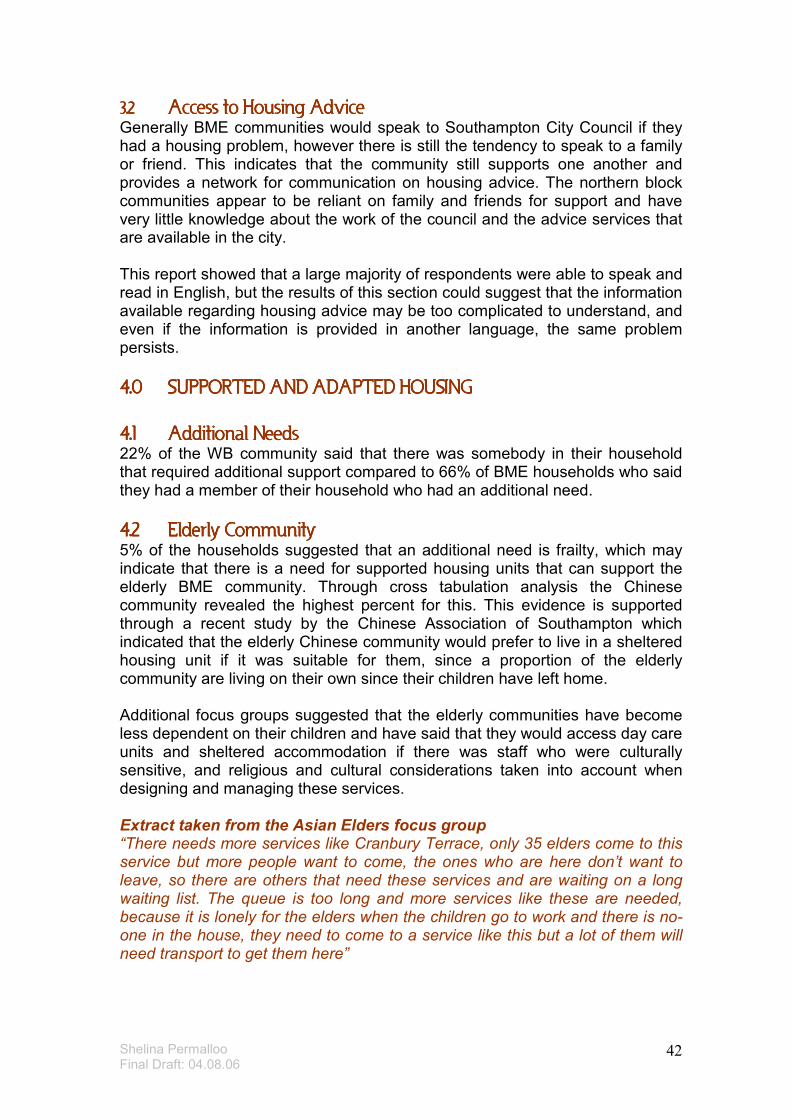
3.13.13.13.1 The Housing RegisterThe Housing RegisterThe Housing RegisterThe Housing Register A large majority of the respondents within this report are not currently on the housing register, because they do not qualify or they feel that they are not in housing need. The Somali and Afghan community appear to have the most access to the housing register, although it would still appear that generally people from a BME background, are either unaware of the register, find it too difficult to access, or perhaps do not feel that they would be housed suitably to their need.
Shelina Permalloo Final Draft: 04.08.06
42
3.23.23.23.2 Access to Housing AdviceAccess to Housing AdviceAccess to Housing AdviceAccess to Housing Advice Generally BME communities would speak to Southampton City Council if they had a housing problem, however there is still the tendency to speak to a family or friend. This indicates that the community still supports one another and provides a network for communication on housing advice. The northern block communities appear to be reliant on family and friends for support and have very little knowledge about the work of the council and the advice services that are available in the city. This report showed that a large majority of respondents were able to speak and read in English, but the results of this section could suggest that the information available regarding housing advice may be too complicated to understand, and even if the information is provided in another language, the same problem persists.
4.04.04.04.0 SUPPORTED AND ADAPTESUPPORTED AND ADAPTESUPPORTED AND ADAPTESUPPORTED AND ADAPTED HOUSINGD HOUSINGD HOUSINGD HOUSING 4.14.14.14.1 Additional NeedsAdditional NeedsAdditional NeedsAdditional Needs 22% of the WB community said that there was somebody in their household that required additional support compared to 66% of BME households who said they had a member of their household who had an additional need.
4.24.24.24.2 Elderly CoElderly CoElderly CoElderly Communitymmunitymmunitymmunity 5% of the households suggested that an additional need is frailty, which may indicate that there is a need for supported housing units that can support the elderly BME community. Through cross tabulation analysis the Chinese community revealed the highest percent for this. This evidence is supported through a recent study by the Chinese Association of Southampton which indicated that the elderly Chinese community would prefer to live in a sheltered housing unit if it was suitable for them, since a proportion of the elderly community are living on their own since their children have left home. Additional focus groups suggested that the elderly communities have become less dependent on their children and have said that they would access day care units and sheltered accommodation if there was staff who were culturally sensitive, and religious and cultural considerations taken into account when designing and managing these services. Extract taken from the Asian Elders focus group “There needs more services like Cranbury Terrace, only 35 elders come to this service but more people want to come, the ones who are here don’t want to leave, so there are others that need these services and are waiting on a long waiting list. The queue is too long and more services like these are needed, because it is lonely for the elders when the children go to work and there is no-one in the house, they need to come to a service like this but a lot of them will need transport to get them here”
Shelina Permalloo Final Draft: 04.08.06
43
4.34.34.34.3 Mental HealthMental HealthMental HealthMental Health Just under half the Kurdish respondents stated that they suffered from a mental health problem, this is a concerning figure which has been supported through evidence from the additional qualitative research. The community suggested that the accommodation that they have been housed in heightens their isolation, which then causes depression. Additional research into this phenomenon is required.
4.44.44.44.4 Adaptation to PropertyAdaptation to PropertyAdaptation to PropertyAdaptation to Property 7.3% of WB households suggested that their home needs adapting whereas 25% of BME households said they need adaptation to their home. The Bengali community appear to need to most adaptations to their home, again this could be due to large family structures and the presence of the extended family unit within this community.
4.54.54.54.5 Provisions for Family HomesProvisions for Family HomesProvisions for Family HomesProvisions for Family Homes There is evidence that BME communities have relatives moving to the City within 3 years. This was prevalent with the Somali, Filipino, Bengali, Zimbabwean and Afghan community. This supports information provided from the voluntary and community sector, whereby it is said that once new communities settle into the city, they then request for their families to come over and live with them. This indicates that newly arrived BME communities will be in demand for properties that can support larger family units, rather than accommodation for single people.
5.05.05.05.0 VIEW ON THE AREAVIEW ON THE AREAVIEW ON THE AREAVIEW ON THE AREA 5.15.15.15.1 Areas of the CityAreas of the CityAreas of the CityAreas of the City
Most BME communities tend to live in the inner city, Shirley or Portswood wards of the city. There appears to be some distinct areas that different BME communities live. The Bengali community have a large presence within the Newtown area, which shows that there is little movement with this community to other areas of the city as compared to the Indian community, who now have a presence within many wards of the city. Settlement patterns are perhaps not always the choice of the individual, however the inner city of Southampton appears to have an adequate social and cultural infrastructure to support these communities. Unfortunately, this will continue to cause a great amount of pressure and will cause increased anti social behaviour, and a diminishing housing stock.
5.25.25.25.2 Satisfaction With Area of ResidenceSatisfaction With Area of ResidenceSatisfaction With Area of ResidenceSatisfaction With Area of Residence 88.4% of the WB community appear to be satisfied with their accommodation, however for the BME community a lower number of 66% were happy with their area of residence. The most dissatisfied communities were the Kurdish, Afghan and Polish, this was related to the issue of anti social behaviour and racism within their area, and unsuitable accommodation for their needs.
Shelina Permalloo Final Draft: 04.08.06
44
5.35.35.35.3 HostilityHostilityHostilityHostility Amongst various Ethnic Groups Amongst various Ethnic Groups Amongst various Ethnic Groups Amongst various Ethnic Groups Through cross tabulation analysis there is evidence of a level of hostility with the northern block communities and the traditionally established BME communities. The additional focus group supported this notion, and participants described the fact that many Eastern Europeans felt hostile towards the Indian community, as they are generally the landlords to the private rented accommodation they live in. The Polish community have said that they prefer to live in Portswood and would not like to live in the inner city, although the inner city areas are a stepping stone for new Eastern European communities when they first enter the country.
6.06.06.06.0 FUTURE HOUSING REQUIREMENTSFUTURE HOUSING REQUIREMENTSFUTURE HOUSING REQUIREMENTSFUTURE HOUSING REQUIREMENTS 6.16.16.16.1 Existing Households Moving in SouthamptonExisting Households Moving in SouthamptonExisting Households Moving in SouthamptonExisting Households Moving in Southampton
40% of BME communities said that they plan to move out within the next 3 years compared to 22% of the WB community. The BME respondents said that they would like to move to Shirley, Portswood and Ocean Village. This information is supported with HomeBid statistics that show BME communities are choosing homes within those areas of the city. The situations preventing a move are both similar for the WB and BME communities; this is because there is are the lack of affordable housing both to buy, and to rent.
6.26.26.26.2 Perception of NeigPerception of NeigPerception of NeigPerception of Neighbourhoodshbourhoodshbourhoodshbourhoods Unfortunately there are areas of the city that people from a BME community are not choosing to live in; these include areas such as Lordswood, Lordshill, Millbrook, Weston and Thornhill. Interestingly, the WB community have suggested that the areas they would like accommodation would be Bassett, Shirley, Portswood, Lordswood then Lordshill. This information provides a distinct contrast to the difference in perception of neighbourhoods. Through additional focus group discussions, the BME communities perceive these areas as being hostile, high anti social behaviour and the presence of racism which all contribute to not making these areas a desirable place to live in.
6.36.36.36.3 Home OwnershipHome OwnershipHome OwnershipHome Ownership 35.4% BME respondents aspire to own their own home, however this figure is lower than the WB community of which 45.8% aspire to own their own home. This is particularly prominent with the Kurdish, Filipino, Zimbabwean and Indian communities. 5.5% of respondents said they would consider shared ownership schemes, whereas 1.5% of the WB community would consider this as an option. Low cost home ownership could be a possible option for these communities. Swaythling Housing Society are currently the Zone Agents for the Key Worker Living Schemes across the South East and there have been 11% of completed sales to BME communities, with the largest ethnic group being white other (5%), Other Asian or Asian British (2%), and other ethnic group (2%).
Shelina Permalloo Final Draft: 04.08.06
45
6.46.46.46.4 Housing needs of Concealed Households Housing needs of Concealed Households Housing needs of Concealed Households Housing needs of Concealed Households When asked who would be moving out of the current household a higher number of friends of the BME respondents would be moving out of the current household to form their own home, than compared to the WB community. This could indicate that more BME communities share their households with people who do not form part of their immediate family. The specific BME communities that said that they would be moving out to form a new household derive from Filipino, Zimbabwean and Lithuanian ethnic backgrounds. The age structures of those moving, and when they plan to move out does not vary enormously between the BME and WB community. Both the WB and BME community have a preference to move to a privately rented accommodation before owner occupation, however the number of concealed BME households wanting to be owner occupiers is higher. The size of the accommodation required by concealed BME households compared to the WB community did not vary significantly although there was a slightly higher proportion of 3 and 4 bedroom properties required. Concealed BME households require accommodation in the aforementioned ‘aspirational’ areas of the city that includes Shirley, Portswood and Ocean Village. WB respondents were less likely to choose Ocean Village but opted for Portswood, Bitterne Manor and then Sholing. There appears to be a trend as to where members of the BME and WB communities would prefer to live, and this again is supported through statistics from Home Bid reports from Southampton City Council. The concealed WB community prefer to live in those locations to be closer to family (31%), followed by the fact that they have always lived there (15%), and then to be close to work (15%), whereas the most important reason for moving to this location for the concealed BME community is to be closer to work. These findings suggest BME respondent seek accommodation in areas which are closer to work, which could then support the reason for why there is an over representation of BME communities living in the central wards of the city.
7.07.07.07.0 INCOME, SAVINGS AND EQUITYINCOME, SAVINGS AND EQUITYINCOME, SAVINGS AND EQUITYINCOME, SAVINGS AND EQUITY The information retrieved in this section of the report is not conclusive in providing an overview of the economic situation for the BME communities of the City. The only inferences which can be drawn is that the Filipino, Polish and Indian communities of the city appear to be the most economically wealthy in terms of income per month, and the amount of equity and savings they have. The Kurdish community are in receipt of the lowest income, again, this information can neither be a true representation nor an indication to a specific communities’ financial situation. Nevertheless, based on this small amount of data received in this section, the research has pointed to the issue that the Bengali community are receiving the
Shelina Permalloo Final Draft: 04.08.06
46
highest amount of financial support more than any other ethnic group. This piece of research confirms previous research, and national research, which states that the Bengali community compared to the other Asian communities, are in receipt of the most financial support and are over represented within the social and affordable housing sector.
Shelina Permalloo Final Draft: 04.08.06
47
RECOMMENDATIONSRECOMMENDATIONSRECOMMENDATIONSRECOMMENDATIONS
Section Section Section Section
Shelina Permalloo Final Draft: 04.08.06
48
5.05.05.05.0 RECOMMENDATIONSRECOMMENDATIONSRECOMMENDATIONSRECOMMENDATIONS
*Please note that this section only highlights the key issues drawn f*Please note that this section only highlights the key issues drawn f*Please note that this section only highlights the key issues drawn f*Please note that this section only highlights the key issues drawn from rom rom rom the research, and requires additional comments from the PWGthe research, and requires additional comments from the PWGthe research, and requires additional comments from the PWGthe research, and requires additional comments from the PWG
The recommendations provided in this section are targeted to the Registered Social Landlords (RSL’s) who form part of Southampton Housing’s Partnership. These recommendations will help RSL’s to develop and deliver housing services in Southampton that reflect both the needs and the aspirations of Southampton’s BME community.
1.01.01.01.0 Diversity Diversity Diversity Diversity 1.1 This report has clearly highlighted that there is a diverse range of ethnic
communities living in Southampton. This diversity should not be overlooked, and BME communities of the City should not be seen as a homogenous group with similar needs. This report has indicated that the needs and aspirations of the various communities are both distinct, and varied from one community to the other.
2.02.02.02.0 Areas to develop and reAreas to develop and reAreas to develop and reAreas to develop and re----developdevelopdevelopdevelop 2.1 BME households identified within this research stated that their local
area of residence was their preferred area of residence, largely due to culture, religion, family and accessibility to their place of work. In an attempt to improve housing conditions, and alleviate the strain of overcrowding in the private sector for owner-occupiers, RSL’s should look into effectively promoting home improvement loans, to assist in adaptations of properties, and to improve the condition of the properties.
2.2 RSL’s should continue to develop homes in the aspirational areas of the
city, which include Shirley, Portswood and Ocean Village. 2.3 Increased HHSRS assessments in private sector accommodation, in
order to effectively monitor the issue of health and safety (*SCC private sector housing department?)
3.03.03.03.0 Tackling Racism and Anti Social BehaviourTackling Racism and Anti Social BehaviourTackling Racism and Anti Social BehaviourTackling Racism and Anti Social Behaviour 3.1 The report identifies a fear of ‘white’ areas of the city due to racism and
anti social behaviour. RSL’s are recommended to work in partnership with Southampton City Council to increase effective management in these “undesirable areas” of the city, and promote community cohesion and increased race awareness (* the issue of cross city migration and Home Bid needs to be examined)
Shelina Permalloo Final Draft: 04.08.06
49
3.2 RSL’s should have a consistent and collective approach to monitoring
issues of anti social behaviour and race harassment. RSL’s should update MAGRH (Southampton’s Multi Agency Group for Race Harassment) in order to ensure that monitoring and management of race harassment and anti social behaviour is effective across RSL’s operating within the city.
3.3 RSL’s should continue to provide homes in new areas of the city, and
work closely with the local community in the design of the development to ensure, that as far as possible, it is able to meet the needs of those communities.
3.4 RSL’s should examine the option of linked re-housing options – where
more than one family can be reallocated to a particular area to increase cohesion and lessen the impact of social isolation.
3.5 RSL’s community involvement and tenant participation teams should
build networks with young people in order to increase youth activities in the inner city. These activities would serve to promote race equality and attempt to decrease anti social behaviour within these areas. This could also be linked to working in partnership with neighbourhood wardens to increase community safety in the area.
3.6 A high proportion of the young single men of the city, Kurdish,
Zimbabwean, Afghan have highlighted an interest in receiving cultural and race support, and also organised social activities. This again could be incorporated into RSL community involvement and tenant participation strategies.
4.04.04.04.0 Communicating Housing OptionCommunicating Housing OptionCommunicating Housing OptionCommunicating Housing Optionssss 4.1 RSL’s to work alongside the community and voluntary sector to provide
appropriate housing advice and support for new communities. Drop in services, and open days would provide face-to-face information, rather than translating leaflets into different languages. According to the research most written information is either too complicated, or not in the right language. Even if the information has been translated the concept is not easily understood in another language.
4.2 RSL’s should develop a more hand’s on approach to advertising new
developments to BME communities, through ethnic media options, and through word of mouth.
5.05.05.05.0 Supported and Adapted HousingSupported and Adapted HousingSupported and Adapted HousingSupported and Adapted Housing 5.1 This report has shown that the family structure is evolving, whereby the
elderly BME communities are becoming more independent and less dependent on the extended family unit. RSL’s should consider
Shelina Permalloo Final Draft: 04.08.06
50
developing culturally sensitive supported housing provisions for elderly BME communities, in order to accommodate these changing needs and aspirations of these members of the community.
5.2 RSL’s need to work more closely with specialist tenancy support teams,
supporting people, and the voluntary sector to ensure that certain communities identified within the research have access to the right level of support, in order to decrease isolation and alleviate depression mental health.
5.3 A possible option is having a pool of tenancy support workers which can
speak more than one community language, or have an awareness of the cultural and ethnic needs of BME tenants – a service that all RSL’s can use (*again more information needed here)
6.06.06.06.0 Home Ownership Options Home Ownership Options Home Ownership Options Home Ownership Options 6.1 RSL’s should ensure that new developments are advertised in the right
medium to ensure that all communities access information on shared ownership, key worker living and shared equity schemes.
6.2 The report has identified that the Filipino community have shown the
most interest in home ownership, and according to ethnic monitoring of completed sales in Homes in Hants, there has been a considerable uptake from the Filipino community. RSL’s to examine which professions have the highest BME uptake and advertise low cost home ownership accordingly.


![First Nations Picture Book Unit[1] - WordPress.com · bbbb cccc dddd eeee ffff gggg hhhh iiii jjjj kkkk llll mmmm nnnn oooo pppp qqqq rrrr ssss tttt uuuu vvvv ...](https://static.fdocuments.in/doc/165x107/5b0606477f8b9ac33f8c3cab/first-nations-picture-book-unit1-cccc-dddd-eeee-ffff-gggg-hhhh-iiii-jjjj-kkkk.jpg)