CBS CORPORATION REPORTS STRONG FOURTH QUARTER AND FULL YEAR 2011
20
CBS CORPORATION REPORTS STRONG FOURTH QUARTER AND FULL YEAR 2011 ADJUSTED RESULTS Fourth Quarter EPS of $.57 Up 24% Fourth Quarter OIBDA of $837 Million Up 9% Full Year EPS of $1.94 Up 75% Full Year OIBDA of $3.1 Billion Up 32% NEW YORK, February 15, 2012 – CBS Corporation (NYSE: CBS.A and CBS) today reported results for the fourth quarter and full year ended December 31, 2011. “CBS’s strategy of producing and distributing industry-leading content around the world and across multiple platforms continues to pay off,” said Sumner Redstone, Executive Chairman, CBS Corporation. “Our programming gets stronger every year, and our financial performance grows more and more robust. I am proud of the efforts of Leslie and his team, and I am certain CBS will continue to be a powerhouse throughout this year and beyond.” “2011 was a record year for CBS, and we’re confident 2012 will be even better,” said Leslie Moonves, President and Chief Executive Officer, CBS Corporation. “In the fourth quarter, margins continued to expand, and EPS continued to grow. And we’ve recently taken strategic steps to accelerate our growth in what we see as an improving marketplace. We’ve reached another key retransmission agreement, and we’ve extended our NFL contract well into the future. In addition, the performance of the CBS Television Network in the first half of this season was the industry’s best in decades. Plus, as the election season progresses and the automotive rebound continues, our local businesses will continue to improve. What’s particularly exciting, however, is our ability to capitalize on the fundamental changes in our business model, meaning that the ways we get paid for our content are becoming more lucrative all the time. As our momentum builds and our revenue mix becomes more steady and recurring, we are positioned to enhance margins, drive earnings, and return significant value to our shareholders for many years to come.”
Transcript of CBS CORPORATION REPORTS STRONG FOURTH QUARTER AND FULL YEAR 2011

CBS CORPORATION REPORTS STRONG FOURTH QUARTER AND
FULL YEAR 2011 ADJUSTED RESULTS
Fourth Quarter EPS of $.57 Up 24%
Fourth Quarter OIBDA of $837 Million Up 9%
Full Year EPS of $1.94 Up 75%
Full Year OIBDA of $3.1 Billion Up 32%
NEW YORK, February 15, 2012 – CBS Corporation (NYSE: CBS.A and CBS) today reported results for the
fourth quarter and full year ended December 31, 2011.
“CBS’s strategy of producing and distributing industry-leading content around the world and across multiple
platforms continues to pay off,” said Sumner Redstone, Executive Chairman, CBS Corporation. “Our
programming gets stronger every year, and our financial performance grows more and more robust. I am proud
of the efforts of Leslie and his team, and I am certain CBS will continue to be a powerhouse throughout this year
and beyond.”
“2011 was a record year for CBS, and we’re confident 2012 will be even better,” said Leslie Moonves, President
and Chief Executive Officer, CBS Corporation. “In the fourth quarter, margins continued to expand, and EPS
continued to grow. And we’ve recently taken strategic steps to accelerate our growth in what we see as an
improving marketplace. We’ve reached another key retransmission agreement, and we’ve extended our NFL
contract well into the future. In addition, the performance of the CBS Television Network in the first half of this
season was the industry’s best in decades. Plus, as the election season progresses and the automotive rebound
continues, our local businesses will continue to improve. What’s particularly exciting, however, is our ability to
capitalize on the fundamental changes in our business model, meaning that the ways we get paid for our content
are becoming more lucrative all the time. As our momentum builds and our revenue mix becomes more steady
and recurring, we are positioned to enhance margins, drive earnings, and return significant value to our
shareholders for many years to come.”

2
Fourth Quarter 2011 Results
Revenues were $3.78 billion for the fourth quarter of 2011 compared with $3.90 billion for the fourth quarter of
2010, which included the second-cycle syndication sale of CSI: Crime Scene Investigation and significant
political advertising. Revenues in 2011 benefited from the Company’s new digital streaming agreements and
higher affiliate and subscription fees, including retransmission revenues.
Adjusted operating income before depreciation and amortization (“OIBDA”) of $837 million for the fourth
quarter of 2011 increased 9% from $771 million in the same prior-year period, with adjusted OIBDA margin
expansion of two percentage points, to 22%. The Company’s adjusted OIBDA growth and margin expansion
were driven by increases in high-margin revenues, including digital streaming and affiliate and subscription fee
revenues, as well as lower costs associated with the timing of programming.
Adjusted operating income for the fourth quarter of 2011 increased 11% to $701 million from $632 million for
the same quarter in 2010.
Adjusted net earnings from continuing operations for the fourth quarter of 2011 were $384 million, or $.57 per
diluted share, up from $320 million, or $.46 per diluted share, for the prior-year period. The increase in earnings
per share (“EPS”) was driven by the Company’s OIBDA growth, lower interest expense, and lower weighted
average shares outstanding, reflecting the impact of share repurchases in 2011.
During the fourth quarter of 2011, in a continued effort to reduce its cost structure, the Company initiated
restructuring activities, which resulted in charges totaling $46 million associated with the relocation and closure
of certain business activities and other exit costs.
Adjusted results for the fourth quarter of 2011 exclude restructuring charges. Results for the fourth quarter of
2010 were adjusted at that time to exclude restructuring charges of $15 million and a pre-tax loss on early
extinguishment of debt of $43 million. Reported operating income increased 6% to $655 million from $617
million for the same prior-year period. Reported net earnings from continuing operations for the fourth quarter
of 2011 were $356 million, or $.53 per diluted share, up from $283 million, or $.41 per diluted share, for the
same prior-year period. Reconciliations of non-GAAP measures to reported results are included at the end of
this earnings release.

3
Full Year 2011 Results
Full year 2011 revenues of $14.25 billion increased 1% from the prior year, led by growth in higher-margin
revenues, including a 6% rise in content licensing and distribution revenues, which were driven by new digital
streaming agreements; a 9% increase in affiliate and subscription fee revenues; and growth in underlying
advertising revenues. Comparability of revenues for 2011 was affected by the benefits to 2010 from CBS
Television Network’s broadcast of Super Bowl XLIV and significant political advertising revenues for midterm
elections, as well as the new programming agreement for the NCAA Division I Men’s Basketball Championship
(“NCAA Tournament”), which resulted in lower revenues but higher profits for 2011.
Adjusted OIBDA for 2011 was up 32% to $3.12 billion from $2.37 billion for 2010, and the adjusted OIBDA
margin rose five percentage points, to 22%. This increase was driven by the aforementioned growth in high-
margin revenues and significantly lower sports programming costs, which resulted from the new agreement for
the NCAA Tournament and the absence of the Super Bowl XLIV broadcast. Adjusted operating income for 2011
increased 43% to $2.58 billion from $1.81 billion for 2010.
For the full year 2011, adjusted net earnings from continuing operations of $1.32 billion was up from $773
million in 2010, and adjusted diluted EPS from continuing operations increased to $1.94, a record for the
Company, from $1.11 per diluted share in 2010. EPS growth was driven by the increase in OIBDA, lower
interest expense, and lower weighted average shares outstanding, reflecting the impact of the 2011 share
repurchases.
Adjusted results for 2011 exclude restructuring charges of $46 million. Results for 2010 were adjusted at that
time to exclude a favorable settlement related to previously disposed businesses of $90 million, restructuring
charges of $81 million, a pre-tax loss on early extinguishment of debt of $81 million, a pre-tax gain on a
disposition of $8 million, and a net provision from discrete tax items of $8 million. Reported operating income
increased 39% to $2.53 billion from $1.82 billion. Reported net earnings from continuing operations for 2011
were $1.29 billion, or $1.90 per diluted share, up from $724 million, or $1.04 per diluted share, for 2010.
Reconciliations of non-GAAP measures to reported results are included at the end of this earnings release.

4
Free Cash Flow, Balance Sheet and Liquidity
During the fourth quarter of 2011, the Company made a contribution of $200 million to pre-fund its qualified
pension plans. Consequently, free cash flow for the fourth quarter of 2011 reflected an outflow of $44 million
compared to an inflow of $40 million for the fourth quarter of 2010, which included a pension contribution of
$167 million. Free cash flow for 2010 also benefited from the receipt of a $90 million settlement related to
previously disposed businesses. For the 2011 full year, free cash flow, which included pension contributions of
$410 million, increased 2% to $1.48 billion from $1.45 billion for 2010, primarily reflecting the OIBDA
increase.
The Company repurchased 7.0 million shares of CBS Corporation Class B Common Stock during the fourth
quarter of 2011 for $170 million under its share repurchase program, bringing repurchases for the full year to
42.2 million shares for $1.02 billion. At December 31, 2011, the Company’s cash balance was $660 million,
$180 million higher than December 31, 2010; debt outstanding was $5.98 billion; and there were no credit
facility borrowings.

5
Consolidated and Segment Results (dollars in millions)
The tables below present the Company’s revenues by segment and type and its adjusted OIBDA and adjusted
operating income by segment for the three and twelve months ended December 31, 2011, and 2010.
Reconciliations of all non-GAAP measures to reported results are included at the end of this earnings release.
Three Months Ended Twelve Months Ended December 31, December 31, Revenues by Segment 2011 2010 2011 2010 Entertainment $ 1,995 $ 2,021 $ 7,457 $ 7,391 Cable Networks 395 368 1,621 1,475 Publishing 229 232 787 791 Content Group 2,619 2,621 9,865 9,657 Local Broadcasting 721 821 2,689 2,782 Outdoor 514 511 1,894 1,819 Local Group 1,235 1,332 4,583 4,601 Eliminations (70) (52) (203) (198) Total Revenues $ 3,784 $ 3,901 $ 14,245 $ 14,060 Three Months Ended Twelve Months Ended December 31, December 31, Revenues by Type 2011 2010 2011 2010 Advertising $ 2,508 $ 2,623 $ 9,007 $ 9,153 Content licensing and distribution 758 796 3,254 3,071 Affiliate and subscription fees 460 426 1,744 1,598 Other 58 56 240 238 Total Revenues $ 3,784 $ 3,901 $ 14,245 $ 14,060 Three Months Ended Twelve Months Ended December 31, December 31, Adjusted OIBDA 2011 2010 2011 2010 Entertainment $ 318 $ 249 $ 1,431 $ 894 Cable Networks 175 169 707 569 Publishing 28 20 92 72 Content Group 521 438 2,230 1,535 Local Broadcasting 266 322 849 865 Outdoor 131 101 346 289 Local Group 397 423 1,195 1,154 Corporate (64) (64) (228) (218) Residual costs (19) (27) (75) (105) Eliminations 2 1 1 4 Adjusted OIBDA 837 771 3,123 2,370 Other discrete items (a) — — — 90 Restructuring charges (46) (15) (46) (81) Total OIBDA $ 791 $ 756 $ 3,077 $ 2,379 Three Months Ended Twelve Months Ended December 31, December 31, Adjusted Operating Income (Loss) 2011 2010 2011 2010 Entertainment $ 275 $ 209 $ 1,271 $ 731 Cable Networks 169 163 684 546 Publishing 27 18 85 65 Content Group 471 390 2,040 1,342 Local Broadcasting 242 296 750 765 Outdoor 76 42 111 40 Local Group 318 338 861 805 Corporate (71) (70) (252) (239) Residual costs (19) (27) (75) (105) Eliminations 2 1 1 4 Adjusted Operating Income 701 632 2,575 1,807 Other discrete items (a) — — — 90 Restructuring charges (46) (15) (46) (81) Total Operating Income $ 655 $ 617 $ 2,529 $ 1,816 (a) See reconciliations at the end of this earnings release for descriptions of the components of other discrete items.

6
Entertainment (CBS Television Network, CBS Television Studios, CBS Studios International, CBS Television
Distribution, CBS Films, and CBS Interactive)
Entertainment revenues for the fourth quarter of 2011 decreased 1% to $2.00 billion from $2.02 billion for the
same prior-year period. The decrease reflects the second-cycle syndication sale of CSI: Crime Scene
Investigation during the fourth quarter of 2010. At the same time, in 2011 the Company benefited from new
multiyear domestic and international licensing agreements for digital streaming as well as increases in
retransmission revenues. Advertising revenues for the fourth quarter of 2011 were essentially flat compared with
the fourth quarter of 2010.
Fourth Quarter
Entertainment adjusted OIBDA for the fourth quarter of 2011 increased 28% to $318 million from $249 million,
with margin improvement of four percentage points to 16% compared with the same prior-year period. The
increase in adjusted OIBDA and strong margin expansion were driven by growth in high-margin revenues,
primarily reflecting the impact of the aforementioned digital streaming agreements, as well as lower costs,
which were largely driven by the timing of production and distribution expenses. Adjusted OIBDA excludes
restructuring charges of $40 million for 2011 and $12 million for 2010.
Entertainment revenues of $7.46 billion for 2011 increased 1% from $7.39 billion in 2010. Revenues grew
despite the benefit to 2010 from the CBS Television Network’s broadcast of Super Bowl XLIV and the impact of
the new programming agreement for the NCAA Tournament, which resulted in lower revenues but higher
profits for 2011. Revenue growth was driven by new licensing agreements for digital streaming, growth in
underlying advertising revenues for the CBS Television Network, and higher retransmission revenues.
Full Year
Entertainment adjusted OIBDA for 2011 increased 60% to $1.43 billion from $894 million for 2010, and the
adjusted OIBDA margin increased seven percentage points to 19%. The strong adjusted OIBDA growth and
margin expansion were driven by the aforementioned growth in high-margin streaming and retransmission
revenues; significantly lower sports programming costs resulting from the new agreement for the NCAA
Tournament and the absence of the Super Bowl XLIV broadcast; and lower costs primarily driven by the timing
of production and distribution expenses. Adjusted OIBDA excludes restructuring charges of $40 million for
2011 and $23 million for 2010.

7
Cable Networks (Showtime Networks, CBS Sports Network, and Smithsonian Networks)
Cable Networks revenues for the fourth quarter of 2011 increased 7% to $395 million from $368 million for the
same prior-year period. The results were driven by rate increases and growth in subscriptions to Showtime
Networks, CBS Sports Network, and Smithsonian Networks, as well as higher revenues from the licensing of
Showtime original series. As of December 31, 2011, subscriptions totaled 73 million for Showtime Networks
(including Showtime, The Movie Channel, and Flix), 44 million for CBS Sports Network, and 12 million for
Smithsonian Networks.
Fourth Quarter
Cable Networks OIBDA for the fourth quarter of 2011 grew 4% to $175 million from $169 million for the same
prior-year period, primarily reflecting revenue growth, partially offset by the timing of advertising costs for
original series premieres.
Cable Networks revenues for 2011 increased 10% to $1.62 billion from $1.48 billion for 2010, driven by rate
increases and growth in subscriptions to Showtime Networks, CBS Sports Network, and Smithsonian Networks,
as well as higher revenues from the licensing of Showtime original series.
Full Year
Cable Networks OIBDA of $707 million for 2011 increased 24% from adjusted OIBDA of $569 million in
2010, driven by revenue growth and lower theatrical programming costs. The increase was partially offset by
higher advertising and programming costs for original series. Adjusted OIBDA for 2010 excludes restructuring
charges of $3 million.
Publishing (Simon & Schuster)
Publishing revenues for the fourth quarter of 2011 decreased 1% to $229 million from $232 million for the same
prior-year period, as strong growth in the sale of more profitable digital content was offset by lower print book
sales. Sales of digital content increased 83% from the 2010 fourth quarter and represented approximately 18%
of total Publishing revenues. Best-selling titles in the fourth quarter included Steve Jobs by Walter Isaacson and
11/22/63 by Stephen King.
Fourth Quarter
Publishing adjusted OIBDA for the fourth quarter of 2011 increased 40% to $28 million from $20 million for
the same prior-year period. This increase was primarily driven by lower expenses resulting from the significant
increase in more profitable digital sales as a percentage of total revenues and the absence of a provision for
doubtful accounts recorded in the fourth quarter of 2010. Adjusted OIBDA excludes restructuring charges of $2
million for both the fourth quarter of 2011 and 2010.

8
Publishing revenues for 2011 decreased 1% to $787 million from $791 million for the prior year, as strong
growth in the sale of digital content, which more than doubled from 2010, was offset by lower print book sales.
Full Year
Publishing adjusted OIBDA for 2011 rose 28% to $92 million from $72 million for the prior year, reflecting
lower direct operating costs. These include the impact of cost-containment measures, the decline in expenses
resulting from an increase in more profitable digital sales as a percentage of total revenues, and the absence of a
provision for doubtful accounts recorded in 2010. Adjusted OIBDA excludes restructuring charges of $2 million
for 2011 and $4 million for 2010.
Local Broadcasting (CBS Television Stations and CBS Radio)
Local Broadcasting revenues for the fourth quarter of 2011 decreased 12% to $721 million from $821 million
for the same prior-year period. The decline is entirely attributable to lower political advertising sales as well as
lost revenues resulting from the NBA lockout during 2011. CBS Television Stations revenues decreased 18%,
also reflecting lower political sales and lost NBA advertising revenues, partially offset by higher retransmission
revenues and an improvement in auto advertising. CBS Radio revenues decreased 5%, reflecting the decline in
political spending, which was partially offset by growth in domestic auto and financial services advertising.
Fourth Quarter
Local Broadcasting OIBDA for the fourth quarter of 2011 decreased $56 million to $266 million from $322
million for the same prior-year period. Lower programming expenses, in part because of the NBA lockout, and
the impact of cost-containment measures overcame nearly half of the revenue decline.
Local Broadcasting revenues for 2011 decreased 3% to $2.69 billion from $2.78 billion because of a difficult
comparison to 2010, which included significant political advertising sales and revenues from the 2010 Super
Bowl broadcast. CBS Television Stations revenues decreased 7%, driven by the impact of these two
noncomparable items as well as lost revenues from the NBA lockout during 2011. Revenues for CBS Television
Stations also reflected higher retransmission revenues and growth in domestic auto and financial services
advertising. CBS Radio revenues increased slightly from the prior year, reflecting growth in domestic auto,
financial services, and retail advertising, partially offset by lower political advertising sales.
Full Year
Local Broadcasting OIBDA for 2011 decreased 2% to $849 million from adjusted OIBDA of $865 million for
2010, as the revenue decline was substantially offset by lower programming and production costs for syndicated
and sports programming. Adjusted OIBDA for 2010 excludes restructuring charges of $25 million.

9
Outdoor (CBS Outdoor)
Outdoor revenues for the fourth quarter of 2011 increased 1% to $514 million from $511 million for the same
prior-year period. Revenues for the Americas (comprising North America and South America) increased slightly
in constant dollars for the fourth quarter of 2011 from the same prior-year period, principally reflecting rate
increases in the U.S. billboards business, partially offset by the impact from the nonrenewal of the Toronto
transit contract. Revenues for Europe increased 3% in constant dollars, primarily reflecting higher revenues in
the United Kingdom.
Fourth Quarter
Outdoor adjusted OIBDA for the fourth quarter of 2011 increased 30% to $131 million from $101 million for
the same prior-year period, driven by revenue growth and lower costs, resulting primarily from the mix of more
profitable contracts and the settlement of legal matters. Adjusted OIBDA excludes restructuring charges of $4
million for the fourth quarter of 2011 and $1 million for the same prior-year period.
Outdoor revenues for 2011 increased 4% to $1.89 billion from $1.82 billion in 2010, principally reflecting the
improvement in the outdoor advertising marketplace in the Americas and the favorable impact of foreign-
exchange rate changes. Revenues for the Americas grew 4% in constant dollars, reflecting rate increases in the
U.S. billboards and displays businesses, partially offset by the impact of the nonrenewal of the Toronto transit
contract. Revenues for Europe in 2011 decreased 2% in constant dollars, reflecting weakness in the European
economy.
Full Year
Outdoor adjusted OIBDA for 2011 increased 20% to $346 million from $289 million for 2010, driven by the
revenue growth and lower costs, resulting primarily from the mix of more profitable contracts and the settlement
of legal matters. Adjusted OIBDA excludes restructuring charges of $4 million for 2011 and $26 million for
2010.

10
Corporate
Corporate expenses before depreciation of $64 million for the fourth quarter of 2011 remained flat compared
with the same prior-year period. For the full year, corporate expenses increased $10 million to $228 million,
primarily driven by higher incentive compensation associated with the Company’s improved operating results.
Residual Costs
Residual costs include pension and postretirement benefits costs for plans retained by the Company for
previously divested businesses. For the fourth quarter of 2011, residual costs decreased $8 million to $19 million
compared with the same prior-year period. For the full year, residual costs decreased $30 million to $75 million
from adjusted residual costs of $105 million for 2010. For each period, the decrease primarily reflected the
favorable performance of pension plan assets in 2010 as well as the benefit from the pre-funding of pension
plans at the end of 2010. Adjusted residual costs for the full year 2010 exclude a settlement of $90 million
related to the favorable resolution of certain disputes regarding previously disposed businesses.
Discontinued Operations
During the fourth quarter of 2011, the Company reached favorable resolutions of certain contingencies related to
its previously disposed businesses, which are accounted for as discontinued operations. As a result, a pre-tax
gain of $23 million ($14 million, net of tax) was recorded in discontinued operations.

11
About CBS Corporation CBS Corporation is a mass media company with constituent parts that reach back to the beginnings of the broadcast industry, as well as newer businesses that operate on the leading edge of the media industry. The Company, through its many and varied operations, combines broad reach with well-positioned local businesses, all of which provide it with an extensive distribution network by which it serves audiences and advertisers in all 50 states and key international markets. It has operations in virtually every field of media and entertainment, including broadcast television (CBS and The CW – a joint venture between CBS Corporation and Warner Bros. Entertainment), cable television (Showtime Networks, Smithsonian Networks and CBS Sports Network), local television (CBS Television Stations), television production and syndication (CBS Television Studios, CBS Studios International and CBS Television Distribution), radio (CBS Radio), advertising on out-of-home media (CBS Outdoor), publishing (Simon & Schuster), interactive media (CBS Interactive), licensing and merchandising (CBS Consumer Products), video/DVD (CBS Home Entertainment), motion pictures (CBS Films), and socially responsible media (EcoMedia). For more information, log on to www.cbscorporation.com. Cautionary Statement Concerning Forward-looking Statements This news release contains both historical and forward-looking statements. All statements other than statements of historical fact are, or may be deemed to be, forward-looking statements within the meaning of section 27A of the Securities Act of 1933 and section 21E of the Securities Exchange Act of 1934. These forward-looking statements are not based on historical facts, but rather reflect the Company’s current expectations concerning future results and events. Similarly, statements that describe our objectives, plans or goals are or may be forward-looking statements. These forward-looking statements involve known and unknown risks, uncertainties and other factors that are difficult to predict and which may cause the actual results, performance or achievements of the Company to be different from any future results, performance or achievements expressed or implied by these statements. These risks, uncertainties and other factors include, among others: advertising market conditions generally; changes in the public acceptance of the Company’s programming; changes in technology and its effect on competition in the Company’s markets; changes in the Federal Communications laws and regulations; the impact of piracy on the Company’s products; the impact of the consolidation in the market for the Company’s programming; other domestic and global economic, business, competitive and/or other regulatory factors affecting the Company’s businesses generally; the impact of union activity, including possible strikes or work stoppages or the Company’s inability to negotiate favorable terms for contract renewals; and other factors described in the Company’s news releases and filings with the Securities and Exchange Commission including but not limited to the Company’s most recent Form 10-K, Form 10-Qs and Form 8-Ks. The forward-looking statements included in this document are made only as of the date of this document, and under section 27A of the Securities Act and section 21E of the Exchange Act, we do not have any obligation to publicly update any forward-looking statements to reflect subsequent events or circumstances. Contacts: Press: Investors: Gil Schwartz Adam Townsend Executive Vice President, Corporate Communications Executive Vice President, Investor Relations (212) 975-2121 (212) 975-5292 [email protected] [email protected] Dana McClintock Jessica Kourakos Senior Vice President, Corporate Communications Vice President, Investor Relations (212) 975-1077 (212) 975-6106 [email protected] [email protected]

12
CBS CORPORATION AND SUBSIDIARIES CONSOLIDATED STATEMENTS OF OPERATIONS (Unaudited; in millions, except per share amounts)
Three Months Ended Twelve Months Ended December 31, December 31, 2011 2010 2011 2010
Revenues $ 3,784 $ 3,901 $ 14,245 $ 14,060 Operating income 655 617 2,529 1,816 Interest expense (106) (130) (436) (529) Interest income 2 2 7 6 Loss on early extinguishment of debt — (43) — (81) Other items, net (10) 13 (17) 10 Earnings before income taxes 541 459 2,083 1,222 Provision for income taxes (186) (172) (755) (463) Equity in earnings (loss) of investee companies, net of tax 1 (4) (37) (35) Net earnings from continuing operations 356 283 1,291 724 Net earnings from discontinued operations 14 — 14 — Net earnings $ 370 $ 283 $ 1,305 $ 724 Basic net earnings per common share: Net earnings from continuing operations $ .55 $ .42 $ 1.94 $ 1.07 Net earnings from discontinued operations $ .02 $ — $ .02 $ — Net earnings $ .57 $ .42 $ 1.97 $ 1.07 Diluted net earnings per common share: Net earnings from continuing operations $ .53 $ .41 $ 1.90 $ 1.04 Net earnings from discontinued operations $ .02 $ — $ .02 $ — Net earnings $ .55 $ .41 $ 1.92 $ 1.04 Weighted average number of common shares outstanding: Basic 653 680 664 679 Diluted 669 698 681 694 Dividends per common share $ .10 $ .05 $ .35 $ .20
13
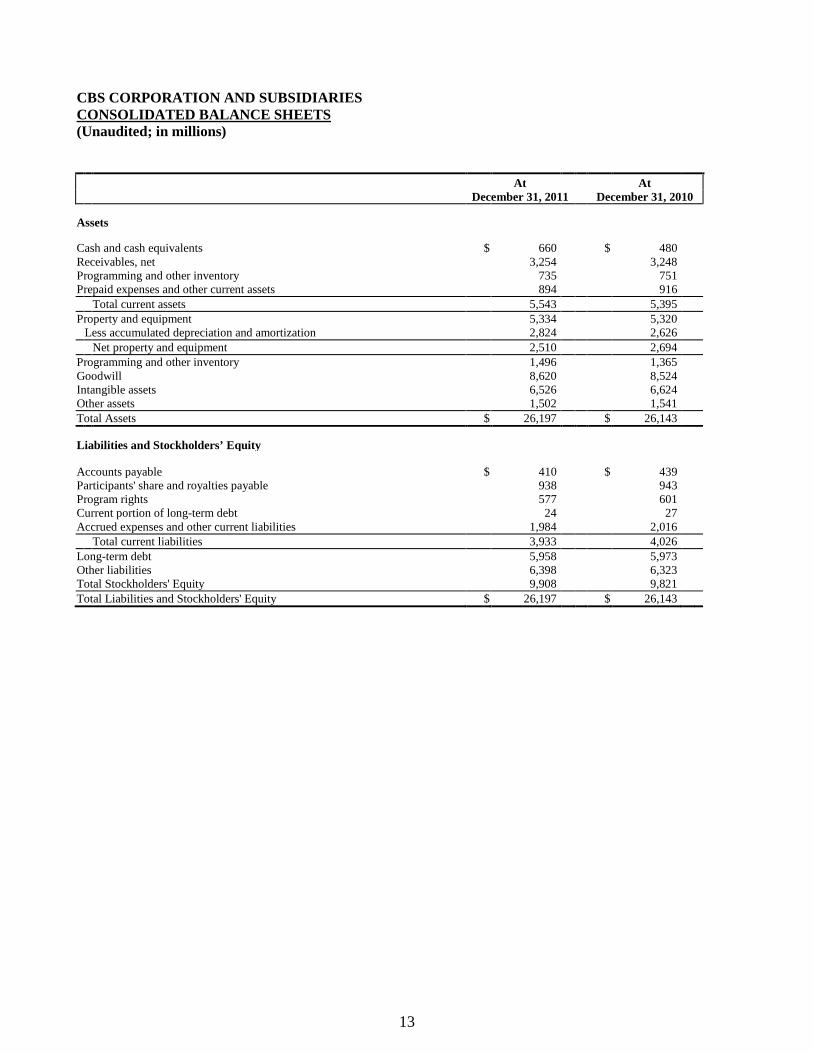
CBS CORPORATION AND SUBSIDIARIES CONSOLIDATED BALANCE SHEETS (Unaudited; in millions) At At December 31, 2011 December 31, 2010 Assets Cash and cash equivalents $ 660 $ 480 Receivables, net 3,254 3,248 Programming and other inventory 735 751 Prepaid expenses and other current assets 894 916 Total current assets 5,543 5,395 Property and equipment 5,334 5,320 Less accumulated depreciation and amortization 2,824 2,626 Net property and equipment 2,510 2,694 Programming and other inventory 1,496 1,365 Goodwill 8,620 8,524 Intangible assets 6,526 6,624 Other assets 1,502 1,541 Total Assets $ 26,197 $ 26,143 Liabilities and Stockholders’ Equity Accounts payable $ 410 $ 439 Participants' share and royalties payable 938 943 Program rights 577 601 Current portion of long-term debt 24 27 Accrued expenses and other current liabilities 1,984 2,016 Total current liabilities 3,933 4,026 Long-term debt 5,958 5,973 Other liabilities 6,398 6,323 Total Stockholders' Equity 9,908 9,821 Total Liabilities and Stockholders' Equity $ 26,197 $ 26,143

14
CBS CORPORATION AND SUBSIDIARIES CONSOLIDATED STATEMENTS OF CASH FLOWS (Unaudited; in millions) Twelve Months Ended December 31, 2011 2010 Operating Activities: Net earnings $ 1,305 $ 724 Less: Net earnings from discontinued operations 14 — Net earnings from continuing operations 1,291 724 Adjustments to reconcile net earnings from continuing operations to net cash flow provided by operating activities: Depreciation and amortization 548 563 Stock-based compensation 140 136 Loss on early extinguishment of debt — 81 Equity in loss of investee companies, net of tax and distributions 50 35 Change in assets and liabilities, net of effects of acquisitions (280) 196 Net cash flow provided by operating activities 1,749 1,735 Investing Activities: Acquisitions, net of cash acquired (75) (11) Capital expenditures (265) (284) Investments in and advances to investee companies (79) (90) Proceeds from dispositions 22 18 Other investing activities 8 (1) Net cash flow used for investing activities (389) (368) Financing Activities: Proceeds from issuance of notes — 1,094 Repayment of notes and debentures — (2,126) Payment of capital lease obligations (19) (16) Dividends (206) (142) Purchase of Company common stock (1,012) — Payment of payroll taxes in lieu of issuing shares for stock-based compensation (82) (37) Proceeds from exercise of stock options 72 7 Excess tax benefit from stock-based compensation 72 16 Decrease to accounts receivable securitization program — (400) Other financing activities (5) — Net cash flow used for financing activities (1,180) (1,604) Net increase (decrease) in cash and cash equivalents 180 (237) Cash and cash equivalents at beginning of year 480 717 Cash and cash equivalents at end of year $ 660 $ 480
15
CBS CORPORATION AND SUBSIDIARIES
(Unaudited; in millions) SUPPLEMENTAL DISCLOSURES REGARDING NON-GAAP FINANCIAL INFORMATION
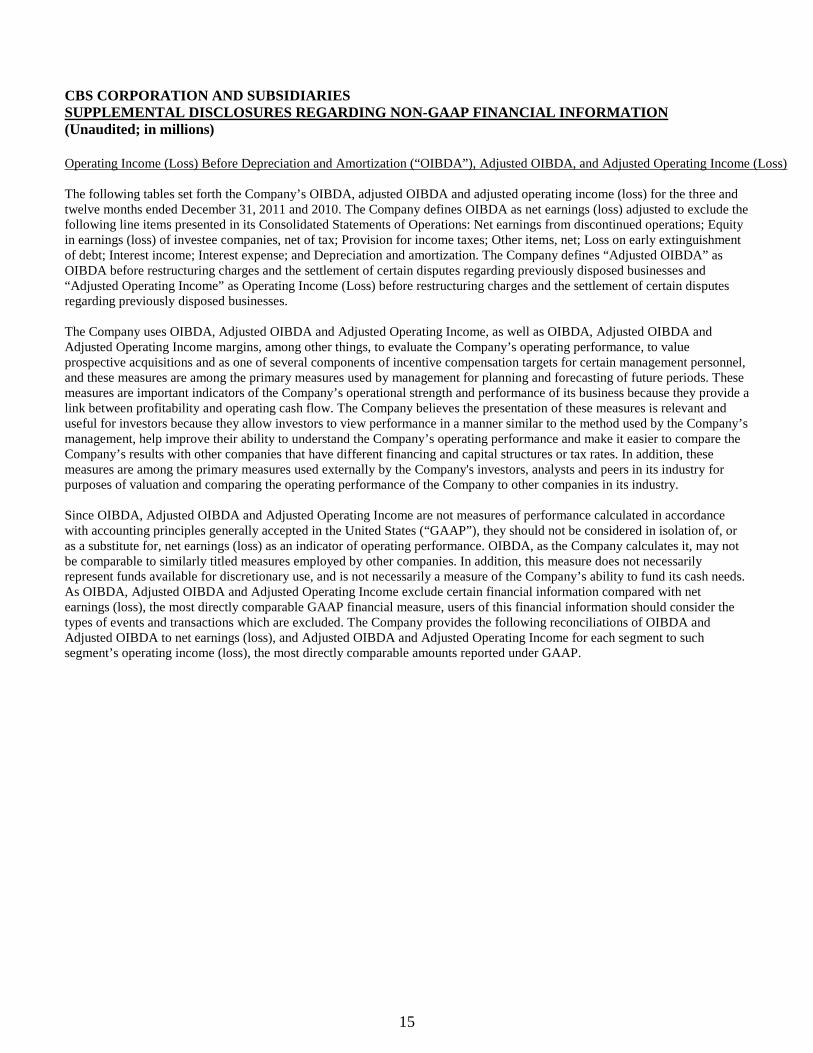
Operating Income (Loss) Before Depreciation and Amortization (“OIBDA”), Adjusted OIBDA, and Adjusted Operating Income (Loss)
The following tables set forth the Company’s OIBDA, adjusted OIBDA and adjusted operating income (loss) for the three and twelve months ended December 31, 2011 and 2010. The Company defines OIBDA as net earnings (loss) adjusted to exclude the following line items presented in its Consolidated Statements of Operations: Net earnings from discontinued operations; Equity in earnings (loss) of investee companies, net of tax; Provision for income taxes; Other items, net; Loss on early extinguishment of debt; Interest income; Interest expense; and Depreciation and amortization. The Company defines “Adjusted OIBDA” as OIBDA before restructuring charges and the settlement of certain disputes regarding previously disposed businesses and “Adjusted Operating Income” as Operating Income (Loss) before restructuring charges and the settlement of certain disputes regarding previously disposed businesses. The Company uses OIBDA, Adjusted OIBDA and Adjusted Operating Income, as well as OIBDA, Adjusted OIBDA and Adjusted Operating Income margins, among other things, to evaluate the Company’s operating performance, to value prospective acquisitions and as one of several components of incentive compensation targets for certain management personnel, and these measures are among the primary measures used by management for planning and forecasting of future periods. These measures are important indicators of the Company’s operational strength and performance of its business because they provide a link between profitability and operating cash flow. The Company believes the presentation of these measures is relevant and useful for investors because they allow investors to view performance in a manner similar to the method used by the Company’s management, help improve their ability to understand the Company’s operating performance and make it easier to compare the Company’s results with other companies that have different financing and capital structures or tax rates. In addition, these measures are among the primary measures used externally by the Company's investors, analysts and peers in its industry for purposes of valuation and comparing the operating performance of the Company to other companies in its industry. Since OIBDA, Adjusted OIBDA and Adjusted Operating Income are not measures of performance calculated in accordance with accounting principles generally accepted in the United States (“GAAP”), they should not be considered in isolation of, or as a substitute for, net earnings (loss) as an indicator of operating performance. OIBDA, as the Company calculates it, may not be comparable to similarly titled measures employed by other companies. In addition, this measure does not necessarily represent funds available for discretionary use, and is not necessarily a measure of the Company’s ability to fund its cash needs. As OIBDA, Adjusted OIBDA and Adjusted Operating Income exclude certain financial information compared with net earnings (loss), the most directly comparable GAAP financial measure, users of this financial information should consider the types of events and transactions which are excluded. The Company provides the following reconciliations of OIBDA and Adjusted OIBDA to net earnings (loss), and Adjusted OIBDA and Adjusted Operating Income for each segment to such segment’s operating income (loss), the most directly comparable amounts reported under GAAP.

CBS CORPORATION AND SUBSIDIARIES SUPPLEMENTAL DISCLOSURES REGARDING NON-GAAP FINANCIAL INFORMATION (continued) (Unaudited; in millions)
16
Three Months Ended December 31, 2011
Adjusted Adjusted Depreciation Operating Restructuring Operating OIBDA and Amortization Income/(Loss) Charges Income/(Loss)
Entertainment $ 318 $ (43) $ 275 $ (40) $ 235 Cable Networks 175 (6) 169 — 169 Publishing 28 (1) 27 (2) 25 Content Group 521 (50) 471 (42) 429 Local Broadcasting 266 (24) 242 — 242 Outdoor 131 (55) 76 (4) 72 Local Group 397 (79) 318 (4) 314 Corporate (64) (7) (71) — (71) Residual Costs (19) — (19) — (19) Eliminations 2 — 2 — 2 Total $ 837 $ (136) $ 701 $ (46) $ 655
Margins (a) 22% 19% 17% Three Months Ended December 31, 2010
Adjusted Adjusted Depreciation Operating Restructuring Operating OIBDA and Amortization Income/(Loss) Charges Income/(Loss)
Entertainment $ 249 $ (40) $ 209 $ (12) $ 197 Cable Networks 169 (6) 163 — 163 Publishing 20 (2) 18 (2) 16 Content Group 438 (48) 390 (14) 376 Local Broadcasting 322 (26) 296 — 296 Outdoor 101 (59) 42 (1) 41 Local Group 423 (85) 338 (1) 337 Corporate (64) (6) (70) — (70) Residual Costs (27) — (27) — (27) Eliminations 1 — 1 — 1 Total $ 771 $ (139) $ 632 $ (15) $ 617
Margins (a) 20% 16% 16% Three Months Ended December 31, 2011 2010
Adjusted OIBDA $ 837 $ 771 Restructuring charges (46) (15) Total OIBDA 791 756 Depreciation and amortization (136) (139) Operating income 655 617 Interest expense (106) (130) Interest income 2 2 Loss on early extinguishment of debt — (43) Other items, net (10) 13 Earnings before income taxes 541 459 Provision for income taxes (186) (172) Equity in earnings (loss) of investee companies, net of tax 1 (4) Net earnings from continuing operations 356 283 Net earnings from discontinued operations 14 — Net earnings $ 370 $ 283 (a) Margin is defined as adjusted OIBDA, operating income, or adjusted operating income, as applicable, divided by revenues.
CBS CORPORATION AND SUBSIDIARIES SUPPLEMENTAL DISCLOSURES REGARDING NON-GAAP FINANCIAL INFORMATION (continued) (Unaudited; in millions)
17
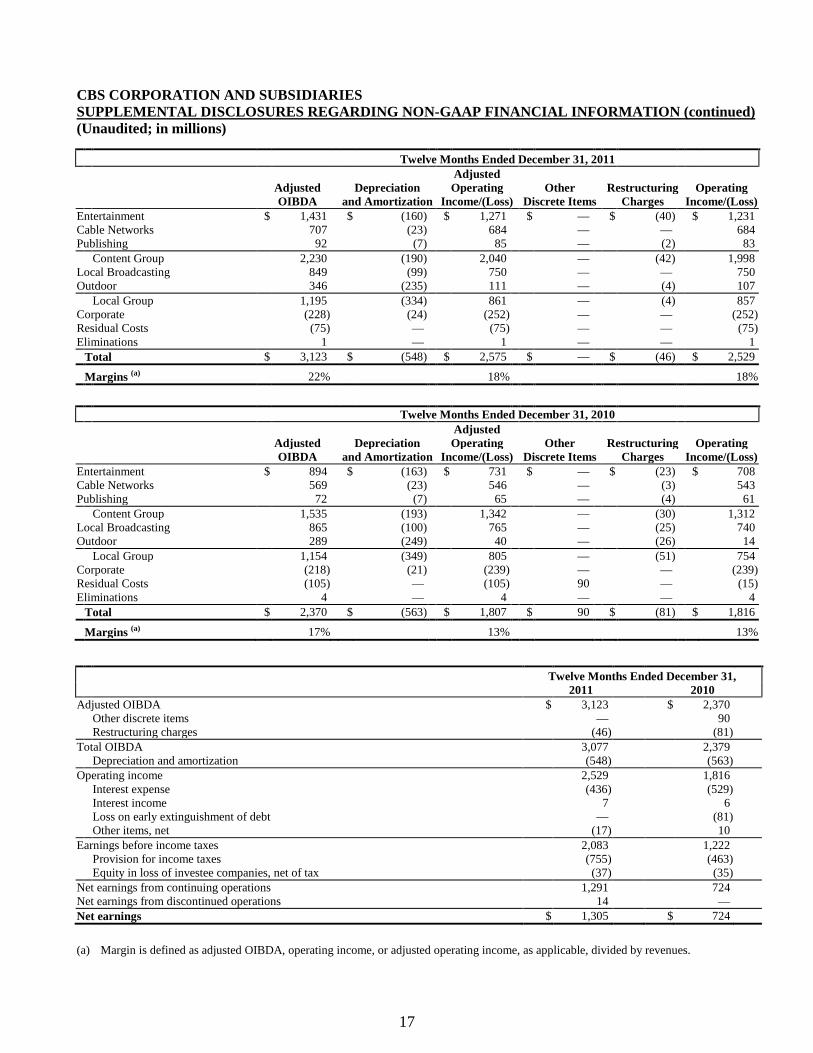
Twelve Months Ended December 31, 2011
Adjusted Adjusted Depreciation Operating Other Restructuring Operating OIBDA and Amortization Income/(Loss) Discrete Items Charges Income/(Loss)
Entertainment $ 1,431 $ (160) $ 1,271 $ — $ (40) $ 1,231 Cable Networks 707 (23) 684 — — 684 Publishing 92 (7) 85 — (2) 83 Content Group 2,230 (190) 2,040 — (42) 1,998 Local Broadcasting 849 (99) 750 — — 750 Outdoor 346 (235) 111 — (4) 107 Local Group 1,195 (334) 861 — (4) 857 Corporate (228) (24) (252) — — (252) Residual Costs (75) — (75) — — (75) Eliminations 1 — 1 — — 1 Total $ 3,123 $ (548) $ 2,575 $ — $ (46) $ 2,529
Margins (a) 22% 18% 18% Twelve Months Ended December 31, 2010
Adjusted Adjusted Depreciation Operating Other Restructuring Operating OIBDA and Amortization Income/(Loss) Discrete Items Charges Income/(Loss)
Entertainment $ 894 $ (163) $ 731 $ — $ (23) $ 708 Cable Networks 569 (23) 546 — (3) 543 Publishing 72 (7) 65 — (4) 61 Content Group 1,535 (193) 1,342 — (30) 1,312 Local Broadcasting 865 (100) 765 — (25) 740 Outdoor 289 (249) 40 — (26) 14 Local Group 1,154 (349) 805 — (51) 754 Corporate (218) (21) (239) — — (239) Residual Costs (105) — (105) 90 — (15) Eliminations 4 — 4 — — 4 Total $ 2,370 $ (563) $ 1,807 $ 90 $ (81) $ 1,816
Margins (a) 17% 13% 13% Twelve Months Ended December 31, 2011 2010
Adjusted OIBDA $ 3,123 $ 2,370 Other discrete items — 90 Restructuring charges (46) (81) Total OIBDA 3,077 2,379 Depreciation and amortization (548) (563) Operating income 2,529 1,816 Interest expense (436) (529) Interest income 7 6 Loss on early extinguishment of debt — (81) Other items, net (17) 10 Earnings before income taxes 2,083 1,222 Provision for income taxes (755) (463) Equity in loss of investee companies, net of tax (37) (35) Net earnings from continuing operations 1,291 724 Net earnings from discontinued operations 14 — Net earnings $ 1,305 $ 724 (a) Margin is defined as adjusted OIBDA, operating income, or adjusted operating income, as applicable, divided by revenues.

CBS CORPORATION AND SUBSIDIARIES SUPPLEMENTAL DISCLOSURES REGARDING NON-GAAP FINANCIAL INFORMATION (continued) (Unaudited; in millions)
18
Free cash flow reflects the Company’s net cash flow provided by (used for) operating activities less capital expenditures. The Company’s calculation of free cash flow includes capital expenditures since investment in capital expenditures is a use of cash that is directly related to the Company’s operations. The Company’s net cash flow provided by (used for) operating activities is the most directly comparable GAAP financial measure. Management believes free cash flow provides investors with an important perspective on the cash available to the Company to service debt, make strategic acquisitions and investments, maintain its capital assets, satisfy its tax obligations and fund ongoing operations and working capital needs. As a result, free cash flow is a significant measure of the Company’s ability to generate long-term value. It is useful for investors to know whether this ability is being enhanced or degraded as a result of the Company’s operating performance. The Company believes the presentation of free cash flow is relevant and useful for investors because it allows investors to evaluate the cash generated from the Company's underlying operations in a manner similar to the method used by management. Free cash flow is one of several components of incentive compensation targets for certain management personnel. In addition, free cash flow is a primary measure used externally by the Company’s investors, analysts and peers in its industry for purposes of valuation and comparing the operating performance of the Company to other companies in its industry. As free cash flow is not a measure calculated in accordance with GAAP, free cash flow should not be considered in isolation of, or as a substitute for, either net cash flow provided by (used for) operating activities as a measure of liquidity or net earnings (loss) as a measure of operating performance. Free cash flow, as the Company calculates it, may not be comparable to similarly titled measures employed by other companies. In addition, free cash flow as a measure of liquidity has certain limitations, and does not necessarily represent funds available for discretionary use and is not necessarily a measure of the Company’s ability to fund its cash needs. When comparing free cash flow to net cash flow provided by (used for) operating activities, the most directly comparable GAAP financial measure, users of this financial information should consider the types of events and transactions which are not reflected in free cash flow. The following table presents a reconciliation of the Company’s net cash flow provided by operating activities to free cash flow:
Free Cash Flow
Three Months Ended Twelve Months Ended December 31, December 31, 2011 2010 2011 2010
Net cash flow provided by operating activities $ 69 $ 161 $ 1,749 $ 1,735 Capital expenditures (113) (121) (265) (284) Free cash flow $ (44) $ 40 $ 1,484 $ 1,451 The following table presents a summary of the Company’s cash flows: Three Months Ended Twelve Months Ended December 31, December 31, 2011 2010 2011 2010
Net cash flow provided by operating activities $ 69 $ 161 $ 1,749 $ 1,735 Net cash flow used for investing activities $ (140) $ (168) $ (389) $ (368) Net cash flow used for financing activities $ (216) $ (585) $ (1,180) $ (1,604)

CBS CORPORATION AND SUBSIDIARIES SUPPLEMENTAL DISCLOSURES REGARDING NON-GAAP FINANCIAL INFORMATION (continued) (Unaudited; in millions, except per share amounts)
19
The following tables reconcile adjusted financial results to the reported results included in this earnings release. The Company believes that adjusting its financial results for the impact of these items is relevant and useful for investors because it allows investors to view performance in a manner similar to the method used by the Company's management, provides a clearer perspective on the current underlying performance of the Company, and adjusting each period’s results on the same basis makes it easier to compare the Company's year-over-year results.
2011 and 2010 Adjusted Results
Three Months Ended December 31, 2011
2011 Restructuring Other Discrete 2011 Reported Charges (a) Items Adjusted
Revenues $ 3,784 $ — $ — $ 3,784 OIBDA 791 46 — 837 OIBDA margin (b) 21% 22% Operating income 655 46 — 701 Interest expense (106) — — (106) Interest income 2 — — 2 Other items, net (10) — — (10) Earnings before income taxes 541 46 — 587 Provision for income taxes (186) (18) — (204) Effective income tax rate 34% 35% Equity in earnings of investee companies, net of tax 1 — — 1 Net earnings from continuing operations $ 356 $ 28 $ — $ 384 Diluted EPS from continuing operations $ .53 $ .04 $ — $ .57 Diluted weighted average number of common shares outstanding 669 669 Three Months Ended December 31, 2010
2010 Restructuring Other Discrete 2010 Reported Charges (c) Items (d) Adjusted
Revenues $ 3,901 $ — $ — $ 3,901 OIBDA 756 15 — 771 OIBDA margin (b) 19% 20% Operating income 617 15 — 632 Interest expense (130) — — (130) Interest income 2 — — 2 Loss on early extinguishment of debt (43) — 43 — Other items, net 13 — — 13 Earnings before income taxes 459 15 43 517 Provision for income taxes (172) (6) (15) (193) Effective income tax rate 37% 37% Equity in loss of investee companies, net of tax (4) — — (4) Net earnings from continuing operations $ 283 $ 9 $ 28 $ 320 Diluted EPS from continuing operations $ .41 $ .01 $ .04 $ .46 Diluted weighted average number of common shares outstanding 698 698
(a) Restructuring charges at Entertainment, Publishing and Outdoor primarily associated with the relocation and closure of certain business activities and other exit costs.
(b) OIBDA margin is defined as OIBDA or adjusted OIBDA divided by revenues. (c) Restructuring charges at Entertainment, Publishing and Outdoor reflecting severance costs associated with the elimination of
positions and contract terminations. (d) Reflects a pre-tax loss on early extinguishment of debt of $43 million.

CBS CORPORATION AND SUBSIDIARIES SUPPLEMENTAL DISCLOSURES REGARDING NON-GAAP FINANCIAL INFORMATION (continued) (Unaudited; in millions, except per share amounts)
20
Twelve Months Ended December 31, 2011
2011 Restructuring Other Discrete Tax 2011 Reported Charges (a) Items Items Adjusted
Revenues $ 14,245 $ — $ — $ — $ 14,245 OIBDA 3,077 46 — — 3,123 OIBDA margin (b) 22% 22% Operating income 2,529 46 — — 2,575 Interest expense (436) — — — (436) Interest income 7 — — — 7 Other items, net (17) — — — (17) Earnings before income taxes 2,083 46 — — 2,129 Provision for income taxes (755) (18) — — (773) Effective income tax rate 36% 36% Equity in loss of investee companies, net of tax (37) — — — (37) Net earnings from continuing operations $ 1,291 $ 28 $ — $ — $ 1,319 Diluted EPS from continuing operations $ 1.90 $ .04 $ — $ — $ 1.94 Diluted weighted average number of common shares outstanding 681 681 Twelve Months Ended December 31, 2010
2010 Restructuring Other Discrete Tax 2010 Reported Charges (c) Items (d) Items (e) Adjusted
Revenues $ 14,060 $ — $ — $ — $ 14,060 OIBDA 2,379 81 (90) — 2,370 OIBDA margin (b) 17% 17% Operating income 1,816 81 (90) — 1,807 Interest expense (529) — — — (529) Interest income 6 — — — 6 Loss on early extinguishment of debt (81) — 81 — — Other items, net 10 — (8) — 2 Earnings before income taxes 1,222 81 (17) — 1,286 Provision for income taxes (463) (32) 9 8 (478) Effective income tax rate 38% 37% Equity in loss of investee companies, net of tax (35) — — — (35) Net earnings from continuing operations $ 724 $ 49 $ (8) $ 8 $ 773 Diluted EPS from continuing operations $ 1.04 $ .07 $ (.01) $ .01 $ 1.11 Diluted weighted average number of common shares outstanding 694 694
(a) Restructuring charges at Entertainment, Publishing and Outdoor primarily associated with the relocation and closure of certain business activities and other exit costs.
(b) OIBDA margin is defined as OIBDA or adjusted OIBDA divided by revenues. (c) Restructuring charges at Entertainment, Cable Networks, Publishing, Local Broadcasting and Outdoor primarily reflecting
severance costs associated with the elimination of positions, contract terminations and costs associated with exiting an operating facility.
(d) Reflects a settlement of $90 million from the favorable resolution of certain disputes regarding previously disposed businesses, a pre-tax loss on early extinguishment of debt of $81 million and a gain of $8 million on the divestiture of the Company’s television station in Norfolk, Virginia.
(e) Comprising a $62 million reduction of deferred tax assets associated with the 2010 Patient Protection and Affordable Care Act, partially offset by a $26 million reversal of previously established deferred tax liabilities and a $28 million tax benefit from the settlements of income tax audits.