CBO PAPER · spread capital costs over the period when benefits are accruing from the investment....
25
CBO PAPER Capital Budgeting May 2008 CONGRESSIONAL BUDGET OFFICE SECOND AND D STREETS, S.W. WASHINGTON, D.C. 20515
Transcript of CBO PAPER · spread capital costs over the period when benefits are accruing from the investment....

CBO PAPER
Capital Budgeting
May 2008
CONGRESSIONAL BUDGET OFFICE SECOND AND D STREETS, S.W.
WASHINGTON, D.C. 20515

The Congress of the United States O Congressional Budget Office
A
P A P E R
CBO
Capital Budgeting
May 2008

Preface
This Congressional Budget Office (CBO) paper, prepared at the request of the Chairman of the House Committee on the Budget, analyzes the advantages and disadvantages of adopt-ing a capital budget at the federal level. It also examines implementation issues, including options for defining capital spending.
The paper was written by Jeffrey Holland and David Torregrosa, with contributions from Sheila Campbell, Kathleen Gramp, Amber Marcellino, Nathan Musick, and David Newman. Elizabeth Cove wrote the appendix. Robert Dennis, Peter Fontaine, Theresa Gullo, Kim Kowalewski, and Leo Lex directed the research. Linda Lewis Harris assisted with the prepara-tion of some of the tables.
Perry Beider, Eric Miller, John Peterson, Brian Plummer, David Rafferty, Eric Schatten, and Tom Woodward of CBO provided useful suggestions or assistance. Helpful comments were also provided by Eileen Parlow and Wendy Payne of the Federal Accounting Standards Advi-sory Board; Ron Feldman of the Federal Reserve Bank of Minneapolis; Robert Anderson, Michael Falkenheim, Laurence Jacobson, Carol Johnson, Jessie LaVine, Patrick Locke, Arthur Stigile, and Gail Zimmerman of the Office of Management and Budget; Gary Ward of the Department of the Treasury; David Merriman of the University of Illinois at Chicago; and Marvin Phaup, formerly of CBO. (The assistance of external reviewers implies no responsibil-ity for the final product, which rests solely with CBO.)
Christine Bogusz edited the paper, and Loretta Lettner proofread it. Maureen Costantino prepared the paper for publication. Lenny Skutnik produced the printed copies, Linda Schimmel handled the print distribution, and Simone Thomas produced the electronic version for CBO’s Web site (www.cbo.gov).
Peter R. OrszagDirector
May 2008
JohnSK
Peter R. Orszag

Contents
Summary and Introduction 1
Definition of Capital 2
Reports by the Office of Management and Budget 2
National Income and Product Accounts 3
Financial Accounting Guidelines for Federal Agencies 4
Trends in Federal Capital Expenditures 4
Infrastructure 4
Military Investment 5
Research and Development 6
Current Budgetary and Financial Accounting for Capital 6
Treatment of Capital Spending in the Federal Budget 7
Private-Sector Financial Reports 7
Federal Financial Accounting 8
Establishing a Separate Capital Budget Using the Financial Accounting Model 8
Implementation Issues 9
Mixing Cash and Accrual Measures in the Budget 11
Control over Spending 12
Other Options Related to Capital Budgeting 13
Create a Cap on Capital Spending as Part of New Budget Enforcement Provisions 13
Set Up Capital Acquisition Funds 13
Economic Effects of More Capital Spending 14
Appendix: State Capital Budgeting 15

VI CAPITAL BUDGETING
Tables
1. Major Federal Investment Outlays 3
2. Cost of Federal Property, Plant, and Equipment as of September 30, 2007 5
3. Depreciation Versus Capitalized Fixed-Asset Costs for the Federal Government, Fiscal Years 2003 to 2007 9
A-1. An Example of a Capital Spending Budget at the State Level, by Function, 2008 to 2013 16
Figures
1. Public Spending on Investments for Transportation and Water Infrastructure 6
2. Total U.S. R&D Spending 7
Box
1. Capital Accounts in a Unified Budget 10
Capital Budgeting
Summary and IntroductionThe federal budget, which presents the government’s expenditures and revenues for each fiscal year, serves many purposes. It enables policymakers to allocate resources to serve national objectives, provides the basis for agencies’ management of federal programs, gives the Treasury needed information for its management of cash and the public debt, and provides businesses and individ-uals with information to make an informed assessment about the government’s stewardship of the public’s money and resources. Inflows and outflows are recorded mostly on a cash basis because those transactions are readily veri-fiable and they provide policymakers and the public with a close approximation of the government’s annual cash deficit or surplus.
Some observers have proposed modifying the budgeting system by implementing a capital budget for the federal government, which would distinguish certain types of investments from other expenditures in the budget. One commonly discussed approach would segregate cash spending on capital projects in a capital budget and report in the regular budget the depreciation on federal capital assets, thus allocating current costs to future time periods. Such an approach—which would move from the current, primarily cash-based budgeting system to one that relies more on accrual-based accounting—would be similar to private-sector accounting in that it would spread capital costs over the period when benefits are accruing from the investment.
Proponents of capital budgeting assert that the current budgetary treatment of capital investment creates a bias against capital spending and that additional spending would benefit the economy by boosting productivity. They note that capital budgeting could better match budgetary costs with benefit flows and eliminate some of the spikes in programs’ budgets from new investments. The existence and extent of any such bias, however,
depends on how differently policymakers would behave with a capital budget instead of the existing budgetary treatment of capital investments. Furthermore, although evidence suggests that additional capital spending could have larger economic benefits than costs, the economic benefits of increasing capital spending by the federal gov-ernment would partly depend on how well the additional funds were targeted to high-value projects and on the extent to which they would displace spending that would otherwise be undertaken by the private sector or other levels of government.
Moving to a budget that is more reliant on accrual-based accounting could increase complexity, diminish transpar-ency, and make the federal budget process more sensitive to small changes in assumed parameters, such as deprecia-tion rates. (Indeed, other nations have considered adopt-ing capital budgets, but generally decided against it for those same reasons.) Adopting an accrual approach to only one aspect of the budget could raise concerns as to whether the budgeting system would provide a fair basis for allocating the government’s resources among compet-ing priorities. In addition, providing special treatment to certain areas of the budget, such as capital spending, could make the process more prone to manipulation. Furthermore, simply arriving at a definition of capital for budgeting purposes could be a significant challenge. Concerns about such issues largely explain why previous groups charged with exploring budgetary concept issues—including the 1967 President’s Commission on Budget Concepts and the 1999 President’s Commission to Study Capital Budgeting—have rejected the idea of a separate capital budget for the federal government.
More-limited changes to the current process might still accomplish the goal of focusing on capital investment but be simpler to implement than a capital budget as tradi-tionally defined. One approach would be to create a cate-gory for capital spending as part of a restoration of the
2 CAPITAL BUDGETING
CBO
statutory budget enforcement procedures that expired in 2002. Such a category within overall discretionary spend-ing limits could help highlight important policy goals. By carving out separate limits for certain programs, however, lawmakers could forgo flexibility to make budgetary trade-offs as spending needs changed in the future. Another alternative, which would address concerns about the management of assets rather than their reporting in the budget, might be to attribute a portion of the cost of assets each year (in the form of depreciation) to the pro-grams that use them. Requiring users to pay the costs might improve incentives for agencies to sell assets that are no longer appropriate to their needs.
Definition of CapitalIn general, capital refers to an investment in goods or ser-vices that provide benefits over a period of time after their acquisition. However, a substantial portion of govern-mental spending could be viewed as providing a stream of benefits over an extended period, beyond those activities typically associated with the term “capital.”1
Specific definitions of capital can vary significantly depending on the purpose. Some definitions focus nar-rowly on physical infrastructure, such as highways and buildings; others focus more broadly and include intangi-bles, such as investment in education and social services. Such differentiation greatly affects the scope of what is considered capital. Each classification has potential short-comings: A broad definition might encompass so many activities as to make the categorization unhelpful and could invite criticism that a capital budget would simply be a device for understating the cost of federal spending; a narrow definition could lead to a bias against spending that does not directly result in the acquisition of physical assets.2
Another set of issues arises from the fact that the federal government pays for more investment than it owns. Roads, airports, and mass transit systems, for example, are paid for at least in part with federal tax dollars but are under the control of state and local governments or inde-pendent authorities. The definition of federal capital might therefore include those expenditures, on the basis of who pays for them, or exclude them, on the basis of who owns them.
Various budgetary and financial reports that are currently available provide differing perspectives on capital spending.
Reports by the Office of Management and BudgetIn its annual instructions to agencies’ budget officers in Circular A-11, the Office of Management and Budget (OMB) defines federal capital assets as “land, structures, equipment, intellectual property (e.g., software), and information technology (including IT service contracts) used by the Federal Government and having an estimated useful life of two years or more.”3
In its Analytical Perspectives volume of the annual federal budget, OMB provides some aggregate information on the scope and composition of federal investment spend-ing.4 OMB reports federal investment spending by cate-gory: major public physical capital investment (outlays for construction and rehabilitation, major equipment, and the purchase or sale of land and structures); conduct of research and development (outlays for activities that increase basic scientific knowledge or promote research and development); and conduct of education and train-ing (activities to promote a more skilled and productive labor force, a category that consists mostly of financial assistance and loan subsidies for higher education).
In fiscal year 2007, about 16 percent of federal outlays—roughly $430 billion—was categorized as investments (see Table 1). Slightly less than half of that amount was spent for physical capital, about 30 percent went for research and development, and the remainder represents spending for education and training.
1. Statement of Robert D. Reischauer, Brookings Institution, before the President’s Commission to Study Capital Budgeting (April 24, 1998), available at http://clinton2.nara.gov/pcscb/wt_reischauer.html.
2. Statement of June E. O’Neill, Director, Congressional Budget Office, Capital Budgeting, before the President’s Commission to Study Capital Budgeting (April 24, 1998).
3. Office of Management and Budget, Circular A-11, Part 7.
4. Budget of the United States Government, Fiscal Year 2009: Analyti-cal Perspectives, Chapter 6.

CAPITAL BUDGETING 3
CBO
Table 1.
Major Federal Investment Outlays(Billions of dollars)
Source: Congressional Budget Office based on Budget of the United States Government, Fiscal Year 2009: Analytical Perspectives.
Note: The Office of Management and Budget’s calculations of spending for research and development vary from those of the National Science Foundation (whose numbers were used in Figure 2) because of differences in definition and in the timing of expenditures.
a. Estimates for 2008 and 2009 reflect the President’s budget request.
National Income and Product Accounts The national income and product accounts (NIPAs), which are compiled by the Bureau of Economic Analysis (BEA) in the Department of Commerce, use a definition of capital similar to that of OMB, but the NIPA counter-part to the federal budget treats capital expenditures differently. The BEA, like OMB, classifies purchases of capital assets—such as structures, equipment, and soft-ware—that are used in the production of defense and nondefense services as investment. Examples of such pur-chases are those for military aircraft and ships, housing for troops, government buildings, vehicles, and comput-ers. However, even though those expenditures are included in the calculation of gross domestic product (GDP), the NIPAs do not track cash outlays on invest-ment in their measure of federal receipts and expendi-tures. The NIPAs view federal receipts and expenditures like the private-sector income statement. Therefore, the NIPA counterpart to the federal budget recognizes the
cost of capital when it is consumed, not when it is pur-chased. Consequently, the NIPA measure of federal expenditures on capital goods is based on estimates of the depreciation (consumption of fixed capital) of the stock of federal capital.5
In addition, a significant amount of spending that is often thought of as federal capital investment actually shows up elsewhere in the accounts. Federal spending for infrastructure that is generally provided through grants to state and local governments—for air transportation, highways, transit, and water treatment plants—is excluded from the NIPA estimates of the federal capital stock and from federal expenditures. Instead, such spend-
Actual Estimatea
2007 2008 2009
Major Physical Capital InvestmentDirect federal spending
Defense 108 141 155Nondefense 31 37 36____ ____ ____
Subtotal, direct federal spending 139 178 191
Grants to state and local governments 71 76 76___ ___ ___Subtotal, major physical capital investment 209 255 266
Conduct of Research and DevelopmentDefense 77 79 83Nondefense 53 56 57___ ___ ___
Subtotal, conduct of research and development 130 135 140
Conduct of Education and TrainingGrants to state and local governments 54 56 54Direct federal spending 37 38 34__ __ __
Subtotal, conduct of education and training 91 93 88
Total, Major Federal Investment Outlays 430 482 494
5. The NIPAs measure economic depreciation, which differs from the depreciation that a corporation can take for tax purposes. Eco-nomic depreciation is not accelerated, and it is based on an asset’s replacement cost, not its historic cost.

4 CAPITAL BUDGETING
CBO
ing is recorded as state investment, and depreciation on those assets is part of the expenditure measure for states.
Like OMB, the NIPAs do not count federal spending on intangibles, such as education and research and devel-opment, as capital investment. Those items appear in the accounts as current spending (equivalent to cash accounting).
Financial Accounting Guidelines for Federal AgenciesTo supplement the information contained in the budget, the federal government supplies financial information in a separate report, the Financial Report of the United States Government. That report’s balance sheet and statement of net cost provide information on holdings of capital assets and depreciation of that capital, similar to what a capital budget might report.6
As with Circular A-11 and the NIPAs, the Financial Report adopts the narrower definition of capital, which excludes intangibles. The Financial Report provides an estimated value of federal property, plant, and equipment (valued at original cost minus accumulated depreciation). Property, plant, and equipment are tangible assets that have a useful life of at least two years and are not intended for resale. The category includes buildings, structures, computer software, and other assets used to produce goods and services; but it excludes roads, air-ports, and other facilities that are owned or controlled by other entities. Capital leases are also included, but most federal lands—including military bases, national parks, and forests—are excluded. At the end of fiscal year 2007, the federal government reported nearly $700 billion of property, plant, and equipment on its balance sheet (see Table 2).7 About two-thirds of that sum is for national defense purposes, mostly military equipment—ships, air-craft, combat vehicles, and weapons.
Classifications have varied over time with changes in accounting standards. For example, $655 billion of national defense assets were taken off the balance sheet in 1998; such assets were not restored to the balance sheet until 2003. In 2007, changes in accounting standards led
the National Aeronautics and Space Administration to reclassify costs previously reported as property, plant, and equipment as research and development costs, which resulted in a downward adjustment of nearly $13 billion on the balance sheet for that year.
Intangible federal investments are generally not classified as assets and thus are not shown on the balance sheet. Although those expenditures create future economic ben-efits, most of the benefits accrue to the public rather than to the government. In addition, the amount and timing of the benefits from such expenditures are very difficult to estimate.8
Trends in Federal Capital ExpendituresCapital expenditures in the federal budget are mostly controlled by annual appropriations. Under OMB’s defi-nition, about 40 percent of the more than $1 trillion spent on such discretionary programs last year would be categorized as investment, mainly for infrastructure, mili-tary equipment, and research and development.
Whatever the budgetary impediments to capital spending are—real or perceived—the historical record shows that there have been episodes of rapidly expanding public investment: the development of the interstate highway system; the U.S. space exploration program, culminating in the landing on the moon; spending on water systems after the passage of the Clean Water Act; the large defense buildup in the 1980s; and, more recently, spending on aviation, mass transit, and rail.
InfrastructureMost capital spending by the federal government on physical infrastructure in the nondefense sector is for transportation or water projects (that is, for water supply, wastewater treatment, and water resources, such as dams and levees). Federal investment in transportation and water infrastructure totaled nearly $58 billion in 2007. Almost nine-tenths of that spending took the form of grants and loan subsidies to states and localities; 60 per-cent of the total went to highways and roads alone. As a share of federal nondefense discretionary outlays, capital spending on transportation and water infrastructure has ranged between 11 percent and 14 percent for the past several decades. (Before the late 1980s, that percentage 6. Congressional Budget Office, Comparing Budget and Accounting
Measures of the Federal Government’s Fiscal Condition (December 2006).
7. Department of the Treasury, Financial Report of the United States Government (December 2007), available at www.fms.treas.gov/fr/07frusg/07frusg.pdf.
8. Statement of David Mosso, Chairman, Federal Accounting Standards Advisory Board, before the President’s Commission to Study Capital Budgeting (May 8, 1998), available at http://clinton2.nara.gov/pcscb/wt_mosso.html.

CAPITAL BUDGETING 5
CBO
Table 2.
Cost of Federal Property, Plant, and Equipment as of September 30, 2007(Billions of dollars)
Source: Congressional Budget Office based on data from Department of the Treasury, Financial Report of the United States Government (December 2007), p. 62.
Notes: * = less than $500 million; n.a. = not applicable.
Numbers may not sum to totals because of rounding.
was considerably greater than it is today; for example, such spending often exceeded 20 percent of nondefense discretionary outlays through the early 1960s, a period of exceptionally rapid growth in federal spending—particu-larly to build the interstate highway system.)
Net of federal grants and loans, state and local govern-ments spent $78 billion on transportation and water infrastructure in 2004 (the latest year for which satisfac-tory data are available). As a result, states and localities account for almost two-thirds of total public capital spending; annual expenditures by states and localities on transportation and water infrastructure have exceeded those of the federal government since the mid-1980s (and did so prior to the mid-1970s as well). As a share of GDP, federal, state, and local capital spending has remained relatively flat over the past two decades—at about 1.1 percent. The federal share has remained just below 0.5 percent of GDP (see Figure 1).
Military InvestmentMilitary investment spending for physical assets accounted for about 20 percent of the Department of Defense’s (DoD’s) outlays in 2007. Such spending is used to construct facilities and other infrastructure on defense installations and to acquire weapon systems and other equipment. However, some of the items purchased with
appropriations that DoD classifies as investment—mis-siles and ammunition, for example—may not meet nar-rower definitions of capital. In 2007, DoD’s investment spending totaled $107 billion, or 0.8 percent of GDP. Such spending has declined over time, falling from an average of about 1.5 percent of GDP in the 1970s and 1980s to 1.0 percent of GDP in the 1990s. Thus far this decade, military investment spending has accounted for 0.7 percent of GDP.
Most military investment spending—about 90 percent—is used to acquire weapon systems and other equipment. The remainder is used to construct or acquire facilities and infrastructure. That composition of investment spending has remained relatively constant for decades. However, the portion of total military spending allocated for investment has fluctuated over time. Investment spending accounted for about 30 percent of DoD’s out-lays in the 1980s and early 1990s but fell to just over 20 percent by the end of the 1990s. Investment spending decreased further in the current decade, to 19 percent of DoD’s outlays, as personnel and manpower spending increased for the wars in Iraq and Afghanistan. Appropri-ations for equipment to fight the wars grew tenfold between 2004 and 2007, but investment as a share of defense outlays has not yet increased significantly because
Buildings, Structures, andFacilities 173 189 363 102 97 198 72 92 164
Military Equipment 728 151 879 360 85 444 368 67 435Construction in Progress 20 35 54 n.a. n.a. n.a. 20 35 54Land 11 11 22 n.a. n.a. n.a. 11 11 22Software 9 11 20 6 5 11 4 6 9Capital Leases and
2 6 8 1 3 4 1 3 4Other * 9 9 * 6 6 * 3 3____ ____ _____ ____ ____ ____ ____ ____ ____
942 411 1,354 468 195 663 475 217 691
DefenseCivilian
Agencies
Original Cost
TotalDepartment of
Defense
Accumulated Depreciation
Agencies TotalDepartment of
Improvements
Total
Net Assets
TotalDepartment of
DefenseCivilian
AgenciesCivilian

6 CAPITAL BUDGETING
CBO
Figure 1.
Public Spending on Investments for Transportation and Water Infrastructure (Percentage of gross domestic product)
Source: Congressional Budget Office.
Note: Includes spending on transportation, water resources, and water supply and wastewater treatment systems.
such funds are spent more slowly than appropriations for salaries and operating expenses.
Research and DevelopmentThe federal government’s spending on research and devel-opment (R&D) spans a wide variety of activities. It includes grants to academic scientists to conduct research to advance the state of knowledge in their fields. Govern-ment-funded laboratories also conduct biomedical, energy, and engineering research. In addition, a substan-tial portion of the federal government’s R&D spending is dedicated to national defense purposes—to develop new military aircraft or weapon systems, for example.
In the 1950s and early 1960s, federal spending on R&D rose rapidly. It reached a peak of almost 2 percent of GDP in 1964 during the acceleration of the U.S. space program (see Figure 2). Since then—with the exception of a period in the 1980s when an expansion of national defense activities prompted more funding for research and development—federal R&D spending has generally declined as a share of GDP.9 In 2007, it totaled 0.9 per-cent of GDP. Over the past 50 years, however, the private sector has increased its spending on R&D. As a result,
total R&D expenditures in the United States—public and private—climbed from less than 1.5 percent of GDP in the early 1950s to nearly 2.6 percent in 2006.
In its appropriations for R&D activities, the federal gov-ernment has expanded its support of basic research more rapidly than its support of applied research (which aims to link scientific knowledge to some practical purpose) or development (which aims to create marketable products). Federal spending for development has had some large swings, mainly because of increased expenditures at vari-ous times for space and defense programs.
Federal R&D funds tend to go toward different entities, depending on whether the work involved is research or development. In 2006, universities performed 45 percent of federally funded research but less than 3 percent of development, whereas industry performed 11 percent of federally funded research but 48 percent of development. The other main performers of federally funded R&D include the federal government itself and federally funded research and development centers, which are managed by industry, universities, or nonprofit organizations. Gov-ernment laboratories performed 21 percent of federal research and 35 percent of federal development in 2006. Federally funded research and development centers accounted for a smaller portion—14 percent of research and 13 percent of development funded by the federal government.
Current Budgetary and Financial Accounting for CapitalThe budget is a key instrument in national policymaking, a tool for setting priorities and delineating which services should be provided by the government. The federal bud-get generally measures spending and revenues on a uni-fied basis, including all of the government’s activities in one place.10 Inflows and outflows are recorded mostly on a cash basis because those transactions are readily verifi-able and they provide policymakers and the public with a close approximation of the government’s annual cash def-icit or surplus. A cash budget also has the advantage of
Federal CapitalSpending Share
Public CapitalSpending Share
1956 1962 1968 1974 1980 1986 1992 1998 2004
0
0.2
0.4
0.6
0.8
1.0
1.2
1.4
1.6
1.8
2.0
State and Local
Federal
9. For a detailed discussion of trends in federal R&D spending and the literature on the returns to such spending, see Congressional Budget Office, Federal Support for Research and Development (June 2007).
10. The federal budget does not include the activities of the Federal Reserve Banks.

CAPITAL BUDGETING 7
CBO
Figure 2.
Total U.S. R&D Spending (Percentage of gross domestic product)
Source: Congressional Budget Office based on data from the National Science Foundation, Division of Science Resource Statistics, Science and Engineering Indicators 2008.
Notes: R&D = research and development.
The National Science Foundation’s calculations of spending for research and development vary from those of the Office of Management and Budget (whose numbers were used in Table 1) because of differences in definition and in the tim-ing of expenditures.
being relatively transparent and easily understood. One disadvantage, however, is that it does not measure the year-to-year changes in the government’s assets and liabil-ities. To supplement the information contained in the budget, the federal government also supplies information on federal assets and liabilities in a separate report titled Financial Report of the United States Government. That report provides much of the information that capital budgeting might also address.
Private-sector entities, too, maintain cash flow budgets—in order to properly manage their needs for cash.11 But they also produce financial reports with a different focus. Such financial accounting generally reviews the perfor-mance of an entity for a just-completed period by using accrual methods that recognize transactions when an eco-
nomic event occurs rather than when the resulting cash flow takes place. Consequently, financial accounting dis-tinguishes between capital assets (aimed at producing income or benefits in the future) and current operating costs (aimed at producing income or benefits now). Because trends in profits and losses are a central focus of private-sector accounting, a financial accounting system that attributes investment costs to the period when the benefits of the investment accrue is particularly valuable in that context.
Treatment of Capital Spending in the Federal BudgetCurrently, the federal government’s budget reports and controls capital spending no differently than spending for annual operations. According to the Principles of Financ-ing Capital Asset Acquisitions issued by OMB, the full cost of a capital asset is to be recorded as an obligation when resources are committed, and the associated cash expendi-tures are recorded as federal outlays for the years in which they are disbursed.12 (For many capital investments, the outlays occur over a number of years.)
To illustrate the current treatment of capital expendi-tures, suppose a $10 billion investment is approved, and all of the funds are spent in the first two years. The fed-eral budget might report an obligation of $10 billion in the first year, outlays totaling $10 billion in the first two years, and no outlays in subsequent years. No deprecia-tion of the asset would be reported.
Private-Sector Financial ReportsUnder generally accepted accounting principles, private firms prepare a balance sheet, which shows assets, liabili-ties, and net worth (assets minus liabilities); an income statement, which shows the period’s revenues, expenses, and net profit; and a cash flow statement, which shows sources, uses, and cash balances.
Private firms treat capital transactions differently from operating expenditures. The purchase is reported on the balance sheet either as an exchange of assets (cash for the purchased item) or, if financed by borrowing, as an equal increase in both assets and liabilities. In general, the pur-chase does not change a firm’s net worth immediately. If the income stream generated by the investment exceeds future expenses, net worth will increase in the future; if not, net worth will decline. The cash flow statement reports outlays for the purchase of the asset and, in that
11. In contrast with the public sector, budgets in the private sector are typically not made public and are instead used for internal plan-ning purposes.
1953 1963 1973 1983 1993 2003
0
1
2
3
4
Federal
Industry
University Nonprofit
OtherNonfederal
12. Office of Management and Budget, Circular A-11, Appendix J.

8 CAPITAL BUDGETING
CBO
respect, parallels the federal budget’s treatment of capital investment. The income statement, which matches reve-nues with costs incurred in the period, recognizes an expense only for the periodic depreciation of a capital asset rather than its purchase cost. Depreciation, which covers both physical wear and tear and anticipated tech-nological obsolescence, is intended to assign a portion of the original cost of the asset to the period in which the asset is consumed and thus depends on the estimated useful life of the asset.
Federal Financial AccountingLike the financial statements of private companies, the Financial Report of the United States Government consists of a balance sheet, an income statement, a cash flow statement, and notes to those financial statements.13 (The federal budget, by contrast, is largely a cash flow statement, but it also serves some of the functions of an income statement.) The financial statements describe what has already happened and provide more-comprehensive information than the budget as to the government’s financial condition.
As in private-sector financial reporting, purchases of capital assets (those owned by the federal government—thus, not roads and airports, for example) are recorded on the federal government’s balance sheet as an exchange of assets. Those purchases do not directly change the federal government’s net financial position.
The financial report’s version of an income statement (called the statements of net cost and statements of opera-tions and changes in net position) recognizes the cost of property, plant, and equipment as those items are con-sumed, rather than when they are purchased.14 Deprecia-tion is measured using a systematic method for assigning the cost of an asset to each period during the estimated useful life of the asset. A common approach is straight-line depreciation—for example, an item that costs
$1 million to purchase and has a 10-year useful life would be depreciated at $100,000 a year and would be reported as an expense (amortized) at that annual rate for the life of the asset. In contrast, spending on intangible federal investments appears as an expense in the period in which it occurs, rather than being amortized over time.
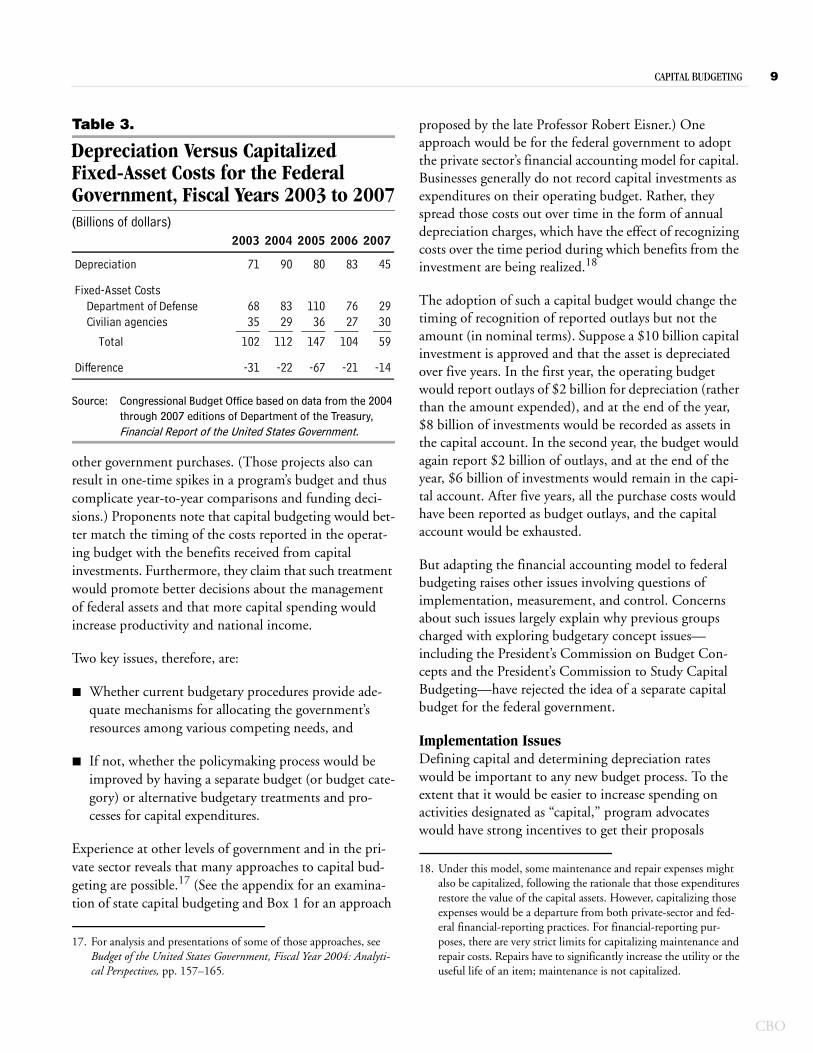
Because of differences in the timing of the recognition of costs, the summary measures of the federal budget and the financial statements differ significantly. In 2007, the budget recorded a deficit of $162 billion, whereas the financial report’s net operating cost—the excess of the cost of operations over revenues—was $276 billion. The treatment of fixed capital goods accounted for only $14 billion of the $114 billion difference between the budget deficit and the net cost of government operations in 2007 (see Table 3). Depreciation expenses—not counted in the budget—added $45 billion to the net operating cost, while the purchase of fixed assets added $59 billion to the budget deficit.15 Over the past five years, federal budget outlays for fixed capital expenses have exceeded depreciation expenses.
Table 3 also illustrates the sizable swings that can be gen-erated by changes in depreciation calculations. Total depreciation stated in the Financial Report of the United States Government dropped dramatically from 2006 to 2007—falling from $83 billion to $45 billion—mostly as a result of a change in the Department of Defense’s treat-ment of military equipment.16 If depreciation were to appear in the federal budget, such variations would have to be controlled by an explicit set of rules for depreciation (similar to, but not necessarily the same as, those that the Internal Revenue Service sets up for private companies to control the depreciation they report for tax purposes).
Establishing a Separate Capital Budget Using the Financial Accounting ModelProponents of capital budgeting assert that requiring up-front recognition of all costs—as the budget currently does—places investment projects at a disadvantage, because those projects may seem expensive relative to
13. The comparisons with private financial statements are approxi-mate, and the purposes of those statements differ. For example, the closest federal counterpart to the cash flow statement is the statements of changes in cash balance from unified budget and other actions.
14. See Federal Accounting Standards Advisory Board, SFFAS 6: Accounting for Property, Plant, and Equipment (November 30, 1995), pp. 45 and 61–62, available at www.fasab.gov/pdffiles/codification_report2007.pdf.
15. Department of the Treasury, Financial Report of the United States Government, p. 43.
16. Because of limitations in DoD’s financial system, calculations of fixed-asset costs may need to be adjusted in the future.
CAPITAL BUDGETING 9
CBO
Table 3.
Depreciation Versus Capitalized Fixed-Asset Costs for the Federal Government, Fiscal Years 2003 to 2007(Billions of dollars)
Source: Congressional Budget Office based on data from the 2004 through 2007 editions of Department of the Treasury, Financial Report of the United States Government.
other government purchases. (Those projects also can result in one-time spikes in a program’s budget and thus complicate year-to-year comparisons and funding deci-sions.) Proponents note that capital budgeting would bet-ter match the timing of the costs reported in the operat-ing budget with the benefits received from capital investments. Furthermore, they claim that such treatment would promote better decisions about the management of federal assets and that more capital spending would increase productivity and national income.
Two key issues, therefore, are:
B Whether current budgetary procedures provide ade-quate mechanisms for allocating the government’s resources among various competing needs, and
B If not, whether the policymaking process would be improved by having a separate budget (or budget cate-gory) or alternative budgetary treatments and pro-cesses for capital expenditures.
Experience at other levels of government and in the pri-vate sector reveals that many approaches to capital bud-geting are possible.17 (See the appendix for an examina-tion of state capital budgeting and Box 1 for an approach
proposed by the late Professor Robert Eisner.) One approach would be for the federal government to adopt the private sector’s financial accounting model for capital. Businesses generally do not record capital investments as expenditures on their operating budget. Rather, they spread those costs out over time in the form of annual depreciation charges, which have the effect of recognizing costs over the time period during which benefits from the investment are being realized.18
The adoption of such a capital budget would change the timing of recognition of reported outlays but not the amount (in nominal terms). Suppose a $10 billion capital investment is approved and that the asset is depreciated over five years. In the first year, the operating budget would report outlays of $2 billion for depreciation (rather than the amount expended), and at the end of the year, $8 billion of investments would be recorded as assets in the capital account. In the second year, the budget would again report $2 billion of outlays, and at the end of the year, $6 billion of investments would remain in the capi-tal account. After five years, all the purchase costs would have been reported as budget outlays, and the capital account would be exhausted.
But adapting the financial accounting model to federal budgeting raises other issues involving questions of implementation, measurement, and control. Concerns about such issues largely explain why previous groups charged with exploring budgetary concept issues—including the President’s Commission on Budget Con-cepts and the President’s Commission to Study Capital Budgeting—have rejected the idea of a separate capital budget for the federal government.
Implementation IssuesDefining capital and determining depreciation rates would be important to any new budget process. To the extent that it would be easier to increase spending on activities designated as “capital,” program advocates would have strong incentives to get their proposals
17. For analysis and presentations of some of those approaches, see Budget of the United States Government, Fiscal Year 2004: Analyti-cal Perspectives, pp. 157–165.
2003 2004 2005 2006 2007
Depreciation 71 90 80 83 45
Fixed-Asset CostsDepartment of Defense 68 83 110 76 29Civilian agencies 35 29 36 27 30____ ____ ____ ____ ___
Total 102 112 147 104 59
Difference -31 -22 -67 -21 -14
18. Under this model, some maintenance and repair expenses might also be capitalized, following the rationale that those expenditures restore the value of the capital assets. However, capitalizing those expenses would be a departure from both private-sector and fed-eral financial-reporting practices. For financial-reporting pur-poses, there are very strict limits for capitalizing maintenance and repair costs. Repairs have to significantly increase the utility or the useful life of an item; maintenance is not capitalized.
10 CAPITAL BUDGETING
CBO
classified as capital spending. They would also have incentives to push for longer depreciation periods to lower the cost in the current period.19
Although an issue common to all capital budgeting pro-posals is the definition of capital, depending on the pur-pose of capital budgeting, different definitions may be appropriate.20 Many different types of spending can be classified as investment—from spending on physical assets to outlays for human capital and research and development—all with potential long-term benefits to
society. As such, they could be counted as part of capital investment.
Much of the federal government’s spending on physical investment, apart from that for military weapon systems, results in assets that it does not own or control. Roads, airports, and mass transit systems, for example, are under the control of state and local governments. Partly for that reason, the Federal Accounting Standards Advisory Board treats federal grants for infrastructure spending as expenses rather than capitalizing them. However, some analysts argue that all federal capital outlays for physical assets should be treated the same, regardless of ownership; they assert that ownership of the assets is not relevant to the provision of services.
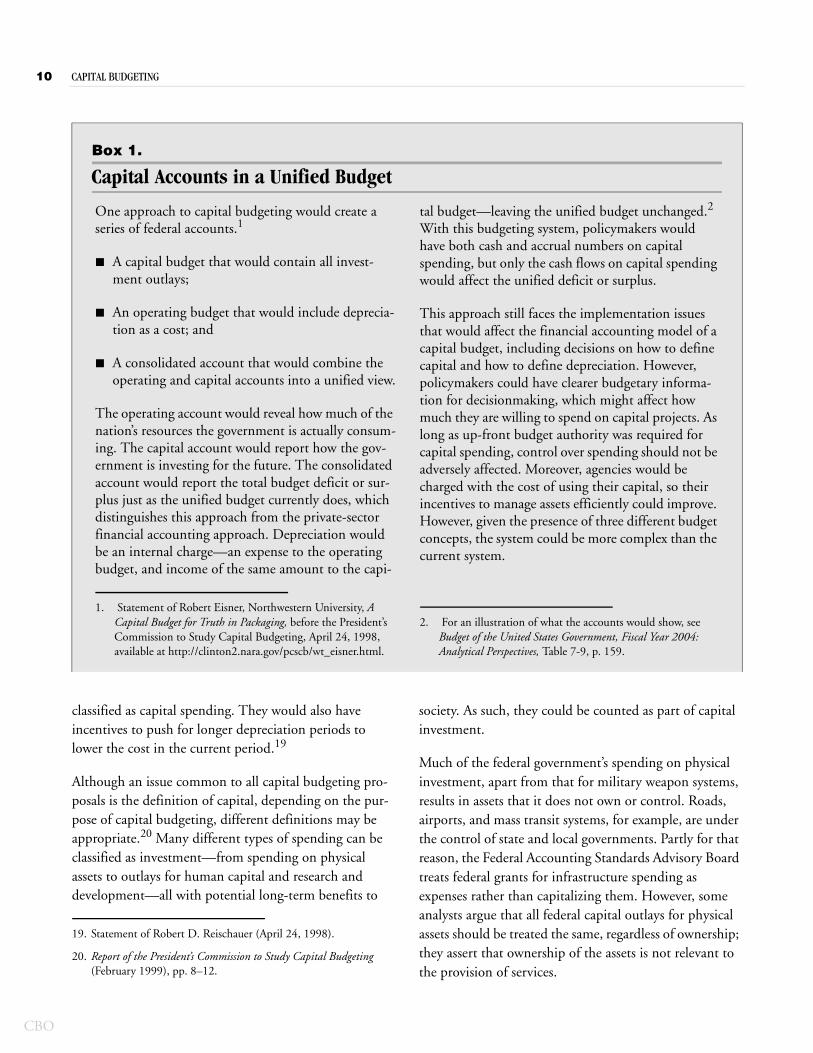
Box 1.
Capital Accounts in a Unified Budget
One approach to capital budgeting would create a series of federal accounts.1
B A capital budget that would contain all invest-ment outlays;
B An operating budget that would include deprecia-tion as a cost; and
B A consolidated account that would combine the operating and capital accounts into a unified view.
The operating account would reveal how much of the nation’s resources the government is actually consum-ing. The capital account would report how the gov-ernment is investing for the future. The consolidated account would report the total budget deficit or sur-plus just as the unified budget currently does, which distinguishes this approach from the private-sector financial accounting approach. Depreciation would be an internal charge—an expense to the operating budget, and income of the same amount to the capi-
tal budget—leaving the unified budget unchanged.2 With this budgeting system, policymakers would have both cash and accrual numbers on capital spending, but only the cash flows on capital spending would affect the unified deficit or surplus.
This approach still faces the implementation issues that would affect the financial accounting model of a capital budget, including decisions on how to define capital and how to define depreciation. However, policymakers could have clearer budgetary informa-tion for decisionmaking, which might affect how much they are willing to spend on capital projects. As long as up-front budget authority was required for capital spending, control over spending should not be adversely affected. Moreover, agencies would be charged with the cost of using their capital, so their incentives to manage assets efficiently could improve. However, given the presence of three different budget concepts, the system could be more complex than the current system.
1. Statement of Robert Eisner, Northwestern University, A Capital Budget for Truth in Packaging, before the President’s Commission to Study Capital Budgeting, April 24, 1998, available at http://clinton2.nara.gov/pcscb/wt_eisner.html.
2. For an illustration of what the accounts would show, see Budget of the United States Government, Fiscal Year 2004: Analytical Perspectives, Table 7-9, p. 159.
19. Statement of Robert D. Reischauer (April 24, 1998).
20. Report of the President’s Commission to Study Capital Budgeting (February 1999), pp. 8–12.
CAPITAL BUDGETING 11
CBO
Another major issue is the time period for allocating costs, which involves assumptions about the useful life of an asset and the depreciation rate schedule. Various rate schedules could be used in capital budgeting, including straight-line or accelerated depreciation (higher rates of depreciation in the early years). The imprecision in deter-mining depreciation rate schedules, however, has not pre-vented their use in other settings. For example, deprecia-tion affects reported corporate profits and federal tax receipts. An unavoidable problem is that reported depre-ciation imperfectly tracks changes in the economic value of an asset. In particular, there are examples of invest-ments, particularly buildings, having significant residual value after complete depreciation for tax purposes. There is even less experience to draw on when determining the appropriate depreciation rate for intangible capital, par-ticularly human capital.21 Considerable judgment would be required; the Congress might choose to specify the depreciation rate (as it has done for tax purposes) for broad categories of investments—or even for specific ones. Similarly, determining the depreciation rate of weapon systems for budgetary purposes, especially when factoring in technical obsolescence, would most likely be contentious, even though the Department of Defense has done substantial work valuing those systems.22 One con-cern is that changes in how such valuations are made and how depreciation is applied might not be transparent, which increases the potential for manipulation.
Reporting depreciation as an outlay would raise other questions. Should depreciation rates be adjusted annually to account for inflation or changes in the replacement cost of an asset? What about asset retirement costs—for example, decommissioning nuclear submarines or clean-ing up Army bases? One approach would be to include such end-of-the-cycle costs in the capitalized cost of the assets and depreciate them over the useful life of the asset. Doing so would provide a complete assessment of the costs of new investments. (The budget currently reports
asset retirement costs as they are paid at the end of the life cycle.)
Mixing Cash and Accrual Measures in the BudgetOther nations have adopted capital budgets, but they typically did so as part of a switch from cash budgeting to accrual budgeting.23 Mixing cash and accrual measures muddies the relationship between the federal deficit and the change in debt held by the public, which would make it more difficult to gauge the short-term macroeconomic effects of federal fiscal policy.
The principal current use of accrual methods in the bud-get is to measure the subsidy costs of federal credit pro-grams. In adopting the Federal Credit Reform Act of 1990, the Congress sought to improve budgeting for fed-eral credit programs by making the budgetary costs of direct loans and loan guarantees comparable with those of other programs. The aim of credit reform is to report the government’s entire expected loss from direct and guaranteed loans when the loans are made and to place both types of transactions, as well as grants, on a level playing field in the allocation of budgetary resources. Such credit subsidy estimates are reported in the federal budget when the credit is provided.24 Moving other sig-nificant components of the budget to an accrual concept, however, could make it difficult to sustain a cash-based concept for the rest of the budget. Moving capital spend-ing to an accrual basis should therefore be considered in the broader context of possibly adopting accrual account-ing for the budget as a whole.
Australia and New Zealand adopted accrual budgeting because they determined that accruals provided better cost measures than cash to support their budgeting proce-dures, known as “output-based budgeting.” In New Zealand, output-based budgeting means that government ministers purchase outputs from departments or other providers; departments manage their inputs, including capital, independently. Departments use accrual budget-ing to ensure that the price they charge reflects their full
21. Statement of Paul L. Posner, Director, Budget Issues, Accounting and Information Management Division, Government Account-ability Office, Budget Issues: Budgeting for Capital, before the President’s Commission to Study Capital Budgeting, GAO/T-AIMD-98-99 (March 6, 1998).
22. Statement of Edward M. Gramlich, Member, Board of Governors of the Federal Reserve System, before the President’s Commission to Study Capital Budgeting (March 6, 1998), available at http://clinton2.nara.gov/pcscb/wt_gramlich.html.
23. Government Accountability Office, Budget Issues: Accrual Budget-ing Useful in Certain Areas but Does Not Provide Sufficient Informa-tion for Reporting on Our Nation’s Longer-Term Fiscal Challenge, GAO-08-206 (December 20, 2007), pp. 4 and 21.
24. Agencies reevaluate their initial subsidy estimates each year and record any necessary adjustments in the budget. See Congressional Budget Office, Credit Subsidy Reestimates, 1993-1999 (September 2000).

12 CAPITAL BUDGETING
CBO
cost of holding and using capital. Accrual budgeting ensures that departments decide rationally whether to own or rent assets and that the prices charged by depart-ments are as comparable as possible to the prices charged by private-sector entities.25 Furthermore, accrual budget-ing enables government ministers as the “owners” of departments to make informed decisions about supplying additional capital to departments and to guard against departments wearing down their capital base, which would jeopardize their ability to provide outputs in the future. In those nations, however, accruals apply across the board to the depreciation of existing assets, employ-ees’ pension benefits, and the future cost of environmen-tal cleanup associated with government activities. (The costs of social insurance programs are still reported on a cash basis.) Approval by the Parliament is required for major capital infusions.
Although accrual measures may provide better informa-tion about the cost of providing services, those measures are estimates. As such, some accrual measures, such as the cost of pension benefits, are very sensitive to the underly-ing assumptions. In many cases, a substantial range of possible assumptions on which to base an estimate exists. For example, small changes in interest rate assumptions can lead to significant changes in accrual costs. (As just one example, the present value of a $1,000 cost in 50 years is $54 at a 6 percent nominal discount rate but more than twice as much, $141, at a 4 percent discount rate.) A danger is that assumptions could be biased or manipulated. Partly for that reason, accrual measures have not been widely adopted in the U.S. federal bud-get.26 Cash measures are harder to manipulate than accrual ones.
Another disadvantage of accrual accounting is that it pro-vides less insight into the timing of expenditures and rev-enues than cash-based budgets that are projected out over time. For example, a $1 accrual could result because $1 is spent today or because, with a 4 percent nominal dis-count rate, $7 will be spent 50 years from now.
Control over SpendingSome forms of capital budgeting could create new chal-lenges for the federal budget process. The budget is a decisionmaking tool to determine how much to spend and how to allocate that spending across programs. Spreading costs for capital spending over long periods would mean that much of the cost of capital programs would be recorded well beyond the 10-year period now used for budget projections and enforcement. The change would be most dramatic for discretionary pro-grams, where the controls over spending largely focus on the year in which funds are appropriated. Extending the time period for recording costs also could affect estimates underpinning current pay-as-you-go (PAYGO) rules for mandatory spending.
New mechanisms would therefore be needed to ensure accountability. For example, funding decisions for invest-ment projects rely on the provision of budget authority (or obligation limitations for highway programs) to con-trol the amount of spending. The application of capital budgeting techniques could involve the allocation of bud-get authority to future time periods in the same way that outlays for depreciation costs would be recorded. Other issues to consider regarding budget control would be the treatment of capital expenditures in the budget resolution and in appropriation bills, whether separate operating and capital budgets should be presented, and the treat-ment of asset write-offs.
Concerns about budget discipline explain why some countries have retained cash-based budgeting for capital spending.27 Norway and Sweden recently considered adopting accrual-based budgeting for all spending, including capital, but ultimately decided to stay with cash-based budgeting. Those countries concluded that cash-based budgeting provides better control over capital spending. For example, Sweden feared that capital bud-geting would undermine fiscal discipline by encouraging more spending for infrastructure and weapon systems at
25. Departments’ operating costs include both depreciation and a capital charge. The capital charge, designed to ensure that depart-ments recognize the opportunity cost of holding capital, includes both debt and equity components. The equity component, derived using the Capital Asset Pricing Model, notionally reflects the return on capital demanded by investors. Thus, the charge for capital reflects (as much as possible) the costs and incentives faced by private-sector managers.
26. Federal agencies budget for employees’ pension costs on an accrual basis, but those accruals are intragovernmental—flowing from the agencies to the government’s retirement accounts—and do not affect the surplus or deficit. See Congressional Budget Office, The President’s Proposal to Accrue Retirement Costs for Federal Employees (June 2002). 27. Government Accountability Office, Budget Issues.

CAPITAL BUDGETING 13
CBO
the expense of other priorities—while at the same time leading to more debt being incurred. Similarly, Denmark, Finland, and the Netherlands stopped using separate cap-ital budgets many years ago.28
Other Options Related to Capital BudgetingSome of the goals of capital budgeting might be met by less ambitious approaches. Creating a separate cap for capital spending under renewed enforcement provisions could serve to highlight policy goals. Capital acquisition funds could improve management of resources by agen-cies, without necessarily altering either the unified budget concept or budget enforcement procedures.
Create a Cap on Capital Spending as Part of New Budget Enforcement ProvisionsOne possible alternative to capital budgeting would be to create a category for capital spending as part of a restora-tion of statutory budget enforcement procedures origi-nally enacted in the Budget Enforcement Act of 1990 (BEA). Annual limits on appropriations (for discretionary spending) and the pay-as-you-go requirement for new mandatory spending and revenue laws expired on Sep-tember 30, 2002. The Congress has reinstated PAYGO provisions for mandatory spending through rules or the budget resolution, but discretionary spending (as much of capital spending is categorized) is not currently subject to any long-term planning constraints.
Experience with the provisions of the BEA suggests that caps can improve budgetary discipline as long as a politi-cal consensus exists to uphold them. Under an overall dis-cretionary spending cap, however, higher spending on capital investments would have to be offset by lower spending on other discretionary programs.
A separate category (or multiple categories) of discretion-ary spending related to capital expenditures could be cre-ated within an overall cap and could serve to identify important policy goals. For example, when the BEA was in effect, separate discretionary caps existed in certain years for areas such as transportation and conservation. The process of setting and enforcing such caps makes those particular areas more visible and allows for explicit policy decisions regarding goals and budgetary priorities. But lawmakers give up flexibility to meet other needs
within overall caps when they carve out separate limits for certain programs. In addition, spending priorities may shift from year to year. If the overall caps were extended for a five-year period—as they have been in the past—establishing sublimits might make it difficult to shift pri-orities, or, conversely, might prompt lawmakers to cate-gorize funding in ways that would take advantage of the structure of the specified groupings.
Set Up Capital Acquisition FundsWithout changing the requirement for up-front appro-priations, the government’s use of its funds might be improved by attributing the cost of capital to the agencies or programs that use the assets.29 Requiring users to pay the cost might improve incentives for agencies to sell assets that were no longer appropriate to their needs. Under current practices, acquisition costs are often not attributed to individual programs, and the holding costs of capital are almost never recognized. Once an asset has been acquired, the user recognizes neither its depreciation nor the interest on the public debt that could be retired if the asset was sold.
Capital acquisition funds, similar to those adopted in the Netherlands and the United Kingdom, are one way of reflecting capital costs in agencies’ budgets while retain-ing the full, up-front recognition costs in the budget totals; a separate capital budget would not be required. Under that approach, all capital assets could be purchased by accounts at the departmental level and financed with borrowing from the Treasury.30 (Importantly, depart-ments would still require authority to borrow from the Treasury.) Those accounts would then collect rental or mortgage payments from users of the capital sufficient to repay interest and principal to the Treasury. Because those payments would be intragovernmental, they would not affect the budget totals or the measure of the deficit or surplus. (The payments from the department would be exactly offset by receipts to the Treasury.) Thus, the pay-ments would be treated similarly to the accrual payments for employees’ pensions that agencies currently make to the federal retirement funds and for military retirees’ health care. The Congress requires those payments so
28. Budget of the United States Government, Fiscal Year 2004, p. 162.
29. Statement of June E. O’Neill (April 24, 1998).
30. For a complete description, see Government Accountability Office, Capital Financing: Potential Benefits of Capital Acquisition Funds Can Be Achieved Through Simpler Means, GAO-05-249 (April 2005). Also see Budget of the United States Government, Fiscal Year 2004, p. 13.

14 CAPITAL BUDGETING
CBO
that agencies consider more of the costs of labor when deciding how to allocate funds.
Setting up capital acquisition funds might present opera-tional challenges, though. To the extent that agencies in a department receive funding from different appropriation subcommittees, the department might need multiple acquisition funds. Agencies also have expressed concern that they might not receive sufficient appropriations to pay the annual charges. In addition, this alternative faces the types of implementation issues that confront capital budgeting—settling on a definition of capital and deter-mining appropriate depreciation rates, addressing unex-pected changes in the usefulness of assets, and funding asset retirement costs. For example, once an agency has fully repaid its debt to the Treasury, should the agency be able to use the asset without charge? Furthermore, many analysts are skeptical that such an approach would stop the use of lease arrangements and public/private partner-ships by agencies.
Although capital acquisition funds do not exist, the General Services Administration operates the Federal Buildings Fund, which serves a similar function. The fund finances some capital assets, mainly buildings, through full, up-front (that is, lump-sum) appropriations and then charges rental payments to users over time, to recover the original expenditure.31 This arrangement also helps avert spikes in agencies’ budget authority that could result from acquiring new buildings.
Economic Effects of More Capital SpendingTo the extent that policymakers would devote more resources to capital spending under a capital budgeting framework, total investment in the United States would probably increase, although the extent of such an increase would depend on the behavior of state and local govern-ments and the private sector. The economic benefit of any such increased capital investment would depend in part on which specific types of investment would be boosted. The literature on the economic returns from infrastructure spending, for example, suggests that such public spending often has positive returns but that both the average return and the range of returns among projects vary significantly and depend on a number of factors.32 Research suggests that the returns to early pub-lic investments, such as expanding the interstate highway system, can be large but that the economic payoff depends on the amount of infrastructure already in place. The evidence also suggests that a large share of net bene-fits may come from a relatively small share of potential projects.
31. Ibid., p. 5, and Figure 3, p. 24.
32. Statement of Peter Orszag, Director, Congressional Budget Office, Current and Future Investment in Infrastructure, before the House Committee on the Budget and the House Committee on Trans-portation and Infrastructure (May 8, 2008).
Appendix:State Capital Budgeting
Unlike the federal government, most states pre-pare capital budgets. Some general observations about those capital budgets are that:
B States finance capital expenditures with a mix of cur-rent revenues and fees as well as issuances of debt;
B In contrast with practices in the private sector, states do not report depreciation as an expense;
B States face credit-market constraints on borrowing that are not as relevant for the federal government. In addition, states have enacted, to varying degrees, requirements for balanced operating budgets and restrictions on the issuance of debt; and
B Also unlike the federal government, states must com-pete for taxpayers, constraining their ability to shift the costs of today’s services to future taxpayers.
Content of a Capital BudgetA state capital budget is a statement of costs and sources of financing for proposed road, rail, recreational, environ-mental, technological, and building projects over a lim-ited period. Those budgets generally include expenditures for planning, land acquisition, design, construction, and equipment. Some states’ capital budgets also include grant payments to local governments and public authori-ties for aviation, economic development, port develop-ment, community colleges, mental health, and housing projects. Project expenditures must exceed a minimum value to be included in a capital budget, although those minimums range widely—from $500 in Arkansas to $500,000 for construction projects in Oregon.
Not all capital-related expenditures are included, how-ever. Most states exclude expenditures for maintenance
and payments on leased property, which are instead included in operating budgets. Debt issued by certain public authorities that is backed by revenue collected by those authorities, such as toll revenue, is also excluded in most cases; some authority debt is considered “off-budget” if a state is not legally required to make debt-service payments on the authority’s behalf in the event of default.
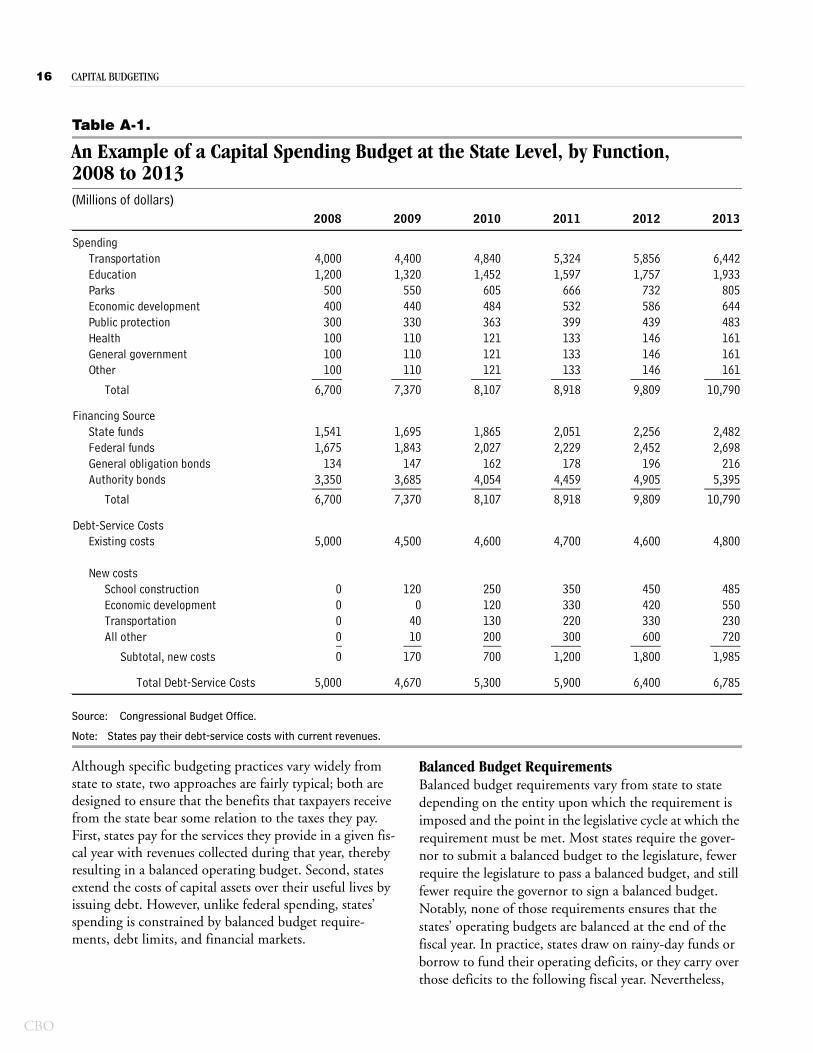
State capital budgets generally contain two sections: one that describes expenditures for projects that are not financed using debt, and another that describes debt-service payments on borrowed revenues (see Table A-1). Both of those types of expenditures are paid from current revenues. Although capital financing patterns vary from state to state, 39 percent of all state capital expenditures in 2006 were paid from state special funds, 28 percent from federal funds, 27 percent from bond proceeds, and 6 percent from general funds.1
Capital Budgeting and Constraints at the State LevelStates’ budgeting practices reflect the reality that they must compete with each other for taxpayers. In other words, budget discipline is imposed on the states by the market for taxpayers, a market that is considerably more competitive than the one in which federal budgeting practices are formed. States that incurred high levels of debt would have to pay high levels of interest, and that debt service would either crowd out other types of expen-ditures for services or force legislators to raise taxes. Such fiscal policies could encourage residents to leave the state in search of a lower tax burden or additional services.
1. National Association of State Budget Officers, State Expenditure Report 2006 (December 2007), p. 83.
16 CAPITAL BUDGETING
CBO
Table A-1.
An Example of a Capital Spending Budget at the State Level, by Function, 2008 to 2013(Millions of dollars)
Source: Congressional Budget Office.
Note: States pay their debt-service costs with current revenues.
Although specific budgeting practices vary widely from state to state, two approaches are fairly typical; both are designed to ensure that the benefits that taxpayers receive from the state bear some relation to the taxes they pay. First, states pay for the services they provide in a given fis-cal year with revenues collected during that year, thereby resulting in a balanced operating budget. Second, states extend the costs of capital assets over their useful lives by issuing debt. However, unlike federal spending, states’ spending is constrained by balanced budget require-ments, debt limits, and financial markets.
Balanced Budget RequirementsBalanced budget requirements vary from state to state depending on the entity upon which the requirement is imposed and the point in the legislative cycle at which the requirement must be met. Most states require the gover-nor to submit a balanced budget to the legislature, fewer require the legislature to pass a balanced budget, and still fewer require the governor to sign a balanced budget. Notably, none of those requirements ensures that the states’ operating budgets are balanced at the end of the fiscal year. In practice, states draw on rainy-day funds or borrow to fund their operating deficits, or they carry over those deficits to the following fiscal year. Nevertheless,
2008 2009 2010 2011 2012 2013
4,000 4,400 4,840 5,324 5,856 6,4421,200 1,320 1,452 1,597 1,757 1,933
500 550 605 666 732 805400 440 484 532 586 644300 330 363 399 439 483100 110 121 133 146 161100 110 121 133 146 161100 110 121 133 146 161_____ _____ _____ _____ _____ ______
6,700 7,370 8,107 8,918 9,809 10,790
1,541 1,695 1,865 2,051 2,256 2,4821,675 1,843 2,027 2,229 2,452 2,698
134 147 162 178 196 2163,350 3,685 4,054 4,459 4,905 5,395_____ _____ _____ _____ _____ ______6,700 7,370 8,107 8,918 9,809 10,790
5,000 4,500 4,600 4,700 4,600 4,800
0 120 250 350 450 4850 0 120 330 420 5500 40 130 220 330 2300 10 200 300 600 720_ ___ ___ _____ _____ _____0 170 700 1,200 1,800 1,985
Total Debt-Service Costs 5,000 4,670 5,300 5,900 6,400 6,785
Subtotal, new costs
SpendingTransportation
General governmentOther
Financing Source
EducationParksEconomic developmentPublic protectionHealth
Total
State fundsFederal fundsGeneral obligation bondsAuthority bonds
Debt-Service CostsExisting costs
New costs
All other
Total
School constructionEconomic developmentTransportation
APPENDIX CAPITAL BUDGETING 17
CBO
the fact that budget overruns are usually small relative to total state expenditures suggests that the requirements do impose budget discipline on legislators.
Although capital investments are not subject to balanced budget requirements, debt-service payments are paid with current revenues and therefore are subject to those requirements. States do not report depreciation as a bud-get outlay primarily because a state budget is a tool for managing expected cash outflows, and depreciation does not require a cash payment. (States do include deprecia-tion in their financial reports.) Reporting both deprecia-tion and debt service in the budget would force legislators to cut spending or raise taxes or fees unnecessarily in order to meet the balanced budget requirement.
State BorrowingCapital projects often require intermittent, large expendi-tures over an extended time, but a state’s ability to make those large expenditures is constrained by its need to pay for operating costs out of revenues collected during the fiscal year. Consequently, capital investments are gener-ally excluded from balanced budget requirements and are usually financed by issuing debt. That borrowing allows states to compete effectively for taxpayers by ensuring that the taxpayers who benefit from those assets also pay for them.
States have enacted constitutional, statutory, and admin-istrative limitations on debt issuance, which vary from
state to state. A state’s capacity to meet its debt-service payments changes as revenue collections fluctuate, so some states build flexibility into their limits by restricting outstanding debt to a percentage of the state’s taxable property value, or by holding debt service to a percentage of general fund revenues. Other states limit the total amount of debt outstanding or require voter approval before new debt may be issued. Regardless of their form, limits do not prevent states from incurring more debt, they simply require the voters, legislature, or an appointed body to decide explicitly to do so in the form of an amendment to the constitution, statute, or adminis-trative policy.
Financial MarketsStates’ borrowing costs are determined by the financial markets, and those costs change with the state’s fiscal con-dition. When states wish to borrow, they approach one or all of the credit-rating agencies to rate their bonds, and that rating largely determines their cost of borrowing. Very generally, the rating reflects the agencies’ assessment of the risk that the state will be unable or unwilling to make its debt-service payments. By lowering states’ credit ratings as debt or debt service reaches levels deemed risky by those agencies, the rating agencies provide a signal to the taxpayers that the state may have to cut other spending or raise taxes in order to meet its debt-service payments.