CB Final Presentation on Littering
31
To study and analyze the habit of littering among Indians Atul Kumar Sharma (053003) Gaurav Kumar (053014) Pratik Panigrahi (053030) Rashi Singh (053033) Shivam Khemka (053045) Siddharth Misra (053047) Group 18 Consumer Behavior
-
Upload
siddharth-misra -
Category
Documents
-
view
36 -
download
5
Transcript of CB Final Presentation on Littering

Consumer Behavior
To study and analyze the habit of littering among IndiansAtul Kumar Sharma (053003)Gaurav Kumar (053014)Pratik Panigrahi (053030)Rashi Singh (053033)Shivam Khemka (053045)Siddharth Misra (053047)
Group 18

Litter and LitteringLitter refers to different waste products such as:-
ContainersPapersWrappers etc.
Disposed onto streets, country sides and remote places.Littering is the pollution of environment by different litter waste.

Littering in India
Very less concern towards “Environment Cleanliness”.
Huge Population:- 1.2 billion
Waste generation in India:- 1.3 pounds per person per day (Source:- CPHEEO)
1.5 million tons of garbage every day.
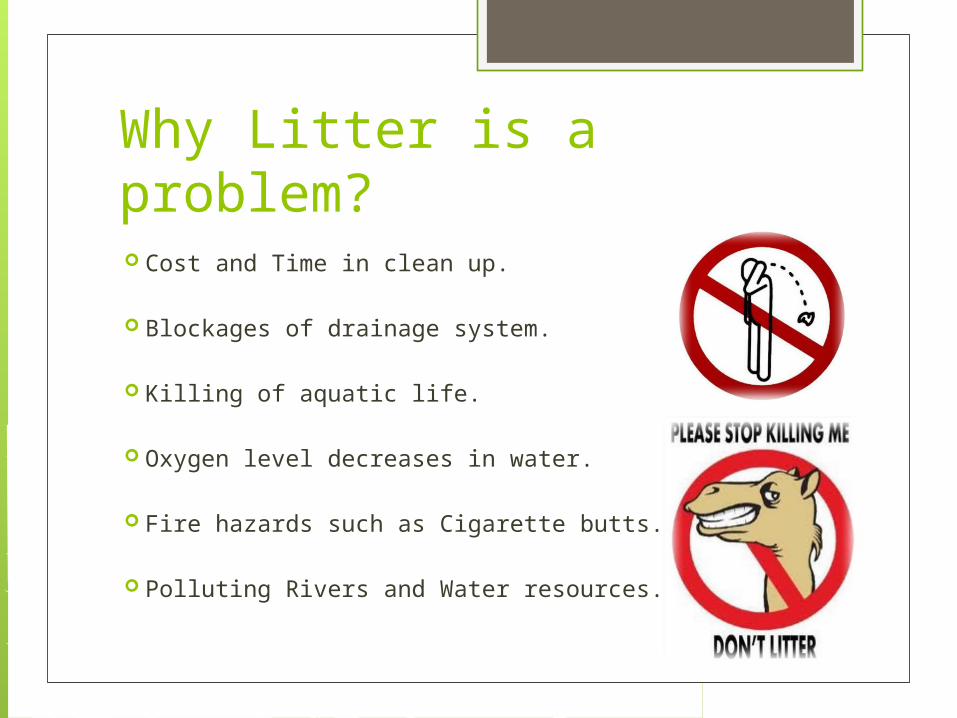
Why Litter is a problem? Cost and Time in clean up.
Blockages of drainage system.
Killing of aquatic life.
Oxygen level decreases in water.
Fire hazards such as Cigarette butts.
Polluting Rivers and Water resources.

A plastic beverage bottle takes 450 years to decompose
A plastic bag will not disintegrate for 20 years
Over 4.5 trillion cigarettes are littered worldwide each year
Each year thousands of animals strangle or choke from litter
Litter is a source of more than 2500 fires annually in urban areas
FACTS

Research Design
•Questionnaire•Focus group discussions
Research Instrument
•Convenience sampling •Students from FORE and other B-schools
Sampling
•A total of 68 respondents Sample
Size

Have you ever Littered?
Respondents were asked about if they had littered to begin with. This was like an acceptance and has a flow of the questions.
91%
9%
YesNoDon't Know

Littering Frequency
This gives us the result of how often the respondents think they litter. They cannot keep track of things which are done unconsciously. However they can estimate a conservative number of times they usually litter. Majority accepted that they were involved in littering rarely and sometimes.
5%
22%
58%
15%
OftenSometimesRarelyNever

Perception about littering in India
Respondents perception about littering being a problem or not was captured by asking them if they considered it one. The magnitude of the problem was further divided into three scales of minor, major and no problem. This reflects the awareness and concern about littering among the respondents.
94%
6%
Major ProblemMinor ProblemNot a Problem at all

Cause of Littering
Respondents were asked the main causes of litter in the society. This was to assess what the participants thought was causing litter the most in the surroundings. Majority said they viewed it as a problem due to lack of proper waste disposal.
Cigar
ette
Sm
oker
s
Const
ruct
ion
Site
s
Garba
ge C
olle
ctio
n
Outdo
or R
ecre
atio
n
Peop
le D
rivin
g
Peop
le W
alki
ng
Teen
ager
s
Uncov
ered
load
from
Tru
cks
No pr
oper
mec
hani
sm fo
r was
te d
ispo
sal
0%
20%
40%
60%
80%

Situational Barriers to Proper Disposal
Participants were asked how likely they were to litter given ten situational barriers and motivators to proper disposal. The response categories were from zero (not at all likely) to five (very likely). Higher scores indicate greater likelihood of littering in that situation.

Types of litter: How likely are you to drop…
The main dependent variable in the survey was self-reported willingness to litter. Respondents were asked the likelihood that they would drop specific items. The intended littering behavior items provides us a combined measure of all the intended behaviors, as well as measures of intended behavior for the specific types of litter.

Concern for Keeping Places Clean
The participants were asked if they are likely to correct people who litter to keep surroundings clean. This also involved going beyond oneself to do the right thing. People could get shy and indifferent at times when educating and correcting others. However as the respondents felt that the problem of littering was severe, they also are ready to change and correct people behavior and habits.
22%
46%
26%
5%
2%
Very likelySomewhat LikelySomewhat UnlikelyVery UnlikelyUndecided

Availability of Trash Cans in Public Places
Majority of the respondents believe that there are not enough trash cans in the public places.
2% 3%
6%
57%
32% Strongly AgreeAgreeNeither Agree nor DisagreeDisagreeStrongly Disagree
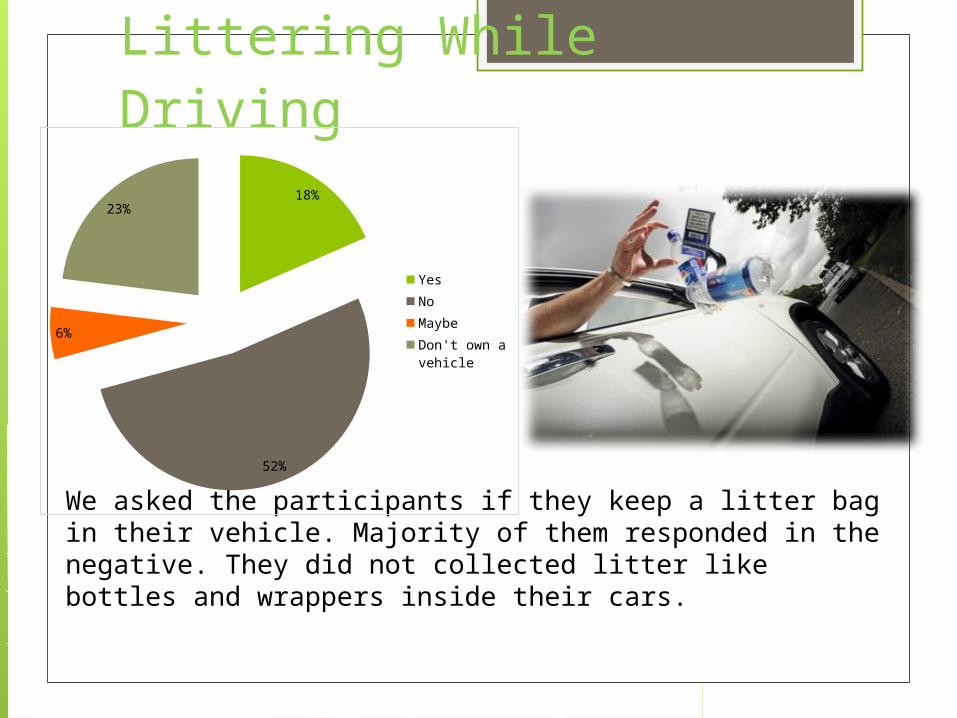
Littering While Driving
We asked the participants if they keep a litter bag in their vehicle. Majority of them responded in the negative. They did not collected litter like bottles and wrappers inside their cars.
18%
52%
6%
23%
YesNoMaybeDon't own a vehicle
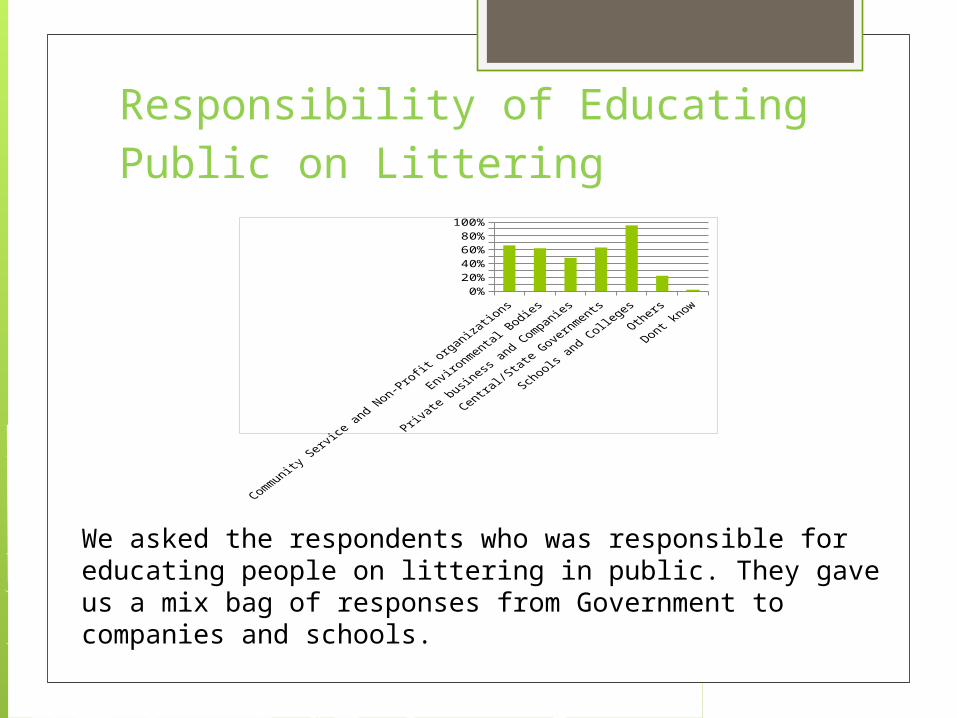
Responsibility of Educating Public on Littering
We asked the respondents who was responsible for educating people on littering in public. They gave us a mix bag of responses from Government to companies and schools.
0%20%40%60%80%
100%

Visibility and Recall of Litter Prevention Messages
66%
28%
6%
YesNoDont know
Respondents were asked if they had seen some ad campaign or messages regarding litter prevention through any medium. Majority of them had seen at least one.

Effectiveness of Litter Prevention Messages
Respondents were asked their view on effectiveness of messages on anti-littering. People have mixed responses in this. This was to measure how successful is a litter prevention message and education campaign to prevent the respondents from littering.
11%
26%
31%
28%
5%
Very IneffectiveIneffectiveNeither Effective nor IneffectiveEffectiveVery Effective

Chi Square 1Ho: The frequency of littering is not affected by any Litter prevention messages.
H1: The frequency of littering is affected by any Litter prevention messages.
From the above generated table we can see that the P Value for 95% significance level is 0.04
Which is less than our α = 0.05. So, we can reject our null hypothesis stating that the frequency of littering was being influenced and affected by litter prevention messages. This was further proved by Chi Square analysis. We found that litter prevention messages affected habit of littering. It gave them a recall and awareness for the problem of littering.

Chi Square 2
Ho: The frequency of littering is not in relation to Age.
H1: The frequency of littering is in a relation to Age.
From the below generated table we can see that the P Value for 95% significance level is 0.88. Which is more than our α = 0.05. So, we can accept our null hypothesis stating that littering was not affected by age of the respondents. However the majority of age of the respondents is under 25 years. Therefore it will be difficult to take a stand for general but it is acceptable for this research report.

Chi Square 3
H0: The frequency of littering not related to the availability of Trash Cans.
H1: The frequency of littering is related to the availability of Trash Cans.
From the below generated table we can see that the P Value for 95% significance level is 0.48. Which is more than our α = 0.05. So, we can accept our null hypothesis stating that frequency of littering is not affected by the number of trash cans in public. This shows that even if there are trash cans people’s habit to litter will remain as it is.

Focus Group Discussion Analysis
Major Points that were discussed -
Throwing away of things, indiscipline , improper waste disposal techniques
chewing gums, left over of an apple or food item, cigarette buds and spitting of pan masala
Tendency to break rules, surroundings play an important role, airports are littered less in comparison to train stations
Not enough bins , mindset towards already littered place, more litter while travelling, income and education playing vital role.

Consequences of littering - discussed -
•Spread of life threatening diseases, unhygienic environment•hampering country image, low tourism
Avoiding littering
Family education Educational institutes NGOs

Other prevention measures
More stringent rules should be made and enforce them properly.
New advertisement campaigns with brand ambassadors like Amitabh Bachan or Sachin Tendulkar or any public figure that have a clean image.

ConclusionThe main cause of litter in the society was considered to be the lack of proper mechanism of garbage disposal.
On a scale of 1 to 5 the highest average rating that was given to a situational barrier to proper disposal was lack of trashcans around followed by the situation when there is already a lot of trash around.
On a scale of 1 to 5 the highest average rating for the type of litter that respondents are likely to drop was that of wrappers and chewing gum spitting.
Out of 77% of the respondents that own a vehicle, majority said that they do not have a litter bag in their vehicle.
Majority of respondents (91%) felt that it is the Schools and Colleges who are responsible for spreading awareness against littering.
Our chi square hypothesis analysis shows that the frequency of littering is not related to the availability of trash cans.
Campaign to stop littering
Address littering behavior and changing the environment
Almost 85% of littering is the result of individual attitudes – Changing individual behavior is the key to prevent littering
Working not only towards the cleaning up of the litter but also towards preventing its recurrence.

Attitude Change Process
Education and awareness are the basic tools
Out-of-Home (OOH) campaign would be the best option to enhance the initial learning
Utilizing Repetition to expose people to the same message in order to get the desired response.

1. Designing different OOH campaigns, each presenting three different images depicting three different kinds of litter (cigarette butts, banana peels, plastics, wrappers, chewing gums etc.)

2. Designing an OOH campaign, depicting a message from the animals to humans to stop littering in order to make them realize how
litter is adversely affecting them as well. This campaign would touch the people’s emotional
chord.

3. When people were asked the reasons for littering one of the reasons that a very high percentage of people responded to was ‘When there is already a lot of trash around’. So this OOH campaign will make people aware of the fact that adding litter to already existing litter is still litter and will further cause problems.