CAVA@San Diego
14
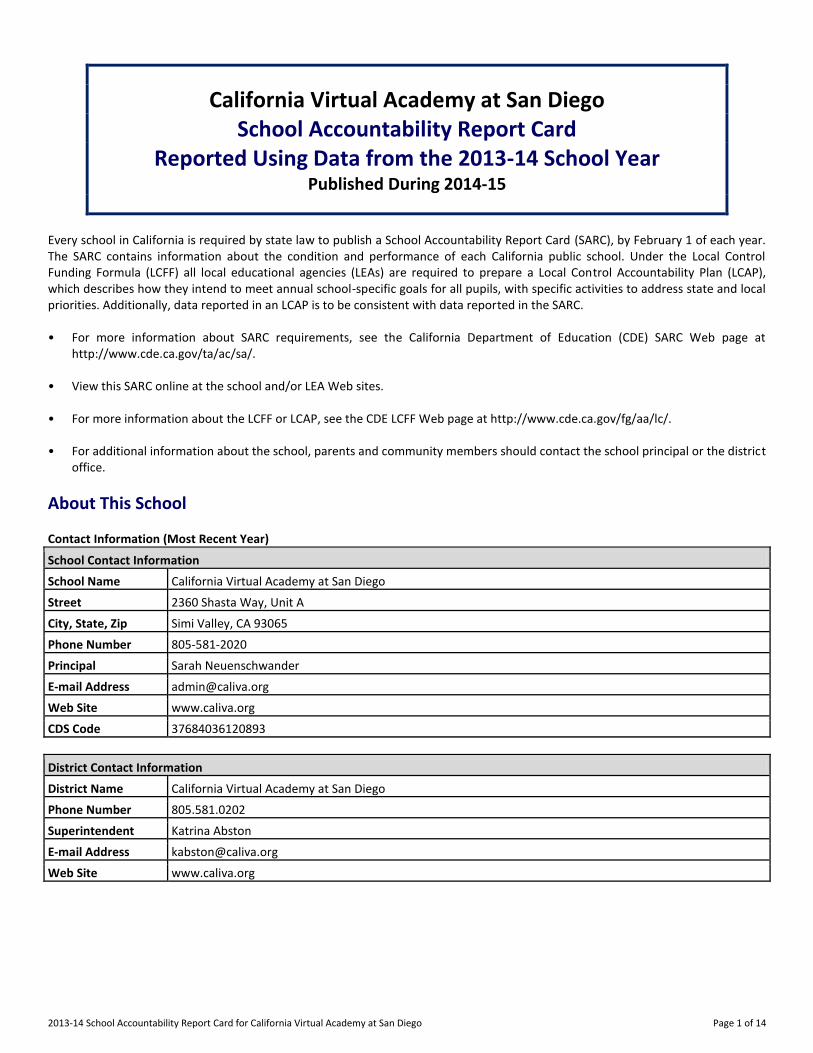
2013-14 School Accountability Report Card for California Virtual Academy at San Diego Page 1 of 14 California Virtual Academy at San Diego School Accountability Report Card Reported Using Data from the 2013-14 School Year Published During 2014-15 Every school in California is required by state law to publish a School Accountability Report Card (SARC), by February 1 of each year. The SARC contains information about the condition and performance of each California public school. Under the Local Control Funding Formula (LCFF) all local educational agencies (LEAs) are required to prepare a Local Control Accountability Plan (LCAP), which describes how they intend to meet annual school-specific goals for all pupils, with specific activities to address state and local priorities. Additionally, data reported in an LCAP is to be consistent with data reported in the SARC. • For more information about SARC requirements, see the California Department of Education (CDE) SARC Web page at http://www.cde.ca.gov/ta/ac/sa/. • View this SARC online at the school and/or LEA Web sites. • For more information about the LCFF or LCAP, see the CDE LCFF Web page at http://www.cde.ca.gov/fg/aa/lc/. • For additional information about the school, parents and community members should contact the school principal or the district office. About This School Contact Information (Most Recent Year) School Contact Information School Name------- California Virtual Academy at San Diego Street------- 2360 Shasta Way, Unit A City, State, Zip------- Simi Valley, CA 93065 Phone Number------- 805-581-2020 Principal------- Sarah Neuenschwander E-mail Address------- [email protected] Web Site------- www.caliva.org CDS Code 37684036120893 District Contact Information District Name------- California Virtual Academy at San Diego Phone Number------- 805.581.0202 Superintendent------- Katrina Abston E-mail Address------- [email protected] Web Site------- www.caliva.org
Transcript of CAVA@San Diego
2013-14 School Accountability Report Card for California Virtual Academy at San Diego Page 1 of 14
California Virtual Academy at San Diego
School Accountability Report Card
Reported Using Data from the 2013-14 School Year
Published During 2014-15
Every school in California is required by state law to publish a School Accountability Report Card (SARC), by February 1 of each year. The SARC contains information about the condition and performance of each California public school. Under the Local Control Funding Formula (LCFF) all local educational agencies (LEAs) are required to prepare a Local Control Accountability Plan (LCAP), which describes how they intend to meet annual school-specific goals for all pupils, with specific activities to address state and local priorities. Additionally, data reported in an LCAP is to be consistent with data reported in the SARC. • For more information about SARC requirements, see the California Department of Education (CDE) SARC Web page at
http://www.cde.ca.gov/ta/ac/sa/. • View this SARC online at the school and/or LEA Web sites. • For more information about the LCFF or LCAP, see the CDE LCFF Web page at http://www.cde.ca.gov/fg/aa/lc/. • For additional information about the school, parents and community members should contact the school principal or the district
office.
About This School Contact Information (Most Recent Year)
School Contact Information
School Name------- California Virtual Academy at San Diego
Street------- 2360 Shasta Way, Unit A
City, State, Zip------- Simi Valley, CA 93065
Phone Number------- 805-581-2020
Principal------- Sarah Neuenschwander
E-mail Address------- [email protected]
Web Site------- www.caliva.org
CDS Code 37684036120893
District Contact Information
District Name------- California Virtual Academy at San Diego
Phone Number------- 805.581.0202
Superintendent------- Katrina Abston
E-mail Address------- [email protected]
Web Site------- www.caliva.org
2013-14 School Accountability Report Card for California Virtual Academy at San Diego Page 2 of 14
School Description and Mission Statement (Most Recent Year)
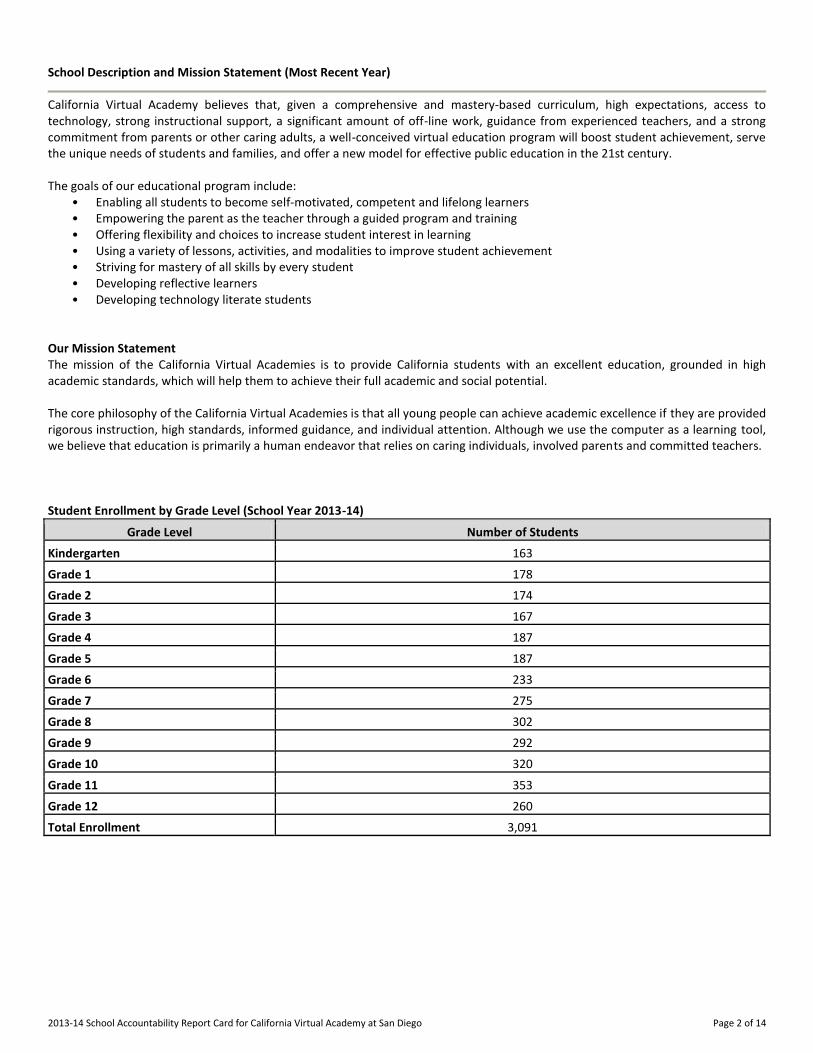
California Virtual Academy believes that, given a comprehensive and mastery-based curriculum, high expectations, access to technology, strong instructional support, a significant amount of off-line work, guidance from experienced teachers, and a strong commitment from parents or other caring adults, a well-conceived virtual education program will boost student achievement, serve the unique needs of students and families, and offer a new model for effective public education in the 21st century. The goals of our educational program include:
• Enabling all students to become self-motivated, competent and lifelong learners • Empowering the parent as the teacher through a guided program and training • Offering flexibility and choices to increase student interest in learning • Using a variety of lessons, activities, and modalities to improve student achievement • Striving for mastery of all skills by every student • Developing reflective learners • Developing technology literate students
Our Mission Statement The mission of the California Virtual Academies is to provide California students with an excellent education, grounded in high academic standards, which will help them to achieve their full academic and social potential. The core philosophy of the California Virtual Academies is that all young people can achieve academic excellence if they are provided rigorous instruction, high standards, informed guidance, and individual attention. Although we use the computer as a learning tool, we believe that education is primarily a human endeavor that relies on caring individuals, involved parents and committed teachers. Student Enrollment by Grade Level (School Year 2013-14)
Grade Level Number of Students
Kindergarten------- 163
Grade 1------- 178
Grade 2------- 174
Grade 3------- 167
Grade 4------- 187
Grade 5------- 187
Grade 6------- 233
Grade 7------- 275
Grade 8 302
Grade 9------- 292
Grade 10------- 320
Grade 11------- 353
Grade 12------- 260
Total Enrollment------- 3,091

2013-14 School Accountability Report Card for California Virtual Academy at San Diego Page 3 of 14
Student Enrollment by Group (School Year 2013-14)
Group Percent of Total Enrollment
Black or African American------- 9.3
American Indian or Alaska Native------- 1.8
Asian------- 4.6
Filipino------- 2.5
Hispanic or Latino------- 24.8
Native Hawaiian or Pacific Islander 0.8
White 55.0
Two or More Races 0.0
Socioeconomically Disadvantaged 51.6
English Learners 2.1
Students with Disabilities 10.4
A. Conditions of Learning
State Priority: Basic The SARC provides the following information relevant to the Basic State Priority (Priority 1): • Degree to which teachers are appropriately assigned and fully credentialed in the subject area and for the pupils they are
teaching; • Pupils have access to standards-aligned instructional materials; and • School facilities are maintained in good repair. Teacher Credentials
Teachers School District
2012-13 2013-14 2014-15 2014-15
With Full Credential 100% 100% 100% 100%
Without Full Credential 0 0 0 0%
Teaching Outside Subject Area of Competence (with full credential) 0 0 0
Teacher Misassignments and Vacant Teacher Positions
Indicator 2012-13 2013-14 2014-15
Misassignments of Teachers of English Learners 0 0 0
Total Teacher Misassignments * 0 0 0
Vacant Teacher Positions 0 0 0 Note: “Misassignments” refers to the number of positions filled by teachers who lack legal authorization to teach that grade level, subject area, student group, etc. * Total Teacher Misassignments includes the number of Misassignments of Teachers of English Learners.

2013-14 School Accountability Report Card for California Virtual Academy at San Diego Page 4 of 14
Core Academic Classes Taught by Highly Qualified Teachers (School Year 2013-14)
Location of Classes Percent of Classes In Core Academic Subjects
Taught by Highly Qualified Teachers Not Taught by Highly Qualified Teachers
This School 100.00 0.00
All Schools in District 100.00 0.00
High-Poverty Schools in District 100.00 0.00
Low-Poverty Schools in District 0.00 0.00 Note: High-poverty schools are defined as those schools with student eligibility of approximately 40 percent or more in the free and reduced price meals program. Low-poverty schools are those with student eligibility of approximately 39 percent or less in the free and reduced price meals program. Quality, Currency, Availability of Textbooks and Instructional Materials (School Year 2014-15) Year and month in which data were collected: June 2014 CAVA is a public charter school. Students are provided new curriculum each year.
Core Curriculum Area Textbooks and Instructional Materials/
Year of Adoption
From Most Recent
Adoption?
Percent of Students Lacking Own
Assigned Copy
Reading/Language Arts K12 Materials are provided new to students at enrollment and each year when curriculum is mastered.
Yes 0%
Mathematics K12 Materials Yes 0%
Science------- K12 Materials Yes 0%
History-Social Science K12 Materials Yes 0%
Foreign Language Middlebury Yes 0%
Health------- K12 Yes 0%
Visual and Performing Arts CAVA is an independent study program that is not site based. Art is provided by K12.
Yes 0%
Science Laboratory Equipment (grades 9-12)
CAVA is not a site based program. All materials are provided by K12 curriculum.
Yes 0%
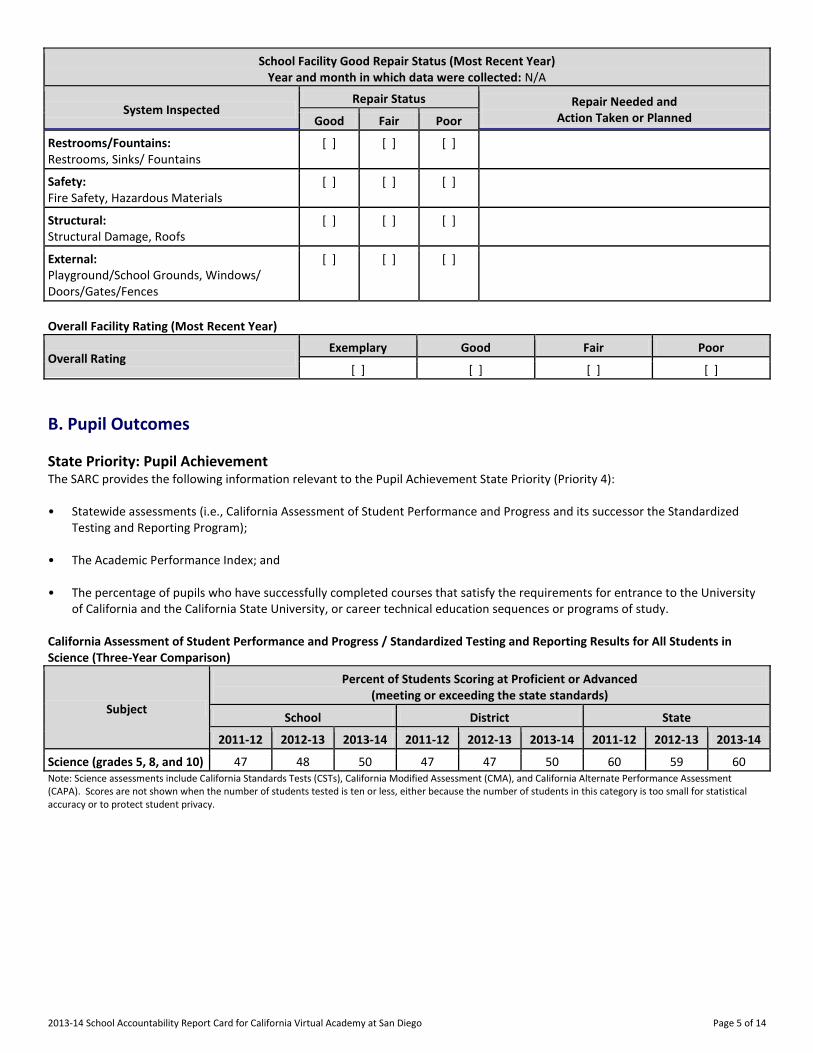
School Facility Conditions and Planned Improvements (Most Recent Year)
CAVA is a non-site based facility. School Facility Good Repair Status (Most Recent Year)
School Facility Good Repair Status (Most Recent Year) Year and month in which data were collected: N/A
System Inspected Repair Status Repair Needed and
Action Taken or Planned Good Fair Poor
Systems: Gas Leaks, Mechanical/HVAC, Sewer
[ ] [ ] [ ]
Interior: Interior Surfaces
[ ] [ ] [ ]
Cleanliness: Overall Cleanliness, Pest/ Vermin Infestation
[ ] [ ] [ ]
Electrical: Electrical
[ ] [ ] [ ]
2013-14 School Accountability Report Card for California Virtual Academy at San Diego Page 5 of 14
School Facility Good Repair Status (Most Recent Year) Year and month in which data were collected: N/A
System Inspected Repair Status Repair Needed and
Action Taken or Planned Good Fair Poor
Restrooms/Fountains: Restrooms, Sinks/ Fountains
[ ] [ ] [ ]
Safety: Fire Safety, Hazardous Materials
[ ] [ ] [ ]
Structural: Structural Damage, Roofs
[ ] [ ] [ ]
External: Playground/School Grounds, Windows/ Doors/Gates/Fences
[ ] [ ] [ ]
Overall Facility Rating (Most Recent Year)
Overall Rating Exemplary Good Fair Poor
[ ] [ ] [ ] [ ]
B. Pupil Outcomes
State Priority: Pupil Achievement The SARC provides the following information relevant to the Pupil Achievement State Priority (Priority 4): • Statewide assessments (i.e., California Assessment of Student Performance and Progress and its successor the Standardized
Testing and Reporting Program); • The Academic Performance Index; and • The percentage of pupils who have successfully completed courses that satisfy the requirements for entrance to the University
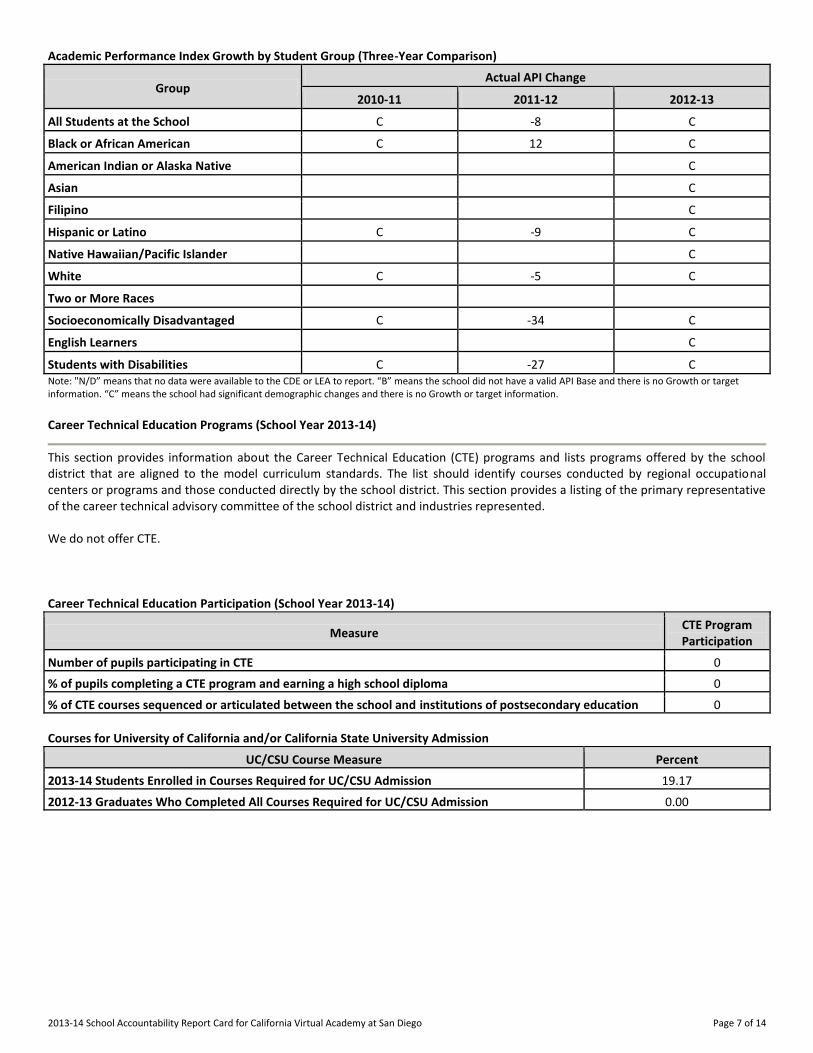
of California and the California State University, or career technical education sequences or programs of study. California Assessment of Student Performance and Progress / Standardized Testing and Reporting Results for All Students in Science (Three-Year Comparison)
Subject
Percent of Students Scoring at Proficient or Advanced (meeting or exceeding the state standards)
School District State
2011-12 2012-13 2013-14 2011-12 2012-13 2013-14 2011-12 2012-13 2013-14
Science (grades 5, 8, and 10) 47 48 50 47 47 50 60 59 60 Note: Science assessments include California Standards Tests (CSTs), California Modified Assessment (CMA), and California Alternate Performance Assessment (CAPA). Scores are not shown when the number of students tested is ten or less, either because the number of students in this category is too small for statistical accuracy or to protect student privacy.

2013-14 School Accountability Report Card for California Virtual Academy at San Diego Page 6 of 14
California Assessment of Student Performance and Progress Results by Student Group in Science (School Year 2013-14)
Group Percent of Students Scoring at Proficient or Advanced
All Students in the LEA 50
All Student at the School 50
Male------- 55
Female------- 45
Black or African American 39
American Indian or Alaska Native 54
Asian------- 59
Filipino------- 55
Hispanic or Latino 38
Native Hawaiian or Pacific Islander
White------- 57
Two or More Races-------
Socioeconomically Disadvantaged 42
English Learners------- 29
Students with Disabilities 24
Students Receiving Migrant Education Services Note: CAASPP includes science assessments (CSTs, CMA, and CAPA) in grades 5, 8, and 10. Scores are not shown when the number of students tested is ten or less, either because the number of students in this category is too small for statistical accuracy or to protect student privacy. Standardized Testing and Reporting Results for All Students (Three-Year Comparison)
Subject
Percent of Students Scoring at Proficient or Advanced (meeting or exceeding the state standards)
School District State
2010-11 2011-12 2012-13 2010-11 2011-12 2012-13 2010-11 2011-12 2012-13
English-Language Arts 58 58 55 58 58 55 54 56 55
Mathematics------- 29 29 26 30 29 26 49 50 50
History-Social Science 42 37 37 42 37 37 48 49 49 Note: STAR Program was last administered in 2012-13. Percentages are not calculated when the number of students tested is ten or less, either because the number of students in this category is too small for statistical accuracy or to protect student privacy. Academic Performance Index Ranks (Three-Year Comparison)
API Rank 2010-11 2011-12 2012-13
Statewide------- 3 2 2
Similar Schools------- 6 7 7 Note: For 2014 and subsequent years, the statewide and similar schools ranks will no longer be produced.
2013-14 School Accountability Report Card for California Virtual Academy at San Diego Page 7 of 14
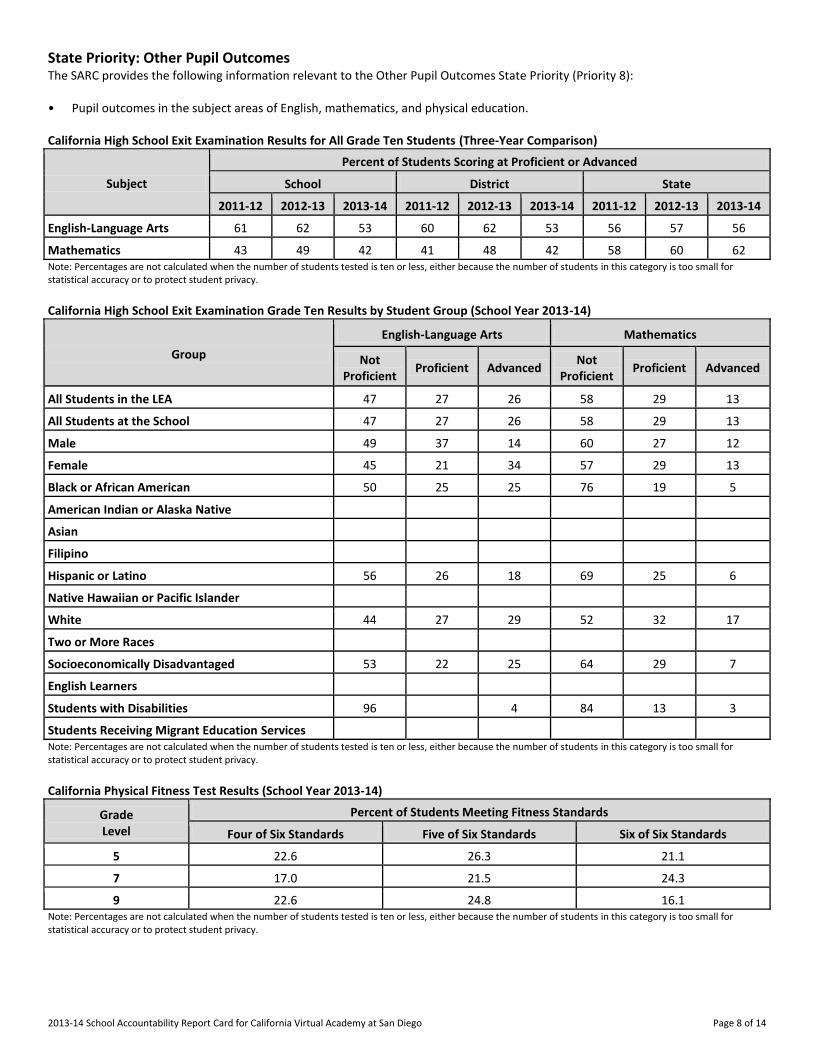
Academic Performance Index Growth by Student Group (Three-Year Comparison)
Group Actual API Change
2010-11 2011-12 2012-13
All Students at the School C -8 C
Black or African American C 12 C
American Indian or Alaska Native C
Asian------- C
Filipino------- C
Hispanic or Latino C -9 C
Native Hawaiian/Pacific Islander C
White------- C -5 C
Two or More Races
Socioeconomically Disadvantaged C -34 C
English Learners C
Students with Disabilities C -27 C Note: "N/D” means that no data were available to the CDE or LEA to report. “B” means the school did not have a valid API Base and there is no Growth or target information. “C” means the school had significant demographic changes and there is no Growth or target information.
Career Technical Education Programs (School Year 2013-14)
This section provides information about the Career Technical Education (CTE) programs and lists programs offered by the school district that are aligned to the model curriculum standards. The list should identify courses conducted by regional occupational centers or programs and those conducted directly by the school district. This section provides a listing of the primary representative of the career technical advisory committee of the school district and industries represented. We do not offer CTE. Career Technical Education Participation (School Year 2013-14)
Measure CTE Program Participation
Number of pupils participating in CTE 0
% of pupils completing a CTE program and earning a high school diploma 0
% of CTE courses sequenced or articulated between the school and institutions of postsecondary education 0
Courses for University of California and/or California State University Admission
UC/CSU Course Measure Percent
2013-14 Students Enrolled in Courses Required for UC/CSU Admission 19.17
2012-13 Graduates Who Completed All Courses Required for UC/CSU Admission 0.00
2013-14 School Accountability Report Card for California Virtual Academy at San Diego Page 8 of 14
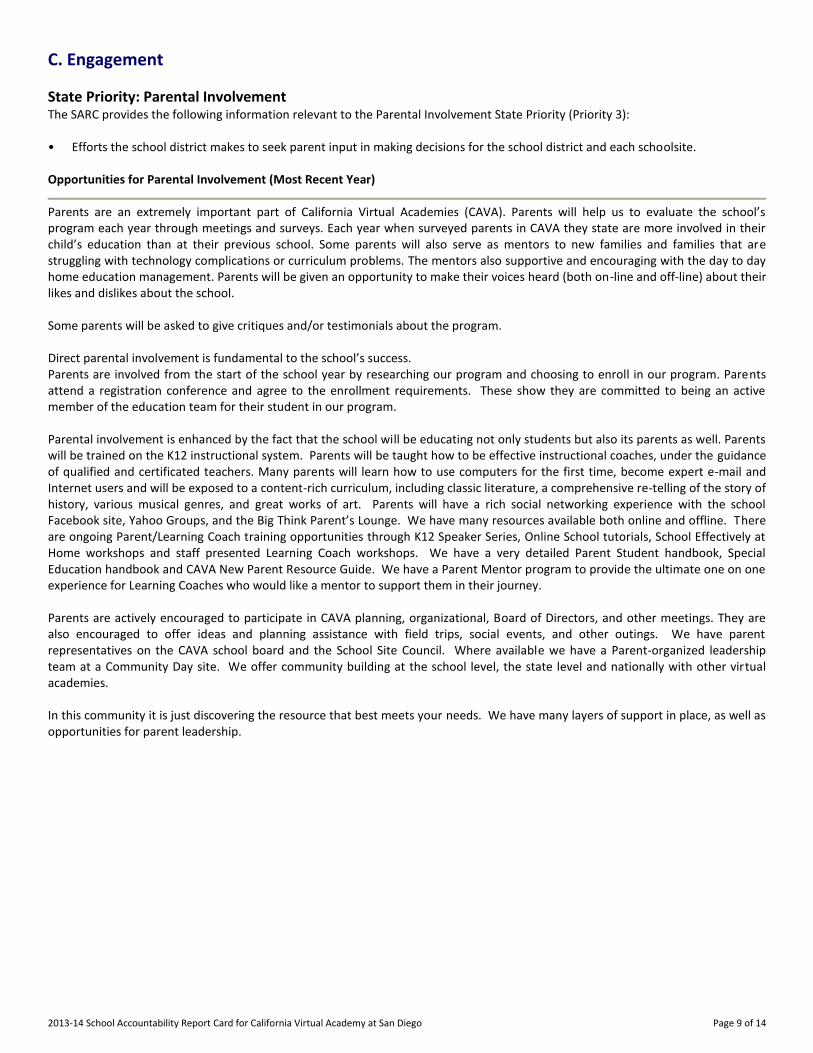
State Priority: Other Pupil Outcomes The SARC provides the following information relevant to the Other Pupil Outcomes State Priority (Priority 8): • Pupil outcomes in the subject areas of English, mathematics, and physical education. California High School Exit Examination Results for All Grade Ten Students (Three-Year Comparison)
Subject
Percent of Students Scoring at Proficient or Advanced
School District State
2011-12 2012-13 2013-14 2011-12 2012-13 2013-14 2011-12 2012-13 2013-14
English-Language Arts 61 62 53 60 62 53 56 57 56
Mathematics 43 49 42 41 48 42 58 60 62 Note: Percentages are not calculated when the number of students tested is ten or less, either because the number of students in this category is too small for statistical accuracy or to protect student privacy. California High School Exit Examination Grade Ten Results by Student Group (School Year 2013-14)
Group
English-Language Arts Mathematics
Not Proficient
Proficient Advanced Not
Proficient Proficient Advanced
All Students in the LEA 47 27 26 58 29 13
All Students at the School 47 27 26 58 29 13
Male------- 49 37 14 60 27 12
Female------- 45 21 34 57 29 13
Black or African American 50 25 25 76 19 5
American Indian or Alaska Native
Asian-------
Filipino-------
Hispanic or Latino 56 26 18 69 25 6
Native Hawaiian or Pacific Islander
White------- 44 27 29 52 32 17
Two or More Races
Socioeconomically Disadvantaged 53 22 25 64 29 7
English Learners-------
Students with Disabilities 96 4 84 13 3
Students Receiving Migrant Education Services Note: Percentages are not calculated when the number of students tested is ten or less, either because the number of students in this category is too small for statistical accuracy or to protect student privacy. California Physical Fitness Test Results (School Year 2013-14)
Grade Level
Percent of Students Meeting Fitness Standards
Four of Six Standards Five of Six Standards Six of Six Standards
-------5------- 22.6 26.3 21.1
-------7------- 17.0 21.5 24.3
-------9------- 22.6 24.8 16.1 Note: Percentages are not calculated when the number of students tested is ten or less, either because the number of students in this category is too small for statistical accuracy or to protect student privacy.
2013-14 School Accountability Report Card for California Virtual Academy at San Diego Page 9 of 14
C. Engagement
State Priority: Parental Involvement The SARC provides the following information relevant to the Parental Involvement State Priority (Priority 3): • Efforts the school district makes to seek parent input in making decisions for the school district and each schoolsite. Opportunities for Parental Involvement (Most Recent Year)
Parents are an extremely important part of California Virtual Academies (CAVA). Parents will help us to evaluate the school’s program each year through meetings and surveys. Each year when surveyed parents in CAVA they state are more involved in their child’s education than at their previous school. Some parents will also serve as mentors to new families and families that are struggling with technology complications or curriculum problems. The mentors also supportive and encouraging with the day to day home education management. Parents will be given an opportunity to make their voices heard (both on-line and off-line) about their likes and dislikes about the school. Some parents will be asked to give critiques and/or testimonials about the program. Direct parental involvement is fundamental to the school’s success. Parents are involved from the start of the school year by researching our program and choosing to enroll in our program. Parents attend a registration conference and agree to the enrollment requirements. These show they are committed to being an active member of the education team for their student in our program. Parental involvement is enhanced by the fact that the school will be educating not only students but also its parents as well. Parents will be trained on the K12 instructional system. Parents will be taught how to be effective instructional coaches, under the guidance of qualified and certificated teachers. Many parents will learn how to use computers for the first time, become expert e-mail and Internet users and will be exposed to a content-rich curriculum, including classic literature, a comprehensive re-telling of the story of history, various musical genres, and great works of art. Parents will have a rich social networking experience with the school Facebook site, Yahoo Groups, and the Big Think Parent’s Lounge. We have many resources available both online and offline. There are ongoing Parent/Learning Coach training opportunities through K12 Speaker Series, Online School tutorials, School Effectively at Home workshops and staff presented Learning Coach workshops. We have a very detailed Parent Student handbook, Special Education handbook and CAVA New Parent Resource Guide. We have a Parent Mentor program to provide the ultimate one on one experience for Learning Coaches who would like a mentor to support them in their journey. Parents are actively encouraged to participate in CAVA planning, organizational, Board of Directors, and other meetings. They are also encouraged to offer ideas and planning assistance with field trips, social events, and other outings. We have parent representatives on the CAVA school board and the School Site Council. Where available we have a Parent-organized leadership team at a Community Day site. We offer community building at the school level, the state level and nationally with other virtual academies. In this community it is just discovering the resource that best meets your needs. We have many layers of support in place, as well as opportunities for parent leadership.
2013-14 School Accountability Report Card for California Virtual Academy at San Diego Page 10 of 14
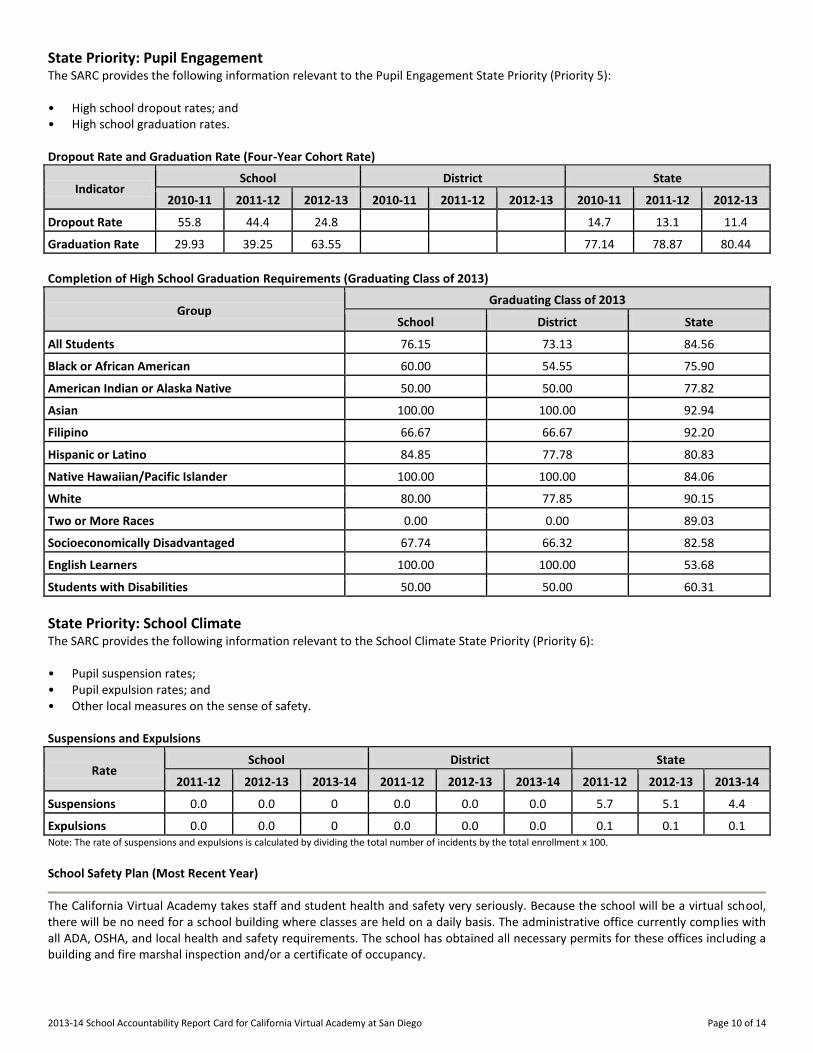
State Priority: Pupil Engagement The SARC provides the following information relevant to the Pupil Engagement State Priority (Priority 5): • High school dropout rates; and • High school graduation rates. Dropout Rate and Graduation Rate (Four-Year Cohort Rate)
Indicator School District State
2010-11 2011-12 2012-13 2010-11 2011-12 2012-13 2010-11 2011-12 2012-13
Dropout Rate 55.8 44.4 24.8 14.7 13.1 11.4
Graduation Rate 29.93 39.25 63.55 77.14 78.87 80.44
Completion of High School Graduation Requirements (Graduating Class of 2013)
Group Graduating Class of 2013
School District State
All Students 76.15 73.13 84.56
Black or African American 60.00 54.55 75.90
American Indian or Alaska Native 50.00 50.00 77.82
Asian------- 100.00 100.00 92.94
Filipino------- 66.67 66.67 92.20
Hispanic or Latino 84.85 77.78 80.83
Native Hawaiian/Pacific Islander 100.00 100.00 84.06
White------- 80.00 77.85 90.15
Two or More Races 0.00 0.00 89.03
Socioeconomically Disadvantaged 67.74 66.32 82.58
English Learners 100.00 100.00 53.68
Students with Disabilities 50.00 50.00 60.31
State Priority: School Climate The SARC provides the following information relevant to the School Climate State Priority (Priority 6): • Pupil suspension rates; • Pupil expulsion rates; and • Other local measures on the sense of safety. Suspensions and Expulsions
Rate School District State
2011-12 2012-13 2013-14 2011-12 2012-13 2013-14 2011-12 2012-13 2013-14
Suspensions------- 0.0 0.0 0 0.0 0.0 0.0 5.7 5.1 4.4
Expulsions------- 0.0 0.0 0 0.0 0.0 0.0 0.1 0.1 0.1 Note: The rate of suspensions and expulsions is calculated by dividing the total number of incidents by the total enrollment x 100. School Safety Plan (Most Recent Year)
The California Virtual Academy takes staff and student health and safety very seriously. Because the school will be a virtual school, there will be no need for a school building where classes are held on a daily basis. The administrative office currently complies with all ADA, OSHA, and local health and safety requirements. The school has obtained all necessary permits for these offices including a building and fire marshal inspection and/or a certificate of occupancy.

2013-14 School Accountability Report Card for California Virtual Academy at San Diego Page 11 of 14
Immunization forms and other pertinent medical records will be kept (confidentially) on file by the school administration. Parents are expected to ensure that their children obtain proper immunizations prior to matriculating pursuant to Chapter 1 (commencing with §120325) of Part 2 of Division 105 of the Health and Safety Code. The school may exempt students from enrolling who are not properly immunized pursuant to §48216 (a-c) of the Education Code. Those parents who are having difficulty obtaining immunizations for their children will be provided information on where to get immunized in their community. All pertinent and required health and safety documentation is collected at time of hire or enrollment as appropriate. Documentation is on file in the student’s records or employee records held in security at the Simi Valley, CA office. Copies of employee records and student records can be made available at the request of the School District. The school has drafted health and safety procedures that the school will follow to ensure the health and safety of pupils shall which include compliance with the criminal background check requirements described in Sections 44237 and 45125.1 of the Education Code.
D. Other SARC Information
The information in this section is required to be in the SARC but is not included in the state priorities for LCFF. Adequate Yearly Progress Overall and by Criteria (School Year 2013-14)
AYP Criteria School District
Made AYP Overall
Met Participation Rate: English-Language Arts
Met Participation Rate: Mathematics
Met Percent Proficient: English-Language Arts
Met Percent Proficient: Mathematics
Met Graduation Rate (if applicable)
Federal Intervention Program (School Year 2014-15)
Indicator School District
Program Improvement Status In PI
First Year of Program Improvement 2009-2010
Year in Program Improvement* Year 5
Number of Schools Currently in Program Improvement --- 1
Percent of Schools Currently in Program Improvement --- 100.0 Note: Cells with “---“ do not require data. * DW (determination waiver) indicates that the PI status of the school was carried over from the prior year in accordance with the flexibility granted through the federal waiver process.
2013-14 School Accountability Report Card for California Virtual Academy at San Diego Page 12 of 14
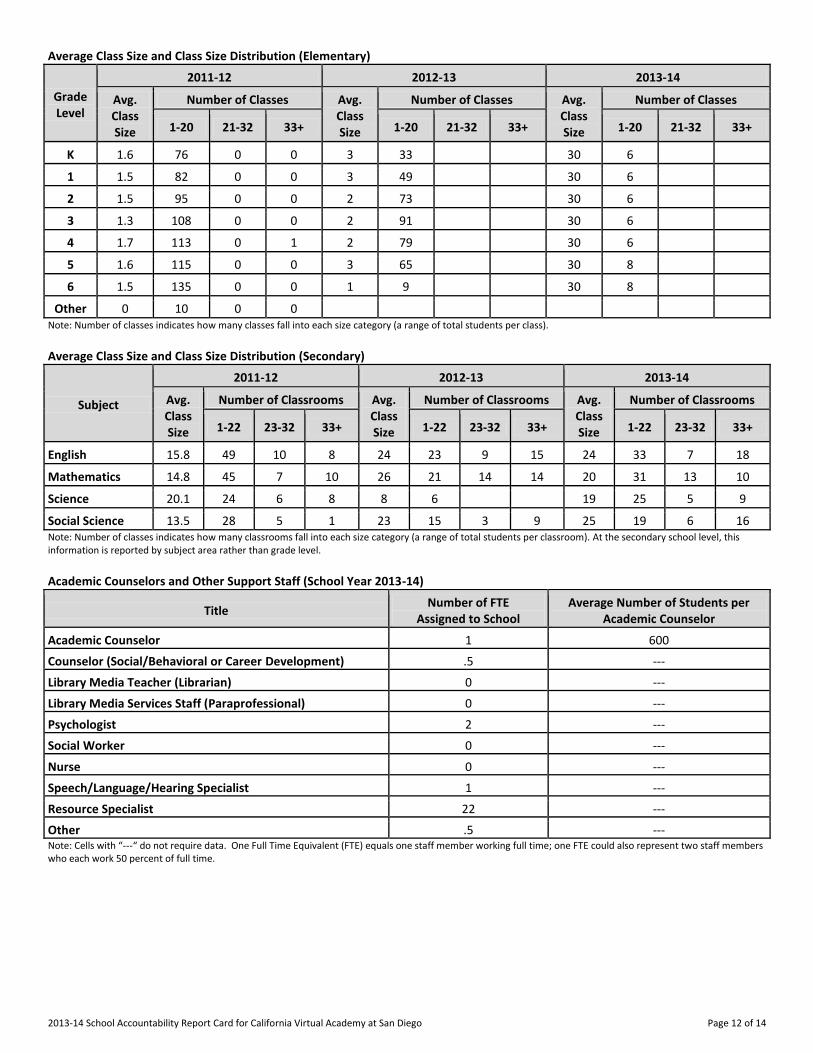
Average Class Size and Class Size Distribution (Elementary)
Grade Level
2011-12 2012-13 2013-14
Avg. Class Size
Number of Classes Avg. Class Size
Number of Classes Avg. Class Size
Number of Classes
1-20 21-32 33+ 1-20 21-32 33+ 1-20 21-32 33+
K ----------
1.6 76 0 0 3 33 30 6
1 ----------
1.5 82 0 0 3 49 30 6
2 ----------
1.5 95 0 0 2 73 30 6
3 ----------
1.3 108 0 0 2 91 30 6
4 ----------
1.7 113 0 1 2 79 30 6
5 ----------
1.6 115 0 0 3 65 30 8
6 ----------
1.5 135 0 0 1 9 30 8
Other ----------
0 10 0 0 Note: Number of classes indicates how many classes fall into each size category (a range of total students per class).
Average Class Size and Class Size Distribution (Secondary)
Subject
2011-12 2012-13 2013-14
Avg. Class Size
Number of Classrooms Avg. Class Size
Number of Classrooms Avg. Class Size
Number of Classrooms
1-22 23-32 33+ 1-22 23-32 33+ 1-22 23-32 33+
English------- ----------
15.8 49 10 8 24 23 9 15 24 33 7 18
Mathematics ----------
14.8 45 7 10 26 21 14 14 20 31 13 10
Science------- ----------
20.1 24 6 8 8 6 19 25 5 9
Social Science ----------
13.5 28 5 1 23 15 3 9 25 19 6 16 Note: Number of classes indicates how many classrooms fall into each size category (a range of total students per classroom). At the secondary school level, this information is reported by subject area rather than grade level. Academic Counselors and Other Support Staff (School Year 2013-14)
Title Number of FTE
Assigned to School Average Number of Students per
Academic Counselor
Academic Counselor------- 1 600
Counselor (Social/Behavioral or Career Development) .5 ---
Library Media Teacher (Librarian) 0 ---
Library Media Services Staff (Paraprofessional) 0 ---
Psychologist------- 2 ---
Social Worker------- 0 ---
Nurse------- 0 ---
Speech/Language/Hearing Specialist 1 ---
Resource Specialist------- 22 ---
Other------- .5 --- Note: Cells with “---“ do not require data. One Full Time Equivalent (FTE) equals one staff member working full time; one FTE could also represent two staff members who each work 50 percent of full time.
2013-14 School Accountability Report Card for California Virtual Academy at San Diego Page 13 of 14
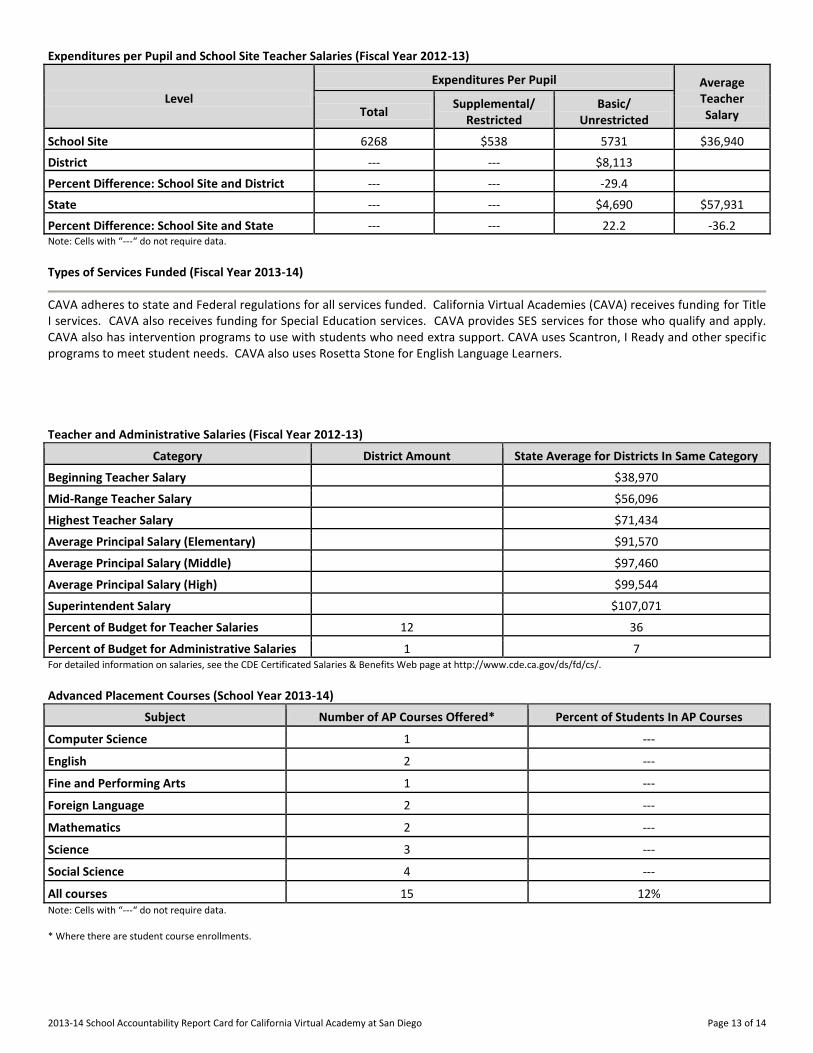
Expenditures per Pupil and School Site Teacher Salaries (Fiscal Year 2012-13)
Level
Expenditures Per Pupil Average Teacher Salary Total
Supplemental/ Restricted
Basic/ Unrestricted
School Site------- 6268 $538 5731 $36,940
District------- --- --- $8,113
Percent Difference: School Site and District --- --- -29.4
State------- --- --- $4,690 $57,931
Percent Difference: School Site and State --- --- 22.2 -36.2 Note: Cells with “---“ do not require data.
Types of Services Funded (Fiscal Year 2013-14)
CAVA adheres to state and Federal regulations for all services funded. California Virtual Academies (CAVA) receives funding for Title I services. CAVA also receives funding for Special Education services. CAVA provides SES services for those who qualify and apply. CAVA also has intervention programs to use with students who need extra support. CAVA uses Scantron, I Ready and other specific programs to meet student needs. CAVA also uses Rosetta Stone for English Language Learners. Teacher and Administrative Salaries (Fiscal Year 2012-13)
Category District Amount State Average for Districts In Same Category
Beginning Teacher Salary $38,970
Mid-Range Teacher Salary $56,096
Highest Teacher Salary $71,434
Average Principal Salary (Elementary) $91,570
Average Principal Salary (Middle) $97,460
Average Principal Salary (High) $99,544
Superintendent Salary $107,071
Percent of Budget for Teacher Salaries 12 36
Percent of Budget for Administrative Salaries 1 7 For detailed information on salaries, see the CDE Certificated Salaries & Benefits Web page at http://www.cde.ca.gov/ds/fd/cs/. Advanced Placement Courses (School Year 2013-14)
Subject Number of AP Courses Offered* Percent of Students In AP Courses
Computer Science 1 ---
English------- 2 ---
Fine and Performing Arts 1 ---
Foreign Language 2 ---
Mathematics 2 ---
Science------- 3 ---
Social Science 4 ---
All courses 15 12% Note: Cells with “---“ do not require data. * Where there are student course enrollments.

2013-14 School Accountability Report Card for California Virtual Academy at San Diego Page 14 of 14
Professional Development
California Virtual Academies (CAVA) professional development, for the K-12th grade staff, activities are designed by staff to be pertinent to their needs and enhance student learning. A variety of staff development opportunities are provided to increase interest and expertise, acquire new ideas and materials, and develop teaching, organization, and management skills. CAVA’s administration staff meets in person at various time of the year to discuss needs gathers information via surveys from both staff member as well as parents of the students to understand where staff development needs are.. The teachers are also surveyed on a monthly basis and at the end of the year for opportunities to discuss additional needed training. These specific training needs are delivered at the All Staff Professional development on a monthly basis. There are additional trainings available on a weekly basis to staff. Teachers are also welcome to research and attend workshops they feel will be beneficial to the enhancement of their profession. Lead teachers are provided as mentor teachers who provide expertise in areas of strength. These teachers have on-going training that support the general staff on a weekly basis. Teachers also meet in person in their regional teams quarterly to review and discuss issues and concerns that need to be immediately addressed and supported