19.11.2004Toni Räikkönen Data Collection in Statistics Finland now and in the Future.

Causes of death in 2015
The number of suicides decreased further in 2015According to Statistics Finland’s statistics on causes of death, altogether 731 suicides werecommitted in Finland in 2015, which is around 60 fewer than in the year before. Suicide mortalityhas decreased by 40 per cent in fifteen years. Suicides have decreased most among men aged35 to 44. However, men still committed clearly more suicides than women: of those who committedsuicide, three out of four were men. Most suicides in relative terms were committed by men aged45 to 54 and aged 75 or over.
Suicide mortality 1970 to 2015
The number of suicides has decreased clearly from the top figures of 1990, when there were over 1,500suicides in Finland. Since then, suicide mortality has decreased almost continuously according to statistics.In 2015, suicide mortality was 40 per cent lower than 15 years ago. However, nearly three times as manypersons died of suicides than in traffic accidents. In 2015, among one hundred thousand Finns, 13 committedsuicide (21 among men and six among women).
Most suicides in relative terms were committed by men aged 45 to 54 andaged 75 or overThe relative number of suicides has decreased since 2000 in all age groups. Among men, suicide mortalitydecreased most in the age group 35 to 44 and least in the age group 55 to 64. Differences between age
Quoting is encouraged provided Statistics Finland is acknowledged as the source.Helsinki 30.12.2016
Health 2016

groups in suicide mortality have narrowed. In 2015, most suicides per 100,000 inhabitants were committedby men aged 45 to 54 and aged 75 or over. Among women, suicide mortality was highest in the age group45 to 54 and lowest in the age group 15 to 24. The median average age of men who committed suicidewas 48 years and of women 51 years.
Men’s suicide mortality by age group in 2000 and 2015
In 2015, the share of suicides in all causes of death was only one per cent. However, suicides are a centralcause of death for young people. One in three persons aged 20 to 29 that died had committed suicide andone in six of those aged 35 to 44. The share of suicides in causes of death for young people is high becauseother mortality among young people is low. One in ten of all those having committed a suicide was ayoung person aged under 25 and one in five was aged over 65.
Despite the downward trend in suicide mortality, Finland is still an exception among Nordic and westerncountries. According to Eurostat’s statistics, the suicide mortality in Finland of the population aged under65 was around 1.5 times higher than the EU average in 2013. By contrast, for persons aged 65 and over,suicide mortality in Finland did not differ from the EU average.
One in five of women and one in ten of men died from dementiaIn 2015, altogether 52,300 persons died. The average age at death (median) was 85 years for women and76 years for men. In 2015, thirty-seven per cent of all deaths were caused by diseases of the circulatorysystem and 24 per cent by neoplasms. The most common disease of the circulatory system was ischaemicheart disease, which caused around one-fifth of all deaths. The most common types of cancer leading todeath for men were lung cancer and prostate cancer, and correspondingly for women breast cancer andlung cancer.
Altogether 8,600 persons died from dementia, including Alzheimer's disease, which represented 16 percent of all deaths. The number of deaths caused by dementia has grown rapidly in the past decade partlydue to the ageing of the population. One in five deaths among women and one in ten deaths among menwere caused by dementia. More than double the amount of women die of dementia than the amount ofmen, which is mainly because women live longer than men. There are no clear differences inage-standardised dementia mortality among genders (Figure 5).
Number of persons that died from alcohol-related causes decreased from2014
2

Close on 1,700 persons died of alcohol-related diseases and alcohol poisonings in 2015, which is nearly200 lower than in the previous year. The share of alcohol-related causes in all deaths was three per cent.The majority of those dying of alcohol, three out of four, were men. Persons who died from alcohol-relatedcauses are older than before. During the past ten years, mortality from alcohol among both men and womenaged 65 or over has grown while in younger age groups it has decreased. The median average age of bothmen and women in alcohol-related causes of death was 61 years.
In 2015, nearly 2,200 persons died of accidents, being four per cent of deaths, when alcohol poisoningsare included in alcohol-related deaths in the time series classification. The number of fatalities fromaccidents was 65 fewer than in the year before. The number of deaths from accidents has slowly and almostcontinuously fallen since 2004, when 2,600 persons died from accidents.
Causes of death 2015
FemalesMalesTotalFemalesMalesTotal54–group time series classification
%%%NumberNumberNumber
3737379 8949 47119 36527–30 Diseases of the circulatory system
2226245 8586 62312 48104–22 Neoplasms
2210165 8632 7178 58025 Dementia, Alzheimer's disease
3548071 3542 16142–49 Accidents
1533781 2881 66641 Alcohol related diseases and accidental poisoning by alcohol
3447821 1581 94031–35 Disease of the respiratory system
12117355873150 Suicides
1010102 6632 7255 378Other causes of death
10010010026 41825 88452 30201–54 Deaths total
3

Contents
1. Causes of death in 2015...........................................................................................................................................6
Fewer deaths of alcohol-related causes and suicides than in the year before........................................................6
Nearly one-half of working-age women died of neoplasms..................................................................................6
Persons aged over 65 died most from diseases of the circulatory system.............................................................7
2. Ischaemic heart disease still the cause of one in five deaths...................................................................................9
Persons dying of ischaemic disease are older than before.....................................................................................9
Women's lung cancer mortality has grown by one-fifth in ten years.....................................................................9
3. Deaths from dementia and Alzheimer's disease are increasing ............................................................................12
4. Alcohol mortality diminished further....................................................................................................................13
5. Stumbling the commonest reason for fatal accidents............................................................................................15
300 fatal accident victims were intoxicated.........................................................................................................16
Number of deaths from drugs have decreased.....................................................................................................16
6. Number of suicides fell clearly..............................................................................................................................18
7. Record low number of deaths of children during the first year of life..................................................................19
TablesTable 1. Main causes of death among working-age population (aged 15 to 64) in 2015............................................7
Table 2. Main causes of death among persons aged 65 or over in 2015.....................................................................8
Table 3. Drug-related mortality 2000 to 2015...........................................................................................................17
Table 4. Causes of death among children under the age of one 2000, 2005, 2010, 2014 and 2015..........................19
Appendix tables
Appendix table 1a. Deaths by underlying cause of death and by age in 2015, both sexes.......................................20
Appendix table 1b. Deaths by underlying cause of death and by age in 2015, males...............................................22
Appendix table 1c. Deaths by underlying cause of death and by age in 2015, females............................................24
Appendix table 2. Deaths from accidents by external cause and deaths from alcohol intoxication 2015.................25
Appendix table 3. Mortality during infant and perinatal period 1987–2015.............................................................26
Appendix table 4. Mean population 2015 by age and sex.........................................................................................27
Appendix table 5. Standard population used in calculating age-standardised figures (Eurostat 2012)....................27
FiguresFigure 1. Proportions of causes of death by age groups in 2015.................................................................................8
Figure 2. Age-standardised mortality from ischaemic heart disease in 1971 to 2015.................................................9
Figure 3. Age-standardised mortality from carcinoma of larynx, trachea and lung in 1971 to 2015........................10
Figure 4. Age-standardised prostate cancer mortality for men and breast cancer mortality for women 1971 to 2015.11
Figure 5. Age-standardised dementia mortality (incl. Alzheimer’s disease) 1971 to 2015.......................................12
Figure 6. Age-standardised mortality from alcohol–related diseases and accidental poisonings by alcohol and totalconsumption of aclohol in 1971 to 2015...................................................................................................................13
Figure 7. Age-standardised mortality from alcohol-related diseases and accidental poisonings by alcohol in 1971 to2015...........................................................................................................................................................................14
Figure 8. Accident mortality and separately deaths from accidental stumbles and falls in 1970 to 2015................15
4

Figure 9. Mortality from drowning accidents in 1998 to 2015.................................................................................16
Figure 10. Suicides mortality 1970 to 2015..............................................................................................................18
Figure 11. Mortality during infant and perinatal period in 1992–2015.....................................................................19
Appendix figures
Appendix figure 1. Age-standardised mortality from diseases of the circulatory system in 1971 to 2015...............28
Appendix figure 2. Age-standardised mortality from neoplasms in 1971 to 2015...................................................28
Quality Description:Causes of death 2015................................................................................................................29
5

1. Causes of death in 2015In 2015, in all 52,300 persons died, of which 25,900 were men and 26,400 women. The longer lifeexpectancy is visible in the age distribution of deaths. People are dying at an ever older age: two in threewere aged over 75 and more than one in three were over 85. Four hundred of dead persons were aged 100or over. The average age at death (median) was 85 years for women and 76 years for men while ten yearsago the average ages were 82 and 73 years.
Due to the age structure of persons who died, the typical causes of death of older age groups dominate thecauses of death distribution of the entire population. In 2015, thirty-seven per cent of deaths of Finns werecaused by diseases of the circulatory system and 24 per cent by neoplasms. The most common disease ofthe circulatory system was ischaemic heart disease, which caused around one-fifth of all deaths. The mostcommon types of cancer leading to death for menwere lung cancer and prostate cancer, and correspondinglyfor women breast cancer and lung cancer.
Altogether 8,600 persons died from dementia, including Alzheimer's disease, which represented 16 percent of all deaths. The number of deaths caused by dementia has grown rapidly in the past decade partlydue to the ageing of the population. One in five deaths among women and one in ten deaths among menwere caused by dementia. More than double the amount of women die of dementia than the amount ofmen, which is mainly because women live longer than men. There are no clear differences inage-standardised dementia mortality among genders (Figure 5).
Fewer deaths of alcohol-related causes and suicides than in the year beforeClose on 1,700 persons died of alcohol-related diseases and alcohol poisonings in 2015, which is nearly200 lower than in the previous year. The share of alcohol-related causes in all deaths was three per cent.The majority (three out of four) of those dying of alcohol were men. During the past ten years, mortalityfrom alcohol among both men and women aged 65 or over has grown while, correspondingly, in youngerage groups mortality from alcohol has decreased. Persons who die from alcohol-related reasons are gettingolder: the median average age at death was 61 years for both men and women.
In 2015, suicides were committed by 731 persons, which is around 60 fewer than in the year before. Thenumber of suicides was at its highest in 1990, when there were over 1,500 suicides in Finland. Since then,suicide mortality has decreased almost continuously (Figure 10). In 2015, suicide mortality was nearly 30per cent lower than ten years ago. The median average age of men who committed suicide was 48 yearsand of women 51 years. One in ten of all those having committed a suicide was aged under 25 and one infive was aged over 65.
In 2015, nearly 2,200 persons died of accidents, being four per cent of deaths, when alcohol poisoningsare included in alcohol-related deaths in the time series classification. The number of fatalities fromaccidents was 65 fewer than in the year before. The number of deaths from accidents has slowly and almostcontinuously fallen since 2004, when 2,600 persons died from accidents.
Nearly one-half of working-age women died of neoplasmsIn Finland, ever fewer working-age persons are dying annually (aged 15 to 64). In 2015, altogether 8,200of them died, which was 16 per cent of all deaths. The number of deaths among working-age personsdeclined by nearly 500 persons. The age-standardised mortality of working-age people has diminished inten years by around one-quarter.
One in five of the men that died in 2015 were of working-age and one in ten of women. The mortality ofworking-age men is still more than double compared to women, even though the mortality of men hasdiminished slightly faster than that of women, which has decreased the difference in mortality betweengenders.
Working-age people died most from neoplasms and from diseases of the circulatory system. More thanone-half of deceased working-age people died of these two causes. As many as 45 per cent of workingage women died from neoplasms. Diseases of the circulatory system have decreased in relative terms for
6

women: their share of deaths was only 15 per cent in 2015, while twenty years ago the share was nearlyone-quarter. For working-age men the importance of diseases of the circulatory system in causes of deathis still higher than that of neoplasms. The most common type of cancer resulting in death among womenwas breast cancer, which caused the death of nearly every tenth working-age woman. For working-agemen, the most common cancer resulting in death was lung cancer.
More than 1,100 persons of working age, or 14 per cent, died of alcohol-related causes 3.5 times moreworking-age men died of alcohol-related causes than working-age women. One in seven of working agemen and one in ten of working age women died from alcohol-related causes. Alcohol mortality amongworking-age men and women has decreased clearly from the peak level of 2007 and was in 2015 at thesame level as in the 1990s.
Table 1. Main causes of death among working-age population (aged 15 to 64) in 2015
FemalesMalesTotalFemalesMalesTotal54-group time series classification
%%%NumberNumberNumber
4524311 1531 3602 51304–22 Neoplasms
1526233821 4741 85627–30 Diseases of the circulatory system
2226112919031–35 Disease of the respiratory system
1015142468721 11841 Alcohol related diseases and accidental poisoning by alcohol
611914460675042–49 Accidents
58712944157050 Suicides
1713154407521 192Other causes of death
1001001002 5555 6348 18901–54 Deaths total
Persons aged over 65 died most from diseases of the circulatory systemIn 2015, ninety per cent of women who died and 78 per cent of men had turned 65. The causes of deathstructure for older age groups differs from that of the working-age population: the relative share ofneoplasms, suicides, accidents and alcohol-related causes of death is smaller than among working-agepeople.
Persons aged over 65 died most from diseases of the circulatory system that caused 40 per cent of deaths.The share of diseases of the circulatory system in causes of death grows with age: For those aged 65 to74 they killed one-third and for those aged over 95 as many as one-half (Figure 1). Correspondingly, theshare of neoplasms in causes of death diminishes after the age of 70. When the share of neoplasms amongdeaths of persons aged 65 to 69 was 40 per cent, only six per cent of those who died at the age of over 95died of neoplasms.
The importance of dementia, including Alzheimer’s disease as a cause of death has grown strongly. In2015, dementia was the third most common cause of death category for elderly people after diseases ofthe circulatory system and neoplasms. Nearly one-fifth of persons who had turned 65 and one-third ofthose aged over 95 died of dementia.
In 2015, one in five of the persons who committed a suicide were aged 65 or over. The share of suicidesin causes of death for elderly people is, however, very low, under one per cent. In an internationalcomparison, the suicide mortality of Finns aged over 65 did not differ from the average for EU countriesin 2013. Additional information on the causes of death of persons aged 65 or over can be found in Appendixtables 1a-c and database tables.
7
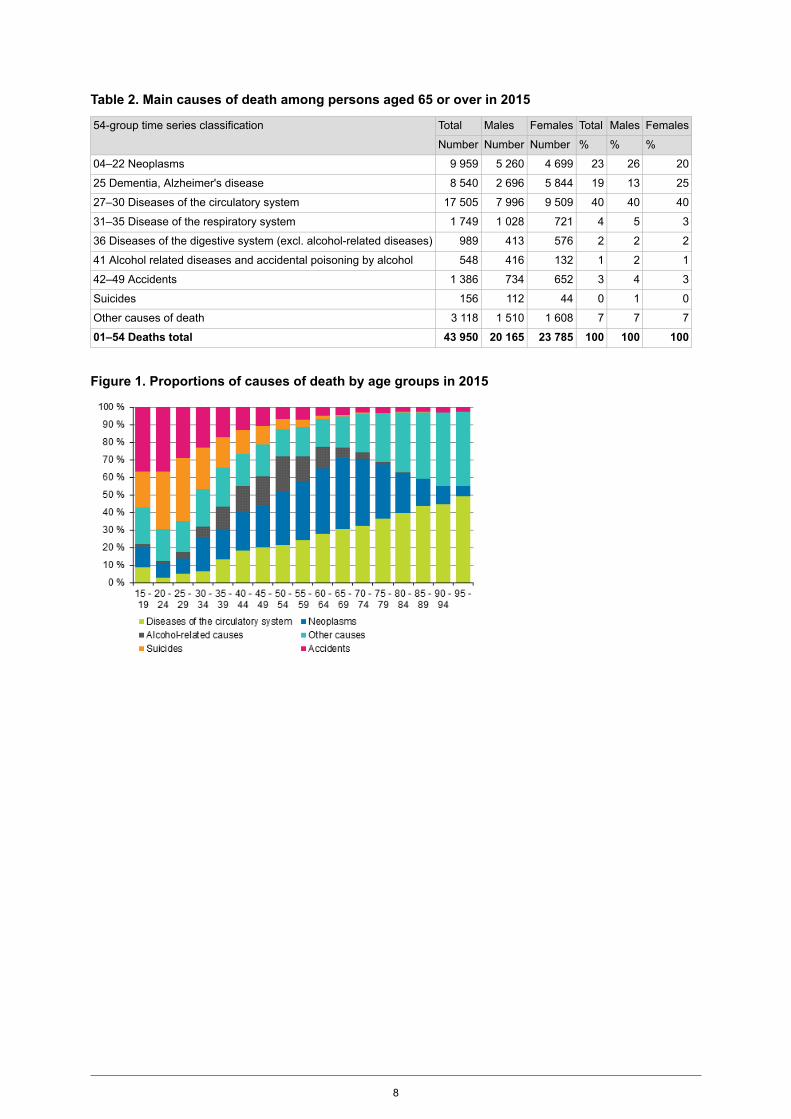
Table 2. Main causes of death among persons aged 65 or over in 2015
FemalesMalesTotalFemalesMalesTotal54-group time series classification
%%%NumberNumberNumber
2026234 6995 2609 95904–22 Neoplasms
2513195 8442 6968 54025 Dementia, Alzheimer's disease
4040409 5097 99617 50527–30 Diseases of the circulatory system
3547211 0281 74931–35 Disease of the respiratory system
22257641398936 Diseases of the digestive system (excl. alcohol-related diseases)
12113241654841 Alcohol related diseases and accidental poisoning by alcohol
3436527341 38642–49 Accidents
01044112156Suicides
7771 6081 5103 118Other causes of death
10010010023 78520 16543 95001–54 Deaths total
Figure 1. Proportions of causes of death by age groups in 2015
8

2. Ischaemic heart disease still the cause of one in fivedeathsOf the main cause of death categories, most Finns died of diseases of the circulatory system in 2015. Thegroup’s importance as a cause of death has decreased, however, over the past twenty years from 44 to 37per cent. Simultaneously, men's and women's age-standardised mortality from diseases of the circulatorysystem has declined by over 40 per cent (Appendix figure 1).
Among diseases of the circulatory system, ischaemic heart disease is still one of the most common causesof death for Finns, even though mortality from ischaemic heart disease has decreased clearly in Finland.Ischaemic heart disease still caused every fifth death and over 10,000 persons died of it in 2015.
Persons dying of ischaemic disease are older than beforePersons dying of this disease are older than before. In 1971, nearly four out of ten persons that died ofischaemic heart disease were of working-age, while in 2015 only one in ten was of working-age. Themedian average age for those dying of ischaemic heart disease in 1971 was 65 years for men and 73 yearsfor women, while the corresponding figures in 2015 were 79 and 87 years.
Figure 2 shows age-standardised ischaemic heart disease mortality. In age standardisation, the effect ofthe age structure of the population and its changes are eliminated. Then it is seen in which level mortalityfrom ischaemic heart disease would be if the age structure of the population remained unchanged duringthe whole reference period. The new standard population of Eurostat is used as the standard populationin age-standardisation. When the ageing of the population is eliminated from the figures by agestandardisation, it can be seen that ischaemic heart disease mortality has fallen evenly over the last 40years. In 2015, ischaemic heart disease mortality decreased further for both men and women.
Figure 2. Age-standardised mortality from ischaemic heart diseasein 1971 to 2015
Women's lung cancer mortality has grown by one-fifth in ten yearsOf the main cause of death categories, second most Finns died of neoplasms. In 2015, they caused nearlyone in four deaths. Persons who died of neoplasms are on average 10 years younger than those who diedof diseases of the circulatory system. Over the past ten years, age-standardised neoplasm mortality hasdecreased by around ten per cent for men and slightly less for women, that is, six per cent (Appendixfigure 2). In 2015, neoplasm mortality increased slightly for both men and women from the year before.The most common type of cancer resulting in death was still lung cancer for men and breast cancer forwomen.
9

In 2015, a total of 1,500 men and 800 women died from carcinoma of the larynx, carcinoma of the tracheitisand lung cancer. The difference between men and women in lung cancer mortality has narrowed since the1980s as lung cancer mortality among men has decreased and simultaneously it has grown slowly amongwomen. Over the past ten years, women’s lung cancer mortality has grown by more than 20 per cent. In2015, men’s lung cancer mortality, however, increased slightly and women's decreased from the yearbefore (Figure 3).
Figure 3. Age-standardised mortality from carcinoma of larynx,trachea and lung in 1971 to 2015
The most common type of cancer causing death among women is breast cancer. In 2015 the number ofdeaths from breast cancer was 816, that is, 29 deaths per 100,000 women. The average age of persons thatdied of breast cancer was 72 and only one in ten of the persons that died were aged under 55. Nearly asmany working-age women died of breast cancer (237 women) as died of alcohol-related causes (246women). The number of deaths from breast cancer was nearly the same in 2015 as ten years earlier butage-standardised breast cancer mortality has decreased by 16 per cent (Figure 4).
After lung cancer, prostate cancer is the second most common type of cancer resulting in death amongmen. In 2015, altogether 898 men died from prostate cancer, which was slightly more than women dyingfrom breast cancer. Men’s prostate cancer mortality is almost on level with women's breast cancer mortality,that is, 33 deaths per 100,000 men.
Above all, prostate cancer is a common cause of death for aged men: more than nine out of ten of thedeceased were over 65 and the average age of the deceased was 80.Men's age-standardised prostate cancermortality has decreased clearly in the 2000s.
10

Figure 4. Age-standardised prostate cancer mortality for men andbreast cancer mortality for women 1971 to 2015
11

3. Deaths from dementia and Alzheimer's disease areincreasingIn 2015, nearly 8,600 Finns died of dementia and Alzheimer's disease, which was over 400 persons morethan in 2014. The number of deaths from dementia has more than doubled over the past ten years. Thegrowth is also visible in the age-standardised figures (Figure 5), where the effects of the population structureare taken into consideration. The growth is in part the result of more specific diagnostics and changes inthe definitions of causes of death (WHO guidelines). From 2005, causes of death statistics have adoptedan international guideline that limits the use of pneumonia as a primary cause of death in connection withseveral chronic diseases. If a person is, in addition to pneumonia, suffering from, for example, dementia,dementia is selected as the primary cause of death.
Dementia mortality has developed in a similar fashion for both men and women. Amajority, or two-thirds,of those who die from this disease group are, however, women. The higher share of deaths from dementiaamong women than men is caused by women living longer than men. The average age at death of personsthat died from dementia was 85 years for men and 89 years for women. Dementia mortality of Finnishmen and women was the highest in EU countries relative to the population in 2013.
Figure 5. Age-standardised dementia mortality (incl. Alzheimer’sdisease) 1971 to 2015
12

4. Alcohol mortality diminished furtherDeaths related to the use of alcohol grew relatively evenly in Finland from the 1980s until 2003, afterwhich deaths from alcohol-related causes increased by around one-quarter within a few years. The slowdecrease in the number of deaths from alcohol-related causes that started in 2008 continued in 2015.Alcohol mortality in 2015 was almost on level with 2003. In 2015, close on 1,700 persons died fromalcohol-related diseases and alcohol poisonings. Of them, around 1,300 were men and 400 women.
Themost significant reason for the growth in alcoholmortality in the early 2000s was increased consumptionof alcohol. Since 2007, total alcohol consumption has decreased, however. In 2015, converted to 100%alcohol, total consumption was 9.0 litres per capita (National Institute for Health and Welfare 2016).Changes in alcohol-related mortality has followed fairly regularly the graph for total consumption ofalcoholic beverages even though alcohol-related deaths usually call for long-term detrimental use of alcoholthat lasts for several years. The changes in the number of deaths from alcohol-related causes between 2009and 2015 were mainly caused by changes in men's deaths from alcohol-related causes.
Several different alcohol-related diseases used as primary causes of death and accidental alcohol poisoningshave been collected into alcohol-related causes of death. Diseases related to long-term alcohol use, suchas liver and heart diseases, cause a majority of deaths from alcohol-related causes. The share of alcoholpoisonings in deaths from alcohol-related causes has decreased from 27 to 16 per cent over a ten-yearperiod. In 2015, altogether 263 persons died from alcohol poisonings, three-quarters of whom were men.
Fewer people die of alcohol-related causes than from neoplasms or diseases of the circulatory system.However, more working-age persons still die of alcohol-related causes than of individual neoplasm typesor ischaemic heart diseases. In addition, alcohol is also a contributing factor to death in many fatal accidents(not the primary cause of death). The share of intoxication in accidents will be discussed in the followingsection.
Figure 6. Age-standardised mortality from alcohol–related diseasesand accidental poisonings by alcohol and total consumption ofaclohol in 1971 to 2015
Men die from alcohol-related causes considerably more often than women (Figure 7). Male mortality hasalso followed more closely changes in total consumption of alcohol. Women are lagging behind in alcoholstatistics but women's mortality from alcohol-related causes has also risen over several decades followingmen's mortality from alcohol-related causes. In 2015, alcohol mortality of both men and women wasone-fifth lower than in 2005.
Persons who died of alcohol-related causes are older than before. During the past ten years, mortality fromalcohol among both men and women aged 65 or over has grown while, correspondingly, in younger agegroups mortality from alcohol has decreased. Two-thirds of persons who died of alcohol-related causesare still of working age but alcohol mortality of persons aged over 65 has grown from 17 to 33 per cent
13

over the past ten years. In 2015, the average age of men and women dying of alcohol-related causes wasexactly 61.
In 2015, the share of alcohol-related causes in all deaths was only three per cent. Alcohol-related causesare, however, more common causes of death for middle-aged people than for retirement-age people. Ofmen that died aged 50 to 54 one in four died of alcohol-related causes and among those aged 65 to 69fewer than one in ten.
Figure 7. Age-standardised mortality from alcohol-related diseasesand accidental poisonings by alcohol in 1971 to 2015
14
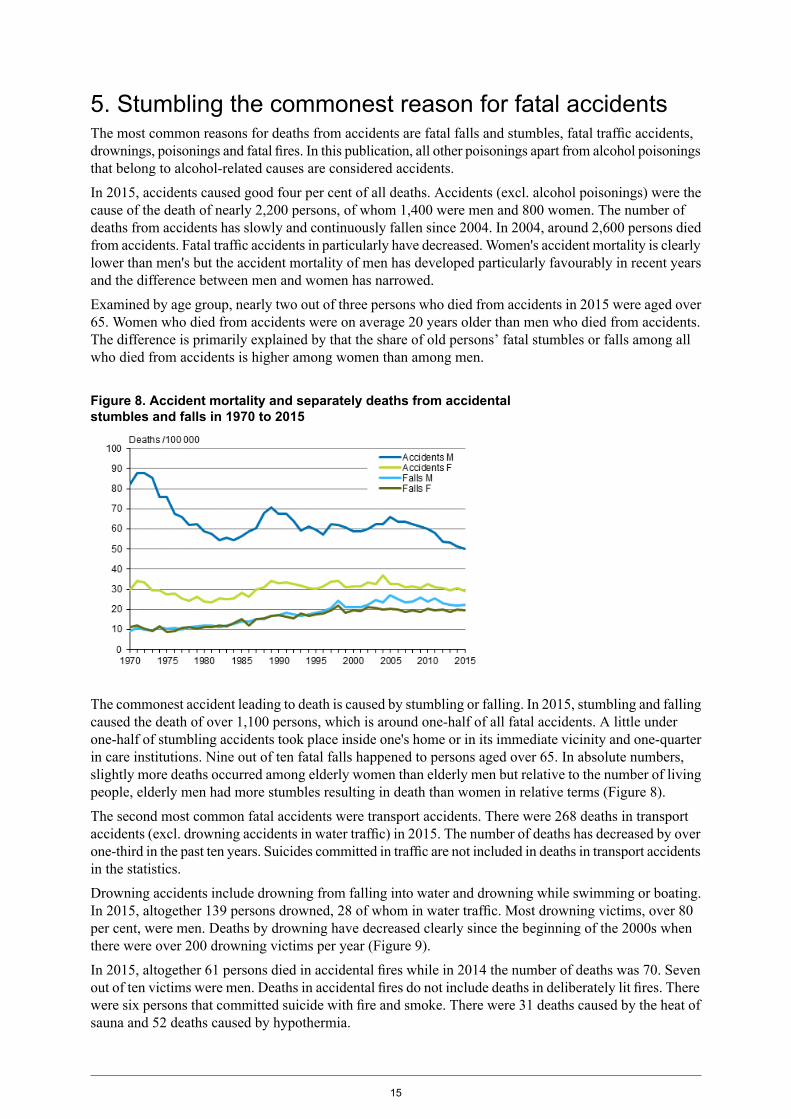
5. Stumbling the commonest reason for fatal accidentsThe most common reasons for deaths from accidents are fatal falls and stumbles, fatal traffic accidents,drownings, poisonings and fatal fires. In this publication, all other poisonings apart from alcohol poisoningsthat belong to alcohol-related causes are considered accidents.
In 2015, accidents caused good four per cent of all deaths. Accidents (excl. alcohol poisonings) were thecause of the death of nearly 2,200 persons, of whom 1,400 were men and 800 women. The number ofdeaths from accidents has slowly and continuously fallen since 2004. In 2004, around 2,600 persons diedfrom accidents. Fatal traffic accidents in particularly have decreased.Women's accident mortality is clearlylower than men's but the accident mortality of men has developed particularly favourably in recent yearsand the difference between men and women has narrowed.
Examined by age group, nearly two out of three persons who died from accidents in 2015 were aged over65. Women who died from accidents were on average 20 years older than men who died from accidents.The difference is primarily explained by that the share of old persons’ fatal stumbles or falls among allwho died from accidents is higher among women than among men.
Figure 8. Accident mortality and separately deaths from accidentalstumbles and falls in 1970 to 2015
The commonest accident leading to death is caused by stumbling or falling. In 2015, stumbling and fallingcaused the death of over 1,100 persons, which is around one-half of all fatal accidents. A little underone-half of stumbling accidents took place inside one's home or in its immediate vicinity and one-quarterin care institutions. Nine out of ten fatal falls happened to persons aged over 65. In absolute numbers,slightly more deaths occurred among elderly women than elderly men but relative to the number of livingpeople, elderly men had more stumbles resulting in death than women in relative terms (Figure 8).
The second most common fatal accidents were transport accidents. There were 268 deaths in transportaccidents (excl. drowning accidents in water traffic) in 2015. The number of deaths has decreased by overone-third in the past ten years. Suicides committed in traffic are not included in deaths in transport accidentsin the statistics.
Drowning accidents include drowning from falling into water and drowning while swimming or boating.In 2015, altogether 139 persons drowned, 28 of whom in water traffic. Most drowning victims, over 80per cent, were men. Deaths by drowning have decreased clearly since the beginning of the 2000s whenthere were over 200 drowning victims per year (Figure 9).
In 2015, altogether 61 persons died in accidental fires while in 2014 the number of deaths was 70. Sevenout of ten victims were men. Deaths in accidental fires do not include deaths in deliberately lit fires. Therewere six persons that committed suicide with fire and smoke. There were 31 deaths caused by the heat ofsauna and 52 deaths caused by hypothermia.
15

Figure 9. Mortality from drowning accidents in 1998 to 2015
300 fatal accident victims were intoxicatedIn 2015, alcohol was a contributing factor in one in six fatal accidents, on average. Sixteen per cent ofthose who died in fatal accidents were intoxicated, i.e. 300 persons (Appendix table 2). Ten years ago, thecorresponding share was 25 per cent of fatal accidents. In the statistics on causes of death, alcoholintoxication is determined from the death certificate where the doctor signing the certificate judged thatalcohol had contributed to the death. The figures exclude alcohol and drug poisonings where alcohol ordrugs have not directly caused the death.
In 2015, intoxication was most common in accidental sauna and drowning deaths, where around one-halfof victims were under the influence of alcohol. Nearly one-half of the persons that died in fires were alsointoxicated. In traffic deaths, one in five were intoxicated at the time of death. By contrast, in stumblingaccidents, of which a majority occurred among persons aged over 70, only one in ten were under theinfluence of alcohol.
Number of deaths from drugs have decreasedThe total number of fatal poisonings (excl. alcohol poisonings) has fallen by 23 per cent from 2010. In2015, their number was 243 cases, which was the same as in the year before. The average age of thosedying of fatal poisonings was 40 years for men and 58 years for women.
In 2015, the number of deaths caused by drugs in Finland was 166, which is 10 fewer than in the previousyear. When calculating drug-related deaths, Statistics Finland uses a classification (Selection B) compiledby the European Monitoring Centre for Drugs and Drug Addiction (EMCDDA). The Monitoring Centrepublishes statistics and reports on its Internet site: www.emcdda.europa.eu.
According to the EMCDDA, cases where the primary cause of death is drug psychoses, accidental poisoning,self-inflicted poisoning, and poisoning with undetermined intent are calculated as drug-related deaths.Deaths caused by drug psychoses are usually a result of drug addiction and long-term drug use. Accidentaldrug poisonings are cases where the death occurs shortly after the consumption of the substance. Theycan often also be referred to as overdoses. In 2015, there were 119 accidental overdoses. The number issmaller than in previous years (2014: 122 and 2013:143). Self-inflicted poisonings with drugs are suicides(primary cause of death). In 2015, twenty-four suicides were committed with drugs. In poisonings withundetermined intent, the intent remains unclear.
16

Table 3. Drug-related mortality 2000 to 2015
FemalesMalesTotalFemalesMalesTotal
Per 100 000 mean populationPer 100 000 meanpopulation
Per 100 000 meanpopulation
NumberNumberNumber
0,94,32,6251091342000
1,23,12,132781102001
1,12,71,92869972002
0,93,01,925761012003
1,53,82,639961352004
1,23,72,431951262005
1,24,22,6311071382006
1,04,52,7271161432007
1,84,63,2491201692008
1,75,03,3451301752009
1,44,42,9391171562010
1,55,93,7411561972011
1,96,13,9521612132012
1,95,53,7531482012013
1,35,23,2351411762014
1,44,73,0391271662015
The drugs referred to in the EMCDDA's classification are mainly opioids. In addition to opioids, drugsalso refer to cannabis and cannabinoids, other hallucinogens, and stimulants suitable for abuse, such asamphetamine and its derivatives. In 2015, four out of five drug-related deaths were associated withoverdoses of opioids.
The numbers of deaths have been calculated in accordance with the WHO's recommendation based onthe substance judged as most influential. In many cases, the death is the result of multiple substancepoisoning where the person has also digested other substances like alcohol and/or psychopharmacons.
Considerably fewer women than men die from drugs. In 2015, women's share of all deaths from drugswas one-quarter. Sixteen per cent of the persons that died accidentally from drugs were women but insuicides committed with drugs, the share of women was clearly higher, over one-half. Most drug-relateddeaths in absolute numbers occurred among persons aged 30 to 34.
17

6. Number of suicides fell clearlyIn 2015, suicides were committed by 731 persons, which was nearly 60 fewer than in the year before. Thenumber of suicides was at its highest in 1990, when there were over 1,500 suicides in Finland. Since then,suicide mortality has decreased. Suicide mortality has decreased by 40 per cent in the past fifteen years.
Men's suicide mortality is much higher than women's. In 2015, suicide mortality or the number of suicidesa year per 100,000 population was 13.3, being 20.7 for men and 6.2 for women. Three out of four of thepersons who committed a suicide were men.
Suicides are a central cause of death for young people. One-third of young people aged under 25 that diedhad committed suicides. The share of suicides in all causes of death is high for young people because othermortality among young people is low. The share of persons aged under 25 among all those having committeda suicide was, however, low: only one in ten suicide victims were aged under 25.
The relative number of suicides has decreased in all age groups over the past 15 years. Young people'ssuicide mortality in Finland has been high by European comparison. According to Eurostat's statistics for2013, suicide mortality among young people was higher than in Finland only in Lithuania. By contrast,for persons aged 65 and over, suicide mortality in Finland did not differ from the EU average. Of thosewho committed suicides, one in five were aged over 65.
Figure 10. Suicides mortality 1970 to 2015
18

7. Record low number of deaths of children during the firstyear of lifeIn 2015, altogether 96 children died under the age of one, which was 29 fewer than in the year before.Infant mortality was 1.7 per 1,000 live-born children. The main causes of death among children under theage of one were perinatal reasons and inborn malformations (Table 3). Infectious diseases, accidents andviolence are rare causes of death for infants.
In 2015, there were 172 stillbirths, which was slightly higher than in the year before (2014: 163 children).Perinatal mortality (deaths during the first week and stillborn) was 4.0 per thousand births. More thanone-half of children dying during their first year of life die during their first week of life (in the earlyneonatal period) and 70 per cent during the first four weeks of life (in the neonatal period). The maincauses of death after the neonatal period are inborn malformations and cot deaths. In 2015, six childrensuffered cot death, whereas in 2014 the corresponding number was 14. Cot deaths mostly occur to childrenover the age of one month.
The mortality of children aged 1 to 14 has nearly halved over the past twenty years. In 2015, the numberof deaths among children was 67, which was 20 fewer than in the previous year. This corresponds withapproximately 8 deaths per 100,000 children. The most common causes of death among children werecancers and traffic accidents.
Over the past ten years, women dying from reasons related to pregnancy or childbirth has been three peryear, on average. The year 2011 was the first year in the history of the statistics on causes of death whenthere were no maternal deaths. In 2015, there were two maternal deaths, which meant that maternalmortality was 3.6 deaths per 100,000 live-born children.
More information about mortality during infant and perinatal period can be found in Appendix table 3.
Figure 11. Mortality during infant and perinatal period in 1992–2015
Table 4. Causes of death among children under the age of one 2000, 2005, 2010, 2014 and 2015
20152014201020052000
96125138179205Total deaths
4946587784Certain conditions originating in the perinatal period (P00–P96)
3042406178Congenital malformations and chromosomal abnormalities (Q00–Q99)
614171918Sudden infant death syndrome (R95)
13554Diseases of circulatory system and respiratory system (J00–J99, I00–I99)
26365Endocrine, nutritional and metabolic diseases (E00–E90)
81011913Other diseases and unknown
04423Accidents and assault (V01–Y89)
19

Appendix tables
Appendix table 1a. Deaths by underlying cause of death and by age in 2015, both sexes
65-15-640-14Ages totalUnderlying cause of death (54-group classification)
43 9508 18916352 30201-54 TOTAL DEATHS (A00-Y89)
42 1116 67013148 91201-41 DISEASES AND ACCIDENTAL POISONING BY ALCOHOL (A00-R99, X45)
21740125801-03 Certain infectious and parasitic diseases (A00-B99, J65)
33003301 Tuberculosis (A15-A19, B90, J65)
000002 Human immunodeficiency virus (HIV) disease (B20-B24)
18440122503 Other infectious and parasitic diseases (A00-A09, A20-B19, B25-B89, B91-B99)
9 9592 513912 48104-22 Neoplasms (C00-D48)
9 6702 489912 16804-21 Malignant neoplasms (C00-C97)
17755023204 Malignant neoplasms of lip, oral cavity and pharynx (C00-C14)
16370023305 Malignant neoplasm of oesophagus (C15)
317124044106 Malignant neoplasm of stomach (C16)
691130082107 Malignant neoplasm of colon (C18, C19)
30387039008 Malignant neoplasm of rectum, anus and anal canal (C20-C21)
42980050909 Primary malignant neoplasm of liver and intrahepatic bile ducts (C22)
90123601 13710 Malignant neoplasm of pancreas (C25)
1 81046502 27511 Malignant neoplasm of larynx, trachea, bronchus and lung (C32-C34)
17356022912 Malignant melanoma of skin (C43)
582241082313 Malignant neoplasm of breast (C50)
352806314 Malignant neoplasm of cervix uteri (C53)
16232019415 Malignant neoplasm of uterus (C54-C55)
24688033416 Malignant neoplasm of ovary (C56)
83662089817 Malignant neoplasm of prostate (C61)
29770036718 Malignant neoplasm of kidney (C64)
22239026119 Malignant neoplasm of bladder (C67)
96420011 16520 Malignant neoplasm of lymphoid, haematopoietic and related tissue (C81-C96)
1 36242681 79621 Other malignant neoplasms
28924031322 Other neoplasms (D00-D48)
470162563723-24 Endocrine, nutritional and metabolic diseases (E00-E90)
361122048323 Diabetes mellitus (E10-E14)
10940515424 Other endocrine, nutritional and metabolic diseases (E00-E09, E15-E90)
8 5404008 58025 Dementia, Alzheimers disease (F01, F03, G30, R54)
1 365246131 62426 Other diseases of the nervous system and sense organs excl. alcohol-related
17 5051 856419 36527-30 Diseases of the circulatory system excl. alcohol-related (I00-I425, I427-I99)
9 274935010 20927 Ischaemic heart diseases (I20-I25)
1 45730921 76828 Other heart diseases excl. rheumatic and alcohol-related (I30-I425, I427-I52)
3 97532314 29929 Cerebrovascular diseases (I60-I69)
2 79928913 08930 Other diseases of the circulatory system (I00-I15, I26-I28, I70-I99)
1 74919011 94031-35 Diseases of the respiratory system (J00-J64, J66-J99)
1267113431 Influenza (J09-J11)
13720015732 Pneumonia (J12-J18, J849)
1 10113001 23133 Bronchitis and emphysema (J40-J44, J47)
69907834 Asthma (J45-J46)
31624034035 Other diseases of the respiratory system (J00-J06, J20-J39, J60-J64, J66-J848, J85-J99)
98918811 17836 Diseases of the digestive system excl. alcohol-related diseases
26714128237 Diseases of the genitourinary system (N00-N99)
20

65-15-640-14Ages totalUnderlying cause of death (54-group classification)
38893516238 Congenital malformations (Q00-Q99)
3941125856439 Other diseases excl. alcohol-related
70102317540 Ill-defined and unknown causes of mortality (R96-R99)
5481 11801 66641 Alcohol-related diseases and accidental poisoning by alcohol
1 5681 435313 03442-53 ACCIDENTS AND VIOLENCE excl. accidental poisoning by alcohol (V01-X44,X46-Y89)
1 386750252 16142-49 Accidents excl. accidental poisoning by alcohol (V01-X44, X46-X59, Y10-Y15,Y85-Y86)
771431223242 Land traffic accidents
111933343 Other land transport accidents
141513044 Water transport accidents (V90-V94)
010145 Others and unspecified transport accidents (V95-V99)
1 00214011 14346 Accidental falls (W00-W19)
4362611147 Accidental drownings (W65-W74)
38205024348 Accidental poisonings excl. accidental poisoning by alcohol (X40-X44, X46-X49, Y10-Y15)
201165236849 Other accidents and sequelae of accidents
156570573150 Suicides (X60-X84, Y87.0)
66317051 Assault (X85-Y09, Y87.1)
164906552 Event of undetermined intent (Y16-Y34, Y87.2)
430753 Other external causes and sequelae of other external causes (Y35-Y84, Y88-Y89)
27184135654 NO DEATH CERTIFICATE
21
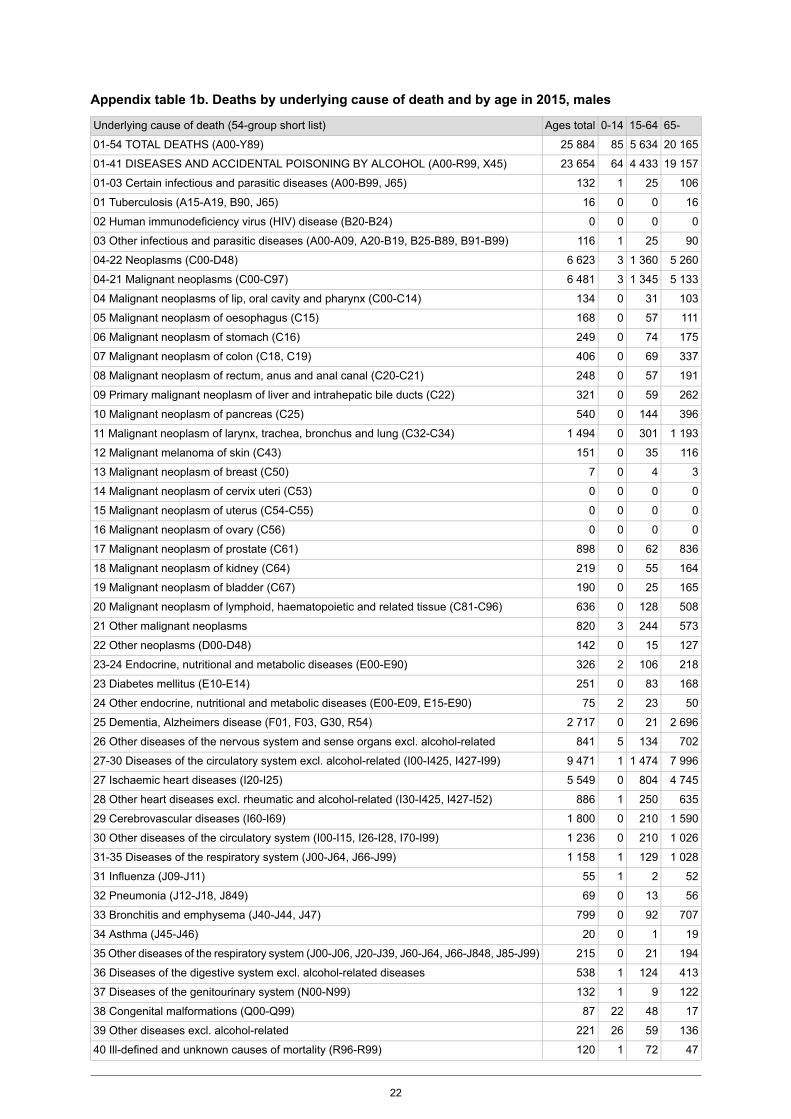
Appendix table 1b. Deaths by underlying cause of death and by age in 2015, males
65-15-640-14Ages totalUnderlying cause of death (54-group short list)
20 1655 6348525 88401-54 TOTAL DEATHS (A00-Y89)
19 1574 4336423 65401-41 DISEASES AND ACCIDENTAL POISONING BY ALCOHOL (A00-R99, X45)
10625113201-03 Certain infectious and parasitic diseases (A00-B99, J65)
16001601 Tuberculosis (A15-A19, B90, J65)
000002 Human immunodeficiency virus (HIV) disease (B20-B24)
9025111603 Other infectious and parasitic diseases (A00-A09, A20-B19, B25-B89, B91-B99)
5 2601 36036 62304-22 Neoplasms (C00-D48)
5 1331 34536 48104-21 Malignant neoplasms (C00-C97)
10331013404 Malignant neoplasms of lip, oral cavity and pharynx (C00-C14)
11157016805 Malignant neoplasm of oesophagus (C15)
17574024906 Malignant neoplasm of stomach (C16)
33769040607 Malignant neoplasm of colon (C18, C19)
19157024808 Malignant neoplasm of rectum, anus and anal canal (C20-C21)
26259032109 Primary malignant neoplasm of liver and intrahepatic bile ducts (C22)
396144054010 Malignant neoplasm of pancreas (C25)
1 19330101 49411 Malignant neoplasm of larynx, trachea, bronchus and lung (C32-C34)
11635015112 Malignant melanoma of skin (C43)
340713 Malignant neoplasm of breast (C50)
000014 Malignant neoplasm of cervix uteri (C53)
000015 Malignant neoplasm of uterus (C54-C55)
000016 Malignant neoplasm of ovary (C56)
83662089817 Malignant neoplasm of prostate (C61)
16455021918 Malignant neoplasm of kidney (C64)
16525019019 Malignant neoplasm of bladder (C67)
508128063620 Malignant neoplasm of lymphoid, haematopoietic and related tissue (C81-C96)
573244382021 Other malignant neoplasms
12715014222 Other neoplasms (D00-D48)
218106232623-24 Endocrine, nutritional and metabolic diseases (E00-E90)
16883025123 Diabetes mellitus (E10-E14)
502327524 Other endocrine, nutritional and metabolic diseases (E00-E09, E15-E90)
2 6962102 71725 Dementia, Alzheimers disease (F01, F03, G30, R54)
702134584126 Other diseases of the nervous system and sense organs excl. alcohol-related
7 9961 47419 47127-30 Diseases of the circulatory system excl. alcohol-related (I00-I425, I427-I99)
4 74580405 54927 Ischaemic heart diseases (I20-I25)
635250188628 Other heart diseases excl. rheumatic and alcohol-related (I30-I425, I427-I52)
1 59021001 80029 Cerebrovascular diseases (I60-I69)
1 02621001 23630 Other diseases of the circulatory system (I00-I15, I26-I28, I70-I99)
1 02812911 15831-35 Diseases of the respiratory system (J00-J64, J66-J99)
52215531 Influenza (J09-J11)
561306932 Pneumonia (J12-J18, J849)
70792079933 Bronchitis and emphysema (J40-J44, J47)
19102034 Asthma (J45-J46)
19421021535 Other diseases of the respiratory system (J00-J06, J20-J39, J60-J64, J66-J848, J85-J99)
413124153836 Diseases of the digestive system excl. alcohol-related diseases
1229113237 Diseases of the genitourinary system (N00-N99)
1748228738 Congenital malformations (Q00-Q99)
136592622139 Other diseases excl. alcohol-related
4772112040 Ill-defined and unknown causes of mortality (R96-R99)
22

65-15-640-14Ages totalUnderlying cause of death (54-group short list)
41687201 28841 Alcohol-related diseases and accidental poisoning by alcohol
8661 135202 02142-53 ACCIDENTS AND VIOLENCE excl. accidental poisoning by alcohol (V01-X44,X46-Y89)
734606141 35442-49 Accidents excl. accidental poisoning by alcohol (V01-X44, X46-X59, Y10-Y15,Y85-Y86)
48112616642 Land traffic accidents
91522643 Other land transport accidents
131512944 Water transport accidents (V90-V94)
010145 Others and unspecified transport accidents (V95-V99)
492112160546 Accidental falls (W00-W19)
345449247 Accidental drownings (W65-W74)
15165018048 Accidental poisonings excl. accidental poisoning by alcohol (X40-X44, X46-X49, Y10-Y15)
123132025549 Other accidents and sequelae of accidents
112441555850 Suicides (X60-X84, Y87.0)
44915451 Assault (X85-Y09, Y87.1)
153705252 Event of undetermined intent (Y16-Y34, Y87.2)
120353 Other external causes and sequelae of other external causes (Y35-Y84, Y88-Y89)
14266120954 NO DEATH CERTIFICATE
23

Appendix table 1c. Deaths by underlying cause of death and by age in 2015, females
65-15-640-14Ages totalUnderlying cause of death (54-group short list)
23 7852 5557826 41801-54 TOTAL DEATHS (A00-Y89)
22 9542 2376725 25801-41 DISEASES AND ACCIDENTAL POISONING BY ALCOHOL (A00-R99, X45)
11115012601-03 Certain infectious and parasitic diseases (A00-B99, J65)
17001701 Tuberculosis (A15-A19, B90, J65)
000002 Human immunodeficiency virus (HIV) disease (B20-B24)
9415010903 Other infectious and parasitic diseases (A00-A09, A20-B19, B25-B89, B91-B99)
4 6991 15365 85804-22 Neoplasms (C00-D48)
4 5371 14465 68704-21 Malignant neoplasms (C00-C97)
742409804 Malignant neoplasms of lip, oral cavity and pharynx (C00-C14)
521306505 Malignant neoplasm of oesophagus (C15)
14250019206 Malignant neoplasm of stomach (C16)
35461041507 Malignant neoplasm of colon (C18, C19)
11230014208 Malignant neoplasm of rectum, anus and anal canal (C20-C21)
16721018809 Primary malignant neoplasm of liver and intrahepatic bile ducts (C22)
50592059710 Malignant neoplasm of pancreas (C25)
617164078111 Malignant neoplasm of larynx, trachea, bronchus and lung (C32-C34)
572107812 Malignant melanoma of skin (C43)
579237081613 Malignant neoplasm of breast (C50)
352806314 Malignant neoplasm of cervix uteri (C53)
16232019415 Malignant neoplasm of uterus (C54-C55)
24688033416 Malignant neoplasm of ovary (C56)
000017 Malignant neoplasm of prostate (C61)
13315014818 Malignant neoplasm of kidney (C64)
571407119 Malignant neoplasm of bladder (C67)
45672152920 Malignant neoplasm of lymphoid, haematopoietic and related tissue (C81-C96)
789182597621 Other malignant neoplasms
1629017122 Other neoplasms (D00-D48)
25256331123-24 Endocrine, nutritional and metabolic diseases (E00-E90)
19339023223 Diabetes mellitus (E10-E14)
591737924 Other endocrine, nutritional and metabolic diseases (E00-E09, E15-E90)
5 8441905 86325 Dementia, Alzheimers disease (F01, F03, G30, R54)
663112878326 Other diseases of the nervous system and sense organs excl. alcohol-related
9 50938239 89427-30 Diseases of the circulatory system excl. alcohol-related (I00-I425, I427-I99)
4 52913104 66027 Ischaemic heart diseases (I20-I25)
82259188228 Other heart diseases excl. rheumatic and alcohol-related (I30-I425, I427-I52)
2 38511312 49929 Cerebrovascular diseases (I60-I69)
1 7737911 85330 Other diseases of the circulatory system (I00-I15, I26-I28, I70-I99)
72161078231-35 Diseases of the respiratory system (J00-J64, J66-J99)
74507931 Influenza (J09-J11)
81708832 Pneumonia (J12-J18, J849)
39438043233 Bronchitis and emphysema (J40-J44, J47)
50805834 Asthma (J45-J46)
1223012535 Other diseases of the respiratory system (J00-J06, J20-J39, J60-J64, J66-J848, J85-J99)
57664064036 Diseases of the digestive system excl. alcohol-related diseases
1455015037 Diseases of the genitourinary system (N00-N99)
2141137538 Congenital malformations (Q00-Q99)
258533234339 Other diseases excl. alcohol-related
233025540 Ill-defined and unknown causes of mortality (R96-R99)
24

65-15-640-14Ages totalUnderlying cause of death (54-group short list)
132246037841 Alcohol-related diseases and accidental poisoning by alcohol
702300111 01342-53 ACCIDENTS AND VIOLENCE excl. accidental poisoning by alcohol (V01-X44,X46-Y89)
6521441180742-49 Accidents excl. accidental poisoning by alcohol (V01-X44, X46-X59, Y10-Y15,Y85-Y86)
293166642 Land traffic accidents
241743 Other land transport accidents
100144 Water transport accidents (V90-V94)
000045 Others and unspecified transport accidents (V95-V99)
51028053846 Accidental falls (W00-W19)
9821947 Accidental drownings (W65-W74)
234006348 Accidental poisonings excl. accidental poisoning by alcohol (X40-X44, X46-X49, Y10-Y15)
7833211349 Other accidents and sequelae of accidents
44129017350 Suicides (X60-X84, Y87.0)
21401651 Assault (X85-Y09, Y87.1)
11201352 Event of undetermined intent (Y16-Y34, Y87.2)
310453 Other external causes and sequelae of other external causes (Y35-Y84, Y88-Y89)
12918014754 NO DEATH CERTIFICATE
Appendix table 2. Deaths from accidents by external cause and deaths from alcohol intoxication2015
Of which under alcohol intoxicationDeaths from accidentsExternal cause
%Persons
15,63001 918Accidental deaths (excl. poisonings)
19,853268Transport accidents
8,0911 143Falls
45,363139Drowning
30,41756Eating, inhalation of food (W79)
58,11831Heat of sauna (W92)
44,32761Fire (X00–X09)
38,52052Natural cold (X31)
6,511168Other accident
25

Appendix table 3. Mortality during infant and perinatal period 1987–2015
Infantmortality3)
Infantdeaths
Neonatalmortality2)
Neonataldeaths
First weekmortality/1,000 births
First weekmortality
StillbirthsPerinatalmortality/1000 births(incl.stillbirths)1)
Perinataldeaths(stillbirths andfirst weekdeaths)
6,23704,22523,21943118,45051987
5,63683,72453,12003077,75071990
4,02512,81722,11302996,84291995
3,62052,41361,7972285,73252000
3,21812,21221,7982085,43062001
3,01652,11171,6912135,53042002
3,21822,11201,7981784,92762003
3,31932,51422,01131875,23002004
3,11792,21251,81041824,92862005
2,91682,01191,5911934,82842006
2,71591,91091,6942045,12982007
2,71591,91161,6941894,72832008
2,61602,01221,6952054,93002009
2,31381,5911,1671814,12482010
2,41421,6971,3781614,02392011
2,41411,4851,2711613,92322012
1,7981,0610,9501473,41972013
2,21251,4811,1621633,92252014
1,7961,2691,0531724,02252015
Perinatal mortality = Stillborn (the duration of the mother's pregnancy at least 22 weeks or birth weight at least 500 g) and deathsduring the first week of life per thousand births (incl. stillborn).
1)
Neonatal mortality = The number of deaths during the four first weeks of life per thousand live births.2)
Infant mortality = The number of deaths at under one year per thousand live births.3)
26

Appendix table 4. Mean population 2015 by age and sex
FemalesMalesTotalAge
2 782 8542 696 6765 479 531Total
27 61029 00556 6150
117 615123 028240 6421–4
149 585156 361305 9465–9
143 283149 831293 11310–14
148 605155 272303 87715–19
166 604174 047340 65120–24
165 253174 794341 04725–29
172 641183 519356 16030–34
167 664177 459345 12335–39
154 575161 704316 27940–44
175 352179 491354 84345–49
186 752188 291375 04350–54
186 345183 159369 50455–59
191 076182 369373 44560–64
196 769182 170378 93965–69
134 441115 579250 01970–74
112 70685 104197 80975–79
88 12955 708143 83680–84
62 88829 49192 37985–89
27 6078 86036 46790–94
6 3591 4397 79895+
Appendix table 5. Standard population used in calculating age-standardised figures (Eurostat 2012)
Standard populationAge
1 0000
4 0001–4
5 5005–9
5 50010–14
5 50015–19
6 00020–24
6 00025–29
6 50030–34
7 00035–39
7 00040–44
7 00045–49
7 00050–54
6 50055–59
6 00060–64
5 50065–69
5 00070–74
4 00075–79
2 50080–84
1 50085–89
80090–94
20095+
100 000Total
27

Appendix figures
Appendix figure 1. Age-standardised mortality from diseases of thecirculatory system in 1971 to 2015
Appendix figure 2. Age-standardised mortality from neoplasms in1971 to 2015
28

Quality Description:Causes of death 2015
1. Relevance of statistical informationIn the statistics on causes of death, statistical data are produced annually on the causes of death of personspermanently resident in Finland. The statistics are compiled on the basis of death certificates. The dataare supplemented with and verified against data on deaths from the Population Information System of thePopulation Register Centre. Statistics Finland has death certificates and data on causes of death from 1936onwards.
Cause of death data are highly significant for general information systems describing the population's stateof health. Cause of death data are used in various medical surveys, and by combining the data with otherStatistics Finland's data files, it is possible to study, for instance, differences in mortality between differentpopulation groups.
Investigating the cause of death and the related procedures including the production of statistics andarchiving of death certificates is based on the act (1973/459) and decree (1973/948) on the investigationof the cause of death. In April 2011, Commission Regulation (EC) No 1338/2008 was passed and itconfirms the variables, specifications andmetadata which the EUMember States have to supply as concernsstatistics on causes of death.
ConseptsCauses of death are obtained from death certificates. Data on underlying causes of death have beencollected in database tables from 1969 onwards and from 1987, in addition to the underlying cause ofdeath, there are also data on immediate, intermediate and contributing causes of death:
• The underlying cause of death is the disease which has initiated the series of illnesses leading directlyto death. In accidental or violent deaths, the underlying cause of death is the external reason whichcaused the injury or poisoning leading to death. The underlying cause of death issued by the physician’sdeath certificate is not directly applied to statistics compilation, but it is used when forming theunderlying cause of death in the statistics.
• The statistical underlying cause of death is determined according to the selection and application rulesof the International Classification of Diseases (ICD-10) compiled by the World Health Organisation(WHO). On their basis, the underlying cause of death is determined from the causes of death givenby the physician in the death certificate. Annual causes of death statistics are made according to theunderlying cause of death determined for the statistics. Other causes of death are mainly used insurveys.
• The immediate cause of death refers to the disease, failure or injury whose symptoms cause the personto die. However, the mechanisms of death, e.g. cardiac arrest, are not regarded as immediate causesof death.
• The intermediate cause of death refers the condition which leads from the underlying cause to theimmediate cause of death.
• The contributing cause of death are other significant circumstances that contributed to the deathrecorded in the part II of the death certificate but are not related to the cause-consequence chain inpart I of the death certificate.
In the case of stillbirths and infants dying before the age of 28 days the statistical data include thechild's main cause of death, the mother's main reason contributing to the child's death, and two otherreasons contributing to the child's death.
Stillbirths include a foetus or a newborn who shows no signs of life at the time of birth after a pregnancylasting at least 22 weeks or the newborn weighing at least 500 grams. This concept has been used in Finnishannual tables since 1987. In the earlier used definition, stillbirths were newborns or foetuses when theduration of pregnancy had been at least 28 weeks. The changed concept also influenced the definition ofperinatal deaths for stillbirths. Terminations of pregnancy prior to the 22nd week of pregnancy areconsidered miscarriages. Terminations of pregnancy are not included in the cause of death statistics.
29
Infant mortality refers to the share of deaths in infancy (at under one year) per thousand live births.Neonatal mortality refers to the share of deaths during the four first weeks of life per thousand live births.The figure is often given in tables as per mil. Early neonatal mortality refers to the number of deathsduring the first week of life relative to the live births. Late neonatal mortality refers to the number ofdeaths which occur at the age of 7 to 27 days relative to the live births.
Perinatal mortality refers to the share of stillbirths and deaths during the first week of life among allbirths (incl. stillbirths). The age during the first week is calculated in hours.
Perinatal mortality is calculated by dividing the number of stillbirths and deaths during the first weekof life by the number of all births during the statistical year. The age during the first week is calculated inhours.
More concepts of the cause of death statistics can be found at: http://tilastokeskus.fi/til/ksyyt/kas_en.html
2. Methodological description of surveyThe cause of death statistics data are total data including all deaths in Finland or abroad of personspermanently resident in Finland at the time of their death. Statistics on stillbirths are made separately;cases of stillbirths are not included in deaths during the statistical reference year. The statistics on stillbirthsare supplemented with data from the birth register of the National Institute for Health and Welfare (THL).
Death certificates are issued by the physician establishing the death. If determining the cause of deathrequires an autopsy, the death certificate is issued by a forensic pathologist after the information acquiredfrom the autopsy is complete. The physician issuing the death certificate delivers the certificate to theregional unit of the National Institute for Health and Welfare (THL) where the deceased was a resident.A forensic pathologist there verifies the correctness of the certificate and the certificates are sent on toStatistics Finland. In addition, the health care unit or the physician has to report the death to the PopulationInformation System. At Statistics Finland, the death certificate data are compared with data on the deceasedobtained from the Population Information System and lists of missing death certificates are sent to THLfor monitoring purposes. The data files on causes of death are supplemented with other demographic datafrom the Population Information System.
Death certificates are received at Statistics Finland in paper form from THL. Death certificates are scannedat Statistics Finland in picture format and part of the data is read optically to the database. Diagnosis textsand cause of death codes issued by physicians are checked with the help of an electronic dictionary. Thestatistical underlying cause of death is determined according to the selection and application rules of theInternational Classification of Diseases (ICD-10) compiled by the World Health Organization (WHO).Some of the statistical underlying causes of death are coded automatically with the application and partmanually utilising the description of events written by the physician.
Since 1996, causes of death have been coded according to the international ICD-10 classification(International Statistical Classification of Diseases and Related Health Problems). The ICD-10 classificationis an international classification maintained by the World Health Organization (WHO) describing causesof death, illnesses, accidents and reasons for using health care services. The classification can be foundon WHO’s pages. Causes of death are coded mainly in the most accurate level of the classification, the3-digit level is the publication level. In certain cases, specifying codes according to the Finnish nationalclassification of diseases are used. THL maintains the Finnish version of the ICD-10 classification ofdiseases.
In the publication, the mortality rate can be measured with the general mortality rate, where the numberof deaths is divided by mean population and multiplied by one thousand or one hundred thousand. Themortality rate can also be calculated by age group, when deaths in each age group are expressed as aproportion to the population of corresponding age.
Age-standardised mortality rate refers to mortality where the effect of age structure is eliminated byage standardisation. The standardisation used in cause of death statistics is made by using direct agestandardisation (standardised death rate, SDR), which means that mortality figures for the year in question
30

have been used to calculate how many people would die if the age structure of the population remainedthe same throughout time. The formula for direct standardisation is as follows:
SDR = ∑ (mi Pi / P) × 100 000
mi = mortality rate in age group i
Pi = standard population in age group i
P = standard population
Mortality and the generality of causes of death are heavily dependent on age. For this reason, agestandardisation is used in the statistics when comparing mortality differences of different times and areas.In the publication on cause of death statistics, the 'new' standard population of Europe has been used since1996 as the standard population when calculating age-standardisedmortality rates (Appendix 5). Differentstandard population has been used in the age-standardised mortality figures published by Eurostat, forwhich reason the figures differ from those released by Statistics Finland.
3. Correctness and accuracy of dataThe death certificate form is confirmed by theMinistry of Social Affairs and Health. The physician recordsthe cause of death on the death certificate as a code and as a text specifying the diagnosis. At StatisticsFinland, the causes of death are coded mainly on the basis of the diagnosis text.
In case the information in the death certificate is deficient, inconsistent or difficult to classify, theinformation about the event recorded on the death certificate or a medical expert will be consulted or moreinformation is requested from the issuer of the death certificate. In cases of alcohol and medicinalpoisonings, the additional information used consists of the research results from the register of forensicchemistry. The underlying cause of death is determined from the event information in the death certificatein about 1,000 cases yearly. Around 700 cases are handled by a medical expert every year. Additionalinformation is requested from the issuer of the death certificate in about 50cases per year. Additionalinformation is obtained for some 150 cases per year from the register of forensic chemistry.
In practice, the coverage of the cause of death statistics is around 100 per cent, because the data on deathare verified from the Population Information System. The number of deaths on which no information onthe cause of death is obtained has previously been 100 to 150 per year, but in the last few years the numberof missing death certificates has been growing. In 2015, there were 356 missing death certificates. Ofthem, 23 were deaths abroad on which only a notification on death was obtained. The data derived fromlate death certificates are combined to the survey database and death certificate archives.
Number of death certificates missing from statistics yearly
Proportion of all deaths, %NumberYear
0,1402000
0,21182005
0,31352006
0,31392007
0,31462008
0,31572009
0,21072010
0,31322011
0,42262012
0,52672013
0,94772014
0,73562015
Most causes of death are based on clinical data, but qualitatively better data for death certificates arederived from autopsies. The share of autopsies in all deaths were highest in Finland of all Nordic countries.
31

The number of forensic autopsies has decreased fast in Finland since 2010, however. In 2015, a forensicautopsy was performed for 16 per cent and a medical autopsy for 5 per cent of dead persons.
Share of forensic and medical autopsies in death cases in 1975 to2015
4. Timeliness and promptness of published dataCause of death data are produced yearly and they are completed at the end of the following year. The dataare final and describe the deaths during the previous calendar year of persons permanently resident inFinland. After the data are published, death certificates are not added afterwards to the annual data of thestatistics, but they are included in research data and death certificate archives.
5. Accessibility and transparency/clarity of dataThe data of the cause of death statistics are published yearly under the topic Health on the home pages ofthe cause of death statistics and the tables are released in Statistics Finland’s StatFin database. The tablesof the cause of death statistics are made according to the underlying cause of death.
The cause of death statistics are available starting from 1936. The data for 1936 to 1968 are in table formatin the paper publications. From 1969, there are data as a time series database. Tailored tables and researchdata can be made from unit-level data at Statistics Finland to customer needs. A licence is always neededfor unit-level research data. The application for licence can be found on Statistics Finland’s home page.Cause of death data can also be combined to other datasets by means of the person number (e.g. withpopulation census and employment statistics data).
Cause of death data are also published for international sources and databases, such as:
— The Nordic Statistical Yearbook “Health Statistics for the Nordic Countries” http://nowbase.org/
— Eurostat’s database, e.g http://ec.europa.eu/eurostat
—WHO’s databases, e.g European Health for All database, http://www.euro.who.int/en/data-and-evidence
Statistics Finland also maintains Finland's death certificate archive. The archive contains Finnish residents'death certificates from 1936 onwards. The death certificates from 1936 to 1965 are located in the NationalArchive. More recent death certificates are archived at Statistics Finland.
If it has been less than 50 years since the person died, the death certificate data are confidential. Copiesof death certificates and unit-level cause of death data are released from the archive to the purposesprescribed in the act on the investigation of the cause of death (459/1973). They are mainly released tothe dead person's next of kin, pension institutions and official use and for scientific research and statisticalsurveys. Instructions for applying for death certificates and on the licence procedure can be found onStatistics Finland's web pages.
32

6. Comparability of statisticsThe classification of causes of death used in the statistics has changed a number of times. Since 1996,causes of death have been coded according to the ICD-10 classification (International StatisticalClassification of Diseases and Related Health Problems). Between 1987 and 1995, the data were codedusing the national classification of diseases 1987 and from 1969 to 1986, the international classificationICD-8 was in use.
To improve the comparability of cause of death data from different years, Statistics Finland has made timeseries classifications. The longest comparable national time series classification (54 categories) containsdata from 1969 onwards. In addition, use is made of a 72-category classification where data are availablefrom 1998. This classification complies in main aspects with the 65-category European shortlistclassification used by the EU, which was used by Eurostat from 1998 to 2013. Since the beginning of2014, an updated 86-category European shortlist 2012 classification has been available on Eurostat'swebsite. This classification has also been available on the data of the causes of death statistics at StatisticsFinland.
7. Coherence and consistency/uniformityThe cause of death statistics are the only comprehensive statistics on causes of death in Finland. OtherStatistics Finland’s statistics describing the mortality rate and causes of death are vital statistics, statisticson road traffic accidents and occupational accident statistics.
The data on deaths published by Statistics Finland's vital statistics are comprehensive statistics on thenumber of deaths. The number of deaths per year differs somewhat from the number of deaths in the causeof death statistics. The difference is mainly caused by that the vital statistics do not contain deaths registeredas deaths after the compilation time of the statistics (the end of the following year's January). In the vitalstatistics for 2014, the number of deaths was 52,492, which was 190 deaths more than in the cause ofdeath statistics. The number of deaths under the age of one year was 97 in the vital statistics and 96 in thecause of death statistics. When calculating infant mortality, the number of deaths under the age of one inthe vital statistics is used in official connections.
The statistics on road traffic accidents compile statistics on deaths in road traffic. Data are obtained fromthe information system of the police. The coverage of the data is checked against those of the cause ofdeath statistics. The figures deviate from those in the cause of death statistics by some tens of cases eachyear. The deviation is due to the following differences in the statistical criteria:
• The statistics on road traffic accidents contain all deaths in traffic in the area of Finland, whereas thecause of death statistics include all deaths of the permanent population of Finland occurring either inFinland or abroad.
• The cause of death statistics are compiled on the basis of the day of the death, but the time period ofthe statistics on road traffic accidents is the day of the accident and at most the 30 following days.
• In the cause of death statistics suicides committed in traffic are included in suicides, in the statisticson road traffic accidents they are regarded as road traffic accidents.
Occupational accident statistics are compiled on the basis of information on insurance activities and thestatistics include all those accidents at work on which insurance institutions have paid compensation. Bycontrast, in the cause of death statistics the information on occupational accidents is derived from deathcertificates as defined by the physician. The number of deaths from occupational accidents differs yearlyvery little from the figures in the cause of death statistics.
33

Health 2016
Inquiries029 551 3605Airi Pajunen029 551 3291Jari Hellanto
Director in charge:Jari Tarkoma [email protected]: Causes of death, Statistics Finland
ISSN 1796-0479Communication and Information Services, Statistics Finland= Official Statistics ofFinland
tel. +358 29 551 2220www.stat.fi
ISSN 1799-5078 (pdf)Publication orders, Edita Publishing Oytel. +358 20 450 05www.editapublishing.fi