
Causes of Falls of Roof - Council for Scientific and ...
124
Safety In Mines Research Advisory Committee Causes of Falls of Roof in South African Collieries J.N. van der Merwe J.J. van Vuuren R. Butcher I. Canbulat March 2001 Revised August 2001
Transcript of Causes of Falls of Roof - Council for Scientific and ...

Safety In Mines Research Advisory Committee
Causes of Falls of Roof in South AfricanCollieries
J.N. van der MerweJ.J. van Vuuren
R. ButcherI. Canbulat
March 2001Revised August 2001

ii
Executive summaryThe main objective of this research was to determine the causes of falls of roof in South Africancollieries.
The research team was assembled from the CSIR Miningtek, ITASCA Africa (Pty) Ltd and Steffen,Robertson and Kirsten Consulting Inc to achieve a balanced view. The south African CollieryManager’s Association and the members of the South African National Institute of RockEngineering who are employed by collieries lent full support to the work.
Sixteen major roof falls were investigated in detail and their causes established. This data wassupplemented by mapping a large number of roof falls on four collieries in less detail. The totalnumber of recorded roof falls was 182. The data bank simulated the data bank of roof falls thatresulted in fatalities in terms of the total number of falls recorded and the thickness distribution ofthe collapses.
It was found that the causes of the falls differed for different thickness ranges of roof falls. The thinfalls, classified as “Skin falls”, which accounted for approximately 70% of all fatalities, werepredominantly caused by ineffective joint support and excessive bolt spacings.
Ineffective joint support was found to be a dominant cause of roof falls for all thickness ranges,while the influence of excessive bolt spacings diminished with increasing fall thickness. However, itremained a significant cause of roof falls even for the major falls.
Burnt coal, dykes, bad mining practice, weathering and inferior materials were found to be minorcauses, but nonetheless contributed to the falls. Horizontal stress was a minor cause, withincreasing contribution for thicker falls. It was also found that indications of horizontal stresscoincided with areas of reduced roof rock strength.
In general, roof falls occurred in areas where the roof rock was found to be less competent in termsof rock mass rating systems. It was concluded that the Coal Mine Roof Rating (CMRR) systemdeveloped by NIOSH in the USA held promise for application in South Africa and should beinvestigated further.
It was indicated that in South Africa, less bolts are installed for comparable roof conditions than inthe USA and Australia. This supports the conclusion that excessive bolt spacing is a major cause ofroof collapses in South Africa.

iii
AcknowledgementsThe investigation covered a wide area and entailed underground inspection at several mines. Thetopic itself, falls of roof, is one that poses a significant threat to mine supervisors at all levels. Inaddition to the obvious danger to workers posed by falls of roof, there is also the danger to amanager that the outcome of an investigation of this nature could be used for prosecution. Despitethis, more invitations to investigate falls were received than could be handled.
This was due to the positive attitude adopted by the South African Colliery Manager’s Association,SACMA. The organisation and its individual members are lauded for their contribution to thisproject. On every mine that was visited, the team was received cordially and given every assistanceto complete the task. They are not mentioned by name to abide by the undertaking of confidentialitythat was entered into.
The rock engineers employed by the mines assisted in similar fashion, accompanying the team onthe visits without interfering or attempting to steer the investigation in any particular direction.
The team members, Jaco J. van Vuuren (ITASCA Africa), Richard Butcher (SRK Consulting) andbefore he left the country, Ismet Canbulat (CSIR Miningtek), were always prepared to change theirschedules to accommodate urgent call-outs to falls of roof. The team members are thanked for theircommitment and contribution to the task.
SIMRAC is gratefully acknowledged for sponsoring the project.

iv
Contents
Executive summary.......................................................................................................................... ii
Acknowledgements ......................................................................................................................... iii
1 Introduction ............................................................................. 1
2 Size Distribution of Fatal South African Roof Fall Accidents...3
3 Method of investigation .......................................................... 4
4 Description of the database.................................................... 6
5 Characteristics of All Roof Falls............................................. 8
5.1 Causes of Falls.....................................................................................................................8
5.2 Locality of All Falls................................................................................................................8
5.3 Timing of Falls ......................................................................................................................9
6 Characteristics of Skin Falls................................................. 12
6.1 Causes of Skin Falls ...........................................................................................................13
6.2 Localities of Skin Falls ........................................................................................................14
6.3 Timing of Skin Falls ............................................................................................................15
7 Characteristics of Large Falls............................................... 16
7.1 Causes of Large Falls.........................................................................................................17
7.2 Localities of Large Falls ......................................................................................................18
7.3 Timing of Large Falls ..........................................................................................................18
8 Characteristics of Major Falls............................................... 19
8.1 Causes of Major Falls .........................................................................................................19
8.2 Localities of Major Falls ......................................................................................................21
8.3 Timing of Major Falls ..........................................................................................................21
v
9 Discussion of Causes of Roof Falls ..................................... 23
10 Influence of roof rock quality................................................ 24
10.1 Roof Rating Systems ......................................................................................................24
10.2 Roof Rock Strength ........................................................................................................2510.2.1 Uniaxial Compressive Strength of Sandstone (UCS) ..................................................2610.2.2 Modulus of Elasticity of Sandstone (E)........................................................................2610.2.3 Shear Strength of Sandstone......................................................................................2710.2.4 Uniaxial Tensile Strength (UTS) of Shale/Mudstone ...................................................2710.2.5 Uniaxial Tensile Strength (UTS) of Sandstone ............................................................28
11 Role of Support Material ....................................................... 29
12 Discussion and Conclusions................................................ 31
12.1 Most Fatalities Are Caused By Thin Roof Falls ...............................................................31
12.2 Characteristics of Roof Falls ...........................................................................................31
12.3 Inadequate Joint Support Is The Most Frequent Cause Of Roof Falls.............................31
12.4 Bolt Spacing Is Too Wide................................................................................................33
12.5 Under Performance of Support Material Is Not a Major Problem But Should Not BeTolerated At All ..............................................................................................................................34
12.6 Weathering Is Not a Major Cause of Roof Falls In Young Mines.....................................36
12.7 Burnt Coal, Dykes And Bad Mining Are Relatively Minor Contributors to Roof Falls. ......36
12.8 Horizontal Stress Signs Coincided with Weak Roof Material...........................................36
References .................................................................................. 38
Appendix I - Individual site investigation reports..................... 39
Appendix II – Summary of Mapped Falls................................. 114

vi
Tables
Table 1. Causes of roof falls for different thickness of falls. 25
Figures
Figure 1. Fall of roof fatality rate per thousand employees on South African collieries for theten year period 1991 to 2000.
8
Figure 2. Distribution of thickness of fatal roof falls in South African collieries. The databaseconsisted of 192 documented cases. More than 70% of all fatal roof falls were less than 0,51m thick.
8
Figure 3. Comparison of the databases of mapped and fatal roof falls. 11Figure 4. Comparison of the roof fall rates and size distributions of roof falls on the selectedmines.
12
Figure 5. Causes of all roof falls 13Figure 6. Localities of all roof falls 13Figure 7.Timing of all falls 14Figure 8. Size distribution of all falls. 14Figure9. Illustration of a roof fall with island bolts, indicating excessive bolt spacing. 15Figure 10. Illustration of a fall with free hanging bolts, indicating insufficient tension orexcessive bolt spacing. This roof is now unsupported.
15
Figure 11. Breakdown of the causes of Skin Falls, showing the dominance of excessive boltspacing and insufficient joint support.
16
Figure 12. Example of a roof fall that was caused by insufficient joint support. The W-strapsin the photo were installed after the roof fall had occurred.
16
Figure 13. Localities of Skin Falls. 17Figure 14. Timing of Skin Falls relative to the timing of bolt installations. 18Figure 15. Timing of Skin Falls with the old mine case excluded from the database. 19Figure 16. Example of a Large Fall that occurred after the installation of support, caused byinsufficient joint support. The joint plane without support is indicated by the ellipse.
19
Figure 17. Causes of Large Falls 19Figure 18. Localities of Large Falls 20Figure 19. Timing of Large Falls relative to the timing of support installation. 21Figure 20. This fall was classified as Major. It occurred after support had been installed andwas classified as being caused by horizontal stress. It occurred in the vicinity of a dyke.
22
Figure 21. Causes of Major Falls. 22Figure 22. Causes of Major Falls, excluding weathering. 23Figure 23. Localities of Major Falls. 24Figure 24. Timing of Major Falls relative to the timing of support installation. 24
Figure 25. Causes of roof falls seen against the background of thickness of roof falls. 25
Figure 26. Test of correlation between the rating systems and road width. 27Figure 27. Comparison of the amount of support installed for comparable roof conditions inSouth Africa, the USA and Australia, after Mark (1999).
28
Figure 28. UCS values that were obtained from roof sandstone samples collected at the fallareas.
28
Figure 29. Modulus of Elasticity of sandstone samples from the fall areas. 29Figure 30. Shear strength of the sandstone samples. 30Figure 31. Shear strength of Mudstone/Shale samples 31Figure 32. Uniaxial Tensile Strength of the sandstone samples. 32Figure 33. Even though this roof has been re-supported after a fall, the joint is still notadequately supported.
34
Figure 34. Unsupported joint that resulted in a major fall. 34Figure 35. Skin fall caused by failure between bolts that were spaced too widely. 35Figure 36. Major fall that was caused by a bolt system failing at the weakest link, the resin 35

vii
contact. A denser bolt spacing would have prevented this fall.Figure 37. Was the fall in the background caused by cutting lengths off cable anchors likethe one shown in the photograph?
36
Figure 38. The smooth appearance of the thread on this bolt was due to the nut havingstripped off on it.
37

1
1 IntroductionDespite several years of rock engineering research and application on South African collieries, fallof roof accidents continue to claim lives, as shown in Figure 1. There are several perceived reasonsfor this fact, including poor adherence to standards, poor design of support systems, poorperformance of support elements, unknown nature of the stress regime, etc.
SIMRAC approved this research project to answer the following deceptively simple question: whatcauses the roof to fall? Analytical simulations of roof falls abound, with models ranging from simplebeam behaviour to more complex numerical models simulating the complete stress regime withoften uncertain input. Before this project, no major in situ underground investigation had ever beendone in South Africa.
There were attempts in the past to obtain SIMRAC approval for a project of this nature, but it wasnever successful, mainly due to the difficulty in guaranteeing confidentiality. In 1999, however, theSouth African Colliery Managers Association (SACMA) lent their support for the project after thelabour movements, the State and SACMA agreed that the results of this project would not be usedfor any purpose other than scientific investigation. The team therefore concentrated on thetechnical causes of roof falls and did not try to establish blame or negligence on the side of anyindividual or group of individuals.
The investigating team undertook not to identify any site, mine or individual that was connected tothe investigation. It was also decided not to limit the investigation to accidents, but to include falls ofroof that could have resulted in accidents. It was therefore important that the database of the casesthat were studied should simulate the database of roof falls that did result in accidents as closely aspossible. This was achieved after the SIMCOM sub committee of SIMRAC approved a change ofscope. The initial plan was to study twenty falls of roof in great detail. However, after the first fifteenfalls had been studied, it became clear that the database was heavily biased towards the major rooffalls. To rectify this problem, a great number of smaller roof falls on selected mines wereinvestigated in less detail and included in the database.
Obtaining suitable sites for research is often a problem. In this case, however, the oppositeoccurred: at one stage the data gathering threatened to get out of hand due to the number of sitesthat were offered by SACMA members. SACMA is to be lauded for their open attitude thatcontributed to this investigation in no small measure. In all cases, the team was given all thenecessary information and mine plans and not in a single case did a manager attempt to steer theteam in any particular direction. Likewise, the rock engineering practitioners employed by themining companies lent their full support. The local rock engineers accompanied the investigatingteam on each investigation except one, in a case where a company did not employ a rock engineer.
The final outcome of the investigation did not yield a single cause for roof falls, but several. It wasfound that different size ranges of roof falls had different combinations of causes. It should be bornein mind throughout this report that where a single cause or type of cause is mentioned, it is the onethat was considered to be the dominant one in any particular case, not the only one. For example,in the case where a laminated roof collapsed, it could have been prevented by installing longerbolts closer together to create a stronger beam or by restricting the road width. Therefore, was thecause of the collapse an inferior support system or an excessive road width? The team approachedthis problem in a pragmatic fashion: if the collapse occurred in an area where the road was widerthan elsewhere in the section where the roof did not collapse, the cause was put down to excessiveroad width. However, if the road width was already restricted and several falls occurred in an area,the cause was put down to an inferior support system for the local conditions.

2
Normalised Fatalities
0
0.2
0.4
0.6
0.8
1
1.2
1990 1992 1994 1996 1998 2000
Fat
alit
ies/
1000
/Yea
r
Figure 1. Fall of roof fatality rate per thousand employees on South African collieries for theten-year period 1991 to 1999.

3
2 Size Distribution of Fatal South African Roof FallAccidents.
Analyses of the sizes of roof falls that resulted in fatal accidents in South African collieries weredone by Vervoort (1989) and later by Canbulat and Jack (1998). The former covered the period1970 to 1988 and the latter the period 1989 to 1995. There were only minor differences in thedistributions for those two periods. The main conclusion was that the majority of fatal accidents arecaused by the smaller roof falls. Their data was combined and the resultant size distribution of fatalroof falls is shown in Figure 2.
Thickness Distribution of Fatal Roof Falls
0
0.1
0.2
0.3
0.4
0.5
0.6
0.7
0.8
0.5 1 1.5 2 2.5 3 3.5 4
Thickness (m)
No
rmal
ised
Fre
qu
ency
Figure 2. Distribution of thickness of fatal roof falls in South African collieries. Thedatabase consisted of 192 documented cases. More than 70% of all fatal roof falls were lessthan 0,51 m thick.
The trend in the USA is somewhat different. Bauer and Dolinar (2000) reported that in the USA,82% of roof fall injuries were caused by falls that did not entail failure of the support system as awhole, but rather small falls between bolts. However, over the three-year period 1996 to 1998, only3 out of 13 fatalities under supported roof resulted from skin falls, the remaining 10 being caused bymassive failures.
According to Pappas et al (2000) 24% of roof fall injuries in the USA occurred under unsupportedroof in the period 1996 to 1999. They also reported that a decade ago, approximately 50% of rooffall injuries occurred under unsupported roof. This is somewhat similar to the situation in SouthAfrica, where reductions in roof falls under unsupported roof had been brought about by stricterdiscipline and enforcement.
More detailed descriptions of the characteristics of fatal roof falls in South Africa falls beyond thescope of this investigation, having been dealt with in detail by Canbulat and Jack (1998).

4
3 Method of investigationAccording to the agreement with SACMA, the investigating team was invited by mine managers toinvestigate roof falls on their mines. Managers from all the groups participated in this effort and as aresult, a wide geographical area was covered. The corners of the area that was included were theParfuri coal field in the far North East of the country, East of Springs in the West, East ofMiddelburg in the East and South of Newcastle in the South. The emphasis was on the Witbankcoalfield where most of the underground coal mining is being carried out. There, the No’s 2, 3, 4and 5 Seams were investigated.
Upon arrival at a mine, the team would be shown the mine plans and given a history of mining inthe area. The geology would be discussed and the team had the opportunity to request anyadditional information.
The investigation would then proceed underground. Initially, the team would view the roof fall andhold a general discussion on the site. Thereafter, each team member would proceed on a detailedinvestigation of his area of speciality. This included:Geophysics and geology, including stratigraphy, Rock Mass Rating (RMR), Bieniawski (1980),Modified Rock Mass Rating (MRMR), Laubscher (1985), and Coal Mine Roof Rating (CMRR),Molinda and Mark (1994);Mining parameters, including road width, mining sequence, pillar size, equipment, mining method;Roof support, including type of support, bolt length, spacing, installation quality, timing of supportandA general investigation of the surrounding area, including slips and faults, dimensions, other falls.
Following that, the team would reassemble and reach consensus on the cause of the roof fall. Theteam would then view specific areas of interest that were found during the detailed individualinspections. Finally, the team tested their diagnosis by establishing why the roof did not fall in theadjacent areas. During the underground investigation, mining personnel were at hand to assist andsupply additional information.
Roof rock samples were collected from selected sites for laboratory testing. The tests included:Uniaxial Compressive Strength,Poisson’s Ratio,Modulus of Elasticity,Uniaxial Tensile Strength anddirect Shear Strength.
In this way, fifteen major roof falls were investigated in detail in Phase 1 of the investigation. Thosecases are summarised in Appendix A where the important information is contained for each case.
Following Phase 1, there was concern that the objective of simulating the fatal roof fall populationwould not be reached. There was an insufficient number of smaller roof falls, the mine managershaving invited the team to investigate the more spectacular roof falls. This was rectified bychanging the scope of the investigation. Four mines were selected and all falls were recorded inselected roadways. The dimensions and causes of the falls were recorded. The experience thatwas gained in Phase 1 was used to establish the causes of the falls, which were investigated inless detail than the ones in Phase 1. In this way, a total of 167 additional roof falls wereinvestigated to bring the total to 182 falls. A total linear distance of 7,63 km was covered.
The following broad causes were established:Excessive bolt spacingJoints (including faults)Weathering (including Acid Mine Drainage)

5
Incorrect or insufficient joint supportBurnt coalMining (e.g. cutting away pillar corners, breaking splits away at major discontinuities, poor horizoncontrol, etc)Excessive horizontal stress (including weak rock).

6
4 Description of the databaseThe database of the investigated roof falls simulated the database of fatal roof falls almost exactly.The comparison is shown in Figure 3.
Because the falls that were investigated were not necessarily those that resulted in an injury, it wasimportant to create a comparable database. As Figure 3 shows, this objective was achieved.
The average density of the falls was 0,022 falls per linear metre, meaning that on average, therewas a roof fall every 45 m. This includes minor roof falls.
In the USA, Molinda et al (2000) reported reportable roof fall rates ranging from 0,0003/m to0,0001/m. These figures are not directly comparable with South Africa’s, as the definition of a“reportable” roof fall according to US regulations is one that –Causes injury;Falls above anchorage;Blocks ventilation;Blocks escape orStops production for 30 minutes or more.
Molinda et al (2000) also indicated that the vast majority of US collieries had a zero roof fall rate.This variation in roof fall rates for different mines in South Africa was also found by Canbulat andJack (1998) who found that a small number of mines in South Africa was responsible for themajority of roof fall accidents.
Distribution of Thickness of Mapped and Fatal Falls
0
0.1
0.2
0.3
0.4
0.5
0.6
0.7
0.8
0.5 1 1.5 2 2.5 3 3.5 4
Thickness of Falls (m)
Mapped Falls
Fatal Falls
Number of fatal falls = 192Number of mapped falls = 182
Figure 3. Comparison of the databases of mapped and fatal roof falls.
The roof fall rates on the mines selected for this investigation displayed some variation, as shown inFigure 4.
As seen on Figure 4, the characteristics with regard to the size distributions of roof falls on the fourselected mines were largely similar. Mine DD had a slightly different distribution, displaying a

7
greater proportion of thicker roof falls. The selected area on Mine DD had been abandoned forabout twenty years and the immediate roof consisted of coal. Over time, the roof had weatheredand fallen in several areas. It is postulated that due to weathering, a great number of small falls hadfallen out higher.
The ages of the other areas were between five and approximately ten years, but all the areas wereventilated and maintained. The highest density of roof falls was on Mine BB, which also had thegreatest proportion of small falls.

8
5 Characteristics of All Roof Falls
5.1 Causes of FallsIf the population of roof falls is viewed as a whole, it was found that the dominant causes of fallswere insufficient joint support (37%) and excessive bolt spacing (27%). These were followed byweathering (12%), horizontal stress/weak roof rock (9%), bad mining (9%), burnt coal (4%), anddykes (2%). This is shown in Figure 5.
Size Distributions at Different Localities
0
10
20
30
40
50
60
70
80
90
0.25 0.5 0.75 1 1.25 1.5 1.75 2 5
Fall Height (m)
Mine BB Mine DD
Mine SS Mine TT
Fall density = 0,036/m Fall density = 0,023/m
Fall density = 0,017/m Fall density = 0,020/m
Figure 4. Comparison of the roof fall rates and size distributions of roof falls on the selectedmines.
5.2 Locality of All FallsNot surprisingly, it was found that the majority of all roof falls occurred at intersections, which wereresponsible for 66% of the total, shown in Figure 6. Bearing in mind that intersections account forapproximately 30% of the total exposed roof, it means that one is more than four times asvulnerable to a roof fall injury in an intersection than in a roadway. According to Molinda et al (1998)the roof fall rate in the USA is eight to ten times greater in intersections than in roadways.

9
Causes: All Falls
Spacing27%
Joints37%
Hor. Stress9%
Weathering12%
Burnt Coal4%
Dyke2%
Mining9%
Figure 5. Causes of all roof falls
Locality: All Falls
Intersection66%
Roadway34%
Figure 6. Localities of all roof falls
5.3 Timing of FallsThe timing of roof falls were tested against the timing of support installation. It was found, as shownin Figure 7, that the majority of falls – 68% - occurred after support had been installed and in 20 %of all cases, no systematic support was installed. In this classification of timing, the term “Nosupport” means that the roof was considered to be sufficiently stable by itself and no artificialsupport was installed. The term “Before support” means that systematic support was in fact used in

10
the area, but that the roof fell before the intended supports were installed. This is cause forconcern, indicating that the effort and cost incurred in supporting the roof were not effective. Thelarge proportion of roof falls in areas where no support was installed, indicates a lack of judgement.Analysing all roof falls as a single group may be misleading. The smaller falls mostly occurredbetween bolts with a different mechanism than the major falls. It was then decided to split thedatabase into smaller groups, with the following classification based on thickness of the falls:
Skin falls – less than 0, 3 m thickLarge falls – 0,31 to 1,0 m thickMajor falls – thicker than 1,01 m.
The size distribution is shown in Figure 8.
As the population of mapped falls is a good simulation of the population of falls that resulted infatalities, it is clear that the most important group is the “Skin” group, as it accounts for 62% of thetotal number of roof falls.
Timing of Fall: All Falls
Before12%
After68%
No Support20%
Figure 7. Timing of all falls

11
Size Distribution of All Falls
Skin62%
Large23%
Major15%
Figure 8. Size distribution of all falls.

12
6 Characteristics of Skin FallsMost of the skin falls occurred as falls with island bolts, like the example shown in Figure 9, or asfalls with free hanging bolts, as shown in Figure 10. According to van der Merwe (1998), the mostlikely causes of such falls are excessive bolt spacing and insufficient bolt tension. This should beseen in the context of roof rock strength and thickness of the layers. A spacing that is adequate atthe time of bolt installation, may not be sufficient after a long time of exposure when the roofmaterial has been allowed to weather. Also, there is no single correct bolt spacing, it primarily beinga function of the thickness of the individual roof layers.
Figure 9. Illustration of a roof fall with island bolts, indicating excessive bolt spacing.

13
Figure 10. Illustration of a fall with free hanging bolts, indicating insufficient tension orexcessive bolt spacing. This roof is now unsupported.
6.1 Causes of Skin FallsFigure 11 shows the breakdown of causes of Skin Falls. Excessive bolt spacing and joints togetheraccount for 68% of all these minor, yet most dangerous roof falls. An example of a Skin Fall causedby a joint is shown in Figure 12.
Causes of Skin Falls
Spacing37%
Joints31%
Hor. Stress8%
Mining11%
Weathering7%
Dyke4%
Burnt Coal2%
Figure 11. Breakdown of the causes of Skin Falls, showing the dominance of excessive boltspacing and insufficient joint support.

14
Figure 12. Example of a roof fall that was caused by insufficient joint support. The W-strapsin the photo were installed after the roof fall had occurred.
6.2 Localities of Skin FallsThe localities of skin falls is shown in Figure 13. It is seen that 71% of the falls occurred inintersections. If this is normalised for the relative area of intersections as opposed to roadways, itmeans that on an equal length basis, Skin Falls are four times more likely to occur at intersectionsthan in roadways.
Localities of Skin Falls
Intersection71%
Roadway29%
Figure 13. Localities of Skin Falls.

15
6.3 Timing of Skin FallsFigure 14 shows that 68% of Skin Falls occurred after support had been installed. In 19% of thecases, no support was installed and only 13% occurred before the installation of support. Ifeverything had been done correctly, there should be no falls after support had been installed.
Due to the inclusion of one old, abandoned area in the database, it may be argued that thedatabase is biased. It is possible that at the time of support installation, the support was in factadequate but that the roof rock lost strength due to weathering. Also, personnel are unlikely to workin abandoned areas. To test this argument, the Skin Falls were also analysed with the exclusion ofthe old mine case. This result is shown in Figure 15.
It is seen that the result is not significantly affected, as 72% of Skin Falls occurred after theinstallation of support. Therefore, it is concluded that roof support systems are not adequate toprevent the occurrence of Skin Falls. The most important issues to address to rectify this situationare bolt spacings, which should be smaller, and joint support.

16
7 Characteristics of Large FallsCompared to Skin Falls, Large Falls occur less seldom. The density of Skin Falls is 0,015 falls/m,while that of large falls is 0,006 falls/m. There are more than twice as many falls per metre in thethickness range 0 - 0,3 m than in the range 0,31 m to 1,0 m. An example of a LargeFall is shown in Figure 16.
Timing of Skin Falls
Before13%
After68%
No Support19%
Figure 14. Timing of Skin Falls relative to the timing of bolt installations.
Timing of Skin FallsOld Mine Excluded
Before14%
After72%
No Support14%
Figure 15. Timing of Skin Falls with the old mine case excluded from the database.

17
7.1 Causes of Large FallsAs Figure 17 indicates, Large Falls are also primarily caused by insufficient joint support andexcessive bolt spacing, although the relative proportion has come down to 49%. Excessive spacingof bolts is down to 10% while weathering has increased to 24% compared to 7% for Skin Falls.Insufficient joint support increased from 31% to 39%.
Figure 16. Example of a Large Fall that occurred after the installation of support caused byinsufficient joint support. The ellipse indicates the joint plane without support.
Causes of Large Falls
Spacing10%
Joints39%
Hor. Stress10%
Mining10%
Weathering24%
Burnt Coal7%
Dyke0%
Figure 17. Causes of Large Falls

18
7.2 Localities of Large FallsThere is a slight shift in the localities of large falls. Intersection falls are still in the majority, althoughthe relative proportion of intersection/roadway falls has come down to 61/39 from 71/29. Thebreakdown is shown in Figure 18.
Localities of Large Falls
Intersection61%
Roadway39%
Figure 18. Localities of Large Falls
7.3 Timing of Large FallsAs Figure 19 shows, the tendency for Large Falls to occur after the installation of support is stillapparent. There is no significant difference between the tendencies for Skin and Large Falls tooccur after support installation. 27% of the falls occurred where no support was installed and 12%before support was installed.

19
8 Characteristics of Major FallsMajor Falls occur less frequently than Skin and Large Falls, at a density of 0,004 falls/m. They arealso responsible for a smaller proportion of fatal accidents. An example of a major fall is shown inFigure 20.
8.1 Causes of Major FallsFigure 21 shows the breakdown of causes of Major Falls. Excessive bolt spacing is no longer oneof the primary causes, but insufficient joint support retains a dominant position, accounting for 50%of the falls. The second most frequent causes, horizontal stress and weathering, are smallercontributors at 14% each.
Timing of Large Falls
Before12%
After61%
No Support27%
Figure 19. Timing of Large Falls relative to the timing of support installation.

20
Figure 20. This fall was classified as Major. It occurred after support had been installed andwas classified as being caused by horizontal stress. It occurred in the vicinity of a dyke.
Causes of Major Falls
Spacing11%
Joints50%
Hor. Stress14%
Weathering14%
Burnt Coal11%
Dyke0%
Mining0%
Figure 21. Causes of Major Falls.
The prominence of weathering as a cause of roof falls may be due to the inclusion of an old mine inthe database. If those falls are excluded from the database, the relative contributions shiftsomewhat. This is shown in Figure 22.
Horizontal stress and excessive spacing then increase to 24% and 18% respectively, butinsufficient joint support is still dominant at 40%.

21
8.2 Localities of Major FallsAs Figure 23 indicates, even Major Falls tend to occur more frequently at intersections than inroadways, although the tendency is somewhat reduced. The intersection frequency is 54% and46% of Major Falls occurred in roadways. A Major Fall is thus almost three times as likely to occurin an intersection than in a roadway on an equal distance basis.
8.3 Timing of Major FallsAs expected, Major Falls occur more frequently than with skin or large falls after support had beeninstalled, see Figure 24. Major Falls are usually thicker than the length of roof bolts and bolting hasless effect. It was noticed that in most cases, additional support had been installed before the MajorFalls occurred, indicating that there was at least some indication that a problem could be expected.However, the additional supports were not always effective.
Causes of Major FallsOld Mine Excluded
Spacing18%
Joints40%
Hor. Stress24%
Burnt Coal18%
Dyke0%
Horizon0%
Weathering0%
Figure 22. Causes of Major Falls, excluding weathering.

22
Localities of Major Falls
Intersection54%
Roadway46%
Figure 23. Localities of Major Falls.
Timing of Major Falls
Before4%
After78%
No Support18%
Figure 24. Timing of Major Falls relative to the timing of support installation.

23
9 Discussion of Causes of Roof FallsTable 1 is useful to obtain an overview of the contributions of the identified causes of roof falls inthe different thickness categories.
% Contribution to…….CauseAll falls Skin Falls Large falls Major falls
Insufficient joint support 38 31 39 50Excessive bolt spacing 27 38 10 11Weathering 12 7 24 14Horizontal stress 9 8 10 14Bad mining 9 11 10 0Burnt coal 4 2 7 11Dykes 2 4 0 0
Table 1. Causes of roof falls for different thickness of falls.
This information is also shown in Figure 25. Inspection of the figure indicates that insufficient jointsupport and excessive bolt spacing can be considered major contributors to falls of roof, especiallyin the more frequently occurring thinner falls. It is by attending to these two causes that the greatestimprovement will be made to fall of roof accident rates. Insufficient joint support is a consistentlyhigh contributing factor, even increasing in importance for the thicker roof falls.
Horizontal stress, weathering and bad mining each contribute at around the ten percent mark toroof falls and should not be neglected. Horizontal stress tends to be a more frequent cause of majorroof falls, but is still less of a problem than insufficient joint support. Weathering is, as can beexpected, a more important cause of roof falls in older mines, especially where the immediate roofis a material that is prone to weathering like coal, shale or mudstone.
0
10
20
30
40
50
60
Join
ts
Spacin
g
Horizonta
l stre
ss
Wea
ther
ing
Bad m
ining
Dykes
Burnt
coal
Co
ntr
ibu
tio
n (
%)
All
Skin
Large
Major
Figure 25. Causes of roof falls seen against the background of thickness of roof falls.

24
10 Influence of roof rock qualityThe influence of roof rock quality was investigated by two methods, namely different rating systemsand laboratory testing. This was only done for Phase 1 of the investigation, where the falls wereinvestigated in greater detail.
10.1 Roof Rating SystemsThree rating systems were used, namely the Rock Mass Rating or RMR, Bieniawski (1980), theModified Rock Mass Rating or MRMR, Laubscher (1990) and the Coal Mine Roof Rating or CMRR,Molinda and Mark (1994).
It is postulated that miners often know when the roof quality deteriorates and that they then takesome form of action. Most often, they will reduce the road width. In that case, there should acorrelation between the rating systems and the road widths that were measured. This possibilitywas tested against the data for the roof falls that were investigated in Phase 1. The results areshown in Figure 26.
It is seen from the figure that the regression line between road width and the MRMR has a negativeslope, indicating a negative correlation. The other two rating systems both displayed positiveslopes, with R2 values of 0,44 and 0,52 for the RMR and CMRR systems respectively. It is notsurprising that the CMRR correlated better to the data, it having being developed specifically forcoal mine roof evaluation.
Mark (1999) reported on CMRR values for South African collieries. He visited a number of collieriesin the same geographical area that was investigated in Phase 1 of this investigation and reportedCMRR values in the range 45 to 87, average 66. His data was not gathered at roof fall sites andcan be seen as representing “healthy” roof. The ratings found in this investigation, performed atroof fall sites, were in the range 8 to 55, average 31, which are considerably lower.
This indicates that although it was developed for USA coal mines, the CMRR has at least somemerit for application or further development in South Africa.
Correlations Between Road Width and Rating Systems
R2 = 0.4386
R2 = 0.2528
R2 = 0.5181
0
10
20
30
40
50
60
70
80
4 4.5 5 5.5 6 6.5 7 7.5
Road Width (m)
Rat
ing
Nu
mb
er
RMR
MRMR
CMRR
Linear (RMR)
Linear (MRMR)
Linear (CMRR)
Figure 26. Test of correlation between the rating systems and road width.

25
Mark (1999) also reported on the correlation between the CMRR and a factor representing theamount of support installed in a mine roof, the PSUP. The PSUP is based on the spacing, lengthand capacity of bolts and road width; the higher the number, the greater the amount of support.Figure 27 is compiled from Mark (1999). Even though based on limited South African data, thefigure is clear: in South African collieries, less support is used for comparable roof conditions thanin either the USA or Australia. This supports previous conclusions that in South African collieries,the density of supports needs to be increased.
10.2 Roof Rock StrengthRock samples were collected from a number of the fall sites, primarily those that were investigatedduring Phase 1 of the investigation. The following laboratory tests were conducted:Uniaxial compressive strengthPoison’s ratioModulus of ElasticityUniaxial tensile strengthDirect shear strength
PSUP vs CMRR
0
10
20
30
40
50
60
70
80
90
100
0 0.1 0.2 0.3 0.4 0.5 0.6
PSUP
CM
RR
RSA Data
USA Data
Australian Mines
South African Mines
Figure 27. Comparison of the amount of support installed for comparable roof conditions inSouth Africa, the USA and Australia, after Mark (1999).

26
Sandstone UCS
0
10
20
30
40
50
60
70
80
90
Mine A Mine AA Mine C Mine O Mine E Mine O
Un
iaxi
al C
om
pre
ssiv
e S
tren
gth
(M
pa)
Horizontal Stress
Horizontal Stress
Oversize Intersection
SlipsHorizontal Stress
Small falls"Normal" average value
Figure 28. UCS values that were obtained from roof sandstone samples collected at the fallareas.
10.2.1 Uniaxial Compressive Strength of Sandstone (UCS)The UCS values for sandstone ranged from less than 40 MPa to 80 MPa, see Figure 28. This isless than the “normal” average value of approximately 75 MPa and indicates a reducedcompressive strength in the fall areas.
The causes of the falls that were determined by the investigating team are also indicated on thefigure. It is significant that the falls that were categorised as having been caused by horizontalstress had the lowest UCS of all the samples. This confirms that horizontal stress is more likely tobecome a problem in areas with reduced strength.
10.2.2 Modulus of Elasticity of Sandstone (E)Figure 29 shows the E values that were obtained from the set of samples, again seen against thebackground of the diagnosed causes of the roof falls.

27
Sandstone Modulus
0
2
4
6
8
10
12
14
16
18
Mine A Mine AA Mine C Mine O Mine E Mine O
Un
iaxi
al M
od
ulu
s (G
Pa)
Horizontal Stress
Horizontal Stress
Oversize Intersection
Small falls
Slips
Horizontal Stress
"Normal" average value
Figure 29. Modulus of Elasticity of sandstone samples from the fall areas.
The previous observation that the “horizontal stress falls” are characterised by reduced numbers, inthis case stiffness, is repeated here. With the exception of one case, all the stiffness values arebelow the “normal” value of 13 GPa.
10.2.3 Shear Strength of SandstoneThe shear strengths of the sandstone samples are shown in Figure 30 in similar format as theprevious two figures. The reduction in strength is again apparent, the “normal” shear strength ofsandstone being approximately 15 GPa. All the samples had reduced strength, the greatestreduction again being apparent from the samples where horizontal stress was the dominant causeof the roof falls.
10.2.4 Uniaxial Tensile Strength (UTS) of Shale/MudstoneCuriously, the Shale/Mudstone samples, shown in Figure 31, did not suffer the same shear strengthreduction as the sandstone samples. However, the “horizontal stress” samples are again at the lowend of the range.

28
Sandstone Shear
0
2
4
6
8
10
12
Mine C MineAA
MineAA
MineAA
Mine A Mine E Mine O MineAA
Mine O
Sh
ear
Str
eng
th (
MP
a)
Horizontal Stress
Horizontal Stress
Oversize Intersection
Small falls
Slips
Horizontal Stress
Small falls Small falls
Small falls
Figure 30. Shear strength of the sandstone samples.
10.2.5 Uniaxial Tensile Strength (UTS) of SandstoneThe UTS of the sandstone samples were obtained by performing the standard Brazilian strengthtest. The results are shown in Figure 32. In this case, there is no general strength reduction,although the “horizontal stress” samples maintain their consistent position at the low end of thescale.

29
11 Role of Support MaterialThe quality of support material was found to be a possible problem in isolated cases. In two cases,bolts that had been rejected by major companies with in house testing facilities were found at thesites of roof falls on small mines without those facilities. While it could not be proven that the inferiormaterial caused the falls, it is suspected to have contributed.
In two other cases, suspicious lengths of cut-off cable were found in places where cable anchorshad been installed by outside contractors. The lengths of the cables to be installed are usuallyspecified by contract and are delivered in the correct length. There is no reason to cut cable to therequired length underground. However, it was not possible to retrieve full lengths of installed cablesfrom the fall debris to check the installed length of the cables.
Mudstone/Shale Shear
0
2
4
6
8
10
12
Mine B Mine A Mine B Mine E Mine D
Sh
ear
Str
eng
th (
MP
a)
Horizontal Stress
Horizontal Stress
Oversize Intersection
Major Slip
Horizontal Stress
"Normal" average value
Figure 31. Shear strength of Mudstone/Shale samples

30
Sandstone UTS
0
2
4
6
8
10
12
Mine A Mine AA Mine E Mine C Mine E Mine O
Un
iaxi
al T
ensi
le s
tren
gth
(M
Pa)
Horizontal StressHorizontal Stress
Oversize Intersection
Small falls
SlipsHorizontal Stress
"Normal" average value
Figure 32. Uniaxial Tensile Strength of the sandstone samples.

31
12 Discussion and Conclusions
12.1 Most Fatalities Are Caused By Thin Roof FallsThe majority of fatalities in South African collieries is caused by relatively thin slabs of roof rockfalling out between bolts. More than 70% of the roof falls are less than 0,5 m thick. The frequencyof fatal roof falls diminishes rapidly as the thickness increases. The database of falls that wereinvestigated, is a good simulation of the database of fatal roof falls.
12.2 Characteristics of Roof FallsViewing all roof falls, irrespective of thickness, the dominant causes are insufficiently supportedjoints and bolt spacings that are too wide. Together, these two causes account for 64% of all rooffalls. This is followed by a number of contributory causes, namely weathering, horizontal stress andbad mining, each contributing around 10% to the total. Burnt coal and dykes can be considered asminor causes.
Roof falls occur predominantly at intersections where 66% of the total falls occurred, the remaining34% occurring in roadways. This implies that workers are approximately four times as vulnerable toroof falls in intersections than in roadways.
Almost 70% of all falls occurred after support had been installed, just over 10% before support hadbeen installed and in 20% of the cases no support had been installed.
Slightly different patterns were found for three thickness ranges of roof falls, namely skin falls (up to0,3 m thick), large falls (between 0,31 m and 1,0 m thick) and major falls (thicker than 1,0 m). Thedominance of insufficiently supported joints increased with increasing fall thickness while excessivebolt spacing became less important as a cause of roof falls. Horizontal stress combined with weakroof rock increased as a contributor with increasing fall thickness, being responsible for 14% ofmajor roof falls.
Intersections are the most popular location for roof falls in all size categories, although there is arelative shift in favour of roadways with the thicker falls.
In all categories, the majority of falls occurred after support had been installed, indicating theinadequacy of the support systems. It would appear that the bolts are too widely spaced to preventthin falls between bolts and that the systems are unable to bear the weight of the major falls. Bothof these problems can be addressed by installing bolts on a denser pattern.
12.3 Inadequate Joint Support Is The Most Frequent Cause OfRoof Falls
Despite several years of attention to the support of joints, lack thereof continues to be the singlemost frequent cause of roof falls in all thickness categories. Whether the solution lies in training,awareness or enforcement is not the subject of this investigation, which is only aimed atestablishing the causes of roof falls.
There are several well publicised methods to support joints but they were simply not found to havebeen implemented underground. In a number of cases, when unsupported joints were pointed outto underground personnel, some reactions were that that particular joint was a stable one and

32
would not fall, that it was too far from the face to be re-supported, that there was insufficient labourto do it or that if all joints had to be supported the roof would fail under the weight of the steel.
If individuals who intentionally move in under unsupported roof can be dismissed while theyendanger only their own lives, then surely the same drastic method of enforcement can be appliedto personnel who neglect to support joints, thereby endangering the lives of several other people.
Figures 33 and 34 are further examples of unsupported joints.
Figure 33. Even though this roof has been re-supported after a fall, the joint is still notadequately supported.
Figure 34. Unsupported joint that resulted in a major fall.

33
12.4 Bolt Spacing Is Too WideThe second most frequent cause of roof falls in all categories was found to be excessive boltspacing. As a result of excessive spacings, a major cause of skin falls is dislodgement of relativelythin roof plates between and around bolts, like the example shown in Figure 35. A secondconsequence is that bolts are unable to sustain the weight of larger falls, as shown in Figure 36.
Figure 35. Skin fall caused by failure between bolts that were spaced too widely.
Figure 36. Major fall that was caused by a bolt system failing at the weakest link, the resincontact. A denser bolt spacing would have prevented this fall.

34
It was also indicated that in South Africa, less bolts are used for comparable roof conditions than inthe USA and Australia. Although this indication is based on limited data, it conforms to visualobservation over several years.
This problem can be overcome by increasing the density of bolts or by applying some form of arialcover - see Bauer and Dolinar (2000) - like wiremesh, wider head plates, synthetic material mesh,spray-on membrane or even the “safety net” that is under development for use in gold mine stopes.Addressing this problem will also alleviate the problem of inadequate joint support.
12.5 Under Performance of Support Material Is Not a MajorProblem But Should Not Be Tolerated At All
While under performing materials were only found in isolated cases, the frequency should be zero.The fact that material that was known by the supplier to be sub standard was found at two smallmines without the benefit of a full time rock engineering practitioner, was disturbing.
In two other areas, cable cut-offs that were found at the sites of collapses raised suspicion butcould not be proven to have contributed to the fall because it was not possible to determine thelengths of cables that were installed. Figure 37 shows one of the cable cut-offs.
In one fall, it was found that the nuts had stripped off the bolts, shown in Figure 38, resulting in amajor fall of roof. The thread should not be the weakest part of the bolt assembly. It is suspectedthat in this case, either the diameter of the thread was too small or the diameters of the nuts weretoo wide.

35
Figure 37. Was the fall in the background caused by cutting lengths off cable anchors likethe one shown in the photograph?
Figure 38. The smooth appearance of the thread on this bolt was due to the nut havingstripped off on it.

36
The use of sub standard material can be prevented by implementing a regular and scientificallydesigned testing procedure on all mines. This is a requirement of the Guidelines for the Compilationof Codes of Practice to Prevent Rock Related Accidents on Collieries, but it is not alwaysimplemented.
When appointing sub contractors for special support installation, price should not be the onlyconsideration. There should also be strict supervision during the construction process.
12.6 Weathering Is Not a Major Cause of Roof Falls In YoungMines
In the single old section that was investigated, weathering was found to be the dominant cause ofroof falls. In other cases, it played a minor role. However, there were often signs of Acid MineDrainage (AMD) at roof falls, even in younger mines. It is recommended that roof rocks’susceptibility to acid attack be evaluated.
12.7 Burnt Coal, Dykes And Bad Mining Are Relatively MinorContributors to Roof Falls.
Burnt coal and dykes are known hazards in coal mining. Perhaps for that reason, dyke areas andthe surrounding burnt coal areas are usually well supported.
Under the category of “Bad mining” are included matters like poor horizon control with continuousminers, misdirected blast holes in conventional mining and patently wrong mining like breakingintersections away underneath obvious joints. The incidence of this was found to be low in theinvestigation. However, it did occur, and where it did, it tended to persist for long distances. Thismay indicate development by a less disciplined crew.
12.8 Horizontal Stress Signs Coincided with Weak RoofMaterial.
It has often been said that failure of anything, a mine roof included, is the result of an imbalancebetween the load on the object and its strength. Therefore, for roof failure to occur there are alwaystwo matters to be considered, namely the strength of the roof material and the stress acting on it. Itis misleading to consider only one of the two sides of this equation.
There has been a recent trend in South Africa to over emphasise the role of horizontal stress incolliery roof failures. What this investigation found, is that the areas where horizontal stress wasdeemed to have been the major cause of roof falls, were also characterised by significantweakening of the roof material.
The conclusion reached from this is that even where the magnitude of horizontal stress is low, itmay result in failure in areas where the roof material is weak. Therefore, under the conditions ofrelatively shallow coal mining as in South Africa, the problem is not as much the magnitude of thestress as the local strength reduction of the roof material.

37
Fortunately, it is easier to monitor the strength of the roof than it is to monitor the magnitude of thestress. There are several ways to monitor the roof strength, including laboratory tests, simple onsite point load tests, splitter index tests on core, etc.
The incidence of roof falls due to the manifestation of horizontal stress signs was relatively low.Where it was apparent, the falls tended to be major ones.
38
ReferencesBauer, R. and Dolinar, D. (2000). Skin Failure of Roof and Rib and Support Techniques inUnderground Coal Mines. Proc. New Technology for Coal Mine Roof Support. NIOSH IC9453.
Bieniawski, Z.T. (1976). Rock Mass Classification in Rock Engineering. Proc Symp Exploration forRock Engineering, Ed Z.T. Bieniawski. AA Balkema, Cape Town.
Canbulat, I and van der Merwe, J.N. (2000). Safe mining face advance and support installationpractice in mechanical miner workings under different geotechnical conditions. Safety in MinesResearch Advisory Committee, Department of Minerals and Energy, Johannesburg, South Africa.March 2000.
Canbulat, I. and Jack, B. (1998). Review Of Current Design Methodologies To Improve TheSafety Of Roof Support Systems, Particularly In The Face Area, In Collieries. Safety in MinesResearch Advisory Committee, 1998.
Jack, B. (2000). Roof Behaviour in South African Coal Room and Pillar Panels. 19th Conference onGround Control in Mining, Morgantown, West Virginia.
Laubscher, D.H. (1990). Geomechanical Classification System for the Rating of the Rock Mass inMine Design. South Afr. Inst. Min. Metall. Volume 10 1990 pp 257 – 273.
Mark, C. (1999). Ground Control in South African Mines – a US Perspective. 18th Conference onGround Control in Mining, Morgantown, West Virginia.
Mark, C. and Molinda, G. M. (1994). Evaluating Roof Control in Underground Coal Mines With theCoal Mine Roof Rating. 13th Conference on Ground Control in Mining, Morgantown, West Virginia.
Moebs, N. and Stateham, R.M. (1986). Coal Mine roof Instability: Categories and Causes. UnitedStates Bureau of Mines IC 9076.
Molinda, G., Mark, C., Bauer, E., Babich, D. and Pappas, D. (1998). Factors InfluencingIntersection Stability in US Coal Mines. 17th Conference on Ground Control in Mining, Morgantown,West Virginia.
Molinda, G.M, Mark, C. and Dolinar, D. (2000) Assessing coal Mine Roof Stability Through RoofFall Analysis. Proc. New Technology for Coal Mine Roof Support. NIOSH IC9453.
Van der Merwe, J.N. (1998) Simple User’s Guide to the Installation of Resin Roofbolts. Safety inMines Research Advisory Committee, Department of Minerals and Energy, Johannesburg, SouthAfrica. March 1998.
Vervoort, A. (1989). A Review of Fall of Ground Fatalities in South African Collieries During thePeriod 1970 – 1988. Sangorm Symposium: Advances in Rock Mechanics in Underground CoalMining. South African National Group on Rock Mechanics.
Vervoort, A. (1989). Support Design in Coal Mine Roadways and Intersections. SangormSymposium: Advances in Rock Mechanics in Underground Coal Mining. South African NationalGroup on Rock Mechanics.
Vervoort, A. and Jack, B. (2000). Three-Dimensional Simulations of the Roof Behavior in CoalRoom and Pillar Panels. 19th Conference on Ground Control in Mining, Morgantown, West Virginia.

39
Appendix I - Individual site investigation reports
Case A Summary: Dimensional imbalance
Mine locality: Highveld coalfield
Seam: No 4
Mining method: Bord and pillar with 70o turn-off (Joy 12HM31 with continuous haulage). Pillarcentres in direction of roadways were 28 m, road widths nominally 7,2 m.
Mining depth: 120 m
Mining height: 2,9 m
General description of roof: Sandstone beds (0,28 and 0,15 m thick) separated by laminated shale.Shale content of fall 82%. In general, beds varied in thickness from 4 to 30 cm – see Figure 1.
Figure 1. Illustration of the laminated nature of the roof. Note the variation in thickness ofthe light sandstone layer at the bottom of the roof.
Discontinuities present: Small joints, possibly inconsequential
Sandstone MRMR: 28
Sandstone hydraulic radius: 8 m
Sandstone UCS: 7,4 MPa

40
Shale MRMR: 19
Shale hydraulic radius: 2,3 m
Shale UCS: 4,3 MPa
Combined CMRR: 40 (Weak roof)
Combined MRMR: 19
Combined hydraulic radius: 10 m
Combined UCS: 4,1 MPa
Time of fall: Several weeks after development
Supported/unsupported: Supported, after beds had separated.
Support: 1,5 m M20 Ausbar full column dual speed resin, 25 mm holes, 4 bolts per row 2 m apart.
Cut-out distance: According to standard 16 to 24 m depending on roof conditions. Managerprefers 18 m. Uncertain what it was at fall position.
Support quality: Good
Monitoring: Tell tales in general area, none found at fall position. Tell tales on mine are 1,8 m long,no marks found in roof after fall (1,6 m high), assumed there was no tell tale at fall position.According to mine overseer no warning signs day before fall.
Locality: Intersection
Horizontal stress indicators: Non detected
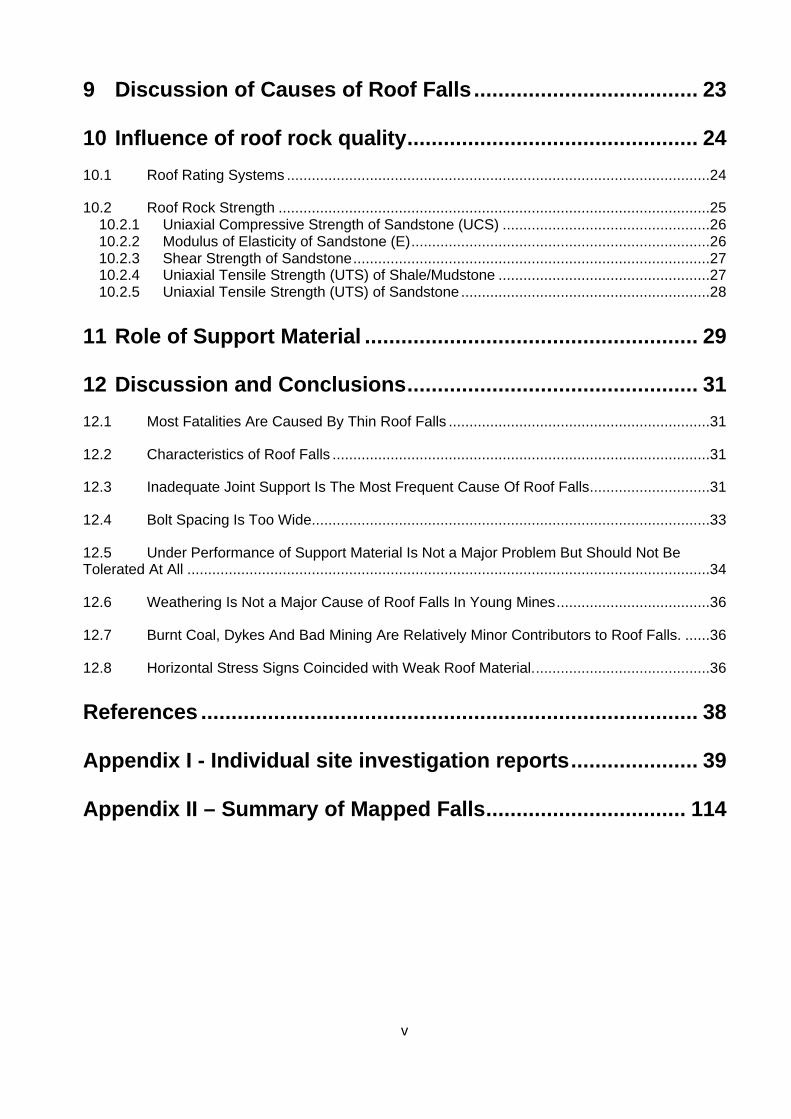
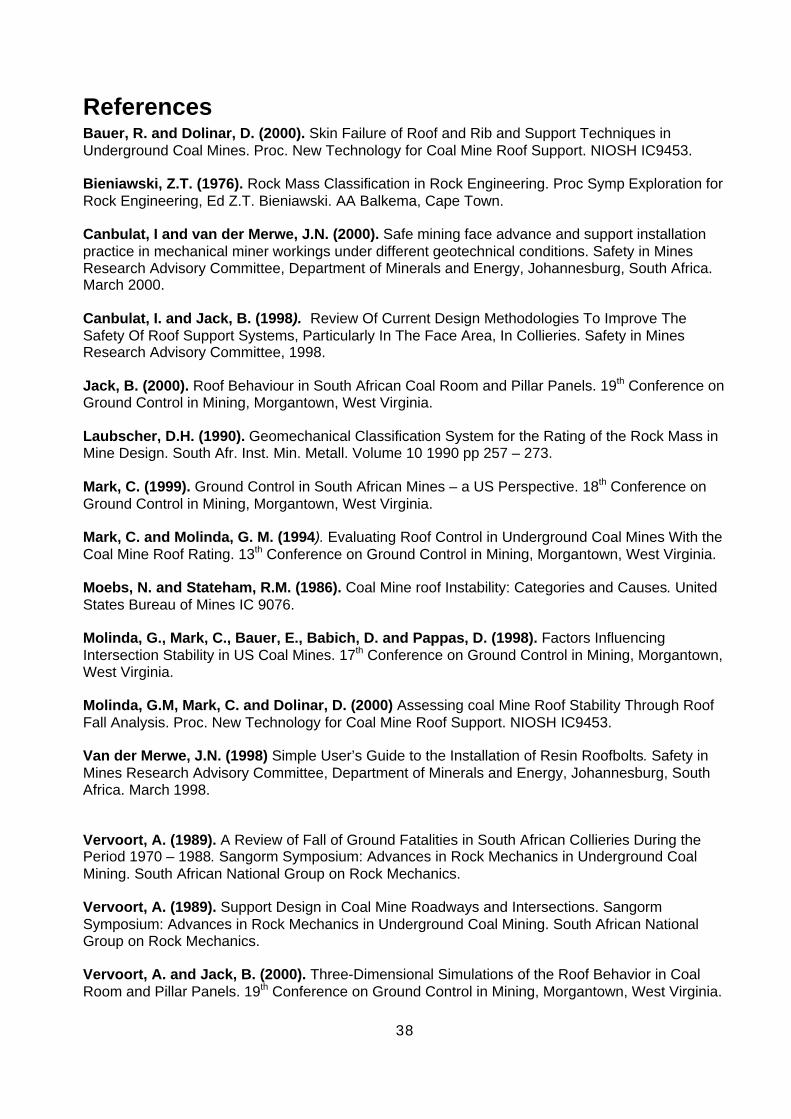
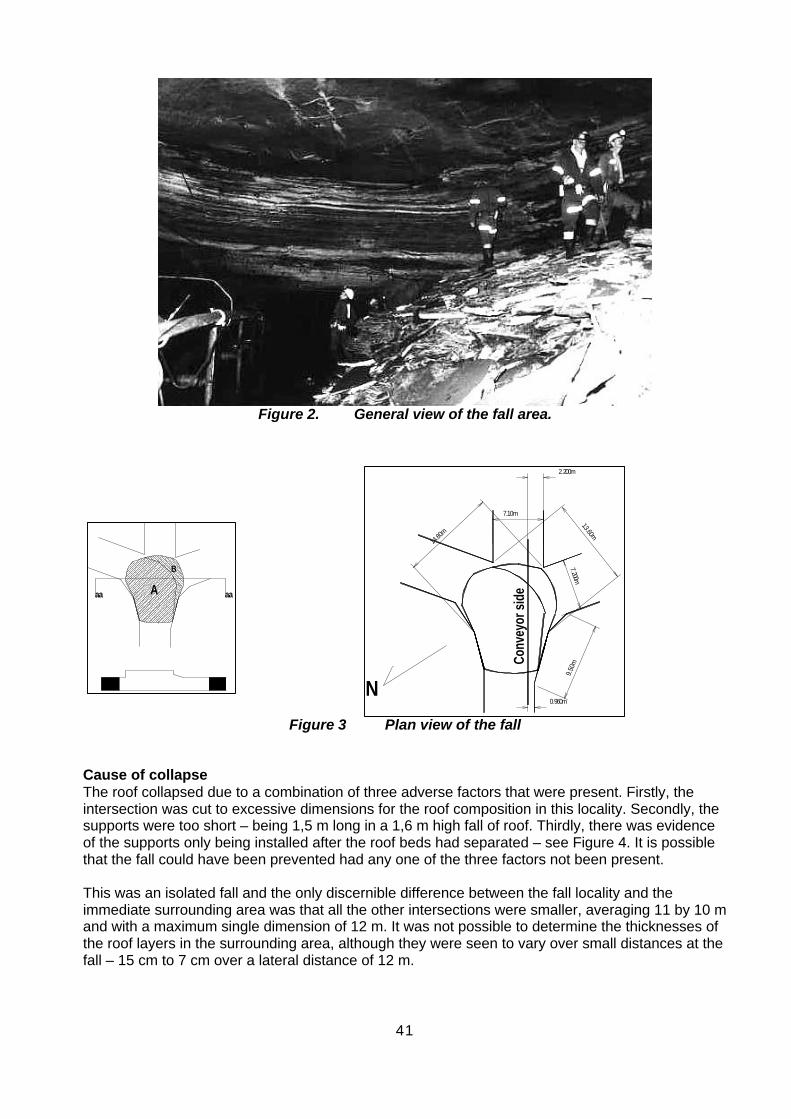
General description of fall: Intersection fell to height of 1,6 m, lateral dimensions 14,8 m by 13,6m. Area of fall 155 m2 – see Figures 2 and 3.
41
Figure 2. General view of the fall area.
Figure 3 Plan view of the fall
Cause of collapseThe roof collapsed due to a combination of three adverse factors that were present. Firstly, theintersection was cut to excessive dimensions for the roof composition in this locality. Secondly, thesupports were too short – being 1,5 m long in a 1,6 m high fall of roof. Thirdly, there was evidenceof the supports only being installed after the roof beds had separated – see Figure 4. It is possiblethat the fall could have been prevented had any one of the three factors not been present.
This was an isolated fall and the only discernible difference between the fall locality and theimmediate surrounding area was that all the other intersections were smaller, averaging 11 by 10 mand with a maximum single dimension of 12 m. It was not possible to determine the thicknesses ofthe roof layers in the surrounding area, although they were seen to vary over small distances at thefall – 15 cm to 7 cm over a lateral distance of 12 m.
A
B
aa aa
7.200m
0.960m
2.200m
13.60m
14.80
m
7.10m
9.50
mConv
eyor
sid
e
N

42
Figure 4. The white material on the roof next to the top end of the bolt is resin,indicating that the bolts were only installed after the roof layers had separated.
There were 18 other intersection falls in the wider area that was not visited. These occurred over atraverse of several hundred metres and were not inspected. There were no other falls within 200 mof the inspected one.
The roof composition is given, but the length and spacing of supports, the time of supportinstallation and the mining dimensions are controllable. Roof stability is achieved by combining thecontrollable parameters in such a way that the disturbing forces in the roof do not exceed thestrength of the material, or by containing the failed material and preventing it from falling.
Effect of dimensionsThe tensile stress generated in a roof is directly proportional to the square of the minimumdimension. Therefore, in this case, the tensile stress generated in the roof was 44% greater thanthat at any of the other intersections in the area.
Effect of bolt lengthLonger bolts would have been able to suspend the roof, even though the roof material had failed.Assuming a bolt density of 3 m2 per bolt and 25 mm hole diameters, bolts of 1,8 m length wouldhave suspended this roof.
Effect of time of support installationIf the support can be installed before the beds separate, it is possible to combine the layers into athicker plate. The tensile stress generated in a roof is inversely proportional to the beam thickness.There was evidence that the beds had already separated by the time the bolts were installed (seeFigure 4) and therefore the roof behaved like a number of independent plates rather than a thicker,single one. Because of this, the generated tensile stress was more than twice as high as it couldhave been, had the bolts been installed sooner.
Conclusion

43
This fall occurred because there was an imbalance between the thicknesses of the roof layers, thesize of the intersection and the length of the bolts.
Given the circumstances, the most important immediate controllable factor was the intersectionsize. However, against the background of:
• unknown roof composition but seen to be variable,
• mining method that often results in large intersections to accommodate the continuous haulage,and
• the other 18 falls that had occurred with the same equipment in the same traverse,
The simplest prevention would have been to install 1,8 m long bolts.

44
Case B Summary: Slips
Mine locality: Highveld Coalfield
Seam: No 4
Mining method: Double header 16 road bord and pillar with Joy 12HM17 and 12HM21 continuousminers, right hand side 2 lines ahead. Road width was 6.6 m.
Mining depth: 57 m
Mining height: 4.5 m
General description of roof: 15 to 60 cm fine grained muddy sandstone (also logged as finegrained sandstone with sandy mudstone) followed by +/- 2 m of mudstone with sandy mudstonewith a thin (15 cm) sandstone layer at the base. Note: the mine geologists do not distinguishbetween mudstone and shale.
Discontinuities present: A thin dyke (0.5 m) is still to be exposed where the falls occurred and hasbeen exposed by the leading roadways to the right. A major slip, vertical displacement 0.5 m, withsympathetic smaller slips was present at the major fall site.
Time of fall: During shift, as CM was in the process of pulling back.
Supported/unsupported: Unsupported
Support: M16 x 1.5 m mechanical anchors, 3 per row at 2 m spacings close to the fall, elsewhere 2bolts per row at 2 m row spacing.
Cut-out distance: 25 m
Support quality: Medium to good
Monitoring: None
Locality: Intersection with major slip
Horizontal stress indicators: None

45
Figure 1 Diagram showing the positions of the two falls and the cutting sequence.
General description of fall: The fall positions and mining sequence are shown in Figure 1. Therewere two falls. The thin one was approximately 0.1 m to 0.3 m high by 11 m by 7 m (77 m2), eitherside of a small slip with approximately 0.1 m displacement. The exposed roof above showed signsof dampness but there was no free flowing or dripping water, see Figure 2.
The thick fall, shown in Figure 3, was approximately 0.5 m high by 12 m long and on average 4 mwide (48 m2). It occurred on the weak side of the major slip. On the previous shift, the slip wasuncovered in the roadway. The second lift was then not cut, in order to stabilise the slip. The splitwas then cut from left to right, through the slip and beyond to hole in the next roadway. As the CMpulled out, the roof collapsed. The fall occurred between the position where the exposed weak sideof the slip was approximately 3 m wide to where it disappeared into the ribside.
Cause of collapse
The small fall occurred prior to support being installed in an area where the nether “sandymudstone” was thin. The minor slip running through the fall was sufficient to split the beam into two
Strong
Strongside
Weak
Weak
Thick fall
Thin fall
12
34 5

46
cantilevers. Without the presence of the slip, the maximum tensile stress at the edges of the beamwould have been:
t
L
2
2γσ = [B.1]
where γ = unit weight of rockL = length of beamt = thickness of beam,
or approximately 3 MPa. However, with the slip in place, the clamped beam became a cantilever,with maximum tensile stress:
t
Lc
23γσ = , [B.2]
or approximately 18 MPa, which is more than the tensile strength of about 5 MPa.
At the position of the large fall, the bottom layer had become substantially thicker and thus stronger.Once again, however, the slip turned the beam into a cantilever.
At the far end of the split, where the fall started, the entire road width was on the weak side of theslip. At a beam length of 6.6 m, the generated tensile stress was approximately 6 to 7 MPa which isjust greater than the tensile strength. The fall then occurred, the plate breaking back dynamically towhere the beam length was about 3 m.
Where the slip was first exposed in the roadway, it’s strike was parallel to the split. When the splitwas then cut, the CM operator possibly assumed that it would maintain a
Figure 2 Detail of the roof of the thin fall.

47
Figure 3 Overall view of the thick fall
constant direction. He may not have been able to see that it had turned closer to the left-handribside.
The split was followed in other roadways across the section, where it had not resulted in a fall, seeFigure 4. In all the other positions, it either daylighted in a roadway (in other words, crossing theexcavation as opposed to running along it) or had a short exposed weak side. It was also wellsupported, indicating that personnel had become wary of it.
Figure 4 Sketch plan showing the continuation of the slips through the section.
Conclusion
Both of these falls are fully explained by the presence of the unsupported slips, changing the basicbehaviour of the roof to that of a cantilever with the accompanying drastic increase in tensile stress.

48
Prevention
The fall could have been prevented if the slip had been supported at short intervals, i.e. by reducingthe cut out distance. On this mine, it was seen that operator awareness of roof hazards was at ahigh level – yet they were possibly lulled into a false sense of security when the slip did not fall afterits initial exposure.

49
Case C Summary: Poor support and directional control in weak roof,complicated by horizontal stress.
Mine locality: Witbank Coalfield
Seam: No 2
Mining method: Continuous miner bord and pillar, 9 road section operating as two sectionsfeeding onto a common belt, the right hand 4 roads leading by one split.
Mining depth: 47 m.
Mining height: 2 – 2.5 m, following the seam height. Numerous floor rolls, restricting mining heightat short intervals.
General description of roof: Bottom roof is 1.0 to 0.9 m thick laminated coaly shale andsandstone bands, average 0.2 m thick, overlain by jointed weathering shale, see Figure 1. Severaldiscontinuous sandstone lenses (more like brecciated plates) in roof, shown in Figure 2.
Discontinuities present: Numerous flatly dipping slips (see Figure 3) affecting the bottom 1.5 m ofroof. Average trace length 12 m. Prominent slip at fall position, 20 m long, 30o dip, rough undulatingsurface.
Roof CMRR: 31 (zero stand up time)
Roof MRR: 61 (1 month stand-up time)
Roof UCS: 18 MPa (DRMS)
Roof MRMR: 25 (Unstable)
Internal Angle of Friction: 30o – 35o
Cohesion: 100 – 150 kPa
Time of fall: Between shifts.
Supported/unsupported: Supported.

50
Figure 1 Laminated nature of the roof.
Figure 2. Discontinuous sandstone remnant in the roof, arguably the result ofdifferential settlement of the floor of the seam.

51
Figure 3. Dense pattern of flatly dipping joints.
Support: 1.5 m long 14 mm twisted square bar in 22 mm holes, semi-full column resin (1.0 manchor as per standard). Pattern 3 bolts per row spaced 1.5 m, first lift 8 m long supported beforesecond lift is cut. At fall and most other slips, 1.8 m long by M16 rebar full column resin was used atdense (< 1 m) spacing. Headboards were common.
Cut-out distance: 8 m.
Support quality: Poor. Holes either over drilled or not enough resin capsules used, resulting inanchors only being 1.0 to 0.4 m long. Insufficient tension observed on several bolts (loosewashers). Number of bolts with stripped nut thread on them found at fall. (Note: similar to previousexperience with twisted square bar. Grooves run through threads, which misalign when torqueapplied to bolt, impeding crimp nut passage, excessive torque on bolt which develops micro steelfractures, fails at low loads later. Alternatively, thread on nuts stripped off. Suppliers informed ofproblem several years ago. )
In general, the directional control over drivage was poor resulting in irregularly sized pillars andintersections see Figure 4.
Monitoring: None
Locality: Intersection

52
Figure 4. Mine plan of the general area in which the fall occurred.
Horizontal stress indicators: Sporadic horizontal stress indicators evident, see Figure 5, sufficientto determine direction of maximum to be NW-SE. No stress indications within two pillars of fall (20m) and no over thrusting or other horizontal stress indicators seen in sides of fall.
Figure 5. One of the sporadic occurrences of guttering.
General description of fall: The fall was approximately 1.4 m high in an intersection that was oversized (8.5 m x 10.5 m) due to a corner of a pillar being cut out, see Figure 6. Figure 7 is a generalview of the fall. Two slips intersected in the central region of the fall.

53
Figure 6. Sketch of the fall. The following dimensions were measured at the fall:
A = 10.5 m , B = 8.4 m , C = 5.9 m, D = 3.0 m, E = 2.7 m, F = 6.1 m, G = 6.1 m.
Figure 7. General view of the fall
Cause of collapse
This roof was at the lower extreme of South African roof conditions, comparable with “poor” roof inthe USA. Under the circumstances, a dense, stiff support system would have been moreappropriate, coupled with strict control over mining directions and dimensions.
The contribution of the horizontal stress indicators could not be established. Given the flatly dippingslips, it must have played a role in destabilising the roof at the slip positions, even though it isassumed that the magnitude was not very high. With roof as weak as was observed, even amoderate stress would have resulted in more damage than was observed. But whether the fallwould have occurred without any horizontal stress at all is also possible.
A
B
C
DE F
G
H

54
The headboards per se did not contribute to the fall, rather, conditions would have been worsewithout their additional areal coverage. Over the longer term, as the timber deteriorates, they mayhave a negative influence, but over the short term they are better than merely using steel washers.
Conclusion
It is concluded that this fall was due to poor support, poor directional control and possibly substandard support materials under the conditions of a weak, flatly jointed roof with the addedcomplication of horizontal stress.

55
Case D Summary: Fall 1 unsupported slip, Fall 2 well installed butincorrect type of support.
Mine locality: Witbank Coalfield
Seam: No 2
Mining method: Conventional bord and pillar followed by selective top coaling.
Mining depth: 75 m
Mining height: Initially +/- 3.5 m, after top coaling 4.5 m to 6.5 m.
General description of roof: Coal of varying thickness (0 to 2 m) followed by 0.5 to 1.0 m ofalternating shale/sandstone bands of 10 to 30 cm thickness, then laminated shale.
Discontinuities present: Number of calcite filled continuous NW-SE striking slips spaced 15 –20m apart. Numerous shorter NW-SE striking joints, spacing varied from 2 m too less than 0.5 m.
Time of fall: Unknown. Area was mined +/- 20 years ago.
Supported/unsupported: Fall 1 was not supported, fall 2 was supported.
Support: 1.5 m M16 mechanical anchors.
Cut-out distance: Unknown, but as the mining method was drill and blast, not more than 2 m.
Support quality: Good at time of installation.
Monitoring: None
Locality: Fall 1 at an intersection, fall 2 intersection and roadway.
Horizontal stress indicators: None
General description of falls
Figure 1 is a plan view of the falls.
Fall 1: Wedge shaped at intersection against slickensided joint, see Figure 2. Fall height appearedto be 0.5 m. It could have been more than a metre on one side, although the higher area on thesouthern side was where the top coaling stopped. The extra height may have been top-coaled andnot fallen.

56
Figure 1 Plan view of the two falls.
Figure 2. View of the slip that bounded Fall 1 on the northern side.
10.500m
9.700m
6.200m
3.500m
4.500m
3.000m
11.100m
Area =2
N
First
Second

57
Fall 2: Fall 2 covered a wide area, interspaced with top coaling. The fall height was exactly 1.5 m,the length of the bolts. Each bolt position could be seen, indicated by brown circular discoloration,see Figure 3. The bolts appeared to have been well tensioned, indicated by the rock columns ontop of washers, shown in Figure 4.
One of the fallen rocks contained a roofbolt hole. Radial stress fractures emanated from the holeposition, shown in Figure 5, indicating that at the time of installation the expansion of the anchorresulted in a localised stress that exceeded the compressive strength of the shale.
Cause of collapseFall 1 was caused by the slip resulting in a cantilever. It was possibly triggered by blasting duringthe top coaling operation. It had the appearance of being aided by horizontal stress, but no otherindications of horizontal stress could be found. In the soft roof, such signs should have been visibleif the horizontal stress had been higher than normal.
Fall 2 appeared to have been caused by the bolts. It is postulated that the mechanical anchorscaused stress fracturing at the ends of the holes when they were expanded. The bolt density wasseen to have been dense (less than a metre spacing in places) and over time resulted in a plane offracturing at the anchor horizon. Rust marks on the roof indicate that water was also present, or atleast that moisture accumulated in the minute openings caused by the stress fracturing. Eventuallya loose layer was formed with the upper boundary at the anchor horizon and the collapse occurred.
The collapse may have been aided or even initiated by the top coaling operations in the section.That this collapse was not part of the top coaling mining operation, is indicated by the fact that nomaterial was loaded out, as was done elsewhere.
ConclusionFall I was caused by the unsupported slip.
Fall 2 was caused (or aided) by the wrong choice of support for the existing conditions. Resinanchors would have afforded better anchorage without inducing the radial stress in the surroundingrock. From all appearances, the bolts were well tensioned and installed at a dense spacing. Whilethis is normally sound mining practice, and commendable in the light of the observed jointing, itaggravated the situation in this case.
PreventionFall 1 could have been prevented by supporting the slip and Fall 2 by using resin instead ofmechanical anchors.

58
Figure 3. View of the discoloration at the anchor positions of the bolts, also showing thehigh density of slips.
Figure 4. View of a rock column on top of the washer, indicating sufficient pretensionon the bolt.

59
Figure 5. View of the stress damage around a roof bolthole.

60
Case E Summary: Horizontal stress
Mine locality: Witbank Coalfield
Seam: No 5
Mining method: Continuous miner bord and pillar, overmining No 2 seam with 30 m parting. Bordwidth 6.9 m.
Mining depth: 40 m
Mining height: 2.4 m
General description of roof: Silty sandstone (0.36 m), followed by laminated sandstone (0.2 m),then laminated silty sandstone (0.24 m ), then shale (0.15 m) and finally sandstone with shalebands (0.1 m). Roof slightly weathered, susceptible to weathering. Dripping water was evident, seeFigure 1.
Figure 1. Water dripping from the roof.
Discontinuities present: Major slip, planar and slickensided, through centre of fall.
Roof MRMR: 22
Roof UCS: 6 MPa
Roof CMRR: 43
Roof RMR: 63

61
Time of fall: Not known.
Supported/unsupported: Supported
Support: Full column resin M16 by 1.5 m long rebar, 3 bolts per row at 2 m spacing.
Cut-out distance:
Support quality: Medium. Holes not filled, powdery resin observed in fall, indicating over mixing ofresin.
Monitoring: none at fall.
Locality: Intersection.
Horizontal stress indicators: A stress damage survey of the workings indicated that the maximumhorizontal stress has a direction of 185degrees. The area where the fall of ground occurred showssigns of stress induced damage. This mainly took the form of scaling of a roof siltstone bed (thatbounded the fall) and roof guttering, see Figure 2. This cutter extended some 14m into the corner ofa pillar. At this position rock flour and shearing of a seam joint was noticed. Over thrusting of thenether roof beds was evident, see Figure 3. The stress damage rating (SDR) values for the fall ofground area ranged from 3 to 6 (Deep cutter to roof fall conditions). The SDR values for the areasurrounding the fall ranged from 2 to 3 (slight to deep cutter conditions). All stress damage wasconfined to the roof, with all ribs being stable.
General description of fall: A plan view of the fall is shown in Figure 4 and a general view inFigure 5. The fall originated in the intersection and migrated into the split to the right. From there itcrossed the next roadway and caused a cutter on the opposite ribside. The cutter/overthrustingcontinued for at least another roadway where it caused damage to a pillar corner. The fall heightwas 0.7 m at the intersection. The continuation fall was confined to the nether 0.3m skin of the roof.
Figure 2. Buckling of the nether roof layer

62
Figure 3. Over thrusting of roof layers.

63
Figure 4. Sketch plan of the fall.
Cause of collapseThis fall was caused by high horizontal stress. The joint was the weak spot where it originated.Once mobilised, the roof strata continued to deform, driven by the high horizontal stress. Thedifference between the magnitudes of the maximum and minimum horizontal stresses areestimated to be small, as there was evidence of minor over thrusting in a direction perpendicular tothe axis of the main damage, see Figure 6.
ConclusionThe cause of the horizontal stress could not be established.
PreventionIt is possible that the fall may have been prevented by installing a stiffer support system, i.e. thickerbolts at a denser pattern and with higher quality of bolt installation. The time lapse betweenexposure and support of the roof is not known, but it should be a minimum in a case where highhorizontal stress exists.
7.1 m
6.2 m
6.7 m
6.5 mMajor fall
Continuationof damage
Pillar cornerdamaged
Cutter

64
Figure 5. General view of the major fall.
Figure 6. Minor over thrusting in a direction perpendicular to the main guttering.

65
Case F Summary: Insufficiently supported wedge
Mine locality: Highveld Coalfield
Seam: No 4
Mining method: Bord and pillar with Voest Alpine ABM30 Bolter miner. Road width 6.6m.
Mining depth: 84 m.
Mining height: 4.2 m
General description of roof: The roof was coal, 1.5 m to 2.0 m thick. It was followed by asequence of muddy sandstone and mudstone with sandy mudstone with a thin (15cm) sandstonelayer at the base. Note: the mine geologists do not distinguish between mudstone and shale.
Discontinuities present: The fall occurred at a 1.2m wide dyke striking NE-SW. The miningdirection was due West. The dyke was steeply dipping towards the East. There were numeroussympathetic slips.
Time of fall: Between shifts.
Supported/unsupported: Supported
Support: M16 by 1.5m long mechanical anchors, 2 bolts per row with 1.5m spacing. In the vicinityof the dyke the spacing was decreased to 3 bolts per row at 1m spacing. Additional support was3.5m cable anchors and W-straps.
Support quality: The bolts were well installed, but there was some doubt regarding the quality ofthe cable anchors. This did not contribute to the fall, as they were installed on the other side of thedyke as where the fall occurred. The tension indicator rings were not exposed – see Figure,implying that either the pretension was insufficient or that the wrong indicator rings were installed. A2 m long cut-off was found, see Figure 2, which is always cause for concern as it may mean thatsome of the cables were cut shorter prior to installation.
Monitoring: None.
Locality: Intersection.

66
Figure 1. Detail of the tensioning assembly of the cable anchor, showing that the loadindicator had not come out. Note also that there is only one grouting tube instead of two.
Figure 2. Worker holding the cable cut-off that was found in the section.
Horizontal stress indicators: None.
General description of fall: The fall was wedge shaped, +/- 1.5 m high by 12 m long and 2 m wideat the wide end. The top was flat. A plan view of the fall area is shown in Figure 3 and a view of theslickensided edge of the fall in Figure 4. As the roof had not yet been re-supported, a detailedinspection could not be done. The roadway through the dyke had been mined a few days prior tothe fall. On the night before the fall, a cubby was cut at the dyke/roadway intersection. No additionalsupport appeared to have been installed in the newly exposed roof.

67
12.5
00m
12.500m
6.500m
Cubby was cut the night before
Roof fall 16H00Wednesday Roof fall when area
was initially mineda year ago.
6.8m
6.9m
Mining in the weekpreceding the fall
Change in strikedirection of dyke
Height4.4m
10m
1234
N
Figure 3. Plan view of the fall.
Cause of collapseThe new cubby exposed new roof that enlarged the area of the roof on the western side of thedyke. This is the weak side (the dyke was steeply dipping towards the East). A slip almost parallelto the dyke formed a wedge with the dyke. The support was insufficient to contain the wedge – noroofbolt holes were visible in the slickensided sides of the fall. The bolts were both too short, anddid not penetrate the plane of the joint that formed the wedge.
Figure 4. View of the slickensided joint forming the one end of the wedge.
Conclusion

68
This fall was caused by an insufficiently supported wedge that was formed by joints associated withthe dyke. As the dyke had been mined before, and appeared to be stable, consideration waspossibly not given to the effects of enlarging the area that was mined at the dyke.
Prevention
This fall could have been prevented by better support (i.e. longer bolts at a denser spacing) andensuring that bolts penetrate the joint plane or by installing W-straps across the joint plane.Primarily, however, it could have been prevented by not cutting the cubby at the dyke/roadwayintersection.

69
Case G Summary:
Mine locality: Witbank coalfield
Seam: No 1 Seam
Mining method: Bord and pillar with drill and blast, 14 roadways, 6.5m wide roadways.
Mining depth: 70 m
Mining height: 2.1 m to 2.5 m, sometimes less as frequent rolls in the floor occur (No 1 Seam isdirectly on the paleo floor).
General description of roof: The immediate roof was 0.25m laminated shale/sandstone layer,followed by a 0.25m thick coal stringer, 0.3m laminated shale, another 0.1m coal stringer, 0.4mlaminated shale, .1m coal/shale contact and a 0.3m sandstone.
Discontinuities present: The fall occurred on a slickensided fault with dip of 50o and trace lengthof 16 m +. Displacement was 1.2 m. A number of sympathetic joints were found, in particular two tothe West of the fall that appeared to form a wedge.
Roof MRMR: 23 (poor)
Roof UCS: 8 MPa
Angle of friction: 25 – 30o
Cohesion: 200 – 300 kPa
RQD: 90%
Roof RMR: 50 (fair)
Roof CMRR: 33 (weak)
Time of fall: Between shifts
Supported/unsupported: Supported
Support: M16 full column resin V-bar, 1.2 m long, 3 bolts per row at 2 m spacings,.
Support quality: Poor. A number of bolts with at least 200 mm free space at the bottom werefound. Torque was less than 150 N-m, indicating poor pre-tension. Two V-bars were found to bebroken. (Note: the suppliers were informed of inherent problems with M16 V-bar strength someyears ago. Fractures in the steel tend to form at the positions where the bar is pinched, weakeningthe steel.)
Monitoring: None
Locality: Intersection.
Horizontal stress indicators: None

70
General description of fall: A plan view of the fall is shown in Figure 1. The height was 1.5 to 1.75m, with a flat roof and inclined sides, see section in Figure 2. The base area of the fall was 90 m2.The contact of the fault plane with the roof rock at the top of the fall was seen to be open, indicatinglack of compression, perhaps tensile horizontal stress. Water was dripping out of the opening. Thesouthern extension of the fault was also open, +/- 2 to 5 mm. Bed separation on the western side ofthe fall was also seen.
Three roofbolt holes were found in the fault plane, indicating that bolts had penetrated the plane.However, judging from their lateral position, 1 m from the edge of the fall, the length of the bolts, 1.2m and the inclination of the fault plane, 45o – 50o, the anchor length on the strong side of the faultwas about 0.2 m. Resin was seen inside the holes, indicating that the V-bar had pulled out of theresin. Usually, with more suitable bolts, the failure occurs on the resin/rock plane. This type offailure has previously been observed with V-bar.
Cause of collapseThe fault changed the clamped beams in the roof to cantilevers, thereby increasing the inducedtensile stress from 1.8 MPa to 10.8 MPa (6 m long beams, .25 m thick). This is clearly in excess ofthe tensile strength of the roof material of around 5 MPa.
The support that was installed through the fault plane was inadequate. With the liberal assumptionthat the bolt spacing was 1 m all along the fault plane, then the total resistance offered by the boltswas as follows (assuming resin/steel cohesion of 2000 kPa):
Length of anchor = 200mmBolt diameter = 16mmContact area = 10 053mm2
Resistance = 20.1 kN
The total weight to be supported was as follows:
Length = 6 m

71
Figure 1. Plan view of the fall.
Slip plane
3.59
8m 45.000° New roof
2.7m
1.0m
2.1m
6.8m
1.5m
Original roof height,ending against slip
0.45
m
1.20
m
1.0m
0.20
m
Floor
Roof
Figure 2. Cross-section through the fall.
Slip dipping east
Slip dipping west
Fault dipping west
Slip dipping west
N
9.5
X
X
5.5
5.5m
9.0m
6.8m5.8
6.2
5.7
2Total area ofthe fall = 89.7m
Faultopen

72
Width = 1 mHeight = 1.5 x .66666 (assuming 2/3 height due to profile of fall) = 1 mVolume = 6 m3
Weight = 150 kN
(Note that if more suitable steel tendons were used, the resistance would have been somewhatbetter:
Length of anchor = 20 mmHole diameter = 22mmContact area = 13 823mm2
Resistance = 27.6 kN
This is a 37% improvement)
ConclusionThis fall was caused by the fault that changed the roof strata behaviour from that of a clampedbeam to a cantilever. The split at the fault position enlarged the exposed area of the weak side ofthe fault and the support that was provided through the fault plane was inadequate.
PreventionThe first point to note is that the fall would possibly have been prevented if the split had not beenmined. The split was mined under the weak side of the fault, with the fault at the furthest end – thisis the worst possible position for a split to be in.
Secondly, with regard to bolting, the resistance per bolt on a 1 m spacing would have had to be 150kN. This is in excess of the strength of a M16 bolt, so that either M20 bolts would have beenrequired or the spacing along the fault plane would have had to be reduced to 0.5m.
If the spacing had been reduced to 0.5m, the anchor length would have had to be 0.5m, see Figure3. This would have been possible if the bolts were installed 0.5 m from the fault plane. Tosummarise, a support configuration consisting of the 1.2m bolts spaced at 0.5m apart and installed0.5m from the fault, would have been sufficient to contain the fall. Note that this presupposes asuitable support tendon. If V-bar had been used, with failure occurring on the steel/resin interface,the spacing would have had to be reduced to 0.37m.
The other alternative, which is preferable because it is independent of the dip of the fault, is toinstall bolts on either side of the fault and to join them with short lengths of W-strap.

73
Figure 3. Section and isometric view to explain bolting configuration through fault plane.
}Roof
Fault
Bolt
ANCHOR
Section
0.5
0.5 m
Isometric sketch

74
Case H Summary: Thin wedge / beam created by joints
Mine locality: Highveld Coalfield
Seam: No 2
Mining method: Continuous miner bord and pillar, 5 road section. Road width 7.2 m
Mining depth: 125 m
Mining height: 4 m
General description of roof: The general condition of the roof can be described as good. Theimmediate roof strata consisted of a laminated sandy mudstone contact with an upper laminatedsandy micaceous mudstone bed. The laminated mudstone is sometimes known locally as shale.
Discontinuities present: There was a fault with 0.7 m displacement at the far end of the fall, andtwo or more minor slips at the near end of the fall.
Roof MRMR: 22 (poor)
Roof UCS: 9.9 MPa
Roof CMRR: 55 (moderate, stand-up time 4 days)
Roof RMR: 71 (good, 15 days stand-up time)
Time of fall: During cutting
Supported/unsupported: Unsupported
Support: 0.9 m long M16 mechanical anchors, 4 bolts per row at 2 m spacings. Joint support is 1.5long mechanical anchors.
Cut-out distance: 15 m
Support quality: Excellent. 90% of bolts had torque in excess of 200 N-m.
Monitoring: None
Locality: Roadway
Horizontal stress indicators: None
General description of fall: The fall occurred over the full width of the roadway, from the exposedfault at the far end of where the CM was cutting to a position 4 m back where it was bounded bytwo or more minor joints. A plan view is shown in Figure 1. Figure 2 is a general view of the fallarea. The fall was 0.5 m thick at the far end, thinning to approximately 0.1 m at the near end. Thethinning of the fall was due to thinning of the immediate roof stratum caused by a dome structure.
The same fault was present in the adjacent roadway. There, no fall occurred. The shiftbossreduced the cut out distance to install support closer to the fault before it was exposed.

75
Cause of collapseThe fault and the joints caused cantilever behaviour of the roof, resulting in a failure plane at theright hand side, see Figure 3. The length of the beam was approximately 7 m and the averagethickness was 0.3 m. Then, the induced tensile stress is:
t
L23γσ = = 12.3 MPa, [H.1]
where γ = unit weight of beamL = length of beamT = thickness of beam.
This is in excess of the tensile strength of the roof rock of approximately 5 MPa.
This was exacerbated by the thinning of the roof strata back from the fault. The orientation of thefault is as favourable as it could be and in general this type of situation seldom results in falls ofroof. The instability was aided by the other minor joints and the dome structure of the roof strata.
Alternatively, and equally acceptable, is that the combination of fault and the joints formed a wedgein the roof. The far end of the fall could not be examined for the presence of small joints as the fallhad not been re-supported at the time of the investigation.
ConclusionThe fall was caused by the excessive cut out distance resulting in mining underneath anunfavourable jointing configuration in the roof without support. The underground crew’s reaction inthe next roadway, i.e. to project the position of the fault and then to reduce the cut out distanceaccordingly, is laudable.

76
Figure 1. Plan view of the roof fall.
Figure 2. General view of the roof fall, showing the fault at the far end.
..
FaultstrikingEast - westand dippingnorth
Tip
N
9.75m
10.3m
Fall - 42m
6.6m
18m
7.5
Last row ofroofbolts
height
4.02m7.2m
2
Joints
Fault plane

77
Figure 3. Simplified diagram of the beam formed by the configuration of the fault andthe minor joints.
PreventionThis fall could have been prevented by a reduced cut out distance or by the implementation of amethod to detect discontinuities ahead of the face. This method does not exist yet and needs to bedeveloped.
Fault
Joints
7 m
Plane of failure

78
Case I Fall 1/2 Summary: Weak, weathered strata, joints.
Mine locality: Pafuri Coalfield
Seam: No.7
Mining method: Bord and pillar drill and blast. Road widths average 5.5 m. Irregular pillar sizesdue to dip and several discontinuities.
Mining depth: 50 m
Mining height: 2.7 m
General description of roof: 2.5 m highly weathered laminated shale followed by 1.5mmoderately weathered laminated shale.
Discontinuities present: Densely jointed, close proximity to dyke. Some joints slightly open.
Roof MRMR: 15 (very poor)
Roof RMR: 38 (poor)
Roof CMRR: 6 (weak)
Roof UCS: 3 MPa
Roof cohesion: 100 kPa
Angle of friction: 30o
RQD: 25%
Time of fall: Small falls between bolts during mining, bigger falls at unknown time some weeksafter mining.
Supported/unsupported: Supported
Support: M16 rebar 2 m long resin point anchor with W-straps, additional support 2.4 m long M16resin point anchor 0.5 m apart on joints. Most bolts installed parallel to joints.
Support quality: Medium to poor, bolts not fully tensioned. Indications that roof had separatedprior to support installation, see Figure 1.1 showing resin bulbs on bolts.

79
Figure 1.1. The resin bulbs on the exposed bolts indicate that bed separation had alreadytaken place by the time the bolts were installed.
Cut-out distance: N/A
Monitoring: None
Locality: Intersection
Horizontal stress indicators: None at fall, potting some distance away. Direction of maximumhorizontal stress estimated at 1200. Open joints in approximate direction of major horizontal stressindicate lack of compression, or even tensile minor horizontal stress. At a small (unmapped) fallapproximately 200 m west of this area, a roofbolt showing post installation horizontal movementwas seen, see Figure 1.2.
General description of fall: See Figure 1.3 for plan view. Fall height estimated 1.5m for Fall 1 and6.5 m for Fall 2. Figure 1.4 shows dome shape of Fall 2 and Figure 1.5 the small fragmentedrubble, indicative of the weak nature of the roof.
Cause of collapsePoor rock quality, weathering, joints. Falls do not align with direction of maximum horizontal stress,which is probably incidental due to the proximity of the dyke. Appears that the contribution ofhorizontal stress may have been to open some joints, increasing instability.

80
Figure 1.2. Post installation horizontal displacement of bolt or bending beam?
Direction of weathered zone
1
0
6.4m
24
2322
20
19
16
15
1312
11
6.6m
2.84m4.67m
3.01m
Fall 1
Fall 2
N
CM cut up to here
70.000°
27.0
0m(3
2.00
m)
29.00m(32.00m)
Figure 1.3. Plan view of Falls 1 and 2.

81
Figure 1.4. Dome shape of Fall 2. Note the density of the joints.
Figure 1.5. Note the small fragments of the fall rubble.
ConclusionFalls caused by joints.
PreventionArea support comprising of 2m long full column resin anchors supplemented by W-straps asstandard.

82
Case I Fall 3/4 Summary: Weak, jointed roof with water and horizontalstress.
Mine locality: Pafuri Coalfield
Seam: No 7
Mining method: Two-road bord and pillar drill and blast development. Bord width 6m.
Mining depth: 340 m
Mining height: 2.7 m
General description of roof: 2 m severely weathered laminated shale.
Discontinuities present: There was a dyke less than 30 m away. Two joint sets were present, thefirst one with dip/dip direction 50o/270o and spacing .5 m, and the second with dip/dip direction80o/180o.
Roof MRMR: 38
Roof RMR: 43 (fair)
Roof CMRR: 23 (weak)
Roof UCS: 8.5 MPa
Roof cohesion: 150 – 200 kPa
Angle of friction: 35o
RQD: 96%
Time of fall: Not known, after support.
Supported/unsupported: Supported
Monitoring: None
Locality: Roadway.
Horizontal stress indicators: Deep cutters and one severe roof potting, see Figure 2.1. The SDRwas estimated at 4 – 6 and the direction of the maximum horizontal stress was 179o.

83
Figure 2.1. Roof potting in the vicinity of Fall 3/4
General description of fall: Figure 2.2 is a plan view of Falls 3 and 4. Figures 2.3 and 2.4 aregeneral views of Falls 3 and 4 respectively. Water came out of the roof. At fall 4 there was aborehole.
Cause of collapseFalls 3 and 4 were caused by the intense jointing in the vicinity of the dyke, aggravated byhorizontal stress and the weathered nature of the roof. The roof at Fall 4 was weakened by wateraccumulating in a borehole prior to being mined.
At a depth of 340 m, the horizontal stress with a k-ratio of 2.5 is 21 MPa, which is greatly in excessof the stress measured at mines where horizontal stress is perceived to be a major problem.
ConclusionThe falls were caused by weak, jointed roof in the vicinity of a dyke, aggravated by water andhorizontal stress.

84
N
5 6 8
7
9
1115
1617
19
11.2m
10.2m
5.5m
6.3m
6.2m
5.85m
Figure 2.2. Plan view of fall 3 and 4.
Figure 2.3 General view of Fall 3, showing the blocky nature of the roof.

85
Figure 2.4. General view of Fall 4, showing water flowing from the borehole.

86
Case I Fall 5 Summary: Burnt roof, joints. (3 falls in close proximity)
Mine locality: Pafuri Coalfield
Seam: No 7
Mining method: Continuous miner bord and pillar development, stooping in area. Road widthdesigned to 5 m, average measured at 4.3 m.
Mining depth: 70 to 85 m
Mining height: 2.3 m
General description of roof: Baked shale, bedded .2 m to .6 m thick beds. Coal is burnt.
Discontinuities present: Close to dyke, heavily jointed.
Roof MRMR: 30
Roof RMR: 37 (poor)
Roof CMRR: 21 – 28 (weak)
Roof UCS: 5.9 MPa
Roof cohesion: 100 kPa
Angle of friction: 30o
Time of fall: Started during development, continuous.
Supported/unsupported: Supported
Support: M16 rebar, 2 m long, resin point anchor. Supplemented by W-straps and cable anchors.
Support quality: Medium.
Monitoring: None
Locality: Intersection, continued into roadway.
Horizontal stress indicators: None. Joints are loose, indicating lack of compression in roof.
General description of falls: Figures 3.1 and 3.2 are plan views of two of the falls. The fallheights ranged from 1.5 m to over 4 m. Figures 3.3 and 3.4 show typical damage to the roof. Notethe column of rock on top of the W-strap in the background of Figure 3.4, indicating the weaknessof the roof and its inability to support itself even over very short distances. Figure 3.5 shows theintensity of the jointing in the area. Figure 3.6 is a general view of the fall shown in plan in Figure3.2.

87
27 & 28
29
2526
2422 & 30
Figure 3.1. Plan view of one of the falls in the area, indicating the arial extent of the fall.The fall had an estimated height of 1.5 m.
12
15 & 16
9
7 &
8
13 & 14
10
N
Figure 3.2. Plan view of the fall that was more than 4 m high.

88
Figure 3.3. General view of one of the burnt coal falls. The channel shape of the fall wascaused by parallel joints, forming a wedge that fell.
Figure 3.4. Note the rock on top of the W-strap in the background, indicative of the roof’sinability to support itself over short distances.

89
Figure 3.5. Note the intensity of jointing in the roof.
Figure 3.6. General view of the 4 m high fall, shown in plan in Figure 3.2.
Cause of collapseThese falls were caused by the high intensity of jointing and weak roof that is typical of heatinduced damage in the vicinity of some dykes.
ConclusionHeat generated by the dykes weakened the roof, causing the falls of ground.
Prevention

90
Standard support consisting of cable anchors and W-straps would have prevented these falls. Thiswould require a cut-out distance of say 3 m and very low advance rates.

91
Case I Fall 6 Summary: Dyke, burnt coal, wedge
Mine locality: Pafuri Coalfield
Seam: No7
Mining method: Bord and pillar drill and blast. Road widths 6.3 to 6.6m.
Mining depth: 57 m
Mining height: 3.0 m
General description of roof: Bedded, laminated shale. Beds are 200 – 600 thick.
Discontinuities present: Split mined semi-parallel to dyke, sympathetic joints present. Wedgeforming joints spaced at 1.8 m to 0.5 m.
Roof MRMR: 24
Roof RMR: 34
Roof CMRR: 38 (weak)
Roof UCS: 5.4 MPa
Roof cohesion: 150 – 200 kPa
Angle of friction: 35o to 40o.
RQD: 98 %
Supported/unsupported: Supported.
Support: M16 rebar, resin point anchor.
Monitoring: None
Locality: Intersection and roadway.
Horizontal stress indicators: None
General description of fall: Figure 4.1 is a plan view of the fall , which consisted of two parts. Itwas not known which occurred first. The fall in the intersection was in the burnt coal, and wasapproximately 4m high. The fall in the split was between joints that formed a 3m high wedge thatfell out. Figure 4.2 shows one of the joints that formed the wedge.

92
Figure 4.1 Plan view of the two parts of the fall.
Figure 4.2. One side of the wedge formed by intersecting joints.
Cause of collapseThe fall was caused by intersecting joints forming a wedge and by the weakened roof due to theheating effects of the dyke.
N

93
ConclusionThe fall was caused by intersecting joints forming a wedge and by the weakened roof due to theheating effects of the dyke.
PreventionThe fall in the intersection could have been prevented by installing cable anchors and W-strapsconcurrent with mining at short cut-out distances, perhaps also by not creating the split in thatposition. The fall in the split could have been prevented by firstly not mining the split in closeproximity to the dyke or by installing thicker bolts at closer spacings through the planes of the twojoints that formed the wedge.

94
Case L Summary: Horizontal stress, weak zone
Mine locality: Witbank Coalfield
Seam: No 2
Mining method: Bord and pillar 11 road panel with Joy 12HM9. Designed bord width is 6.5 m,although measured widths in the section were only 5.5 m to 6.0 m..
Mining depth: 45 m
Mining height: 3.1 m to 3.5 m (average 3.3 m)
General description of roof: The immediate roof is gritstone, which was 120 mm thick at themajor fall site. Further south it is thicker than 500 mm and to the north of the fall it is 400 mm thick.On top of this is a weak mudstone contact, increasing in thickness from 35 mm in the north to 200mm in the southern end of the panel. At the major fall site it is 70 mm thick. Overlying the contact islaminated shale, bed spacing 60 to 200 mm.
Discontinuities present: No major features, moderate flat dipping jointing with dip/strike directionof 10o/234o.
Roof MRMR: 22 (on verge of being stable)
Roof RMR: 46 (fair – 3 days stand up time)
Roof CMRR: 23 (weak – immediate collapse))
Roof UCS: 5.5 MPa
Roof angle of friction: 35o to 40o
Roof cohesion: 150 – 200 kPa
RQD: 60%
Time of fall: Between shifts.
Supported/unsupported: Fall occurred in two phases. The first fall was unsupported. The roofwas then supported and then the major fall occurred.
Support: M20 Ausbar 1.5 m long 3 bolts per row at 2 m spacings in 25 mm holes, full column dualspeed single capsules. Bolt density was increased at the fall.
Cut-out distance: 12 m at major fall, reduced to 5 m after fall occurred.
Support quality: Medium at fall, good elsewhere. At fall, bolts were installed late after first falloccurred. Due to height, equipment could not reach roof and bolts not installed to full length. Thetorque on a number of bolts was less than 150 N-m and several holes were not filled with resin.
Monitoring: None
Locality: Intersections and roadways

95
Horizontal stress indicators: The excavations where the fall occurred showed signs of damagethat could be attributed to horizontal stress. The near-by workings showed signs of horizontal stressdamage. The horizontal stress damaged (roof) was confined to the southwest side of the panel.This damaged zone was defined by a line bearing 302/122° (magnetic). To the north east of thisline, the roof was not damaged. In the southwest section, horizontal stress damage took the form ofpotting and cutter roof, see Figure 1. The cutter damage to the roof varied from slight to deep.Minor floor lifting was seen in the undamaged areas, see Figure 2. Minimal pillar stress induceddamage was observed. Where this occurred it normally took the form of scaling of the pillarcorners, with shear failure of the top pillar/roof contact being also seen. The falls were seen tomigrate around corners, see Figure 3. One of the roofbolt holes was seen to be deformed as shownin Figure 4.
A stress damage survey gave SDR rating values of 6 to 2.5 for the damaged section (fall of groundto slight cutter roof). In the undamaged section values of 1 were recorded (stable). Stress damagesurveys indicated that the maximum horizontal stress has a direction in the region of 240°.Underground stereographic surveys show that the maximum horizontal stress acts (in plan) at a 10°angle to the dip of the bedding and at a 20° angle to the main boundary between different thicknessof sandstone (<0.5m) in the immediate roof. From the above facts it can be ascertained that higherthan normal roof shear stresses are generated in these areas.
General description of fall: Figure 5 shows a layout plan of the section with most of the falls,potting, cutters, floor heave and guttering indicated on it. A distinct channel, in which the roof fallsoccur, can be plotted from this. The direction of this channel is ± 300° to 320°. The Mine overseerstated that this channel has been following them from some distance back and slowly creepedacross the panel as they advanced.
Figure 6 shows a more detailed plan of the area around the major fall (Fall L) and Figure 7 showsthe mining sequence.

96
Figure 1 Minor potting.
Figure 2. Floor heave

97
Figure 3. Fall progressing around a corner in the form of a cutter.
Figure 4. Deformed roof bolt hole.

98
Guttering + fall0.5m - 1m
N2nd fallheight +1m
Major FallHeight +2m
RoofPotting
New fall
Minor fallup to 0.2massociated with gritstone
Cutter
N
ML
JK
L5 L4 L3
I
L1L2 BR
S81
S80
S79
S78
S77
S76
S75
FFloorheavestriking 150 - 330
H G
S74
ABC
E
D
R1 R2 R3
Water flowingout of strata
R4 R5
Figure 5. General key plan of the falls.
Figure 6. Detail of the major fall, Fall L in Figure 5.
L1 BR
S76
S77
S78
R1

99
345AB
6.5
00
m
7.500m
14.000m
BA
1 2A
B
Figure 7. The cutting sequence.
The contour plan of the seam floor shows no dipping of the seam.
In split 80, road no. 4, floor heave was observed. The floor heave was ± 100 – 150mm high and ranin two lines more or less diagonally across the intersection. The lines were not parallel with thestrike direction being ± 320° and 340° respectively. The intersection that was formed, was largerthan the other intersections throughout the section due to the splits being started of in this roadway.Thus the pillar corners were cut away to enable the CM to turn. The corresponding intersection,one split back was also inspected and no floor heave was observed. The position of the floor heavecorresponds to the channel of weakness.
From the sidewall on the northern side in road 4, water was running out of a concentrated area inthe strata above the coal, see Figure 8. It appeared to be coming from the bedding plane betweenthe coal and the Gritstone. The flow was more than 3 l/min. The sidewall was stained reddishbrown.
The Mine Overseer reported that prior to intersecting the water in road no. 4, water was coming outof the faces mined towards the western side. Once they passed the water in road no. 4, the waterin the faces stopped. The direction of the Paleo ridge is towards the north-western side.

100
Figure 8. Position where water was coming out at the contact between the roof and theribside.
Fall A had an elliptical shape diagonally across the intersection with a height of ± 0.3m and itoccurred just after cutting the roadway. The dome of the fall is more towards the west side of thefall.
In the next intersection at Fall B, potting occurred diagonally across the intersection at ± 0.1m –0.3m. This happened in the last week prior to the investigation as the Mine Overseer reported itwas the first time he had noticed the fall.
Fall C was ± 0.1 up to 0.4m thick and occurred whilst cutting. It was already re-supported. Sharpcorners formed in the fall. Minor potting along the sidewall, to the north of the fall.
The height of Fall D was 0.73 m at the western end and 0.24 m at the eastern end. It formed apointed shape at the western side. The fall was re-supported. Water was running out of the roof at± 0.2 l/min.
Area E consist out of two areas where minor potting occurred along the sidewall parallel to the splitand diagonally across the intersection.
Fall F was in the shape of a parallelogram with the western and the eastern side being 0.15m and0.10m thick respectively.
Fall G with a height of ± 150mm had an elliptical shape diagonally across the intersection.
Fall H was a minor fall in the shape of a half circle across the roadway but it was out of or up to thisthat a cutter in the roof led, see Figure 9.

101
Figure 9. Cutter linking up with a roof fall.
Fall I was potting of the roof. On the other side of the pillar, towards the west, a minor piece of rooffell.
Falls J, K and M were all independent areas but linked to the major fall.
Fall J was ± 100mm – 200mm thick with the Mudstone clearly recognisable above the Gritstone.
K was Guttering up to 0.5m high with a small dome towards the eastern side. The height of fall atthe dome was ± 0.75m. This guttering extended around the corner up to fall H.
L was the major fall with a domed shaped top as indicated in Figure 6 by the black shaded area inFall L. It extended around the corner and was ± 2m high. A general view of the fall is shown inFigure 10.

102
Figure 10. General view of the major fall, Fall L.
Fall M occurred a few days after the major fall and had a height of ± 1m.
Area N was a single drum lift, ± 3.6m wide, which was cut through for ventilation purposes. A fall,as indicated in Figures 5 & 6, occurred here as well. The height was ± 0.2m.
Cause of collapseThe fact that this collapse followed a consistent direction across the panel, even working its wayaround corners in narrow channels, the deformed roof bolt hole and the floor lift all indicate thathorizontal stress played a major role in its occurrence. The direction of the maximum horizontalstress was at right angles to the direction of the axis of the fall.
The fact that the support was installed late where the fall started, was possibly the trigger. After thefirst minor fall the roof was too high for the roofbolter to do proper installations. The bolts that wereinstalled were consequently too short and could not be tensioned. This aggravated the situationand then the second fall occurred.
The horizontal stress had previously been measured at the mine in three different localities. Themagnitudes of the major principal stress were respectively 6.4 MPa, 3.7 MPa and 5.7 MPa withinclinations of 18o, 0o and 5o. If one assumes that the horizontal stress at the fall was the maximum,i.e. 6.4 MPa, then the k-ratio (horizontal to vertical stress) was 5.7 which is greatly in excess of theratio of 2 to 3 that is regarded as normal.
However, the absolute magnitude is still small in comparison to the compressive strength of theroof material that is usually in the range 50 MPa to 70 MPa. At a depth of 100 m below surface, thenormal horizontal stress with a k-ratio of 2.5, is also 6.4 MPa and the effects observed in thisinvestigation, are not common at a depth of 100 m. The horizontal stress in itself is thus notresponsible for the fall, rather the ratio of stress to the local strength of the material.
The CMRR rating of the roof at the fall was 23, which is regarded as weak, indicating immediatecollapse.

103
ConclusionThe fall was caused by a localised zone of weakness stretching diagonally across the panel. Thedriving force behind the fall was the horizontal stress. Once the roof rock was mobilised at themajor fall, the effects continued in a direction perpendicular to the direction of the maximumhorizontal stress. In the rest of the section, there are no visual indications of horizontal stress likeguttering or floor heave. The effects are confined to the relatively narrow area of local weakness.The presence of water is a further indication of weaknesses in the rock mass in that area.
PreventionThis fall could have been prevented by a shorter cut-out distance, denser support pattern andquicker installation of support in the area of local weakness.

104
Case N Summary: undercutting unsupported sandstone, stooping, oldmine
Mine locality: Vryheid Coalfield
Seam: Upper Dundas
Mining method: Drill and blast stooping
Mining depth: 130 m at site of investigation, rapid increase due to overlying mountain.
Mining height: 1.1 m, some roads brushed to 1.7 to 2.1 m, see Figure 1.
General description of roof: The immediate roof consisted of 0.7 m cross- bedded sandstone (tobrushed roof elevation) followed by 0.2 m bedded sandstone. During brushing the nether 0.7 mthick sandstone was removed. Where the roof was brushed, the bedded sandstone formed theroof. The roof that fell in this case was the nether 0.7 m. The contact between the two units isuncemented.
Discontinuities present: No major features, but the roof was bedded, jointed and randomly cross-bedded, shown in Figure 2.
Roof MRMR: 28 (poor)
Roof UCS: 12.7 MPa
CMRR: 38 (weak), reduced to 28 (weak) taking account of weathering by acid mine drainage,shown in Figure 3.
RMR: 55 (fair)
Angle of friction: 25o to 35o
Cohesion: 200 – 300 kPa
Time of fall: Between shifts
Supported/unsupported: Supported
Support: M16 by >1.2 m long mechanical anchors, 3 per row at 2 m spacings.
Cut-out distance: Not applicable.

105
Figure 1. View of the brushed roadway and the undercut into the pillar during stooping.
Figure 2. Bedding and cross bedding of the nether sandstone and the weathered,uncemented contact between the bottom and top sandstones.

106
Figure 3. Discoloration caused by acid mine drainage from the overlying Gus seamworkings.
Support quality: Good
Monitoring: None
Locality: In pillar during stooping.
Horizontal stress indicators: None
General description of fall: There is goaf on either side of the panel being extracted now, whichserved as main development for several decades (estimated 100 years). The overlying Gus seamhas also been stooped and the currently mined panel is approaching the edge of the overlying goaf.Subsidence cracks were found on surface, see example in Figure 4, indicating that the goafs failedthrough to surface.
The roadway was brushed during development several decades ago. During pillar extraction now,the coal only is extracted, undercutting the sandstone roof. The undercut roof fell, the dimensionsbeing 3 m long by 1 m wide and 0.7 m high. Figure 5 shows the locality of the fall and Figure 6 is aview of it.

107
Figure 4. Example of a surface crack.
Figure 5. Plan view of the fall area.
6.0m
Height
1.74m7.61m Height
2.13m
Height2.15m
6.03m
FALL

108
Figure 6. View of the fall.
There was high vertical loading in the area, indicated by cracking noises in the pillars, bent roofboltwashers, ribside spitting, pillar compression - shown in Figure 7 - and even roofbolt washers flyingoff.
Cause of collapse
The high vertical loading caused by stooping and the presence of the overlying goaf edge, resultsin differential compression of the pillars, the pillar in the process of being mined compressing morethan the others. This result in bending of the roof beam, which is a cantilever due to the one endhaving been removed by the brushing. This beam then fails. Failure is aided by the cross beddingof the sandstone beam and by the lateral movement of the coal as the pillar gets compressed.

109
Figure 7. Vertical compression and lateral expansion of the pillar during extraction.
ConclusionThis fall was caused by increased vertical load due to stooping operations causing bending of thecross bedded and jointed nether sandstone roof beam, which was weakened by brushing.
The mining geometry was unfavourable, with goafs on both sides and a goaf edge on top. Thishighlights a unique problem with extracting the last coal from old mines – there is no control overthe geometry that was created decades ago, at a time when no consideration was given to the laterextraction of the last pillars.
PreventionThis fall could only have been prevented by adequate support of the sandstone brow. Taking intoaccount the low mining height, roofbolting is not a viable option as the bolt length would have hadto be greater than the mining height. The remaining options are to mine the brow, which wouldhave an adverse effect on the economics of the operation, or to use temporary supports to protectdrilling crews.

110
Case O Summary: Horizontal stress, Joints
Mine locality: Witbank coalfield
Seam: No 4
Mining method: Square bord and pillar. Pillar centres were 13,5 m, road widths nominally 6,5 m.
Mining depth: 61 m
Mining height: 2,9 to 3,2m
General description of roof: The succession from bottom to top at the falls was: 0,2 sandylaminated shale, 0,05 mm fossil contact, 0,55 m laminated shale, 0,51 sandstone with interlaminated siltstone, 0,98 inter bedded sandstone/siltstone, 0,87 m sandstone and 1,62 m shale.
Discontinuities present: Prominent joint set running across panel, dip and dip directionapproximately 85o/319o, strike trace length 19m, dip trace length 0,7 m, large scale condition wasplanar. Fall was at the crest of a roll, ±30 m from the limbs. On surface there was a pan +/- 60 maway laterally. The panel, 87 m wide, was situated between two transgressional sills.
Roof CMRR: 31 (Weak)
Roof RMR: 49 (Fair)
Roof MRMR: 30 (Poor)
Supported/unsupported: Supported.
Support: 1,5m M16 full column resin bolts, 3 per row at 2m row spacing.
Support quality: Good
Monitoring: None
Locality: Roadway plus 2 intersections, one on either side.
Horizontal stress indicators: The Stress Damage Rating (SDR) varied from 6 (fall of ground) to3,5 (deep cutter) in the vicinity of the fall to 1 (stable) elsewhere in the section. The direction of themaximum horizontal stress according to underground mapping was from 2o to 28o.
According to stress measurements done in the area, the direction of maximum horizontal stresswas 23o and the magnitude 13,5 MPa.
General description of fall: A general view of the fall is shown in Figure 1. The fall height was 4,1m to 4,5 m. In width it spanned across the roadway (planned width 6,5m – actual could not bemeasured) and had a length of more than 20 m. It appeared to have started at an intersectionwhere pillar corners were cut away (according to the u/g manager).

111
Figure 1. General view of the fall.
A crank handled roofbolt, shown in Figure 2, was seen. The roof of the fall was flat, but had severeripple marks, shown in Figure 3.
Steep dipping joints bound the fall on either side with discoloration caused by water, shown inFigure 4. The area was wet.

112
Figure 2. Crank handled roof bolt seen in the fall
Figure 3. Ripple marks on the sandstone roof of the fall. Note the discoloration caused bywater.
Figure 4. Discoloured joint plane bounding the fall.
Cause of collapseIt is believed that this fall was by a combination of several factors, namely weak roof strata,horizontal stress, jointing and water.
The first factor was the weak roof. Three different rating systems, namely CMRR, RMR and MRMRall resulted in low ratings for the rock mass quality. The UCS, UTS, Shear strength and Elastic

113
modulus of the roof material were found to be low by laboratory tests. Stress mapping indicated thepresence of horizontal stress. It was also measured in the area, and had a magnitude of 13,5 MPa.While this magnitude is not considered to be excessive, the weak roof allowed horizontal stress toresult in failure.
The other aggravating combination of factors was the observed jointing and water. The maximumhorizontal stress did not act either parallel or perpendicular to the joints, resulting in an estimatedshear stress of 6,3 MPa to be present across the joints. Coupled to the presence of water, this wasmost probably the trigger that resulted in this major roof fall.

114
Appendix II – Summary of Mapped Falls
Before /After
Cause Height Width Length Int/RW n/row Spacing Roadwidth
n w 0.2 6 12 i 3 2 6.7n w 0.14 6 12 i 3 2 6.7n j 0.4 6 12 r 0 0 6.7n j 1.9 6 12 r 3 2 6.7n w 0.27 6 12 i 3 2 6.7n w 0.15 6 12 i 3 2 6.7n w 0.18 6 12 i 3 2 6.7n h 0.5 6 12 r 0 0 6.7n j 0.3 6 12 I 4 2.5 6.9n b 0.4 6 12 I 4 2.5 6.9n b 0.3 6 12 r 4 2.5 6.9n b 0.5 6 12 I 4 2.5 6.9n m 0.3 6 12 I 4 2.5 6.9n tb 0.25 6 12 I 4 2.5 6.9n m 0.6 6 12 I 4 2.5 6.9n tb 0.1 6 12 I 4 2.5 6.9n m 0.3 6 12 I 4 2.5 6.9n m 0.3 6 12 I 4 2.5 6.9n h 0.2 6 12 I 4 2.5 6.9n h 0.25 6 12 I 4 2.5 6.9n w 0.15 6 12 I 4 2.5 6.9n j 0.5 6 12 I 4 2.5 6.9n m 0.2 6 12 I 4 2.5 6.9n j 0.25 6 12 I 4 2.5 6.9n tb 0.35 6 12 I 4 2.5 6.9n b 4 6 12 r 4 2.5 6.9n j 3 6 12 I 4 2.5 6.9b tb 0.3 1.5 2.4 I 3 2 6b tb 0.5 1 1 I 3 2 6b tb 0.06 1.7 3.4 I 3 2 6b tb 0.03 3 1.3 r 3 2 6a tb 0.025 3 4 I 3 2 6a tb 0.06 1.7 3 I 3 2 6a tb 0.03 3 1.3 I 3 2 6a tb 0.25 3 4 I 3 2 6a m 0.5 1.8 2 I 3 2 6a m 0.2 0.5 0.5 I 3 2 6a tb 0.02 1.2 2.1 I 3 2 6a d 0.023 5.7 3.9 I 3 2 6a h 0.3 4.7 8.2 I 3 2 6a tb 0.25 6.2 12 I 3 2 6a tb 0.2 6.2 25 I 3 2 6a h 0.15 2 12 I 3 2 6a tb 0.15 6 30 I 3 2 6b m 0.3 10 12 I 3 2 6b m 0.8 12 12 I 3 2 6a j 0.6 3 6 I 3 2 6

115
Before /After
Cause Height Width Length Int/RW n/row Spacing Roadwidth
a j 0.5 10 11 I 3 2 6n w 1.2 4 15 r 0 0 7n w 1 3 18 r 0 0 7.5a w 1.3 3 12 r 0 0 5.5n w 1 3 16 r 0 0 6a j 0.5 11 9 i 3 2 7.5a w 1.1 5 10 i 3 2 6.7a j 0.1 1 1 i 3 2 6.7n w 0.5 4 25 i 3 2 6.7a j 1.3 6 45 r 0 0 6.7a j 0.7 4 12 i 3 2 6.7a w 0.9 5 22 i 3 2 6.7a j 0.1 1 2 i 3 2 6.7a j 0.7 5 13 i 3 2 6a w 0.7 4 12 r 0 0 6a w 0.9 8 8 i 3 2 6n w 1 5 18 i 3 2 6.7a j 1.5 6 60 i 3 2 6a w 1.2 3 15 r 0 0 6a j 0.9 4 21 r 0 0 6a j 1.4 5 7 i 3 2 6a j 1.5 4 10 r 0 0 6a j 0.2 1 7 i 3 2 7b m 0.3 3 3 i 3 2 7a b 0.5 3 3 i 4 2 5.5a h 2 5 5 i 5 1 5.5a tb 0.2 6 12 i 4 2 7a tb 0.05 3 5 i 3 2.5 7a j 0.05 3 6 i 4 3 7a tb 0.1 4 15 i 4 3 7a w 0.07 1 1 i 4 3 7a j 0.3 1.5 3 i 4 1.5 6.3a b 4 6.5 6.5 i 4 1 7a m 0.07 0.5 0.5 i 4 2 7a m 0.1 1 3 i 4 2 7b j 0.3 3 7 I 4 2 7b j 0.7 4 13 r 4 2 7a m 0.15 3 6 i 4 3 7a m 0.1 0.6 2 i 4 3 7a tb 0.06 0.7 3.9 i 3 1.5 6a j 0.7 1.2 1.8 r 4 1 5.8a tb 0.05 2.5 5 r 3 2 6a j 0.05 3 5 r 3 2 5.9a tb 0.05 2 6 i 3 2 6n tb 0.1 3 6 i 0 0 6a j 0.3 1 3 i 3 2 6n w 0.04 6 6 i 0 0 6.2a j 0.07 1 2.5 i 3 1 6a j 0.15 1 2 i 0 0 6a d 0.04 4 5 r 3 1.5 6a d 0.15 2 3 r 2 2 6

116
Before /After
Cause Height Width Length Int/RW n/row Spacing Roadwidth
a d 0.2 0.3 1.7 r 2 2 6a tb 0.15 1 4 i 2 2 6a tb 0.12 2 6 i 2 2 6a j 0.05 1 1 r 3 2 6a h 0.08 1 2 r 3 2 6a j 0.1 5 12 i 4 2.5 6a tb 0.2 5 5 i 4 2.5 6a tb 0.05 0.5 0.5 r 3 2 6a j 0.1 1 2 i 3 2 6n tb 0.3 3 5 i 0 0 6a j 0.3 3 6 i 3 2 6a j 0.2 3 4 r 0 0 6a w 0.8 9.1 9.7 i 3 2 6.8n j 2 4 15 r 0 0 6.8a w 0.7 9 9 i 3 2 6.8a w 0.5 9 9 i 3 2 6a j 0.3 8 8 i 3 2 6.5a j 2.2 8 8 i 3 2 6a j 1.5 8 8 i 3 2 6n j 0.2 5 25 r 0 0 6a j 0.8 4 6 i 3 2 6a j 0.2 1 3 i 3 2 7a j 0.2 1 1 i 3 2 7a j 0.1 1 4 i 3 2 7a tb 0.1 1 1 i 3 2 7a tb 0.2 2 2 r 3 2 7a tb 0.3 1 1 r 3 2 7b h 0.3 2 4 r 3 2 7b j 0.3 1 1 r 3 2 7b h 3 5 10 i 4 1.5 6a tb 0.1 1 1 r 3 2 7a tb 0.3 3 5 r 3 2 7a tb 0.05 1.5 1.5 i 3 2 7a j 0.5 0.5 1 r 3 2 7b h 0.1 5 5 r 3 2 7a h 0.2 1 2 r 3 2 7a j 0.2 0.5 1 i 3 2 7a tb 0.1 1.5 1.5 i 3 2 7b tb 0.2 1 1.5 i 3 2 7b h 0.2 2 7 i 3 2 6a j 0.1 1 2 r 3 2 7a j 0.5 5 15 r 3 2 7a j 0.3 1 1.5 r 3 2 7a j 0.2 2 5 r 3 2 7a j 0.2 2 2 r 3 2 7b h 1 5 6 r 3 2 7a b 0.3 5 7 r 3 2 7a j 0.2 0.5 2 i 3 2 6a j 0.2 2 5 r 3 2 6b tb 0.3 2 4 r 3 2 6b tb 0.1 1 1.5 r 3 2 6

117
Before /After
Cause Height Width Length Int/RW n/row Spacing Roadwidth
a tb 0.05 6 6 r 3 2 6a m 0.2 1 1 i 3 2 6a j 0.2 2.6 4 r 3 2 6a tb 0.05 2 3 i 3 2 6a tb 0.05 6 6 i 3 2 6b tb 0.1 2 4 i 3 2 6a tb 0.1 4 8 i 3 2 6b j 0.3 3 4 r 3 2 6a j 0.2 2 4 i 3 2 6a h 1 6 30 r 3 2 6a tb 0.1 1.5 2 i 3 2 6a tb 0.2 5 5 r 2 2 6a j 0.3 3 6 i 3 2 6a tb 0.5 3 6 r 2 2 6a tb 0.3 6 10 r 2 2 6a tb 0.4 7 7 i 3 2 6a j 0.1 3 6 i 2 2 6a tb 1.6 13.6 14.8 i 4 2 7.2a j 0.5 4 12 r 3 2 6.6a tb 1.4 8.5 10.5 i 3 2 6.1a j 0.5 2 6 i 3 2 6.2a tb 1.5 6 15 r 3 2 6.2a h 0.7 5 12 i 3 2 6.9a j 1.5 2 12 i 3 2 6.6a j 1.5 6 15 i 3 2 6.5b j 0.5 4 7 r 4 1.5 7.2a j 6.5 5 5 i 4 1.5 5.5a j 2 6 8 r 4 1.5 6a j 1.5 6 8 i 4 1.5 4.3a b 4 6 20 r 4 1.5 6.4a h 2 6 15 r 4 1.5 5.8a m 0.7 1 3 r 2 3 6a h 4.5 6 30 r 2 3 6
Notes
1. i = intersectionr = roadway
2. n = no supportb = before supporta = after support
3. j = jointsm = bad miningtb = excessive spacingd = dykeb = burnt coalh = horizontal stressw = weathering


![Home Page [mrtubb.weebly.com] · The Earth's shadow falls on the Sun. The Moon's shadow falls on the Earth. The Sun shuts off light for a few minutes. What causes a solar eclipse?](https://static.fdocuments.in/doc/165x107/5f1d53776c5bd26b4e2fddf5/home-page-the-earths-shadow-falls-on-the-sun-the-moons-shadow-falls-on-the.jpg)


