Gas Turbines Blade Failures - Causes, Avoidance and Troubleshooting
Tallinn 2018
CAUSES OF DYNAMIC
POSITIONING SYSTEM FAILURES
AND THEIR EFFECT ON DP VESSEL
STATION KEEPING
Master thesis
Supervisor: Harli Moosaar
Student: Ilja Pil
A163519
Student e-mail: [email protected]
Study programme: Technical exploitation
of ships and navigation
2
AUTORIDEKLARATSIOON
Olen koostanud töö iseseisvalt.
Töö koostamisel kasutatud kõikidele teiste autorite töödele,
olulistele seisukohtadele ja andmetele on viidatud.
/Ees- ja perenimi/ ……………………………
(allkiri, kuupäev)
Üliõpilase kood: …………………….
Üliõpilase e-posti aadress: …………….
Juhendaja /tiitel, ees- ja perenimi/:
Töö vastab lõputööle esitatud nõuetele
……………………………………………
(allkiri, kuupäev)
Kaitsmiskomisjoni esimees:
Lubatud kaitsmisele
…………………………………
(ametikoht, nimi, allkiri, kuupäev)

3
PREFACE
This master thesis has been written during the winter and spring 2017/2018 as a
graduation project in Estonian Maritime Academy. The aim of this thesis was to
highlight the most common causes of DP system failures and their effect on DP vessel
position keeping. This thesis is first of this kind in Estonia and will hopefully act as a
starting point for further researches in a field of vessel Dynamic Positioning.
Conducting the research and writing this thesis has given me the opportunity to gain
theoretical knowledge and collect experience without experiencing the incidents
themselves. I will be happy if this thesis and the information it contains will reach the
reader and raise the awareness of possible incidents as well as their effects on station
keeping.
While working on this thesis, I experienced a tremendous feeling of dedication, which
sometimes affected my overall performance as a colleague, husband, father, and friend.
I promise that I will make it up. I am also grateful to my colleagues and my supervisor
for their valuable advises, suggestions, and explanations.
I also would like to thank IMCA for providing me with incident data required for this
thesis.
4
ANNOTATION
A widely used way to identify the effects of dynamically positioning system failures on
a vessel station keeping is to conduct ‘Failure Modes & Effects Analyses’ (FMEA)
trials. Despite the fact that such trials are carried out periodically, loss of position
incidents still occur. Loss of position incident reports, collected and published by
International Marine Contractors Association (IMCA), contain useful information about
the causes of incidents and details on the sequence of events which lead to the incident.
Initial sorting of the reports revealed that over 72% of loss of position incidents in a
period 2007-2015 were caused by failures within the propulsion, position reference,
computer, or power systems. By conducting inductive content analysis of the related
incident reports, the main causes of such failures were identified and an associative
relationship between the main causes and the type of incidents was established. As a
result, the conceptual models of loss of position incidents were built. Conceptual models
provide an overview of main causes and their effects on station keeping in accordance
with the frequencies of their occurrence.
Key words:
Dynamic positioning, loss of position, incident analysis, incident frequencies,
conceptual model, trends, dynamic positioning system failure.
5
Table of contents
PREFACE ......................................................................................................................... 3
ANNOTATION ................................................................................................................ 4
Table of contents .............................................................................................................. 5
List of figures ................................................................................................................... 8
List of tables ................................................................................................................... 10
Introduction .................................................................................................................... 11
1 Dynamic positioning system ....................................................................................... 14
1.1 Introduction and history ........................................................................................ 14
1.2 DP system classification ....................................................................................... 16
1.3 DP system principles ............................................................................................ 17
1.3.1 Redundancy, reliability, capability ................................................................ 17
1.3.2 DP system structure ....................................................................................... 19
1.3.3 Theory and mathematical model ................................................................... 20
1.3.4 Operational modes ......................................................................................... 22
1.4 Main components of DP system ........................................................................... 22
1.4.1 Computers and control console ..................................................................... 22
1.4.2 Position reference system .............................................................................. 23
1.4.3 Environment reference system ...................................................................... 25
1.4.4 Propulsion system .......................................................................................... 26
1.4.5 Power system ................................................................................................. 27
2 Methodology ................................................................................................................ 29
2.1 Literature overview ............................................................................................... 29
2.2 Selecting data ........................................................................................................ 29
2.3 IMCA categories................................................................................................... 31
2.4 Research methods ................................................................................................. 31
2.5 Credibility and limitations .................................................................................... 34
3 Results ......................................................................................................................... 35
3.1 Propulsion failures ................................................................................................ 35
3.1.1 Initial sorting ................................................................................................. 35
3.1.2 Failure groups and causes .............................................................................. 36
3.1.3 Incident types and frequencies ...................................................................... 40
3.1.4 Potential LOP Incidents ................................................................................. 41
6
3.1.5 Drift off .......................................................................................................... 44
3.1.6 Drive off ........................................................................................................ 47
3.1.7 Trends ............................................................................................................ 49
3.2 Position Reference system failures ....................................................................... 49
3.2.1 Initial sorting ................................................................................................. 49
3.2.2 Failure groups and causes .............................................................................. 51
3.2.3 Incident types and frequencies ...................................................................... 55
3.2.4 Potential LOP incidents ................................................................................. 56
3.2.5 Drift off .......................................................................................................... 58
3.2.6 Drive off ........................................................................................................ 61
3.2.7 Trends ............................................................................................................ 63
3.3 DP system computer failures ................................................................................ 64
3.3.1 Initial sorting ................................................................................................. 64
3.3.2 Failure groups and causes .............................................................................. 66
3.3.3 Incident types and frequencies ...................................................................... 69
3.3.4 Potential incidents ......................................................................................... 70
3.3.5 Drift off .......................................................................................................... 71
3.3.6 Drive off ........................................................................................................ 73
3.3.7 Trends ............................................................................................................ 75
3.4 Power system failures ........................................................................................... 75
3.4.1 Initial sorting ................................................................................................. 75
3.4.2 Failure groups and causes .............................................................................. 77
3.4.3 Incident types and frequencies ...................................................................... 81
3.4.4 Potential incidents ......................................................................................... 82
3.4.5 Drift off .......................................................................................................... 85
3.4.6 Trends ............................................................................................................ 88
4 Conclusion ................................................................................................................... 89
5 Lühikokkuvõte ............................................................................................................. 91
6 Bibliography ................................................................................................................ 93
Appendices ..................................................................................................................... 96
Appendix 1 DP system operational modes (Guide to Dynamic Positioning of
Vessels“, Alstom 2000) .............................................................................................. 96
Appendix 2 Characteristics of different reference systems. (Guide to Dynamic
Positioning of Vessels“, Alstom 2000)....................................................................... 97

7
Appendix 3 Example of incident report published by IMCA (IMCA) ...................... 98
Appendix 4 Sorting file in Microsoft Office Excel (by author) ................................. 99
Appendix 5 Incidents caused by “Propulsion system” failure (by author)............... 100
Appendix 6 Incidents caused by “Reference system” failure (by author) ................ 101
Appendix 7 Incidents caused by “Computer system” failure (by author) ................ 102
Appendix 8 Incidents caused by “Power system” failures (by author) .................... 103
8
List of figures
Figure 1.1 First ships using dynamic positioning (Shatto, 2011) ................................... 15
Figure 1.2 Example of vessel redundancy concept (Global Maritime, 2018) ................ 18
Figure 1.3 Schematic diagram of DP system (Chas and Ferreiro, 2008). ..................... 19
Figure 1.4 Forces acting on dynamically positioned vessel. (Kongsberg Maritime) ..... 20
Figure 1.5 Kalman filter application (Holvik, 1998) ...................................................... 21
Figure 1.6 Different types of position reference systems (Chas & Ferreiro, 2008) ...... 24
Figure 1.7 Simplified single line diagram of the DP vessel power system (Sørfonn,
2007) ............................................................................................................................... 28
Figure 3.1.1 Failure groups of “Propulsion system” (by author) ................................... 38
Figure 3.1.2 LOP Incident frequencies caused by propulsion system failure (by author)
........................................................................................................................................ 40
Figure 3.1.3 Propulsion failures leading to potential LOP incidents (by author) .......... 41
Figure 3.1.4 Propulsion failures leading to “drift off” incidents (by author) ................. 44
Figure 3.1.5 Conceptual model of “drift off” incident caused by propulsion failure (by
author) ............................................................................................................................ 46
Figure 3.1.6 Propulsion failures leading to „drive off “incident (by author) ................. 47
Figure 3.1.7 Conceptual model of “drive off” incident caused by propulsion failure (by
author) ............................................................................................................................. 48
Figure 3.1.8 Trends of LOP incidents caused by propulsion system failure (by author) 49
Figure 3.2.1 Failure rate of position reference systems (by author)............................... 52
Figure 3.2.2 Failure groups of “Position reference system” (by author) ....................... 54
Figure 3.2.3 Incidents caused by “reference system” failure (by author) ...................... 55
Figure 3.2.4 Position reference system failures leading to potential LOP incidents (by
author) ............................................................................................................................ 56
Figure 3.2.5 Failures of different position reference systems leading to potential LOP
incident (by author) ........................................................................................................ 56
Figure 3.2.6 Position reference systems causing “drift off” incidents (by author) ........ 58
Figure 3.2.7 Main causes of failures leading to drift off incidents (by author) .............. 59
Figure 3.2.8 Types and number of reference systems online before “Drift off” (by
author) ............................................................................................................................ 59
Figure 3.2.9 Conceptual model of Drift off incident caused by Position reference system
failure (by author) ........................................................................................................... 60
9
Figure 3.2.10 Position reference systems causing “drive off” incidents (by author) ..... 61
Figure 3.2.11 Main causes of position reference failures leading to “drive off” (by
author) ............................................................................................................................ 61
Figure 3.2.12 Types and number of reference system online before “Drive off” (by
author) ............................................................................................................................ 62
Figure 3.2.13 Conceptual model of “Drive off” incident caused by Position reference
system failure (by author)............................................................................................... 63
Figure 3.2.14 Trends of the LOP incidents caused by position reference system failure
(by author) ...................................................................................................................... 63
Figure 3.3.1 Failure groups of “Computer system” (by author) .................................... 67
Figure 3.3.2 Failure rate of DP controller and operator workstation (by author)........... 68
Figure 3.3.3 LOP Incident frequencies caused by computer system failure (by author) 69
Figure 3.3.4 Propulsion failures leading to potential LOP incidents (by author) ........... 70
Figure 3.3.5 Causes of DP computer failures causing potential LOP incidents (by
author) ............................................................................................................................ 70
Figure 3.3.6 Computer failures leading to “drift off” incidents (by author) .................. 72
Figure 3.3.7 Conceptual model of “Drift off” incident caused by computer system
failure (by author) ........................................................................................................... 73
Figure 3.3.8 Computer failures leading to “drive off” incidents (by author) ................. 73
Figure 3.3.9 Conceptual model of “Drive off” incident caused by computer system
failure (by author) ........................................................................................................... 74
Figure 3.3.10 Trends of LOP incidents caused by DP computer failure (by author) ..... 75
Figure 3.4.1 Failure groups of “Power system” (by author) .......................................... 78
Figure 3.4.2 Failure groups of “Power system” (by author) .......................................... 80
Figure 3.4.3 Mechanical failures vs electrical (by author) ............................................. 80
Figure 3.4.4 Incidents caused by Power system failure (by author) .............................. 81
Figure 3.4.5 Power system failures leading to potential incidents (by author) .............. 82
Figure 3.4.6 Power system failures causing “drift off” incidents (by author) ................ 85
Figure 3.4.7 “Drift off” incidents caused by power system failure (by author) ............. 87
Figure 3.4.8 Trends of the LOP incidents caused by power system failures (by author)88
10
List of tables
Table 1. Equivalent classification society DP class notations (by author) ..................... 17
Table 2. Main cause of DP incidents IMCA 2007-2015 (by author) ............................. 31
Table 3. Workflow of the research (by author) .............................................................. 33
Table 4. Propulsion failure groups and related causes (by author) ................................ 37
Table 5. Online reference systems based on 99 reports (by author) .............................. 51
Table 6. Causes of reference system failures (by author) .............................................. 53
Table 7. Causes of “computer” failures (by author) ....................................................... 66
Table 8. Power system common failures causes (by author) ......................................... 77
Table 9. Power system groups (by author) .................................................................... 79
11
Introduction
When the oil and gas industry was expanding further offshore, shallow water techniques
that were successfully used for years to recover hydrocarbons were becoming less and
less attractive. The industry required new methods for positioning vessels and other
offshore installations in deeper waters. The development of Dynamic Positioning
(further DP) systems made it possible to automatically keep the vessels or the floating
offshore structure in a stable position using thrusters and position reference systems. DP
is described as an automatic control of vessel’s position and heading by coordinated use
of thrusters with respect to one or more position references. A DP system is the
collection of all the equipment that supports automatic position keeping control. (IMCA
M 103 Rev. 3, 2017)
Reliable station keeping is essential to many offshore operations. Working in close
proximity to another vessel or structure, supporting diving operations, anchor handling
and drilling are just some examples of the tasks which require precise position keeping.
Despite the offshore oil and gas industry being the main user of dynamically positioned
vessels, the growing number of different types of ships are now being fitted with DP
systems. The ‘Wärtsilä Dynamic Positioning unit’ reported a successful test of the
remote control of ship operations. The test involved driving the vessel through a
sequence of manoeuvres using a combination of DP and manual joystick control. The
test vessel was in the North Sea while the remote-control navigating was carried out
from the ‘Wärtsilä’ office located in San Diego, California, 8000 km away (Wärtsilä
Corporation, 2017). This important step towards developing the remote operated vessels
indicates that DP system and associated equipment will have the place in the shipping
industry for the years to come.
The success of DP supported operations depends on the reliability of the equipment,
training levels and skills of operators, as well as mitigation of associated risks. When
performing such operations, there is always a certain risk of incidents due to operational
or technical error. Despite the myriad of regulations and rules that have been produced
and applied in the recent years by regulatory bodies, loss of position (further LOP)
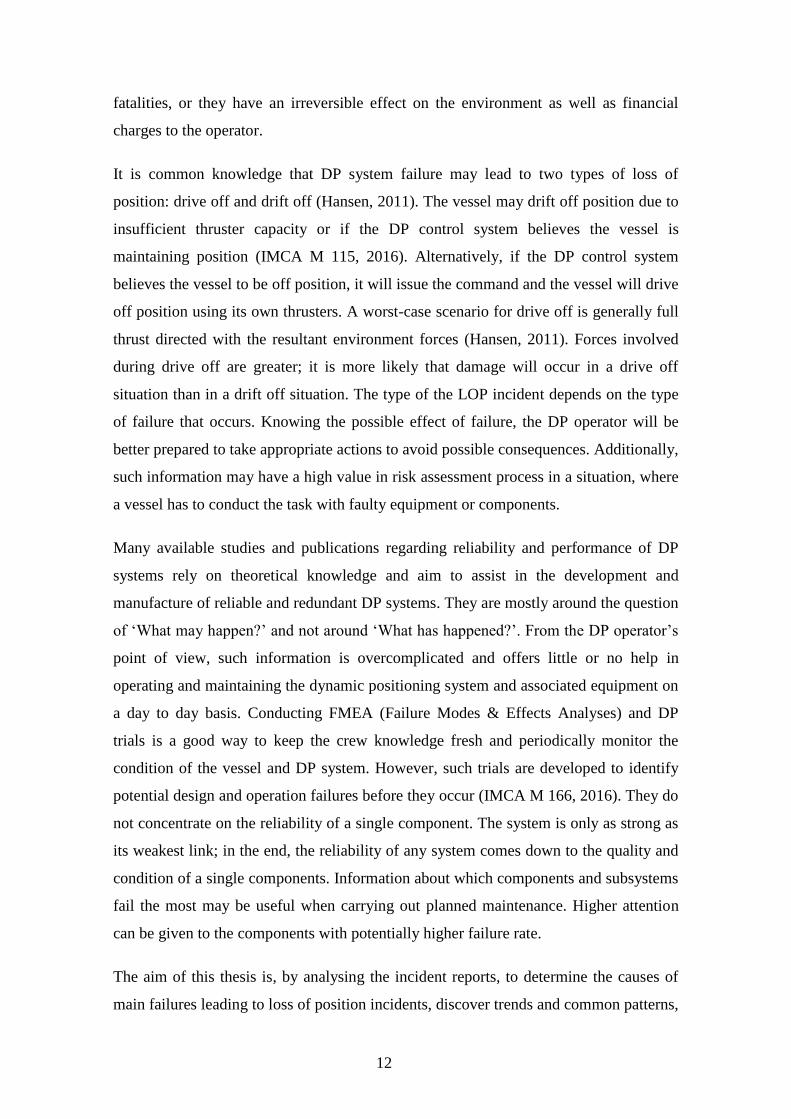
incidents still occur. The consequences of such incidents may be disastrous, including
12
fatalities, or they have an irreversible effect on the environment as well as financial
charges to the operator.
It is common knowledge that DP system failure may lead to two types of loss of
position: drive off and drift off (Hansen, 2011). The vessel may drift off position due to
insufficient thruster capacity or if the DP control system believes the vessel is
maintaining position (IMCA M 115, 2016). Alternatively, if the DP control system
believes the vessel to be off position, it will issue the command and the vessel will drive
off position using its own thrusters. A worst-case scenario for drive off is generally full
thrust directed with the resultant environment forces (Hansen, 2011). Forces involved
during drive off are greater; it is more likely that damage will occur in a drive off
situation than in a drift off situation. The type of the LOP incident depends on the type
of failure that occurs. Knowing the possible effect of failure, the DP operator will be
better prepared to take appropriate actions to avoid possible consequences. Additionally,
such information may have a high value in risk assessment process in a situation, where
a vessel has to conduct the task with faulty equipment or components.
Many available studies and publications regarding reliability and performance of DP
systems rely on theoretical knowledge and aim to assist in the development and
manufacture of reliable and redundant DP systems. They are mostly around the question
of ‘What may happen?’ and not around ‘What has happened?’. From the DP operator’s
point of view, such information is overcomplicated and offers little or no help in
operating and maintaining the dynamic positioning system and associated equipment on
a day to day basis. Conducting FMEA (Failure Modes & Effects Analyses) and DP
trials is a good way to keep the crew knowledge fresh and periodically monitor the
condition of the vessel and DP system. However, such trials are developed to identify
potential design and operation failures before they occur (IMCA M 166, 2016). They do
not concentrate on the reliability of a single component. The system is only as strong as
its weakest link; in the end, the reliability of any system comes down to the quality and
condition of a single components. Information about which components and subsystems
fail the most may be useful when carrying out planned maintenance. Higher attention
can be given to the components with potentially higher failure rate.
The aim of this thesis is, by analysing the incident reports, to determine the causes of
main failures leading to loss of position incidents, discover trends and common patterns,
13
and to find the connection between the failures and which type of incident they cause.
This thesis focusses on the most common technical failures causing the vessel to lose
the desired position. A discussion of human factor falls outside the scope of this thesis,
as it has been widely studied elsewhere.
The research relies on incidents reported to International Marine Contractors
Association (further IMCA) on a voluntary basis in a period 2007-2015 and kindly
provided to the author by the IMCA organisation in order to conduct this study.
Using inductive content analysis, the incidents are sorted by the main cause and
categorised into content related groups. Also, effects of such failures on the vessel
station keeping capability and incident scenarios are discussed. As a result of this study,
conceptual models of LOP incidents are created.
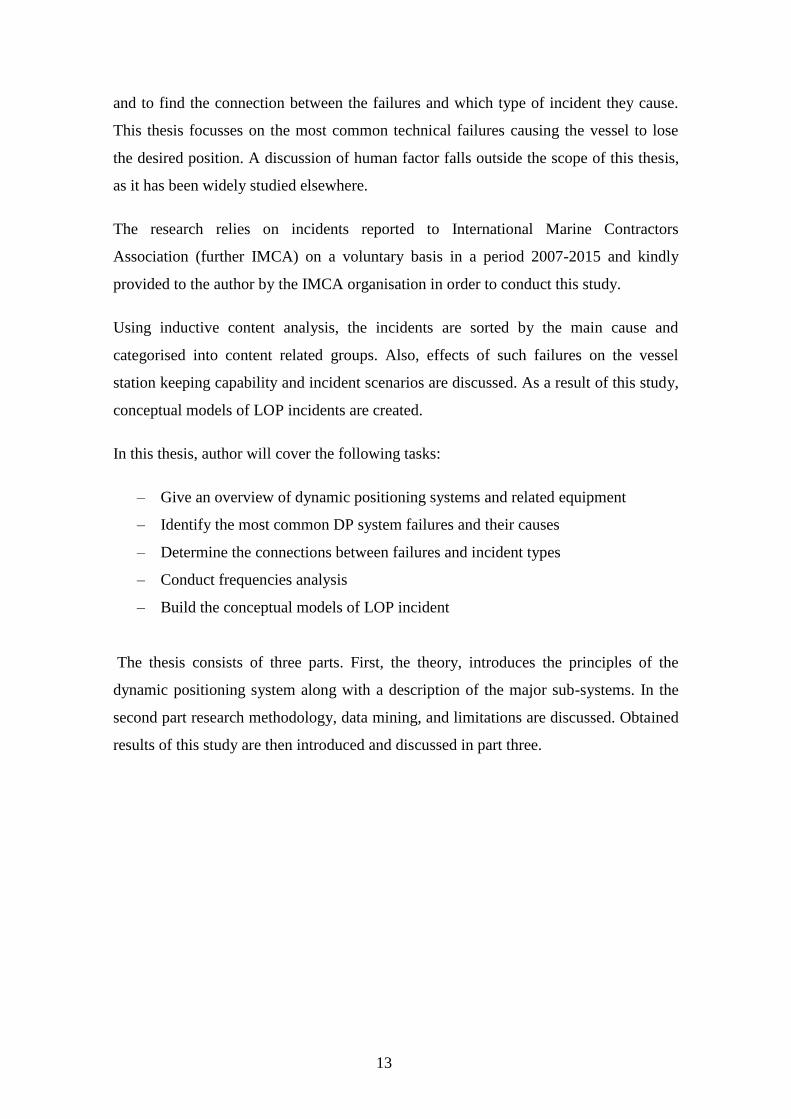
In this thesis, author will cover the following tasks:
– Give an overview of dynamic positioning systems and related equipment
– Identify the most common DP system failures and their causes
– Determine the connections between failures and incident types
– Conduct frequencies analysis
– Build the conceptual models of LOP incident
The thesis consists of three parts. First, the theory, introduces the principles of the
dynamic positioning system along with a description of the major sub-systems. In the
second part research methodology, data mining, and limitations are discussed. Obtained
results of this study are then introduced and discussed in part three.
14
1 Dynamic positioning system
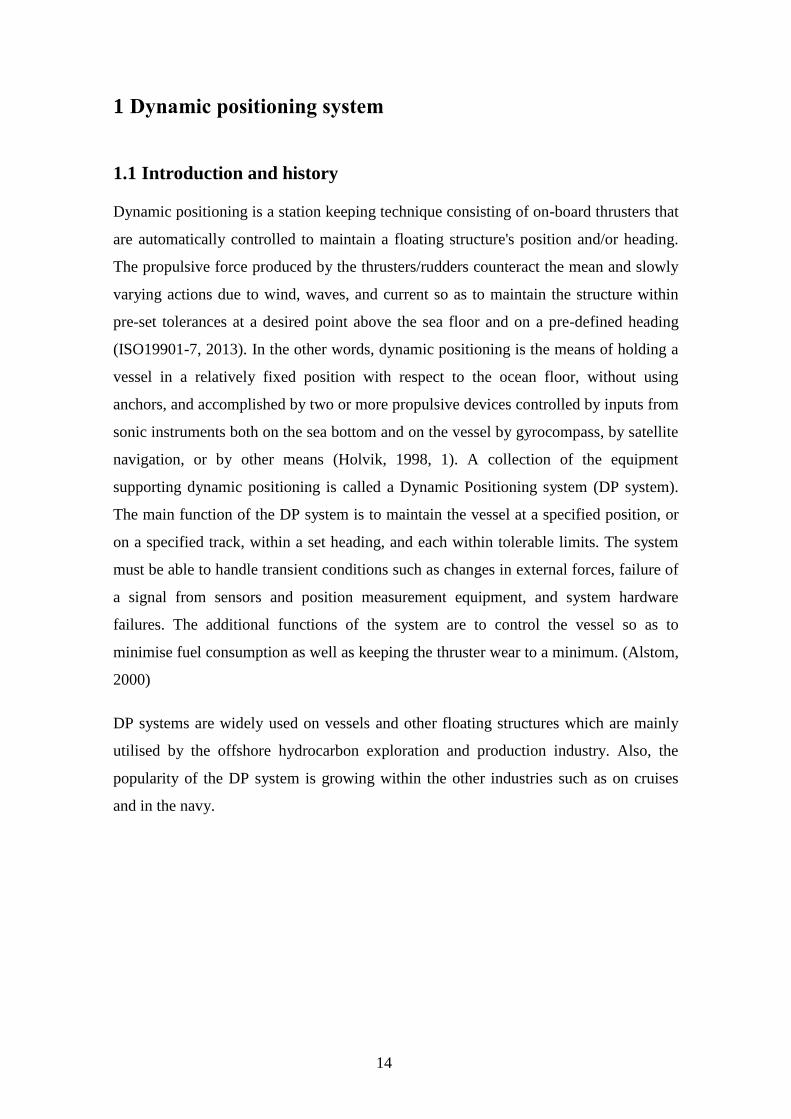
1.1 Introduction and history
Dynamic positioning is a station keeping technique consisting of on-board thrusters that
are automatically controlled to maintain a floating structure's position and/or heading.
The propulsive force produced by the thrusters/rudders counteract the mean and slowly
varying actions due to wind, waves, and current so as to maintain the structure within
pre-set tolerances at a desired point above the sea floor and on a pre-defined heading
(ISO19901-7, 2013). In the other words, dynamic positioning is the means of holding a
vessel in a relatively fixed position with respect to the ocean floor, without using
anchors, and accomplished by two or more propulsive devices controlled by inputs from
sonic instruments both on the sea bottom and on the vessel by gyrocompass, by satellite
navigation, or by other means (Holvik, 1998, 1). A collection of the equipment
supporting dynamic positioning is called a Dynamic Positioning system (DP system).
The main function of the DP system is to maintain the vessel at a specified position, or
on a specified track, within a set heading, and each within tolerable limits. The system
must be able to handle transient conditions such as changes in external forces, failure of
a signal from sensors and position measurement equipment, and system hardware
failures. The additional functions of the system are to control the vessel so as to
minimise fuel consumption as well as keeping the thruster wear to a minimum. (Alstom,
2000)
DP systems are widely used on vessels and other floating structures which are mainly
utilised by the offshore hydrocarbon exploration and production industry. Also, the
popularity of the DP system is growing within the other industries such as on cruises
and in the navy.
15
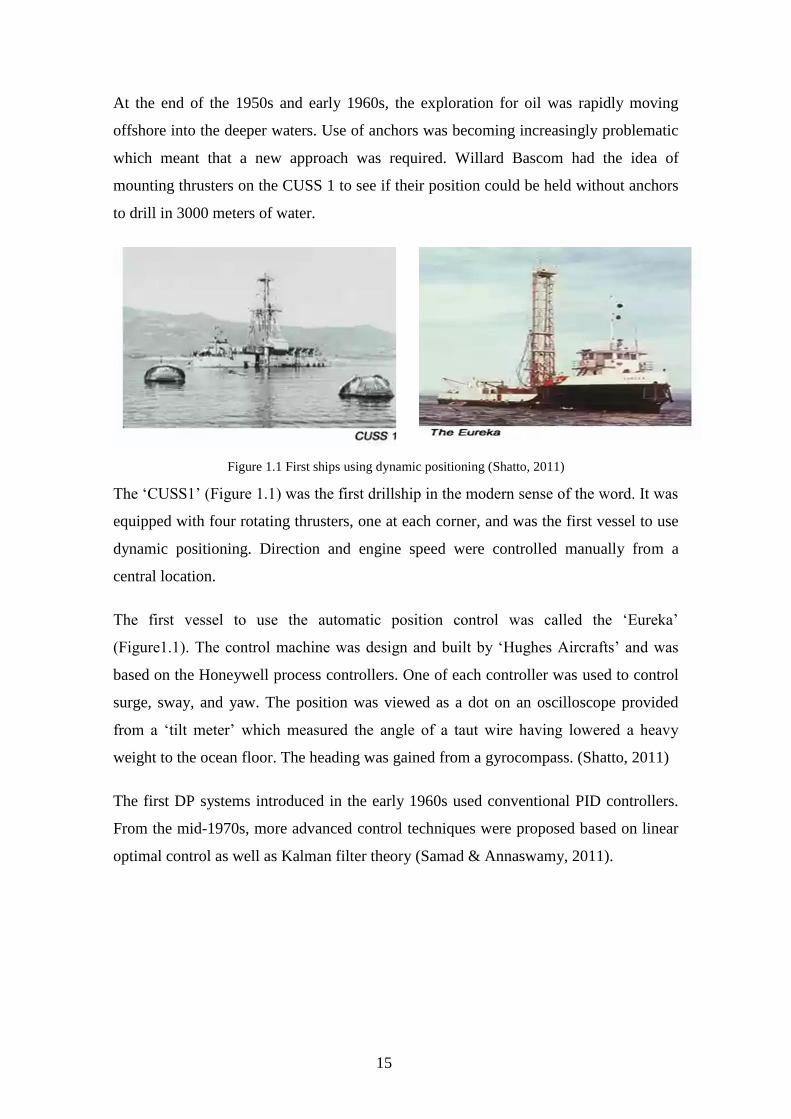
At the end of the 1950s and early 1960s, the exploration for oil was rapidly moving
offshore into the deeper waters. Use of anchors was becoming increasingly problematic
which meant that a new approach was required. Willard Bascom had the idea of
mounting thrusters on the CUSS 1 to see if their position could be held without anchors
to drill in 3000 meters of water.
Figure 1.1 First ships using dynamic positioning (Shatto, 2011)
The ‘CUSS1’ (Figure 1.1) was the first drillship in the modern sense of the word. It was
equipped with four rotating thrusters, one at each corner, and was the first vessel to use
dynamic positioning. Direction and engine speed were controlled manually from a
central location.
The first vessel to use the automatic position control was called the ‘Eureka’
(Figure1.1). The control machine was design and built by ‘Hughes Aircrafts’ and was
based on the Honeywell process controllers. One of each controller was used to control
surge, sway, and yaw. The position was viewed as a dot on an oscilloscope provided
from a ‘tilt meter’ which measured the angle of a taut wire having lowered a heavy
weight to the ocean floor. The heading was gained from a gyrocompass. (Shatto, 2011)
The first DP systems introduced in the early 1960s used conventional PID controllers.
From the mid-1970s, more advanced control techniques were proposed based on linear
optimal control as well as Kalman filter theory (Samad & Annaswamy, 2011).
16
1.2 DP system classification
The necessary reliability of the DP system is determined by the consequences of loss of
position keeping capability. The larger the consequence, the more reliable the DP-
system should be. The equipment classes are defined by the effect of failure and the
nature of the failures which must be considered (DP vessel design philosophy…, DPC,
2011).
International Maritime Organisation (further IMO) defines three DP equipment classes
which are intended to provide different levels of station keeping reliability (Circular
645, 1994, 5):
1. For equipment class 1, loss of position may occur in the event of a single failure in
any active component or system
2. For equipment class 2, a loss of position is not to occur in the event of a single fault
in any active component or system. Normally static components will not be
considered to fail where adequate protection from damage is demonstrated and
reliability is to the satisfaction of the administration. Single failure criteria include:
– Any active component or system (generators, thrusters, switchboards remote
controlled valves, etc.).
– Any normally static component (cables, pipes, manual valves, etc.) which is not
properly documented with respect to protection.
3. For equipment class 3, a single failure includes:
– Items listed for class 2, and any normally static component are assumed to fail.
– All components in any watertight compartment, from fire or flooding.
– All components in any one fire subdivision from fire or flooding
Classes can be matched to the consequences of loss of position. Basically, with the DP2
class, all active components like generators, thrusters, switchboards, remote controlled
valves, etc. are needed to be redundant. Class 3 requires redundancy of all active
components and normally static components plus the physical separation of the
components.
17
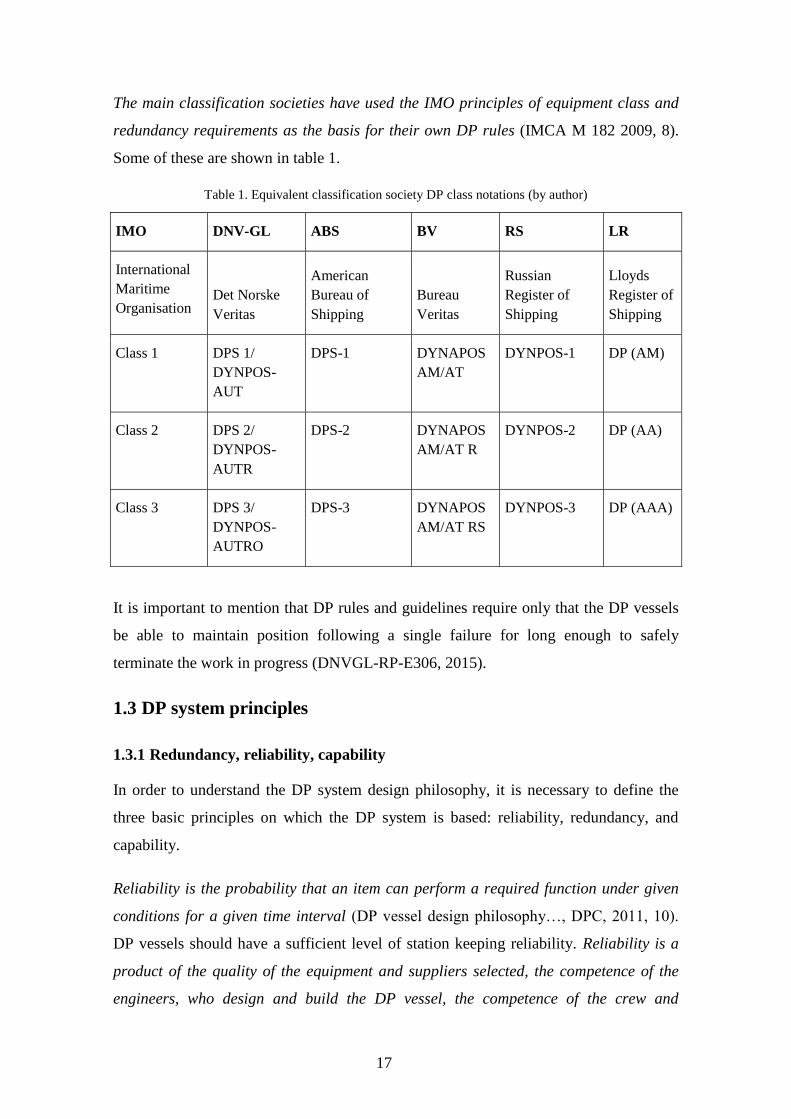
The main classification societies have used the IMO principles of equipment class and
redundancy requirements as the basis for their own DP rules (IMCA M 182 2009, 8).
Some of these are shown in table 1.
Table 1. Equivalent classification society DP class notations (by author)
IMO DNV-GL ABS BV RS LR
International
Maritime
Organisation Det Norske
Veritas
American
Bureau of
Shipping
Bureau
Veritas
Russian
Register of
Shipping
Lloyds
Register of
Shipping
Class 1 DPS 1/
DYNPOS-
AUT
DPS-1 DYNAPOS
AM/AT
DYNPOS-1 DP (AM)
Class 2 DPS 2/
DYNPOS-
AUTR
DPS-2 DYNAPOS
AM/AT R
DYNPOS-2 DP (AA)
Class 3 DPS 3/
DYNPOS-
AUTRO
DPS-3 DYNAPOS
AM/AT RS
DYNPOS-3 DP (AAA)
It is important to mention that DP rules and guidelines require only that the DP vessels
be able to maintain position following a single failure for long enough to safely
terminate the work in progress (DNVGL-RP-E306, 2015).
1.3 DP system principles
1.3.1 Redundancy, reliability, capability
In order to understand the DP system design philosophy, it is necessary to define the
three basic principles on which the DP system is based: reliability, redundancy, and
capability.
Reliability is the probability that an item can perform a required function under given
conditions for a given time interval (DP vessel design philosophy…, DPC, 2011, 10).
DP vessels should have a sufficient level of station keeping reliability. Reliability is a
product of the quality of the equipment and suppliers selected, the competence of the
engineers, who design and build the DP vessel, the competence of the crew and
18
management who maintain and operate it (DNVGL-RP-E306, 2015, 19). DP rules and
guidelines do not specify the levels of reliability.
Redundancy is the existence of more than one means of performing a required function
(DP vessel design philosophy…, DPC, 2011, 10). Redundancy in the DP systems
(single fault tolerance) is achieved by the provision of redundant systems; reliability and
redundancy are not the same. DP class rules have redundancy requirements stipulated in
order to achieve fault tolerant systems and meet the objective of preventing a single
failure which leads to a loss of position. They often do not address the ability of the
vessel to continue its industrial mission (DNVGL-RP-E306, 2015).
DP capability defines a DP vessel’s station keeping ability under given environmental
and operational conditions. DP capability analyses are used to establish the maximum
weather conditions in which a DP vessel can maintain its position and heading for a
proposed thruster configuration.
The groups into which generators, thrusters, and auxiliary services are divided largely
determines the vessel’s worst-case failure and therefore its post-failure DP capability.
The worst-case failure is the failure that has the greatest effect on station keeping
capability (DNVGL-RP-E306, 2015, 24). Generally, the worst-case failure is
determined through FMEA study. The worst case single fault with respect to class
requirements DP2 or 3 is a fault on one of the main bus-bar sections or a fault in a main
propulsion motor.
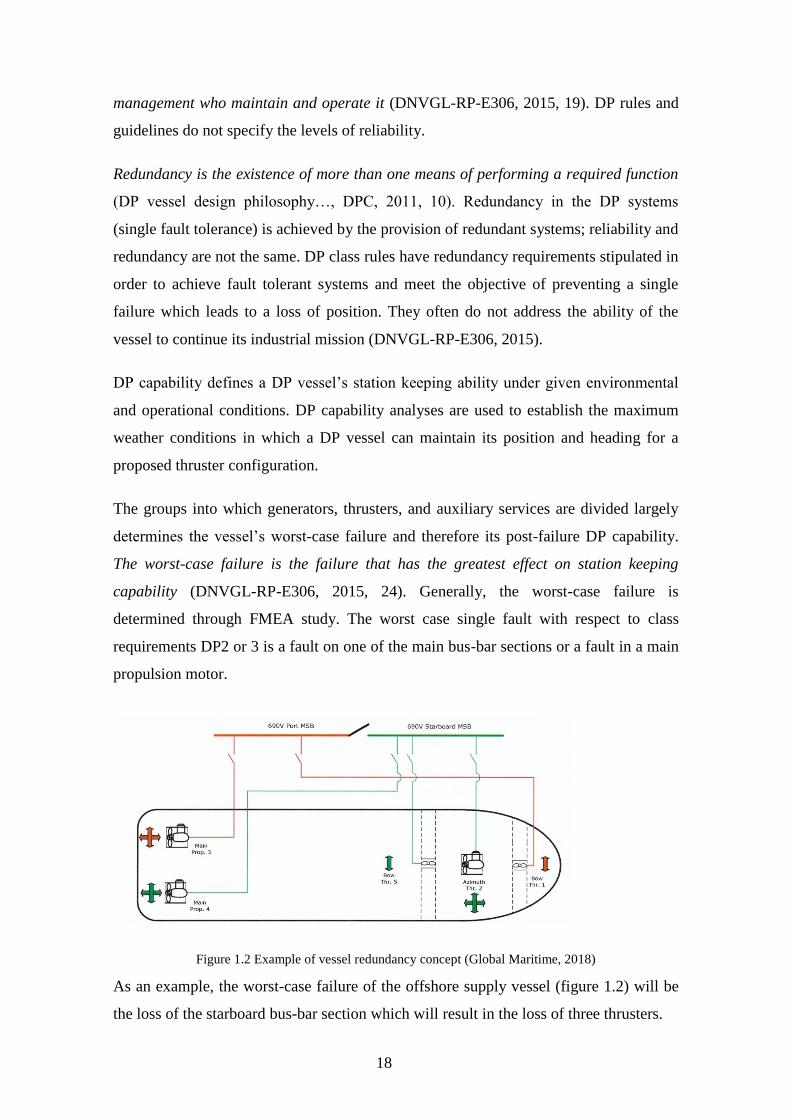
Figure 1.2 Example of vessel redundancy concept (Global Maritime, 2018)
As an example, the worst-case failure of the offshore supply vessel (figure 1.2) will be
the loss of the starboard bus-bar section which will result in the loss of three thrusters.
19
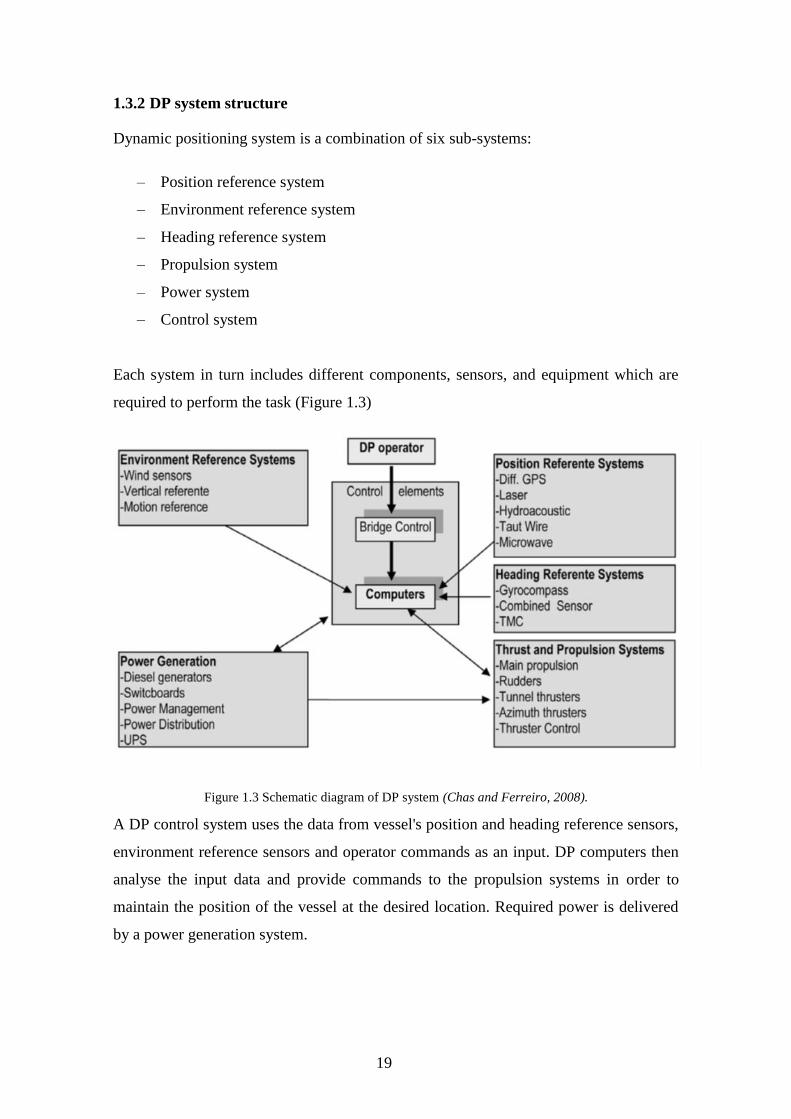
1.3.2 DP system structure
Dynamic positioning system is a combination of six sub-systems:
– Position reference system
– Environment reference system
– Heading reference system
– Propulsion system
– Power system
– Control system
Each system in turn includes different components, sensors, and equipment which are
required to perform the task (Figure 1.3)
Figure 1.3 Schematic diagram of DP system (Chas and Ferreiro, 2008).
A DP control system uses the data from vessel's position and heading reference sensors,
environment reference sensors and operator commands as an input. DP computers then
analyse the input data and provide commands to the propulsion systems in order to
maintain the position of the vessel at the desired location. Required power is delivered
by a power generation system.
20
1.3.3 Theory and mathematical model
When in the open water, the vessel is subject to environmental forces which include
wind, current, and waves. Task specific vessels may also be a subject to task dependent
forces such as a cable, pipe, anchors, tow ropes, or fire monitor reactions. Additionally,
the vessel is subjected to moments which are generated by the vessel’s own propulsion
system. All forces affecting the vessel are variable and have different effects on the
vessel’s motion. As a result of such forces, the vessel’s position, heading, and speed are
constantly changing. Listed changes are measured by a position-reference system and
fed into the DP control system. Additional data from environmental reference system is
used to correct the reference system readings for roll, pitch, wind force, and direction.
The DP control system then calculates the forces that the thrusters must produce in
order to control the vessel’s motion.
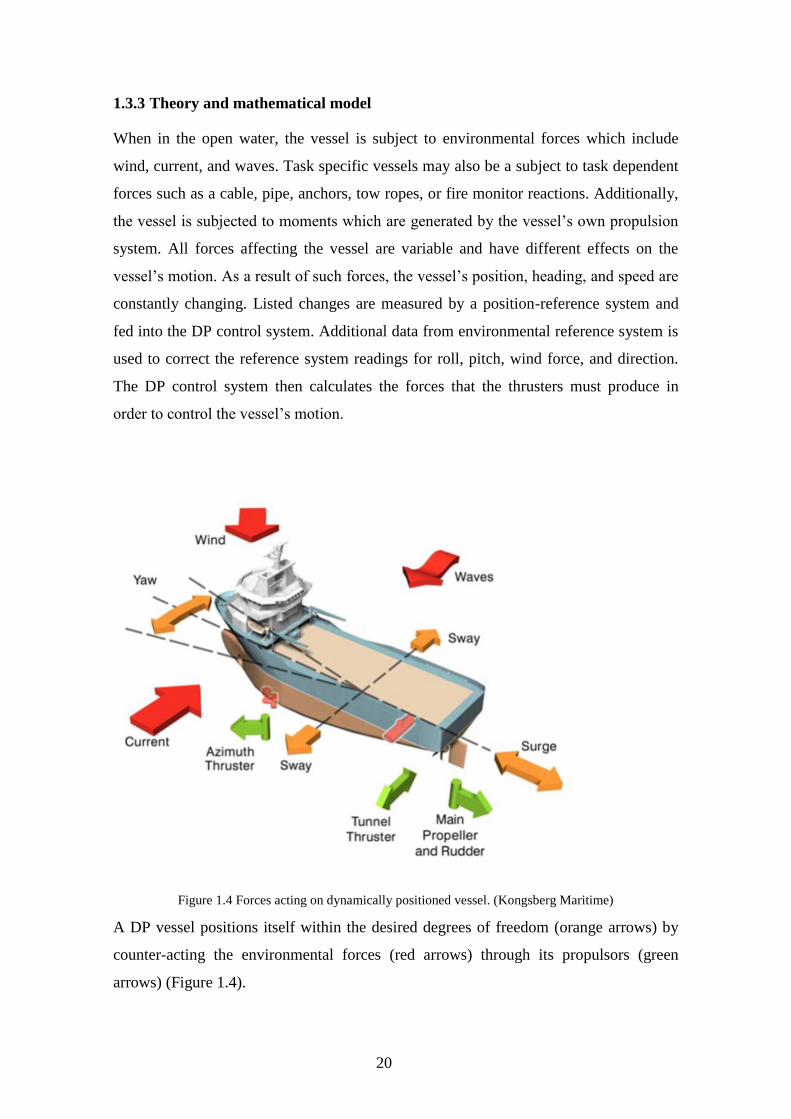
Figure 1.4 Forces acting on dynamically positioned vessel. (Kongsberg Maritime)
A DP vessel positions itself within the desired degrees of freedom (orange arrows) by
counter-acting the environmental forces (red arrows) through its propulsors (green
arrows) (Figure 1.4).
21
The DP system controls the vessel within three degrees of freedom - surge, sway, and
yaw - in the horizontal plane. The vessel also moves in three vertical degrees of
freedom: pitch, roll, and heave. The pitch and roll motions are not controlled by the DP
system, however, in order to allow the position-reference system to correct for these
motions, the system must have information about them. Dynamic positioning is only
concerned with the automatic control of surge, sway, and yaw. Surge and sway are
related to the position of the vessel, while yaw is defined by the vessel heading (Chas &
Ferreiro, 2008).
In a simple closed feedback loop control system, a change of a sensed condition causes
an action to counteract the change; the effect of the change is then sensed again and so
on. Forces acting on vessel are variable in nature. To reduce oscillations in the data,
some sort of filtering is required. The control system therefore incorporates a
mathematical model of the vessel along with a Kalman filter. The mathematical model
is an accurate description of the vessel’s response to any external forces. Even if the
mathematical model of the vessel is as accurate as possible, it will never be 100%
correct. For this reason, measured data and data received from the mathematical model
are used together and are processed by the Kalman Filter algorithm.
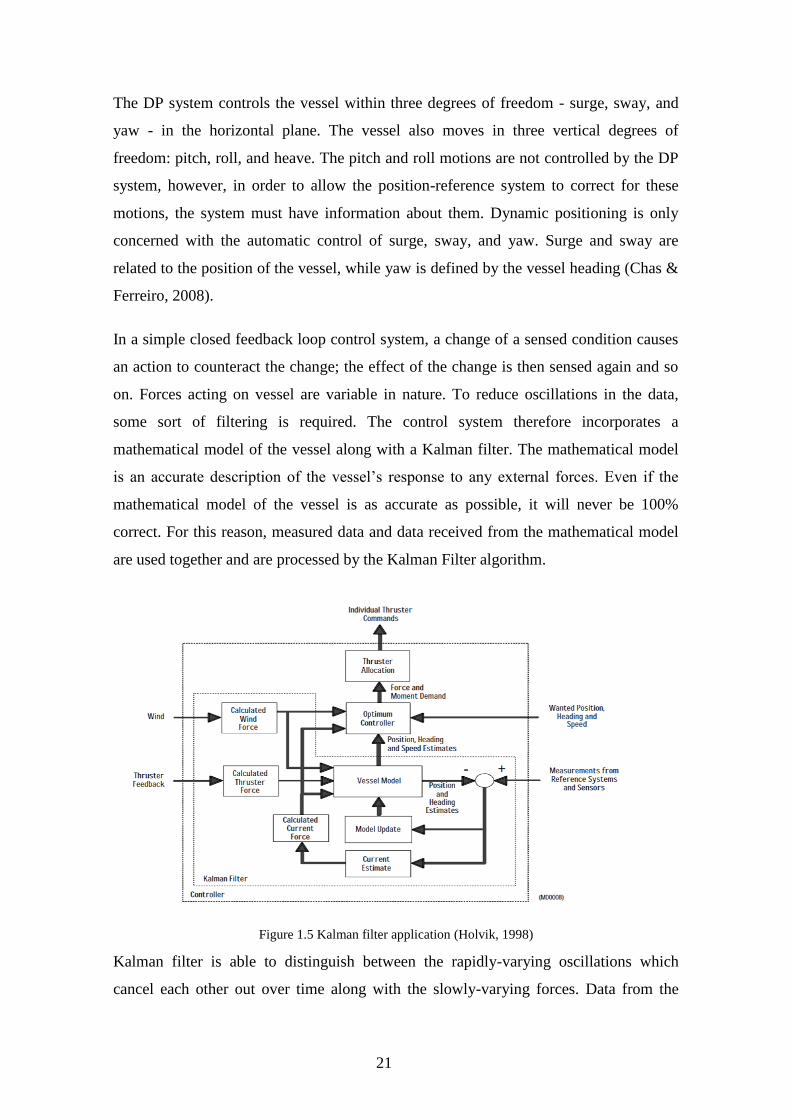
Figure 1.5 Kalman filter application (Holvik, 1998)
Kalman filter is able to distinguish between the rapidly-varying oscillations which
cancel each other out over time along with the slowly-varying forces. Data from the
22
different sensors, processed by a filter, are weighed in accordance with their noise levels
and then used to update the state of a ship, received from the mathematical model. This
data is compared with the required position of the vessel, input by the operator, the
speed, any other forces, and the thruster demand that is created (Figure 1.5). The result
of the thrust is then fed back to update the model vessel. (Alstom, 2000)
Over a period of time on location, the mathematical model adapts itself to the
environmental forces. This process is often referred as ‘building up the model’. It helps
to improve vessel station keeping capabilities, reduces fuel consumption, and the active
use of thrusters. In the case of reference system failure, the DP system will go into
‘dead-reckoning’ mode and will use the created environmental model as a position
reference input. The Kalman filter also provides the optimum combination of data from
the different position-reference systems. (Holvik, 1998)
1.3.4 Operational modes
Today, DP Systems are not only designed for station keeping but also offer different
operational modes with which to control the vessel. Each vessel, depending on its roles,
may support several operational or control modes, however, the vessel can only be
under the control of one operational mode at any one time. The difference between the
modes is found in the way in which the position and speed are controlled (Alstom,
2000). The typical list of operational modes is given in Appendix 1.
Operation modes may vary between the manufacturers. Normally, before an operational
mode can be selected, the system will check that the minimum set of equipment needed
to operate the mode is available and that it has been selected.
1.4 Main components of DP system
1.4.1 Computers and control console
The processors operating the DP control software are generally known as DP
computers. Depending upon the class notation of the DP vessel, computers may be
installed in single, dual, or triple configurations. Modern systems communicate via
intranet or local area network (LAN) which may incorporate many other vessel control
functions in addition to dynamic positioning. In all DP vessels, the DP control
computers are dedicated specifically to the DP function with no other tasks. A single-
23
computer system or 'simplex' DP control system provides no redundancy. A dual or
two-computer system provides redundancy and auto-changeover if the online system
fails. A triple or 'triplex' system, usually installed on DP3 vessels, provides an extra
element of redundancy and an opportunity for 2-out-of-3 voting.
The control console, or so-called operator station, is the DP system interface and
provides the facility for the DP operator to send and receive data. Console incorporates
control buttons, switches, indicators, alarms, and screens. Important parameters from
the power, thruster system, and DP control systems are displayed to ensure that those
systems are functioning correctly. Information necessary to operate the DP system
safely should be visible at all times. Other information should be available upon
operator request. In a well-designed and ergonomic DP control station, the position
reference system control panels, thruster panels, and communications are ergonomically
located close to the DP control console.
1.4.2 Position reference system
Accurate, reliable, and continuous position information is essential for dynamic
positioning. There are many different Position Reference Systems (further PRS)
available for DP systems; the selection of position measuring equipment for a vessel is
based on the role of the vessel (Alstom, 2000). Position reference may either be absolute
or relative systems. An absolute system gives the vessel’s geographical position. A
relative system gives the vessel's position in relation to a non-fixed reference.
A position reference system may incorporate different types of position measuring
equipment. It is possible to use just one type, however, for reliability, two or more types
of position references are usually used.
Characteristics of different reference systems are shown in Appendix 2. When several
PRS are online, a voting system can be used to pool the position values which weights
the values as appropriate. If only one position reference system is enabled in the DP
then it is simply checked, filtered, and used.
24
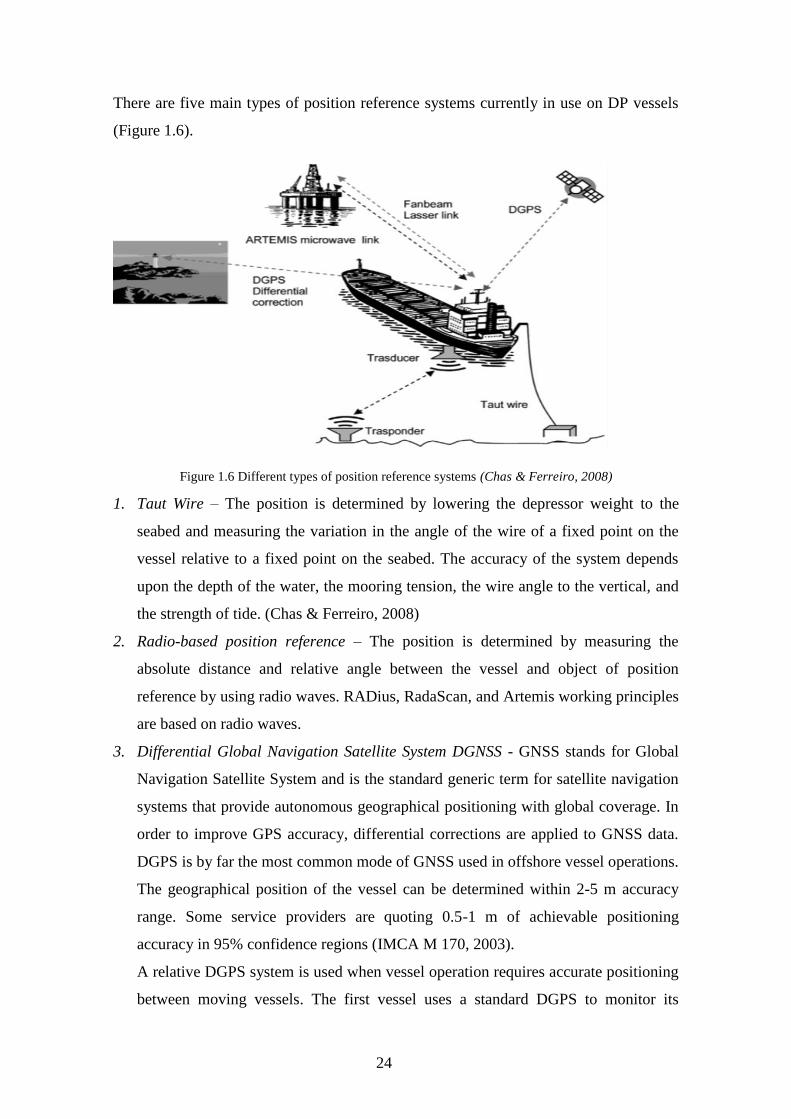
There are five main types of position reference systems currently in use on DP vessels
(Figure 1.6).
Figure 1.6 Different types of position reference systems (Chas & Ferreiro, 2008)
1. Taut Wire – The position is determined by lowering the depressor weight to the
seabed and measuring the variation in the angle of the wire of a fixed point on the
vessel relative to a fixed point on the seabed. The accuracy of the system depends
upon the depth of the water, the mooring tension, the wire angle to the vertical, and
the strength of tide. (Chas & Ferreiro, 2008)
2. Radio-based position reference – The position is determined by measuring the
absolute distance and relative angle between the vessel and object of position
reference by using radio waves. RADius, RadaScan, and Artemis working principles
are based on radio waves.
3. Differential Global Navigation Satellite System DGNSS - GNSS stands for Global
Navigation Satellite System and is the standard generic term for satellite navigation
systems that provide autonomous geographical positioning with global coverage. In
order to improve GPS accuracy, differential corrections are applied to GNSS data.
DGPS is by far the most common mode of GNSS used in offshore vessel operations.
The geographical position of the vessel can be determined within 2-5 m accuracy
range. Some service providers are quoting 0.5-1 m of achievable positioning
accuracy in 95% confidence regions (IMCA M 170, 2003).
A relative DGPS system is used when vessel operation requires accurate positioning
between moving vessels. The first vessel uses a standard DGPS to monitor its
25
position. The second vessel receives GPS data on its own receiver and also receives
GPS data from the first vessel over an Ultra high frequency (UHF) link. The second
vessel then compares the two positions before deriving a range and bearing which is
fed to the DP system. (Alstom, 2000).
4. Hydro-acoustic Position reference HPR - Hydro-acoustic systems (HPR) provide
positioning with transponders placed on the seabed and a transducer placed in the
ship’s hull; using the propagation of sound through water in the same way as radio
waves above the water. (Alstom, 2000). Disadvantages of this is the vulnerability to
noise by thrusters or other acoustic systems. Also, the use is limited in shallow
waters (Chas & Ferreiro, 2008).
5. Laser-based systems - there are two major laser DP position references in use:
Fanbeam and CyScan. Both systems lock onto a single target and/or a number of
targets on the structure, from which position must be maintained. Light pulses are
sent and received in order to measure range and bearing (IMCA M 170, 2003).
1.4.3 Environment reference system
An environment reference system measures the environmental forces acting on the
vessel including wind, current, and waves. The systems consist of sensors which are
feeding the environmental information into the DP system. The vessel sensors are:
– Gyrocompass – The gyrocompass is used for heading control.
– Vertical Reference Unit (VRU) - The VRU on the vessel determines the
difference between the ‘local’ vertical and reference plane of vessel. Although a
DP system does not control a vessel in the pitch, roll, and heave axes, pitch and
roll must be measured to provide accurate compensation for some position
measurement equipment.
– Anemometer/Wind sensor - An anemometer is a device for measuring both the
speed and direction of the wind. Wind is a major disturbing element on a vessel.
The wind speed and direction are used to improve position control by modifying
thruster demands.
– Doppler Log - The Doppler log measures the vessel’s speed over the seabed. It
uses sound and the Doppler Effect that is produced by a moving sound source
having an altered reflected frequency which varies in proportion to the speed of
that sound source (Alstom, 2000).
26
1.4.4 Propulsion system
The propulsion system is critical for the overall performance of the vessel, including the
vessel’s station keeping capability. Diesel electric propulsion is now almost universal
amongst medium and large DP vessels but direct driven and hydraulically driven
thrusters are still used on some vessels (IMCA M 206 Rev. 1, 2016, 3).
Generally, four common types of thrusters are used on dynamically positioned vessels:
1. Conventional propellers with rudders
2. Tunnel thrusters
3. Azimuthing thrusters
4. Azipod thrusters
A propeller is the traditional method of vessel propulsion. Propellers may be in either
single or twin configurations. Two types of propellers are used: controllable pitch
propellers (further CPP) or fixed pitch propellers (further FPP). Propellers provide
thrust in both directions, however, due to the shape of the blades and the effect of the
hull, the amount of thrust in the reverse direction is only 40-60% of that which is
available in the forward direction (Alstom, 2000). Rudders provide sway force to the
vessel in conjunction with the propeller. Generally, rudders are considered inefficient
when side thrust is required. DP vessels with conventional shafted propulsion will have
stern tunnel thrusters for improvement of manoeuvrability.
Tunnel thrusters are mounted in the bow and/or stern of the vessel. These enable the
vessel to be moved sideways and provide a turning moment. Similar to a main propeller,
thrusters may be of the CPP or FFP type. Tunnel thrusters are only effective at very low
speeds and when located as far below the waterline as possible.
While tunnel thrusters are located in the tunnel and can only provide thrust in two
directions, Azimuth thrusters are able to rotate. By rotating the thruster, the direction of
thrust can be controlled within 3600. The magnitude of thrust can be controlled in pitch
or speed (CPP or FPP with variable speed drive). Azimuth thrusters are positioned so
that they interfere as little as possible with each other as well as to avoid becoming
damaged by touching the sea bed. They can also be retractable.
27
Azipod is a complete propulsion unit suspended below the ship. The pod contains an
electric motor, the drive end of which is attached to a fixed pitch propeller. Azipod can
also be rotated through 3600 providing high manoeuvrability.
1.4.5 Power system
Power system reliability has a very high importance to DP operations. Power needs to
be supplied to the thrusters and all auxiliary systems, as well as to the DP control
elements and reference systems.
The design of today’s offshore vessels and installations is driven by different
environmental regulations, where emissions to the air are important. The majority of the
offshore support vessels use Marine Diesel oil (further MDO). MDO is also preferred
due to its readiness for use. For medium size installations, piston engines are normally
used. Larger DP operated offshore oil & gas production vessels and semi-submersible
units will normally be designed with an electrical propulsion system (Sørfonn, 2007, 5).
The thrusters are the biggest consumers of the generated power. While in operation, the
power demand depends on the environmental conditions and the mode in which system
is operated. Due to this fact, the power system of DP vessels should be flexible and able
to handle short power surges. The power systems are also required to comply with the
relevant rules for the vessel’s mandatory classification notations. All essential services
for generators and their prime movers such as cooling, fuel, air, and lubricating systems
are to be arranged in accordance with vessels DP notation.
After power is generated, it needs to be safely delivered to consumers. The electrical
systems of today’s vessels require extensive use of power electronics and a
sophisticated Power Management System (further PMS). A PMS is designed to control
and monitor the electric power production and consumption on-board a vessel. The
system controls and monitors the engine driven generators, switchboards, and
consumers. In the case of an electrical system fault, the power management system
restores power in the smallest amount of time possible. On a typical diesel-electric
installation, the power is produced by gen-sets (generator driven by diesel engine). The
number and configuration of the gen-sets depends on the DP notation requirements and
considering capability needs.
28
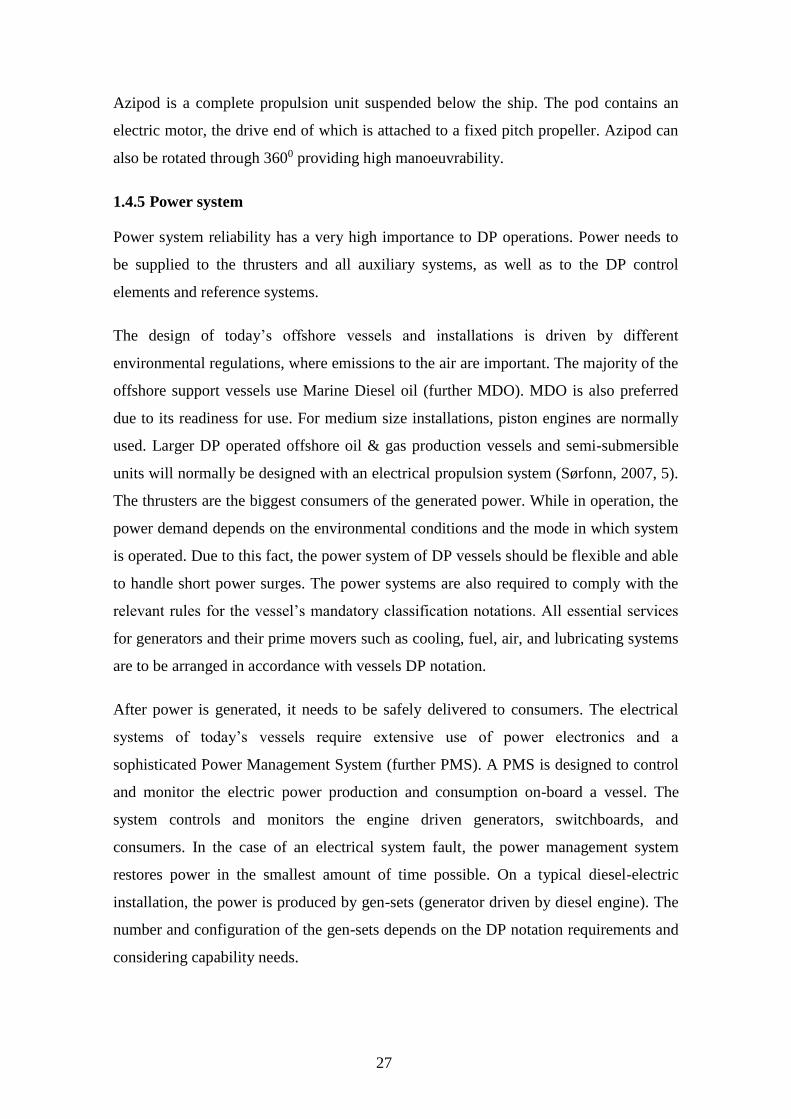
A simplified line diagram of the offshore support vessel power system consisting of
four gen-sets connected to the common bus-bar. Gen-sets provide power to thruster
electrical drives through the transformers. Thruster speed is controlled by using
frequency converters. By opening the bus-tie, the bus-bar can be divided into two
different sections, providing the required redundancy (figure 1.7)
Figure 1.7 Simplified single line diagram of the DP vessel power system (Sørfonn, 2007)
There are extensive requirements to the reliability and redundancy of the power systems
due to their importance and vulnerability. Most important of them are discussed in the
next chapters.
29
2 Methodology
2.1 Literature overview
To ensure the reliable and safe operation of dynamically positioned vessels, regulations
are necessary. The history of DP regulation can be widely found elsewhere, however,
today there are two main regulatory bodies producing guidelines designed to improve
safety and operational performance associated with dynamic positioning:
– International Marine Contractors Association (IMCA)
– Dynamic Positioning Committee (DPC)
The first formal guidance for vessels with dynamic positioning systems was issued by
IMO in 1994, providing an international standard for dynamic positioning systems on
all types of new vessel. While IMO circular outlines the minimum requirements for DP
vessels, more detailed guidelines are produced by IMCA. ‘Guidelines for the design and
operation of Dynamically Positioned Vessels’ addresses the different aspects of
dynamic positioning systems including the associated operational hazards and safe
design of the equipment. The Dynamic Positioning Committee produced ‘DP vessel
design philosophy guidelines’ to outline detailed requirements and design suggestions
for DP vessels. Training and experience of key DP personnel is addressed in IMCA
circular M117 (former IMO MSC 738).
In addition to all above listed documents, both IMCA and DP committees take an active
role in developing and publishing the detailed guidelines, addressing various
components of dynamic positioning as well as associated equipment. Some of them rely
on past incidents and statistics, whilst others concentrate on the theoretical study of this
complex system.
2.2 Selecting data
To achieve the goals set in this thesis, historical incident data is required. In maritime
industry, accidents are required to be reported to the flag state and/or to the governing
body of the territorial waters where the event took place. Generally, the accident is the
event or sequence of events what has resulted in a serious injury, death of a person,
30
material damage to a ship, or pollution to the environment. According to legislation, the
reporting of the ship’s equipment breakdowns, which do not lead to an accident, is not
required. Such breakdowns can be classified as incidents. The Merchant Shipping
(Accident Reporting and Investigation) Regulations describe incident as an “event or
sequences of events which has occurred directly in connection with the operation of a
ship that endangered, or if not corrected would endanger the safety of a ship, its
occupants or any other person or the environment” (Merchant Shipping Regulations,
2012). Despite the fact that a failure of the dynamic positioning system, if not corrected,
may lead to a serious accident, reporting of such events is not compulsory.
To improve safety, reliability, and operational efficiency of the dynamically positioned
vessels, IMCA facilitates DP stations keeping event reporting systems and encourages
its members and non-members to submit the information regarding such events.
Reported events are then sorted and published on the IMCA website on a yearly basis.
To preserve the anonymity of the reports, the events are assigned with numbers and are
presented in a format of an incident tree (Appendix 3). Reports are available for
members free of charge and non-members can purchase the publications. Incident data
required to conduct this study was kindly provided by IMCA upon request with no
charge.
The study is based on the events reported to IMCA in the period of 2007-2015, covering
9 years of DP operations. Reported events are categorised by IMCA into DP incidents,
DP undesired events, and DP observations. For the purpose of this thesis, only DP
incidents are studied. IMCA defines a DP incident as a major system failure,
environmental, or human factor which has resulted in a loss of DP capability. DP vessel
station keeping capability is the ability of the vessel to maintain position and heading in
defined environmental conditions. In total, 619 events categorised as incidents by
IMCA were reported during the given period.
31
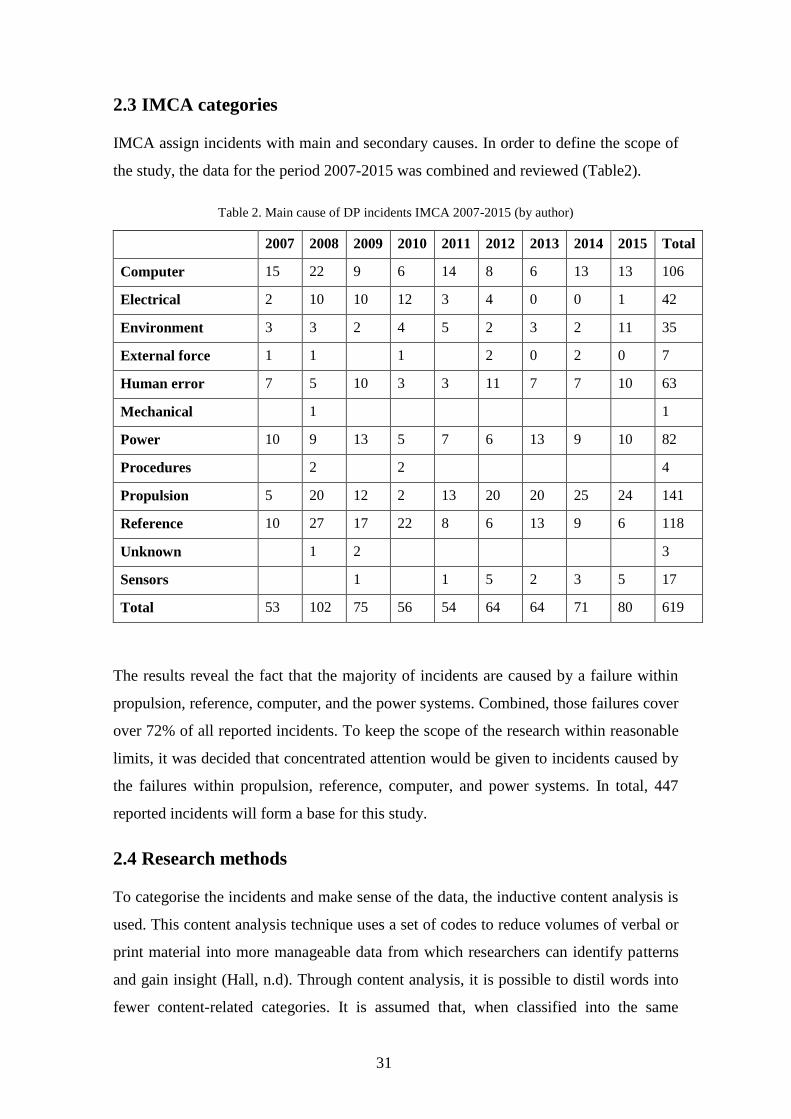
2.3 IMCA categories
IMCA assign incidents with main and secondary causes. In order to define the scope of
the study, the data for the period 2007-2015 was combined and reviewed (Table2).
Table 2. Main cause of DP incidents IMCA 2007-2015 (by author)
2007 2008 2009 2010 2011 2012 2013 2014 2015 Total
Computer 15 22 9 6 14 8 6 13 13 106
Electrical 2 10 10 12 3 4 0 0 1 42
Environment 3 3 2 4 5 2 3 2 11 35
External force 1 1
1
2 0 2 0 7
Human error 7 5 10 3 3 11 7 7 10 63
Mechanical
1
1
Power 10 9 13 5 7 6 13 9 10 82
Procedures
2
2
4
Propulsion 5 20 12 2 13 20 20 25 24 141
Reference 10 27 17 22 8 6 13 9 6 118
Unknown
1 2
3
Sensors
1
1 5 2 3 5 17
Total 53 102 75 56 54 64 64 71 80 619
The results reveal the fact that the majority of incidents are caused by a failure within
propulsion, reference, computer, and the power systems. Combined, those failures cover
over 72% of all reported incidents. To keep the scope of the research within reasonable
limits, it was decided that concentrated attention would be given to incidents caused by
the failures within propulsion, reference, computer, and power systems. In total, 447
reported incidents will form a base for this study.
2.4 Research methods
To categorise the incidents and make sense of the data, the inductive content analysis is
used. This content analysis technique uses a set of codes to reduce volumes of verbal or
print material into more manageable data from which researchers can identify patterns
and gain insight (Hall, n.d). Through content analysis, it is possible to distil words into
fewer content-related categories. It is assumed that, when classified into the same
32
categories, words, phrases, and the like will share the same meaning (Cavanagh, 1997).
Content analysis can be used in an inductive or deductive way. The purposes for using
an inductive approach are to condense extensive and varied raw text data into a
summary format, establish clear links between the research objectives, and to develop a
model or theory about the underlying structure of experiences or processes which are
evident in the raw data. (Thomas, 2003) If there is not enough former knowledge about
the phenomenon or if this knowledge is fragmented, the inductive approach is
recommended (Lauri & Kyngäs, 2005). Inductive content analysis is a qualitative
method of content analysis that researchers use to develop theory and identify themes
by studying documents, recordings, as well as other printed and verbal material. (Hall,
n. d) An approach based on inductive data moves from the specific to the general, so
that particular instances are observed and then combined into a larger whole or general
statement (Chinn &Kramer, 1999).
By applying inductive content analysis, the main causes of incidents are identified,
coded, and categorised into similar content categories until common patterns are
identified. Usually the purpose of categories is to build up a model, conceptual system,
conceptual map or categories (Elo & Kyngäs, 2008). Results of the research are
presented in the form of conceptual models that show categories of main causes leading
to different LOP incidents.
33
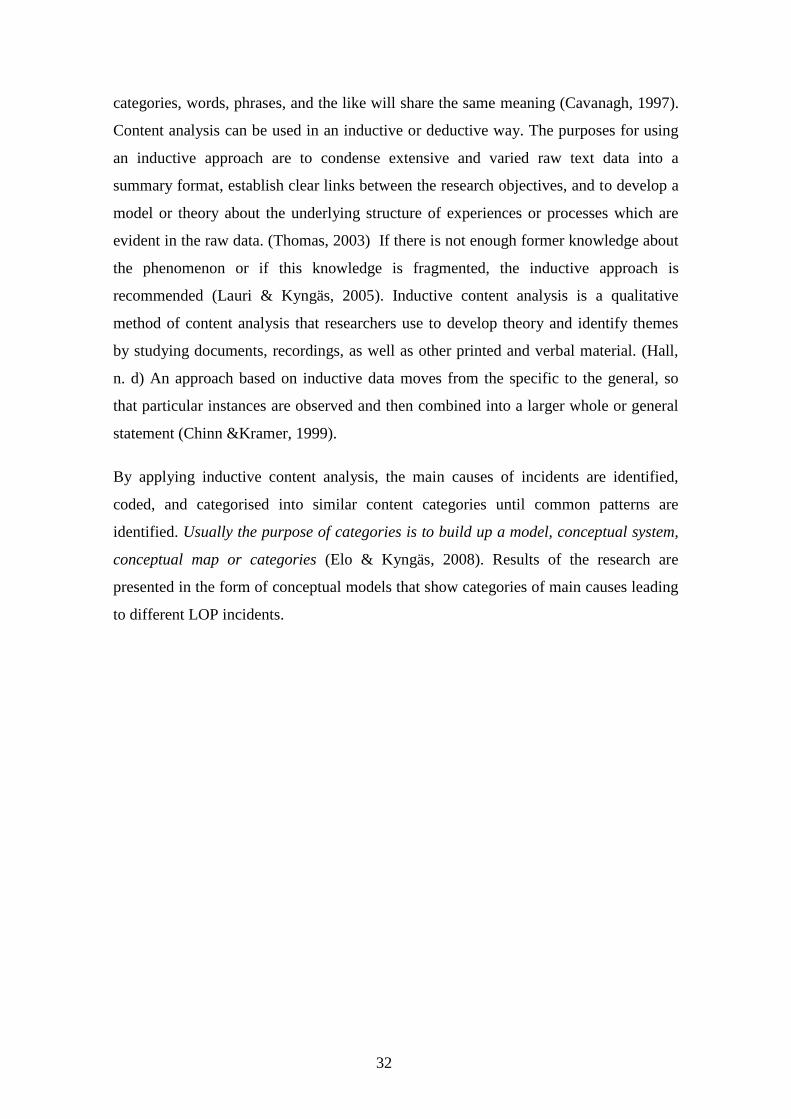
The following table (table 3) explains the workflow of the theoretical inductive analysis
based on Elo & Kyngäs (2008) and associated steps within this research.
Table 3. Workflow of the research (by author)
Phase Theoretical Practical
Preparation Selecting the unit of
analysis
Reviewing of the historical DP incident data
in order to:
– define the scope of research,
– identify the main causes of common
failures,
– identify the connection between
failures and type of incidents they
cause.
Preparation Making sense of the data Reading through the incident reports to get a
whole picture of the upcoming research.
Organising data Open coding Studying the incident report and assigning
each incident with the major cause.
Organising data Categorization Main causes are classified into similar
content categories
Organising data Abstraction Tables, showing causes and associated
categories are created.
Reporting Model, conceptual
system
Failure models are created.
The process of data organisation was carried out using Microsoft Excel software. Each
row represented an incident and columns were populated as follows: group, incident
number, what happened, main cause, and type of incident (drift off, drive off, potential
incident). Some additional data was also entered regarding the types of equipment
which were online during incident (Appendix 4).
In order to quantify the data, the frequencies of failures and causes were calculated.
Created conceptual models represent the failures according to the frequencies of their
occurrence in descending order with more frequent failures being on top.
34
2.5 Credibility and limitations
Data used to conduct this research originated from a secondary source and has been pre-
sorted by IMCA. The information presented on the reports is limited to the incident tree
and a brief description of the incident. Reports also provide the main cause and a
secondary cause of the incident. To identify the cause and assign it into a category, three
aspects were taken into account: data available from reports, author’s experience, and
literature review. Additionally, consultations were held with experienced DP operators.
All incidents, where available data was insufficient to identify the main cause, were
excluded from this study.
Reports are also sorted by incident type into ‘drift off’ and ‘drive off’ categories.
Reports, in which the fact of actual loss of position was not definite, were categorised as
‘potential incidents’. For reasons of space, the conceptual models of potential LOP
incidents were not built, but general models of incident are given in the appendices.
No attempt was made to categorise the incidents by DP class. Despite DP class notation
being an essential factor regarding position keeping, IMCA reports do not provide such
information.
Also, all incidents in which the human factor played a key role were excluded from this
study.
35
3 Results
3.1 Propulsion failures
3.1.1 Initial sorting
The propulsion system is a key part of a Dynamic Positioning system. The
consequences of propulsion failures directly affect the station keeping performance of
the DP vessel. According to the American Bureau of Shipping (further ABS) guide for
DP vessels, the propulsion, or in the other words ‘thruster system’, is defined as a
combination of components and systems necessary to supply the DP system with
required thrust force and thrust direction. The thruster system includes:
– Thrusters with drive units and necessary auxiliary systems including piping.
– Main propellers and rudders if these are under the control of the DP system.
– Thruster control electronics.
– Manual thruster controls.
– Associated cabling and cable routing.
When the main propulsion propellers are included under DP control, they are
considered as thrusters and all relevant functional requirements are applied (ABS 2013,
24).
In addition to a vessel’s common requirements, the dynamically positioned vessel has to
be able to provide the forces required to execute manoeuvres in surge, sway, and yaw.
The total forces must be controllable in magnitude from zero to full power as well as in
direction through 360° (DNVGL-RP-E306, 2015, 43). IMO and classification societies
stipulate the redundancy requirements for each DP class. The vessel with DP1 notation
should have thrusters in number and of a capacity sufficient enough to maintain position
and heading under the specified maximum environmental conditions. Vessels with DP2
or DP3 notation are to have thrusters in number and of a capacity sufficient to maintain
position and heading, in the event of any single failure, under the specified maximum
environmental conditions. This includes the failure of any one or more thrusters. (ABS,
2013) DP rules and guidelines generally include requirements that thrusters should have
a fail-safe and not develop uncontrolled thrust or reverse the direction of thrust as the
36
result of a single failure. Potential fail-safe conditions include: fail as set, fail to zero
thrust, or motor stop (IMCA M 206 Rev.1, 2016).
In this section, all reported incidents that were caused by some sort of propulsion
system failure are analysed. In total, 141 reported incidents are transferred from IMCA
publications into the research Excel worksheet. After initial sorting, some adjustments
were made with regards to the failures and reports were moved as follows:
– Moved to ‘Power’ section – 15 reports
– Removed from the list – 3 reports
– Removed as ‘Human error’ – 9 reports
– Added from ‘Power section’- 2 reports
The available data does not provide accurate information regarding the type of
propulsion. By analysing the reports, it was possible to identify wherever the engine
was used to generate electrical power or wherever it was powering the thruster units
directly. Incidents what were caused by the failure of the prime movers within the gen-
sets were moved to the ‘power’ section. Uninterrupted power supplies (further UPS)
failures, electrical network earth faults, and unidentified power supply problems were
also moved to the ‘Power’ section. Incidents caused by the engines which were part of
the propulsion (main engines) and thrusters driven directly by engine remained in the
‘Propulsion’ subsection.
In a complicated socio-technical system such as DP, it is often difficult to distinguish
between human error and technical failure. In some reports, the human factor played a
significant role. Wrong set-up after repairs, incorrect maintenance procedures, and
installation of faulty or incorrect components are just a few examples of how human
action may affect the performance of the propulsion system.
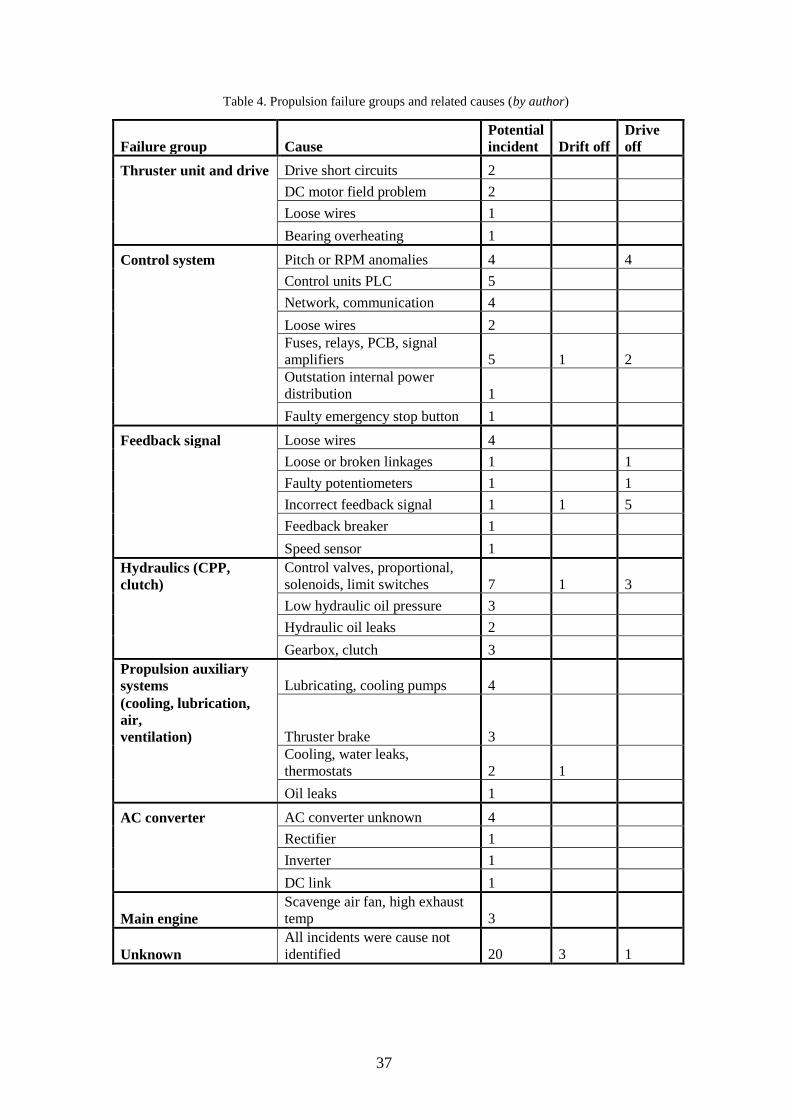
3.1.2 Failure groups and causes
By analysing remaining 116 reports, the possible main causes of the failures were
identified, grouped, and the frequencies of their occurrence calculated. Results are
shown in table 4. Due to insufficient information, the main cause of 24 incidents was
not identified.
37
Table 4. Propulsion failure groups and related causes (by author)
Failure group Cause
Potential
incident Drift off
Drive
off
Thruster unit and drive Drive short circuits 2
DC motor field problem 2
Loose wires 1
Bearing overheating 1
Control system Pitch or RPM anomalies 4
4
Control units PLC 5
Network, communication 4
Loose wires 2
Fuses, relays, PCB, signal
amplifiers 5 1 2
Outstation internal power
distribution 1
Faulty emergency stop button 1
Feedback signal Loose wires 4
Loose or broken linkages 1
1
Faulty potentiometers 1
1
Incorrect feedback signal 1 1 5
Feedback breaker 1
Speed sensor 1
Hydraulics (CPP,
clutch)
Control valves, proportional,
solenoids, limit switches 7 1 3
Low hydraulic oil pressure 3
Hydraulic oil leaks 2
Gearbox, clutch 3
Propulsion auxiliary
systems Lubricating, cooling pumps 4
(cooling, lubrication,
air,
ventilation) Thruster brake 3
Cooling, water leaks,
thermostats 2 1
Oil leaks 1
AC converter AC converter unknown 4
Rectifier 1
Inverter 1
DC link 1
Main engine
Scavenge air fan, high exhaust
temp 3
Unknown
All incidents were cause not
identified 20 3 1
38
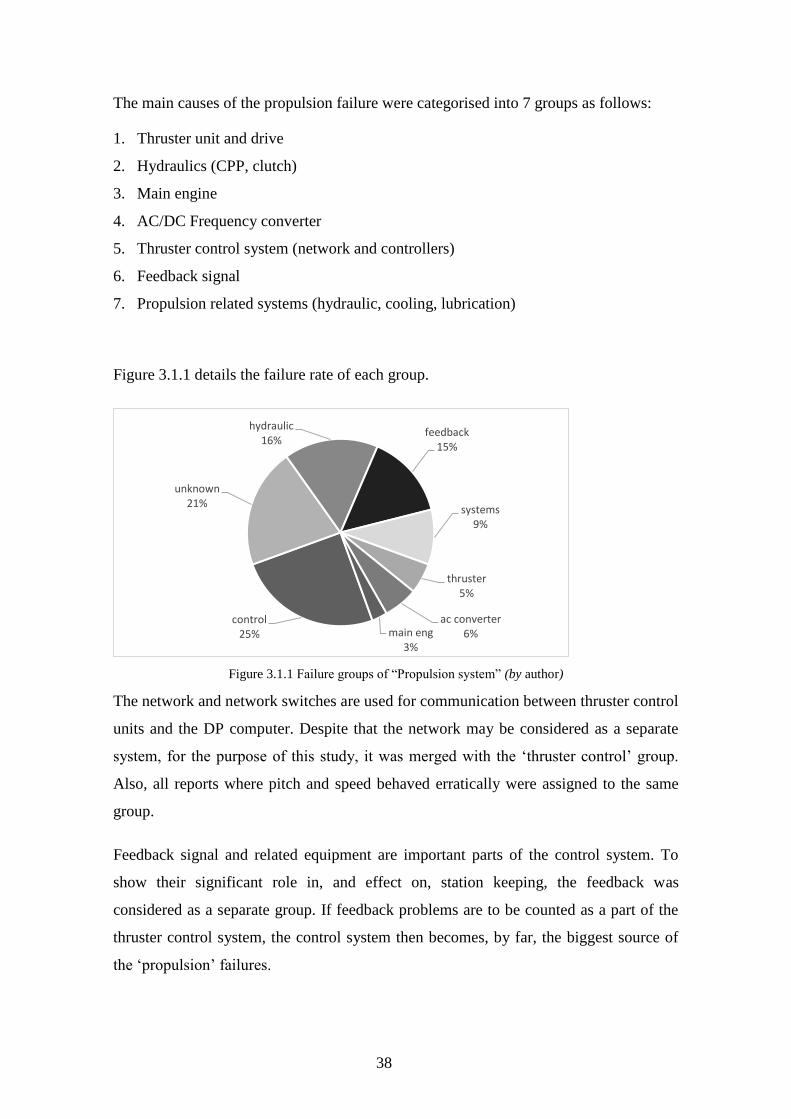
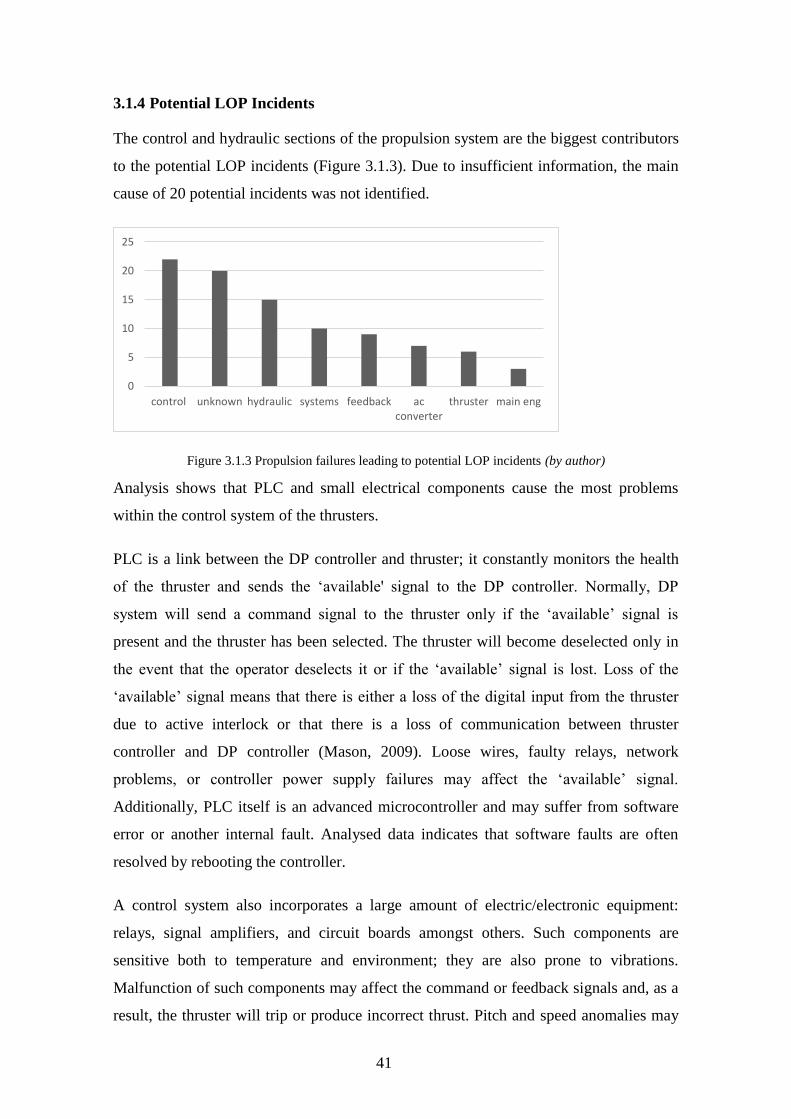
The main causes of the propulsion failure were categorised into 7 groups as follows:
1. Thruster unit and drive
2. Hydraulics (CPP, clutch)
3. Main engine
4. AC/DC Frequency converter
5. Thruster control system (network and controllers)
6. Feedback signal
7. Propulsion related systems (hydraulic, cooling, lubrication)
Figure 3.1.1 details the failure rate of each group.
Figure 3.1.1 Failure groups of “Propulsion system” (by author)
The network and network switches are used for communication between thruster control
units and the DP computer. Despite that the network may be considered as a separate
system, for the purpose of this study, it was merged with the ‘thruster control’ group.
Also, all reports where pitch and speed behaved erratically were assigned to the same
group.
Feedback signal and related equipment are important parts of the control system. To
show their significant role in, and effect on, station keeping, the feedback was
considered as a separate group. If feedback problems are to be counted as a part of the
thruster control system, the control system then becomes, by far, the biggest source of
the ‘propulsion’ failures.
control 25%
unknown21%
hydraulic16%
feedback15%
systems9%
thruster5%
ac converter6%main eng
3%
39
“There has been a noticeable reduction in failure rates of thrusters since the
introduction of variable frequency drives with fixed pitch propellers” (DP vessel design
philosophy…, DPC 2011, 30). An attempt was made to sort the incidents by the type of
the propeller into FPP and CPP. Unfortunately, the information provided within the
reports was insufficient to control the above statement. However, the problems with
controllable pitch propellers were clearly mentioned in 31 reports. Also, the amount of
hydraulic and feedback failures may suggest that the CPP failure rate is rather high.
In general, control and feedback signals may be affected by loose or damaged wires,
poor contacts in terminals, and blown fuses, amongst others. Also, errors within the
network or local thruster programmable logic controller (further PLC) may lead to
thruster failure. In case of a power supply failure, control, or feedback signals errors, the
thruster is designed to fail safe. It is supposed to stop or speed/thrust should be reduced
to zero. By doing so, the vessel’s station keeping capability will be affected but ‘drive
off’ may be prevented. Additionally, feedback signal failure may cause the converter to
increase motor speed on some units and stop the others.
Hydraulic systems are normally used to control the CPP and steering. Generally, if
hydraulic pressure is lost, the protection system is designed to stop the thruster (IMCA
M 206 Rev. 1, 2016). Jamming of proportional control valves is another common cause
of hydraulic system failures (Phillips, 1998).
Failures within the variable speed drives that may affect the station keeping are centred
around frequency converter and electric drive. Wire break, bad contact, or a blown fuse
within the converter may cause under or over-voltage and, as a consequence, the
thruster will trip. Overheating or failure of the thyristor will lead to load reduction and,
if not rectified, will eventually trip the converter. Short circuits, earth faults, or open
circuits within the drive will take the thruster out of operation for extended period of
time.
Auxiliary systems failures may also have a significant effect on position keeping
capability (IMCA M 206 Rev.1 2016, 121). Leaks, pump failures, and power supply
failures are just some examples of the possible causes.
Diesel engine driven thrusters or propellers also have issues which may influence the
station keeping capabilities of the DP vessel (IMCA M 206 Rev.1, 2016). In addition to
40
common engine and auxiliary system failures, they may also be affected by clutch and
related equipment errors.
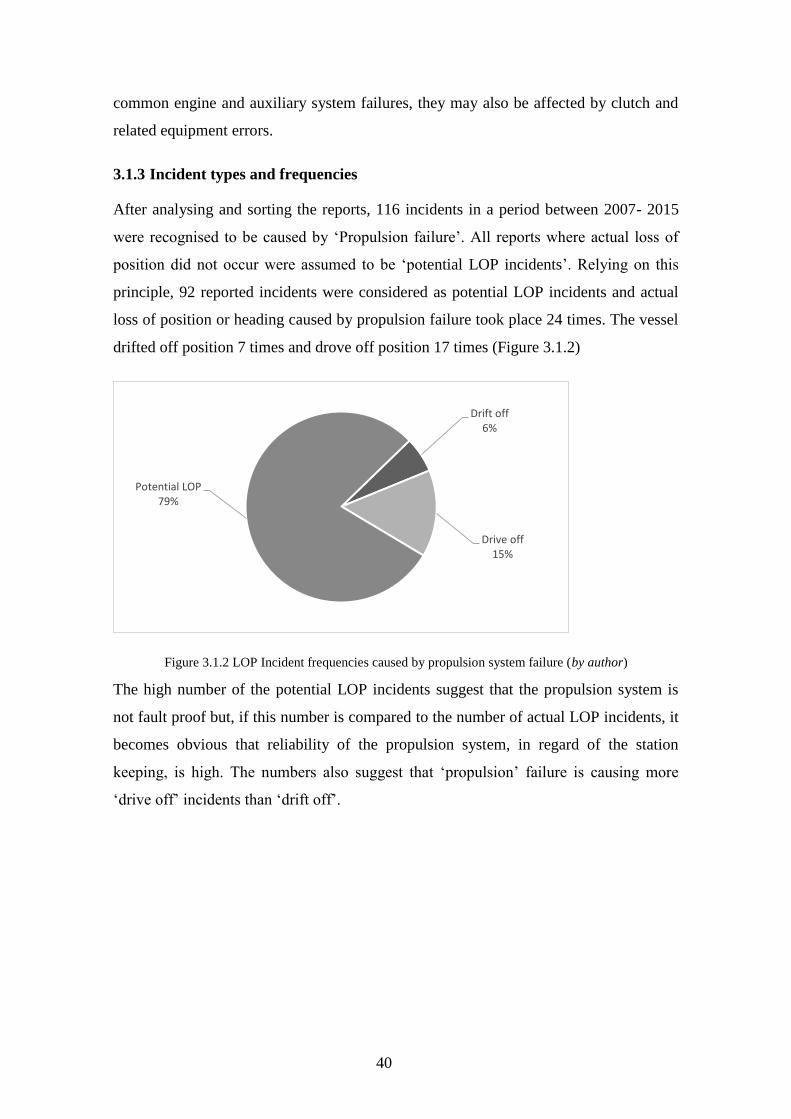
3.1.3 Incident types and frequencies
After analysing and sorting the reports, 116 incidents in a period between 2007- 2015
were recognised to be caused by ‘Propulsion failure’. All reports where actual loss of
position did not occur were assumed to be ‘potential LOP incidents’. Relying on this
principle, 92 reported incidents were considered as potential LOP incidents and actual
loss of position or heading caused by propulsion failure took place 24 times. The vessel
drifted off position 7 times and drove off position 17 times (Figure 3.1.2)
Figure 3.1.2 LOP Incident frequencies caused by propulsion system failure (by author)
The high number of the potential LOP incidents suggest that the propulsion system is
not fault proof but, if this number is compared to the number of actual LOP incidents, it
becomes obvious that reliability of the propulsion system, in regard of the station
keeping, is high. The numbers also suggest that ‘propulsion’ failure is causing more
‘drive off’ incidents than ‘drift off’.
Drift off6%
Drive off15%
Potential LOP79%
41
3.1.4 Potential LOP Incidents
The control and hydraulic sections of the propulsion system are the biggest contributors
to the potential LOP incidents (Figure 3.1.3). Due to insufficient information, the main
cause of 20 potential incidents was not identified.
Figure 3.1.3 Propulsion failures leading to potential LOP incidents (by author)
Analysis shows that PLC and small electrical components cause the most problems
within the control system of the thrusters.
PLC is a link between the DP controller and thruster; it constantly monitors the health
of the thruster and sends the ‘available' signal to the DP controller. Normally, DP
system will send a command signal to the thruster only if the ‘available’ signal is
present and the thruster has been selected. The thruster will become deselected only in
the event that the operator deselects it or if the ‘available’ signal is lost. Loss of the
‘available’ signal means that there is either a loss of the digital input from the thruster
due to active interlock or that there is a loss of communication between thruster
controller and DP controller (Mason, 2009). Loose wires, faulty relays, network
problems, or controller power supply failures may affect the ‘available’ signal.
Additionally, PLC itself is an advanced microcontroller and may suffer from software
error or another internal fault. Analysed data indicates that software faults are often
resolved by rebooting the controller.
A control system also incorporates a large amount of electric/electronic equipment:
relays, signal amplifiers, and circuit boards amongst others. Such components are
sensitive both to temperature and environment; they are also prone to vibrations.
Malfunction of such components may affect the command or feedback signals and, as a
result, the thruster will trip or produce incorrect thrust. Pitch and speed anomalies may
0
5
10
15
20
25
control unknown hydraulic systems feedback acconverter
thruster main eng
42
be caused by the failure of different components. Relying on the information available
from the reports, it is impossible to identify exact causes of such errors. In general,
voltage irregularities or current leaks may affect the command or feedback signal and
thus cause anomalies or erratic behaviour in such a way that speed or direction of thrust
are changed without a related command from the DP computer or operator.
Faults within the emergency stop system may cause the spurious loss of a thruster.
Propulsion related emergency stops for DP2 equipment are usually ‘normally open’
contacts (IMCA M 206 Rev.1, 2016). However, if a system is designed with ‘normally
closed contact’, then the wire brake will stop the thruster. To prevent shutdown of the
thruster on emergency stop, cable faults, such as open circuit or short circuit, line
monitoring may be used.
High rate of hydraulic system failures indicates that CPP is still widely in use. Analysis
revealed that the pitch control valves are the most common cause of the hydraulic
system failures. When in DP, the vessels propulsion system works under variable
conditions and as a result the pitch control valves are operated very frequently. Poor
maintenance and degraded oil quality may also contribute to the unexpected failure.
Data also shows that pitch control or thruster azimuth angle control valves may fail in
any position. That makes this error unpredictable. Most todays DP control systems are
arranged to provide a prediction error if the thrust magnitude or direction is not as
expected, this can occur if hydraulic systems are not capable of turning the thruster or
changing blade pitch in the expected time (IMCA M 206 Rev.1, 2016).
Thrusters have numerous protections which are designed to prevent any damage to the
equipment. The protection system will normally stop the thruster should lubricating oil
pressure or cooling temperature readings exceed the pre-set limits. Lubricating oil
systems are usually dedicated to the single thruster and failure within the system will
affect only one thruster. Providing fully independent cooling systems for each thruster is
considered to be good practice to avoid the risk of losing multiple thrusters due to leaks
or maintenance related activities (IMCA M 206 Rev. 1, 2016). If central cooling is used,
the cooling system failure may affect several thrusters on the same loop depending on
the configuration. Analysis shows that the most vulnerable parts of the auxiliary
systems are cooling and lubricating pumps. Failure of the lubricating oil pump will
affect the oil pressure and, in turn, trip the thruster. Some thrusters can operate without
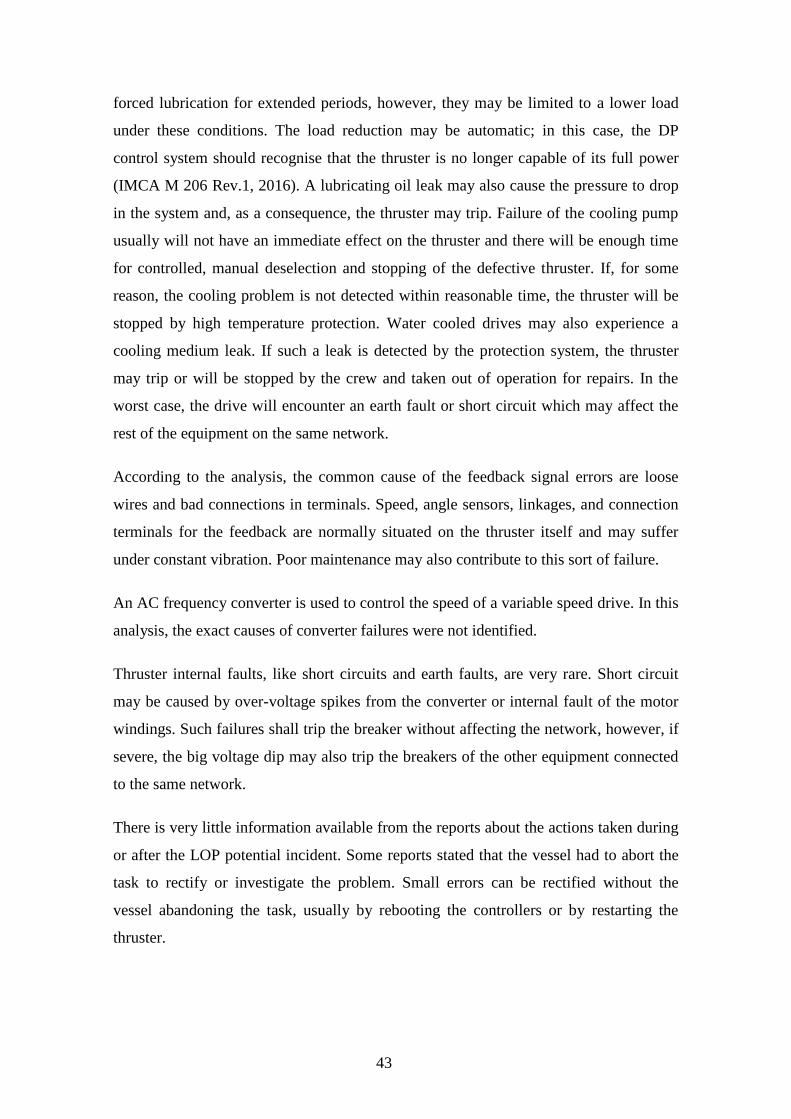
43
forced lubrication for extended periods, however, they may be limited to a lower load
under these conditions. The load reduction may be automatic; in this case, the DP
control system should recognise that the thruster is no longer capable of its full power
(IMCA M 206 Rev.1, 2016). A lubricating oil leak may also cause the pressure to drop
in the system and, as a consequence, the thruster may trip. Failure of the cooling pump
usually will not have an immediate effect on the thruster and there will be enough time
for controlled, manual deselection and stopping of the defective thruster. If, for some
reason, the cooling problem is not detected within reasonable time, the thruster will be
stopped by high temperature protection. Water cooled drives may also experience a
cooling medium leak. If such a leak is detected by the protection system, the thruster
may trip or will be stopped by the crew and taken out of operation for repairs. In the
worst case, the drive will encounter an earth fault or short circuit which may affect the
rest of the equipment on the same network.
According to the analysis, the common cause of the feedback signal errors are loose
wires and bad connections in terminals. Speed, angle sensors, linkages, and connection
terminals for the feedback are normally situated on the thruster itself and may suffer
under constant vibration. Poor maintenance may also contribute to this sort of failure.
An AC frequency converter is used to control the speed of a variable speed drive. In this
analysis, the exact causes of converter failures were not identified.
Thruster internal faults, like short circuits and earth faults, are very rare. Short circuit
may be caused by over-voltage spikes from the converter or internal fault of the motor
windings. Such failures shall trip the breaker without affecting the network, however, if
severe, the big voltage dip may also trip the breakers of the other equipment connected
to the same network.
There is very little information available from the reports about the actions taken during
or after the LOP potential incident. Some reports stated that the vessel had to abort the
task to rectify or investigate the problem. Small errors can be rectified without the
vessel abandoning the task, usually by rebooting the controllers or by restarting the
thruster.
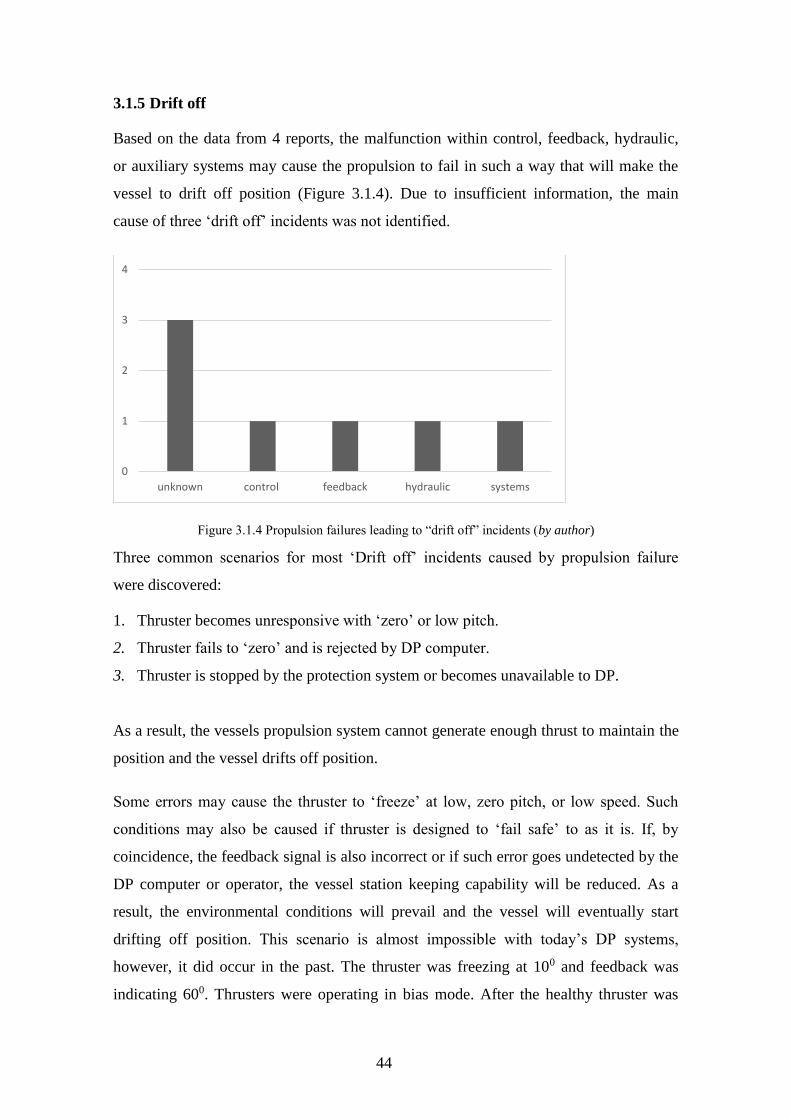
44
3.1.5 Drift off
Based on the data from 4 reports, the malfunction within control, feedback, hydraulic,
or auxiliary systems may cause the propulsion to fail in such a way that will make the
vessel to drift off position (Figure 3.1.4). Due to insufficient information, the main
cause of three ‘drift off’ incidents was not identified.
Figure 3.1.4 Propulsion failures leading to “drift off” incidents (by author)
Three common scenarios for most ‘Drift off’ incidents caused by propulsion failure
were discovered:
1. Thruster becomes unresponsive with ‘zero’ or low pitch.
2. Thruster fails to ‘zero’ and is rejected by DP computer.
3. Thruster is stopped by the protection system or becomes unavailable to DP.
As a result, the vessels propulsion system cannot generate enough thrust to maintain the
position and the vessel drifts off position.
Some errors may cause the thruster to ‘freeze’ at low, zero pitch, or low speed. Such
conditions may also be caused if thruster is designed to ‘fail safe’ to as it is. If, by
coincidence, the feedback signal is also incorrect or if such error goes undetected by the
DP computer or operator, the vessel station keeping capability will be reduced. As a
result, the environmental conditions will prevail and the vessel will eventually start
drifting off position. This scenario is almost impossible with today’s DP systems,
however, it did occur in the past. The thruster was freezing at 100 and feedback was
indicating 600. Thrusters were operating in bias mode. After the healthy thruster was
0
1
2
3
4
unknown control feedback hydraulic systems
45
stopped in good weather conditions, the vessel began drifting off. The feedback signal is
usually not used by a DP controller for calculations and is only monitored by local
thruster controller. If, for some reason, deviation between command and feedback signal
goes undetected, the thruster will keep on the ‘available’ status and DP controller will
operate it as usual. The vessel will remain in position as long as other thrusters are able
to compensate.
An uncommon scenario for ‘drift off’ incident caused by propulsion feedback failure, is
when the thruster stays online but the thrust direction is not as expected. This may be
caused by combination of different factors. Such unusual ‘drift off’ occurred when
actual thrust direction of an azimuth thruster was 1800 opposite of what was indicated.
As a consequence, thrusters were cancelling each other out, resulting in ‘drift off’.
Azimuth thrusters typically have three angle measuring devices; one device provides
feedback to the thruster control unit, one provides feedback to the DP control system for
indication purposes, and the third provides angle indication at the local control station
(IMCA M 206 Rev.1, 2016). Some thruster manufacturers use a single mechanical drive
for all three angle indicators. If this drive slips, the thruster may be pointing in the
wrong direction with no indication to warn of this.
An internal oil leak within the controllable pitch propeller may cause the pitch control
valves to become slow to respond to the DP computer demands. It may result in the
deviation between command and feedback signal. Such deviation will be detected by
local controller and if the limits are exceeded, the thruster will be stopped or rejected by
the DP controller. Station keeping capability will be reduced and the vessel may drift
off the position.
Cooling system failures should not affect station keeping however, if undetected, the
drive’s windings or bearings temperature will rise and thruster will trip. Depending on
the system configuration, the multiply thrusters may be affected.
Analysis shows, that most of the ‘drift off’ incidents were caused by a loss of a single
thruster. The general rule states that, “a single fault in the thruster system is to be such
that the thruster fails to a safe mode so that the vessel’s position and heading are not
affected” (ABS 2013, 23). According to this requirement, the loss of one thruster should
not affect the station keeping of DP 2 or DP3 class vessels under normal conditions.
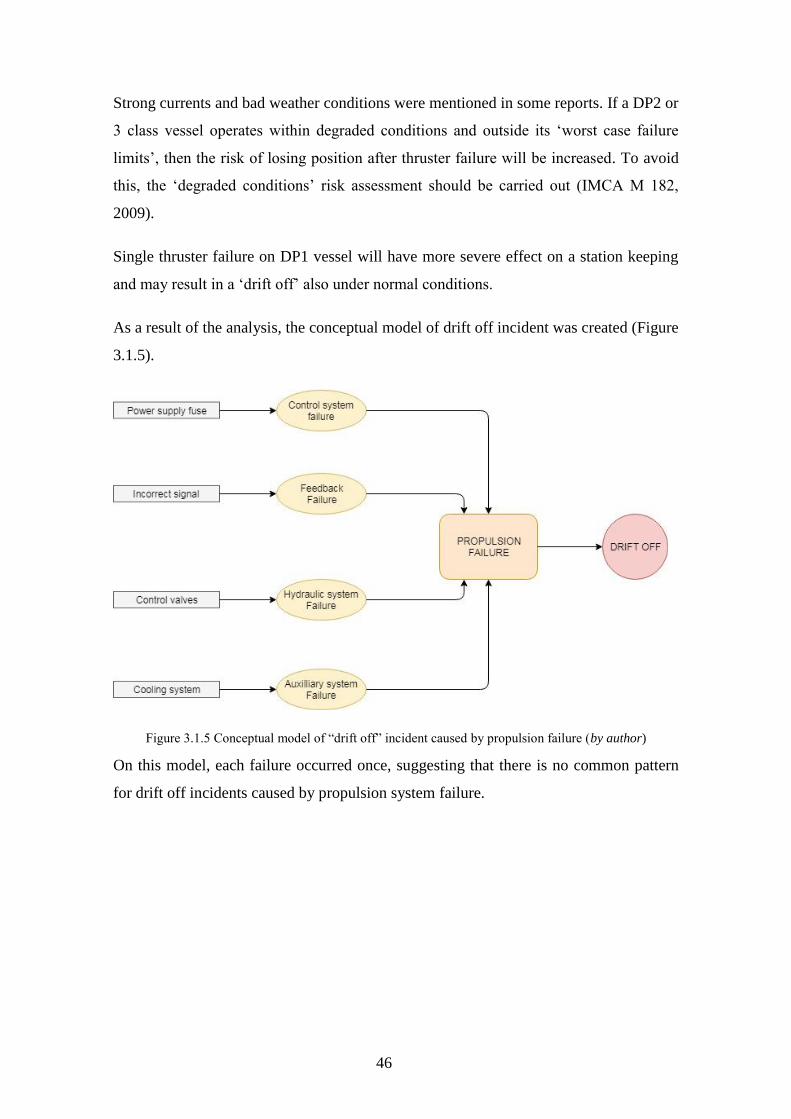
46
Strong currents and bad weather conditions were mentioned in some reports. If a DP2 or
3 class vessel operates within degraded conditions and outside its ‘worst case failure
limits’, then the risk of losing position after thruster failure will be increased. To avoid
this, the ‘degraded conditions’ risk assessment should be carried out (IMCA M 182,
2009).
Single thruster failure on DP1 vessel will have more severe effect on a station keeping
and may result in a ‘drift off’ also under normal conditions.
As a result of the analysis, the conceptual model of drift off incident was created (Figure
3.1.5).
Figure 3.1.5 Conceptual model of “drift off” incident caused by propulsion failure (by author)
On this model, each failure occurred once, suggesting that there is no common pattern
for drift off incidents caused by propulsion system failure.
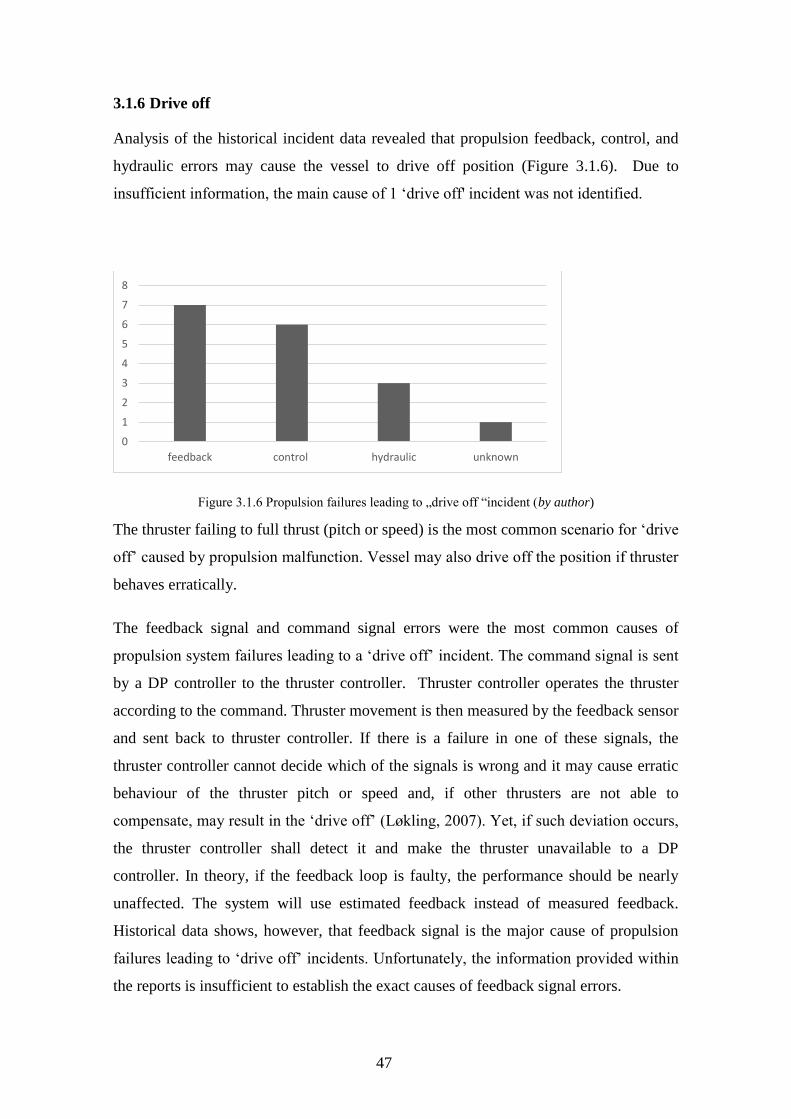
47
3.1.6 Drive off
Analysis of the historical incident data revealed that propulsion feedback, control, and
hydraulic errors may cause the vessel to drive off position (Figure 3.1.6). Due to
insufficient information, the main cause of 1 ‘drive off' incident was not identified.
Figure 3.1.6 Propulsion failures leading to „drive off “incident (by author)
The thruster failing to full thrust (pitch or speed) is the most common scenario for ‘drive
off’ caused by propulsion malfunction. Vessel may also drive off the position if thruster
behaves erratically.
The feedback signal and command signal errors were the most common causes of
propulsion system failures leading to a ‘drive off’ incident. The command signal is sent
by a DP controller to the thruster controller. Thruster controller operates the thruster
according to the command. Thruster movement is then measured by the feedback sensor
and sent back to thruster controller. If there is a failure in one of these signals, the
thruster controller cannot decide which of the signals is wrong and it may cause erratic
behaviour of the thruster pitch or speed and, if other thrusters are not able to
compensate, may result in the ‘drive off’ (Løkling, 2007). Yet, if such deviation occurs,
the thruster controller shall detect it and make the thruster unavailable to a DP
controller. In theory, if the feedback loop is faulty, the performance should be nearly
unaffected. The system will use estimated feedback instead of measured feedback.
Historical data shows, however, that feedback signal is the major cause of propulsion
failures leading to ‘drive off’ incidents. Unfortunately, the information provided within
the reports is insufficient to establish the exact causes of feedback signal errors.
0
1
2
3
4
5
6
7
8
feedback control hydraulic unknown

48
The other factor what may contribute to 'drive off’ if a thruster fails, is an operator
incorrect intervention. Thrusters can fail in various ways and develop high unexpected
levels of thrust or incorrect thrust direction. Since other thrusters will try to counter-
balance the failed thruster, it is sometimes difficult for an operator to quickly determine
which thruster has failed so that it can be stopped before vessel position is affected. By
mistake, the healthy thruster may be stopped instead of the faulty one and, as a result,
the faulty thruster will cause the vessel to drive off the position.
Malfunction of the CPP control valves is another possible cause of ‘drive off’ incidents.
If pitch control jams in full pitch, or any other significant thrust position, and the other
thrusters are not able to compensate, the vessel will drive off position. DP rules and
guidelines require that single failures should not cause uncontrolled increase in thrust
magnitude or direction. Failure to full speed (significantly increased thrust) is generally
not accepted in DP rules and guidelines and should be addressed appropriately in the
design (DNVGL-RP-E306, 2015, 48). Modern variable speed drives generally fail to
zero speed if a significant discrepancy is detected between command and feedback
signals. The only way to achieve the above requirement when CPP fails is to manually
stop the thruster. The operator correct intervention is of a high importance.
As a result of the analysis, the conceptual model of the drive off incident was created
(Figure 3.1.7)
Figure 3.1.7 Conceptual model of “drive off” incident caused by propulsion failure (by author)
On this model, the failures and their causes are placed depending on the frequencies of
their occurrence with the most frequent failure being on the top.
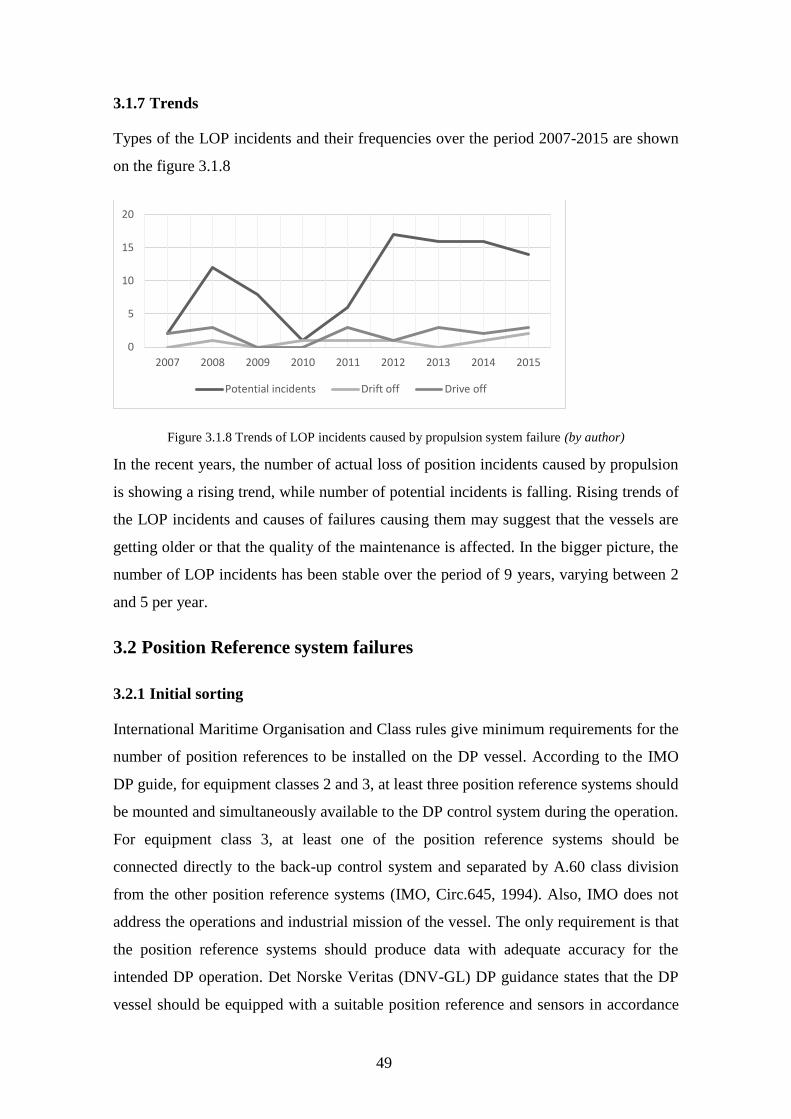
49
3.1.7 Trends
Types of the LOP incidents and their frequencies over the period 2007-2015 are shown
on the figure 3.1.8
Figure 3.1.8 Trends of LOP incidents caused by propulsion system failure (by author)
In the recent years, the number of actual loss of position incidents caused by propulsion
is showing a rising trend, while number of potential incidents is falling. Rising trends of
the LOP incidents and causes of failures causing them may suggest that the vessels are
getting older or that the quality of the maintenance is affected. In the bigger picture, the
number of LOP incidents has been stable over the period of 9 years, varying between 2
and 5 per year.
3.2 Position Reference system failures
3.2.1 Initial sorting
International Maritime Organisation and Class rules give minimum requirements for the
number of position references to be installed on the DP vessel. According to the IMO
DP guide, for equipment classes 2 and 3, at least three position reference systems should
be mounted and simultaneously available to the DP control system during the operation.
For equipment class 3, at least one of the position reference systems should be
connected directly to the back-up control system and separated by A.60 class division
from the other position reference systems (IMO, Circ.645, 1994). Also, IMO does not
address the operations and industrial mission of the vessel. The only requirement is that
the position reference systems should produce data with adequate accuracy for the
intended DP operation. Det Norske Veritas (DNV-GL) DP guidance states that the DP
vessel should be equipped with a suitable position reference and sensors in accordance
0
5
10
15
20
2007 2008 2009 2010 2011 2012 2013 2014 2015
Potential incidents Drift off Drive off
50
with the vessel’s DP class notation and operational requirements (DNVGL-RP-E306,
2015). Choice of position reference systems should consider the vessels mission and the
expected performance in a range of operational conditions. It is also recommended that
the amount of references installed on the vessel should exceed the minimum sensor
requirements stipulated by class rules in order to maximise operational uptime and
achieve industrial mission requirements. (DP operations guidance part 1, 2012) If the
vessel is required to operate in close proximity to a floating facility, where the risk for
shadowing of DGNSS signal may present, the redundancy in relative position reference
sensors should be considered (DNVGL-RP-E306, 2015, 114). Position reference
systems online should be based on different principles. The rules also require that the
performance of position reference systems should be monitored and warnings provided
when the signals from the position reference systems are either incorrect or substantially
degraded (IMO, Circ.645, 1994). The amount of references to be online during one or
another operation is not regulated by class societies but can be found in a different DP
operation guidance and vessel operator’s manuals. For instance, the operational
guidance on position reference systems and sensors for different operations in a form of
a table was published by Marine Technology Society Dynamic Positioning Committee
in ‘DP Operations Guidance Part 2 Appx 2’ (DP Operations Guidance…, 2012).
In this section, all incidents, caused by some sort of position reference system failure are
analysed. In total, 118 IMCA reports are transferred into the Excel file. After initial
sorting, adjustments were made in regard of the failures and moved as follows:
– Moved to ‘Computer’ section -2 reports
– Removed as ‘Human error’ – 4 reports
– Removed from the list – 14 reports
– Added from ‘Computer’ section – 1 report
In this research, environmental sensors including gyrocompass, anemometer, vertical
reference unit (further VRU), and Doppler log are not considered as a part of the
position reference system and all events caused by any of the environmental sensor
error were excluded from the list. Reports, in which failure was recognised to be caused
by the DP main controller rather than reference computer, are moved to the computer
section. All reported incidents where human factor played a key role were excluded
from the list. Inadequate service contracts affecting differential corrections,
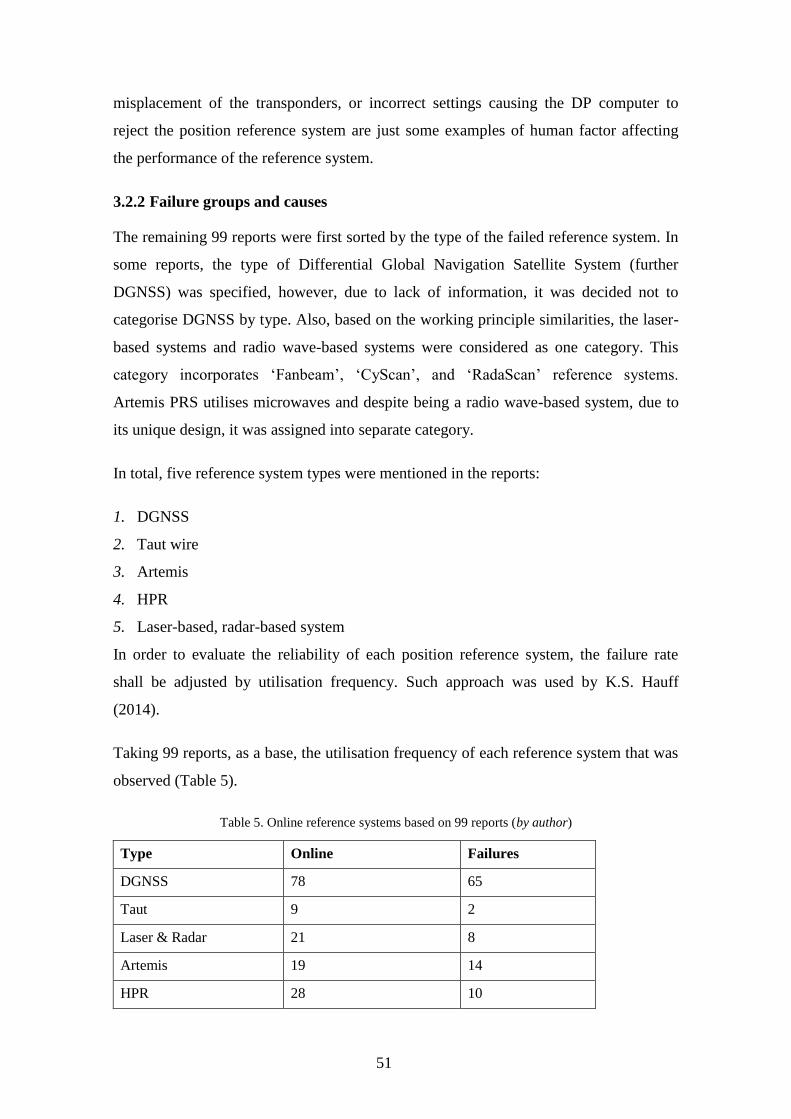
51
misplacement of the transponders, or incorrect settings causing the DP computer to
reject the position reference system are just some examples of human factor affecting
the performance of the reference system.
3.2.2 Failure groups and causes
The remaining 99 reports were first sorted by the type of the failed reference system. In
some reports, the type of Differential Global Navigation Satellite System (further
DGNSS) was specified, however, due to lack of information, it was decided not to
categorise DGNSS by type. Also, based on the working principle similarities, the laser-
based systems and radio wave-based systems were considered as one category. This
category incorporates ‘Fanbeam’, ‘CyScan’, and ‘RadaScan’ reference systems.
Artemis PRS utilises microwaves and despite being a radio wave-based system, due to
its unique design, it was assigned into separate category.
In total, five reference system types were mentioned in the reports:
1. DGNSS
2. Taut wire
3. Artemis
4. HPR
5. Laser-based, radar-based system
In order to evaluate the reliability of each position reference system, the failure rate
shall be adjusted by utilisation frequency. Such approach was used by K.S. Hauff
(2014).
Taking 99 reports, as a base, the utilisation frequency of each reference system that was
observed (Table 5).
Table 5. Online reference systems based on 99 reports (by author)
Type Online Failures
DGNSS 78 65
Taut 9 2
Laser & Radar 21 8
Artemis 19 14
HPR 28 10
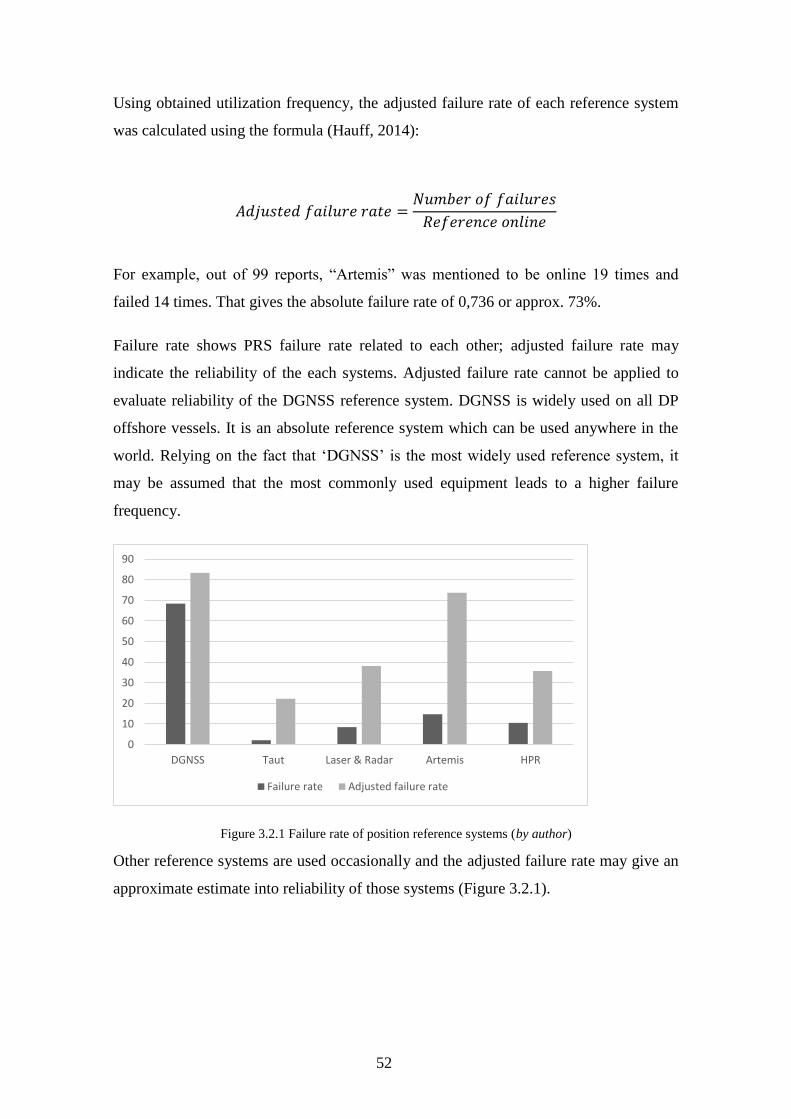
52
Using obtained utilization frequency, the adjusted failure rate of each reference system
was calculated using the formula (Hauff, 2014):
𝐴𝑑𝑗𝑢𝑠𝑡𝑒𝑑 𝑓𝑎𝑖𝑙𝑢𝑟𝑒 𝑟𝑎𝑡𝑒 =𝑁𝑢𝑚𝑏𝑒𝑟 𝑜𝑓 𝑓𝑎𝑖𝑙𝑢𝑟𝑒𝑠
𝑅𝑒𝑓𝑒𝑟𝑒𝑛𝑐𝑒 𝑜𝑛𝑙𝑖𝑛𝑒
For example, out of 99 reports, “Artemis” was mentioned to be online 19 times and
failed 14 times. That gives the absolute failure rate of 0,736 or approx. 73%.
Failure rate shows PRS failure rate related to each other; adjusted failure rate may
indicate the reliability of the each systems. Adjusted failure rate cannot be applied to
evaluate reliability of the DGNSS reference system. DGNSS is widely used on all DP
offshore vessels. It is an absolute reference system which can be used anywhere in the
world. Relying on the fact that ‘DGNSS’ is the most widely used reference system, it
may be assumed that the most commonly used equipment leads to a higher failure
frequency.
Figure 3.2.1 Failure rate of position reference systems (by author)
Other reference systems are used occasionally and the adjusted failure rate may give an
approximate estimate into reliability of those systems (Figure 3.2.1).
0
10
20
30
40
50
60
70
80
90
DGNSS Taut Laser & Radar Artemis HPR
Failure rate Adjusted failure rate
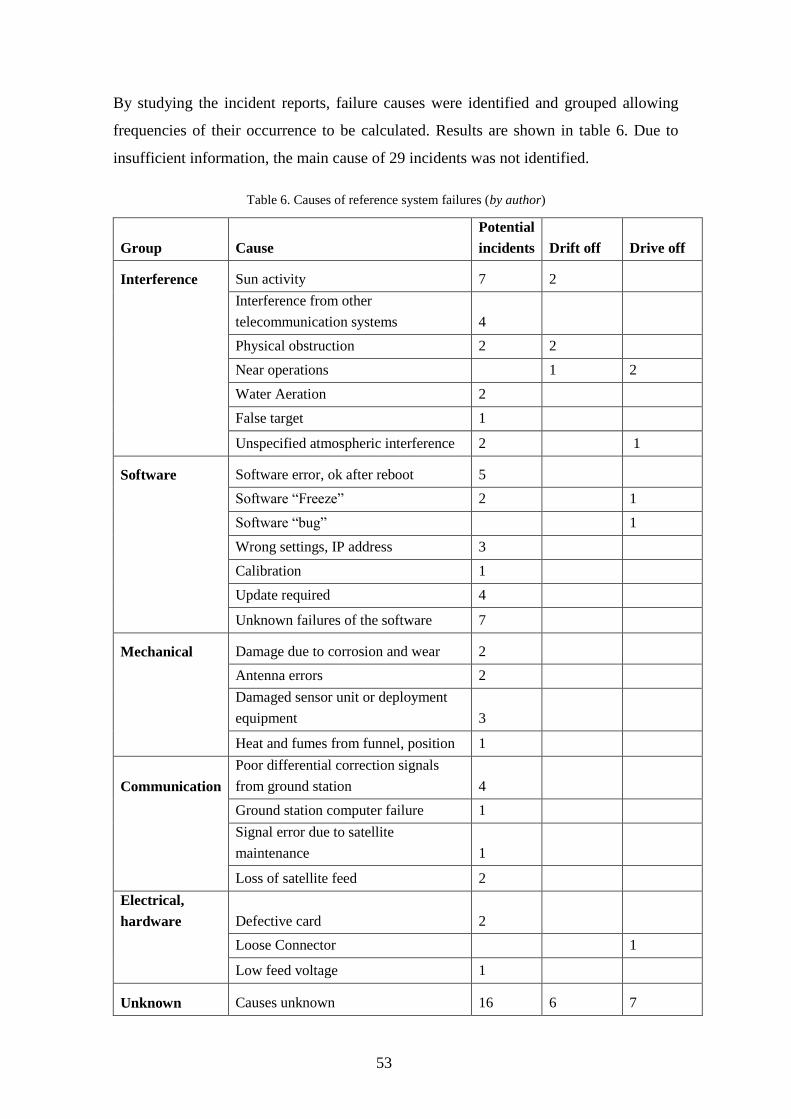
53
By studying the incident reports, failure causes were identified and grouped allowing
frequencies of their occurrence to be calculated. Results are shown in table 6. Due to
insufficient information, the main cause of 29 incidents was not identified.
Table 6. Causes of reference system failures (by author)
Group Cause
Potential
incidents Drift off Drive off
Interference Sun activity 7 2
Interference from other
telecommunication systems 4
Physical obstruction 2 2
Near operations 1 2
Water Aeration 2
False target 1
Unspecified atmospheric interference 2 1
Software Software error, ok after reboot 5
Software “Freeze” 2 1
Software “bug” 1
Wrong settings, IP address 3
Calibration 1
Update required 4
Unknown failures of the software 7
Mechanical Damage due to corrosion and wear 2
Antenna errors 2
Damaged sensor unit or deployment
equipment 3
Heat and fumes from funnel, position 1
Communication
Poor differential correction signals
from ground station 4
Ground station computer failure 1
Signal error due to satellite
maintenance 1
Loss of satellite feed 2
Electrical,
hardware Defective card 2
Loose Connector 1
Low feed voltage 1
Unknown Causes unknown 16 6 7
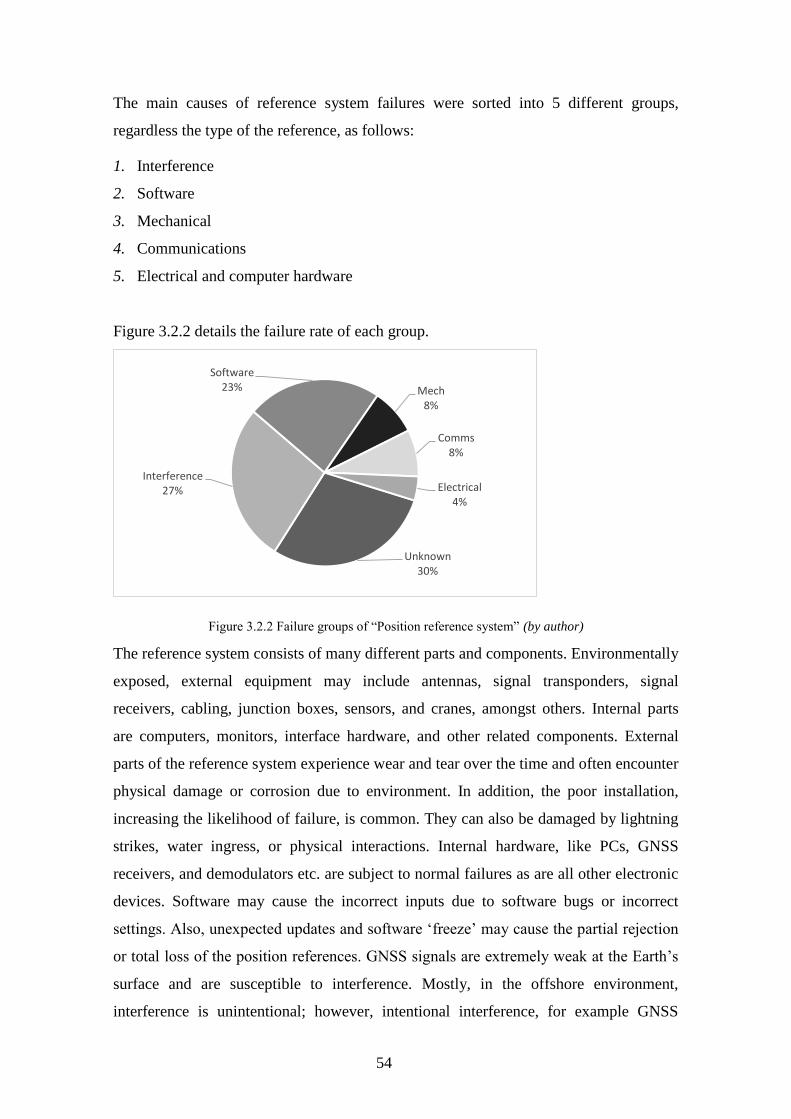
54
The main causes of reference system failures were sorted into 5 different groups,
regardless the type of the reference, as follows:
1. Interference
2. Software
3. Mechanical
4. Communications
5. Electrical and computer hardware
Figure 3.2.2 details the failure rate of each group.
Figure 3.2.2 Failure groups of “Position reference system” (by author)
The reference system consists of many different parts and components. Environmentally
exposed, external equipment may include antennas, signal transponders, signal
receivers, cabling, junction boxes, sensors, and cranes, amongst others. Internal parts
are computers, monitors, interface hardware, and other related components. External
parts of the reference system experience wear and tear over the time and often encounter
physical damage or corrosion due to environment. In addition, the poor installation,
increasing the likelihood of failure, is common. They can also be damaged by lightning
strikes, water ingress, or physical interactions. Internal hardware, like PCs, GNSS
receivers, and demodulators etc. are subject to normal failures as are all other electronic
devices. Software may cause the incorrect inputs due to software bugs or incorrect
settings. Also, unexpected updates and software ‘freeze’ may cause the partial rejection
or total loss of the position references. GNSS signals are extremely weak at the Earth’s
surface and are susceptible to interference. Mostly, in the offshore environment,
interference is unintentional; however, intentional interference, for example GNSS
Unknown 30%
Interference 27%
Software23% Mech
8%
Comms8%
Electrical4%
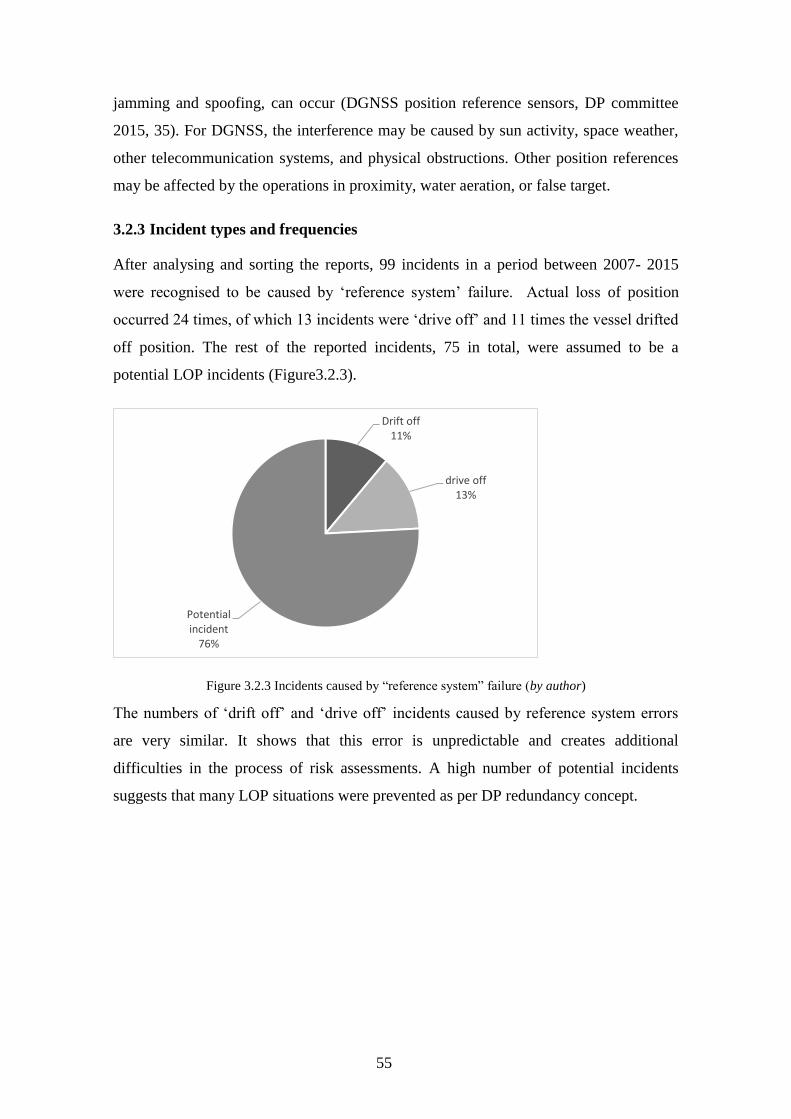
55
jamming and spoofing, can occur (DGNSS position reference sensors, DP committee
2015, 35). For DGNSS, the interference may be caused by sun activity, space weather,
other telecommunication systems, and physical obstructions. Other position references
may be affected by the operations in proximity, water aeration, or false target.
3.2.3 Incident types and frequencies
After analysing and sorting the reports, 99 incidents in a period between 2007- 2015
were recognised to be caused by ‘reference system’ failure. Actual loss of position
occurred 24 times, of which 13 incidents were ‘drive off’ and 11 times the vessel drifted
off position. The rest of the reported incidents, 75 in total, were assumed to be a
potential LOP incidents (Figure3.2.3).
Figure 3.2.3 Incidents caused by “reference system” failure (by author)
The numbers of ‘drift off’ and ‘drive off’ incidents caused by reference system errors
are very similar. It shows that this error is unpredictable and creates additional
difficulties in the process of risk assessments. A high number of potential incidents
suggests that many LOP situations were prevented as per DP redundancy concept.
Drift off11%
drive off13%
Potential incident
76%
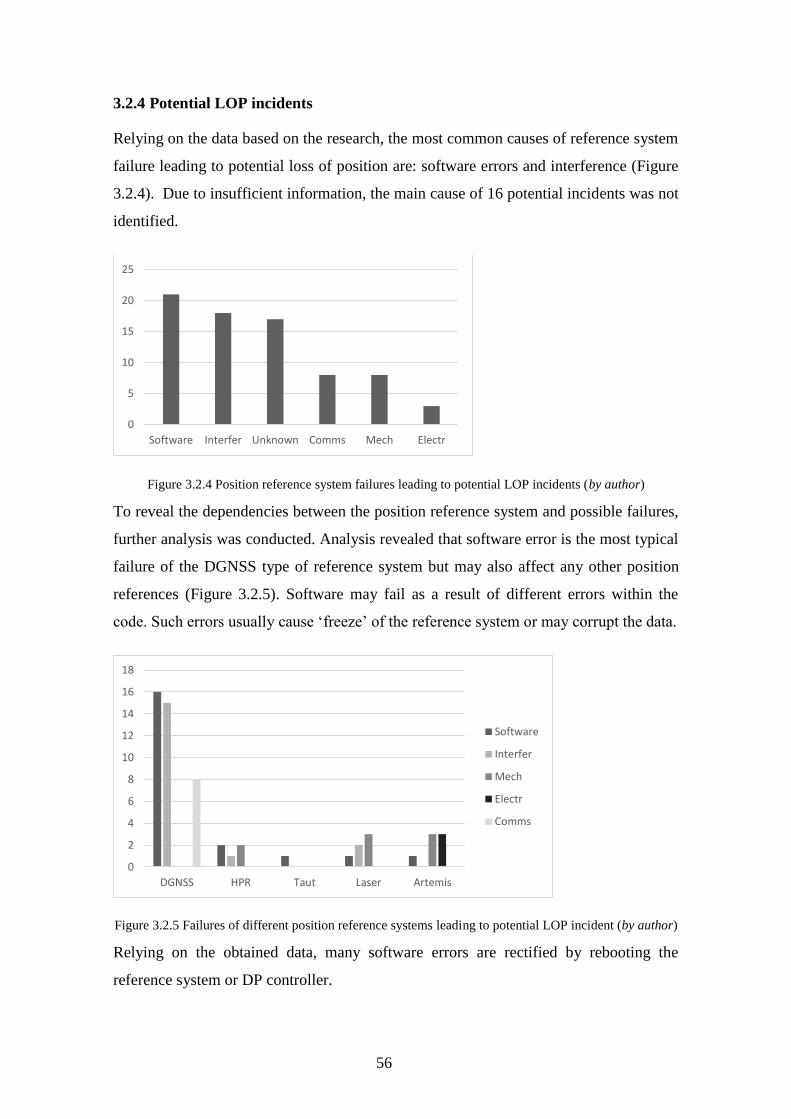
56
3.2.4 Potential LOP incidents
Relying on the data based on the research, the most common causes of reference system
failure leading to potential loss of position are: software errors and interference (Figure
3.2.4). Due to insufficient information, the main cause of 16 potential incidents was not
identified.
Figure 3.2.4 Position reference system failures leading to potential LOP incidents (by author)
To reveal the dependencies between the position reference system and possible failures,
further analysis was conducted. Analysis revealed that software error is the most typical
failure of the DGNSS type of reference system but may also affect any other position
references (Figure 3.2.5). Software may fail as a result of different errors within the
code. Such errors usually cause ‘freeze’ of the reference system or may corrupt the data.
Figure 3.2.5 Failures of different position reference systems leading to potential LOP incident (by author)
Relying on the obtained data, many software errors are rectified by rebooting the
reference system or DP controller.
0
5
10
15
20
25
Software Interfer Unknown Comms Mech Electr
0
2
4
6
8
10
12
14
16
18
DGNSS HPR Taut Laser Artemis
Software
Interfer
Mech
Electr
Comms
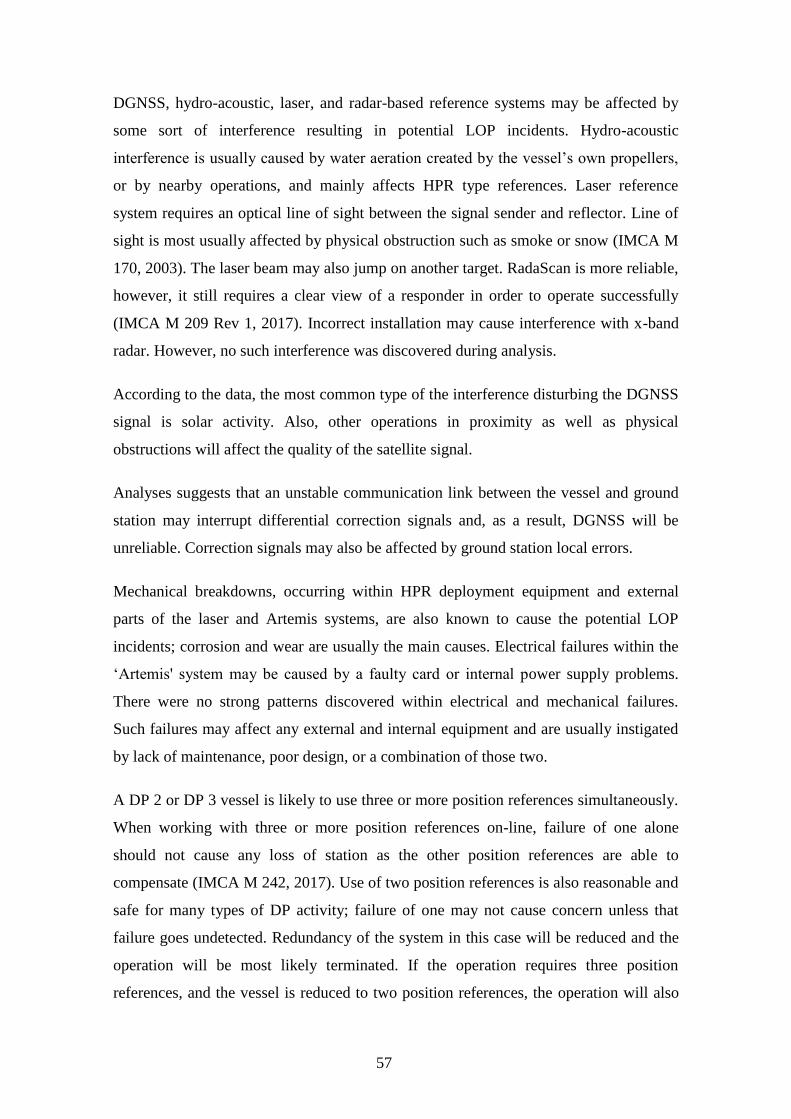
57
DGNSS, hydro-acoustic, laser, and radar-based reference systems may be affected by
some sort of interference resulting in potential LOP incidents. Hydro-acoustic
interference is usually caused by water aeration created by the vessel’s own propellers,
or by nearby operations, and mainly affects HPR type references. Laser reference
system requires an optical line of sight between the signal sender and reflector. Line of
sight is most usually affected by physical obstruction such as smoke or snow (IMCA M
170, 2003). The laser beam may also jump on another target. RadaScan is more reliable,
however, it still requires a clear view of a responder in order to operate successfully
(IMCA M 209 Rev 1, 2017). Incorrect installation may cause interference with x-band
radar. However, no such interference was discovered during analysis.
According to the data, the most common type of the interference disturbing the DGNSS
signal is solar activity. Also, other operations in proximity as well as physical
obstructions will affect the quality of the satellite signal.
Analyses suggests that an unstable communication link between the vessel and ground
station may interrupt differential correction signals and, as a result, DGNSS will be
unreliable. Correction signals may also be affected by ground station local errors.
Mechanical breakdowns, occurring within HPR deployment equipment and external
parts of the laser and Artemis systems, are also known to cause the potential LOP
incidents; corrosion and wear are usually the main causes. Electrical failures within the
‘Artemis' system may be caused by a faulty card or internal power supply problems.
There were no strong patterns discovered within electrical and mechanical failures.
Such failures may affect any external and internal equipment and are usually instigated
by lack of maintenance, poor design, or a combination of those two.
A DP 2 or DP 3 vessel is likely to use three or more position references simultaneously.
When working with three or more position references on-line, failure of one alone
should not cause any loss of station as the other position references are able to
compensate (IMCA M 242, 2017). Use of two position references is also reasonable and
safe for many types of DP activity; failure of one may not cause concern unless that
failure goes undetected. Redundancy of the system in this case will be reduced and the
operation will be most likely terminated. If the operation requires three position
references, and the vessel is reduced to two position references, the operation will also
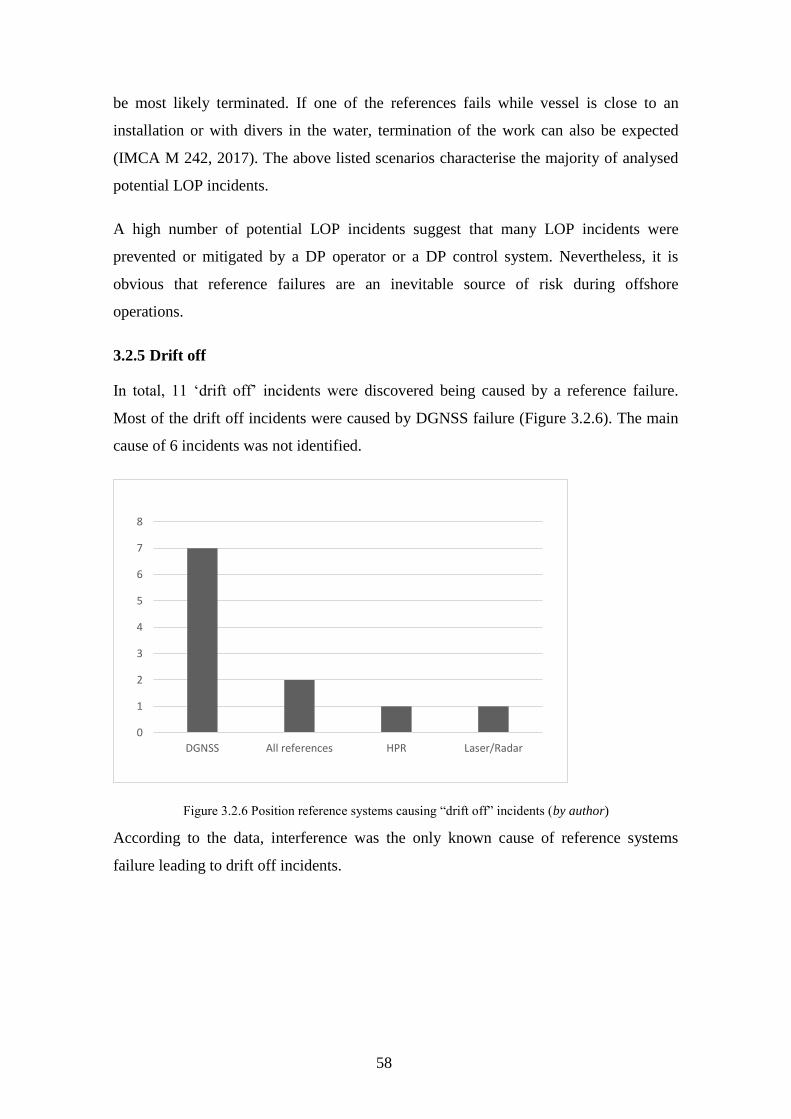
58
be most likely terminated. If one of the references fails while vessel is close to an
installation or with divers in the water, termination of the work can also be expected
(IMCA M 242, 2017). The above listed scenarios characterise the majority of analysed
potential LOP incidents.
A high number of potential LOP incidents suggest that many LOP incidents were
prevented or mitigated by a DP operator or a DP control system. Nevertheless, it is
obvious that reference failures are an inevitable source of risk during offshore
operations.
3.2.5 Drift off
In total, 11 ‘drift off’ incidents were discovered being caused by a reference failure.
Most of the drift off incidents were caused by DGNSS failure (Figure 3.2.6). The main
cause of 6 incidents was not identified.
Figure 3.2.6 Position reference systems causing “drift off” incidents (by author)
According to the data, interference was the only known cause of reference systems
failure leading to drift off incidents.
0
1
2
3
4
5
6
7
8
DGNSS All references HPR Laser/Radar
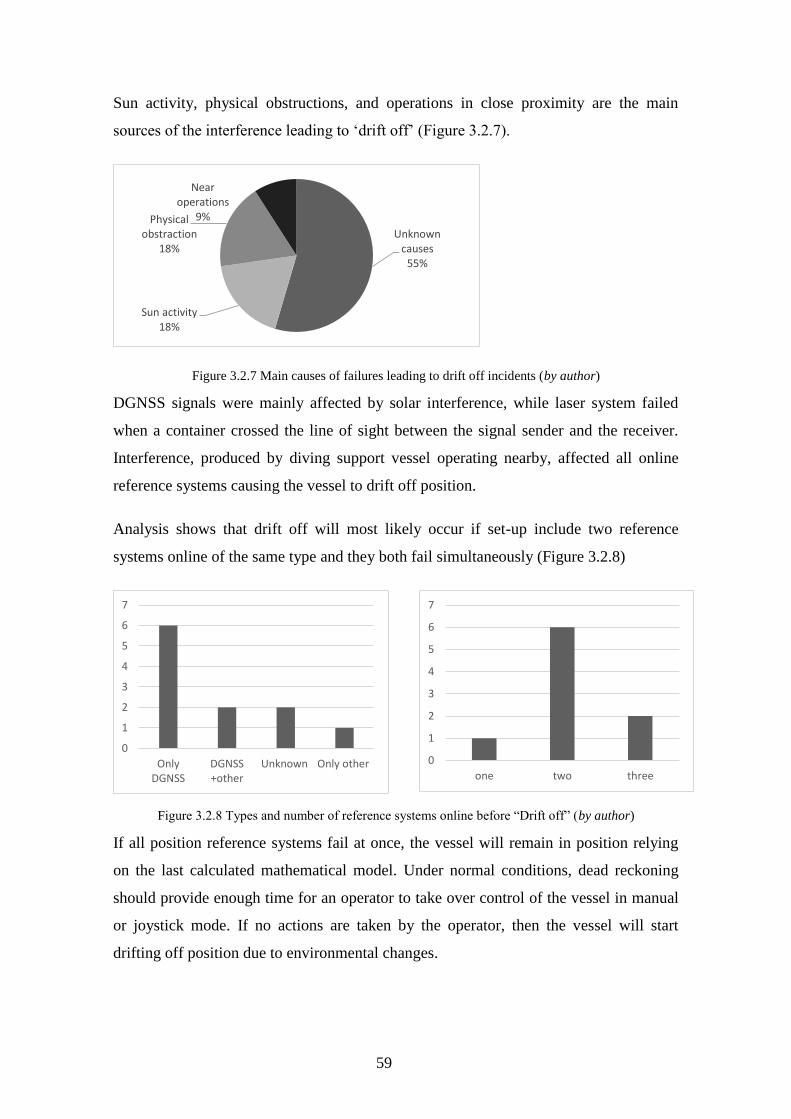
59
Sun activity, physical obstructions, and operations in close proximity are the main
sources of the interference leading to ‘drift off’ (Figure 3.2.7).
Figure 3.2.7 Main causes of failures leading to drift off incidents (by author)
DGNSS signals were mainly affected by solar interference, while laser system failed
when a container crossed the line of sight between the signal sender and the receiver.
Interference, produced by diving support vessel operating nearby, affected all online
reference systems causing the vessel to drift off position.
Analysis shows that drift off will most likely occur if set-up include two reference
systems online of the same type and they both fail simultaneously (Figure 3.2.8)
Figure 3.2.8 Types and number of reference systems online before “Drift off” (by author)
If all position reference systems fail at once, the vessel will remain in position relying
on the last calculated mathematical model. Under normal conditions, dead reckoning
should provide enough time for an operator to take over control of the vessel in manual
or joystick mode. If no actions are taken by the operator, then the vessel will start
drifting off position due to environmental changes.
Unknown causes
55%
Sun activity 18%
Physical obstraction
18%
Near operations
9%
0
1
2
3
4
5
6
7
OnlyDGNSS
DGNSS+other
Unknown Only other 0
1
2
3
4
5
6
7
one two three
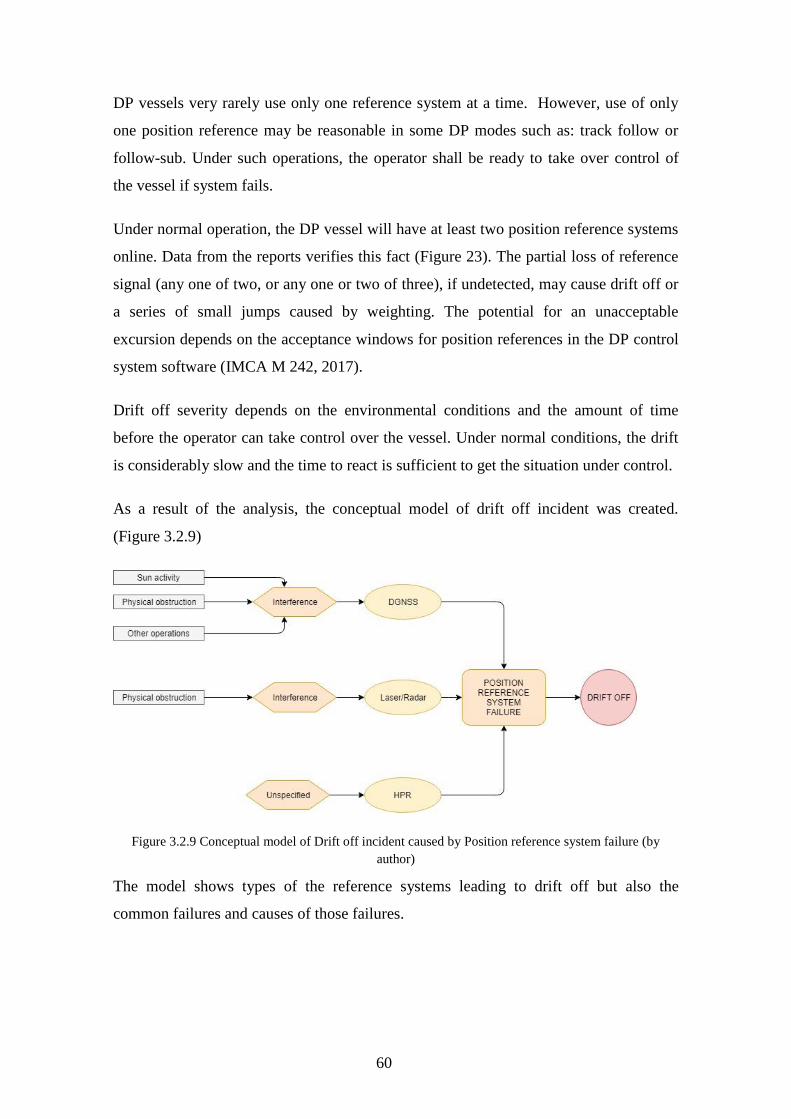
60
DP vessels very rarely use only one reference system at a time. However, use of only
one position reference may be reasonable in some DP modes such as: track follow or
follow-sub. Under such operations, the operator shall be ready to take over control of
the vessel if system fails.
Under normal operation, the DP vessel will have at least two position reference systems
online. Data from the reports verifies this fact (Figure 23). The partial loss of reference
signal (any one of two, or any one or two of three), if undetected, may cause drift off or
a series of small jumps caused by weighting. The potential for an unacceptable
excursion depends on the acceptance windows for position references in the DP control
system software (IMCA M 242, 2017).
Drift off severity depends on the environmental conditions and the amount of time
before the operator can take control over the vessel. Under normal conditions, the drift
is considerably slow and the time to react is sufficient to get the situation under control.
As a result of the analysis, the conceptual model of drift off incident was created.
(Figure 3.2.9)
Figure 3.2.9 Conceptual model of Drift off incident caused by Position reference system failure (by
author)
The model shows types of the reference systems leading to drift off but also the
common failures and causes of those failures.
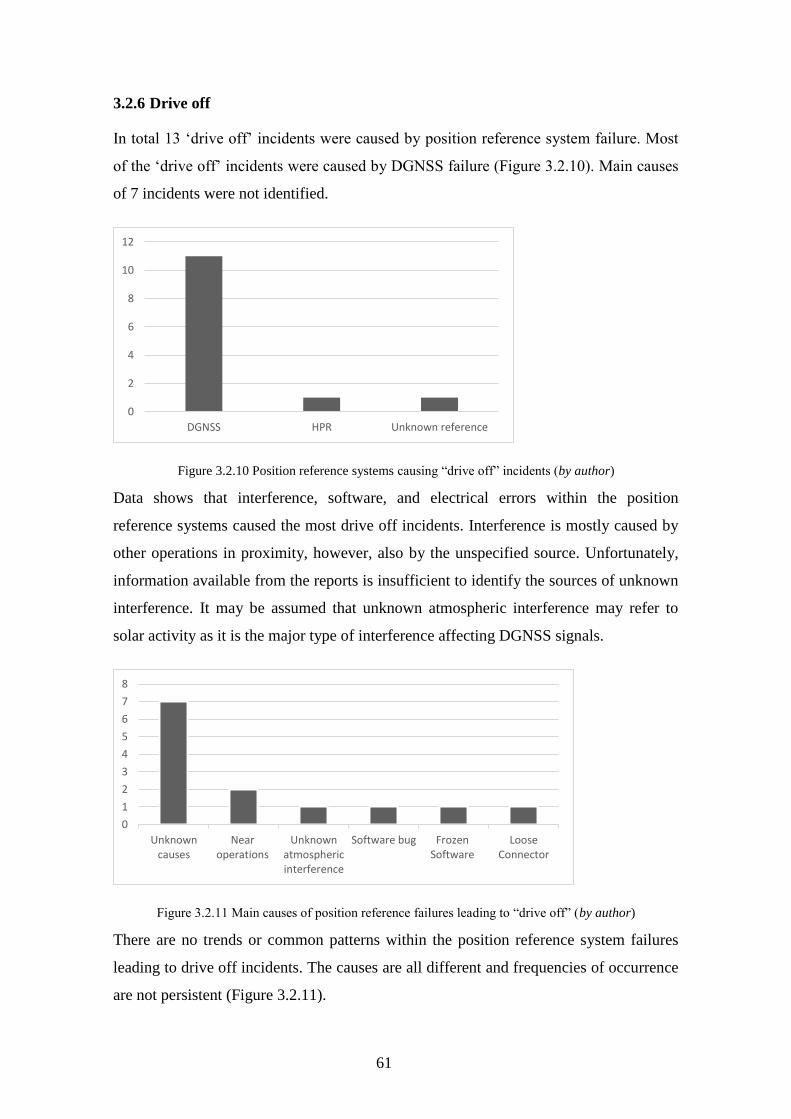
61
3.2.6 Drive off
In total 13 ‘drive off’ incidents were caused by position reference system failure. Most
of the ‘drive off’ incidents were caused by DGNSS failure (Figure 3.2.10). Main causes
of 7 incidents were not identified.
Figure 3.2.10 Position reference systems causing “drive off” incidents (by author)
Data shows that interference, software, and electrical errors within the position
reference systems caused the most drive off incidents. Interference is mostly caused by
other operations in proximity, however, also by the unspecified source. Unfortunately,
information available from the reports is insufficient to identify the sources of unknown
interference. It may be assumed that unknown atmospheric interference may refer to
solar activity as it is the major type of interference affecting DGNSS signals.
Figure 3.2.11 Main causes of position reference failures leading to “drive off” (by author)
There are no trends or common patterns within the position reference system failures
leading to drive off incidents. The causes are all different and frequencies of occurrence
are not persistent (Figure 3.2.11).
0
2
4
6
8
10
12
DGNSS HPR Unknown reference
0
1
2
3
4
5
6
7
8
Unknowncauses
Nearoperations
Unknownatmosphericinterference
Software bug FrozenSoftware
LooseConnector
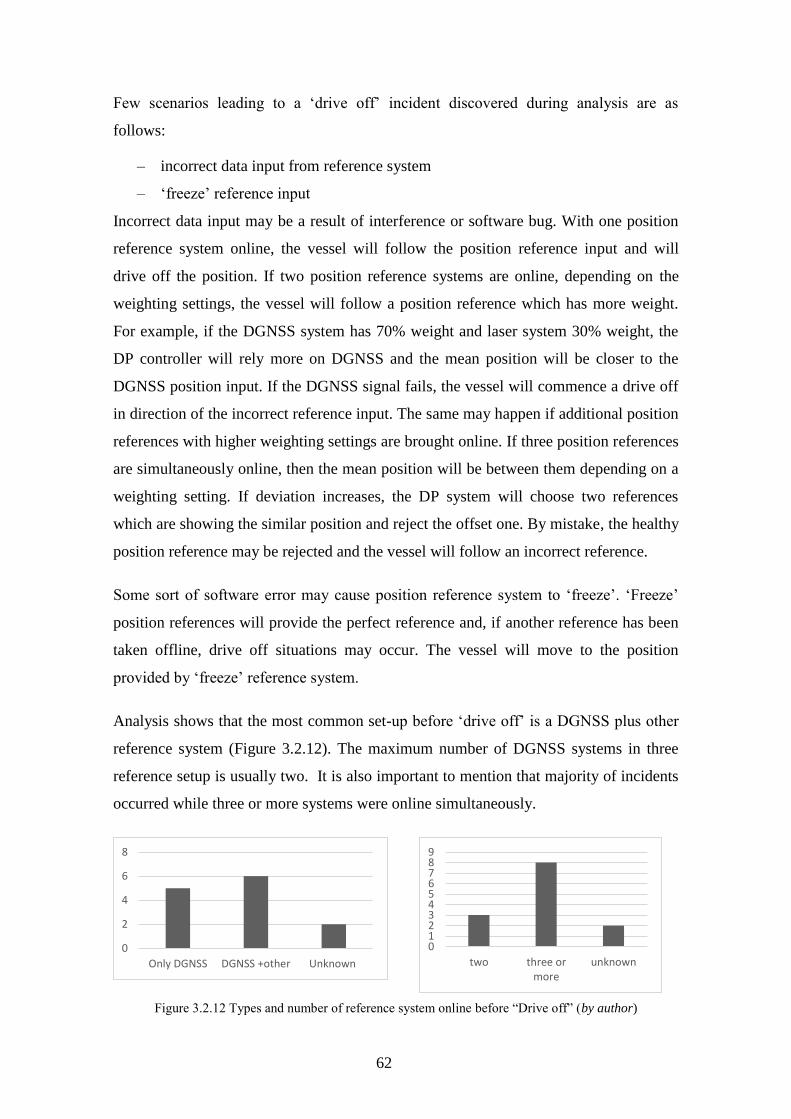
62
Few scenarios leading to a ‘drive off’ incident discovered during analysis are as
follows:
– incorrect data input from reference system
– ‘freeze’ reference input
Incorrect data input may be a result of interference or software bug. With one position
reference system online, the vessel will follow the position reference input and will
drive off the position. If two position reference systems are online, depending on the
weighting settings, the vessel will follow a position reference which has more weight.
For example, if the DGNSS system has 70% weight and laser system 30% weight, the
DP controller will rely more on DGNSS and the mean position will be closer to the
DGNSS position input. If the DGNSS signal fails, the vessel will commence a drive off
in direction of the incorrect reference input. The same may happen if additional position
references with higher weighting settings are brought online. If three position references
are simultaneously online, then the mean position will be between them depending on a
weighting setting. If deviation increases, the DP system will choose two references
which are showing the similar position and reject the offset one. By mistake, the healthy
position reference may be rejected and the vessel will follow an incorrect reference.
Some sort of software error may cause position reference system to ‘freeze’. ‘Freeze’
position references will provide the perfect reference and, if another reference has been
taken offline, drive off situations may occur. The vessel will move to the position
provided by ‘freeze’ reference system.
Analysis shows that the most common set-up before ‘drive off’ is a DGNSS plus other
reference system (Figure 3.2.12). The maximum number of DGNSS systems in three
reference setup is usually two. It is also important to mention that majority of incidents
occurred while three or more systems were online simultaneously.
Figure 3.2.12 Types and number of reference system online before “Drive off” (by author)
0
2
4
6
8
Only DGNSS DGNSS +other Unknown
0123456789
two three ormore
unknown
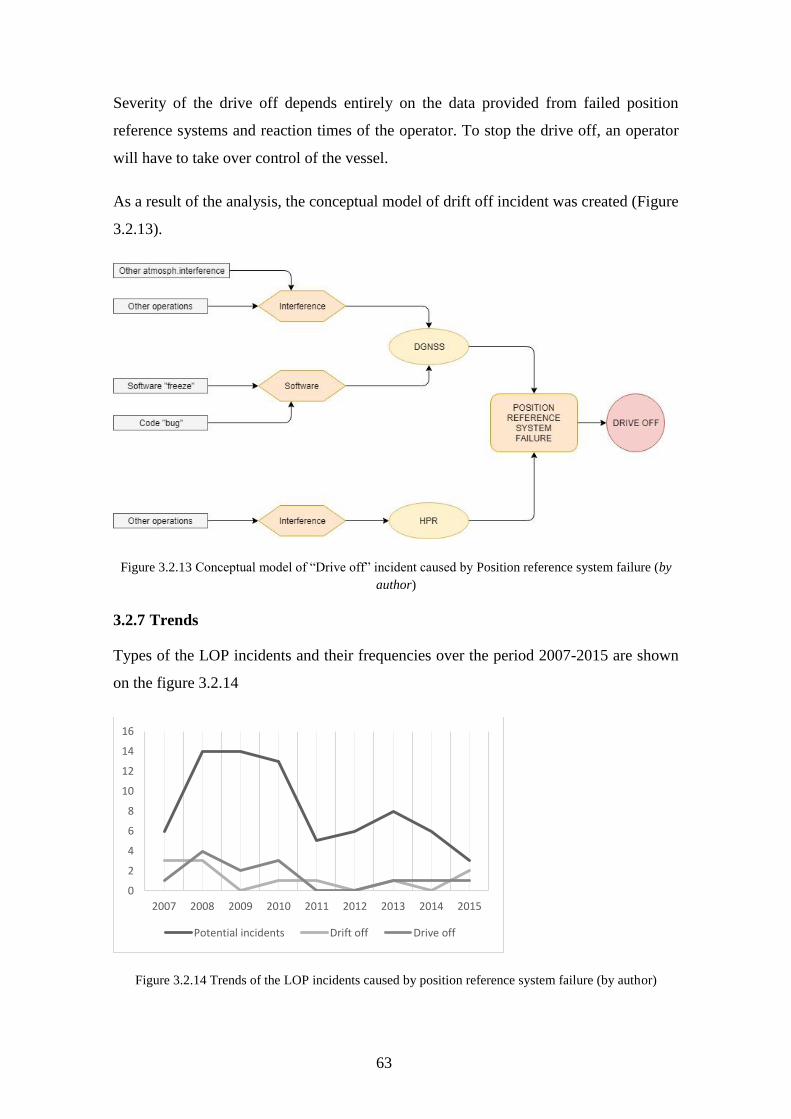
63
Severity of the drive off depends entirely on the data provided from failed position
reference systems and reaction times of the operator. To stop the drive off, an operator
will have to take over control of the vessel.
As a result of the analysis, the conceptual model of drift off incident was created (Figure
3.2.13).
Figure 3.2.13 Conceptual model of “Drive off” incident caused by Position reference system failure (by
author)
3.2.7 Trends
Types of the LOP incidents and their frequencies over the period 2007-2015 are shown
on the figure 3.2.14
Figure 3.2.14 Trends of the LOP incidents caused by position reference system failure (by author)
0
2
4
6
8
10
12
14
16
2007 2008 2009 2010 2011 2012 2013 2014 2015
Potential incidents Drift off Drive off
64
Trends suggest, that number of potential incidents is decreasing while number of actual
LOP incidents is rather stable. It may indicate, that procedures for using reference
systems are improving. Also reliability of related equipment is getting better.
3.3 DP system computer failures
3.3.1 Initial sorting
A DP control system is designed to keep the vessel at a specified position, with a set
heading, each within tolerable limits. To achieve this, the system continuously performs
the following tasks:
– Measures the deviation of the vessel from its target position and calculates the
forces needed to restore the target position.
– Measures the environmental forces acting on the vessel and calculates the forces
needed to counteract their effect.
– Transforms the calculated counteracting forces into commands to the individual
thrusters.
To perform the above tasks, the control system requires a human interface through
which to enter the target position, sensors to monitor the position and environment,
sensors for measuring vessel heading, and a controller to calculate the commands
(Alstom, 2000). To implement the commands, the network and local field PLC are also
necessary.
IMCA defines ‘computer’ as DP system related hardware and software (IMCA). For the
purpose of this thesis, only DP control computer (controller) and operator control
station computer related failures are covered under this section. The other parts of the
control system are discussed elsewhere.
The heart of the control system is the DP controller. The Controller receives data from
the various sensors and the operator then calculates and outputs the command signal to
the propulsion system in order to generate the required thrust to keep the vessel at the
desired location. Operator input is entered using the operator control station. All
essential information regarding system status is also available through this interface.
Control station consists of a display unit, a control panel and a control processor.
65
The general requirements for control systems of DP vessels set by IMO include
arrangement of the operator stations, availability of the information required to monitor
the state of the DP system, alarms and warnings, and also record keeping of their
occurrences. Control systems should be arranged in a way which allows the operator to
control propulsion in manual mode if the DP system fails. To achieve this, the manual
control of the thrusters should be truly independent. (IMO, Circ.645, 1994)
IMO and Class rules stipulate the redundancy requirements according to the vessel DP
class notation; redundancy of the DP1 control system is not required. The control
system of DP2 equipment should consist of at least two independent computer systems.
Common facilities such as self-checking routines, data transfer arrangements, and plant
interfaces should not be capable of causing the failure of both or all systems. In addition
to all listed DP2 requirements, DP3 system should be provided with a back-up DP-
control system. This system should be arranged in a room separated by A60 class
division from the main DP-control station. It is important to mention that DP2 and DP3
computer systems should be arranged so that an automatic transfer of control occurs
after a detected failure in one of the computer systems. (IMO, Circ.645, 1994)
In this section, all LOP incidents and potential LOP incidents caused by ‘DP computer’
failures are analysed. In total, 106 incidents are transferred from IMCA reports into
Excel workbook. After initial sorting, some adjustments were made with regard to the
main failures as follows:
– Moved to ‘Reference’ section – 3 reports
– Removed as ‘Human error’ section – 10 reports
– Added from ‘Reference’ section – 3 reports
All failures that are caused by position reference related equipment are moved to the
‘reference’ section. Additionally, all reports where human error led to the computer
failure are removed. Unintentional stopping or de-selection of thrusters, unauthorised
tuning, and incorrect installation of the software are just a few examples of a human
factor, what was mentioned in the reports, affecting the DP computer.
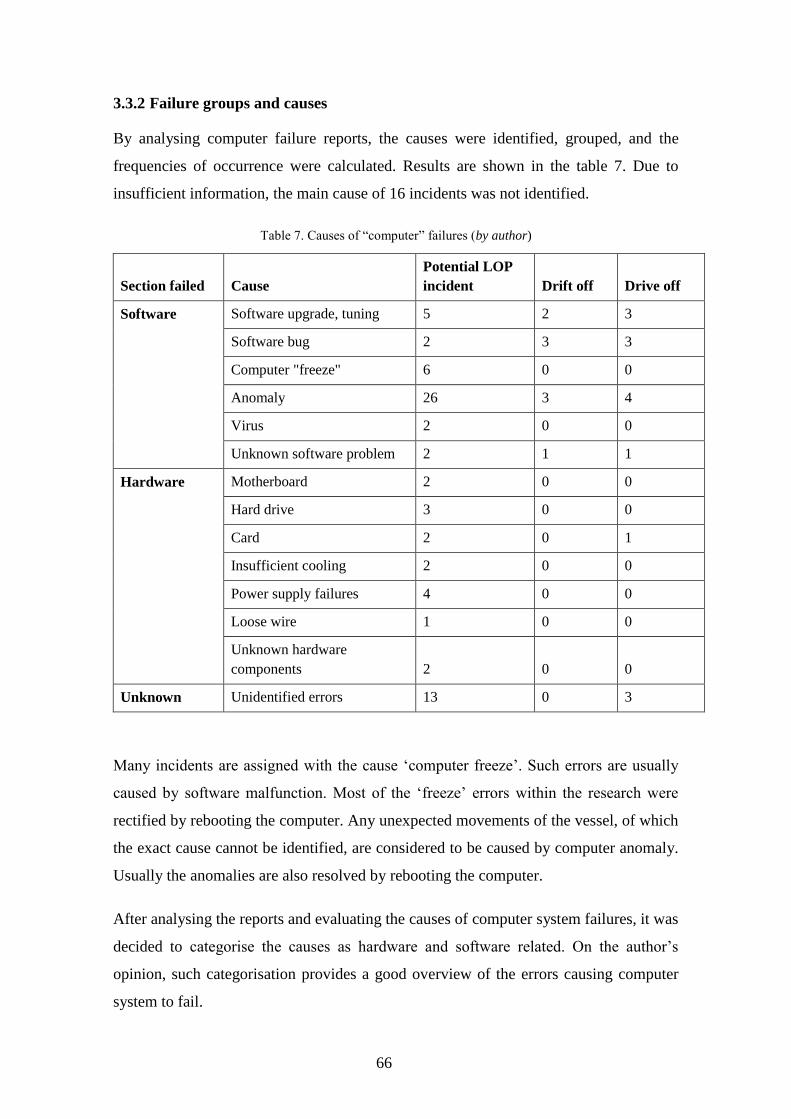
66
3.3.2 Failure groups and causes
By analysing computer failure reports, the causes were identified, grouped, and the
frequencies of occurrence were calculated. Results are shown in the table 7. Due to
insufficient information, the main cause of 16 incidents was not identified.
Table 7. Causes of “computer” failures (by author)
Section failed Cause
Potential LOP
incident Drift off Drive off
Software Software upgrade, tuning 5 2 3
Software bug 2 3 3
Computer "freeze" 6 0 0
Anomaly 26 3 4
Virus 2 0 0
Unknown software problem 2 1 1
Hardware Motherboard 2 0 0
Hard drive 3 0 0
Card 2 0 1
Insufficient cooling 2 0 0
Power supply failures 4 0 0
Loose wire 1 0 0
Unknown hardware
components 2 0 0
Unknown Unidentified errors 13 0 3
Many incidents are assigned with the cause ‘computer freeze’. Such errors are usually
caused by software malfunction. Most of the ‘freeze’ errors within the research were
rectified by rebooting the computer. Any unexpected movements of the vessel, of which
the exact cause cannot be identified, are considered to be caused by computer anomaly.
Usually the anomalies are also resolved by rebooting the computer.
After analysing the reports and evaluating the causes of computer system failures, it was
decided to categorise the causes as hardware and software related. On the author’s
opinion, such categorisation provides a good overview of the errors causing computer
system to fail.
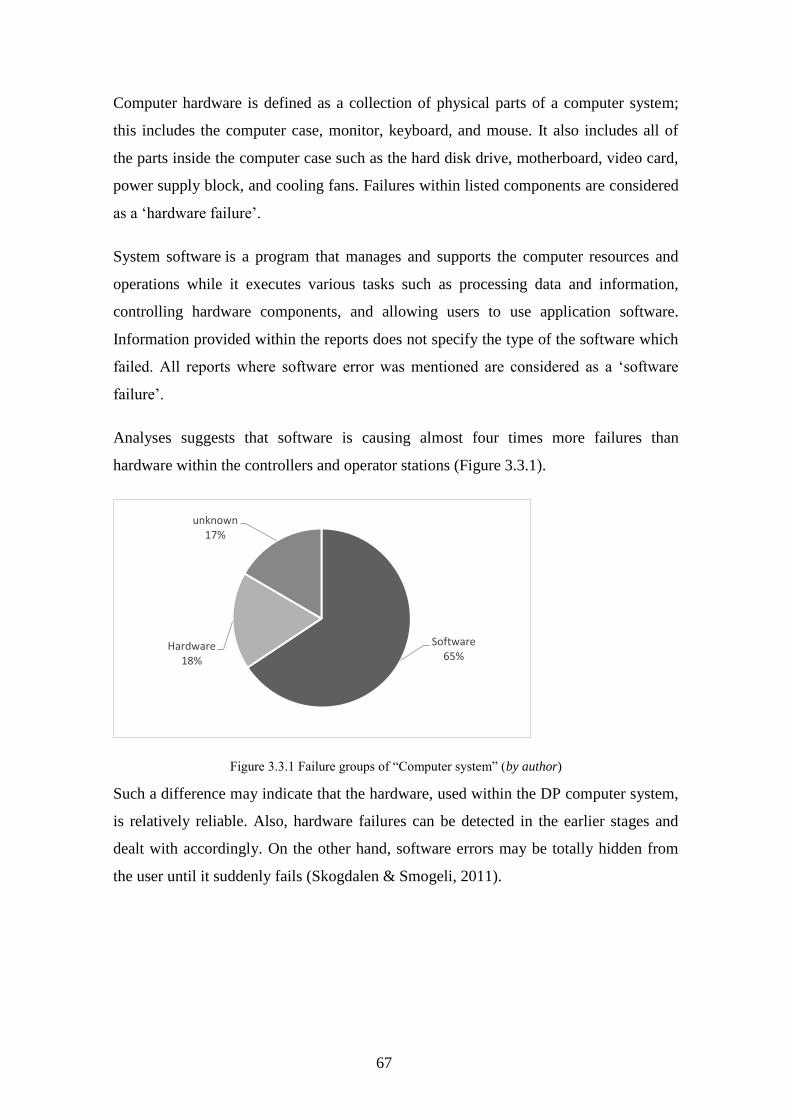
67
Computer hardware is defined as a collection of physical parts of a computer system;
this includes the computer case, monitor, keyboard, and mouse. It also includes all of
the parts inside the computer case such as the hard disk drive, motherboard, video card,
power supply block, and cooling fans. Failures within listed components are considered
as a ‘hardware failure’.
System software is a program that manages and supports the computer resources and
operations while it executes various tasks such as processing data and information,
controlling hardware components, and allowing users to use application software.
Information provided within the reports does not specify the type of the software which
failed. All reports where software error was mentioned are considered as a ‘software
failure’.
Analyses suggests that software is causing almost four times more failures than
hardware within the controllers and operator stations (Figure 3.3.1).
Figure 3.3.1 Failure groups of “Computer system” (by author)
Such a difference may indicate that the hardware, used within the DP computer system,
is relatively reliable. Also, hardware failures can be detected in the earlier stages and
dealt with accordingly. On the other hand, software errors may be totally hidden from
the user until it suddenly fails (Skogdalen & Smogeli, 2011).
Software65%
Hardware18%
unknown17%
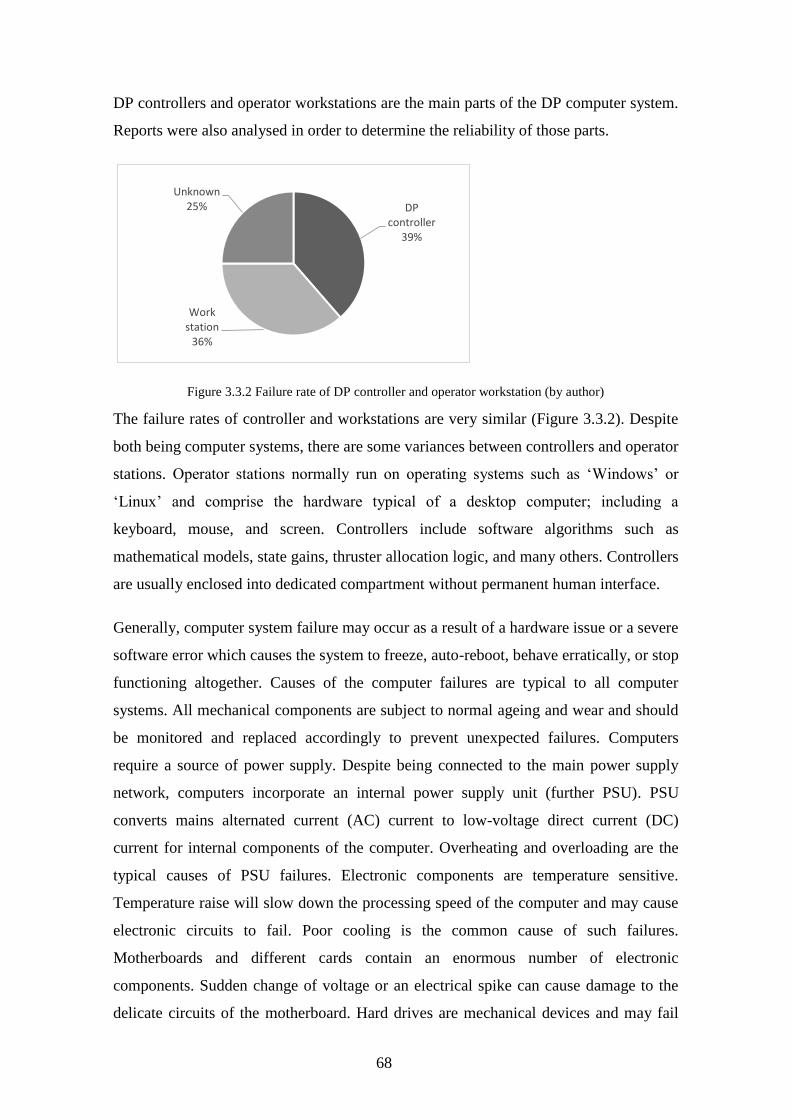
68
DP controllers and operator workstations are the main parts of the DP computer system.
Reports were also analysed in order to determine the reliability of those parts.
Figure 3.3.2 Failure rate of DP controller and operator workstation (by author)
The failure rates of controller and workstations are very similar (Figure 3.3.2). Despite
both being computer systems, there are some variances between controllers and operator
stations. Operator stations normally run on operating systems such as ‘Windows’ or
‘Linux’ and comprise the hardware typical of a desktop computer; including a
keyboard, mouse, and screen. Controllers include software algorithms such as
mathematical models, state gains, thruster allocation logic, and many others. Controllers
are usually enclosed into dedicated compartment without permanent human interface.
Generally, computer system failure may occur as a result of a hardware issue or a severe
software error which causes the system to freeze, auto-reboot, behave erratically, or stop
functioning altogether. Causes of the computer failures are typical to all computer
systems. All mechanical components are subject to normal ageing and wear and should
be monitored and replaced accordingly to prevent unexpected failures. Computers
require a source of power supply. Despite being connected to the main power supply
network, computers incorporate an internal power supply unit (further PSU). PSU
converts mains alternated current (AC) current to low-voltage direct current (DC)
current for internal components of the computer. Overheating and overloading are the
typical causes of PSU failures. Electronic components are temperature sensitive.
Temperature raise will slow down the processing speed of the computer and may cause
electronic circuits to fail. Poor cooling is the common cause of such failures.
Motherboards and different cards contain an enormous number of electronic
components. Sudden change of voltage or an electrical spike can cause damage to the
delicate circuits of the motherboard. Hard drives are mechanical devices and may fail
DP controller
39%
Work station
36%
Unknown25%
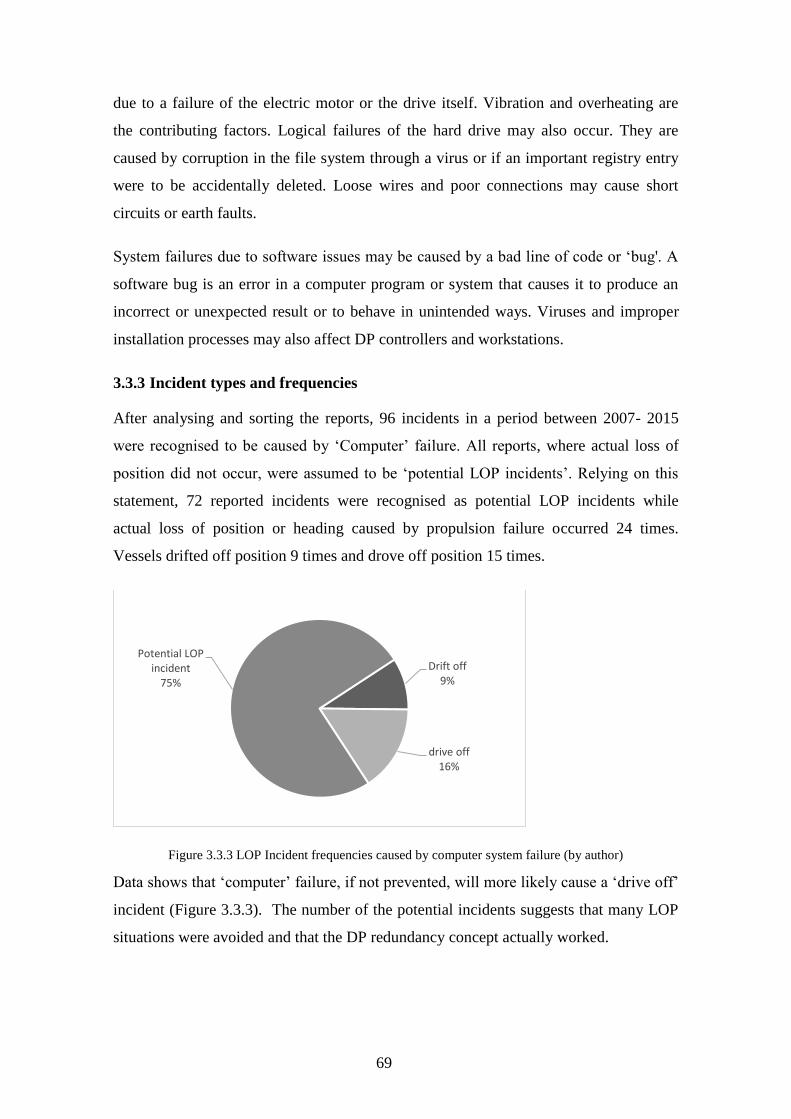
69
due to a failure of the electric motor or the drive itself. Vibration and overheating are
the contributing factors. Logical failures of the hard drive may also occur. They are
caused by corruption in the file system through a virus or if an important registry entry
were to be accidentally deleted. Loose wires and poor connections may cause short
circuits or earth faults.
System failures due to software issues may be caused by a bad line of code or ‘bug'. A
software bug is an error in a computer program or system that causes it to produce an
incorrect or unexpected result or to behave in unintended ways. Viruses and improper
installation processes may also affect DP controllers and workstations.
3.3.3 Incident types and frequencies
After analysing and sorting the reports, 96 incidents in a period between 2007- 2015
were recognised to be caused by ‘Computer’ failure. All reports, where actual loss of
position did not occur, were assumed to be ‘potential LOP incidents’. Relying on this
statement, 72 reported incidents were recognised as potential LOP incidents while
actual loss of position or heading caused by propulsion failure occurred 24 times.
Vessels drifted off position 9 times and drove off position 15 times.
Figure 3.3.3 LOP Incident frequencies caused by computer system failure (by author)
Data shows that ‘computer’ failure, if not prevented, will more likely cause a ‘drive off’
incident (Figure 3.3.3). The number of the potential incidents suggests that many LOP
situations were avoided and that the DP redundancy concept actually worked.
Drift off9%
drive off16%
Potential LOP incident
75%
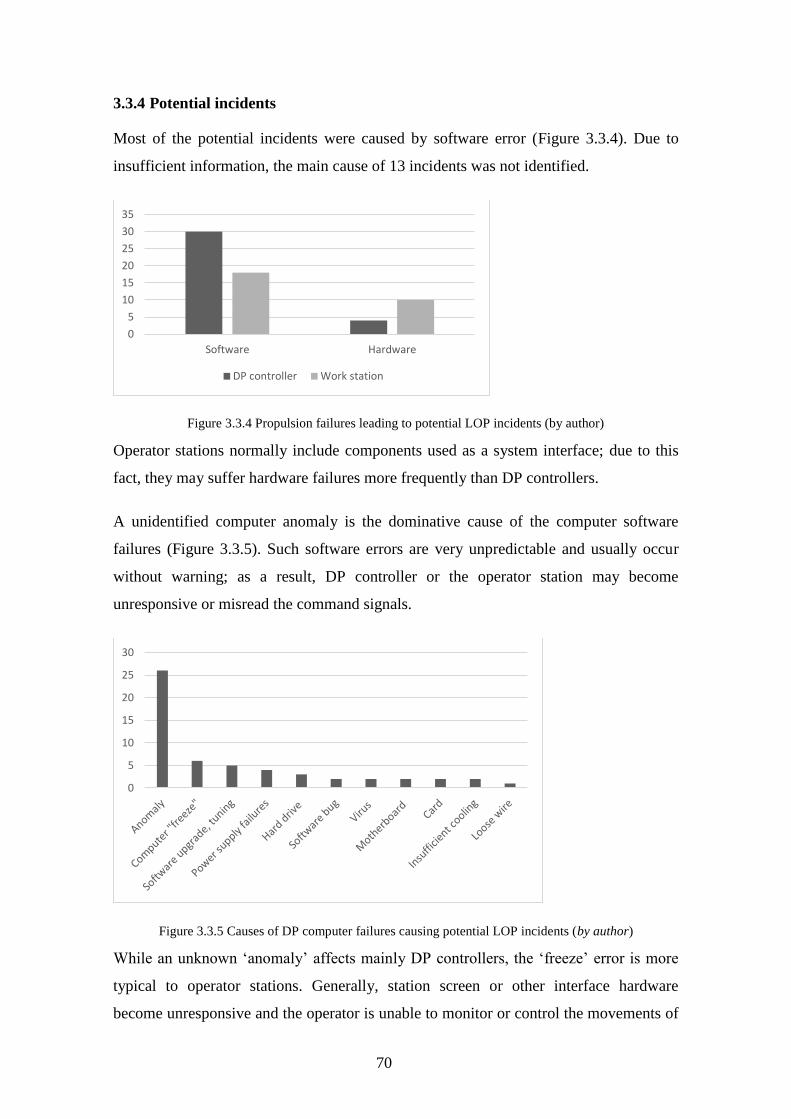
70
3.3.4 Potential incidents
Most of the potential incidents were caused by software error (Figure 3.3.4). Due to
insufficient information, the main cause of 13 incidents was not identified.
Figure 3.3.4 Propulsion failures leading to potential LOP incidents (by author)
Operator stations normally include components used as a system interface; due to this
fact, they may suffer hardware failures more frequently than DP controllers.
A unidentified computer anomaly is the dominative cause of the computer software
failures (Figure 3.3.5). Such software errors are very unpredictable and usually occur
without warning; as a result, DP controller or the operator station may become
unresponsive or misread the command signals.
Figure 3.3.5 Causes of DP computer failures causing potential LOP incidents (by author)
While an unknown ‘anomaly’ affects mainly DP controllers, the ‘freeze’ error is more
typical to operator stations. Generally, station screen or other interface hardware
become unresponsive and the operator is unable to monitor or control the movements of
0
5
10
15
20
25
30
35
Software Hardware
DP controller Work station
0
5
10
15
20
25
30
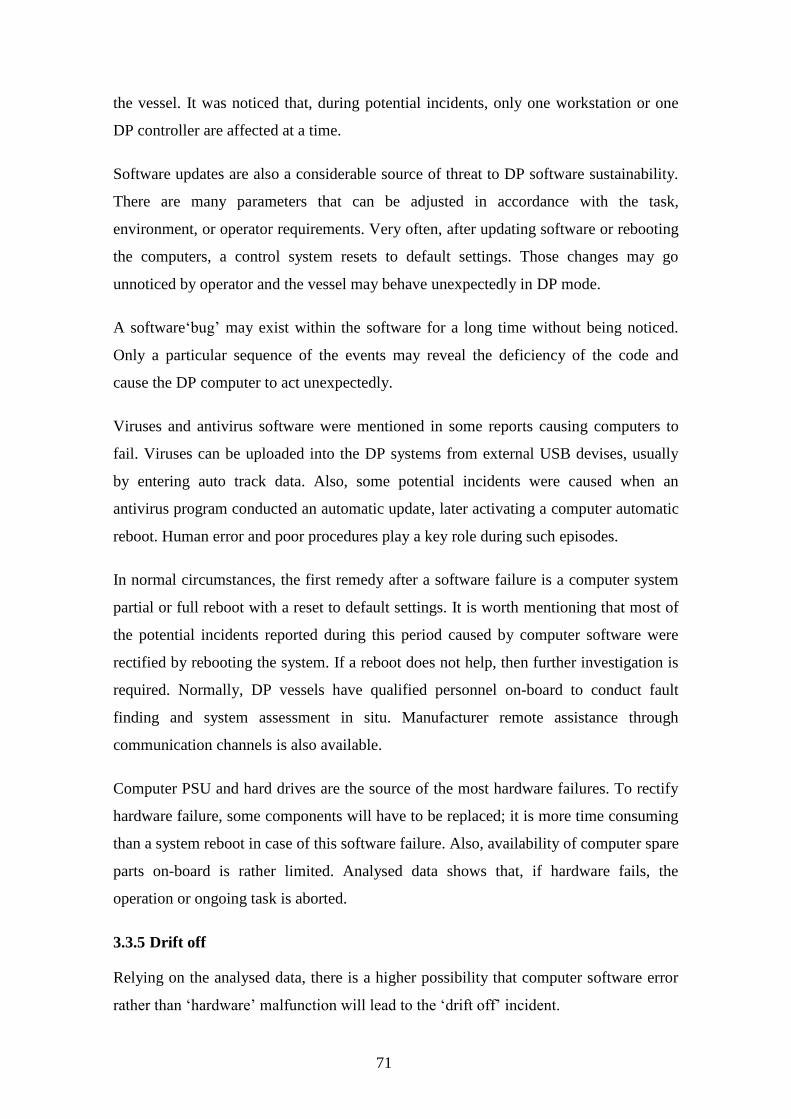
71
the vessel. It was noticed that, during potential incidents, only one workstation or one
DP controller are affected at a time.
Software updates are also a considerable source of threat to DP software sustainability.
There are many parameters that can be adjusted in accordance with the task,
environment, or operator requirements. Very often, after updating software or rebooting
the computers, a control system resets to default settings. Those changes may go
unnoticed by operator and the vessel may behave unexpectedly in DP mode.
A software‘bug’ may exist within the software for a long time without being noticed.
Only a particular sequence of the events may reveal the deficiency of the code and
cause the DP computer to act unexpectedly.
Viruses and antivirus software were mentioned in some reports causing computers to
fail. Viruses can be uploaded into the DP systems from external USB devises, usually
by entering auto track data. Also, some potential incidents were caused when an
antivirus program conducted an automatic update, later activating a computer automatic
reboot. Human error and poor procedures play a key role during such episodes.
In normal circumstances, the first remedy after a software failure is a computer system
partial or full reboot with a reset to default settings. It is worth mentioning that most of
the potential incidents reported during this period caused by computer software were
rectified by rebooting the system. If a reboot does not help, then further investigation is
required. Normally, DP vessels have qualified personnel on-board to conduct fault
finding and system assessment in situ. Manufacturer remote assistance through
communication channels is also available.
Computer PSU and hard drives are the source of the most hardware failures. To rectify
hardware failure, some components will have to be replaced; it is more time consuming
than a system reboot in case of this software failure. Also, availability of computer spare
parts on-board is rather limited. Analysed data shows that, if hardware fails, the
operation or ongoing task is aborted.
3.3.5 Drift off
Relying on the analysed data, there is a higher possibility that computer software error
rather than ‘hardware’ malfunction will lead to the ‘drift off’ incident.
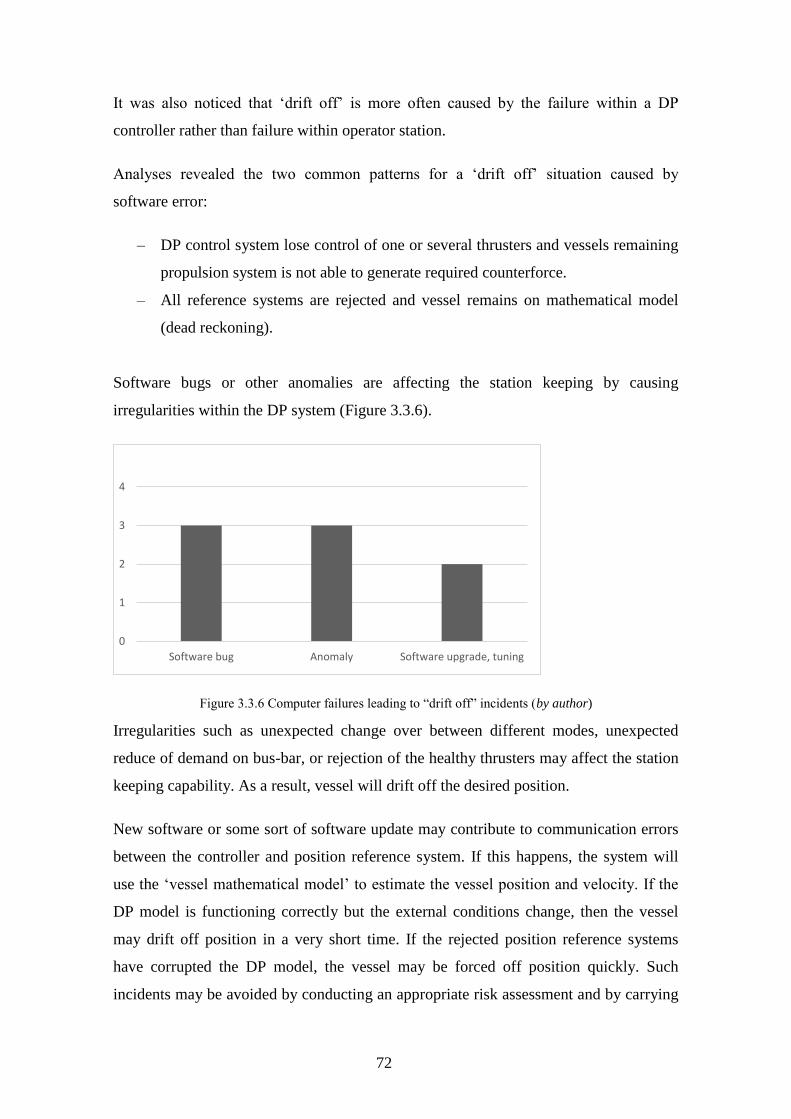
72
It was also noticed that ‘drift off’ is more often caused by the failure within a DP
controller rather than failure within operator station.
Analyses revealed the two common patterns for a ‘drift off’ situation caused by
software error:
– DP control system lose control of one or several thrusters and vessels remaining
propulsion system is not able to generate required counterforce.
– All reference systems are rejected and vessel remains on mathematical model
(dead reckoning).
Software bugs or other anomalies are affecting the station keeping by causing
irregularities within the DP system (Figure 3.3.6).
Figure 3.3.6 Computer failures leading to “drift off” incidents (by author)
Irregularities such as unexpected change over between different modes, unexpected
reduce of demand on bus-bar, or rejection of the healthy thrusters may affect the station
keeping capability. As a result, vessel will drift off the desired position.
New software or some sort of software update may contribute to communication errors
between the controller and position reference system. If this happens, the system will
use the ‘vessel mathematical model’ to estimate the vessel position and velocity. If the
DP model is functioning correctly but the external conditions change, then the vessel
may drift off position in a very short time. If the rejected position reference systems
have corrupted the DP model, the vessel may be forced off position quickly. Such
incidents may be avoided by conducting an appropriate risk assessment and by carrying
0
1
2
3
4
Software bug Anomaly Software upgrade, tuning
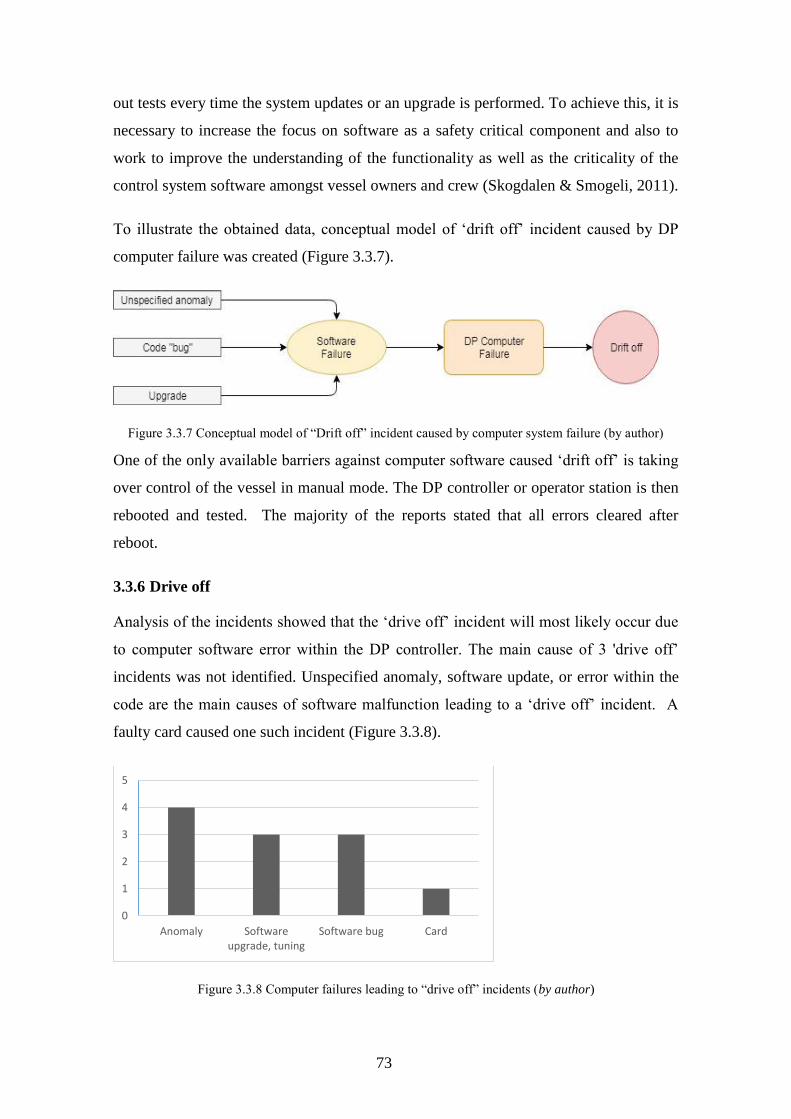
73
out tests every time the system updates or an upgrade is performed. To achieve this, it is
necessary to increase the focus on software as a safety critical component and also to
work to improve the understanding of the functionality as well as the criticality of the
control system software amongst vessel owners and crew (Skogdalen & Smogeli, 2011).
To illustrate the obtained data, conceptual model of ‘drift off’ incident caused by DP
computer failure was created (Figure 3.3.7).
Figure 3.3.7 Conceptual model of “Drift off” incident caused by computer system failure (by author)
One of the only available barriers against computer software caused ‘drift off’ is taking
over control of the vessel in manual mode. The DP controller or operator station is then
rebooted and tested. The majority of the reports stated that all errors cleared after
reboot.
3.3.6 Drive off
Analysis of the incidents showed that the ‘drive off’ incident will most likely occur due
to computer software error within the DP controller. The main cause of 3 'drive off’
incidents was not identified. Unspecified anomaly, software update, or error within the
code are the main causes of software malfunction leading to a ‘drive off’ incident. A
faulty card caused one such incident (Figure 3.3.8).
Figure 3.3.8 Computer failures leading to “drive off” incidents (by author)
0
1
2
3
4
5
Anomaly Softwareupgrade, tuning
Software bug Card
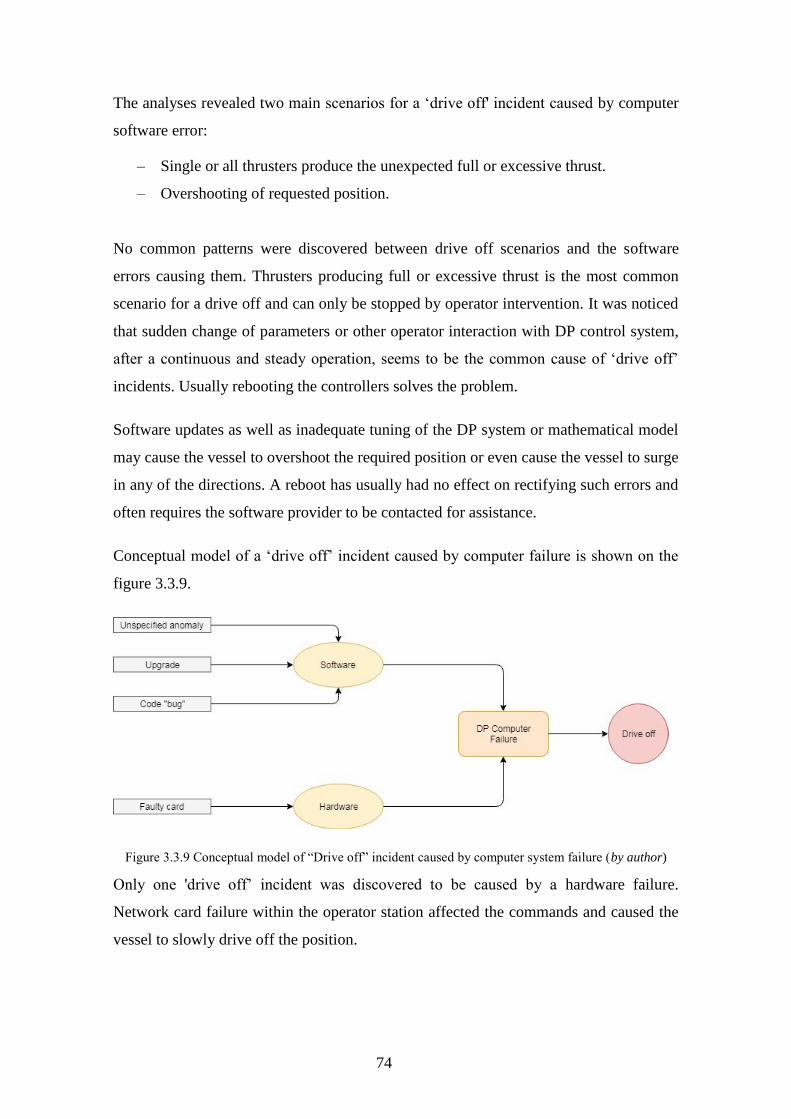
74
The analyses revealed two main scenarios for a ‘drive off' incident caused by computer
software error:
– Single or all thrusters produce the unexpected full or excessive thrust.
– Overshooting of requested position.
No common patterns were discovered between drive off scenarios and the software
errors causing them. Thrusters producing full or excessive thrust is the most common
scenario for a drive off and can only be stopped by operator intervention. It was noticed
that sudden change of parameters or other operator interaction with DP control system,
after a continuous and steady operation, seems to be the common cause of ‘drive off’
incidents. Usually rebooting the controllers solves the problem.
Software updates as well as inadequate tuning of the DP system or mathematical model
may cause the vessel to overshoot the required position or even cause the vessel to surge
in any of the directions. A reboot has usually had no effect on rectifying such errors and
often requires the software provider to be contacted for assistance.
Conceptual model of a ‘drive off’ incident caused by computer failure is shown on the
figure 3.3.9.
Figure 3.3.9 Conceptual model of “Drive off” incident caused by computer system failure (by author)
Only one 'drive off’ incident was discovered to be caused by a hardware failure.
Network card failure within the operator station affected the commands and caused the
vessel to slowly drive off the position.
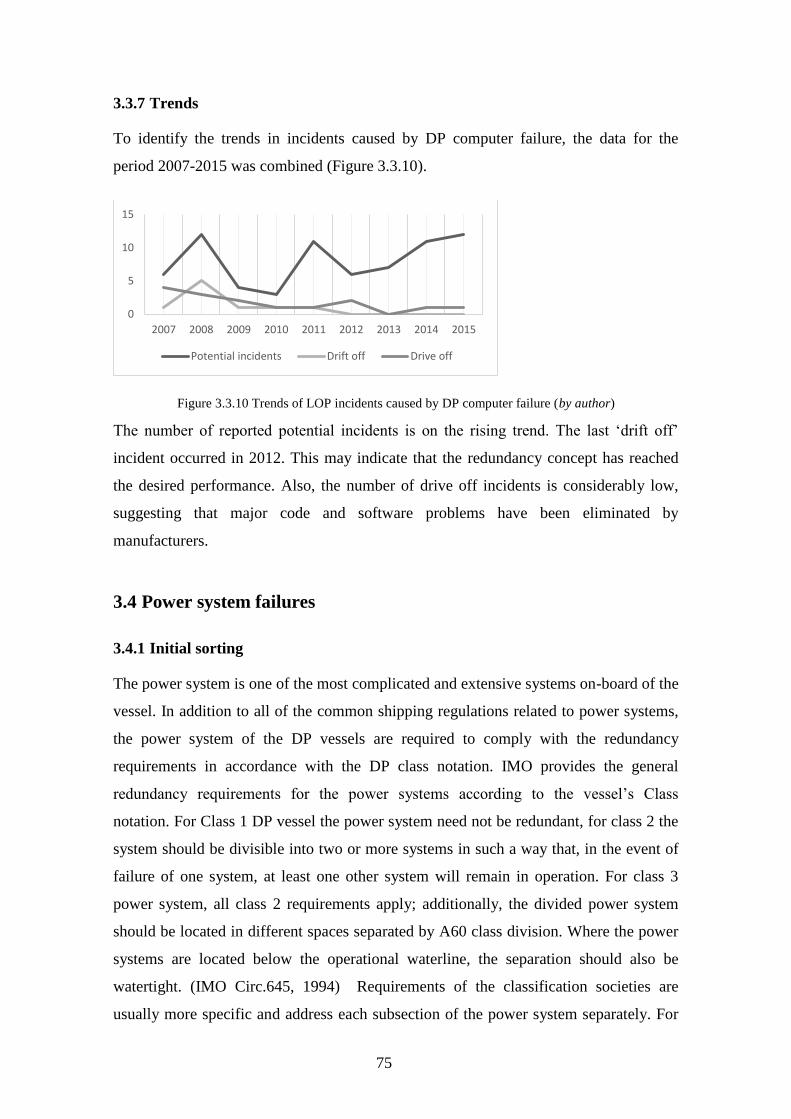
75
3.3.7 Trends
To identify the trends in incidents caused by DP computer failure, the data for the
period 2007-2015 was combined (Figure 3.3.10).
Figure 3.3.10 Trends of LOP incidents caused by DP computer failure (by author)
The number of reported potential incidents is on the rising trend. The last ‘drift off’
incident occurred in 2012. This may indicate that the redundancy concept has reached
the desired performance. Also, the number of drive off incidents is considerably low,
suggesting that major code and software problems have been eliminated by
manufacturers.
3.4 Power system failures
3.4.1 Initial sorting
The power system is one of the most complicated and extensive systems on-board of the
vessel. In addition to all of the common shipping regulations related to power systems,
the power system of the DP vessels are required to comply with the redundancy
requirements in accordance with the DP class notation. IMO provides the general
redundancy requirements for the power systems according to the vessel’s Class
notation. For Class 1 DP vessel the power system need not be redundant, for class 2 the
system should be divisible into two or more systems in such a way that, in the event of
failure of one system, at least one other system will remain in operation. For class 3
power system, all class 2 requirements apply; additionally, the divided power system
should be located in different spaces separated by A60 class division. Where the power
systems are located below the operational waterline, the separation should also be
watertight. (IMO Circ.645, 1994) Requirements of the classification societies are
usually more specific and address each subsection of the power system separately. For
0
5
10
15
2007 2008 2009 2010 2011 2012 2013 2014 2015
Potential incidents Drift off Drive off
76
the instance, the ABS guide for DP vessels divides power system requirements into 4
different sections (ABS, 2013):
1. Power generation,
2. Power distribution,
3. Power management system,
4. Uninterruptible power supply systems.
Power generation addresses the generators and prime movers whilst the power
distribution section stipulates the requirements of the switchboards and cabling network.
To assist the designers of the DP systems in fulfilling all of the requirements related to
redundant power systems, the recommended practises and design philosophies are
available from different class societies and other DP related associations.
Many of the new DP operated offshore vessels are equipped with diesel-electric
propulsion (Sørfonn, 2007, 5). Electrical propulsion system consists of the prime mover
and a generator, commonly called the gen-set. Gen-sets produce all necessary electrical
energy required on-board. Produced energy is then distributed to consumers including
propulsion thrusters. The number of gen-sets installed on-board depends on the vessel’s
power and its redundancy requirements. Typical DP vessel power plants have four, six,
or eight gen-sets connected to two or more switchboards. Engines for an electric power
plant are most commonly liquid fuelled, four-stroke, turbocharged medium speed diesel
engines (IMCA M 206 Rev.1, 2016). Synchronous alternating current generators, more
commonly called alternators, are the most commonly used on board DP ships.
In this section, all incidents caused by power system failure are analysed. In total, 82
IMCA reports are transferred into the Excel file. After initial sorting, some adjustments
were made with regard to the main failures and were moved as follows:
– Moved to ‘propulsion’ subsection – 2 reports
– Removed as ‘human factor’ – 10 reports
– Removed from the list – 2 reports
– Added from ‘Propulsion’ subsection – 15 reports
Not following the procedures, when operating the switchboard or unintentional stopping
of the gen-sets through accidentally pushing the stop or emergency stops, are just some
examples of human errors what may lead to loss of position incident.
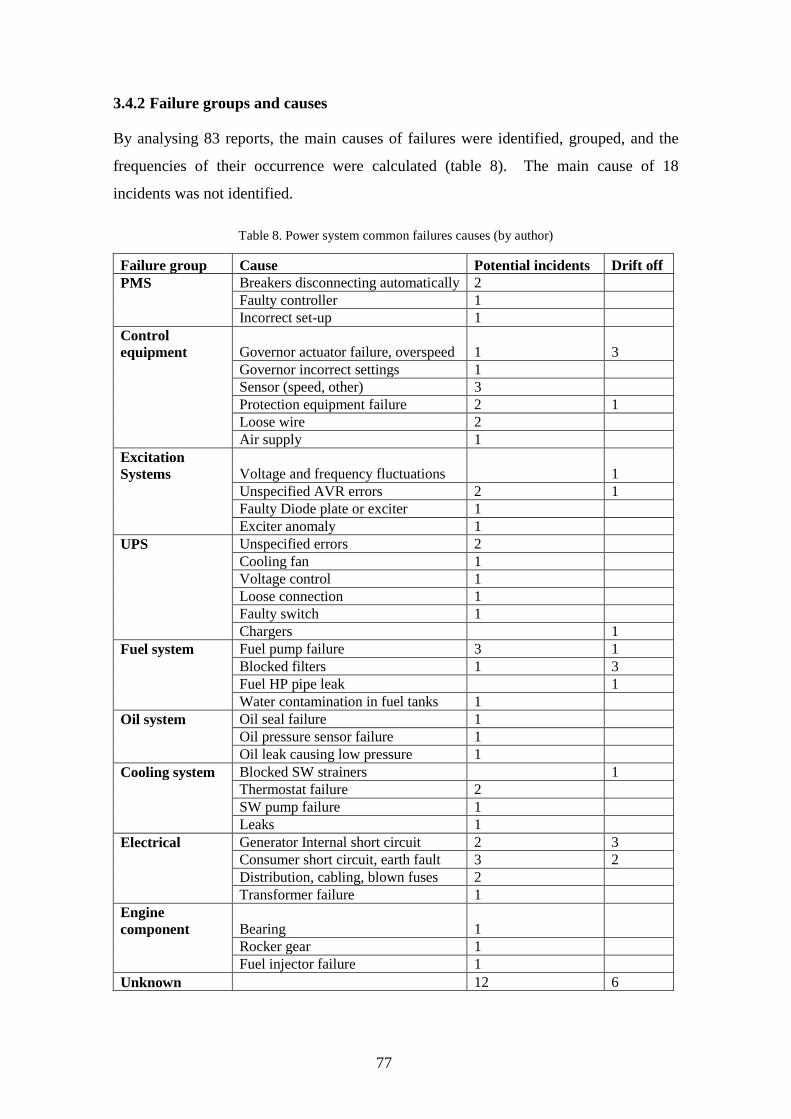
77
3.4.2 Failure groups and causes
By analysing 83 reports, the main causes of failures were identified, grouped, and the
frequencies of their occurrence were calculated (table 8). The main cause of 18
incidents was not identified.
Table 8. Power system common failures causes (by author)
Failure group Cause Potential incidents Drift off
PMS Breakers disconnecting automatically 2
Faulty controller 1
Incorrect set-up 1
Control
equipment Governor actuator failure, overspeed 1 3
Governor incorrect settings 1
Sensor (speed, other) 3
Protection equipment failure 2 1
Loose wire 2
Air supply 1
Excitation
Systems Voltage and frequency fluctuations
1
Unspecified AVR errors 2 1
Faulty Diode plate or exciter 1
Exciter anomaly 1
UPS Unspecified errors 2
Cooling fan 1
Voltage control 1
Loose connection 1
Faulty switch 1
Chargers
1
Fuel system Fuel pump failure 3 1
Blocked filters 1 3
Fuel HP pipe leak
1
Water contamination in fuel tanks 1
Oil system Oil seal failure 1
Oil pressure sensor failure 1
Oil leak causing low pressure 1
Cooling system Blocked SW strainers
1
Thermostat failure 2
SW pump failure 1
Leaks 1
Electrical Generator Internal short circuit 2 3
Consumer short circuit, earth fault 3 2
Distribution, cabling, blown fuses 2
Transformer failure 1
Engine
component Bearing 1
Rocker gear 1
Fuel injector failure 1
Unknown 12 6
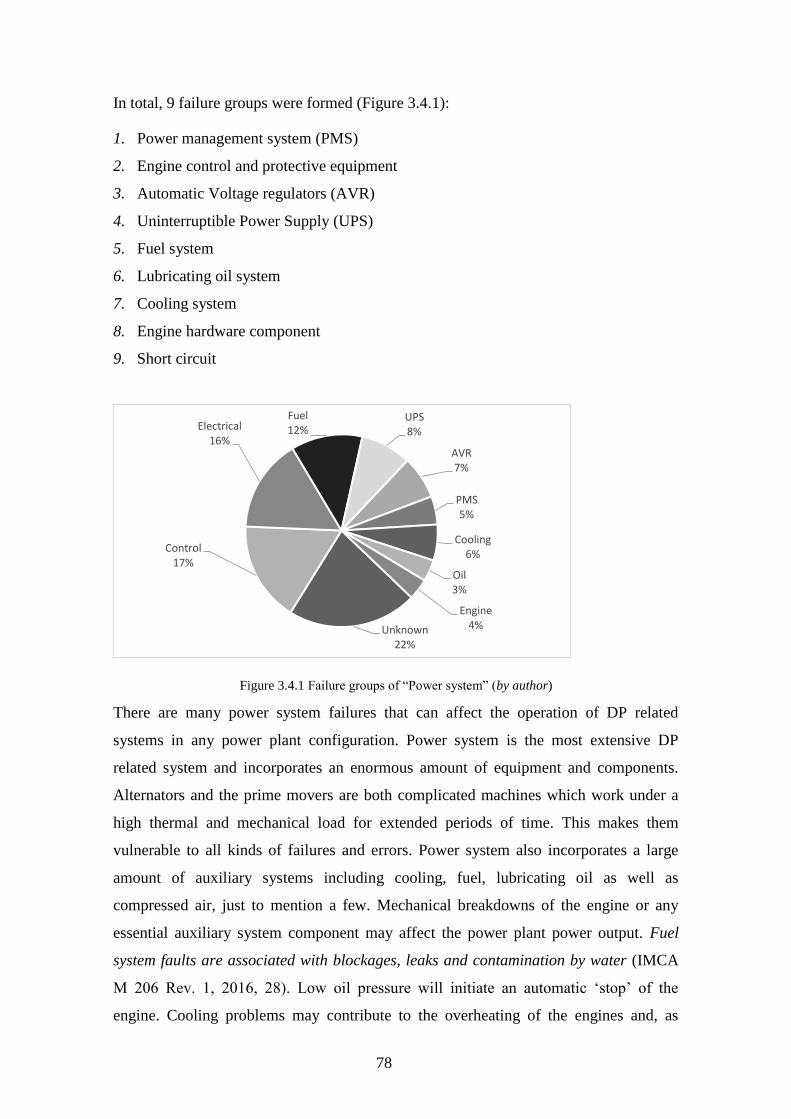
78
In total, 9 failure groups were formed (Figure 3.4.1):
1. Power management system (PMS)
2. Engine control and protective equipment
3. Automatic Voltage regulators (AVR)
4. Uninterruptible Power Supply (UPS)
5. Fuel system
6. Lubricating oil system
7. Cooling system
8. Engine hardware component
9. Short circuit
Figure 3.4.1 Failure groups of “Power system” (by author)
There are many power system failures that can affect the operation of DP related
systems in any power plant configuration. Power system is the most extensive DP
related system and incorporates an enormous amount of equipment and components.
Alternators and the prime movers are both complicated machines which work under a
high thermal and mechanical load for extended periods of time. This makes them
vulnerable to all kinds of failures and errors. Power system also incorporates a large
amount of auxiliary systems including cooling, fuel, lubricating oil as well as
compressed air, just to mention a few. Mechanical breakdowns of the engine or any
essential auxiliary system component may affect the power plant power output. Fuel
system faults are associated with blockages, leaks and contamination by water (IMCA
M 206 Rev. 1, 2016, 28). Low oil pressure will initiate an automatic ‘stop’ of the
engine. Cooling problems may contribute to the overheating of the engines and, as
Unknown22%
Control17%
Electrical16%
Fuel12%
UPS8%
AVR7%
PMS5%
Cooling6%
Oil3%
Engine4%
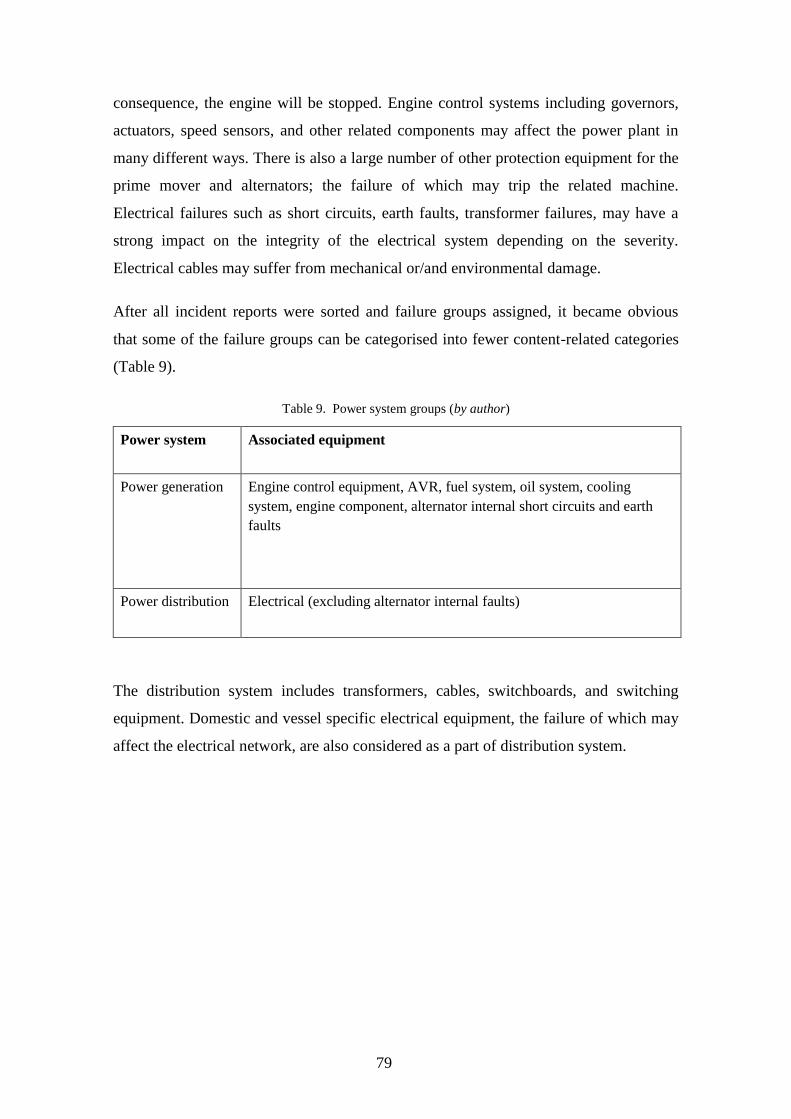
79
consequence, the engine will be stopped. Engine control systems including governors,
actuators, speed sensors, and other related components may affect the power plant in
many different ways. There is also a large number of other protection equipment for the
prime mover and alternators; the failure of which may trip the related machine.
Electrical failures such as short circuits, earth faults, transformer failures, may have a
strong impact on the integrity of the electrical system depending on the severity.
Electrical cables may suffer from mechanical or/and environmental damage.
After all incident reports were sorted and failure groups assigned, it became obvious
that some of the failure groups can be categorised into fewer content-related categories
(Table 9).
Table 9. Power system groups (by author)
Power system Associated equipment
Power generation Engine control equipment, AVR, fuel system, oil system, cooling
system, engine component, alternator internal short circuits and earth
faults
Power distribution Electrical (excluding alternator internal faults)
The distribution system includes transformers, cables, switchboards, and switching
equipment. Domestic and vessel specific electrical equipment, the failure of which may
affect the electrical network, are also considered as a part of distribution system.
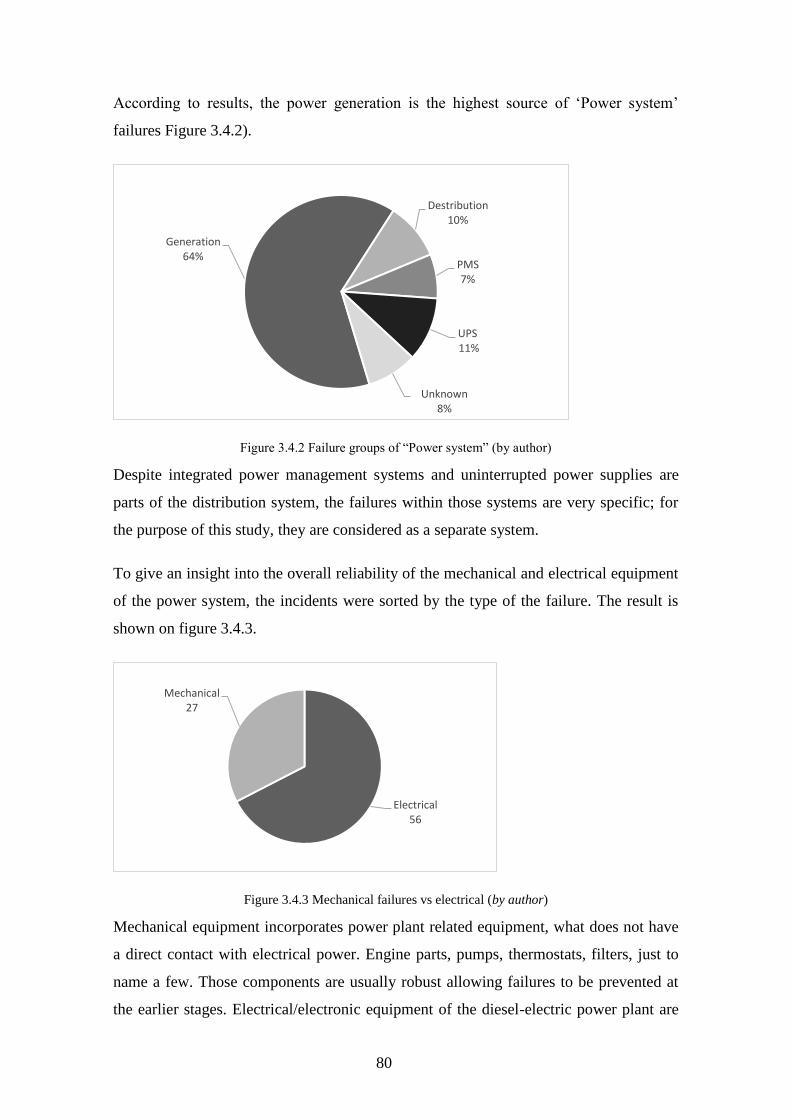
80
According to results, the power generation is the highest source of ‘Power system’
failures Figure 3.4.2).
Figure 3.4.2 Failure groups of “Power system” (by author)
Despite integrated power management systems and uninterrupted power supplies are
parts of the distribution system, the failures within those systems are very specific; for
the purpose of this study, they are considered as a separate system.
To give an insight into the overall reliability of the mechanical and electrical equipment
of the power system, the incidents were sorted by the type of the failure. The result is
shown on figure 3.4.3.
Figure 3.4.3 Mechanical failures vs electrical (by author)
Mechanical equipment incorporates power plant related equipment, what does not have
a direct contact with electrical power. Engine parts, pumps, thermostats, filters, just to
name a few. Those components are usually robust allowing failures to be prevented at
the earlier stages. Electrical/electronic equipment of the diesel-electric power plant are
Generation64%
Destribution10%
PMS7%
UPS11%
Unknown8%
Electrical56
Mechanical27
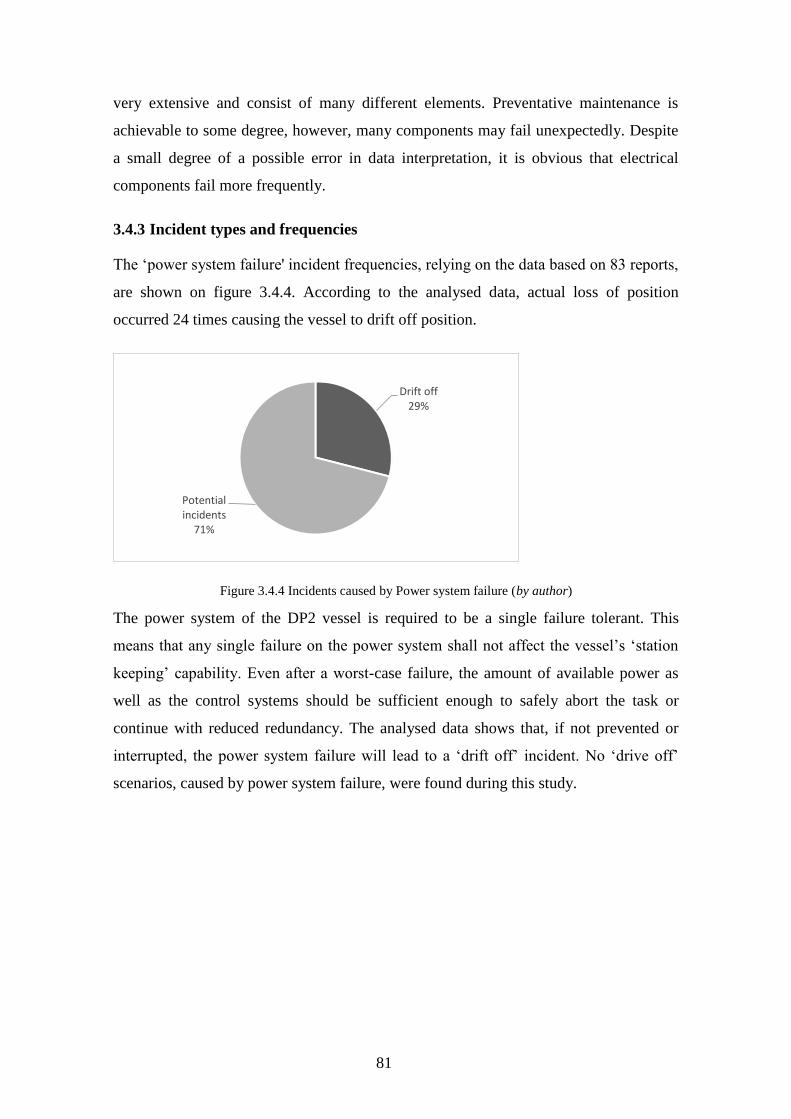
81
very extensive and consist of many different elements. Preventative maintenance is
achievable to some degree, however, many components may fail unexpectedly. Despite
a small degree of a possible error in data interpretation, it is obvious that electrical
components fail more frequently.
3.4.3 Incident types and frequencies
The ‘power system failure' incident frequencies, relying on the data based on 83 reports,
are shown on figure 3.4.4. According to the analysed data, actual loss of position
occurred 24 times causing the vessel to drift off position.
Figure 3.4.4 Incidents caused by Power system failure (by author)
The power system of the DP2 vessel is required to be a single failure tolerant. This
means that any single failure on the power system shall not affect the vessel’s ‘station
keeping’ capability. Even after a worst-case failure, the amount of available power as
well as the control systems should be sufficient enough to safely abort the task or
continue with reduced redundancy. The analysed data shows that, if not prevented or
interrupted, the power system failure will lead to a ‘drift off’ incident. No ‘drive off’
scenarios, caused by power system failure, were found during this study.
Drift off29%
Potential incidents
71%
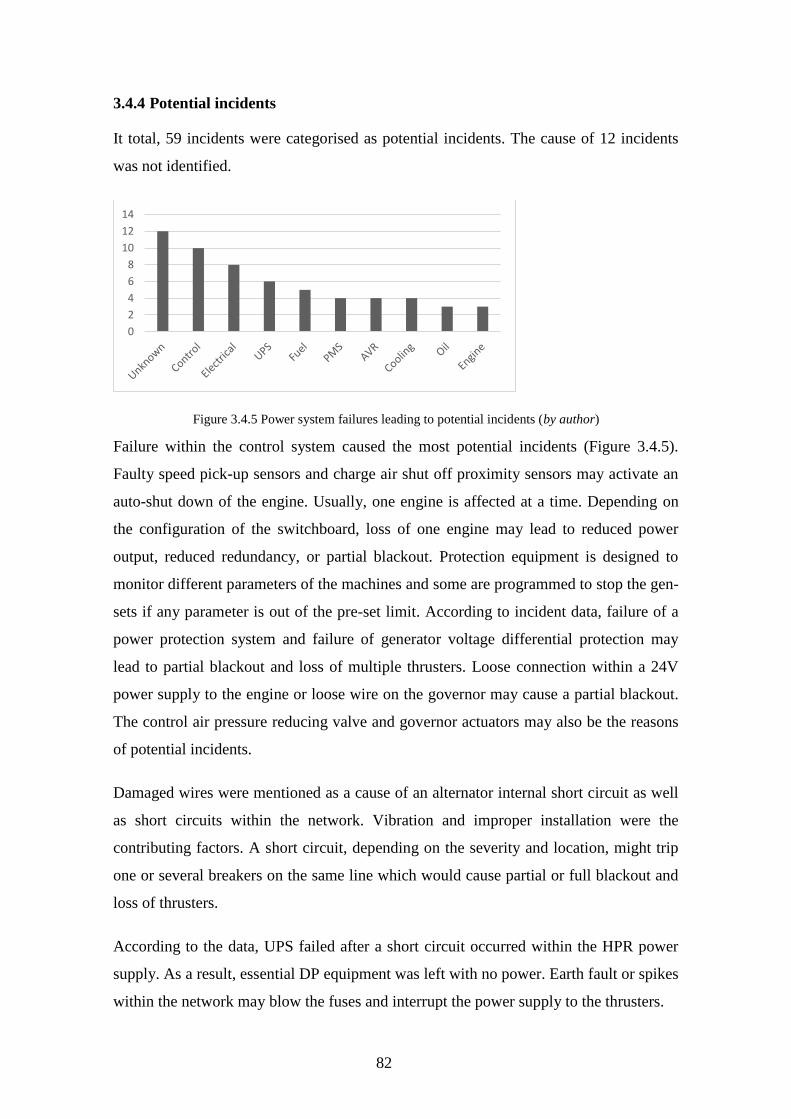
82
3.4.4 Potential incidents
It total, 59 incidents were categorised as potential incidents. The cause of 12 incidents
was not identified.
Figure 3.4.5 Power system failures leading to potential incidents (by author)
Failure within the control system caused the most potential incidents (Figure 3.4.5).
Faulty speed pick-up sensors and charge air shut off proximity sensors may activate an
auto-shut down of the engine. Usually, one engine is affected at a time. Depending on
the configuration of the switchboard, loss of one engine may lead to reduced power
output, reduced redundancy, or partial blackout. Protection equipment is designed to
monitor different parameters of the machines and some are programmed to stop the gen-
sets if any parameter is out of the pre-set limit. According to incident data, failure of a
power protection system and failure of generator voltage differential protection may
lead to partial blackout and loss of multiple thrusters. Loose connection within a 24V
power supply to the engine or loose wire on the governor may cause a partial blackout.
The control air pressure reducing valve and governor actuators may also be the reasons
of potential incidents.
Damaged wires were mentioned as a cause of an alternator internal short circuit as well
as short circuits within the network. Vibration and improper installation were the
contributing factors. A short circuit, depending on the severity and location, might trip
one or several breakers on the same line which would cause partial or full blackout and
loss of thrusters.
According to the data, UPS failed after a short circuit occurred within the HPR power
supply. As a result, essential DP equipment was left with no power. Earth fault or spikes
within the network may blow the fuses and interrupt the power supply to the thrusters.
0
2
4
6
8
10
12
14
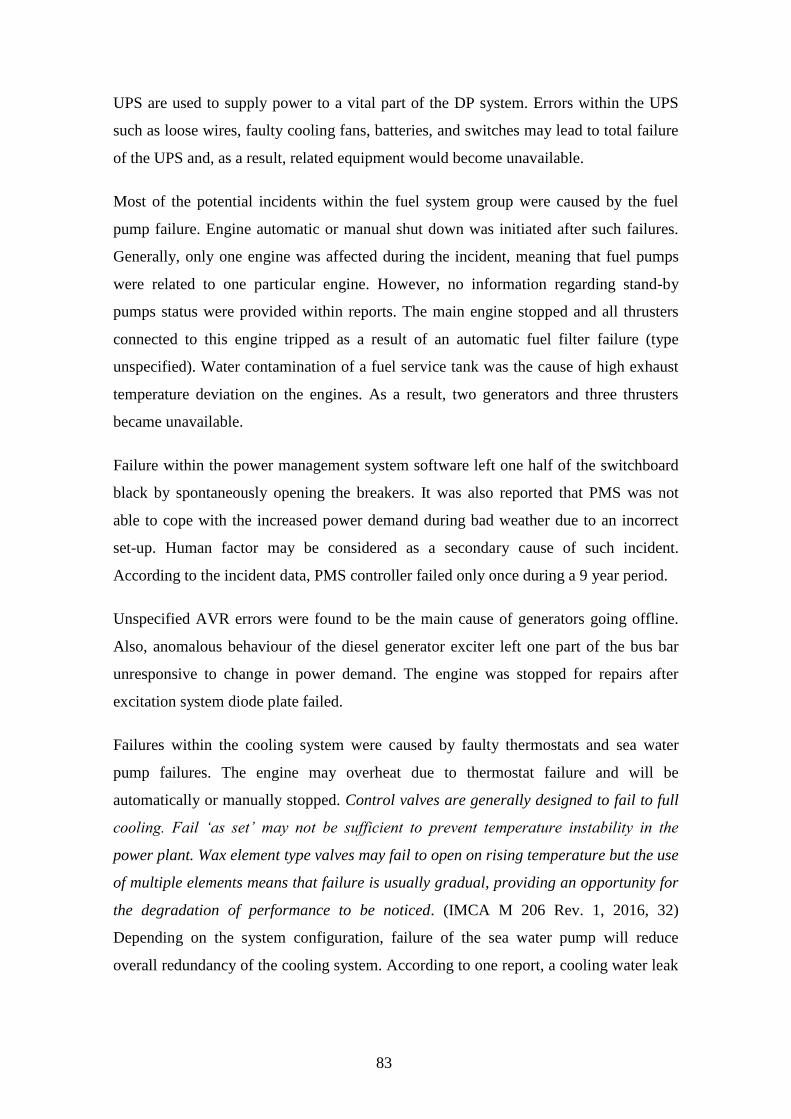
83
UPS are used to supply power to a vital part of the DP system. Errors within the UPS
such as loose wires, faulty cooling fans, batteries, and switches may lead to total failure
of the UPS and, as a result, related equipment would become unavailable.
Most of the potential incidents within the fuel system group were caused by the fuel
pump failure. Engine automatic or manual shut down was initiated after such failures.
Generally, only one engine was affected during the incident, meaning that fuel pumps
were related to one particular engine. However, no information regarding stand-by
pumps status were provided within reports. The main engine stopped and all thrusters
connected to this engine tripped as a result of an automatic fuel filter failure (type
unspecified). Water contamination of a fuel service tank was the cause of high exhaust
temperature deviation on the engines. As a result, two generators and three thrusters
became unavailable.
Failure within the power management system software left one half of the switchboard
black by spontaneously opening the breakers. It was also reported that PMS was not
able to cope with the increased power demand during bad weather due to an incorrect
set-up. Human factor may be considered as a secondary cause of such incident.
According to the incident data, PMS controller failed only once during a 9 year period.
Unspecified AVR errors were found to be the main cause of generators going offline.
Also, anomalous behaviour of the diesel generator exciter left one part of the bus bar
unresponsive to change in power demand. The engine was stopped for repairs after
excitation system diode plate failed.
Failures within the cooling system were caused by faulty thermostats and sea water
pump failures. The engine may overheat due to thermostat failure and will be
automatically or manually stopped. Control valves are generally designed to fail to full
cooling. Fail ‘as set’ may not be sufficient to prevent temperature instability in the
power plant. Wax element type valves may fail to open on rising temperature but the use
of multiple elements means that failure is usually gradual, providing an opportunity for
the degradation of performance to be noticed. (IMCA M 206 Rev. 1, 2016, 32)
Depending on the system configuration, failure of the sea water pump will reduce
overall redundancy of the cooling system. According to one report, a cooling water leak
84
caused the earth fault on the shaft generator and, as a result, the shaft generator and
related thruster tripped.
Engines are protected against low oil pressure. Failure of the pressure sensor, or low oil
pressure due to a leak, will initiate auto-stop of the engine.
Engine components failures were only reported three times during the entire period of 9
years, making the internal combustion engine the most reliable part of the power
system.
For the DP vessel, redundancy in power supply system is fundamental. According to
redundancy philosophy, a single failure shall not cause or prevent the vessel from
station keeping (Sørfonn, 2007). The electrical system of a DP class 2 vessel is normally
arranged as two separate systems with bus-tie being a point of connection between
them. Bus-tie is normally closed during DP operation. Each system has dedicated
thrusters and generators connected to it. If failure occurs on one system, the other will
remain intact and the vessel will be able to maintain position or it will have enough
power and propulsion to safely terminate the operation. The same principles apply to all
sub-systems and they should be segregated in the same way. In reports, considered as
potential incidents, vessels were able to maintain position and had enough capability to
continue or safely terminate the operation.
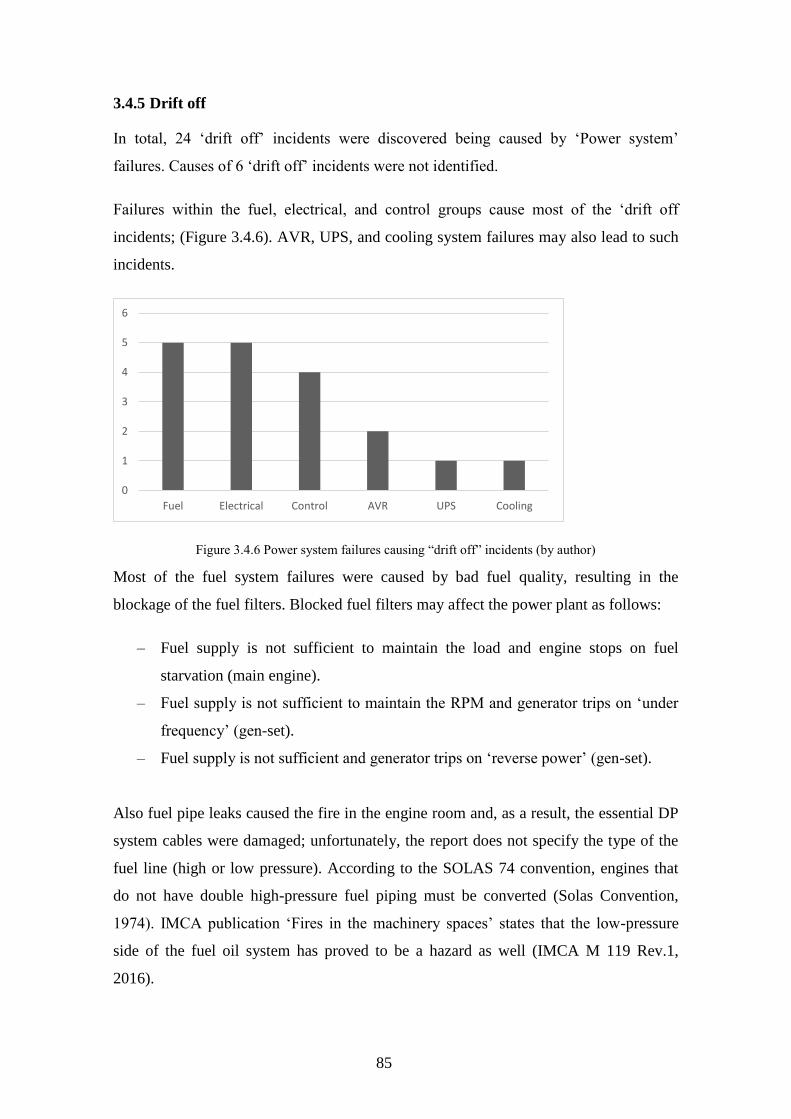
85
3.4.5 Drift off
In total, 24 ‘drift off’ incidents were discovered being caused by ‘Power system’
failures. Causes of 6 ‘drift off’ incidents were not identified.
Failures within the fuel, electrical, and control groups cause most of the ‘drift off
incidents; (Figure 3.4.6). AVR, UPS, and cooling system failures may also lead to such
incidents.
Figure 3.4.6 Power system failures causing “drift off” incidents (by author)
Most of the fuel system failures were caused by bad fuel quality, resulting in the
blockage of the fuel filters. Blocked fuel filters may affect the power plant as follows:
– Fuel supply is not sufficient to maintain the load and engine stops on fuel
starvation (main engine).
– Fuel supply is not sufficient to maintain the RPM and generator trips on ‘under
frequency’ (gen-set).
– Fuel supply is not sufficient and generator trips on ‘reverse power’ (gen-set).
Also fuel pipe leaks caused the fire in the engine room and, as a result, the essential DP
system cables were damaged; unfortunately, the report does not specify the type of the
fuel line (high or low pressure). According to the SOLAS 74 convention, engines that
do not have double high-pressure fuel piping must be converted (Solas Convention,
1974). IMCA publication ‘Fires in the machinery spaces’ states that the low-pressure
side of the fuel oil system has proved to be a hazard as well (IMCA M 119 Rev.1,
2016).
0
1
2
3
4
5
6
Fuel Electrical Control AVR UPS Cooling
86
A generator internal short circuit and short circuits within the domestic electrical
network may lead to drift off. Severe short circuits will induce a momentary voltage
drop. If the complete network is connected together this voltage drop will be seen in the
entire network. This kind of voltage drop will always be present during short circuit
conditions and all consumers connected to these networks may trip or stall if the
voltage cannot be maintained (Sørfonn, 2007, 13). Analysed data shows that position is
lost mainly due to the tripped thrusters after a severe short circuit. As a result, the vessel
loses its capability to maintain position.
Control system failures leading to ‘drift off’ were caused by an error within the
governor or actuator as well as by a faulty ‘reverse power’ microswitch. The engine
governor controls the fuel admission to the engine. Conventional AC generators operate
at constant speed and the governor is arranged to maintain this speed. The most
common governor types are electronic governors with electric or electro-hydraulic
actuators to control the fuel rack on the engine. Many older vessels are fitted with
hydro-mechanical governors (IMCA M 206 Rev.1, 2016). Governor malfunction may
cause severe active power sharing imbalance and voltage/frequency fluctuations in the
network; these may trip the thrusters and other sensitive protective equipment. ‘Fail to
full power’ is the failure mode of greatest concern as this can cause one generator to
take the entire system load. Depending on the generator rating relative to the load size,
the faulty machine may or may not trip on overload. If the machine rating is larger than
the available load, the healthy generators connected to the system will trip on reverse
power. (IMCA M 206 Rev.1, 2016) A fuel control error may also lead to the engine
overspeed. In this case ‘overspeed protection’ will shut down the engine. Analysed
incidents suggest that single governor or actuator malfunction may lead to a severe
consequence and cause a serious ‘drift off’ incident.
A typical AVR failure affecting more than one generator may occur if the AVR causes
over-excitation. This may disrupt reactive power sharing causing healthy machines to
operate in the capacitive region and trip on under excitation (IMCA M 206 Rev.1,
2016). Such failure will lead to full blackout and vessel will drift off position.
Two main engines and two thrusters went offline after loss of DC chargers to the battery
bank. Engine control power is typically 24Vdc which may be derived either from a DC
power supply with battery backup or from a control system which is powered from a
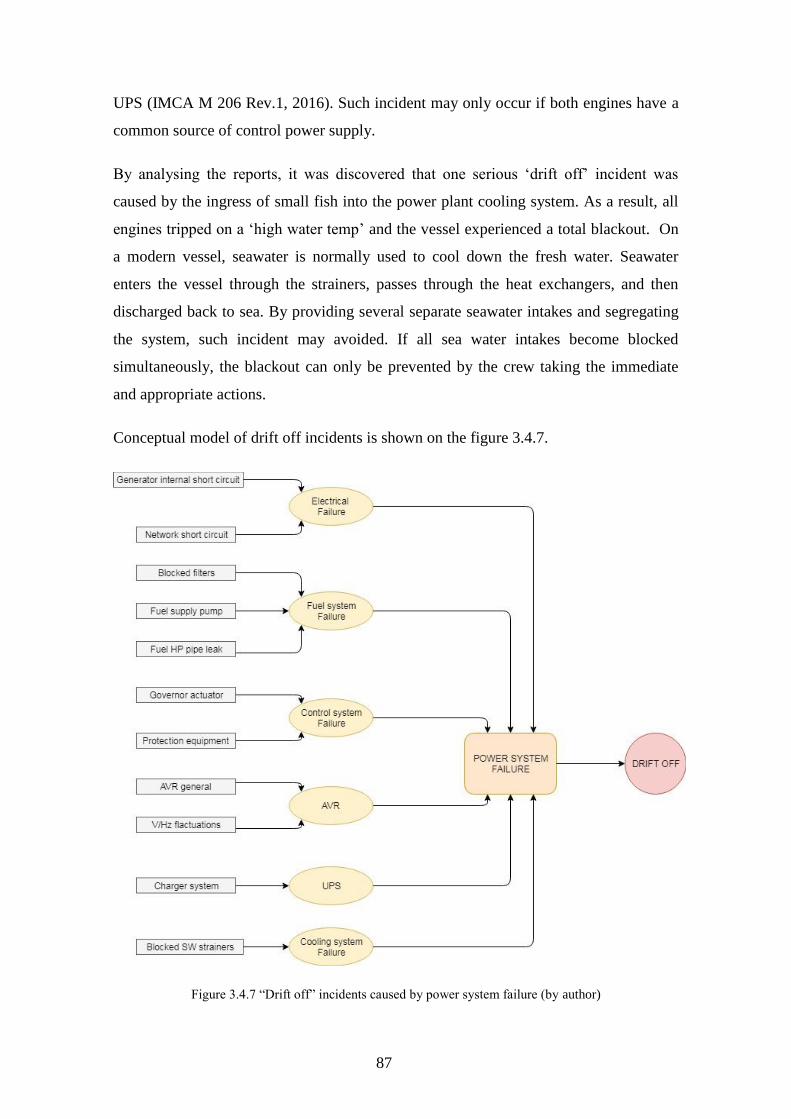
87
UPS (IMCA M 206 Rev.1, 2016). Such incident may only occur if both engines have a
common source of control power supply.
By analysing the reports, it was discovered that one serious ‘drift off’ incident was
caused by the ingress of small fish into the power plant cooling system. As a result, all
engines tripped on a ‘high water temp’ and the vessel experienced a total blackout. On
a modern vessel, seawater is normally used to cool down the fresh water. Seawater
enters the vessel through the strainers, passes through the heat exchangers, and then
discharged back to sea. By providing several separate seawater intakes and segregating
the system, such incident may avoided. If all sea water intakes become blocked
simultaneously, the blackout can only be prevented by the crew taking the immediate
and appropriate actions.
Conceptual model of drift off incidents is shown on the figure 3.4.7.
Figure 3.4.7 “Drift off” incidents caused by power system failure (by author)
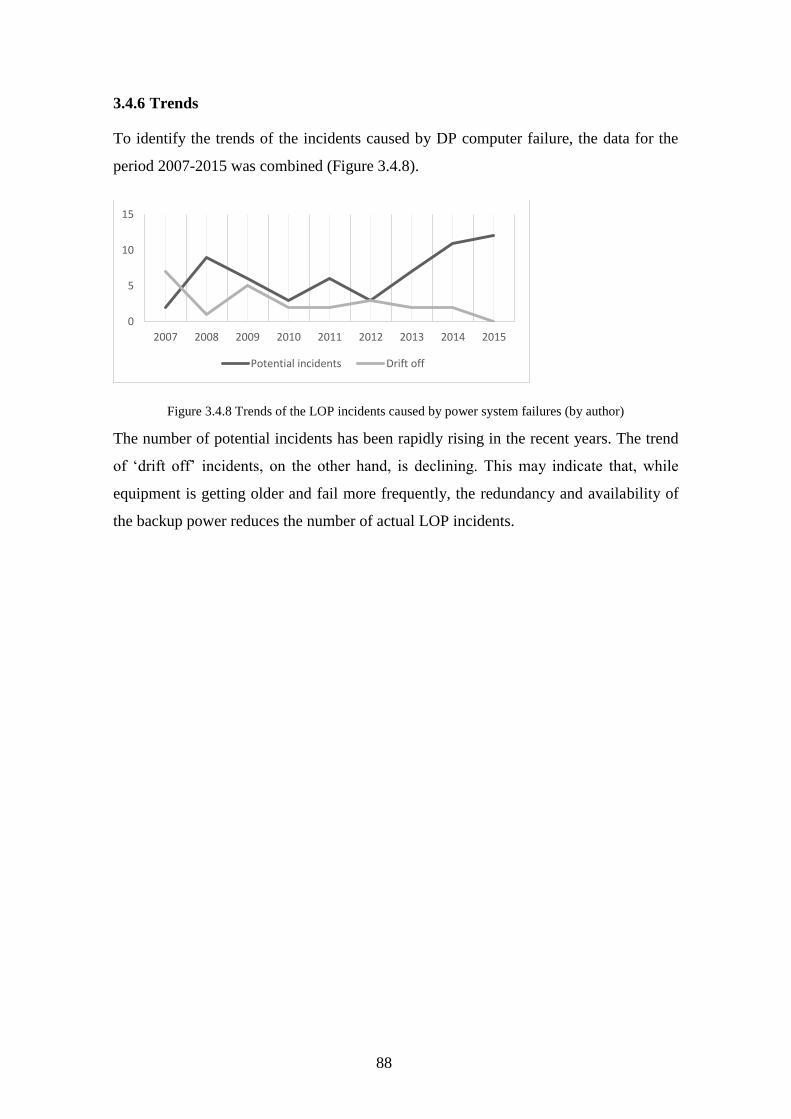
88
3.4.6 Trends
To identify the trends of the incidents caused by DP computer failure, the data for the
period 2007-2015 was combined (Figure 3.4.8).
Figure 3.4.8 Trends of the LOP incidents caused by power system failures (by author)
The number of potential incidents has been rapidly rising in the recent years. The trend
of ‘drift off’ incidents, on the other hand, is declining. This may indicate that, while
equipment is getting older and fail more frequently, the redundancy and availability of
the backup power reduces the number of actual LOP incidents.
0
5
10
15
2007 2008 2009 2010 2011 2012 2013 2014 2015
Potential incidents Drift off
89
4 Conclusion
The aim of this thesis was to determine the main causes of the most common failures of
dynamic positioning system leading to loss of position incidents, discover trends and
common patterns and find the connection between the failures and type of incident they
cause. The task turned out to be more challenging than expected due to the fact, that
information provided within the incident reports was limited and on some occasions
controversial. However, by conducting indicative content analysis, the common patterns
were identified and connections between failures and type of incidents discovered.
Initial sorting of the incident reports revealed, that the failures within propulsion, power,
position reference and computer systems cause the majority of loss of position
incidents. Each aforementioned system was considered as a separate research topic.
Such approach allowed to make adjustments to coding and categorisation process, in
order to obtain structured and systematic results.
The main discoveries of the research may be summarised as follows:
– The main causes of the propulsion system failures lie within the control and
feedback systems. Despite thrusters are designed to fail safe to low or zero
thrust, drive off incidents occur more often than drift off incidents. This fact may
be considered as a clear evidence that thrusters still fail to full thrust.
– Interference is the main cause of position reference system failures. The number
of drift off and drive off incidents is very similar, making outcome of such
failure rather unpredictable. This finding also indicates that procedures and
recommendations for use of position reference systems are not followed.
– Computer systems fail mostly due to software errors and cause two times more
drive off incidents that drift off incidents. It is very difficult to establish the real
cause of software failure, as it usually lies within the code. However, software
errors are normally resolved by rebooting the computer.
– Obtained data indicates that power system failure will lead to drift off incidents
exceptionally. Short circuits and fuel system failures cause the most incidents.
The most surprising results is that blocked fuel filters are among the most
common causes of drift off incidents.
90
The conceptual models of the LOP incidents created as an outcome of this research
provide a valuable information at a glance. They can be useful tools in a risk assessment
process or when planning and carrying out planned maintenance of the vessels dynamic
positioning system and other related equipment. Models show the most vulnerable
components and most common causes of failures leading to LOP incidents. As a
recommendation, more attention should be given to such components and sub-systems
to avoid any future incidents and undesired events.
Data obtained as a result of the analysis also contains valuable numbers of incident
occurrences and failure rates. Such information can be used in the future works to
conduct quantitative analysis and prepare the base for probabilistic risk assessments.
91
5 Lühikokkuvõte
Laeva dünaamiline positsioneerimine on laeva automaatjuhtimise moodus, mida
kasutatakse laeva paigal hoidmiseks või täpsust nõudvate manöövride teostamiseks,
kasutades selleks laeva enda propulsiivseadmeid. See moodus võimaldab hoida laeva
paigal kohtades, kus ankru kasutamine on vee sügavuse või muude asjolude tõttu
võimatu. Dünaamilise positsioneerimise süsteem hõlmab enda alla kogu laeva
seadmeid, mis on seotud dünaamilise positsioneerimisega.
Käesoleval magistritööl oli kaks eesmärki:
– määrata põhilised dünaamilise positsioneerimise süsteemi tehnilised rikked ja
nende põhjused
– seostada DP süsteemi rikked positsiooni kaotamise tüübiga
Eesmärkide täimiseks analüüsiti „International Marine Contractors Association“ poolt
avaldatud ajalooliste intsidentide raporteid ajavahemikust 2007-2015. Analüüsiks
kasutati kvalitatiivset lähenemist ja rakendati induktiivset sisuanalüüsi.
Töömahu vähendamiseks keskenduti vaid põhiliste rikete uurimisele, milleks on
propulsiivseadme, kohaviite süsteemi, DP arvuti ja laeva jõuseadmete rikked. Vastavalt
IMCA andmetele põhjustasid just need rikked 72% kogu intsidentidest antud
ajaperioodil.
Analüüs hõlmas enda alla põhiliste rikete ja nende põhjuste määramist ja grupeerimist.
Lisaks uuriti rikete mõju laeva positsiooni hoidmisele, mille tulemusena grupeeriti
intsidendid kolme rühma: kohalt ära triivimine, kohalt ära sõitmine ning potentsiaalsed
positsiooni kaotamise intsidendid. Selleks, et määrata enam levinud rikked, viidi läbi
rikete sagedusanalüüs. Tulemuste esitamiseks loodi kontseptuaalsed intsidentide
mudelid, kus rikked ja nende põhjused on näidatud reastatuna vastavalt nende esinemise
sagedusele.
Analüüsi tulemusena selgus, et propulsiivseadme, kohaviite süsteemi ja DP arvuti
rikked põhjustavad suurema tõenäosusega kohalt ärasõitmise intsidenti. Jõuseadme
rikked põhjustavad aga ainult äratriivimise intsidente. Propulsiivseadmete nõrgemaks
lüliks on tagasiside ja juhtimissignaaliga seotud probleemid, aga ka hüdraulika

92
juhtklappide rikked. Kohaviitesüsteemi probleemne koht on interferents ja selle mõju
DGNSS-le ja teistele kohaviite süsteemidele. DP arvuti langeb rivist välja enamasti vaid
tarkvara probleemide tõttu. Anomaaliad, tarkvarauuendused ja koodivead põhjustavad
enamuse intsidente. Lühised ja kütuse kvaliteet on jõuseadmete rikete suuremad
põhjustajad.
Uurimustöö tulemusena saadud andmed on võimalik rakendada DP süsteemi ja selle
osade hoolduse planeerimisel ja riskide analüüsimisel erinevate DP operatsioonide
ettevalmistamisel.
93
6 Bibliography
Cavanagh S. (1997). Content analysis: concepts, methods and applications. - Nurse
Researcher, Vol.4, 5–16. https://journals.rcni.com/doi/abs/10.7748/nr.4.3.5.s2
(12.02.2018)
Chas C. S. and Ferreiro R. (2008). Introduction to ship dynamic positioning systems. -
Journal of Maritime Research, Vol. V. No. 1, 79-96.
https://www.jmr.unican.es/index.php/jmr/issue/view/7 (04.12.2017)
Chinn P.L. & Kramer M.K. (1995). Theory and Nursing a Systematic Approach. 4th
edition. St Louis: Mosby-Year Book
David R. Thomas (2003). A general inductive approach for qualitative data analysis.
Auckland: School of Population Health, University of Auckland
DGNSS position reference sensors. (2015). Marine Technology Society, Dynamic
positioning committee website.
DP operations guidance part 1. (2012). Marine Technology Society, Dynamic
positioning committee website.
DP Operations Guidance, appendix 2 DP Project/Construction Vessels. (2012). Marine
Technology Society, Dynamic positioning committee website.
DP vessel design philosophy guidelines part 1. (2011). Marine Technology Society,
Dynamic positioning committee website.
Dynamic positioning vessel design philosophy guidelines. (2015). DNVGL-RP-E306,
DNV GL AS
Elo S. & Kyngäs H. (2008). The qualitative content analysis process. Journal of
Advanced Nursing 62(1), 107–115. doi: 10.1111/j.1365-2648.2007.04569.x Wiley
Online Library (23.01.2018)
Failure Modes of Variable Speed Thrusters. (2001). IMCA M 162, International Marine
Contractors Association website, withdrawn
Fires in Machinery Spaces on DP Vessels. (2016). IMCA M 119 Rev. 2, International
Marine Contractors Association website
Guidance on Failure Modes & Effects Analyses (FMEAs). (2016). IMCA M 166,
International Marine Contractors Association website
Guidance on satellite-based positioning systems for offshore applications. (2017).
IMCA M 242, International Marine Contractors Association website
Guide for Dynamic positioning systems. (2013). American Bureau of Shipping
94
Guide to DP Electrical Power and Control Systems. (2016). IMCA M 206 Rev. 1,
International Marine Contractors Association website
Guide to Dynamic Positioning of Vessels. (2000). Alstom DP manual, ALSTOM 2000
Guidelines for the Design and Operation of Dynamically Positioned Vessels. (2017).
IMCA M 103 Rev. 3, International Marine Contractors Association website
Guidelines for vessels with dynamic positioning systems. (1994). MSC/Circ.645,
International Maritime Organisation
Guidelines on Testing of DP Systems. (n.d). Marine Technology Society, Dynamic
positioning committee website.
Hall S. What Is Inductive Content Analysis? http://smallbusiness.chron.com/inductive-
content-analysis-24666.html (21.1.2018)
Hansen Einar Ole S. (2011). DP dependability. - Proceedings of the Dynamic
Positioning Conference, 11-12th October 2011, Houston, USA
Hauff K.S. (2014). Analysis of Loss of Position Incidents for Dynamically Operated
Vessels: master thesis. Norwegian University of Science and Technology: Trondheim.
Holvik J. (1998). Basics of Dynamic Positioning. - Proceedings of the Dynamic
Positioning Conference, 13-14th October 1998, Houston, USA
Ingve Sørfonn (2007). Power Management Control of Electrical Propulsion Systems. -
Proceedings of the Dynamic Positioning Conference, 9-10th October 2007, Houston,
USA
International Convention for the Safety of Life at Sea (SOLAS). (1974). International
Maritime organisation
International Guidelines for the Safe Operation of Dynamically Positioned Offshore
Supply Vessels. (2009). IMCA M 182, International Marine Contractors Association
website
Lauri S. & Kyngäs H. (2005). Developing Nursing Theories (Finnish: Hoitotieteen
Teorian Kehitta¨minen). Helsinki, Sanoma Pro Oy
Løkling Ø. (2007). How to Utilize Current Measurements to Improve Safety and
Optimize DP Control Systems. - Proceedings of the Dynamic Positioning Conference,
9-10th October 2007, Houston, USA
Mason A. (2009). “DP overview” Converteam DP maintenance course presentation.
Paul Zandbergen. What is Computer Hardware? - Components, Definition & Examples
https://study.com/academy/lesson/what-is-computer-hardware-components-definition-
examples.html (12.12.2017)
95
Petroleum and natural gas industries. (2013). Specific requirements for offshore
structures. Part 7. Station keeping systems for floating offshore structures and mobile
offshore units: International Organization for Standardization ISO19901-7, 2013.
Phillips D. F. (1998). Classic Single Point Failures of Redundant DP Systems. -
Proceedings of the Dynamic Positioning Conference, 13-14th October 1998, Houston,
USA
RadaScan Microwave Radar Sensor for Dynamic Positioning Operations. (2017).
IMCA M 209 Rev 1, International Marine Contractors Association website
Review of Marine Laser Positioning Systems. (2003). IMCA M 170, International
Marine Contractors Association website
Risk Analysis of Collision of Dynamically Positioned Support Vessels with Offshore
Installations. (2016). IMCA M 115, International Marine Contractors Association
website
Shatto H. 2011 – The year in which Dynamic Positioning celebrated its fiftieth
anniversary. http://dynamic-positioning.com/history-of-dp/ (13.11.2017)
Shuzhi Sam Ge, Choo Yoo Sang, and Bernard Voon Ee How. (2011). Dynamic
Positioning System for Marine Vessels. - The Impact of Control Technology T. Samad
and A.M. Annaswamy (eds) (2011). IEEE Control Systems Society, 2011, National
University of Singapore, Singapore, http://ieeecss.org/general/impact-control-
technology (15.02.2018)
Skogdalen J.E, Smogeli Ø. (2011). Looking Forward - Reliability of Safety Critical
Control Systems on Offshore Drilling Vessels. Deepwater Horizon Study Group work
paper, Centre for Catastrophic Risk Management
The Merchant Shipping (Accident Reporting and Investigation) Regulations. (Entry into
force 31.06. 2012). - UK Secretary of State for Transport.
http://www.legislation.gov.uk/uksi/2012/1743/made (24.03.2018)
Wärtsilä successfully tests remote control ship operating capability. - Wärtsilä
Corporation. https://www.wartsila.com/media/news/01-09-2017-wartsila-successfully-
tests-remote-control-ship-operating-capability (01.09.2017)
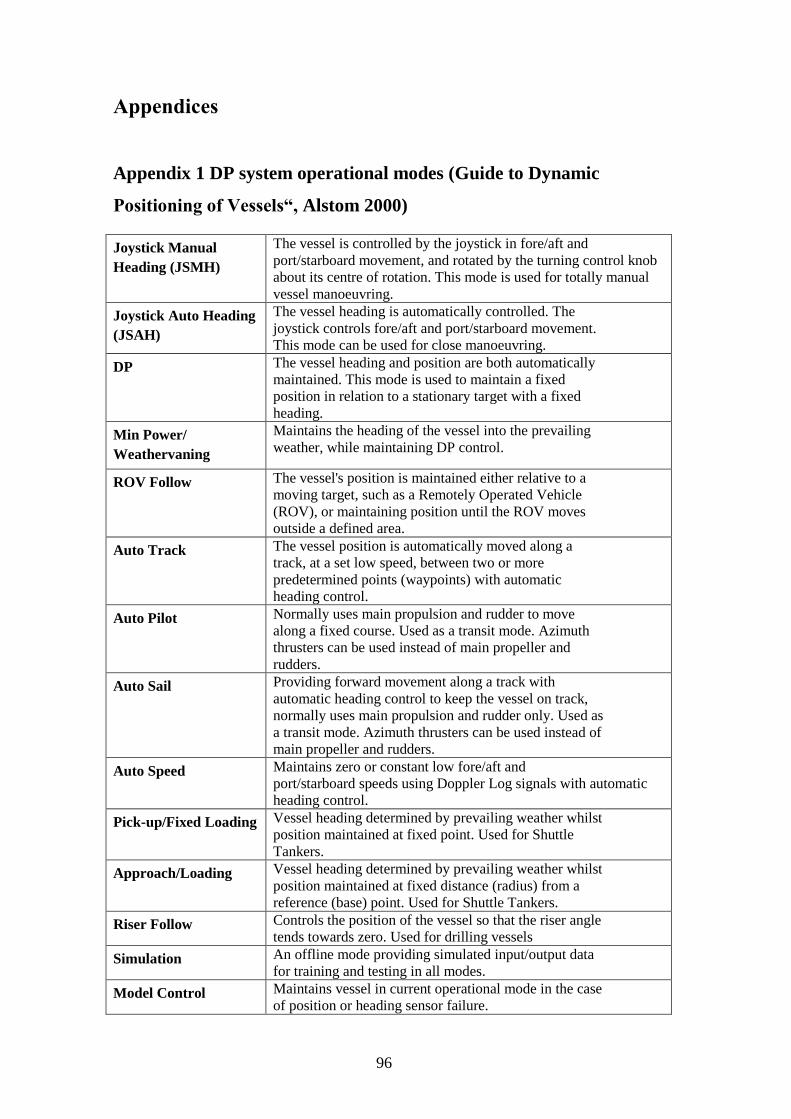
96
Appendices
Appendix 1 DP system operational modes (Guide to Dynamic
Positioning of Vessels“, Alstom 2000)
Joystick Manual
Heading (JSMH)
The vessel is controlled by the joystick in fore/aft and
port/starboard movement, and rotated by the turning control knob
about its centre of rotation. This mode is used for totally manual
vessel manoeuvring.
Joystick Auto Heading
(JSAH)
The vessel heading is automatically controlled. The
joystick controls fore/aft and port/starboard movement.
This mode can be used for close manoeuvring.
DP The vessel heading and position are both automatically
maintained. This mode is used to maintain a fixed
position in relation to a stationary target with a fixed
heading.
Min Power/
Weathervaning
Maintains the heading of the vessel into the prevailing
weather, while maintaining DP control.
ROV Follow The vessel's position is maintained either relative to a
moving target, such as a Remotely Operated Vehicle
(ROV), or maintaining position until the ROV moves
outside a defined area.
Auto Track The vessel position is automatically moved along a
track, at a set low speed, between two or more
predetermined points (waypoints) with automatic
heading control.
Auto Pilot Normally uses main propulsion and rudder to move
along a fixed course. Used as a transit mode. Azimuth
thrusters can be used instead of main propeller and
rudders.
Auto Sail Providing forward movement along a track with
automatic heading control to keep the vessel on track,
normally uses main propulsion and rudder only. Used as
a transit mode. Azimuth thrusters can be used instead of
main propeller and rudders.
Auto Speed Maintains zero or constant low fore/aft and
port/starboard speeds using Doppler Log signals with automatic
heading control.
Pick-up/Fixed Loading Vessel heading determined by prevailing weather whilst
position maintained at fixed point. Used for Shuttle
Tankers.
Approach/Loading Vessel heading determined by prevailing weather whilst
position maintained at fixed distance (radius) from a
reference (base) point. Used for Shuttle Tankers.
Riser Follow Controls the position of the vessel so that the riser angle
tends towards zero. Used for drilling vessels
Simulation An offline mode providing simulated input/output data
for training and testing in all modes.
Model Control Maintains vessel in current operational mode in the case
of position or heading sensor failure.
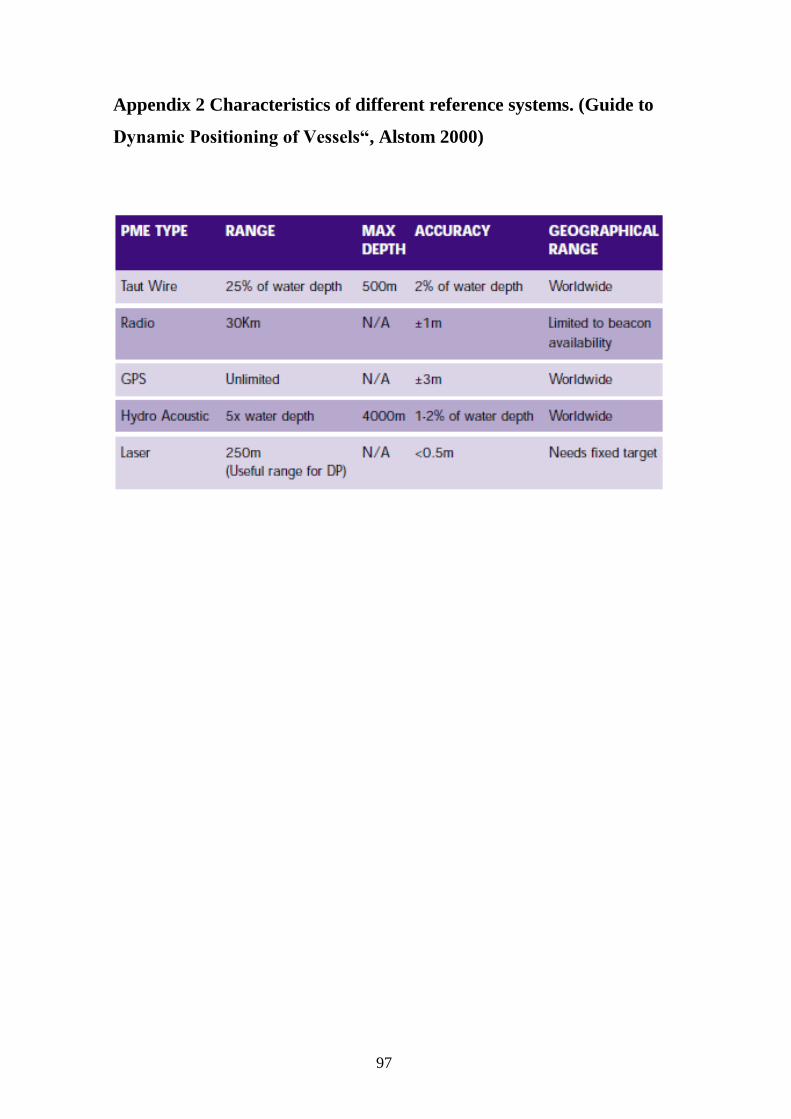
97
Appendix 2 Characteristics of different reference systems. (Guide to
Dynamic Positioning of Vessels“, Alstom 2000)
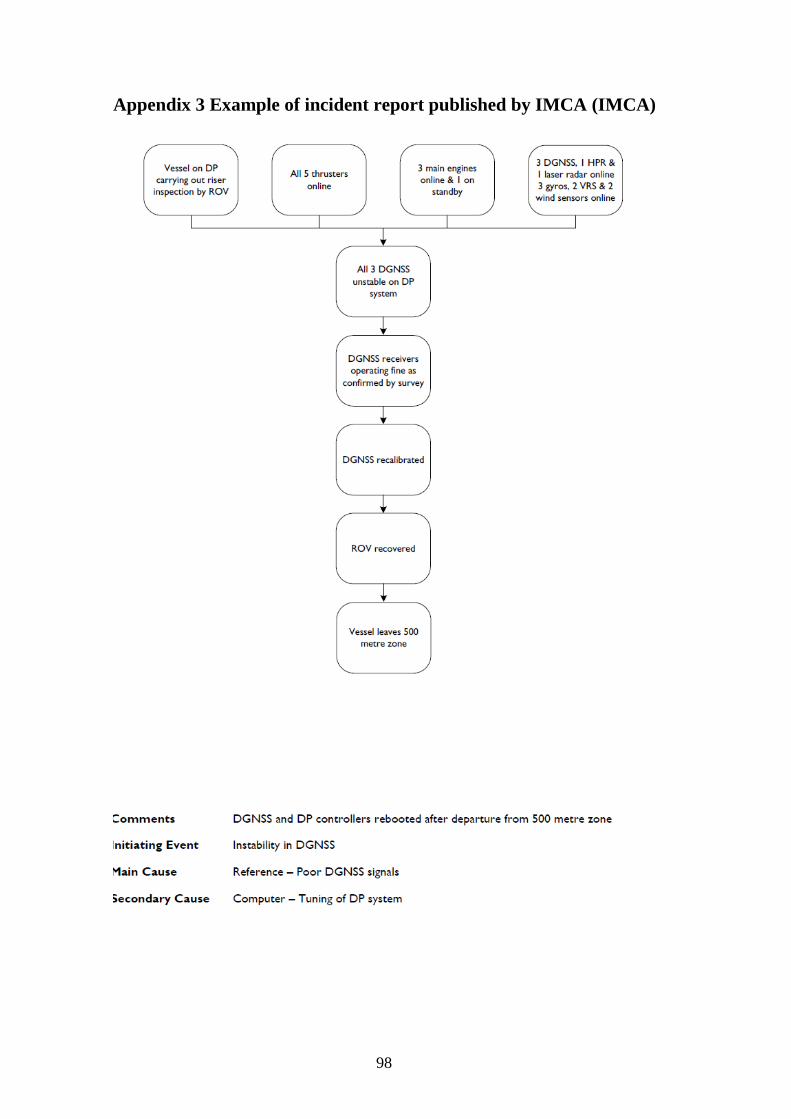
98
Appendix 3 Example of incident report published by IMCA (IMCA)
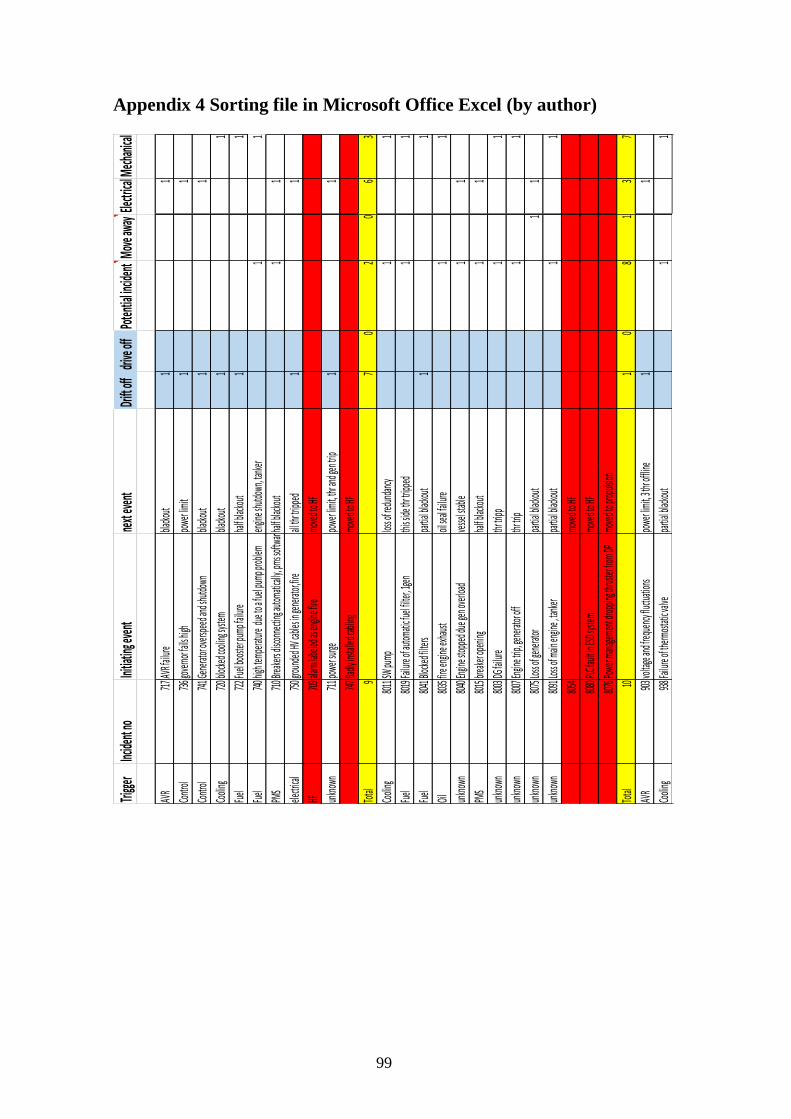
99
Appendix 4 Sorting file in Microsoft Office Excel (by author)
Trigge
rInc
ident
noIni
tiatin
g even
t ne
xt eve
ntDri
ft off
drive
offPo
tentia
l incid
entM
ove a
wayE
lectri
calMe
chanic
al
AVR
717AV
R failu
rebla
ckout
11
Contr
ol736
govern
or fai
ls high
powe
r limi
t1
1
Contr
ol741
Gene
rator
oversp
eed a
nd sh
utdow
nbla
ckout
11
Cooli
ng720
blocke
d coo
ling s
ystem
blacko
ut1
1
Fuel
722Fue
l boost
er pu
mp fa
ilure
half b
lackou
t1
1
Fuel
740hig
h tem
perat
ure du
e to a
fuel p
ump p
roblem
engin
e shu
tdown
, tanke
r1
1
PMS
710Bre
akers d
iscon
nectin
g auto
matica
lly, pm
s softw
arehal
f blac
kout
11
electr
ical
750gro
unde
d HV c
ables
in gen
erator
,fire
all thr
tripp
ed1
1
HF709
alarm
labele
d as e
ngine
fire
moved
to HF
unkno
wn711
powe
r surge
powe
r limi
t, thr
and ge
n trip
11
747Ba
dly ins
talled
cabli
ngmo
ved to
HF
Total
97
02
06
3
Cooli
ng801
1SW
pump
loss o
f redu
ndanc
y1
1
Fuel
8019F
ailure
of aut
omati
c fuel f
ilter, 1
genthi
s side
thr tr
ipped
11
Fuel
8041B
locked
filter
s par
tial bl
ackou
t1
1
Oil803
5fire
engin
e exha
ustoil
seal f
ailure
11
unkno
wn
8040E
ngine
stopp
ed du
e gen
overl
oadves
sel sta
ble
11
PMS
8015b
reaker
open
ing
half b
lackou
t1
1
unkno
wn800
3DG f
ailure
thr tri
pp1
1
unkno
wn800
7Engi
ne tri
p, gen
erator
off
thr tri
p1
1
unkno
wn807
5Loss
of ge
nerat
orpar
tial bl
ackou
t1
1
unkno
wn809
1Loss
of m
ain en
gine ,
tanker
partia
l black
out
11
8054
moved
to HF
8080P
LC fau
lt in E
SD sy
stem
moved
to HF
8076P
ower
manag
emen
t drop
ping t
hruste
r from
DPmo
ved to
prop
ulsion
Total
101
08
13
7
AVR
903vol
tage a
nd fre
quen
cy flu
ctuati
ons
powe
r limi
t, 3 th
r offli
ne1
1
Cooli
ng938
Failur
e of th
ermost
atic v
alve
partia
l black
out
11
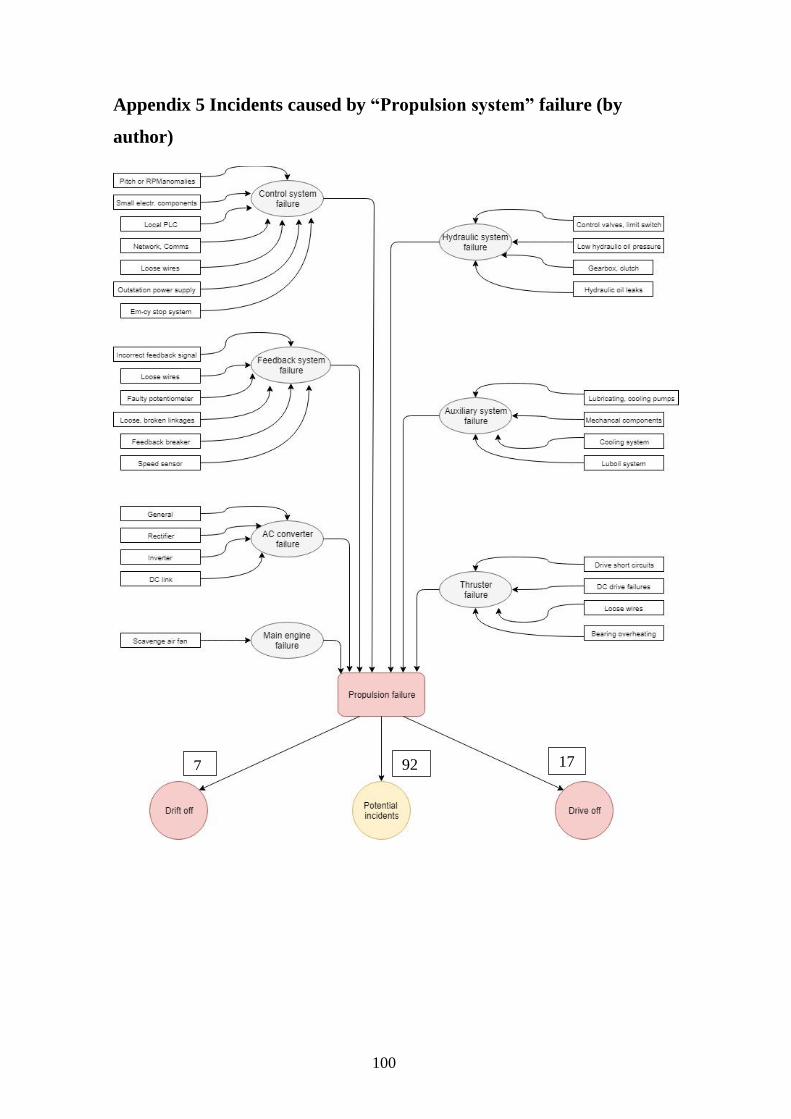
100
Appendix 5 Incidents caused by “Propulsion system” failure (by
author)
7 92 17
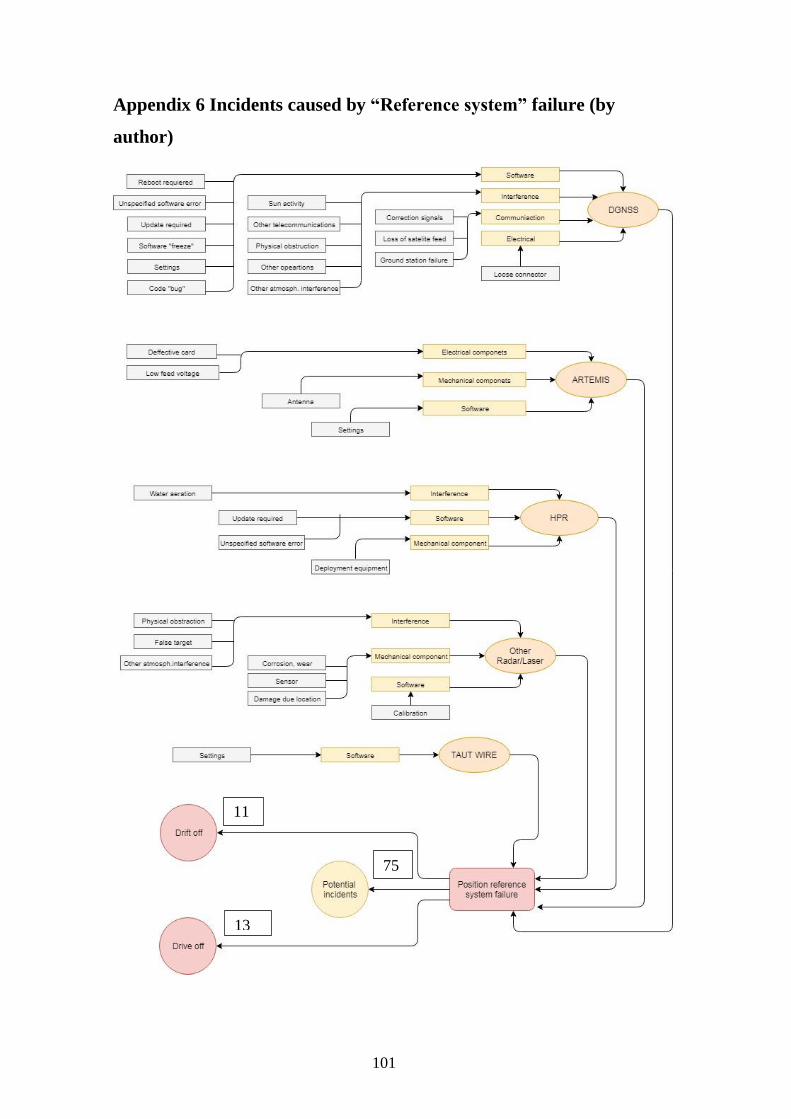
101
Appendix 6 Incidents caused by “Reference system” failure (by
author)
11
13
75
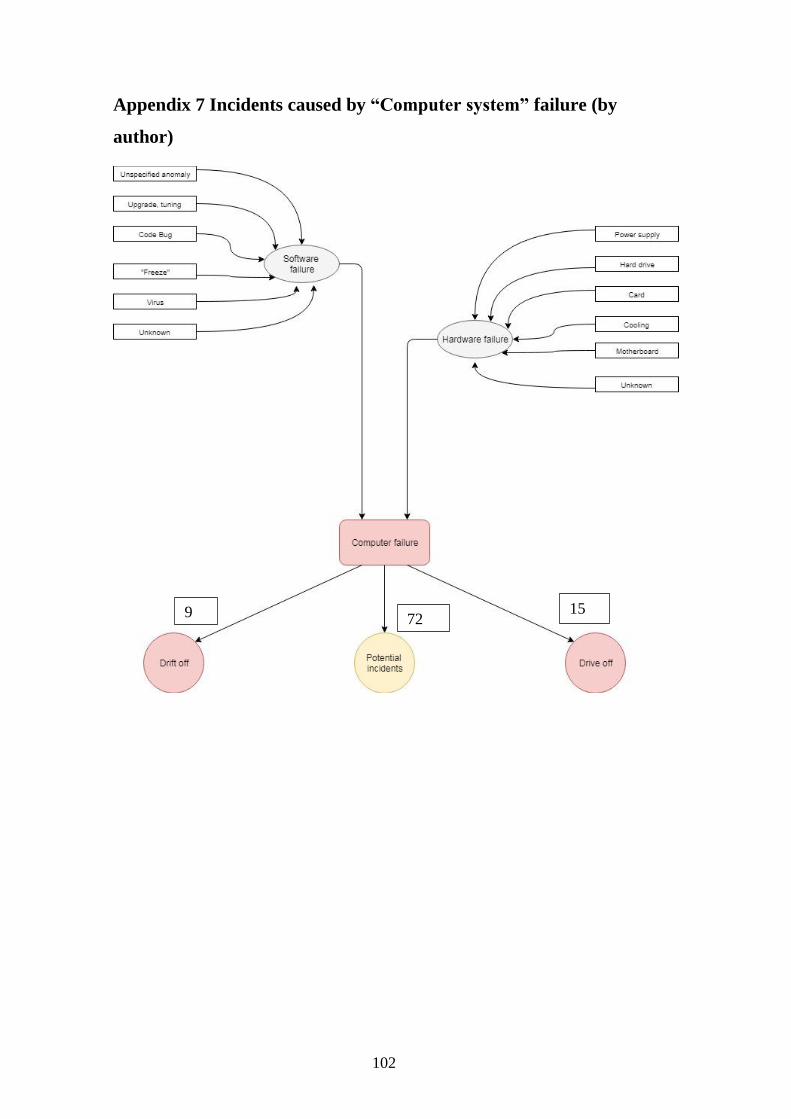
102
Appendix 7 Incidents caused by “Computer system” failure (by
author)
9 15 72
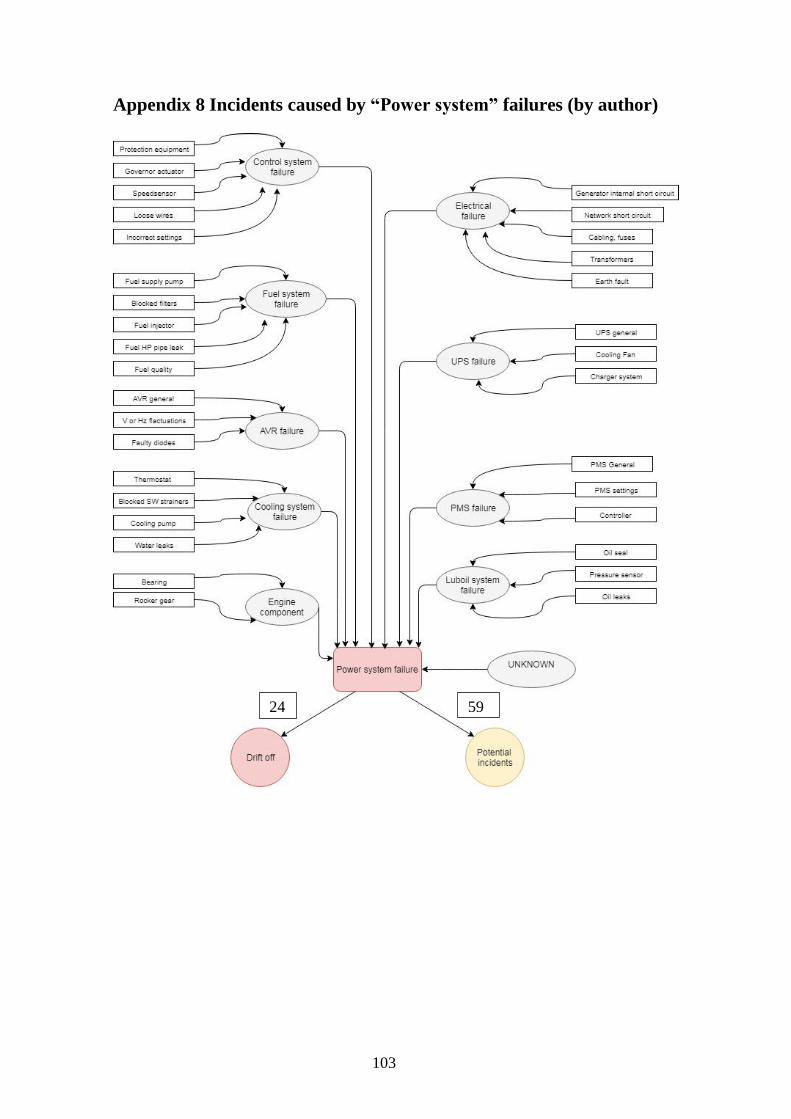
103
Appendix 8 Incidents caused by “Power system” failures (by author)
24 59