CAUSES OF DEATH AUSTRALIA - Australian Bureau of ... · 3 Leading Causes of Death ... Further...
96
84 2007 Revisions 3 ...................................... 82 Cause of Death - Revisions Process 2 ......................... 75 2008 COD Collection - Process Improvements 1 ................... TECHNICAL NOTES 72 Tabulation of selected causes of death 2 ........................ 70 Data used in calculating rates 1 ............................. APPENDICES 92 Glossary .............................................. 55 Explanatory Notes ........................................ ADDITIONAL INFORMATION 52 Deaths of Aboriginal and Torres Strait Islander persons 7 ............. 47 Suicides 6 ........................................... 43 Multiple Causes of Death 5 ................................ 15 Underlying Cause of Death by ICD-10 Chapter 4 ................... 11 Leading Causes of Death 3 ................................ 6 National Health Priority Areas (NHPAs) 2 ......................... 3 Introduction 1 .......................................... DETAILED INFORMATION 2 Notes ................................................ page CONTENTS E M B A R G O : 1 1 . 3 0 A M ( C A N B E R R A T I M E ) W E D 3 1 M A R 2 0 1 0 CAUSES OF DEATH AUSTRALIA 3303.0 2008 For further information about these and related statistics, contact the National Information and Referral Service on 1300 135 070. INQUIRIES www.abs.gov.au
Transcript of CAUSES OF DEATH AUSTRALIA - Australian Bureau of ... · 3 Leading Causes of Death ... Further...

842007 Revisions3 . . . . . . . . . . . . . . . . . . . . . . . . . . . . . . . . . . . . . .82Cause of Death - Revisions Process2 . . . . . . . . . . . . . . . . . . . . . . . . .752008 COD Collection - Process Improvements1 . . . . . . . . . . . . . . . . . . .
T E C H N I C A L N O T E S
72Tabulation of selected causes of death2 . . . . . . . . . . . . . . . . . . . . . . . .70Data used in calculating rates1 . . . . . . . . . . . . . . . . . . . . . . . . . . . . .
A P P E N D I C E S
92Glossary . . . . . . . . . . . . . . . . . . . . . . . . . . . . . . . . . . . . . . . . . . . . . .55Explanatory Notes . . . . . . . . . . . . . . . . . . . . . . . . . . . . . . . . . . . . . . . .
A D D I T I O N A L I N F O R M A T I O N
52Deaths of Aboriginal and Torres Strait Islander persons7 . . . . . . . . . . . . .47Suicides6 . . . . . . . . . . . . . . . . . . . . . . . . . . . . . . . . . . . . . . . . . . .43Multiple Causes of Death5 . . . . . . . . . . . . . . . . . . . . . . . . . . . . . . . .15Underlying Cause of Death by ICD-10 Chapter4 . . . . . . . . . . . . . . . . . . .11Leading Causes of Death3 . . . . . . . . . . . . . . . . . . . . . . . . . . . . . . . .
6National Health Priority Areas (NHPAs)2 . . . . . . . . . . . . . . . . . . . . . . . . .3Introduction1 . . . . . . . . . . . . . . . . . . . . . . . . . . . . . . . . . . . . . . . . . .
D E T A I L E D I N F O R M A T I O N
2Notes . . . . . . . . . . . . . . . . . . . . . . . . . . . . . . . . . . . . . . . . . . . . . . . .page
C O N T E N T S
E M B A R G O : 1 1 . 3 0 A M ( C A N B E R R A T I M E ) W E D 3 1 M A R 2 0 1 0
CAUSES OF DEATH A U S T R A L I A
3303.02 0 0 8
For further informationabout these and relatedstatistics, contact theNational Information andReferral Service on1300 135 070.
I N Q U I R I E S
w w w . a b s . g o v . a u

B r i a n P i n k
Au s t r a l i a n S t a t i s t i c i a n
All coroner certified deaths registered after 1 January 2007 are now subject to a revisions
process. The revisions process enables the use of additional information relating to
coroner certified deaths either 12 or 24 months after initial processing. This increases
the specificity of the assigned ICD-10 codes over time. See Technical Note 2: Causes of
Death - Revisions Process for further information.
See also Technical Note 3: 2007 Revisions for further information on the impact of the
revisions process on 2007 data. 2007 (revised) data are contained in the data cubes
associated with this publication.
CA U S E S OF DE A T H
RE V I S I O N S
The series of spreadsheets associated with this publication has been expanded from
previous years. Additional data is now available for all states and territories and Australia,
for:
! 2007 (revised) underlying cause - standardised death rates and years of potential life
lost
! 2007 (revised) selected causes by age at death, numbers and rates
Year of occurrence data will not be included in this publication. It will be released in mid
2010.
Two processing improvements have been introduced to the Causes of Death collection
for the release of 2008 (preliminary) data. These improvements relate to the way the ABS
codes coroner certified deaths and have had the effect of significantly improving the
quality of cause of death codes assigned to coroner certified cases. All 2008 data in this
publication have been positively impacted by these improvements. See Technical Note 1:
2008 COD Collection - Process Improvements for further information.
CH A N G E S IN TH I S I S S U E
This publication presents statistics on the number of deaths for reference year by state or
territory of Australia, sex, selected age groups, and cause of death classified to the World
Health Organisation's International Classification of Diseases (ICD). Version 10 of the
ICD has been introduced from 1999.
Three technical notes are presented in this publication:
! 2008 COD Collection - Process Improvements
! Causes of Death - Revisions Process
! 2007 Revisions
Users should read these technical notes in order to make themselves aware of changes
in ABS processes which have had an impact on 2008 and 2007 data.
I N TH I S I S S U E
2 A B S • CA U S E S OF D E A T H • 3 3 0 3 . 0 • 2 0 0 8
N O T E S
CHAP T E R 1 IN T R O D U C T I O N . . . . . . . . . . . . . . . . . . . . . . . . . . . . . . . . . . . . . . .
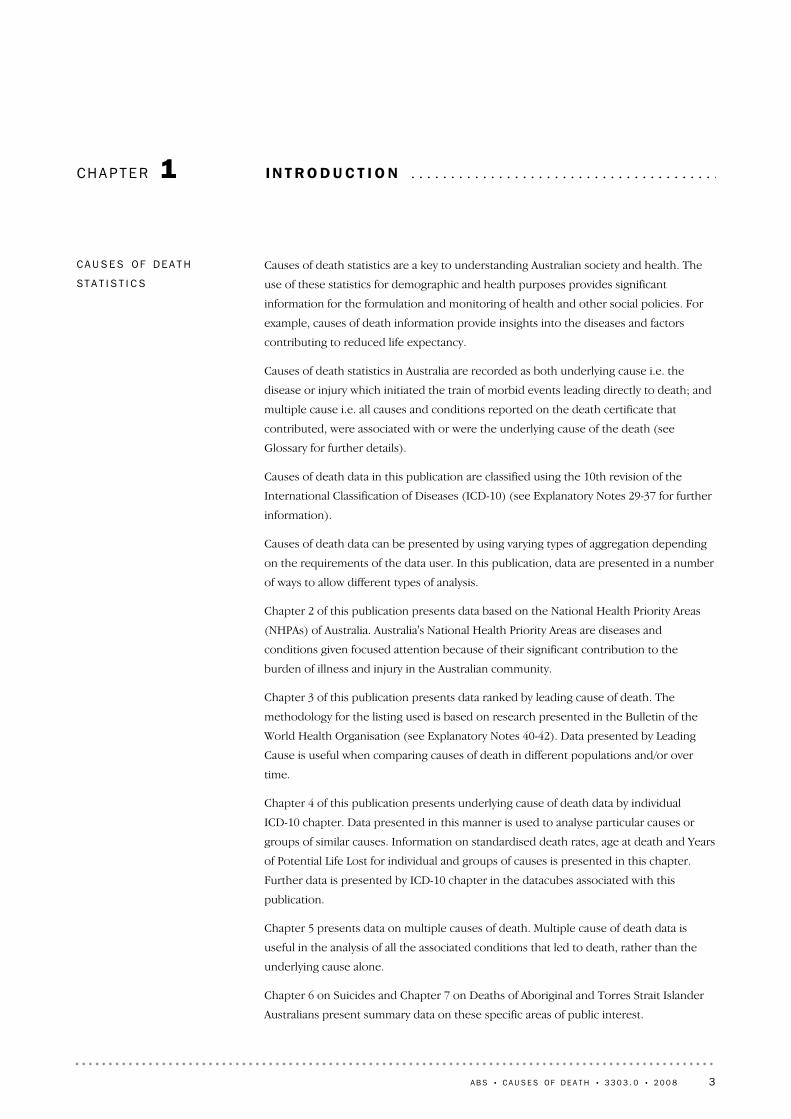
Causes of death statistics are a key to understanding Australian society and health. The
use of these statistics for demographic and health purposes provides significant
information for the formulation and monitoring of health and other social policies. For
example, causes of death information provide insights into the diseases and factors
contributing to reduced life expectancy.
Causes of death statistics in Australia are recorded as both underlying cause i.e. the
disease or injury which initiated the train of morbid events leading directly to death; and
multiple cause i.e. all causes and conditions reported on the death certificate that
contributed, were associated with or were the underlying cause of the death (see
Glossary for further details).
Causes of death data in this publication are classified using the 10th revision of the
International Classification of Diseases (ICD-10) (see Explanatory Notes 29-37 for further
information).
Causes of death data can be presented by using varying types of aggregation depending
on the requirements of the data user. In this publication, data are presented in a number
of ways to allow different types of analysis.
Chapter 2 of this publication presents data based on the National Health Priority Areas
(NHPAs) of Australia. Australia's National Health Priority Areas are diseases and
conditions given focused attention because of their significant contribution to the
burden of illness and injury in the Australian community.
Chapter 3 of this publication presents data ranked by leading cause of death. The
methodology for the listing used is based on research presented in the Bulletin of the
World Health Organisation (see Explanatory Notes 40-42). Data presented by Leading
Cause is useful when comparing causes of death in different populations and/or over
time.
Chapter 4 of this publication presents underlying cause of death data by individual
ICD-10 chapter. Data presented in this manner is used to analyse particular causes or
groups of similar causes. Information on standardised death rates, age at death and Years
of Potential Life Lost for individual and groups of causes is presented in this chapter.
Further data is presented by ICD-10 chapter in the datacubes associated with this
publication.
Chapter 5 presents data on multiple causes of death. Multiple cause of death data is
useful in the analysis of all the associated conditions that led to death, rather than the
underlying cause alone.
Chapter 6 on Suicides and Chapter 7 on Deaths of Aboriginal and Torres Strait Islander
Australians present summary data on these specific areas of public interest.
CA U S E S OF DE A T H
ST A T I S T I C S
A B S • CA U S E S OF D E A T H • 3 3 0 3 . 0 • 2 0 0 8 3
The following table presents summary causes of death data for each major chapter of the
ICD-10. Further information on those causes at the 3-digit level where 10, 20, or 50 or
more deaths were attributed to the cause in 2008 is presented in Chapter 4 of this
publication titled Underlying Cause of Death by ICD-10.
Under ly ing Cause of Death
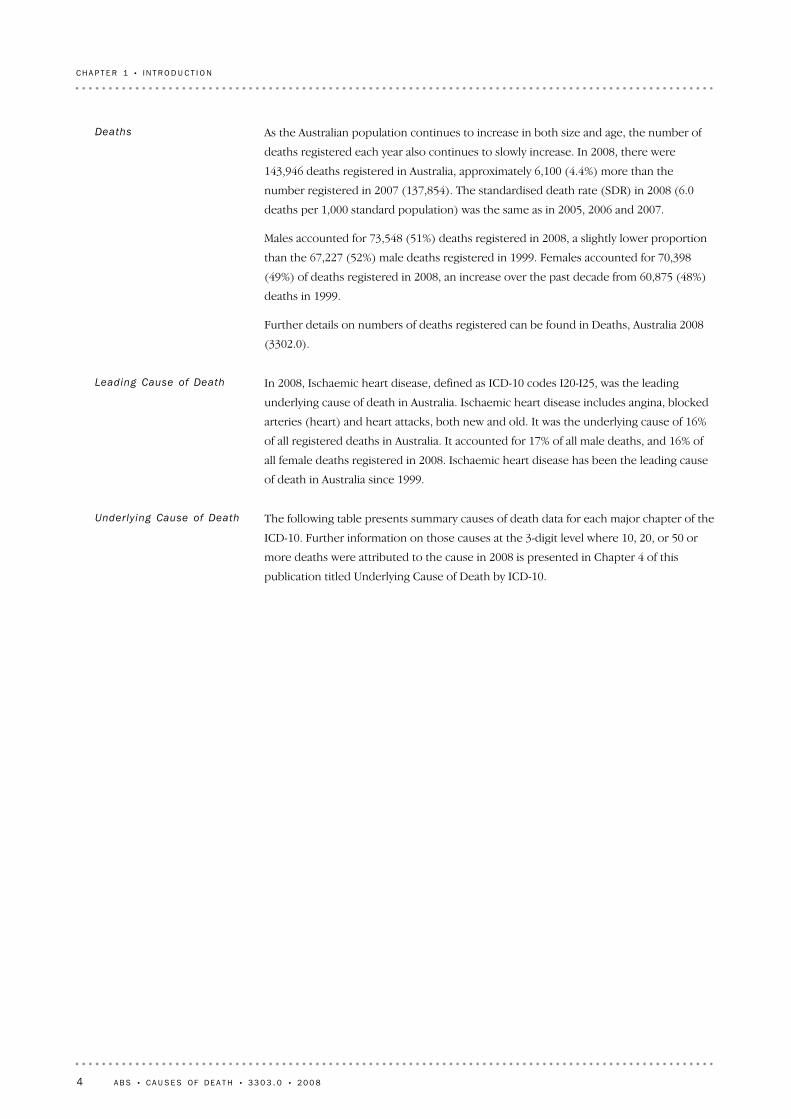
In 2008, Ischaemic heart disease, defined as ICD-10 codes I20-I25, was the leading
underlying cause of death in Australia. Ischaemic heart disease includes angina, blocked
arteries (heart) and heart attacks, both new and old. It was the underlying cause of 16%
of all registered deaths in Australia. It accounted for 17% of all male deaths, and 16% of
all female deaths registered in 2008. Ischaemic heart disease has been the leading cause
of death in Australia since 1999.
Leading Cause of Death
As the Australian population continues to increase in both size and age, the number of
deaths registered each year also continues to slowly increase. In 2008, there were
143,946 deaths registered in Australia, approximately 6,100 (4.4%) more than the
number registered in 2007 (137,854). The standardised death rate (SDR) in 2008 (6.0
deaths per 1,000 standard population) was the same as in 2005, 2006 and 2007.
Males accounted for 73,548 (51%) deaths registered in 2008, a slightly lower proportion
than the 67,227 (52%) male deaths registered in 1999. Females accounted for 70,398
(49%) of deaths registered in 2008, an increase over the past decade from 60,875 (48%)
deaths in 1999.
Further details on numbers of deaths registered can be found in Deaths, Australia 2008
(3302.0).
Deaths
4 A B S • CA U S E S OF D E A T H • 3 3 0 3 . 0 • 2 0 0 8
CH A P T E R 1 • I N T R O D U C T I O N

For the 143,946 deaths registered in Australia in 2008, there were 466,538 causes
reported giving a mean of 3.2 causes per death. The mean number of causes reported
per death varies with age, sex and underlying cause of death. In 18% of all deaths, only
one cause was reported, while 39% of deaths were reported with three or more causes.
For further detail on multiple cause, see the Multiple Cause of Death section of this
publication (Chapter 5).
Mult iple Cause of Death
(a) 2008 data have been subject to process improvements which have increased the quality of these data. See Technical Note 1: 2008 COD Collection -Process Improvements for further information.
(b) Causes of death data for 2008 are preliminary and subject to a revisions process. See Technical Note 2: Causes of Death - Revisions Process.(c) All causes include cause chapters presented here, plus Diseases of the eye and adnexia (H00-H59), Diseases of the ear and mastoid process
(H60-H95) and Pregnancy, childbirth, and the puerperium (O00-O99).
602.580.9100.0143 946All Causes(c)
39.252.36.18 804External causes of morbidity and mortality (V01-Y98)5.463.90.91 243
Symptoms, signs and abnormal clinical and laboratory findings, not elsewhereclassified (R00-R99)
2.81.00.4609Congenital malformations, deformations and chromosomal abnormalities (Q00-Q99)2.70.50.4595Certain conditions originating in the perinatal period (P00-P96)
13.585.62.33 319Diseases of the genitourinary system (N00-N99)4.884.30.81 179Diseases of the musculoskeletal system and connective tissue (M00-M99)1.685.50.3401Diseases of the skin and subcutaneous tissue (L00-L99)
20.780.33.44 939Diseases of the digestive system (K00-K93)46.882.57.811 260Diseases of the respiratory system (J00-J99)
197.684.633.748 456Diseases of the circulatory system (I00-I99)24.882.34.15 961Diseases of the nervous system (G00-G99)25.587.14.56 406Mental and behavioural disorders (F00-F99)24.781.14.15 900Endocrine, nutritional and metabolic diseases (E00-E90)
2.180.70.3503Diseases of the blood and blood-forming organs and certain disorders involving the
immune mechanism (D50-D89)
182.175.429.542 418Neoplasms (C00-D48)8.280.21.31 935Certain infectious and parasitic diseases (A00-B99)
rateyrs.%no.
Standardised
Death Rate
Median
Age
Proportion of
total deathsNumber
Cause of Dea th and ICD Code
DEATHS, by ICD10 CHAPTER LEVEL —2008(a) (b )1.1
A B S • CA U S E S OF D E A T H • 3 3 0 3 . 0 • 2 0 0 8 5
CH A P T E R 1 • I N T R O D U C T I O N

CHAP T E R 2 NA T I O N A L HE A L T H PR I O R I T Y AR E A S (N H P A S ) . . . .
Asthma is a disease which causes narrowing of the airways into the lung causing
breathing difficulties. In 2008, Asthma (J45-J46) was the underlying cause for 449
registered deaths, or 0.3% of all deaths. Asthma was identified as either an underlying
cause or associated cause of death for 1,472 deaths registered in 2008.
AS T H M A ( J 4 5 - J 4 6 )
Arthritis and musculoskeletal diseases (M00-M99) are conditions in which there is
inflammation of the joints that can cause pain, stiffness, disability and deformity. It also
includes other joint problems and disorders of the bones, muscles and their
attachments. Arthritis and musculoskeletal diseases were the underlying cause for 1,179
registered deaths in Australia in 2008. Arthritis and musculoskeletal diseases were
identified as either an underlying cause or associated cause of death for 6,964 deaths
registered in 2008.
The standardised death rate for Arthritis and musculoskeletal diseases was 4.8 per
100,000 population in 2008, the same as in 1999. The standardised death rate for males
in 2008 was 4.2 per 100,000, and 5.2 per 100,000 for females.
Of all deaths due to Arthritis and musculoskeletal diseases in 2008, 776 or 66% were
females, predominantly in the age group 75 to 94 years. Median age at death for deaths
due to these diseases was 81.2 years for males, 85.4 years for females and 84.3 years
overall. Potential life lost due to deaths from these diseases was 1,884 years for males and
2,452 years for females (see Explanatory Notes 43-45 for further information on Years of
Potential Life Lost).
Arthritis (M00-M25) was the underlying cause of 426 deaths, which accounted for 36% of
all deaths due to these diseases, with the most common age group for both males and
females being 80-89 years.
AR T H R I T I S AN D
MU S C U L O S K E L E T A L
D I S E A S E S (M 0 0 - M 9 9 )
Australia's National Health Priority Areas are diseases and conditions given focused
attention because of their significant contribution to the burden of illness and injury in
the Australian community.
Data for 2008 have been positively impacted by process improvements. See Technical
Note 1: 2008 COD Collection - Process Improvements for further information. These data
are also subject to a revisions process. See Technical Note 2: Causes of Death - Revisions
Process for further information.
The eight priority areas are Arthritis and musculoskeletal conditions, Asthma, Cancer
control, Cardiovascular health, Diabetes mellitus, Injury prevention and control, Mental
health and Obesity. In 2008, deaths due to the eight National Health Priority Areas
accounted for 78% of all underlying causes of death and were either associated with or
the underlying cause of 91% of deaths.
OV E R V I E W
6 A B S • CA U S E S OF D E A T H • 3 3 0 3 . 0 • 2 0 0 8
Cardiovascular health relates to the health of the heart and blood vessels. The major
underlying causes of death relating to cardiovascular health are coronary heart disease,
stroke, heart failure and peripheral vascular disease. Cardiovascular disease (I00-I99) was
the underlying cause for 48,456 deaths registered in Australia during 2008, which
represented 34% of all deaths. These diseases contributed to a total of 83,085 deaths as
either an underlying or associated cause of death.
CA R D I O V A S C U L A R
D I S E A S E ( I 0 0 - I 9 9 )
Cancer refers to a diverse group of diseases in which abnormal cells develop and divide
uncontrollably and have the ability to infiltrate and destroy normal body tissue. Cancer
can spread throughout the body causing further damage. In 2008, Cancer (C00-D48) was
the underlying cause of death for 42,418 registered deaths in Australia. This accounted
for 29% of all registered deaths. Cancer contributed to a total of 48,784 deaths as either
an underlying or associated cause of death.
The standardised death rate for Cancer was 182.1 per 100,000 population in 2008, a
decrease from 195.8 per 100,000 population in 1999. The standardised death rate for
males in 2008 was 232.1 per 100,000, and 144.3 per 100,000 for females.
More males than females died of cancer with 129 male deaths per 100 female deaths for
the 2008 reference year. The median age of persons dying from cancer in 2008 was 75.1
years for males, 75.9 years for females and 75.4 years for all cancer deaths. Potential life
lost due to cancer deaths was 183,259 years for males and 150,460 years for females.
Prostate cancer (C61) was the underlying cause of 3,031 deaths registered in 2008, 4.1%
of all male deaths registered. The median age at death for Prostate cancer was 81.0 years.
This is close to the median age for all male deaths (77.9 years). Potential life lost from
deaths due to Prostate cancer was 9,178 years. Breast cancer (C50) was the underlying
cause of 2,774 female deaths registered in 2008, 3.9% of all female deaths registered. The
median age at death for Breast cancer was 68.1 years for females, which is 15.8 years
lower than the median age for all female deaths (83.9 years). Potential life lost from
deaths due to Breast cancer was 33,928 years for females.
Seven of the top 20 leading underlying causes of death in 2008 were attributable to some
form of malignant cancer. These seven causes accounted for 25,922 deaths or 18% of all
registered deaths in 2008. See Chapter 3 Leading Causes of Death for further
information.
CA N C E R (C 0 0 - D 4 8 )
The standardised death rate for Asthma was 1.9 per 100,000 population in 2008, a
decrease from 2.3 per 100,000 population in 1999. The standardised death rate for males
in 2008 was 1.7 per 100,000 and 2.0 per 100,000 for females.
Median age at death for deaths due to Asthma was 74.3 years for males, 82.4 years for
females and 80.3 years overall. The potential life lost due to asthma deaths was 2,664
years for males and 2,180 years for females.
In 98% of cases where Asthma was the underlying cause of death, it was not specified
whether this was attributed to allergic or non allergic asthma. Asthma was the underlying
cause of death for almost twice as many females as males in 2008 with 59 male deaths for
every 100 female deaths.
AS T H M A ( J 4 5 - J 4 6 )
c o n t i n u e d
A B S • CA U S E S OF D E A T H • 3 3 0 3 . 0 • 2 0 0 8 7
CH A P T E R 2 • N A T I O N A L HE A L T H P R I O R I T Y A R E A S ( N H P A S )
Injuries due to External causes of death (V01-Y98), relate to cases where the underlying
cause of death is determined to be one of a group of causes external to the body (for
example Suicide, transport accidents, falls, poisoning etc.).
In 2008, Injuries accounted for 8,804 deaths, or 6.1% of all registered deaths. The
standardised death rate for Injuries was 39.2 per 100,000 of population in 2008, a
decrease from 44.6 per 100,000 population in 1999. The standardised death rate for
males in 2008 was 56.1 per 100,000 and 23.3 per 100,000 for females.
Compared to women, more men at younger ages have died from External causes over
time. Consistent with previous years, approximately two thirds of the total number of
deaths resulting from External causes were males (5,819, 65%). Median age at death for
deaths due to Injuries registered in 2008 was 46.8 years for males, 73.8 years for females
and 52.3 years overall. The potential life lost through deaths due to Injuries was 172,693
years for males and 54,265 years for females.
I N J U R I E S ( V 0 1 - Y 9 8 )
Diabetes is a disorder caused by the inability of the body to control the amount of sugar
in the blood. If left untreated, diabetes can severely damage organs in the body. Diabetes
(E10-E14) was the underlying cause for 4,191 (2.9%) deaths registered in Australia in
2008. Diabetes contributed to 14,461 (10%) deaths as either an underlying or associated
cause of death.
The standardised death rate for Diabetes was 17.6 per 100,000 population in 2008, an
increase from 16.3 per 100,000 population in 1999. The standardised death rate for males
in 2008 was 21.4 per 100,000, and 14.4 per 100,000 for females.
Median age at death due to Diabetes was 78.9 years for males, 83.5 years for females and
81.2 years overall. Potential life lost through death due to Diabetes was 11,736 years for
males and 6,452 years for females.
Type II diabetes (E11, Non-insulin dependent diabetes) accounted for 1,853 deaths, or
44% of all diabetes deaths. This particular type of diabetes was predominant in the 70-94
years age group. Of all deaths due to Non-insulin dependent diabetes, 79% of males and
82% of females were aged 70-94 years.
D I A B E T E S ( E 1 0 - E 1 4 )
Five of the top 20 leading underlying causes of death in 2008 were attributable to some
form of Cardiovascular disease. These five causes accounted for 42,369 deaths, or 29% of
all registered deaths in 2008. See Chapter 3 Leading Causes of Death for further
information.
The standardised death rate for Cardiovascular disease was 197.6 per 100,000 population
in 2008, a decrease from 286.6 per 100,000 population in 1999. The standardised death
rate for males in 2008 was 234.8 per 100,000, and 166.7 per 100,000 for females.
Of those deaths due to Cardiovascular disease, 47% were male and 53% were female.
Females dying from these diseases had a higher median age at death, 87.0 years
compared with 81.3 years for males. The potential life lost due to Cardiovascular disease
is much higher for males than females; 116,912 years for males compared with 49,320 for
females.
CA R D I O V A S C U L A R
D I S E A S E ( I 0 0 - I 9 9 )
c o n t i n u e d
8 A B S • CA U S E S OF D E A T H • 3 3 0 3 . 0 • 2 0 0 8
CH A P T E R 2 • N A T I O N A L HE A L T H P R I O R I T Y A R E A S ( N H P A S )

When the energy consumed from food and drink is greater than the energy used, fat is
deposited on the body, which over time can lead to obesity. Obesity increases the risk of
many other chronic and potentially lethal diseases. There were 182 deaths registered in
2008 where Obesity (E66) was identified as the underlying cause of death. In total, there
were 942 deaths where Obesity was mentioned as either underlying cause, or an
associated cause of death.
In 2008, the standardised death rate for obesity was 0.8 per 100,000 of population, an
increase from 0.7 per 100,000 population in 1999. The standardised death rate for males
in 2008 was 0.7 per 100,000 males and 0.9 per 100,000 for females.
OB E S I T Y ( E 6 6 )
Deaths due to Mental health disorders relate to behaviours and conditions which
interfere with social functioning and capacity to negotiate daily life. Deaths due to Mental
health disorders (F00-F99) were identified as the underlying cause of 6,406 registered
deaths, representing 4.5% of all registered deaths in Australia during 2008. In total,
22,158 deaths were due to, or associated with, Mental health disorders.
The prevalence of Mental health disorders as an underlying cause has increased
significantly over the last ten years. In 2008, the standardised death rate for Mental health
disorders was 25.5 per 100,000 of population, an increase from 15.7 per 100,000
population in 1999. The standardised death rates for males in 2008 was 25.3 per 100,000,
and 24.8 per 100,000 for females.
In 2008, more than half the deaths due to Mental health disorders were females (4,035 or
63%). The median age at death was higher for females at 88.6 years, compared with 84.2
years for males. Consistent with this difference, the potential life lost as a result of deaths
due to Mental health disorders was 8,209 years for males and 4,250 years for females.
Dementia (F01-F03) accounted for 89% of deaths due to Mental health disorders in 2008.
There were 5,688 deaths registered in 2008 for which Dementia was the underlying
cause. Of these, 1,916 were males, and 3,772 females, giving a sex ratio of 50.8 males per
100 female deaths. The median age at death due to Dementia was 85.5 years for males,
89.0 years for females, and 87.8 years overall. For further information regarding
Dementia, see Explanatory Note 65.
ME N T A L HE A L T H
D I S O R D E R S ( F 0 0 - F 9 9 )
Transport accidents (V01-V99, Y85) accounted for 1,402 deaths, 16% of all deaths due to
Injuries. Of these, 1,036 (74%) were males and the remaining 366 (26%) were females.
Transport accidents presented a younger profile in comparison to all deaths due to
Injuries, with a median age at death of 36.3 years for males, 45.6 years for females and
38.0 years overall. Potential life lost from deaths due to Transport accidents was 40,615
years for males and 12,015 years for females.
There were 2,191 deaths due to Intentional self-harm [Suicide] (X60-X84, Y87.0) in 2008,
which accounted for 25% of all deaths due to Injuries. Of these deaths, 1,710 (78%) were
of males and 481 (22%) were of females. The median age at death for Suicide was 42.5
years for males, 43.5 years for females and 42.7 years overall. Potential life lost from
deaths due to Suicide was 59,086 years for males and 16,665 years for females.
Care should be taken in interpreting numbers of Suicide deaths. For further information,
see Explanatory Notes 72-75.
I N J U R I E S ( V 0 1 - Y 9 8 )
c o n t i n u e d
A B S • CA U S E S OF D E A T H • 3 3 0 3 . 0 • 2 0 0 8 9
CH A P T E R 2 • N A T I O N A L HE A L T H P R I O R I T Y A R E A S ( N H P A S )

Of those deaths where Obesity was the underlying cause, 79 (43%) were male, and 103
(57%) were female. The median age at death due to Obesity for males was 56.5 years and
64.6 years for females. Median age at death was 62.3 years for all deaths due to Obesity.
Potential life lost from deaths due to obesity was 1,566 years for males and 1,575 years
for females.
OB E S I T Y ( E 6 6 )
c o n t i n u e d
10 A B S • CA U S E S OF D E A T H • 3 3 0 3 . 0 • 2 0 0 8
CH A P T E R 2 • N A T I O N A L HE A L T H P R I O R I T Y A R E A S ( N H P A S )

CHAP T E R 3 LE A D I N G CA U S E S OF DE A T H . . . . . . . . . . . . . . . . . . . . . . . .
Ranking causes of death is a useful method of describing patterns of mortality in a
population. It allows comparison over time and between populations. However,
different methods of grouping causes of death can result in a vastly different list of
leading causes for any given population. The ranking of leading causes of death in this
publication are based on research presented in the Bulletin of the World Health
Organisation, Volume 84, Number 4, April 2006, 257-336 (see Explanatory Notes 40-42
for further information).
Data for 2008 have been positively impacted by process improvements. See Technical
Note 1: 2008 COD Collection - Process Improvements for further information. These data
are also subject to a revisions process. See Technical Note 2: Causes of Death - Revisions
Process for further information.
In 2008, the leading underlying cause of death for all Australians was Ischaemic heart
diseases (I20-I25), which includes angina, blocked arteries of the heart and heart attacks.
Ischaemic heart diseases were identified as the underlying cause of 23,665 deaths, 16% of
all deaths registered in 2008. While Ischaemic heart diseases have been the leading cause
of death in Australia since 1999, the number of deaths due to this cause has decreased,
from 27,609 in 1999 to 23,665 in 2008. Similarly, the proportion of deaths where
Ischaemic heart disease was the underlying cause has declined from 22% of all deaths in
1999 to 16% in 2008.
Cerebrovascular disease [Strokes] (I60-I69) remained the second leading underlying
cause of death in 2008. Strokes include haemorrhages, strokes, infarctions and blocked
arteries of the brain. Compared to 10 years ago, deaths due to this cause decreased by
2.4%, from 12,266 deaths in 1999 to 11,973 deaths in 2008. The proportion of deaths
attributed to Strokes has decreased over the last 10 years, from 9.6% of deaths in 1999 to
8.3% of deaths in 2008.
Dementia and Alzheimer's disease (F01-F03, G30) was the third leading cause of death in
2008. The number of deaths due to this cause has increased 138% from 3,427 in 1999 to
8,171 in 2008. This is largely due to an increase in deaths due to Dementia (F01-F03),
which increased from 1,911 in 1999 to 5,688 in 2008.
Trachea and lung cancers (C33-C34) were the fourth leading cause of death in 2008.
Compared to 10 years ago, deaths due to this cause have increased by 17%, from 6,803 in
1999 to 7,946 in 2008. The proportion of deaths attributed to this cause was also higher
in 2008, 5.3% in 1999 and 5.5% in 2008.
The top 10 leading causes of death accounted for 53% of all deaths registered in 2008,
and the top 20 leading causes accounted for 67%.
OV E R V I E W
A B S • CA U S E S OF D E A T H • 3 3 0 3 . 0 • 2 0 0 8 11

Ischaemic heart diseases (I20-I25) were the leading cause of death for both males and
females in 2008, with 12,444 and 11,221 deaths respectively. This reflects a sex ratio of
111 male deaths per 100 female deaths.
The leading causes of death vary between the sexes, in part due to the incidence of
gender specific causes, such as Prostate or Ovarian cancer. However, other causes which
may not be gender-specific also showed variance between the sexes. Examples of these
included:
! Trachea and lung cancers (C33-34), for which there were 172 male deaths for every
100 female deaths
! Chronic lower respiratory diseases (J40-J47), for which there were 118 male deaths
for every 100 female deaths
! Strokes (I60-I69), for which there were 65 male deaths for every 100 female deaths
! Dementia and Alzheimer's disease (F01-F03, G30), for which there were 51 male
deaths for every 100 female deaths.
Those causes where a high proportion of deaths were males included:
! Intentional self harm [Suicide] (X60-X84) - 78%
! Trachea and lung cancers (C33-C34) - 63%
LE A D I N G CA U S E S OF
DE A T H BY GE N D E R
(a) Causes listed are the leading causes of death for all deaths registered in 2008 applied to people bornoverseas, based on the WHO recommended tabulation of leading causes. See Explanatory Notes 40-42for further information.
(b) Causes of death data for 2008 are preliminary and subject to a revisions process. See Technical Note 2:Causes of Death - Revisions Process.
(c) 2008 data have been subject to process improvements which have increased the quality of these data.See Technical Note 1: 2008 COD Collection - Process Improvements for further information.
(d) Excludes Sequelae of suicide (Y87.0) as per the WHO recommended tabulation of leading causes. Careneeds to be taken in interpreting figures relating to Suicide due to limitations of the data, see ExplanatoryNotes 72-75.
201 3483670941520Falls (W00-W19)191 490181 390191 243Cirrhosis and other diseases of liver (K70-K77)181 547241 10224946Cardiac arrhythmias (I47-I49)171 74283 566151 898Influenza and pneumonia (J10-J18)161 824191 364211 177Hypertensive diseases (I10-I15)151 857171 527181 371Skin cancers (C43-C44)142 190142 213132 492Suicide (X60-X84)(d)132 291151 902161 718Pancreatic cancer (C25)122 788132 722112 527Breast cancer (C50)113 031122 842122 499Prostate cancer (C61)103 224112 922102 698
Diseases of the kidney and urinary system(N00-N39)
93 360102 98883 222Heart failure (I50-I51)83 88973 71263 558
Blood and lymph cancer (including leukaemia)(C81-C96)
74 12054 44754 576Colon and rectum cancer (C18-C21)64 19193 38992 947Diabetes (E10-E14)56 25545 98546 096Chronic lower respiratory diseases (J40-J47)47 94636 97636 803Trachea and lung cancer (C33-C34)38 17164 27573 427
Dementia and Alzheimer disease (F01-F03,G30)
211 973212 240212 266Strokes (I60-I69)123 665125 439127 609Ischaemic heart diseases (I20-I25)
Rankno.Rankno.Rankno.
200820031999
Cause of dea th and ICD code
LEADING CAUSES OF DEATH (a) , Aust ra l ia Selec ted years—1999, 2003, 2008(b) (c )3.1
OV E R V I E W c o n t i n u e d
12 A B S • CA U S E S OF D E A T H • 3 3 0 3 . 0 • 2 0 0 8
CH A P T E R 3 • L E A D I N G CA U S E S OF D E A T H

Those causes where a high proportion of deaths were females included:
! Dementia and Alzheimer disease (F01-F03, G30)- 67%
! Strokes (I60-I69) - 61%
! Heart failure (I50-I51) - 61%
! Diseases of the kidney and urinary system (N00-N39) - 54%.
(a) Causes listed are the leading causes of death for all deaths registered in 2008based on the WHO recommended tabulation of leading causes. See ExplanatoryNotes 40-42 for further information.
(b) 2008 data have been subject to process improvements which have increased thequality of these data. See Technical Note 1: 2008 COD Collection - ProcessImprovements for further information.
(c) Causes of death data for 2008 are preliminary and subject to a revisions process.See Technical Note 2: Causes of Death - Revisions Process.
(d) Excludes Sequelae of suicide (Y87.0) as per the WHO recommended tabulation ofleading causes. Care needs to be taken in interpreting figures relating to Suicidedue to limitations of the data, see Explanatory Notes 72-75.
2 1901 70910Suicide (X60-X84)(d)4 1912 1419Diabetes (E10-E14)3 8892 2208
Blood and lymph cancer (includingleukaemia) (C81-C96)
4 1202 2307Colon and rectum cancer (C18-C21)8 1712 7076Dementia and Alzheimer disease (F01-F03, G30)3 0313 0315Prostate cancer (C61)6 2553 3874Chronic lower respiratory diseases (J40-J47)
11 9734 7273Strokes (I60-I69)7 9465 0252Trachea and lung cancer (C33-C34)
23 66512 4441Ischaemic heart diseases (I20-I25)
TotalMalesRankUnde r l y i n g Cause of Dea th
LEADING CAUSES OF DEATH (a) , Males —2008(b) (c )3.2
! Blood and lymph cancers (including leukaemia) (C81-C96) - 57%
! Chronic lower respiratory diseases (J40-J47) - 54%
! Colon and rectum cancers (C18-C21) - 54%
! Ischaemic heart disease (I20-I25) - 53%.
LE A D I N G CA U S E S OF
DE A T H BY GE N D E R
c o n t i n u e d
A B S • CA U S E S OF D E A T H • 3 3 0 3 . 0 • 2 0 0 8 13
CH A P T E R 3 • L E A D I N G CA U S E S OF D E A T H

(a) Causes listed are the leading causes of death for all deaths registered in 2008based on the WHO recommended tabulation of leading causes. See ExplanatoryNotes 40-42 for further information.
(b) 2008 data have been subject to process improvements which have increased thequality of these data. See Technical Note 1: 2008 COD Collection - ProcessImprovements for further information.
(c) Causes of death data for 2008 are preliminary and subject to a revisions process.See Technical Note 2: Causes of Death - Revisions Process.
3 2241 75610Diseases of the kidney and urinary
system (N00-N39)
4 1201 8909Colon and rectum cancer (C18-C21)3 3602 0348Heart failure (I50-I51)4 1912 0507Diabetes (E10-E14)2 7882 7746Breast cancer (C50)6 2552 8685Chronic lower respiratory diseases (J40-J47)7 9462 9214Trachea and lung cancer (C33-C34)8 1715 4643Dementia and Alzheimer disease (F01-F03, G30)
11 9737 2462Strokes (I60-I69)23 66511 2211Ischaemic heart diseases (I20-I25)
TotalFemalesRankUnde r l y i n g Cause of Dea th
LEADING CAUSES OF DEATH (a) , Females —2008(b) (c )3.3LE A D I N G CA U S E S OF
DE A T H BY GE N D E R
c o n t i n u e d
14 A B S • CA U S E S OF D E A T H • 3 3 0 3 . 0 • 2 0 0 8
CH A P T E R 3 • L E A D I N G CA U S E S OF D E A T H

CHAP T E R 4 UN D E R L Y I N G CA U S E OF DE A T H BY IC D - 1 0CH A P T E R . . . . . . . . . . . . . . . . . . . . . . . . . . . . . . . . . . . . . . . . . . . . .
In 2008, Infectious diseases (A00–B99) were the underlying cause of 1,935 registered
deaths or 1.3% of all deaths. More males died from Infectious diseases than females in
2008, with 997 deaths registered for males and 938 deaths registered for females.
The median age at death from Infectious diseases in 2008 was 80.2 years, slightly lower
than the median age for total number of deaths which was 80.9 years. The median age at
death from this cause has marginally increased over time, with the median age at death
for females typically recorded as being older than that for males. This trend continued in
2008, with the median age at death 83.0 years for females and 77.2 years for males.
Of those deaths due to Infectious diseases, 1,190 (61%) recorded Septicaemia (A40-A41)
as the underlying cause of death. In the 10 years since 1999, Septicaemia has increased
from 54% of all Infectious diseases to 61% in 2008.
Human immunodeficiency virus [HIV] disease (B20–B24) accounted for 64 deaths in
total in 2008. The number of deaths with HIV as the underlying cause has gradually
decreased over the past ten years, dropping from 135 in 1999. In 2008, more males (57)
than females (7) died from HIV, which is consistent with data from previous years. While
still substantial, the disparity between the number of men and women dying from HIV
has reduced in the 10 years since 1999. This has been driven by the reduction in the
number of males with this underlying cause of death, which has fallen from 126 in 1999
to 57 in 2008. In comparison, the number of females has remained relatively consistent
over this period (9 in 1999 to 7 in 2008). The median age at death due to HIV in 2008
was 50.0 years for total persons, 50.4 years for males and 42.8 years for females.
I N F E C T I O U S D I S E A S E S
(A 0 0 - B 9 9 )
Further information on Underlying Causes of Death is presented in the datacubes
associated with this publication. Included are all causes at the 3-digit level by sex for
Australia and each state/territory of usual residence.
Data cubes
An underlying cause of death is the disease or injury which initiated the train of morbid
events leading directly to death. Accidental and violent deaths are classified according to
the external cause, that is, to the circumstances of the accident or violence which
produced the fatal injury rather than to the nature of the injury.
Data for 2008 have been positively impacted by process improvements. See Technical
Note 1: 2008 COD Collection - Process Improvements for further information. These data
are also subject to a revisions process. See Technical Note 2: Causes of Death - Revisions
Process for further information.
OV E R V I E W
A B S • CA U S E S OF D E A T H • 3 3 0 3 . 0 • 2 0 0 8 15

In 2008, Cancer (C00–D48) was the underlying cause of 42,418 registered deaths in
Australia. This accounted for 30% of all registered deaths. The ratio of male (23,908) to
female (18,510) deaths in 2008 remained steady at 129 males per 100 females. The
median age of persons dying from Malignant cancers (C00–C97) has continued to rise
from 73.2 years in 1999 to 75.2 years in 2008. Deaths due to Malignant cancers accounted
for 41,341 deaths or 97% of all cancers in 2008.
Cancers of the digestive organs (C15–C26) accounted for 11,654 deaths. Of these, Colon
cancer (C18) constituted the largest number of deaths with 2,481. The median age at
death for people dying of colon cancer was 74.6 years for males and 78.1 years for
females, with the largest number of deaths occurring between 75 and 84 years of age for
both males and females.
Pancreatic cancer (C25) was the second highest contributor to deaths from Cancers of
the digestive organs, accounting for 2,291 deaths. There was a small difference between
the number of males (1,192) and females (1,099) with Pancreatic cancer as the
underlying cause of death, however, the median age of males dying of Pancreatic cancer
(72.3) was lower than for females (77.8) dying of the same cause.
CA N C E R (C 0 0 - D 4 8 )
(c) Data cells with small values have been randomly assigned to protectthe confidentiality of individuals. As a result, some totals will not equalthe sum of their components. Cells with a zero value have not beenaffected by confidentialisation.
(d) Causes of death data for 2008 are preliminary and subject to arevisions process. See Technical Note 2: Causes of Death - RevisionsProcess.
— nil or rounded to zero (including null cells)(a) Causes selected are those with 20 or more deaths at the 3 digit level
of ICD-10. (b) 2008 data have been subject to process improvements which have
increased the quality of these data. See Technical Note 1: 2008 CODCollection - Process Improvements for further information.
—271611Other infectious diseases (B99)
0.119975124Sequelae of other and unspecified infectious and parasitic diseases (B94)0.222895133Sequelae of infectious and parasitic diseases (B90-B94)
—251114Viral infection of unspecified site (B34)—391920Other viral diseases (B25-B34)
—64757Human immunodeficiency virus (HIV])disease (B20-B24)
—361125Chronic viral hepatitis (B18)—471433Viral hepatitis (B15-B19)
—251312Zoster (herpes zoster) (B02)—482424Viral infections characterized by skin and mucous membrane lesions (B00-B09)
—281414Slow virus infections of central nervous system (A81)—431924Viral infections of the central nervous system (A80-A89)
—321517Bacterial infection of unspecified site (A49)0.81 161614547Other septicaemia (A41) —291415Streptococcal septicaemia (A40)
0.91 263660603Other bacterial diseases (A30-A49)
—371918Respiratory tuberculosis, not confirmed bacteriologically or histologically (A16)
—512724Tuberculosis (A15-A19)
—29209Other bacterial intestinal infections (A04) —694524Intestinal infectious diseases (A00-A09)
1.31 935938997CHAPTER I Certain infectious and parasitic diseases (A00-B99)
%no.no.no.
Proportion
of all
deathsPersonsFemalesMales
Cause of Dea th and ICD Code
SELECTED UNDERLY ING CAUSES (a) , In fec t ious diseases (A00– B99) —2008(b) (c ) (d )4.1
16 A B S • CA U S E S OF D E A T H • 3 3 0 3 . 0 • 2 0 0 8
CH A P T E R 4 • U N D E R L Y I N G C A U S E OF D E A T H B Y I C D - 1 0 C H A P T E R

There were 8,262 deaths attributed to Cancers of the respiratory system and heart
(C30–C39), accounting for 20% of all malignant cancers. Lung cancer (C34) was the
underlying cause of 7,941 (96%) deaths due to Cancers of the respiratory system and
heart. The male to female ratio of deaths with Lung cancer as the underlying cause of
death has dropped from 216.7 male deaths per 100 females in 1999 to 171.9 male deaths
per 100 females in 2008. However, since 1999 the number of female deaths from this
cause has increased by 775 while the number of male deaths has increased by 370. Males
whose underlying cause of death was Lung cancer, had a marginally lower median age at
death (73.7 years) than females (73.8 years) with the same underlying cause.
Prostate cancer (C61) was the underlying cause of 4.1% of all male deaths registered in
2008. Male deaths with this underlying cause have increased gradually from 2,499 in 1999
to 3,031 in 2008. The median age at death for Prostate cancer was 81.0 years. This was
close to the median age for all deaths (80.9 years) and continues to follow the steady
upward trend from 78.8 years in 1999.
In females, deaths due to Breast cancer (C50) have risen from 2,505 in 1999 to 2,774 in
2008. The 2008 figure is the highest in the past decade, 55 more than in 2005, the second
highest in the past decade, when 2,719 females deaths due to Breast cancer were
recorded. The female median age at death due to Breast cancer was 68.1 years, 2.9 years
lower than males (71.0 years) and 15.8 years lower than the median age for all female
deaths (83.9 years).
CA N C E R (C 0 0 - D 4 8 )
c o n t i n u e d
A B S • CA U S E S OF D E A T H • 3 3 0 3 . 0 • 2 0 0 8 17
CH A P T E R 4 • U N D E R L Y I N G C A U S E OF D E A T H B Y I C D - 1 0 C H A P T E R

0.81 194484710Malignant neoplasm of brain (C71)0.91 233504729
Malignant neoplasms of eye, brain and other parts of central nervous
system (C69-C72)
0.7950288662Malignant neoplasm of bladder (C67)0.6848320528Malignant neoplasm of kidney, except renal pelvis (C64)1.31 8846441 240Malignant neoplasms of urinary tract (C64-C68)
2.13 031—3 031Malignant neoplasm of prostate (C61)2.13 053—3 053Malignant neoplasms of male genital organs (C60-C63)
0.6899899—Malignant neoplasm of ovary (C56) 0.1130130—Malignant neoplasm of uterus, part unspecified (C55)0.2219219—Malignant neoplasm of corpus uteri (C54) 0.2234234—Malignant neoplasm of cervix uteri (C53)0.17272—Malignant neoplasm of vulva (C51) 1.11 5991 599—Malignant neoplasms of female genital organs (C51-C58)
1.92 7882 77414Malignant neoplasm of breast (C50)0.2217108109Malignant neoplasm of other connective and soft tissue (C49) 0.1937716Malignant neoplasm of retroperitoneum and peritoneum (C48) 0.4628124504Mesothelioma (C45)0.7949312637Malignant neoplasms of mesothelial and soft tissue (C45-C49)
0.3420141279Other malignant neoplasms of skin (C44)1.01 437472965Malignant melanoma of skin (C43)1.31 8576131 244Melanoma and other malignant neoplasms of skin (C43-C44)
0.1943955Malignant neoplasm of bone and articular cartilage of other and unspecified
sites (C41)
0.11044559Malignant neoplasms of bone and articular cartilage (C40-C41)
5.57 9412 9215 020Malignant neoplasm of bronchus and lung (C34)0.223734203Malignant neoplasm of larynx (C32) 5.78 2622 9875 275Malignant neoplasms of respiratory and intrathoracic organs (C30-C39)
0.91 297645652Malignant neoplasm of other and ill-defined digestive organs (C26) 1.62 2911 0991 192Malignant neoplasm of pancreas (C25) 0.1884543Malignant neoplasm of other and unspecified parts of biliary tract (C24) 0.119112863Malignant neoplasm of gallbladder (C23) 0.81 213416797Malignant neoplasm of liver and intrahepatic bile ducts (C22) —633429Malignant neoplasm of anus and anal canal (C21)
0.5760291469Malignant neoplasm of rectum (C20) ' 0.6816354462Malignant neoplasm of rectosigmoid junction (C19) 1.72 4811 2111 270Malignant neoplasm of colon (C18) 0.11004753Malignant neoplasm of small intestine (C17) 0.81 145428717Malignant neoplasm of stomach (C16)0.81 209368841Malignant neoplasm of oesophagus (C15) 8.111 6545 0666 588Malignant neoplasms of digestive organs (C15-C26)
0.1791465Malignant neoplasm of other and ill-defined sites in the lip, oral cavity and
pharynx (C14)
—591841Malignant neoplasm of nasopharynx (C11) —501535Malignant neoplasm of oropharynx (C10) —581444Malignant neoplasm of tonsil (C09)
0.1731855Malignant neoplasm of parotid gland (C07) —562333Malignant neoplasm of other and unspecified parts of mouth (C06)
0.115650106Malignant neoplasm of other and unspecified parts of tongue (C02) 0.5675199476Malignant neoplasms of lip, oral cavity and pharynx (C00-C14)
28.741 34118 00123 340Malignant neoplasms (C00-C97)
29.542 41818 51023 908CHAPTER II Neoplasms (C00-D48)
%no.no.no.
Proportion
of all
deathsPersonsFemalesMales
Cause of Dea th and ICD Code
SELECTED UNDERLY ING CAUSES (a) , Cancer (C00– D48) —2008(b) (c ) (d )4.2
18 A B S • CA U S E S OF D E A T H • 3 3 0 3 . 0 • 2 0 0 8
CH A P T E R 4 • U N D E R L Y I N G C A U S E OF D E A T H B Y I C D - 1 0 C H A P T E R

Blood and immunity disorders (D50–D89) accounted for 503 registered deaths in 2008.
This represented 0.3% of all registered deaths in 2008 and has remained stable over the
last 10 years. These deaths were most likely to occur amongst older people, with 72% of
males and 83% of females who died from Blood and immunity disorders aged 65 years
and over.
The median age at death for females from this cause has historically been higher than
the median age at death for males. This trend continued in 2008, with a median age at
death for females of 83.5 years and 77.6 years for males.
Anaemias (D50–D64) accounted for 211 deaths, or 42% of deaths due to Blood and
immunity disorders. The number of deaths due to Anaemias has remained stable over
the last 10 years. The number of Anaemias as a proportion of all Blood and immunity
disorders has been steadily falling over the last decade from 45% in 1999 to 42% in 2008.
The number of females (123) dying from Anaemias in 2008 was higher than the number
BL O O D AN D IM M U N I T Y
D I S O R D E R S (D 5 0 - D 8 9 )
(c) Causes of death data for 2008 are preliminary and subject to arevisions process. See Technical Note 2: Causes of Death - RevisionsProcess.
(d) Data cells with small values have been randomly assigned to protect theconfidentiality of individuals. As a result, some totals will not equal thesum of their components. Cells with a zero value have not beenaffected by confidentialisation.
— nil or rounded to zero (including null cells)(a) Causes selected are those with 50 or more deaths at the 3 digit level of
ICD-10.(b) 2008 data have been subject to process improvements which have
increased the quality of these data. See Technical Note 1: 2008 CODCollection - Process Improvements for further information.
0.11677196Other neoplasms of uncertain or unknown behaviour of lymphoid, haematopoietic and
related tissue (D47)
0.3428172256Myelodysplastic syndromes (D46)0.11568274
Neoplasm of uncertain or unknown behaviour of brain and central nervous system (D43)—713734
Neoplasm of uncertain or unknown behaviour of oral cavity and digestive organs (D37)0.7951435516Neoplasms of uncertain or unknown behaviour (D37-D48)
0.1774730Benign neoplasm of meninges (D32) 0.11257352Benign neoplasms (D10-D36)
0.71 077509568Other Neoplasms (D00-D48)
0.5675249426Malignant neoplasms of independent (primary) multiple sites (C97)0.11306367Leukaemia of unspecified cell type (C95)0.6933390543Myeloid leukaemia (C92)0.3423151272Lymphoid leukaemia (C91)0.6863376487Multiple myeloma and malignant plasma cell neoplasms (C90)0.81 092509583Other and unspecified types of non-Hodgkin's lymphoma (C85)0.1973166Peripheral and cutaneous T-cell lymphomas (C84)0.119473121Diffuse non-Hodgkin's lymphoma (C83)—563026Hodgkin's disease (C81)
2.73 8891 6692 220Malignant neoplasms of lymphoid, haematopoietic and related tissue (C81-C96)
1.62 3531 1461 207Malignant neoplasm without specification of site (C81)0.1205105100Malignant neoplasm of other and ill-defined sites (C76)1.82 5581 2511 307Malignant neoplasms of ill-defined, secondary and unspecified sites (C76-C80)
0.11056045Malignant neoplasm of thyroid gland (C73)0.11618972Malignant neoplasms of thyroid and other endocrine glands (C73-C75)
28.741 34118 00123 340Malignant neoplasms (C00-C97)
29.542 41818 51023 908CHAPTER II Neoplasms (C00-D48)
%no.no.no.
Proportion
of all
deathsPersonsFemalesMales
Cause of Dea th and ICD Code
SELECTED UNDERLY ING CAUSES (a) , Cancer (C00– D48) —2008(b) (c ) (d ) co n t i n u e d4.2
A B S • CA U S E S OF D E A T H • 3 3 0 3 . 0 • 2 0 0 8 19
CH A P T E R 4 • U N D E R L Y I N G C A U S E OF D E A T H B Y I C D - 1 0 C H A P T E R

Endocrine, nutritional and metabolic diseases (E00–E90) in 2008 accounted for 5,900
registered deaths, representing 4.1% of all registered deaths. Total deaths due to these
underlying causes have increased gradually over the last ten years, from 4,100 in 1999 to
5,900 in 2008. The proportion of all deaths due to these causes has also increased slightly
over the same period ranging from 3.2% in 1999 to 4.1% in 2008. The median age at
death from these causes was 81.1 years, which was comparable with the median age of
80.9 years for all deaths in 2008.
Diabetes (E10–E14) was the underlying cause of death for 4,191 people, or 2.9% of all
deaths. 2008 had the highest number of deaths resulting from Diabetes over the past ten
years, with the proportion of all deaths represented by this cause increasing (2.3% to
2.9%) over this period.
Obesity (E66) accounted for a total of 182 deaths in 2008. The overall median age at
death due to Obesity as the underlying cause was 62.3 years, which was 18.6 years less
than the median age for all deaths. At 56.5 years for males and 62.3 years for females, the
median age at death resulting from Obesity for males was almost 6 years lower than it
was for females.
EN D O C R I N E , NU T R I O N A L
AN D ME T A B O L I C
D I S E A S E S ( E 0 0 - E 9 0 )
(c) Causes of death data for 2008 are preliminary and subject to arevisions process. See Technical Note 2: Causes of Death - RevisionsProcess.
(d) Data cells with small values have been randomly assigned to protectthe confidentiality of individuals. As a result, some totals will not equalthe sum of their components. Cells with a zero value have not beenaffected by confidentialisation.
— nil or rounded to zero (including null cells)(a) Causes selected are those with 20 or more deaths at the 3 digit level
of ICD-10. (b) 2008 data have been subject to process improvements which have
increased the quality of these data. See Technical Note 1: 2008 CODCollection - Process Improvements for further information.
—281018Sarcoidosis (D86) —603030Other immunodeficiencies (D84)
0.11105060Certain disorders involving the immune mechanism (D80-D89)
—251114Agranulocytosis (D70) —673532Other diseases of blood and blood-forming organs (D70-D77)
—511536Purpura and other haemorrhagic conditions (D69) —482919Other coagulation defects (D68)
0.11155164Coagulation defects, purpura and other haemorrhagic conditions (D65-D69)
0.1854936Other anaemias (D64) 0.1834637Other aplastic anaemias (D61) 0.11689573Aplastic and other anaemias (D60-D64)
0.3503259244CHAPTER III Diseases of the blood and blood-forming organs and certain disorders
involving the immune mechanism (D50-D89)
%no.no.no.
Proportion
of all
deathsPersonsFemalesMales
Cause of Dea th and ICD Code
SELECTED UNDERLY ING CAUSES (a) , Diseases of the Blood and Immun i t y Disorders (D50–D89) —2008(b) (c ) (d )4.3
of males (88) dying from the same cause. This pattern has been consistent over the 10
years since 1999.
BL O O D AN D IM M U N I T Y
D I S O R D E R S (D 5 0 - D 8 9 )
c o n t i n u e d
20 A B S • CA U S E S OF D E A T H • 3 3 0 3 . 0 • 2 0 0 8
CH A P T E R 4 • U N D E R L Y I N G C A U S E OF D E A T H B Y I C D - 1 0 C H A P T E R
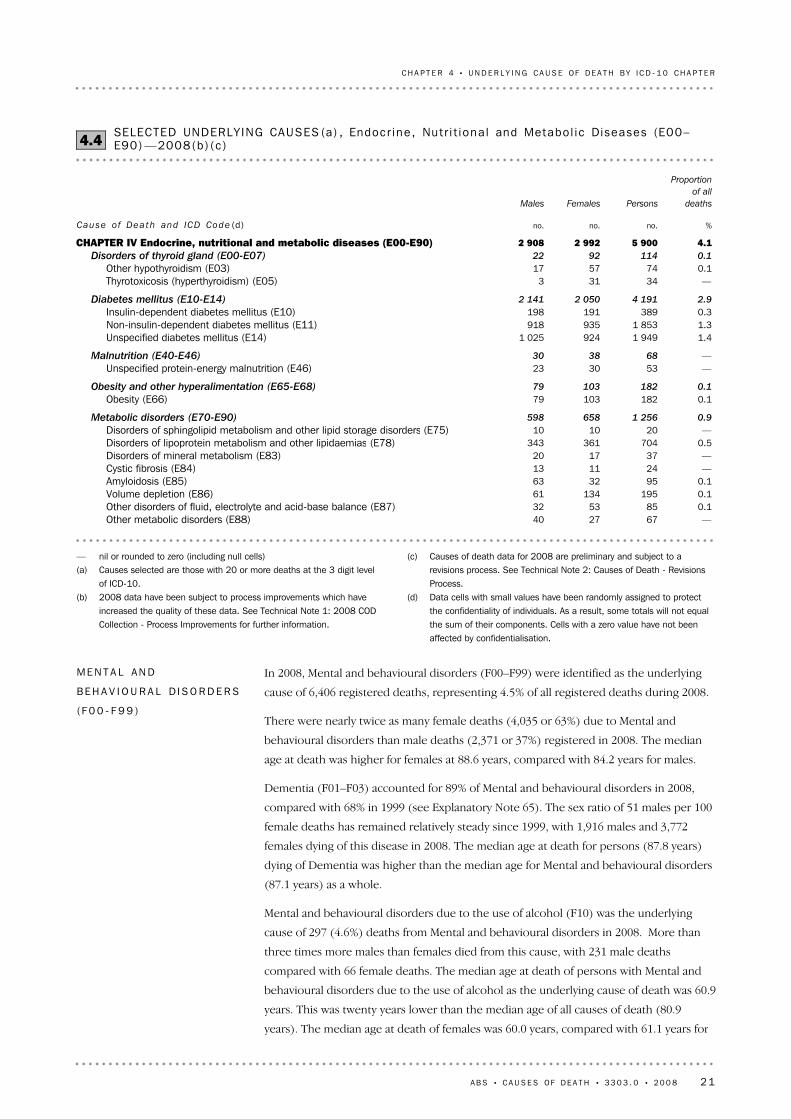
In 2008, Mental and behavioural disorders (F00–F99) were identified as the underlying
cause of 6,406 registered deaths, representing 4.5% of all registered deaths during 2008.
There were nearly twice as many female deaths (4,035 or 63%) due to Mental and
behavioural disorders than male deaths (2,371 or 37%) registered in 2008. The median
age at death was higher for females at 88.6 years, compared with 84.2 years for males.
Dementia (F01–F03) accounted for 89% of Mental and behavioural disorders in 2008,
compared with 68% in 1999 (see Explanatory Note 65). The sex ratio of 51 males per 100
female deaths has remained relatively steady since 1999, with 1,916 males and 3,772
females dying of this disease in 2008. The median age at death for persons (87.8 years)
dying of Dementia was higher than the median age for Mental and behavioural disorders
(87.1 years) as a whole.
Mental and behavioural disorders due to the use of alcohol (F10) was the underlying
cause of 297 (4.6%) deaths from Mental and behavioural disorders in 2008. More than
three times more males than females died from this cause, with 231 male deaths
compared with 66 female deaths. The median age at death of persons with Mental and
behavioural disorders due to the use of alcohol as the underlying cause of death was 60.9
years. This was twenty years lower than the median age of all causes of death (80.9
years). The median age at death of females was 60.0 years, compared with 61.1 years for
ME N T A L AN D
BE H A V I O U R A L D I S O R D E R S
(F 0 0 - F 9 9 )
(c) Causes of death data for 2008 are preliminary and subject to arevisions process. See Technical Note 2: Causes of Death - RevisionsProcess.
(d) Data cells with small values have been randomly assigned to protectthe confidentiality of individuals. As a result, some totals will not equalthe sum of their components. Cells with a zero value have not beenaffected by confidentialisation.
— nil or rounded to zero (including null cells)(a) Causes selected are those with 20 or more deaths at the 3 digit level
of ICD-10. (b) 2008 data have been subject to process improvements which have
increased the quality of these data. See Technical Note 1: 2008 CODCollection - Process Improvements for further information.
—672740Other metabolic disorders (E88) 0.1855332Other disorders of fluid, electrolyte and acid-base balance (E87) 0.119513461Volume depletion (E86) 0.1953263Amyloidosis (E85) —241113Cystic fibrosis (E84)—371720Disorders of mineral metabolism (E83)
0.5704361343Disorders of lipoprotein metabolism and other lipidaemias (E78) —201010Disorders of sphingolipid metabolism and other lipid storage disorders (E75)
0.91 256658598Metabolic disorders (E70-E90)
0.118210379Obesity (E66)0.118210379Obesity and other hyperalimentation (E65-E68)
—533023Unspecified protein-energy malnutrition (E46) —683830Malnutrition (E40-E46)
1.41 9499241 025Unspecified diabetes mellitus (E14) 1.31 853935918Non-insulin-dependent diabetes mellitus (E11)0.3389191198Insulin-dependent diabetes mellitus (E10) 2.94 1912 0502 141Diabetes mellitus (E10-E14)
—34313Thyrotoxicosis (hyperthyroidism) (E05) 0.1745717Other hypothyroidism (E03) 0.11149222Disorders of thyroid gland (E00-E07)
4.15 9002 9922 908CHAPTER IV Endocrine, nutritional and metabolic diseases (E00-E90)
%no.no.no.
Proportion
of all
deathsPersonsFemalesMales
Cause of Dea th and ICD Code (d)
SELECTED UNDERLY ING CAUSES (a) , Endocr ine , Nut r i t iona l and Metabo l i c Diseases (E00–E90) —2008(b) (c )4.4
A B S • CA U S E S OF D E A T H • 3 3 0 3 . 0 • 2 0 0 8 21
CH A P T E R 4 • U N D E R L Y I N G C A U S E OF D E A T H B Y I C D - 1 0 C H A P T E R

Diseases of the nervous system (G00–G99) accounted for 5,961 registered deaths in
2008, representing 4.1% of all registered deaths. This follows a gradual increase in deaths
attributable to Diseases of the nervous system over time, from 3,890 in 1999. The
number of deaths due to Diseases of the nervous system was higher for females (3,237)
than for males (2,724). The median age at death was 80.0 for males, 84.4 for females.
Deaths from Alzheimer's disease (G30) constituted 42% (2,483) of all deaths due to
Diseases of the nervous system and 1.7% of all registered deaths in 2008. Female deaths
(1,692) due to Alzheimer's disease were much higher than male deaths (791), with a
ratio of 47 male deaths per 100 female deaths. The median age at death due to
Alzheimer's disease was 86.8 years.
Parkinson's disease (G20) accounted for 22% of all deaths due to Diseases of the nervous
system and 0.9% of all deaths registered in 2008. There were 1,284 deaths due to this
disease, with a median age at death of 83.2 years. The number of male deaths (752) due
to this disease was higher than the number of female deaths (532). This was similar to
the overall trend for the past 10 years.
D I S E A S E S OF TH E
NE R V O U S SY S T E M
(G 0 0 - G 9 9 )
— nil or rounded to zero (including null cells)(a) Causes selected are those with 20 or more deaths at the 3 digit level of ICD-10. (b) 2008 data have been subject to process improvements which have increased the quality of these data. See Technical Note 1: 2008 COD Collection -
Process Improvements for further information.(c) Causes of death data for 2008 are preliminary and subject to a revisions process. See Technical Note 2: Causes of Death - Revisions Process.(d) Data cells with small values have been randomly assigned to protect the confidentiality of individuals. As a result, some totals will not equal the sum of
their components. Cells with a zero value have not been affected by confidentialisation.(e) See Explanatory Note 65 for further information on data relating to Dementia.
—523220Depressive episode (F32) —654223Mood (affective) disorders (F30-F39)
—562927Schizophrenia (F20) —593227Schizophrenia, schizotypal and delusional disorders (F20-F29)
—29920Mental and behavioural disorders due to multiple drug use and use of other psychoactive
substances (F19)
0.11034162Mental and behavioural disorders due to use of tobacco (F17)0.229766231Mental and behavioural disorders due to use of alcohol (F10) 0.3442121321Mental and behavioural disorders due to psychoactive substance use (F10-F19)
—291613Personality and behavioural disorders due to brain disease, damage and dysfunction (F07)
0.1772750Delirium, not induced by alcohol and other psychoactive substances (F05)3.24 6633 1521 511Unspecified dementia (F03) (e)0.71 025620405Vascular dementia (F01) (e)4.05 7983 8161 982Organic, including symptomatic, mental disorders (F00-F09)
4.56 4064 0352 371CHAPTER V Mental and behavioural disorders (F00-F99)
%no.no.no.
Proportion
of all
deathsPersonsFemalesMales
Cause of Dea th and ICD Code
SELECTED UNDERLY ING CAUSES (a) , Menta l and Behav iou ra l Diso rders (F00–F99) —2008(b) (c ) (d )4.5
males. The trends for males and females differ also, with female deaths remaining steady
since 1999 and male deaths fluctuating over time, ranging between 188 in 1999 and 231
in 2008.
ME N T A L AN D
BE H A V I O U R A L D I S O R D E R S
(F 0 0 - F 9 9 ) c o n t i n u e d
22 A B S • CA U S E S OF D E A T H • 3 3 0 3 . 0 • 2 0 0 8
CH A P T E R 4 • U N D E R L Y I N G C A U S E OF D E A T H B Y I C D - 1 0 C H A P T E R

Due to the small number of deaths attributed to Diseases of the eye and ear (H00-H95),
the following section refers to the period 1999-2008.
Since 1999, a total of 115 deaths have been attributed to Diseases of the eye and ear
(H00-H95). Of these, 47 (41%) were male and 68 (59%) were female.
Diseases of the middle ear and mastoid (H65–H75) have accounted for a total of 54
deaths since 1999. Visual disturbances and blindness (H53–H54) have accounted for a
total of 14 deaths in the last 10 years.
D I S E A S E S OF TH E EY E
AN D EA R (H 0 0 - H 9 5 )
— nil or rounded to zero (including null cells)(a) Causes selected are those with 20 or more deaths at the 3 digit level of ICD-10. (b) 2008 data have been subject to process improvements which have increased the quality of these data. See Technical Note 1: 2008 COD Collection -
Process Improvements for further information.(c) Causes of death data for 2008 are preliminary and subject to a revisions process. See Technical Note 2: Causes of Death - Revisions Process.(d) Data cells with small values have been randomly assigned to protect the confidentiality of individuals. As a result, some totals will not equal the sum of
their components. It is important to note that cells with a zero value have not been affected by confidentialisation.
—201010Other diseases of spinal cord (G95) 0.11596297Other disorders of brain (G93) —271314Hydrocephalus (G91) —582731Disorders of autonomic nervous system (G90)
0.2272115157Other disorders of the nervous system (G90-G99)
—602436Paraplegia and tetraplegia (G82) —24816Hemiplegia (G81) —673136Infantile cerebral palsy (G80)
0.11576790Cerebral palsy and other paralytic syndromes (G80-G83)
0.1873255Primary disorders of muscles (G71) —361818Myasthenia gravis and other myoneural disorders (G70)
0.11405783Diseases of myoneural junction and muscle (G70-G73)
—281513Other polyneuropathies (G62) —452124Polyneuropathies and other disorders of the peripheral nervous system (G60-G64)
—22814Sleep disorders (G47) —583424Transient cerebral ischaemic attacks and related syndromes (G45)
0.2259109150Epilepsy (G40) 0.2352158194Episodic and paroxysmal disorders (G40-G47)
0.11429151Multiple sclerosis (G35) 0.11509852Demyelinating diseases of the central nervous system (G35-G37)
0.2255120135Other degenerative diseases of nervous system, not elsewhere classified (G31) 1.72 4831 692791Alzheimer's disease (G30) 1.92 7381 812926Other degenerative diseases of the nervous system (G30-G32)
—26179Other degenerative diseases of basal ganglia (G23) 0.91 284532752Parkinson's disease (G20) 0.91 328555773Extrapyramidal and movement disorders (G20-G26)
0.4630280350Spinal muscular atrophy and related syndromes (G12) 0.1794435Huntington's disease (G10) 0.5723331392Systemic atrophies primarily affecting the central nervous system (G10-G13)
4.15 9613 2372 724CHAPTER VI Diseases of the nervous system (G00-G99)
Proportion
of all
deathsPersonsFemalesMalesCause of Dea th and ICD Code
SELECTED UNDERLY ING CAUSES (a) , Diseases of the Nervous System (G00–G99) —2008(b) (c ) (d )4.6
A B S • CA U S E S OF D E A T H • 3 3 0 3 . 0 • 2 0 0 8 23
CH A P T E R 4 • U N D E R L Y I N G C A U S E OF D E A T H B Y I C D - 1 0 C H A P T E R

Diseases of the heart and blood vessels (I00–I99) were identified as the underlying cause
of 48,456 registered deaths in 2008. This accounted for 34% of all registered deaths. The
median age at death for Diseases of the heart and blood vessels was 84.6 years, higher
than the median age for all deaths (80.9 years).
Female deaths represented 53% (25,699) of deaths due to these diseases. The pattern of
more female than male deaths for these underlying causes was consistent over the last
10 years. Females (87.0 years) dying from these diseases had a higher median age at
death than males (81.3 years) dying from the same cause.
Ischaemic heart diseases (I20–I25) which includes angina, heart attacks and blocked
arteries of the heart, represented a substantial proportion of deaths attributable to
Diseases of the heart and blood vessels, accounting for 23,665 deaths (49%) . Of deaths
from Ischaemic heart disease, 12,444 (53%) were males, and 11,221 (47%) were females.
Ischaemic heart disease accounted for almost twice the number of deaths than the next
highest contributor to Diseases of the heart and blood vessels (Cerebrovascular disease
[Stroke] (I60-I69), or 11,973).
Deaths from Stroke (I60–I69) numbered 11,973 in 2008 or 25% of all Diseases of the
heart and blood vessels, comparable with Acute myocardial infarction (Heart attack,
(I21). In contrast to Heart attack, however, there were considerably less males 4,727
(39%) with Stroke as the underlying cause of death than females 7,246 (61%). Females at
86.9 years, had a higher median age at death than males at 82.7 years.
Heart attack (I21) represented 11,122 deaths or 23% of all Diseases of the Heart and
Blood Vessels, and a total of 7.7% of all causes. There was a small difference in the
number of male and female deaths due to this cause with 5,539 and 5,583 deaths
respectively. The median age at death for females from Heart attack as their underlying
cause of death was 87.0 years while the male figure was lower at 81.0 years.
D I S E A S E S OF TH E HE A R T
AN D BL O O D VE S S E L S
( I 0 0 - I 9 9 )
(a) Causes selected are those with 10 or more deaths at the 3 digit level of ICD-10. (b) 2008 data have been subject to process improvements which have increased the quality of these data. See
Technical Note 1: 2008 COD Collection - Process Improvements for further information.(c) Causes of death data for 2008 are preliminary and subject to a revisions process. See Technical Note 2: Causes of
Death - Revisions Process.(d) Causes of death data for 2007 have been revised and are subject to further revisions. See Technical Note 3: 2007
Revisions for further information.(e) Data cells with small values have been randomly assigned to protect the confidentiality of individuals. As a result,
some totals will not equal the sum of their components. Cells with a zero value have not been affected byconfidentialisation.
1569Mastoiditis and related conditions (H70) 352312Suppurative and unspecified otitis media (H66) 543222Diseases of middle ear and mastoid (H65-H75)
633627CHAPTER VIII Diseases of the ear and mastoid process (H60-H95)
1486Blindness and low vision (H54) 1486Visual disturbances and blindness (H53-H54)
1055Disorders of orbit (H05) 1266Disorders of eyelid, lacrimal system and orbit (H00-H06)
523220CHAPTER VII Diseases of the eye and adnexa (H00-H59)
no.no.no.
PersonsFemalesMales
Cause of Dea th and ICD Code
SELECTED UNDERLY ING CAUSES (a) , Diseases of the eye and ear (H00– H95) —1999–2008(b) (c ) (d ) (e )4.7
24 A B S • CA U S E S OF D E A T H • 3 3 0 3 . 0 • 2 0 0 8
CH A P T E R 4 • U N D E R L Y I N G C A U S E OF D E A T H B Y I C D - 1 0 C H A P T E R

(c) Causes of death data for 2008 are preliminary and subject to arevisions process. See Technical Note 2: Causes of Death - RevisionsProcess.
(d) Data cells with small values have been randomly assigned to protectthe confidentiality of individuals. As a result, some totals will notequal the sum of their components. Cells with a zero value have notbeen affected by confidentialisation.
— nil or rounded to zero (including null cells)(a) Causes selected are those with 50 or more deaths at the 3 digit level
of ICD-10. (b) 2008 data have been subject to process improvements which have
increased the quality of these data. See Technical Note 1: 2008COD Collection - Process Improvements for further information.
0.121111893Phlebitis and thrombophlebitis (I80) 0.2270152118
Diseases of veins, lymphatic vessels and lymph nodes, not elsewhere
classified (I80-I89)
0.1733538Other disorders of arteries and arterioles (I77) 0.5690376314Other peripheral vascular diseases (I73) 0.91 230482748Aortic aneurysm and dissection (I71) 0.222414480Atherosclerosis (I70) 1.62 3141 0871 227Diseases of arteries, arterioles and capillaries (I70-I79)
1.92 7001 6401 060Sequelae of cerebrovascular disease (I69) 0.3487285202Other cerebrovascular diseases (I67) 3.95 5813 5702 011Stroke, not specified as haemorrhage or infarction (I64) 0.6916519397Cerebral infarction (I63) 0.3462227235Other nontraumatic intracranial haemorrhage (I62) 0.91 316687629Intracerebral haemorrhage (I61) 0.4511318193Subarachnoid haemorrhage (I60) 8.311 9737 2464 727Cerebrovascular diseases (I60-I69)
0.4602302300Complications and ill-defined descriptions of heart disease (I51) 1.92 7581 7321 026Heart failure (I50) 0.120711097Other cardiac arrhythmias (I49) 0.91 319840479Atrial fibrillation and flutter (I48) 0.11367660Cardiac arrest (I46) 0.6896323573Cardiomyopathy (I42) 0.119511877Endocarditis, valve unspecified (I38) 0.6923482441Nonrheumatic aortic valve disorders (I35) 0.118910980Nonrheumatic mitral valve disorders (I34) —662244Acute and subacute endocarditis (I33) —522527Other diseases of pericardium (I31)
5.27 4604 1983 262Other forms of heart disease (I30-I52)
0.225215795Other pulmonary heart diseases (I27) 0.2344202142Pulmonary embolism (I26) 0.4598359239Pulmonary heart disease and diseases of pulmonary circulation (I26-I28)
8.512 1855 4356 750Chronic ischaemic heart disease (I25) 0.2318177141Other acute ischaemic heart diseases (I24) 7.711 1225 5835 539Acute myocardial infarction (I21)
16.423 66511 22112 444Ischaemic heart diseases (I20-I25)
0.11107634Hypertensive heart and renal disease (I13) 0.4534336198Hypertensive renal disease (I12) 0.5688452236Hypertensive heart disease (I11) 0.3492338154Essential (primary) hypertension (I10) 1.31 8241 202622Hypertensive diseases (I10-I15)
—644024Multiple valve diseases (I08) 0.116410955Rheumatic mitral valve diseases (I05) 0.2328220108Chronic rheumatic heart diseases (I05-I09)
33.748 45625 69922 757CHAPTER IX Diseases of the circulatory system (I00-I99)
%no.no.no.
Proportion
of all
deathsPersonsFemalesMales
Cause of Dea th and ICD Code
SELECTED UNDERLY ING CAUSES (a) , Diseases of the Hear t and Blood Vesse ls (I00–I99) —2008(b) (c ) (d )4.8
A B S • CA U S E S OF D E A T H • 3 3 0 3 . 0 • 2 0 0 8 25
CH A P T E R 4 • U N D E R L Y I N G C A U S E OF D E A T H B Y I C D - 1 0 C H A P T E R

Diseases of the respiratory system (J00-J99), which include diseases that impact on the
ability to breathe, accounted for 11,260 registered deaths in 2008, which was 7.8% of all
registered deaths. In line with the pattern of previous years where more males than
females died of this cause, there were 5,924 male deaths compared to 5,336 female
deaths due to Diseases of the respiratory system. Over the past ten years, females tended
to be older than males for this underlying cause. This trend continued in 2008 with the
median age at death for males 81.3 years and females 84.1 years.
In 2008, Chronic lower respiratory diseases (J40–J47) were the underlying cause of 6,255
deaths or 4.3% of all registered deaths. Chronic lower respiratory diseases include
diseases such as asthma, bronchitis and emphysema. More males than females died from
this cause in 2008 (3,387 compared with 2,868). Males also tended to be slightly younger
than females dying from this cause over time. In 2008, the median age at death caused
by Chronic lower respiratory diseases was 80.4 years for males and 81.5 years for females.
In 2008, Pneumonia (J12-J18) accounted for 1,704 of the 1,742 registered deaths due to
Influenza and pneumonia (J10-J18), or 1.2% of all registered deaths in Australia. As in
previous years, more females died from Pneumonia than males, with 1,003 female deaths
compared with 695 male deaths. The median age at death for males was also lower, 84.9
years compared with 90.3 years for females.
The number of deaths from Pneumonitis (J69), which is similar to pneumonia but results
from complications of inhalation of solids and liquids, has increased substantially over
time, from 113 deaths in 1999 to 1,123 in 2008. The increase in deaths due to this cause
was mainly in the 60 years and over age group. In 1999, 157 people aged 60 or over died
from Pneumonitis, whereas in 2008, 1,076 people aged 60 years or over died from this
underlying cause.
D I S E A S E S OF TH E
RE S P I R A T O R Y SY S T E M
( J 0 0 - J 9 9 )
26 A B S • CA U S E S OF D E A T H • 3 3 0 3 . 0 • 2 0 0 8
CH A P T E R 4 • U N D E R L Y I N G C A U S E OF D E A T H B Y I C D - 1 0 C H A P T E R

Diseases of the digestive system (K00–K99) accounted for 4,939 registered deaths in
Australia in 2008 or 3.4% of all registered deaths. The number and proportion of all
deaths due to diseases of the digestive system have remained consistent since 1999.
Slightly more females (2,510) than males (2,429) died from diseases of the digestive
system in 2008. The median age at death for males (74.2 years) dying from these diseases
was 10 years lower than for females (84.2 years).
Alcoholic liver disease (K70) accounted for 751 deaths, 15% of all deaths due to diseases
of the digestive system. More males than females died of alcoholic liver disease, with a
ratio of 297.4 males per 100 females. The age at death ranged from the 25-34 to 85-94
year age groups. Median age at death for males was 58.3 years, while for females it was
56.3 years.
D I S E A S E S OF TH E
D I G E S T I V E SY S T E M
(K 0 0 - K 9 9 )
(c) Causes of death data for 2008 are preliminary and subject to arevisions process. See Technical Note 2: Causes of Death -Revisions Process.
(d) Data cells with small values have been randomly assigned toprotect the confidentiality of individuals. As a result, some totalswill not equal the sum of their components. Cells with a zero valuehave not been affected by confidentialisation.
— nil or rounded to zero (including null cells)(a) Causes selected are those with 20 or more deaths at the 3 digit
level of ICD-10. (b) 2008 data have been subject to process improvements which
have increased the quality of these data. See Technical Note 1:2008 COD Collection - Process Improvements for furtherinformation.
0.4639337302Other respiratory disorders (J98) —533023Respiratory failure, not elsewhere classified (J96)
0.5692367325Other diseases of the respiratory system (J95-J99)
—664026Pleural effusion, not elsewhere classified (J90) 0.1854540Other diseases of pleura (J90-J94)
—27720Pyothorax (J86) —221111Abscess of lung and mediastinum (J85) —491831Suppurative and necrotic conditions of lower respiratory tract (J85-J86)
0.6901356545Other interstitial pulmonary diseases (J84) —492524Pulmonary oedema (J81) —25817Adult respiratory distress syndrome (J80)
0.7980391589Other respiratory diseases principally affecting the interstitium (J80-J84)
0.81 123507616Pneumonitis due to solids and liquids (J69) 0.11092105Pneumoconiosis due to asbestos and other mineral fibres (J61) 0.91 255513742Lung diseases due to external agents (J60-J70)
0.227319083Bronchiectasis (J47) 0.3438277161Asthma (J45) 3.34 7372 0962 641Other chronic obstructive pulmonary disease (J44) 0.5732265467Emphysema (J43) —291316Unspecified chronic bronchitis (J42) —352213Bronchitis, not specified as acute or chronic (J40)
4.36 2552 8683 387Chronic lower respiratory diseases (J40-J47)
0.11306763Unspecified acute lower respiratory infection (J22) —20119Acute bronchitis (J20)
0.11548074Other acute lower respiratory infections (J20-J22)
1.11 586947639Pneumonia, organism unspecified (J18) 0.1783840Bacterial pneumonia, not elsewhere classified (J15) —25187Influenza, virus not identified (J11)
1.21 7421 031711Influenza and pneumonia (J10-J18)
7.811 2605 3365 924CHAPTER X Diseases of the respiratory system (J00-J99)
%no.no.no.
Proportion
of all
deathsPersonsFemalesMales
Cause of Dea th and ICD Code
SELECTED UNDERLY ING CAUSES (a) , Diseases of the Resp i ra to ry System (J00–J99) —2008(b) (c ) (d )4.9
A B S • CA U S E S OF D E A T H • 3 3 0 3 . 0 • 2 0 0 8 27
CH A P T E R 4 • U N D E R L Y I N G C A U S E OF D E A T H B Y I C D - 1 0 C H A P T E R

Diseases of the intestine (K50–K63) increased from 1,298 deaths in 1999 to 1,698 deaths
in 2008. The majority of deaths (1,247) in 2008 occurred in the 75 to 94 year age group
with a median age of 84.5 years.
Diseases of the oesophagus, stomach and duodenum (K20–K31) was the underlying
cause of 532 deaths. The median age at death was 83.1 years, which was 2.2 years higher
than the median age for all causes of death (80.9 years). The sex ratio for this underlying
cause of death was 97 males per 100 females.
D I S E A S E S OF TH E
D I G E S T I V E SY S T E M
(K 0 0 - K 9 9 ) c o n t i n u e d
28 A B S • CA U S E S OF D E A T H • 3 3 0 3 . 0 • 2 0 0 8
CH A P T E R 4 • U N D E R L Y I N G C A U S E OF D E A T H B Y I C D - 1 0 C H A P T E R

Diseases of the skin and subcutaneous tissue (L00-L99) accounted for 401 deaths in
Australia in 2008. Of these, 219 (55%) were female, and 182 (45%) were male. There
were 171 (43%) deaths due to diseases of the skin and subcutaneous tissue aged
between 85 and 94 years, and a further 128 (32%) aged between 75 and 84 years. The
D I S E A S E S OF TH E SK I N
AN D SU B C U T A N E O U S
T I S S U E ( L 0 0 - L 9 8 )
(c) Causes of death data for 2008 are preliminary and subjectto a revisions process. See Technical Note 2: Causes ofDeath - Revisions Process.
(d) Data cells with small values have been randomly assignedto protect the confidentiality of individuals. As a result,some totals will not equal the sum of their components.Cells with a zero value have not been affected byconfidentialisation.
— nil or rounded to zero (including null cells)(a) Causes selected are those with 20 or more deaths at the 3
digit level of ICD-10.(b) 2008 data have been subject to process improvements
which have increased the quality of these data. SeeTechnical Note 1: 2008 COD Collection - ProcessImprovements for further information.
0.3408245163Other diseases of digestive system (K92) 0.3418252166Other diseases of the digestive system (K90-K93)
—321418Other diseases of pancreas (K86) 0.11368254Acute pancreatitis (K85) 0.11096841Other diseases of biliary tract (K83) 0.11166551Cholecystitis (K81)0.11046044Cholelithiasis (K80) 0.4513296217Disorders of gallbladder, biliary tract and pancreas (K80-K87)
0.116962107Other diseases of liver (K76) —472720Other inflammatory liver diseases (K75)
0.2326131195Fibrosis and cirrhosis of liver (K74)0.119475119Hepatic failure, not elsewhere classified (K72) 0.5751189562Alcoholic liver disease (K70) 1.01 4904851 005Diseases of liver (K70-K77)
—23193Other disorders of peritoneum (K66) —713932Peritonitis (K65)
0.1945836Diseases of peritoneum (K65-K67)
0.11498366Other diseases of intestine (K63)—492623Other diseases of anus and rectum (K62) —30219Other functional intestinal disorders (K59)
0.224716582Diverticular disease of intestine (K57) 0.4515311204Paralytic ileus and intestinal obstruction without hernia (K56) 0.3462285177Vascular disorders of intestine (K55) 1.01 459895564Other diseases of intestines (K55-K63)
0.118911772Other noninfective gastroenteritis and colitis (K52) —261511Ulcerative colitis (K51)—241311Crohn's disease (regional enteritis) (K50)
0.223914594Noninfective enteritis and colitis (K50-K52)
—331914Unspecified abdominal hernia (K46) —362610Diaphragmatic hernia (K44)—381226Inguinal hernia (K40)
0.11559263Hernia (K40-K46)
—381721Other diseases of stomach and duodenum (K31)—251015Gastritis and duodenitis (K29)
0.1894841Peptic ulcer, site unspecified (K27)0.11195663Duodenal ulcer (K26)—693534Gastric ulcer (K25 )
0.11196653Other diseases of oesophagus (K22)—553025Gastro-oesophageal reflux disease (K21)
0.4532270262Diseases of oesophagus, stomach and duodenum (K20-K31)
3.44 9392 5102 429CHAPTER XI Diseases of the digestive system (K00-K93)
Proportion
of all
deathsPersons
Female
Male
SELECTED UNDERLY ING CAUSES (a) , Diseases of the Diges t i ve System (K00–K99) —2008(b) (c ) (d )4.10
A B S • CA U S E S OF D E A T H • 3 3 0 3 . 0 • 2 0 0 8 29
CH A P T E R 4 • U N D E R L Y I N G C A U S E OF D E A T H B Y I C D - 1 0 C H A P T E R

Diseases of the muscles, bones and tendons (M00–M99) in 2008 accounted for 1,179
registered deaths, which represented 0.8% of all deaths registered in Australia. Over the
last ten years, the number of deaths from this cause has increased steadily from 862 in
1999 to 1,179 in 2008, representing an increase from 0.7% of all deaths in 1999 to 0.8% of
all deaths in 2008. In 2008, the number of female deaths (776) was almost twice the
number of male deaths (403) from this cause and continued the trend shown by data
recorded previously.
The median age at death has gradually increased over the last decade for both males and
females. Male median age at death for this cause has increased from 76.8 in 1999 to 81.2
years in 2008. The female median age at death has risen from 82.1 years in 1999 to 85.4
years in 2008.
D I S E A S E S OF TH E
MU S C L E S , BO N E S AN D
TE N D O N S (M 0 0 - M 9 9 )
(c) Causes of death data for 2008 are preliminary and subject to arevisions process. See Technical Note 2: Causes of Death -Revisions Process.
(d) Data cells with small values have been randomly assigned toprotect the confidentiality of individuals. As a result, some totalswill not equal the sum of their components. Cells with a zero valuehave not been affected by confidentialisation.
— nil or rounded to zero (including null cells)(a) Causes selected are those with 20 or more deaths at the 3 digit
level of ICD-10. (b) 2008 data have been subject to process improvements which have
increased the quality of these data. See Technical Note 1: 2008COD Collection - Process Improvements for further information.
—20137Other disorders of skin and subcutaneous tissue, not elsewhere classified (L98) —654025Ulcer of lower limb, not elsewhere classified (L97) —311615Decubitus ulcer (L89)
0.11207149Other disorders of the skin and subcutaneous tissue (L80-L99)
—311417Other local infections of skin and subcutaneous tissue (L08) 0.121011793Cellulitis (L03)0.2259139120Infections of the skin and subcutaneous tissue (L00-L08)
0.3401219182CHAPTER XII Diseases of the skin and subcutaneous tissue (L00-L99)
%no.no.no.
Proportion
of all
deathsPersonsFemalesMales
Cause of Dea th and ICD Code
SELECTED UNDERLY ING CAUSES (a) , Diseases of the Sk in and Subcutaneous Tissue (L00–L98) —2008(b) (c ) (d )4.11
median age at death for all persons was 85.5 years, while the male and female median
age at death were 83.7 years and 87.2 years respectively.
The key cause contributing to the increase over the last 10 years in the number of
registered deaths from Diseases of the skin and subcutaneous tissue was Cellulitis (L03),
which increased from 85 registered deaths in 1999 to 210 registered deaths in 2008. Of
these, 56% were female and 44% were male. The female median age at death of 87.5
years, was 2.8 years higher than the male median age at death of 84.7 years. Persons aged
65 years and over contributed to 94% of deaths due to Cellulitis.
Skin ulcers (L89 and L97) were the underlying cause of 96 registered deaths in 2008, a
decrease from 123 in 1999. Of these, 58% were female and 42% were male. The median
age at death for males dying from Skin ulcers was 84.0 years, 4 years lower than the
female median age at death of 88.0 years.
D I S E A S E S OF TH E SK I N
AN D SU B C U T A N E O U S
T I S S U E ( L 0 0 - L 9 8 )
c o n t i n u e d
30 A B S • CA U S E S OF D E A T H • 3 3 0 3 . 0 • 2 0 0 8
CH A P T E R 4 • U N D E R L Y I N G C A U S E OF D E A T H B Y I C D - 1 0 C H A P T E R

Diseases of the kidney and urinary system (N00–N99) accounted for 3,319 registered
deaths in Australia in 2008, which was 2.3% of all registered deaths. The median age at
death was 85.6 years. More females (1,770) than males (1,549) died of these diseases.
D I S E A S E S OF TH E K I D N E Y
AN D GE N I T O U R I N A R Y
SY S T E M (N 0 0 - N 9 9 )
— nil or rounded to zero (including null cells)(a) Causes selected are those with 20 or more deaths at the 3 digit level of ICD-10. (b) 2008 data have been subject to process improvements which have increased the quality of these data. See Technical Note 1: 2008 COD
Collection - Process Improvements for further information.(c) Causes of death data for 2008 are preliminary and subject to a revisions process. See Technical Note 2: Causes of Death - Revisions Process.(d) Data cells with small values have been randomly assigned to protect the confidentiality of individuals. As a result, some totals will not equal the
sum of their components. It is important to note that cells with a zero value have not been affected by confidentialisation.
0.1774136Osteomyelitis (M86) 0.1944945Other osteopathies (M86-M90)
—463214Disorders of continuity of bone (M84) 0.11048816Osteoporosis without pathological fracture (M81) 0.112110219Osteoporosis with pathological fracture (M80) 0.227322350Disorders of bone density and structure (M80-M85)
0.336827296Osteopathies and chondropathies (M80-M94)
—351619Other disorders of muscle (M62) —512427Disorders of muscles (M60-M63)
—703436Soft tissue disorders (M60-M79)
—37298Other systemic involvement of connective tissue (M35) 0.1897118Systemic sclerosis (M34) —432914Systemic lupus erythematosus (M32) —492326Other necrotizing vasculopathies (M31)
0.224416579Systemic connective tissue disorders (M30-M36)
—281216Other joint disorders, not elsewhere classified (M25) —301416Other joint disorders (M20-M25)
—694920Other arthrosis (M19) 0.1825725Arthrosis (M15-M19)
—20128Other arthritis (M13) —20515Gout (M10)
0.118013248Other rheumatoid arthritis (M06) 0.223815880Inflammatory polyarthropathies (M05-M14)
0.1763244Pyogenic arthritis (M00) 0.1763244Infectious arthropathies (M00-M03)
0.3426261165Arthropathies (M00-M25)
0.81 179776403CHAPTER XIII Diseases of the musculoskeletal system and connective tissue
(M00-M99)
%no.no.no.
Proportion
of all
deathsPersonsFemalesMales
Cause of Dea th and ICD Code
SELECTED UNDERLY ING CAUSES (a) , Diseases of the Musc les , Bones, and Tendons (M00–M99) —2008(b) (c ) (d )4.12
Osteoporosis (M80–M85) accounted for 273 registered deaths in Australia for 2008, with
a median age at death of 88.6 years. More than four times more females (223) than
males (50) died from Osteoporosis in 2008, which was a continuation of the pattern
displayed in previous years' data. The median age at death from this cause for females
has historically been higher than the median age at death for males. This trend persisted
in 2008 with the median age at death for females at 89.2 years and for males at 86.0 years.
D I S E A S E S OF TH E
MU S C L E S , BO N E S AN D
TE N D O N S (M 0 0 - M 9 9 )
c o n t i n u e d
A B S • CA U S E S OF D E A T H • 3 3 0 3 . 0 • 2 0 0 8 31
CH A P T E R 4 • U N D E R L Y I N G C A U S E OF D E A T H B Y I C D - 1 0 C H A P T E R

Due to the small number of deaths attributed to Pregnancy and childbirth (O00-O99),
the following section refers to the period 1999-2008.
Pregnancy and childbirth (O00–O99), as an underlying cause of death, accounted for the
deaths of 6 females in Australia in 2008.
Since 1999, this cause has accounted for a total of 100 registered deaths. From 1999 to
2008, Complications of labour and delivery (O60–O75) and Complications within 6
weeks of delivery (O85–O92) accounted for most deaths related to pregnancy and
childbirth. Due to small numbers, it is difficult to make comparisons over time.
These deaths are spread across the childbearing age range, and cannot be attributed to
any one smaller age group.
PR E G N A N C Y AN D
CH I L D B I R T H (O 0 0 - O 9 9 )
(c) Causes of death data for 2008 are preliminary and subject to arevisions process. See Technical Note 2: Causes of Death - RevisionsProcess.
(d) Data cells with small values have been randomly assigned to protectthe confidentiality of individuals. As a result, some totals will not equalthe sum of their components. Cells with a zero value have not beenaffected by confidentialisation.
— nil or rounded to zero (including null cells)(a) Causes selected are those with 20 or more deaths at the 3 digit level
of ICD-10. (b) 2008 data have been subject to process improvements which have
increased the quality of these data. See Technical Note 1: 2008 CODCollection - Process Improvements for further information.
—63—63Hyperplasia of prostate (N40) 0.181—81Diseases of male genital organs (N40-N51)
0.229821880Other disorders of urinary system (N39) —20812Other disorders of bladder (N32)
0.233223399Other diseases of urinary system (N30-N39)
—532231Other disorders of kidney and ureter, not elsewhere classified (N28) —632736Other disorders of kidney and ureter (N25-N29)
—301416Calculus of kidney and ureter (N20) —311417Urolithiasis (N20-N23)
0.5705404301Unspecified renal failure (N19) 1.01 428708720Chronic renal failure (N18) 0.3461255206Acute renal failure (N17)1.82 5941 3671 227Renal failure (N17-N19)
—23201Drug and heavy-metal-induced tubulo-interstitial and tubular conditions (N14) —553025Obstructive and reflux uropathy (N13) —28208Tubulo-interstitial nephritis, not specified as acute or chronic (N12)
0.11187840Renal tubulo-interstitial diseases (N10-N16)
—25718Unspecified nephritic syndrome (N05) —331815Chronic nephritic syndrome (N03)
0.1863749Glomerular diseases (N00-N08)
2.33 3191 7701 549CHAPTER XIV Diseases of the genitourinary system (N00-N99)
%no.no.no.
Proportion
of all
deathsPersonsFemalesMales
Cause of Dea th and ICD Code
SELECTED UNDERLY ING CAUSES (a) , Diseases of the Kidney and Gen i tou r inary Sys tem(N00– N99) —2008(b) (c ) (d )4.13
Of these causes, 2,594 (78%) were due to Kidney failure (N17–N19). More females died
from this cause than males in 2008, although the difference was small (1,367 females
compared with 1,227 males). The median age at death for Kidney failure was 85.5 years,
4.6 years higher than the median age for all deaths.
D I S E A S E S OF TH E K I D N E Y
AN D GE N I T O U R I N A R Y
SY S T E M (N 0 0 - N 9 9 )
c o n t i n u e d
32 A B S • CA U S E S OF D E A T H • 3 3 0 3 . 0 • 2 0 0 8
CH A P T E R 4 • U N D E R L Y I N G C A U S E OF D E A T H B Y I C D - 1 0 C H A P T E R
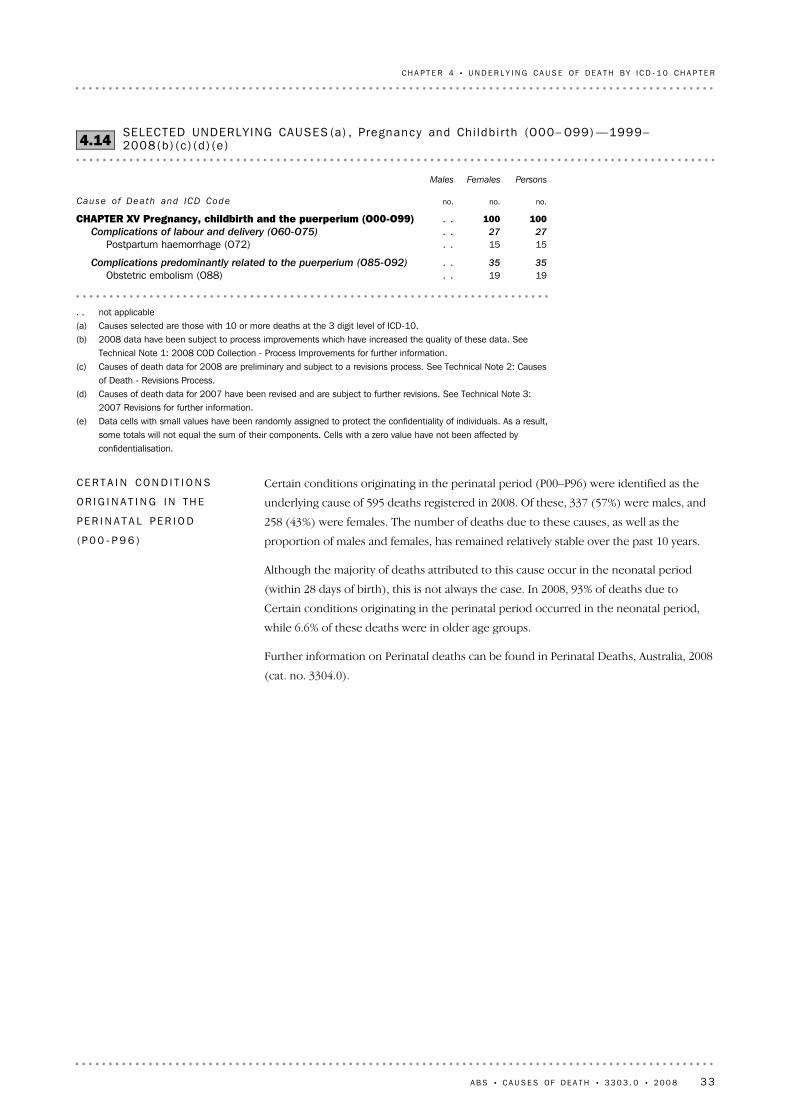
Certain conditions originating in the perinatal period (P00–P96) were identified as the
underlying cause of 595 deaths registered in 2008. Of these, 337 (57%) were males, and
258 (43%) were females. The number of deaths due to these causes, as well as the
proportion of males and females, has remained relatively stable over the past 10 years.
Although the majority of deaths attributed to this cause occur in the neonatal period
(within 28 days of birth), this is not always the case. In 2008, 93% of deaths due to
Certain conditions originating in the perinatal period occurred in the neonatal period,
while 6.6% of these deaths were in older age groups.
Further information on Perinatal deaths can be found in Perinatal Deaths, Australia, 2008
(cat. no. 3304.0).
CE R T A I N CO N D I T I O N S
OR I G I N A T I N G IN TH E
PE R I N A T A L PE R I O D
(P 0 0 - P 9 6 )
. . not applicable(a) Causes selected are those with 10 or more deaths at the 3 digit level of ICD-10. (b) 2008 data have been subject to process improvements which have increased the quality of these data. See
Technical Note 1: 2008 COD Collection - Process Improvements for further information.(c) Causes of death data for 2008 are preliminary and subject to a revisions process. See Technical Note 2: Causes
of Death - Revisions Process.(d) Causes of death data for 2007 have been revised and are subject to further revisions. See Technical Note 3:
2007 Revisions for further information.(e) Data cells with small values have been randomly assigned to protect the confidentiality of individuals. As a result,
some totals will not equal the sum of their components. Cells with a zero value have not been affected byconfidentialisation.
1919. .Obstetric embolism (O88) 3535. .Complications predominantly related to the puerperium (O85-O92)
1515. .Postpartum haemorrhage (O72) 2727. .Complications of labour and delivery (O60-O75)
100100. .CHAPTER XV Pregnancy, childbirth and the puerperium (O00-O99)
no.no.no.
PersonsFemalesMales
Cause of Dea th and ICD Code
SELECTED UNDERLY ING CAUSES (a) , Pregnancy and Chi ldb i r th (O00– O99) —1999–2008(b) (c ) (d ) (e )4.14
A B S • CA U S E S OF D E A T H • 3 3 0 3 . 0 • 2 0 0 8 33
CH A P T E R 4 • U N D E R L Y I N G C A U S E OF D E A T H B Y I C D - 1 0 C H A P T E R
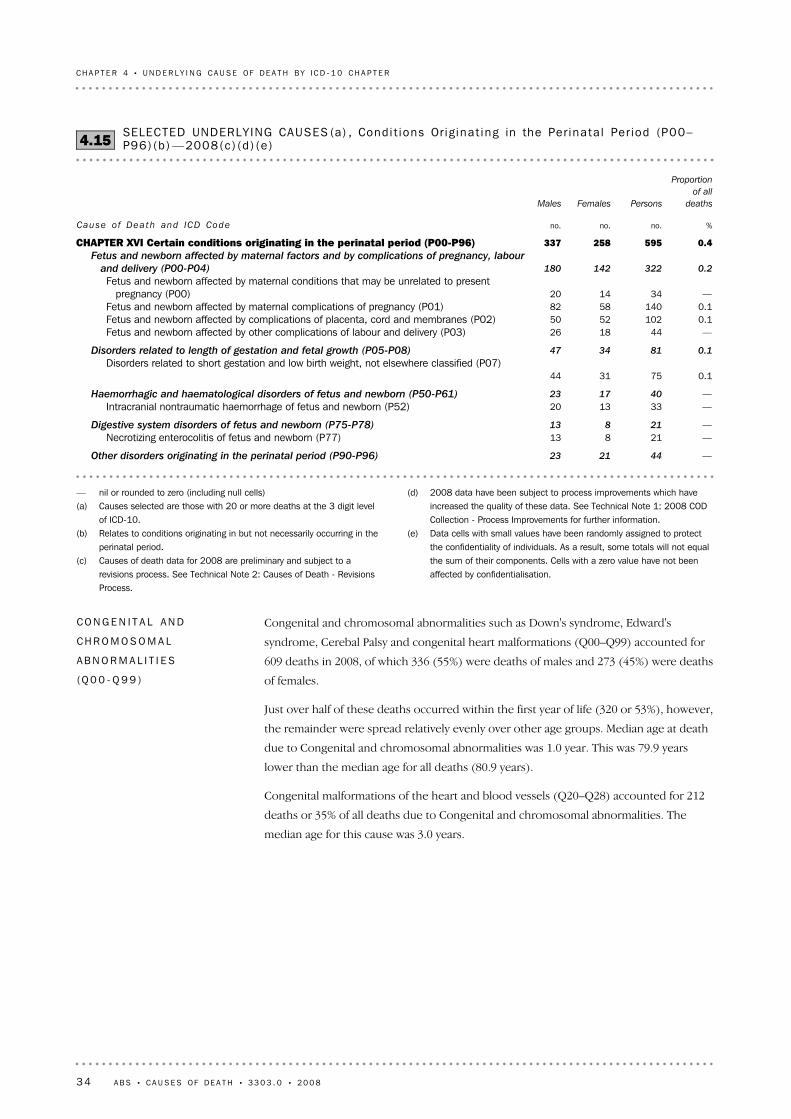
Congenital and chromosomal abnormalities such as Down's syndrome, Edward's
syndrome, Cerebal Palsy and congenital heart malformations (Q00–Q99) accounted for
609 deaths in 2008, of which 336 (55%) were deaths of males and 273 (45%) were deaths
of females.
Just over half of these deaths occurred within the first year of life (320 or 53%), however,
the remainder were spread relatively evenly over other age groups. Median age at death
due to Congenital and chromosomal abnormalities was 1.0 year. This was 79.9 years
lower than the median age for all deaths (80.9 years).
Congenital malformations of the heart and blood vessels (Q20–Q28) accounted for 212
deaths or 35% of all deaths due to Congenital and chromosomal abnormalities. The
median age for this cause was 3.0 years.
CO N G E N I T A L AN D
CH R O M O S O M A L
AB N O R M A L I T I E S
(Q 0 0 - Q 9 9 )
(d) 2008 data have been subject to process improvements which haveincreased the quality of these data. See Technical Note 1: 2008 CODCollection - Process Improvements for further information.
(e) Data cells with small values have been randomly assigned to protectthe confidentiality of individuals. As a result, some totals will not equalthe sum of their components. Cells with a zero value have not beenaffected by confidentialisation.
— nil or rounded to zero (including null cells)(a) Causes selected are those with 20 or more deaths at the 3 digit level
of ICD-10. (b) Relates to conditions originating in but not necessarily occurring in the
perinatal period.(c) Causes of death data for 2008 are preliminary and subject to a
revisions process. See Technical Note 2: Causes of Death - RevisionsProcess.
—442123Other disorders originating in the perinatal period (P90-P96)
—21813Necrotizing enterocolitis of fetus and newborn (P77) —21813Digestive system disorders of fetus and newborn (P75-P78)
—331320Intracranial nontraumatic haemorrhage of fetus and newborn (P52) —401723Haemorrhagic and haematological disorders of fetus and newborn (P50-P61)
0.1753144Disorders related to short gestation and low birth weight, not elsewhere classified (P07)
0.1813447Disorders related to length of gestation and fetal growth (P05-P08)
—441826Fetus and newborn affected by other complications of labour and delivery (P03) 0.11025250Fetus and newborn affected by complications of placenta, cord and membranes (P02) 0.11405882Fetus and newborn affected by maternal complications of pregnancy (P01) —341420
Fetus and newborn affected by maternal conditions that may be unrelated to presentpregnancy (P00)
0.2322142180
Fetus and newborn affected by maternal factors and by complications of pregnancy, labour
and delivery (P00-P04)
0.4595258337CHAPTER XVI Certain conditions originating in the perinatal period (P00-P96)
%no.no.no.
Proportion
of all
deathsPersonsFemalesMales
Cause of Dea th and ICD Code
SELECTED UNDERLY ING CAUSES (a) , Condi t ions Or ig ina t ing in the Per ina ta l Per iod (P00–P96)(b ) —2008(c) (d ) (e )4.15
34 A B S • CA U S E S OF D E A T H • 3 3 0 3 . 0 • 2 0 0 8
CH A P T E R 4 • U N D E R L Y I N G C A U S E OF D E A T H B Y I C D - 1 0 C H A P T E R

Data for Ill defined causes for 2008 have been positively impacted by process
improvements. See Explanatory Notes 67-68 and Technical Note 1: 2008 COD Collection
- Process Improvements for further information. 2008 data are also subject to a revisions
process which will further impact data for Ill defined causes. See Technical Note 2:
Causes of Death - Revisions Process.
Ill defined causes (R00–R99) accounted for 1,243 deaths registered in Australia in 2008.
This represented 0.9% of all registered deaths.
Deaths due to Other ill-defined and unspecified cause of mortality (R99) accounted for
874 deaths, or 70% of all deaths due to Ill-defined causes. The number of deaths coded
to Ill-defined causes are affected by the number of open coronial cases remaining on the
National Coroners Information System (NCIS) at the end of the ABS processing period.
The majority of open cases for which no information was available at the end of
processing have been coded to Other ill-defined and unspecified causes (R99).
I L L DE F I N E D CA U S E S
(R 0 0 - R 9 9 )
(c) Causes of death data for 2008 are preliminary and subject to arevisions process. See Technical Note 2: Causes of Death - RevisionsProcess.
(d) Data cells with small values have been randomly assigned to protectthe confidentiality of individuals. As a result, some totals will not equalthe sum of their components. Cells with a zero value have not beenaffected by confidentialisation.
— nil or rounded to zero (including null cells)(a) Causes selected are those with 20 or more deaths at the 3 digit level
of ICD-10. (b) 2008 data have been subject to process improvements which have
increased the quality of these data. See Technical Note 1: 2008 CODCollection - Process Improvements for further information.
—261313Edwards' syndrome and Patau's syndrome (Q91) —633528Down's syndrome (Q90)
0.11095851Chromosomal abnormalities, not elsewhere classified (Q90-Q99)
—411427Other congenital malformations, not elsewhere classified (Q89) —201010Other specified congenital malformation syndromes affecting multiple systems (Q87)
0.1763145Other congenital malformations (Q80-Q89)
—24816Congenital malformations of the musculoskeletal system, not elsewhere classified (Q79)
—381622Congenital malformations and deformations of the musculoskeletal system (Q65-Q79)
—361719Cystic kidney disease (Q61) —522626Congenital malformations of the urinary system (Q60-Q64)
—22814Congenital malformations of great arteries (Q25) —703337Other congenital malformations of heart (Q24) —371621Congenital malformations of aortic and mitral valves (Q23) —422121Congenital malformations of cardiac septa (Q21)
0.121298114Congenital malformations of the circulatory system (Q20-Q28)
—23716Spina bifida (Q05) —311120Other congenital malformations of brain (Q04)
0.1933558Congenital malformations of the nervous system (Q00-Q07)
0.4609273336CHAPTER XVII Congenital malformations, deformations and chromosomal
abnormalities (Q00-Q99)
%no.no.no.
Proportion
of all
deathsPersonsFemalesMales
Cause of Dea th and ICD Code
SELECTED UNDERLY ING CAUSES (a) , Congen i ta l and Chromosomal Abnormal i t ies (Q00–Q99) —2008(b) (c ) (d )4.16
A B S • CA U S E S OF D E A T H • 3 3 0 3 . 0 • 2 0 0 8 35
CH A P T E R 4 • U N D E R L Y I N G C A U S E OF D E A T H B Y I C D - 1 0 C H A P T E R

Data for External causes of death for 2008 have been positively impacted by process
improvements. See Technical Note 1: 2008 COD Collection - Process Improvements for
further information. 2008 data are also subject to a revisions process which will further
impact data for Ill defined causes. See Technical Note 2: Causes of Death - Revisions
Process for further information.
External causes of death relate to cases where the underlying cause of death is
determined to be one of a group of causes external to the body (for example Intentional
self-harm [Suicide], transport accidents, falls, poisoning etc).
In 2008, External causes accounted for 8,804 deaths, or 6.1% of all registered deaths. The
standardised death rate was 39.2 per 100,000 of population in 2008, a decrease from 44.6
per 100,000 population in 1999. Males were more likely to die from External causes than
females in 2008. The standardised death rate for males was 56.1 per 100,000 compared
with 23.3 females per 100,000.
EX T E R N A L CA U S E S
(V 0 1 - Y 9 8 )
(d) Causes of death data for 2008 are preliminary and subject to arevisions process. See Technical Note 2: Causes of Death - RevisionsProcess.
(e) Data cells with small values have been randomly assigned to protectthe confidentiality of individuals. As a result, some totals will not equalthe sum of their components. It is important to note that cells with azero value have not been affected by confidentialisation.
— nil or rounded to zero (including null cells)(a) Causes selected are those with 20 or more deaths at the 3 digit level
of ICD-10. (b) For further information relating to this data, see Explanatory Notes
67-68.(c) 2008 data have been subject to process improvements which have
increased the quality of these data. See Technical Note 1: 2008 CODCollection - Process Improvements for further information.
0.6874339535Other ill-defined and unspecified causes of mortality (R99)
—592534Sudden infant death syndrome (R95) 0.6935365570Ill-defined and unknown causes of mortality (R95-R99)
—684424Other general symptoms and signs (R68) 0.11068224Senility (R54) —27225Malaise and fatigue (R53)
0.223317558General symptoms and signs (R50-R69)
—402911Other symptoms and signs involving the circulatory and respiratory systems (R09) —493712Symptoms and signs involving the circulatory and respiratory systems (R00-R09)
0.91 243590653CHAPTER XVIII Symptoms, signs and abnormal clinical and laboratory findings, not
elsewhere classified (R00-R99)
%no.no.no.
Proportion
of all
deathsPersonsFemalesMales
Cause of Dea th and ICD Code
SELECTED UNDERLY ING CAUSES (a) , I l l Def ined Causes (R00– R99)(b ) —2008(c) (d ) (e )4.17
In 2008, there were 59 deaths identified as being due to Sudden infant death syndrome
(SIDS) (R95). In processing Causes of Death, the ABS will only code a death to SIDS if
specifically mentioned on the death certificate. The number of open coronial cases could
potentially include deaths which would be determined as SIDS deaths when closed. For
further information, see Technical Note 2: Causes of Death - Revisions Process.
For the past 10 years, typically more males have died from SIDS than females. This trend
continued in 2008, with 34 male deaths compared to 25 female deaths. The majority of
these deaths occurred in the period between 28 days and 1 year of age, with 44 (75%) of
infants with SIDS as the underlying cause of death in this age range in 2008.
I L L DE F I N E D CA U S E S
(R 0 0 - R 9 9 ) c o n t i n u e d
36 A B S • CA U S E S OF D E A T H • 3 3 0 3 . 0 • 2 0 0 8
CH A P T E R 4 • U N D E R L Y I N G C A U S E OF D E A T H B Y I C D - 1 0 C H A P T E R
In 2008, the median age at death from these causes was 52.3 years. The median age at
death for External causes was considerably less than the median age of 80.9 years for all
registered deaths in 2008. The median age at death for males dying of External causes
was 46.8 years, with the median age at death for females 73.8 years.
Consistent with previous years, just over two-thirds of the total number of deaths
resulting from External causes were males (5,819). The difference between the number
of male and female deaths was most apparent amongst the 20-44 year age group, with
2,341 male deaths compared to 635 female deaths.
EX T E R N A L CA U S E S
(V 0 1 - Y 9 8 ) c o n t i n u e d
A B S • CA U S E S OF D E A T H • 3 3 0 3 . 0 • 2 0 0 8 37
CH A P T E R 4 • U N D E R L Y I N G C A U S E OF D E A T H B Y I C D - 1 0 C H A P T E R

Transport accidents (V01–V99, Y85) accounted for 1,402 deaths registered in 2008. This
represented 1.0% of all registered deaths in 2008, and 16% of all External causes of death.
Of these, 183 deaths were of pedestrians (V01-V09), 226 deaths were of motorcycle
riders (V20-V29) and 742 deaths were of occupants of a car (V40-V49).
TR A N S P O R T AC C I D E N T S
(V 0 1 - V 9 9 , Y8 5 )
(e) Includes Sequelae of transport accidents (Y85). Care needs to be takenin interpreting figures relating to Transport accidents for 2008. SeeExplanatory Note 69 for further information.
(f) Includes Sequelae of suicide (Y87.0). Care needs to be taken ininterpreting figures relating to Suicide due to limitations of the data.See Explanatory Notes 72-75.
(g) Includes Sequelae of assault (Y87.1). Care needs to be taken ininterpreting figures relating to assault. See Explanatory Notes 70-71 forfurther details.
(h) Includes Sequelae of events of undetermined intent (Y87.2). For furtherinformation relating to this data, see Explanatory Note 76.
— nil or rounded to zero (including null cells)(a) Causes selected are those with 20 or more deaths at the 3 digit level
of ICD-10. (b) 2008 data have been subject to process improvements which have
increased the quality of these data. See Technical Note 1: 2008 CODCollection - Process Improvements for further information.
(c) Causes of death data for 2008 are preliminary and subject to arevisions process. See Technical Note 2: Causes of Death - RevisionsProcess.
(d) Data cells with small values have been randomly assigned to protectthe confidentiality of individuals. As a result, some totals will not equalthe sum of their components. Cells with a zero value have not beenaffected by confidentialisation.
0.11265769Sequelae of other accidents (Y86) 0.11566591Sequelae of external causes of morbidity and mortality (Y85-Y89)
0.11699277
Surgical operation and other surgical procedures as the cause of abnormal reaction ofthe patient, or of later complication, without mention of misadventure at the time ofthe procedure (Y83)
—482721Drugs, medicaments and biological substances causing adverse effects in therapeutic
use (Y40-Y59)
0.2240128112Complications of medical and surgical care (Y40-Y84, Y88)
0.81 163330833Undetermined Intent (Y10-Y34, Y87.2)(h)0.120579126Assault (X85-Y09, Y87.1)(g)1.52 1914811 710Intentional Self Harm (X60-X84, Y87.0)(f)2.53 5608902 670Other external causes of mortality (X60-Y36)
0.6874486388Exposure to unspecified factor (X59) 0.6878489389Accidental exposure to other and unspecified factors (X58-X59)0.4622177445Accidental poisoning by and exposure to noxious substances (X40-X49)
—361719Exposure to excessive natural cold (X31) —582632Exposure to forces of nature (X30-X39)
—471334Exposure to uncontrolled fire in building or structure (X00) 0.1722250Exposure to smoke, fire and flames (X00-X09)
0.11084464Inhalation and ingestion of other objects causing obstruction of respiratory tract (W80) —582434Inhalation and ingestion of food causing obstruction of respiratory tract (W79) —251015Inhalation of gastric contents (W78)
0.120881127Other accidental threats to breathing (W75-W84)
—41833Unspecified drowning and submersion (W74) —31428Drowning and submersion following fall into natural water (W70) —44142Drowning and submersion while in natural water (W69) —21615Drowning and submersion while in swimming-pool (W67)
0.115929130Accidental drowning and submersion (W65-W74)
—26224Struck by thrown, projected or falling object (W20) 0.185679Exposure to inanimate mechanical forces (W20-W49)0.91 348703645Falls (W00-W19)2.43 4691 5441 925Other external causes of accidental injury (W00-X59)
1.01 4023661 036Transport Accidents (V01-V99, Y85)(e)6.18 8042 9855 819CHAPTER XX External causes of morbidity and mortality (V01-Y98)
%no.no.no.
Proportion
of all
deathsPersonsFemalesMales
Cause of Dea th and ICD Code
SELECTED UNDERLY ING CAUSES (a) , Externa l Causes (V01– Y98) —2008(b) (c ) (d )4.18
38 A B S • CA U S E S OF D E A T H • 3 3 0 3 . 0 • 2 0 0 8
CH A P T E R 4 • U N D E R L Y I N G C A U S E OF D E A T H B Y I C D - 1 0 C H A P T E R

Falls (W00–W19) accounted for 1,348 deaths registered in 2008. This represented 0.9%
of all registered deaths in 2008, and 15% of all External causes of death. Falls have
increased by 54% when compared to five years ago (873 in 2004).
Falls was one of the few categories within External causes in 2008 with more females
than males (703 females, compared with 645 males). This trend can also be observed in
preceding years. The median age at death for Falls was 85.5 years, which was
considerably higher than the median age at death of 52.3 for all External causes. Of all
deaths due to Falls, 87% were of people aged 70 years or more.
FA L L S (W 0 0 - W 1 9 )
(d) Data cells with small values have been randomly assigned toprotect the confidentiality of individuals. As a result, some totalswill not equal the sum of their components. Cells with a zerovalue have not been affected by confidentialisation.
(e) Includes Sequelae of transport accidents (Y85). Care needs tobe taken in interpreting figures relating to transport accidents for2008. See Explanatory Note 69 for further information.
— nil or rounded to zero (including null cells)(a) Causes selected are those with 20 or more deaths at the 3 digit
level of ICD-10. (b) 2008 data have been subject to process improvements which
have increased the quality of these data. See Technical Note 1:2008 COD Collection - Process Improvements for furtherinformation.
(c) Causes of death data for 2008 are preliminary and subject to arevisions process. See Technical Note 2: Causes of Death -Revisions Process.
—42933Accident to powered aircraft causing injury to occupant (V95) —44935Air and space transport accidents (V95-V97)
—23815Motor- or nonmotor-vehicle accident, type of vehicle unspecified (V89) —541341Other land transport accidents (V80-V89)
0.11374295Car occupant injured in noncollision transport accident (V48) 0.231293219Car occupant injured in collision with fixed or stationary object (V47) 0.1842856Car occupant injured in collision with heavy transport vehicle or bus (V44) 0.119474120Car occupant injured in collision with car, pick-up truck or van (V43) 0.5742240502Car occupant injured in transport accident (V40-V49)
—36134Motorcycle rider injured in noncollision transport accident (V28) 0.173568Motorcycle rider injured in collision with fixed or stationary object (V27) —22119Motorcycle rider injured in collision with heavy transport vehicle or bus (V24)
0.174668Motorcycle rider injured in collision with car, pick-up truck or van (V23) 0.222619207Motorcycle rider injured in transport accident (V20-V29)
—24717Pedestrian injured in collision with heavy transport vehicle or bus (V04) 0.11364492Pedestrian injured in collision with car, pick-up truck or van (V03) 0.118358125Pedestrian injured in transport accident (V01-V09)
1.01 4023661 036Transport accidents (V01-V99, Y85)(e)
%no.no.no.
Proportion
of all
deathsPersonsFemalesMales
Cause of Dea th and ICD Code
SELECTED UNDERLY ING CAUSES (a) , Transpor t Acc iden ts (V01– V99) —2008(b) (c ) (d )4.19
As with most other External causes, more males than females died from Transport
accidents in 2008 (1,036 compared with 366). For males, 1.4% of total male deaths
registered in 2008 were caused by Transport accidents. This was compared with only
0.5% of all female deaths. Males also had a lower median age at death than females, with
a median age of 36.2 years for males compared with 45.2 years for females. Of all male
deaths from External causes, 18% were attributed to Transport accidents, predominantly
amongst males aged 15-44 years. Males in this age group accounted for 60% of all male
deaths due to Transport accidents.
For information on quality of data on Transport accidents, refer to Explanatory Note 69.
TR A N S P O R T AC C I D E N T S
(V 0 1 - V 9 9 , Y8 5 )
c o n t i n u e d
A B S • CA U S E S OF D E A T H • 3 3 0 3 . 0 • 2 0 0 8 39
CH A P T E R 4 • U N D E R L Y I N G C A U S E OF D E A T H B Y I C D - 1 0 C H A P T E R

(c) Causes of death data for 2008 are preliminary and subject to arevisions process. See Technical Note 2: Causes of Death - RevisionsProcess.
(d) Data cells with small values have been randomly assigned to protectthe confidentiality of individuals. As a result, some totals will not equalthe sum of their components. Cells with a zero value have not beenaffected by confidentialisation.
— nil or rounded to zero (including null cells)(a) Causes selected are those with 20 or more deaths at the 3 digit level
of ICD-10. (b) 2008 data have been subject to process improvements which have
increased the quality of these data. See Technical Note 1: 2008 CODCollection - Process Improvements for further information.
—521141Accidental poisoning by and exposure to alcohol (X45) 0.230296206
Accidental poisoning by and exposure to other and unspecified drugs, medicaments andbiological substances (X44)
0.117333140Accidental poisoning by and exposure to narcotics and psychodysleptics (hallucinogens), not
elsewhere classified (X42)
—582632Accidental poisoning by and exposure to antiepileptic, sedative-hypnotic, antiparkinsonism and
psychotropic drugs, not elsewhere classified (X41)
0.4622177445Accidental poisoning by and exposure to noxious substances (X40-X49)
%no.no.no.
Proportion
of all
deathsPersonsFemalesMales
Cause of Dea th and ICD Code
SELECTED UNDERLY ING CAUSES (a) , Acc iden ta l Poison ing (X40– X49) —2008(b) (c ) (d )4.21
Accidental poisoning (X40–X49) accounted for 622 deaths registered in 2008. This
represented 0.4% of all registered death 2008, and 7.1% of all External causes of death.
More than twice as many males as females died from Accidental poisoning in 2008, with
445 male and 177 female deaths. The median age at death for Accidental poisoning was
39.7 years. Median age at death for males was 38.1 years, compared with 45.6 years for
females.
AC C I D E N T A L PO I S O N I N G
(X 4 0 - X 4 9 )
(c) Causes of death data for 2008 are preliminary andsubject to a revisions process. See Technical Note 2:Causes of Death - Revisions Process.
(d) Data cells with small values have been randomlyassigned to protect the confidentiality of individuals. Asa result, some totals will not equal the sum of theircomponents. Cells with a zero value have not beenaffected by confidentialisation.
— nil or rounded to zero (including null cells)(a) Causes selected are those with 20 or more deaths at
the 3 digit level of ICD-10.(b) 2008 data have been subject to process
improvements which have increased the quality ofthese data. See Technical Note 1: 2008 CODCollection - Process Improvements for furtherinformation.
0.6792446346Unspecified fall (W19) —331815Other fall on same level (W18) —35131Fall from, out of or through building or structure (W13) —26122Fall on and from ladder (W11) —522428Fall on and from stairs and steps (W10) —211011Fall involving chair (W07)—291811Fall involving bed (W06)
0.2316165151Fall on same level from slipping, tripping and stumbling (W01) 0.91 348703645Falls (W00-W19)
%no.no.no.
Proportion
of all
deathsPersonsFemalesMales
Cause of Dea th and ICD Code
SELECTED UNDERLY ING CAUSES (a) , Fa l l s (W00– W19) —2008(b) (c ) (d )4.20
40 A B S • CA U S E S OF D E A T H • 3 3 0 3 . 0 • 2 0 0 8
CH A P T E R 4 • U N D E R L Y I N G C A U S E OF D E A T H B Y I C D - 1 0 C H A P T E R

Care should be taken in using and interpreting Suicide data contained in this publication.
For further information refer to Explanatory Notes 72-75.
The implementation of process improvements for 2008 preliminary data has resulted in
improved quality in relation to assigning unspecified cause codes to coroner certified
deaths. As a large number of coroner cases are due to External causes of death, these
process improvements have had the effect of improving these data, including Suicide
data. See Technical Note 1: 2008 COD Collection - Process Improvements for further
information.
There were 2,191 deaths coded to Suicide (X60–X84, Y87.0) in 2008. Deaths from
Suicide represented 1.5% of all registered deaths and 25% of all External causes of death
in 2008. More than three times as many males as females died from Suicide in 2008,
continuing the trend of the 10 years since 1999. The median age at death for Suicide was
42.7 years. Median age at death for males was 42.5 years, compared with 43.5 years for
females.
For further information on deaths due to Suicide, see Chapter 6 in this publication.
I N T E N T I O N A L SE L F - H A R M
[S U I C I D E ]
( X 6 0 - X 8 4 , Y 8 7 . 0 )
— nil or rounded to zero (including null cells)(a) Causes selected are those with 20 or more deaths at the 3 digit level of ICD-10. (b) 2008 data have been subject to process improvements which have increased the quality of
these data. See Technical Note 1: 2008 COD Collection - Process Improvements for furtherinformation.
(c) Causes of death data for 2008 are preliminary and subject to a revisions process. SeeTechnical Note 2: Causes of Death - Revisions Process.
(d) Data cells with small values have been randomly assigned to protect the confidentiality ofindividuals. As a result, some totals will not equal the sum of their components. Cells with azero value have not been affected by confidentialisation.
(e) Includes Sequelae of assault (Y87.1). Care needs to be taken in interpreting figures relatingto assault. See Explanatory Notes 70-71 for further details.
—251312Assault by unspecified means (Y09) —35728Assault by bodily force (Y04) —702842Assault by sharp object (X99)
0.120579126Assault (X85-Y09, Y87.1)(e)
%no.no.no.
Proportion
of all
deathsPersonsFemalesMales
Cause of Dea th and ICD Code
SELECTED UNDERLY ING CAUSES (a) , Assau l t (X85–Y09) —2008(b) (c ) (d )4.22
Assault (X85–Y09, Y87.1) accounted for 205 deaths in 2008. The deaths from Assault
represented 0.1% of all registered deaths and 2.3% of all External causes of death in 2008.
Almost twice as many males as females died from Assault in 2008, continuing the trend of
the 10 years since 1999. The median age at death for Assault was 40.1 years. Median age
at death for males was 39.7 years, compared with 40.4 years for females.
Cause of Death statistics for deaths due to assault may differ from other sources of data
due to differences in scope and coverage, but also due to the impact of open coroners
cases on ABS data. See Explanatory Notes 70-71 for further information.
AS S A U L T
( X 8 5 - Y 0 9 , Y 8 7 . 1 )
A B S • CA U S E S OF D E A T H • 3 3 0 3 . 0 • 2 0 0 8 41
CH A P T E R 4 • U N D E R L Y I N G C A U S E OF D E A T H B Y I C D - 1 0 C H A P T E R

(d) Data cells with small values have been randomly assigned to protectthe confidentiality of individuals. As a result, some totals will not equalthe sum of their components. It is important to note that cells with azero value have not been affected by confidentialisation.
(e) Includes Sequelae of suicide (Y87.0). Care needs to be taken ininterpreting figures relating to Suicide due to limitations of the data, seeExplanatory Notes 72-75.
— nil or rounded to zero (including null cells)(a) Causes selected are those with 20 or more deaths at the 3 digit level
of ICD-10. (b) 2008 data have been subject to process improvements which have
increased the quality of these data. See Technical Note 1: 2008 CODCollection - Process Improvements for further information.
(c) Causes of death data for 2008 are preliminary and subject to arevisions process. See Technical Note 2: Causes of Death - RevisionsProcess.
—351322Intentional self-harm by unspecified means (X84) —20614Intentional self-harm by crashing of motor vehicle (X82) —611348Intentional self-harm by jumping or lying before moving object (X81)
0.11213487Intentional self-harm by jumping from a high place (X80) —431231Intentional self-harm by sharp object (X78) —51546Intentional self-harm by other and unspecified firearm discharge (X74)
0.11041100Intentional self-harm by rifle, shotgun and larger firearm discharge (X73)—451233Intentional self-harm by drowning and submersion (X71)
0.81 151204947Intentional self-harm by hanging, strangulation and suffocation (X70) 0.222033187Intentional self-poisoning by and exposure to other gases and vapours (X67) 0.11708981
Intentional self-poisoning by and exposure to other and unspecified drugs, medicaments andbiological substances (X64)
—23518Intentional self-poisoning by and exposure to narcotics and psychodysleptics (hallucinogens),
not elsewhere classified (X62)
—572334Intentional self-poisoning by and exposure to antiepileptic, sedative-hypnotic, antiparkinsonism
and psychotropic drugs, not elsewhere classified (X61)
1.52 1914811 710Intentional self-harm (X60-X84, Y87.0)(e)
%no.no.no.
Proportion
of all
deathsPersonsFemalesMales
Cause of Dea th and ICD Code
SELECTED UNDERLY ING CAUSES (a) , In tent iona l Sel f - Harm (Su ic ide) (X60– X84,X87.0) —2008(b) (c ) (d )4.23
42 A B S • CA U S E S OF D E A T H • 3 3 0 3 . 0 • 2 0 0 8
CH A P T E R 4 • U N D E R L Y I N G C A U S E OF D E A T H B Y I C D - 1 0 C H A P T E R

CHAP T E R 5 MU L T I P L E CA U S E S OF DE A T H . . . . . . . . . . . . . . . . . . . . . .
In 2008, Malignant cancers (C00-C97) contributed to 32.8% (47,179) of all deaths as
either an underlying or multiple cause. There were mentions of 59,205 Malignant cancers
reported in 2008.
Ischaemic heart diseases (I20-I25) which includes angina, heart attacks, and blocked
arteries of the heart, were found to contribute to 27.6% of all deaths as either an
underlying or multiple cause.
The following table lists selected causes of death, both underlying and associated causes,
appearing on death certificates for deaths registered in 2008.
Selected Mult iple Causes
For the 143,946 deaths registered in Australia in 2008, there were 466,538 causes
mentioned, giving a mean of 3.2 causes per death. In 18% of all deaths, only one cause
was reported, while 39% of deaths were reported with three or more causes. The mean
number of causes reported per death varies with age, sex and underlying cause of death.
Number of Mult ip le
Causes
Further information on multiple cause of death is presented in the datacubes associated
with this publication. These include the number of associated causes for all 3-digit
underlying causes, as well as the number of mentions of each cause at the 3-digit level of
ICD-10.
DA T A CU B E S
Multiple causes of death include all causes and conditions reported on the death
certificate (i.e. both underlying and associated causes; see Glossary for further details).
Deaths due to External causes are those which occur as a result of accidents, poisonings
and/or violence. They are classified according to the event, leading to the fatal injury,
such as an accidental fall. Multiple cause data for External causes include the nature of
injury or poisoning, as well as any other causes reported on the death certificate.
Data for 2008 have been positively impacted by process improvements. See Technical
Note 1: 2008 COD Collection - Process Improvements for further information. These data
are also subject to a revisions process. See Technical Note 2: Causes of Death - Revisions
Process for further information.
OV E R V I E W
A B S • CA U S E S OF D E A T H • 3 3 0 3 . 0 • 2 0 0 8 43

Influenza and pneumonia (J10-J18) was identified as the underlying cause for 1,742
deaths in 2008. In 46.8% of cases, Influenza and pneumonia were reported alone and
were typically the least likely of the selected causes to be reported with other associated
causes.
In contrast, Diabetes (E10-E14) was reported alone as the underlying cause in only 1.0%
of the 4,191 deaths attributed to this cause. It was reported more frequently with the
associated causes of Ischaemic heart diseases (I20-I25) including angina, heart attacks
and blocked arteries of the heart (50.8%) and Hypertensive diseases (I10-I15, 35%).
The following table illustrates relationships between the various causes of death in 2008.
Relat ionships between
Mult ip le Causes
— nil or rounded to zero (including null cells)(a) Number of deaths and percentages may add to more than totals because a death certificate can report more than one
leading multiple cause.(b) 2008 data have been subject to process improvements which have increased the quality of these data. See Technical Note
1: 2008 COD Collection - Process Improvements for further information.(c) Causes of death data for 2008 are preliminary and subject to a revisions process. See Technical Note 2: Causes of Death -
Revisions Process.(d) Data cells with small values have been randomly assigned to protect the confidentiality of individuals. As a result, some totals
will not equal the sum of their components. Cells with a zero value have not been affected by confidentialisation.(e) See Explanatory Note 65 for further information on data relating to Dementia.(f) Includes Sequelae of suicide (Y87.0). Care needs to be taken in interpreting figures relating to Suicide due to limitations of
the data, see Explanatory Notes 72-75.(g) Includes Sequelae of transport accidents (Y85). Care needs to be taken in interpreting figures relating to transport accidents
for 2008. See Explanatory Note 69 for further information.
2.71.01 3840.91 325Land transport accidents (V01-V89, Y850)(g)2.71.52 1981.52 191Suicides (X60-X84, Y870)(f)4.513.819 8741.31 824Hypertensive diseases (I10-I15)2.013.319 0751.21 742Influenza and pneumonia (J10-J18)3.713.719 6632.23 224
Diseases of the kidney and urinarysystem (N00-N39)
3.214.621 0352.33 360Heart failure (I50, I51)4.410.014 4612.94 191Diabetes (E10-E14)3.710.715 3524.36 255Chronic lower respiratory diseases (J40-J47)3.113.920 0075.78 171
Dementia and Alzhiemer'sdisease (F01-F03, G30)(e)
3.115.021 6588.311 973Strokes (I60-I69)3.627.639 78516.423 665Ischaemic heart diseases (I20-I25)2.532.847 17928.741 341Malignant cancer (C00-C97)3.2—143 946—143 946All Causes
no.%no.%no.
Mean
causes
per death
Proportion
of total
deathsMultiple
Proportion
of total
deathsUnderlying
MULTIPLE CAUSEUNDERLYING CAUSE
Cause of dea th and ICD code
SELECTED MULTIPLE CAUSES OF DEATH (a) —2008(b) (c ) (d )5.1
44 A B S • CA U S E S OF D E A T H • 3 3 0 3 . 0 • 2 0 0 8
CH A P T E R 5 • MU L T I P L E CA U S E S OF D E A T H

(d) Data cells with small values have been randomly assigned to protect theconfidentiality of individuals. As a result, some totals will not equal thesum of their components. Cells with a zero value have not beenaffected by confidentialisation.
(e) Includes angina, heart attacks and blocked arteries of the heart.(f) Includes asthma, bronchitis and emphysema.
(a) This table presents data for selected causes only. Therefore numbersand percentages due to reporting of underlying cause with selectedassociated causes do not add to totals.
(b) 2008 data have been subject to process improvements which haveincreased the quality of these data. See Technical Note 1: 2008 CODCollection - Process Improvements for further information.
(c) Causes of death data for 2008 are preliminary and subject to arevisions process. See Technical Note 2: Causes of Death - RevisionsProcess.
7.319.68.41.26.24.41 824Hypertensive diseases
(I10-I15)
1.92.71.46.41.446.81 742Influenza and pneumonia
(J10-J18)
5.610.87.224.65.96.73 224
Diseases of the kidney &urinary system (N00-N39)
10.111.28.21.44.312.53 360Heart failure (I50-I51)6.714.421.950.86.41.04 191Diabetes (E10-E14)
100.07.75.121.28.16.06 255Chronic lower respiratory
diseases (J40-J47)(f)
3.3100.010.811.34.610.98 171
Dementia & Alzheimer'sdisease (F01-F03, G30)
3.818.3100.012.85.214.311 973Strokes (I60-I69)10.111.39.7100.06.710.823 665
Ischaemic heart diseases(I20-I25)(e)
6.63.23.78.9100.035.341 341Cancers (C00-C97)10.713.915.027.632.817.6143 946All Causes
%%%%%%no.
Chronic lower
respiratory
diseases
(J40-J47)(f)
Dementia &
Alzheimer's
disease
(F01-F03,
G30)
Strokes
(I60-I69)
Ischaemic
heart disease
(I20-I25)(e)Cancers
(C00-C97)
REPORTED WITH SELECTED ASSOCIATED CAUSEREPORTEDALONE
UNDERLYINGCAUSE
Cause of Dea th and ICD code
SELECTED UNDERLY ING CAUSES WITH ASSOCIATED CAUSE (a) —2008(b) (c ) (d )5.2
A B S • CA U S E S OF D E A T H • 3 3 0 3 . 0 • 2 0 0 8 45
CH A P T E R 5 • MU L T I P L E CA U S E S OF D E A T H

In 2008, there were 14,684 deaths where External causes (V01-Y98) contributed to the
death as a multiple cause. There was a mean of 3.5 causes coded for each of the 8,804
deaths with External causes as the underlying cause of death.
Transport accidents (V01-V99, Y85) accounted for 16% of all injuries with an External
cause as the underlying cause of death, with 37% of these injuries being to the head or
thorax (S00-S09, S20-S29). Suicide (X60-X84, Y87.0) accounted for 25% of total injuries
with an External causes as the underlying cause of death, and of these, Asphyxiation
(T71) was the most common injury (53%).
Care should be taken in interpreting numbers of Suicide deaths. For further information
on 2008 Suicide data, see Explanatory Notes 72-75, Technical Note 1: 2008 COD
Collection - Process Improvements and Chapter 6 of this publication.
External Causes
(c) Causes of death data for 2008 are preliminary and subject to arevisions process. See Technical Note 2: Causes of Death -Revisions Process.
(d) Data cells with small values have been randomly assigned toprotect the confidentiality of individuals. As a result, some totals willnot equal the sum of their components. Cells with a zero value havenot been affected by confidentialisation.
(e) Includes angina, heart attacks and blocked arteries of the heart.(f) Includes asthma, bronchitis and emphysema.
(a) This table presents data for selected causes only. Thereforenumbers and percentages due to reporting of underlying cause withselected associated causes do not add to totals.
(b) 2008 data have been subject to process improvements which haveincreased the quality of these data. See Technical Note 1: 2008COD Collection - Process Improvements for further information.
100.011.132.139.19.6Hypertensive diseases (I10-I15)1.8100.04.14.91.8Influenza and pneumonia (J10-J18)3.615.2100.023.57.8Diseases of the kidney & urinary system (N00-N39)7.023.022.6100.07.3Heart failure (I50-I51)
35.09.031.021.0100.0Diabetes (E10-E14) 10.134.410.317.67.0Chronic lower respiratory diseases (J40-J47)(f)11.235.111.67.47.3Dementia & Alzheimer's disease (F01-F03, G30)29.012.86.65.77.8Strokes (I60-I69)21.37.413.927.511.5Ischaemic heart diseases (I20-I25)(e)
6.77.07.73.76.3Cancers (C00-C97)13.813.313.714.610.0All Causes
%%%%%
Hypertensive
diseases
(I10-I15)
Influenza
and
pneumonia
(J10-J18)
Diseases of
the kidney &
urinary system
Heart
failure
(I50-I51)
Diabetes
(E10-E14)
REPORTED WITH SELECTED ASSOCIATED CAUSE continued
Cause of Dea th and ICD code
SELECTED UNDERLY ING CAUSES WITH ASSOCIATED CAUSE (a) —2008(b) (c ) (d ) co n t i n u e d5.2
46 A B S • CA U S E S OF D E A T H • 3 3 0 3 . 0 • 2 0 0 8
CH A P T E R 5 • MU L T I P L E CA U S E S OF D E A T H

CHAP T E R 6 SU I C I D E S . . . . . . . . . . . . . . . . . . . . . . . . . . . . . . . . . . . . . . . . . . . . .
External causes of death are required to be examined by a Coroner, who investigates
both the mechanism by which a person died, and the intention of the injury (whether
accidental, intentional or assault). For a death to be determined a Suicide, it must be
established by coronial enquiry that the death resulted from a deliberate act of the
deceased with the intention of ending his or her own life (Intentional self-harm).
Coronial processes to determine the intent of a death (whether intentional self harm,
accidental, homicide, undetermined intent) are especially important for statistics on
Suicide deaths because information on intent is necessary to complete the coding under
ICD-10 coding rules (see Explanatory Note 75). Coroners' practices to determine the
intent of a death may vary across the states and territories.
For deaths registered in 2008, 561 deaths were the subject of ongoing coronial
investigations at the time ABS data was finalised, and had insufficient information
recorded on NCIS in order to be able to determine any cause of death. These records
have been coded to Other ill-defined and unspecified causes of mortality (R99). Some of
these deaths may be determined a Suicide after further investigation.
Suicide can be defined as the deliberate taking of one's life (Butterworths Concise
Australian Legal Dictionary, 1997, Butterworths Sydney). To be classified as a Suicide, a
death must be recognised as being due to other than natural causes. Detailed
information (including flow charts) on how deaths are coded as Suicide by the ABS can
be found in Explanatory Note 75.
Data for 2008 have been positively impacted by process improvements. As a result, there
has been an increase in quality in relation to assigning unspecified cause codes to
coroner certified deaths. As a large number of coroner certified deaths are due to
External causes of death, these process improvements have had the effect of improving
the quality of these data, including Suicide data. See Technical Note 1: 2008 COD
Collection - Process Improvements for further information.
In addition to process improvements, 2008 data will be subject to a revisions process.
See Technical Note 2: Causes of Death - Revisions Process for further information. The
revisions process, implemented for all coroner certified deaths registered from 1 January
2007, enables the use of additional information relating to coroner certified deaths 12 or
24 months after initial processing. This increases the specificity of the assigned ICD-10
codes over time. This process will also positively impact External causes of death data,
including suicide data.
Due to the quality improvements and the revisions process, the increase in the number
of deaths classified as Suicide between 2007 and 2008 may be overstated and users are
advised to read the technical notes and use caution.
OV E R V I E W
A B S • CA U S E S OF D E A T H • 3 3 0 3 . 0 • 2 0 0 8 47

While Suicide accounts for only a relatively small proportion (1.5%) of all deaths in
Australia, it does account for a much greater proportion of deaths from all causes within
specific age groups (see graph below). For example, in 2008, 24% of all male deaths aged
15-24 years were due to Suicide. Similarly for females, Suicide deaths comprise a much
higher proportion of total deaths in younger age groups compared with older age
groups.
Suicide as proport ion of
total deaths
There were 2,191 deaths from Suicide registered in 2008. Over three-quarters (78%) of
Suicides were males.
Intentional self-harm [Suicide] (X60–X84, Y87.0) was ranked as the 14th leading cause of
all deaths registered in Australia in 2008. Males accounted for over three-quarters of all
Suicide deaths in 2008, resulting in a ranking as the 10th leading cause of death for
males. Although death by Suicide is a relatively uncommon event (occurring at a rate of
about 10 per 100,000 population per year), the human and economic costs are
substantial.
KE Y CH A R A C T E R I S T I C S
(a) 2008 data have been subject to process improvements which have increased the quality ofthese data. See Technical Note 1: 2008 COD Collection - Process Improvements for furtherinformation.(b) Causes of death data for 2008 are preliminary and subject to a revisions process.See Technical Note 2: Causes of Death - Revisions Process for further information.(c) Causes of death data for 2007 have been revised and are subject to further revisions.See Technical Note 3: 2007 Revisions for further information.(d) Comparisons between 2007 and 2008 may be overstated due to quality improvements.
1999 2002 2005 2008Reference year
no.
0
1000
2000
3000 Males Females Persons
SUICIDES, NUMBER OF DEATHS, 1999-2008 (a) (b) (c) (d )6.1
Further information on how the revisions process has impacted the 2007 data, (including
suicide data) can be found in Technical Note 3: 2007 Revisions.
This chapter contains summary statistics on Suicide deaths registered in Australia, where
the underlying cause of death was determined as Intentional self-harm (X60–X84, Y87.0)
or Suicide. Further information on Suicides is presented in the associated data cubes.
OV E R V I E W c o n t i n u e d
48 A B S • CA U S E S OF D E A T H • 3 3 0 3 . 0 • 2 0 0 8
CH A P T E R 6 • SU I C I D E S

The highest age-specific Suicide death rate for males in 2008 was observed in the 40-44
year age group (26.4 per 100,000 population). As a proportion of total male deaths in this
age group, Suicide deaths represented 16%. The age-specific death rates for the 85+
years age group was 26.2 per 100,000 males, and 24.5 per 100,000 males in the 45-49 year
age group. Suicide as a proportion of total male deaths for these age groups were 0.2%
and 10% respectively. The age-specific Suicide rate for males was lowest in the 15-24 year
(a) Deaths per 100,000 estimated resident population for each age group and sex.See Glossary for further information.(b) 2008 data have been subject to process improvements which have increased the quality ofthese data. See Technical Note 1: 2008 COD Collection - Process Improvements for furtherinformation.(c) Causes of death data for 2008 are preliminary and subject to a revisions process.See Technical Note 2: Causes of Death - Revisions Process.
15-19 25-29 35-39 45-49 55-59 65-69 75-79 85+Age Group (years)
Rate(a)
0
10
20
30MaleFemale
AGE-SPECIF IC SUICIDES RATES (a) , 2008 (b) (c)6.3
ME D I A N AG E
The median age at death for Suicide in 2008 was 42.4 years for males, 43.5 years for
females and 42.7 years overall. In comparison, the median age for deaths from all causes
in 2008 was 77.9 years for males, 83.9 years for females and 80.9 years overall.
AG E - S P E C I F I C RA T E S
Age-specific death rates are the number of deaths during the reference year at a specified
age per 100,000 of the estimated resident population of the same age (see Glossary for
further information). The pattern of age-specific rates in 2008 for Suicide in males and
females is shown in the following graph.
Age
(a) 2008 data have been subject to process improvements which have increased the quality ofthese data. See Technical Note 1: 2008 COD Collection - Process Improvements for furtherinformation.(b) Causes of death data for 2008 are preliminary and subject to a revisions process.See Technical Note 2: Causes of Death - Revisions process for more information.
15-19 25-29 35-39 45-49 55-59 65-69 75-79 85+Age Groups
Proportion of all deaths %
0
5
10
15
20
25
MalesFemalesPersons
SUICIDES, BY SELECTED AGE GROUPS, 2008 (a) (b)6.2Suicide as proport ion of
total deaths cont inue d
A B S • CA U S E S OF D E A T H • 3 3 0 3 . 0 • 2 0 0 8 49
CH A P T E R 6 • SU I C I D E S

The following table presents selected external causes of death by mechanism and intent.
It is possible that additional Suicide deaths are contained within the Intent categories of
Accidental and Undetermined intent, particularly for the mechanisms of poisoning and
hanging (see Explanatory Notes 72-76).
ME C H A N I S M BY IN T E N T -
SE L E C T E D CA U S E S
In 2008, the most frequent method of Suicide was hanging (X70), a method used in half
(53%) of all Suicide deaths. Poisoning by drugs was used in 12% of Suicide deaths,
followed by poisoning by other methods including by alcohol and motor vehicle exhaust
(11%). Methods using firearms accounted for 7.8% of Suicide deaths. The remaining
Suicide deaths included deaths from drowning, jumping from a high place, and other
methods.
ME T H O D OF SU I C I D E
(a) See Glossary for further information.(b) 2008 data have been subject to process improvements which have increased the quality ofthese data. See Technical Note 1: 2008 COD Collection - Process Improvements for furtherinformation.(c) Causes of death data for 2007 have been revised and are subject to further revisions. SeeTechnical Note 3: 2007 Revisions for further information.(d) Causes of death data for 2008 are preliminary and subject to a revisions process.See Technical Note 2: Causes of Death - Revisions Process.(e) Comparisons between 2007 and 2008 may be overstated due to quality improvements.
1999 2000 2001 2002 2003 2004 2005 2006 2007 2008Years
Rate(a)
05
10152025
MalesFemalesPersons
AGE-STANDARDISED DEATH RATES (a) , for Su ic ide–1999-2008 (b) (c ) (d ) (e )
6.4
AG E - S P E C I F I C RA T E S c o n t i n u e d
age group (9.4 per 100,000), however, this represented 20% of all deaths in this age
group.
For females the highest age-specific Suicide death rate in 2008 was observed in the 50-54
year age group with 8.6 deaths per 100,000. The lowest age-specific death rate for female
Suicide deaths was in the 80-84 year age groups (2.0 deaths per 100,000).
AG E - S T A N D A R D I S E D RA T E S
Age standardisation is used to compare death rates over time, as it accounts for any
changes in the age-structure of a population over time. The age-standardised Suicide rate
(for persons) in 2008 was 10.2 per 100,000. This compares with 13.2 per 100,000 in 1999.
The age-standardised Suicide rate in 2008 for males was 16.0 per 100,000 while the
corresponding rate for females was 4.5 per 100,000. Throughout the period 1999 to
2008, the male age-standardised Suicide death rate was approximately four times higher
than the corresponding female rate, as can be seen in the following graph.
Age cont inue d
50 A B S • CA U S E S OF D E A T H • 3 3 0 3 . 0 • 2 0 0 8
CH A P T E R 6 • SU I C I D E S

(d) Includes ICD-10 codes X60-X84 and Y87.0. Care needs to be taken ininterpreting figures relating to Suicide due to limitations of the data,see Explanatory Notes 72-75.
(e) Includes Complications of medical and surgical care (Y40-Y84) andLegal intervention and operations of war (Y35-Y36)
(f) Includes sequelae, explosives, smoke/fire/flames, blunt object, jumpingor lying before moving object, crashing of motor vehicle, other andunspecified means.
— nil or rounded to zero (including null cells)(a) 2008 data have been subject to process improvements which have
increased the quality of these data. See Technical Note 1: 2008 CODCollection - Process Improvements for further information.
(b) Causes of death data for 2008 are preliminary and subject to arevisions process. See Technical Note 2: Causes of Death - RevisionsProcess.
(c) Data cells with small values have been randomly assigned to protectthe confidentiality of individuals. As a result, some totals will not equalthe sum of their components. Cells with a zero value have not beenaffected by confidentialisation.
8 8042481 1632052 1914 997Total
3 674248529921552 650Other(f)1 502—3141211 348Falls (W00-W19, X80, Y01,Y30)
146—2870435Contact with sharp object (W25-W29, X78, X99, Y28)225—31191705Firearms (W32-W34, X72-X74, X93-X95, Y22-Y24)263—57145159Drowning and submersion (W65-W74, X71, X92, Y21)
1 468—94151 151208Hanging (W75-W84, X70, X91, Y20)1 526—3935506622Poisonings (X40-X90, X60-X69, X85-X90, Y10-Y19)
no.no.no.no.no.no.
Total
Other
intent(e)Undetermined
intentAssault
Intentional
self-harm(d)Accidental
death
Mechan i sm of dea th
SELECTED EXTERNAL CAUSES OF DEATH, Mechan ism by in tent —2008(a) (b ) (c )6.5
A B S • CA U S E S OF D E A T H • 3 3 0 3 . 0 • 2 0 0 8 51
CH A P T E R 6 • SU I C I D E S

CHAP T E R 7 DE A T H S OF AB O R I G I N A L AN D TO R R E S ST R A I TIS L A N D E R AU S T R A L I A N S . . . . . . . . . . . . . . . . . . . . . . . . . . . .
Deaths caused by Diseases of the heart and blood vessels (I00–I99) accounted for 631
Indigenous deaths in 2008, 26% of all Indigenous deaths. The two most common types
of circulatory system diseases that contributed to Indigenous deaths were Ischaemic
heart diseases (I20-I25) and Cerebrovascular disease [Stroke] (I60-I69).
Ischaemic heart diseases (I20–I25), which include angina, blocked arteries of the heart
and heart attacks, were the underlying cause of death for 331 (13%) deaths of
Indigenous people. Ischaemic heart diseases were the leading cause of death of
non-Indigenous people in 2008, accounting for 17% of deaths throughout Australia.
Median age at death for Indigenous people who died from Ischaemic heart diseases in
2008 was 59.8 years, compared with 84.1 years for non-Indigenous people. The sex ratio
D I S E A S E S OF TH E HE A R T
AN D BL O O D VE S S E L S
( I 0 0 – I 9 9 )
Cancer (C00–D48) was the underlying cause of 488 deaths (20%) of Indigenous people,
of which 48% were male and 52% were female. Of total non-Indigenous deaths
throughout Australia, 30% were attributed to Cancers. The median age of deaths with an
underlying cause of Cancer was 63.1 years for Indigenous people, and 75.5 years for
non-Indigenous people.
Trachea and lung cancers (C33-C34) accounted for 120 deaths or 4.9% of all deaths of
Indigenous people. Comparatively, these types of Cancer were the underlying cause of
death for 5.5% of all deaths of non-Indigenous people in 2008.
CA N C E R (C 0 0 - D 4 8 )
Further data relating to deaths of Indigenous people can be found in the datacubes
associated with this publication. These include Leading causes of death for the
Indigenous population of Australia and selected states and territories.
DA T A CU B E S
There were 2,472 deaths registered across Australia in 2008 where the deceased person
was identified as being of Aboriginal or Torres Strait Islander origin, or both.
It is considered likely that most deaths of Indigenous Australians are registered.
However, some of these deaths are not identified as Indigenous when they are
registered. The extent to which this occurs is referred to as coverage of Indigenous
deaths. For further information, see Explanatory Notes 53-62.
Data for 2008 have been positively impacted by process improvements. See Technical
Note 1: 2008 COD Collection - Process Improvements for further information. These data
are also subject to a revisions process. See Technical Note 2: Causes of Death - Revisions
Process for further information.
The section below provides a brief summary of deaths due to selected broad level
causes.
OV E R V I E W
52 A B S • CA U S E S OF D E A T H • 3 3 0 3 . 0 • 2 0 0 8

(a) Includes deaths of persons identified as Aboriginal Torres Strait Islander or both.(b) 2008 data have been subject to process improvements which have increased the quality ofthese data. See Technical Note 1: 2008 COD Collection - Process Improvements for furtherinformation.(c) Causes of death data for 2008 are preliminary and subject to a revisions process.See Technical Note 2: Causes of Death - Revisions Process.(d) Ischaemic Heart Disease.
Cancers Diabetes IHD (d) Strokes External causes
%
0
10
20
30Indigenous (Australia)(a)Non-Indigenous (Australia)
SELECTED UNDERLY ING CAUSES OF DEATH AS PROPORT ION OFTOTAL DEATHS, By Ind igenous status (a) : 2008 (b) (c )7.1
There were 390 deaths of Indigenous people attributed to External causes (V01–Y98) in
2008. This represented 16% of all Indigenous deaths, compared with 5.9% of
non-Indigenous deaths attributed to External causes. Of those Indigenous deaths due to
External causes, 66% were male and 34% were female. The median age at death for
External causes was 32.6 years for Indigenous people and 53.9 years for non-Indigenous
people.
Intentional self harm [Suicide] (X60-X84,Y87.0) and Land transport accidents (V01-V89,
Y85.0) were the two leading External causes of death for Indigenous people in 2008.
Suicide accounted for 4.2% (103) of all Indigenous deaths due to External causes; 74
were males and 29 were females. Land transport accidents accounted for 4.0% (99) of all
Indigenous deaths due to External causes; 68 were males and 31 were females.
EX T E R N A L CA U S E S
(V 0 1 – Y 9 8 )
Diabetes (E10–E14) was the underlying cause of death for 189 Indigenous deaths, which
represented 7.6% of all deaths of Indigenous people in 2008. This compared with 2.8% of
deaths of non-Indigenous people. The median age at death of Indigenous people who
died from Diabetes in 2008 was 63.6 years, whereas for non-Indigenous people, it was
81.6 years. The sex ratio for Indigenous deaths due to Diabetes was 82 male deaths per
100 female deaths.
D I A B E T E S ( E 1 0 - E 1 4 )
for Indigenous people who died from Ischaemic heart diseases in 2008 was 153 males
per 100 females.
Strokes (I60–I69), which include haemorrhages, strokes, infarctions and blocked arteries
of the brain, accounted for 114 Indigenous deaths in 2008, 4.6% of all Indigenous deaths.
This compared with 8.4% of deaths of non-Indigenous people. Median age at death was
70.0 years, compared with 85.4 years for non-Indigenous people throughout Australia.
There was no difference in the sex ratio for Indigenous people who died from Strokes in
2008.
D I S E A S E S OF TH E HE A R T
AN D BL O O D VE S S E L S
( I 0 0 – I 9 9 ) c o n t i n u e d
A B S • CA U S E S OF D E A T H • 3 3 0 3 . 0 • 2 0 0 8 53
CH A P T E R 7 • D E A T H S OF A B O R I G I N A L A N D T O R R E S ST R A I T I S L A N D E R A U S T R A L I A N S

A high degree of caution should be exercised in regard to interpreting Indigenous infant
deaths data, as in addition to the data quality issues that impact on Indigenous deaths
data generally (see Explanatory Notes 53-62), data on infant mortality by Indigenous
status is subject to the high variability caused by small numbers.
Infant mortality rates for Indigenous Australians are around twice the rates for all
Australians. Of all Indigenous infant deaths (aged under twelve months) registered in
2008, almost half (43%) were attributed to Conditions originating in the Perinatal Period
(P00–P96). This was a similar proportion compared with non-Indigenous infant deaths
(48%).
I N F A N T MO R T A L I T Y
54 A B S • CA U S E S OF D E A T H • 3 3 0 3 . 0 • 2 0 0 8
CH A P T E R 7 • D E A T H S OF A B O R I G I N A L A N D T O R R E S ST R A I T I S L A N D E R A U S T R A L I A N S

EX P L A N A T O R Y NO T E S . . . . . . . . . . . . . . . . . . . . . . . . . . . . . . .
1 This publication contains statistics on causes of death for Australia.
2 In order to complete a death registration, the death must be certified by either a
doctor using the Medical Certificate of Cause of Death, or by a coroner. Approximately
85-90% of deaths each year are certified by a doctor. The remainder are reported to a
coroner. Although there is variation across jurisdictions in what constitutes a death that
is reportable to a coroner, they are generally reported in circumstances such as:
! where the person died unexpectedly and the cause of death is unknown;
! where the person died in a violent or unnatural manner;
! where the person died during or as a result of an anaesthetic;
! where the person was 'held in care' or in custody immediately before they died; and
! where the identity of the person who has died is unknown.
3 The registration of deaths is the responsibility of the eight individual state and
territory Registrars of Births, Deaths and Marriages. As part of the registration process,
information about the cause of death is supplied by the medical practitioner certifying
the death or by a coroner. Other information about the deceased is supplied by a relative
or other person acquainted with the deceased, or by an official of the institution where
the death occurred. The information is provided to the Australian Bureau of Statistics
(ABS) by individual Registrars for coding and compilation into aggregate statistics. In
addition, the ABS supplements this data with information from the National Coroners
Information System (NCIS). The following diagram shows the process undertaken in
producing cause of death statistics for Australia.
I N T R O D U C T I O N
A B S • CA U S E S OF D E A T H • 3 3 0 3 . 0 • 2 0 0 8 55

10 The ABS causes of death collection includes all deaths that occurred and were
registered in Australia, including deaths of persons whose usual residence is overseas.
Deaths of Australian residents that occurred outside Australia may be registered by
individual Registrars, but are not included in ABS deaths or causes of death statistics.
11 The current scope of the statistics includes:
! all deaths being registered for the first time;
Scope of causes of death
stat ist ics
9 The statistics in chapters 1-7 relate to the number of deaths registered, not those
which actually occurred, in the years shown. Number of deaths by year of occurrence will
be published separately in mid 2010.
20 0 8 SC O P E AN D CO V E R A G E
4 Note that prior to 2007, statistics on perinatal deaths were included in this
publication. From 2007 onward, perinatal deaths data have been published separately in
Perinatal Deaths, Australia (cat.no. 3304.0).
5 Statistics on Suicide deaths for years prior to 2006 were published separately in
Suicides, Australia (cat. no. 3309.0).
6 The data presented in this publication are also included in a series of data cubes that
are available on the ABS website.
7 A Glossary is also provided which details definitions of terminology used.
8 These Explanatory Notes provide salient details relevant to the Causes of Death
collection.
I N T R O D U C T I O N continued
56 A B S • CA U S E S OF D E A T H • 3 3 0 3 . 0 • 2 0 0 8
EX P L A N A T O R Y N O T E S

15 Ideally, for compiling annual time series, the number of events (deaths) should be
recorded and reported as those occurring within a given reference period such as a
calendar year. However, due to lags in registration of events and subsequent delays in
the provision of that information to the ABS, not all deaths are registered in the year that
they occur. This ideal is unlikely to be met under the current legislation and registration
processes. Therefore, the occurrence event is approximated by addition of the event on
a state/territory register of deaths. Also, some additions to the register can be delayed in
being received by the ABS from the Registrar (processing or data transfer lags).
In effect there are 3 dates attributable to each death registration:
! the date of occurrence (of the death);
! the date of registration or inclusion on the State/Territory register; and
! the month in which the registered event is lodged with the ABS.
Coverage of Causes of Death
Stat ist ics
! deaths in Australia of temporary visitors to Australia;
! deaths occurring within Australian Territorial waters;
! deaths occurring in Australian Antarctic Territories or other external territories
(excluding Norfolk Island);
! deaths occurring in transit (i.e. on ships or planes) if registered in the State of 'next
port of call';
! deaths of Australian Nationals overseas who were employed at Australian legations
and consular offices (i.e. deaths of Australian diplomats while overseas) where able
to be identified; and
! deaths that occurred in earlier reference periods that have not been previously
registered (late registrations).
12 The scope of the statistics excludes:
! still births / fetal deaths (these are included in Perinatal Deaths, Australia (cat.no.
3304.0);
! repatriation of human remains where the death occurred overseas;
! deaths overseas of foreign diplomatic staff (where these are able to be identified);
and
! deaths occurring on Norfolk Island.
13 From the 2007 reference year, the scope (time period) of the collection is:
! all deaths registered in Australia in the reference year and received by the ABS by the
end of the March quarter of the subsequent year; and
! deaths registered prior to the reference year but not previously received from the
Registrar nor included in any statistics reported for an earlier period.
As an example, records received by the ABS during the March quarter of 2009 which
were initially registered in 2008 or prior (but not forwarded to the ABS until 2009)
are assigned to the 2008 reference year. Any registrations relating to 2008 which are
received by the ABS after the end of the March quarter are assigned to the 2009 (or
later) reference year.
14 Note that up to and including the 2006 issue of Causes of Death, Australia (cat. no.
3303.0), the scope (time period) for each reference year included:
! all deaths registered in Australia for the reference year and received by the ABS in
the reference year;
! deaths registered during the two years prior to the reference year but not received
by the ABS until the reference year; and
! deaths registered in the reference year and received by the ABS in the first quarter of
the subsequent year.
Under these rules, it was possible for a death registration to not be recorded in the
collection if it had been registered more than two years before the record was
received by the ABS. The scope was changed from the 2007 reference year to ensure
all registrations are included in ABS collections.
Scope of causes of death
stat ist ics continued
A B S • CA U S E S OF D E A T H • 3 3 0 3 . 0 • 2 0 0 8 57
EX P L A N A T O R Y N O T E S

AU S T R A L I A N ST A N D A R D GE O G R A P H I C A L CL A S S I F I C A T I O N ( A S G C )
24 The ASGC is an hierarchical classification system consisting of six interrelated
classification structures. The ASGC provides a common framework of statistical
geography and thereby enables the production of statistics which are comparable and
can be spatially integrated. Causes of death statistics are coded to Statistical Local Area
(SLA) and can be produced for aggregates of these, for example, Statistical Division,
Statistical Sub-Division and State.
25 For further information about the ASGC refer to Australian Standard Geographical
Classification (ASGC), Jul 2009 (cat. no. 1216.0).
ST A N D A R D AU S T R A L I A N CL A S S I F I C A T I O N OF CO U N T R I E S (S A C C )
26 The SACC groups neighbouring countries into progressively broader geographic
areas on the basis of their similarity in terms of social, cultural, economic and political
characteristics. Causes of death statistics are coded using the SACC, as the collection
includes overseas residents whose death occurred while they were in Australia.
27 Birthplaces within Australia are coded to the state/territory level where possible.
The supplementary codes contain the relevant state and territory 4-digit codes.
28 For further information about the classification, refer to Standard Australian
Classification of Countries (SACC), (Second Edition) (cat. no. 1269.0).
Geographic Classi f icat ions
17 A range of socio-demographic data are available from the causes of death collection.
Standard classifications used in the presentation of causes of death statistics include age,
sex, birthplace, marital status, multiple birth and Indigenous status. Statistical standards
for social and demographic variables have been developed by the ABS. Where these are
not published in the Causes of Death publication or data cubes, they can be sourced on
request from the ABS.
MA R I T A L S T A T U S
18 Within ABS causes of death statistics, marital status relates to registered marital
status. Registered marital states refers to formally registered marriages or divorces for
which the partners hold a certificate.
19 For further information about marital status refer to Family, Household and Income
Unit Variables, 2005 (cat. no. 1286.0)
I N D I G E N O U S ST A T U S
20 The term Indigenous is used to refer to Aboriginal and Torres Strait Islander
Australians. Those who are identified as being of Aboriginal and/or Torres Strait Islander
origin through the death registration process are classified as Indigenous persons.
21 For further information about Indigenous status refer to Standards for Statistics on
Cultural and Language Diversity, 1999 (cat. no. 1289.0)
OC C U P A T I O N
22 The occupation classification used in ABS causes of death statistics is the Australian
and New Zealand Standard Classification of Occupations (ANZSCO) First Edition 2006.
However, the ABS has not published causes of death data with an occupation variable
since the 2002 reference year. The ABS considers the quality of the data able to be
produced for this variable to be insufficient for reasonable analysis.
23 For further information on ANZSCO First Edition, refer to ANZSCO: Australian and
New Zealand Standard Classification of Occupation, First Edition (cat. no. 1220.0).
20 0 8 CL A S S I F I C A T I O N S
Socio-Demographic
Classi f icat ions
16 Approximately 4% to 6% of deaths occurring in one year are not registered until the
following year or later. These are included with the count of registered deaths published
for that year.
Coverage of Causes of Death
Stat ist ics continued
58 A B S • CA U S E S OF D E A T H • 3 3 0 3 . 0 • 2 0 0 8
EX P L A N A T O R Y N O T E S

40 Ranking causes of death is a useful method of describing patterns of mortality in a
population and allows comparison over time and between populations. However,
different methods of grouping causes of death can result in a vastly different list of
leading causes for any given population. A ranking of leading causes of death based on
broad cause groupings such as 'cancers' or 'heart disease' does not identify the leading
causes within these groups, which is needed to inform policy on interventions and
Leading Causes of Death
39 Where an accidental or violent death occurs, the underlying cause is classified
according to the circumstances of the fatal injury, rather than the nature of the injury,
which is coded separately.
External Causes of Death
38 The ABS implemented a new version of the automated cause of death coding
software (Medical Mortality Data System (MMDS)) for 2006 data onwards. The MMDS
coding software incorporates coding algorithms to ensure that updates to ICD-10 are
implemented in the production of the statistics.
Automated coding
36 The Updating and Revision Committee (URC), a WHO advisory group on updates
to ICD-10, maintains the cumulative and annual lists of approved updates to the ICD-10
classification. The updates to ICD-10 are of numerous types including addition and
deletion of codes, changes to coding instructions and modification and clarification of
terms.
37 The cumulative list of ICD-10 updates can be found online.
Updates to ICD-10
34 The extensive nature of the ICD enables classification of causes of death at various
levels of detail. For the purpose of this publication, data is presented according to the
ICD at the chapter level, with further disaggregation for major causes of death.
35 To enable the reader to see the relationship between the various summary
classifications used in this publication, all tables show in brackets the ICD codes which
constitute the causes of death covered.
20 0 8 MO R T A L I T Y CO D I N G
IN T E R N A T I O N A L CL A S S I F I C A T I O N OF D I S E A S E S ( I C D )
29 The International Classification of Diseases (ICD) is the international standard
classification for epidemiological purposes and is designed to promote international
comparability in the collection, processing, classification, and presentation of causes of
death statistics. The classification is used to classify diseases and causes of disease or
injury as recorded on many types of medical records as well as death records. The ICD
has been revised periodically to incorporate changes in the medical field. Currently ICD
10th revision is used for Australian causes of death statistics.
30 ICD-10 is a variable-axis classification meaning that the classification does not group
diseases only based on anatomical sites, but also on the type of disease. Epidemiological
data and statistical data is grouped according to:
! epidemic diseases;
! constitutional or general diseases;
! local diseases arranged by site;
! developmental diseases; and
! injuries.
31 For example, a systemic disease such as septicaemia is grouped with infectious
diseases; a disease primarily affecting one body system, such as a myocardial infarction is
grouped with circulatory diseases; and a congenital condition such as spina bifida is
grouped with congenital conditions.
32 For further information about the ICD refer to WHO International Classification of
Diseases (ICD).
33 The ICD 10th Revision is also available online.
Health Classi f icat ions
A B S • CA U S E S OF D E A T H • 3 3 0 3 . 0 • 2 0 0 8 59
EX P L A N A T O R Y N O T E S
48 In compiling causes of death statistics, the ABS employs a variety of measures to
improve quality, which include:
20 0 8 DA T A QU A L I T Y
Coroner Cert i f ied Deaths
46 Causes of death statistics for states and territories in this publication have been
compiled in respect of the state or territory of usual residence of the deceased,
regardless of where in Australia the death occurred and was registered. Deaths of
overseas usual residents which occur in Australia are included in the state/territory in
which their death was registered.
47 Statistics compiled on a state or territory of registration basis are available on
request.
State and Terr i tory Data
43 Years of Potential Life Lost (YPLL) measures the extent of 'premature' mortality,
which is assumed to be any death at ages of 1-78 years inclusive, and aids in assessing the
significance of specific diseases or trauma as a cause of premature death.
44 Estimates of YPLL are calculated for deaths of persons aged 1-78 years based on the
assumption that deaths occurring at these ages are untimely. The inclusion of deaths
under one year would bias the YPLL calculation because of the relatively high mortality
rate for that age, and 79 years was the median age at death when this series of YPLL was
calculated using 2001 as the standard year. As shown below, the calculation uses the
current ABS standard population of all persons in the Australian population at 30 June
2001. This standard is revised every 10 years.
45 YPLL is derived from:
YPLL = !x(Dx(79 − Ax))where:
= adjusted age at death. As age at death is only available in completed years theAx
midpoint of the reported age is chosen (e.g. age at death 34 years was adjusted to 34.5).
= registered number of deaths at age due to a particular cause of death.Dx "
YPLL is standardised for age using the following formula:
YPLLs = !x(Dx(79 −Ax)Cx)where the age correction factor is defined for age as: CX "
Cx =Nxs
Ns$ 1
Nx$N
where:
= estimated number of persons resident in Australia aged 1-78 years at 30 June 2008 N
= estimated number of persons resident in Australia aged years at 30 June 2008 NX "
= estimated number of persons resident in Australia aged years at 30 June 2001Nxs "
(standard population)
= estimated number of persons resident in Australia aged 1-78 years at 30 June 2001Ns
(standard population)
Years of Potent ial Life Lost
(YPLL)
health advocacy. Similarly, a ranking based on very narrow cause groupings or including
diseases that have a low frequency, can be meaningless in informing policy.
41 Tabulations of leading causes presented in this publication are based on research
presented in the Bulletin of the World Health Organisation, Volume 84, Number 4, April
2006, 257-336 . The determination of groupings in this list is primarily driven by data
from individual countries representing different regions of the world. Other groupings
are based on prevention strategies, or to maintain homogeneity within the groups of
cause categories.
42 A number of organisations publish lists of leading causes of death, however the
basis for determining the leading causes may vary. For example, many lists are based on
Years of Potential Life Lost (YPLL) and are designed to present data based on the burden
of mortality and disease to the community. The basis of the ABS listing of leading causes
is based on the numbers of deaths and is designed to present information on incidence
of mortality rather than burden of mortality.
Leading Causes of Death
continued
60 A B S • CA U S E S OF D E A T H • 3 3 0 3 . 0 • 2 0 0 8
EX P L A N A T O R Y N O T E S

53 This publication includes the number of registered Indigenous deaths for 2008.
However, because of the data quality issues outlined below, more detailed breakdowns
of Indigenous deaths are provided only for New South Wales, Queensland, South
Australia, Western Australia and the Northern Territory.
Indigenous deaths
! providing certifiers with certification booklets for guidance in reporting causes of
death on medical certificates. See Information Paper: Certification of Death (cat. no.
1205.0.55.001);
! seeking detailed information from the National Coroners Information System
(NCIS); and
! editing checks at the individual record and aggregate levels.
49 The quality of causes of death coding can be affected by changes in the way
information is reported by certifiers, by lags in completion of coroner cases and the
processing of the findings. While changes in reporting and lags in coronial processes can
affect coding of all causes of death, those coded to Chapter XVIII: Symptoms, signs and
abnormal clinical and laboratory findings, not elsewhere classified and Chapter XX:
External causes of morbidity and mortality are more likely to be affected because the
code assigned within the chapter may vary depending on the coroner's findings.
50 Over time, there have been variances in the way that the ABS has approached the
coding of coroner certified cases. These variances have served to improve the quality of
causes of death data over this time, but have not been significant enough to cause a
break-in-series to the collection. The processing changes which have occurred over time
are (processing year):
! 2003: introduction of the use of NCIS as further information to code coroner
certified deaths.
! 2007: cessation of personal visits to coroner offices to extract information from
paper records; only information contained in NCIS is used to code coroner certified
deaths.
! 2009: increased effort to analyse all information included on part 2 of the Medical
Certificate of Cause of Death. Part 2 of the certificate details conditions that may
have contributed to the death but were not part of the sequence of events that led
to death. This information is utilised for all cases which are 'open' at the end of
processing, and also for some cases which are 'closed' but could have a more
specific causes of death code assigned.
! 2009: additional information on NCIS (police reports, toxicology reports, autopsy
reports and coroners findings) is investigated to ensure the most specific code
possible is assigned to all coroner certified cases. This information is utilised for
both open and closed cases.
! 2009: introduction of a revisions process which allows for coroner certified cases to
be recoded 12 months, and then 24 months later during processing of the
subsequent years' coronial records.
These have resulted in a significant increase in quality for 2008 data in cause of
death codes which are assigned to open coroners cases. Due to these quality
improvements, the ABS advises that caution should be used when comparing causes
of death data over time.
51 Further information on issues regarding changes to processing which has impacted
the 2008 data can be found in Technical Note 1: 2008 COD Collection - Process
Improvements.
52 Further information on the causes of death revision process and how it has been
undertaken can be found in Technical Note 2: Causes of Death - Revisions Process.
Coroner Cert i f ied Deaths
continued
A B S • CA U S E S OF D E A T H • 3 3 0 3 . 0 • 2 0 0 8 61
EX P L A N A T O R Y N O T E S

54 There are several data collection forms on which people are asked to state whether
they are of Indigenous origin. Due to a number of factors, the results are not always
consistent. The likelihood that an indigenous person will identify, or be identified, as
Indigenous on a specific form is known as their propensity to identify as Indigenous.
Propensity to identify as Indigenous on a specific form can be thought of as a proportion
of the total, unknown, number of Indigenous people who identify as such.
55 Propensity to identify as Indigenous is determined by a range of factors, including:
how the information is collected; who completes the form; the perception of how the
information will be used; education programs about identifying as Indigenous; and
cultural issues associated with identifying as Indigenous.
56 While it is considered likely that most deaths of Indigenous Australians are
registered, a proportion of these deaths are not identified as Indigenous by the family,
health worker or funeral director during the death registration process. That is, whilst
data is provided to the ABS for the Indigenous status question for 99% of all deaths,
there are concerns regarding the accuracy of the data. For example, the Indigenous
status question is not always asked of relatives and friends of the deceased by the funeral
director.
57 In addition to those deaths identified as Indigenous, a number of deaths occur each
year where Indigenous status is not stated on the death registration form. In 2008 there
were 1,807 deaths registered in Australia for which Indigenous status was not stated,
representing 1.3% of all deaths registered. The Australian Capital Territory, Queensland
and Victoria had the highest proportions of not stated responses in 2008.
58 As a proportion of all deaths registered, deaths for which Indigenous status was not
stated increased from 1.0% in 2007 to 1.3% in 2008. This was largely due to an increase in
the number of deaths in New South Wales for which Indigenous status was not stated;
from 212 in 2007 to 504 in 2008. Victoria also recorded an increase in deaths where
Indigenous status was not stated, from 437 in 2007 to 553 in 2008.
59 From 2007, Indigenous status recorded for deaths registered in South Australia,
Western Australia, Tasmania, the Northern Territory and the Australian Capital Territory
has been sourced from both the Death Registration Form (DRF) and the Medical
Certificate of Cause of Death (MCCD). Prior to 2007, Indigenous status was sourced only
from the DRF. This method of using both forms to determine Indigenous status resulted
in an additional 44 deaths recorded as Indigenous in 2008, representing a 0.7% increase
in the number of deaths recorded as Indigenous for Australia overall. In addition, a
further 1,652 records were reclassified from 'not stated' Indigenous status to
'non-Indigenous'.
60 Despite the relatively low number of deaths with Indigenous status not stated, it is
likely that some Indigenous deaths are included in the not stated category, contributing
to the under-coverage of Indigenous deaths.
61 Quality studies conducted as part of the Census Data Enhancement project have
investigated the levels and consistency of Indigenous identification between the 2006
Census and death registrations. See Information Paper: Census Data Enhancement -
Indigenous Mortality Quality Study, 2006-07 (cat. no. 4723.0), released on 17 November
2008.
62 An assessment of various methods for adjusting incomplete Indigenous death
registration data for use in compiling Indigenous life tables and life expectancy estimates
is presented in Discussion Paper: Assessment of Methods for Developing Life Tables for
Aboriginal and Torres Strait Islander Australians, 2006 (cat. no. 3302.0.55.002), released
on 17 November 2008.
Indigenous deaths continued
62 A B S • CA U S E S OF D E A T H • 3 3 0 3 . 0 • 2 0 0 8
EX P L A N A T O R Y N O T E S

69 The Department of Infrastructure, Transport, Regional Development and Local
Government has published data in Road Deaths Australia 2008, Statistical Summary on
the number of deaths due to road traffic accidents in 2008 (1,464 deaths). 2008 causes of
death data recorded 1,253 deaths due to road traffic accidents (V01-V79) and a further
145 deaths were coded as Crashing of a motor vehicle, undetermined intent (Y32). The
remaining difference in the numbers (66 deaths) between the two collections are
explained by the different scope and coverage rules for each collection. In addition, a
number of road traffic related deaths may be coded to Other ill-defined and unspecified
causes of mortality (R99) due to the unavailability of information on the NCIS. It is
important to note that the number of deaths attributed to transport accidents for 2008
will change as data is subject to the revisions process. See Technical Note 2: Causes of
Death - Revisions Process for further information.
Transport Accidents
(V01-V99, Y85)
67 During processing of causes of death data for 2008, the ABS increased effort in
coding and analysing Medical Certificate of Cause of Death and quality assurance. More
time was taken to investigate part 2 of the certificate when a non-specific underlying
cause was shown in part 1. Part 2 of the certificate details conditions that may have
contributed to the death but were not part of the sequence of events that led to death.
The ABS also increased resources and time spent investigating coroners reports to
identify specific causes of death. This process involved making increased use of police
reports, toxicology reports, autopsy reports and coroners findings to minimise the use of
non-specific causes and intents.
68 These changes have resulted in a decrease of 381 (33%) in the number of coroner
certified deaths attributed to Other ill-defined and unspecified causes of mortality (R99)
from 1,160 in 2007 preliminary to 779 in 2008 preliminary. Further information on the
process changes and the impact they have had on 2008 data can be found in Technical
Note 1: 2008 COD Collection - Process Improvements.
Unspecif ied Causes of
Mortal i ty
66 Due to increased resources in investigating and reviewing records with a change of
codes to Sequelae when the duration is over 12 months, the underlying cause of
Sequelae of cerebrovascular disease (I69) increased by 302 (13%) from 2,398 in 2007
(prior to revisions process) to 2,700 in 2008.
Diseases of the circulatory
system (I00-I99)
65 Since 2006, there has been a significant increase in the number of deaths coded to
Dementia (F01-F03). Updates to the coding instructions in ICD-10 has resulted in the
assignment of some deaths shifting from Cerebrovascular diseases (I60-I69) to Vascular
dementia (F01). In addition, changes to the Veterans’ Entitlements Act 1986 and Military
Rehabilitation and Compensation Act 2004, and a subsequent promotional campaign
targeted at health professionals, now allow for death from vascular dementia of veterans
or members of the defence forces to be related to relevant service.
Dementia (F01-F03)
64 Deaths coded to Sequelae of other and unspecified infections and parasitic diseases
(B94) increased by 51 from 148 in 2007 preliminary to 199 in 2008, while deaths coded to
Chronic viral hepatitis (B18) decreased by 56 from 92 in 2007 preliminary to 36 in 2008.
The ABS increased resources in investigating and reviewing all records for the categories
Acute hepatitis B (B16), Other acute viral hepatitis (B17) and Chronic viral hepatitis
(B18). Where the record indicated a duration of 1 year or more, or led to another
chronic condition, these codes were changed to Sequelae of viral hepatitis (B942).
Infect ious and parasit ic
diseases (A00-B99)
63 A number of issues should be taken into account by users when analysing the 2008
causes of death data, as outlined below.
SP E C I F I C I S S U E S FO R 20 0 8
DA T A
A B S • CA U S E S OF D E A T H • 3 3 0 3 . 0 • 2 0 0 8 63
EX P L A N A T O R Y N O T E S

72 The number of deaths recorded as Intentional self-harm (Suicide) has decreased
over the last 10 years, from 2,492 in 1999 to 2,191 in 2008. This decrease can be partly
attributed to the variances in the way the ABS has coded coroner certified deaths over
time. See Explanatory notes 48-52. For 2008, the ABS has invested additional effort into
coding coroner cases which remained open at the time of processing. This process
involved making increased use of police reports, toxicology reports, autopsy reports and
coroners findings to assign a more specific cause of death. This will have an influence on
the number of deaths due to Suicide, as the majority of open coroner cases are deaths
due to external causes. See Technical Note 1: 2008 COD Collection - Process
Improvements for further information.
73 In addition, the number of deaths attributed to Suicide for 2008 is expected to
increase as data is subject to the revisions process.
74 Suicide deaths in children are an extremely sensitive issue for families and coroners.
The number of child Suicides registered each year is low in relative terms and is likely to
be underestimated. For that reason this publication does not include detailed
information about Suicides for children aged under 15 years in the commentary or data
cubes. There was an average of 10.1 Suicide deaths per year of children under 15 years
Intent ional Self-Harm
[Suicide] (X60-X84, Y87.0)
71 The following codes may include cases which could potentially have been assaults
but for which the intent was determined to be other than Assault. Such cases cannot be
separately identified in the final causes of death statistics:
! Falls (W13, W15, W17)
! Striking, contact and exposure (W20-W22, W25, W27, W40, W49, W50, W51, W81)
! Firearm discharge (W32, W33, W34)
! Accidental strangulation/hanging/suffocation (W75, W76, W83, W84)
! Contact with knife, sword or dagger (W26)
! Exposure to unspecified factor (X59)
! Events of Undetermined Intent (Y20-Y34)
! Other ill-defined and Unspecified Causes of Mortality (R99)
— nil or rounded to zero (including null cells)(a) 2008 data have been subject to process improvements which have increased the quality of these data.
See Technical Note 1: 2008 COD Collection - Process Improvements for further information.(b) Table cells containing small values have been randomly adjusted to avoid releasing confidential
information. Due to this randomisation process, totals may vary slightly across tables.(c) Recorded Crime - Victims, Australia, 2008 (cat. no. 4510.0)(d) Recorded crime - Victims consist of Murder and Manslaughter (e) From 2007 data cells with small values have been randomly assigned to protect confidentiality. As a
result some totals will not equal the sum of their components. It is important to note that cells with 0values have not been effected by confidentialisation.
20541644323242962Causes of Death (X85-Y09, Y87.1)(e)290417—3228586287Recorded Crime - Victims(b)(c)(d)
AustACTNTTasWASAQLDVic.NSW
TABLE 1: COMPARISON OF DEATHS, caused by assau l t — by State ofReg is t ra t ion —2008 (a)
70 The number of deaths recorded as Assault (X85-Y09, Y87.1) ie murder and
manslaughter and their sequelae, published in the Causes of Death publication vary from
those published by the ABS in Recorded Crime - Victims, Australia, 2008 (cat. no.
4510.0). Differences in the scope and coverage of the two collections and pending
finalisation of legal proceedings may account for the difference between the figures. It is
important to note that the number of deaths attributed to assault for 2008 is expected to
increase as data is subject to the revisions process. See Technical Note 2: Causes of
Death Revisions Process for further information.
Assault (X85-Y09, Y87.1)
64 A B S • CA U S E S OF D E A T H • 3 3 0 3 . 0 • 2 0 0 8
EX P L A N A T O R Y N O T E S

over the period 1999 to 2008. For boys, the average number of Suicides per year was 6.9,
while for girls the average number was 3.2.
75 For processing of deaths registered from 1 January 2007, revised instructions for
ABS coders were developed in order to ensure consistency in the coding of suicide
deaths and compliance with the revised notes for coding to the undetermined intent
categories. At the time that the ABS ceases processing, each coroners record on the NCIS
will have a status of 'open' or 'closed' (See Technical Note 1: 2008 COD Collection -
Process Improvements for further information on coroner certified deaths). The NCIS
case status impacts on how deaths are coded with regard to suicides. With the
introduction of the revisions process for all deaths registered from 1 January 2007,
additional information received by the ABS may lead to a more specific cause of death
code being assigned. Below is a summary of the suicide coding process used by the ABS.
Intent ional Self-Harm
[Suicide] (X60-X84, Y87.0)
continued
A B S • CA U S E S OF D E A T H • 3 3 0 3 . 0 • 2 0 0 8 65
EX P L A N A T O R Y N O T E S
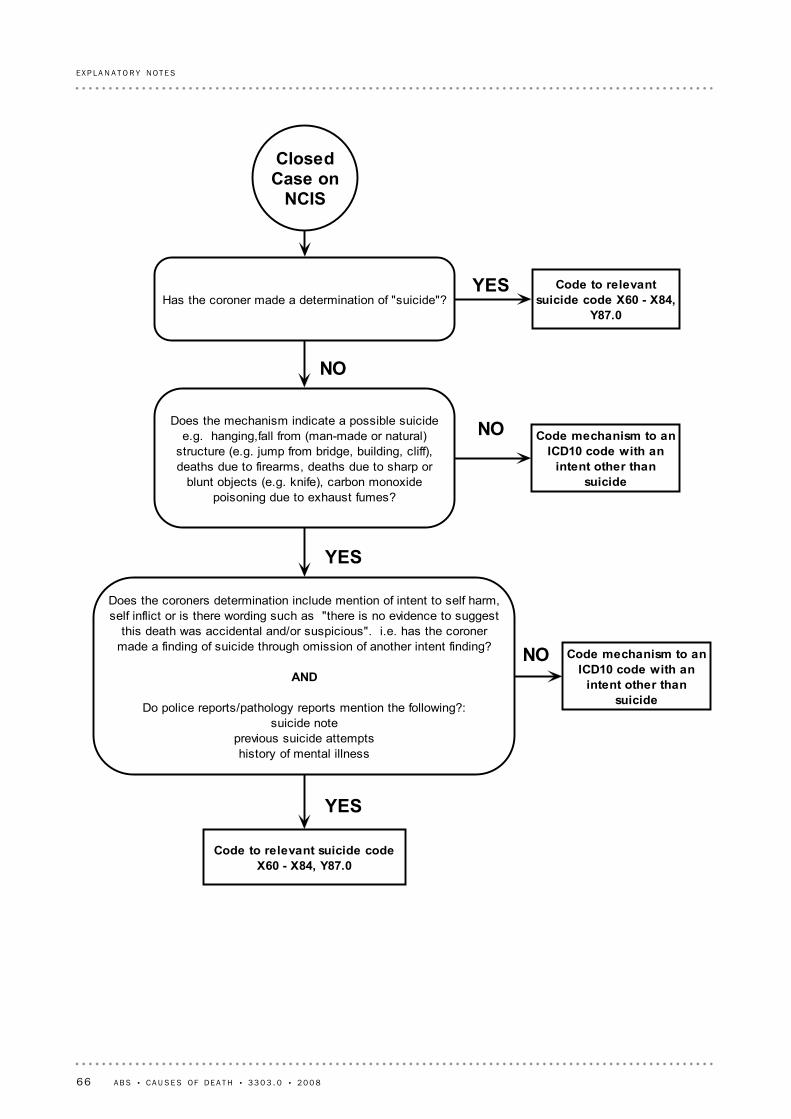
Code to relevantsuicide code X60 - X84,
Y87.0Has the coroner made a determination of "suicide"?
ClosedCase on
NCIS
Does the mechanism indicate a possible suicidee.g. hanging,fall from (man-made or natural)
structure (e.g. jump from bridge, building, cliff),deaths due to firearms, deaths due to sharp or
blunt objects (e.g. knife), carbon monoxidepoisoning due to exhaust fumes?
Does the coroners determination include mention of intent to self harm,self inflict or is there wording such as "there is no evidence to suggest
this death was accidental and/or suspicious". i.e. has the coronermade a finding of suicide through omission of another intent finding?
AND
Do police reports/pathology reports mention the following?:suicide note
previous suicide attemptshistory of mental illness
NO
YES
Code mechanism to anICD10 code with an
intent other thansuicide
NO
YES
NO Code mechanism to anICD10 code with an
intent other thansuicide
Code to relevant suicide codeX60 - X84, Y87.0
YES
66 A B S • CA U S E S OF D E A T H • 3 3 0 3 . 0 • 2 0 0 8
EX P L A N A T O R Y N O T E S

76 Due to changes in coding rules for ICD-10 in 2007, processing of data up to and
including the 2006 reference year assigned a finding of 'Undetermined Intent' only where
there had been an official coronial finding of such. Other deaths where either intent was
'not known' or 'blank' on the NCIS record, were coded with an intent of 'accidental'.
From 2007, a death is coded to an 'Undetermined Intent' code where the NCIS intent
field is: 'could not be determined'; 'unlikely to be known'; or 'blank'. This change in
coding practice has resulted in a significant increase in deaths allocated to these codes in
Undetermined Intent
(Y10-Y34, Y87.2)
A B S • CA U S E S OF D E A T H • 3 3 0 3 . 0 • 2 0 0 8 67
EX P L A N A T O R Y N O T E S

80 Other ABS publications which may be of interest are outlined below. Please note,
older publications may be available through the state and national libraries. All
publications released from 1998 onwards are available on the ABS website
<http://www.abs.gov.au>.
ABS Directions in Aboriginal and Torres Strait Islander Statistics, Jun 2007, cat. no.
4700.0
Australian Demographic Statistics, cat no. 3101.0
Australian Social Trends, cat. no. 4102.0
Births, Australia, cat. no. 3301.0
Causes of Deaths, Australia: Summary Tables, cat. no. 3303.0.55.001
Deaths, Australia, cat. no. 3302.0
Deaths From External Causes, Australia - 1998 to 2002, cat. no. 3320.0
Demography Working Paper 2004/3 - Calculating Experimental Life Tables for Use in
Population Estimates and Projections of Aboriginal and Torres Strait Islander
Australians, 1991 to 2001, cat. no. 3106.0.55.003
Drug Induced Deaths, cat. no. 3321.0.55.001
Experimental Estimates and Projections, Aboriginal and Torres Strait Islander
Australians, 1991 to 2009, cat. no. 3238.0
Information Paper: External Causes of Death, Data Quality, 2005 (cat. no
3317.0.55.001)
Information Paper: ABS Causes of Death Statistics: Concepts, Sources, and Methods,
2006 (cat. no. 3317.0.55.002)
Information Paper: Cause of Death Certification, Australia, 2008 (cat. no.
1205.0.55.001)
Mortality Atlas, Australia, 1997 to 2000, cat. no. 3318.0
Multiple Cause of Death Analysis, 1997-2001, cat. no. 3319.0.55.001
Population Projections, Australia, 2005 to 2101, cat. no. 3222.0
Recent Developments in the Collection of Aboriginal and Torres Strait Islander
Health and Welfare Statistics, 2005, cat. no. 4704.0.55.001
Suicides: Recent Trends, Australia, 1993 to 2003, cat. no. 3309.0.55.001
The Health and Welfare of Australia's Aboriginal and Torres Strait Islander Peoples,
2008, cat. no. 4704.0
81 ABS products and publications are available free of charge from the ABS website <
http://www.abs.gov.au>. Click on Statistics to gain access to the full range of ABS
statistical and reference information. For details on products scheduled for release in the
coming week, click on the Future Releases link on the ABS homepage.
RE L A T E D PR O D U C T S
79 This publication draws extensively on information provided freely by the state and
territory Registrars of Births, Deaths and Marriages, and the Victorian Institute of
Forensic Medicine who manage the NCIS. Their continued cooperation is very much
appreciated: without it, the wide range of vitals statistics published by the ABS would not
be available.
AC K N O W L E D G E M E N T
78 Where figures have been rounded, discrepancies may occur between totals and
sums of the component items.
EF F E C T S OF RO U N D I N G
77 Data cells with small values have been randomly assigned to protect confidentiality.
As a result some totals will not equal the sum of their components. It is important to
note that cells with 0 values have not been effected by confidentialisation.
CO N F I D E N T I A L I S A T I O N OF
DA T A
2007 and 2008. However, it is important to note that the number of deaths attributed to
'Undetermined Intent' codes for both 2007 and 2008 will decrease. See Technical Note 2:
Causes of Death - Revisions Process for further information.
Undetermined Intent
(Y10-Y34, Y87.2) continued
68 A B S • CA U S E S OF D E A T H • 3 3 0 3 . 0 • 2 0 0 8
EX P L A N A T O R Y N O T E S

AB B R E V I A T I O N S . . . . . . . . . . . . . . . . . . . . . . . . . . . . . . . . . . . . . .
years of potential life lostYPLL
World Health OrganizationWHO
Western AustraliaWA
VictoriaVic.
Updating and Revision CommitteeURC
TasmaniaTas.
statistical local areaSLA
Sudden Infant Death SyndromeSIDS
standardised death rateSDR
Standard Australian Classification of CountriesSACC
South AustraliaSA
QueenslandQld
Northern TerritoryNT
New South WalesNSW
National Health Priority AreaNHPA
National Coroners Information SystemNCIS
National Centre for Health StatisticsNCHS
numberno.
Medical Mortality Data SystemMMDS
medical certificate of cause of deathMCCD
indirect standardised death rateISDR
infant mortality rateIMR
ischaemic heart diseaseIHD
International Classification of Diseases 10th RevisionICD-10
Human Immunodeficiency VirusHIV
estimated resident populationERP
death registration formDRF
chronic obstructive airways diseaseCOAD
Clinically ModifiedCM
crude death rateCDR
Catalogue numbercat. no.
AustraliaAust.
Australian Standard Geographical ClassificationASGC
age-specific death rateASDR
Australian and New Zealand Standard Classification of OccupationsANZSCO
Australian Institute of Health and WelfareAIHW
Acquired Immune Deficiency SyndromeAIDS
Australian Capital TerritoryACT
automated coding systemACS
Australian Bureau of StatisticsABS
A B S • CA U S E S OF D E A T H • 3 3 0 3 . 0 • 2 0 0 8 69
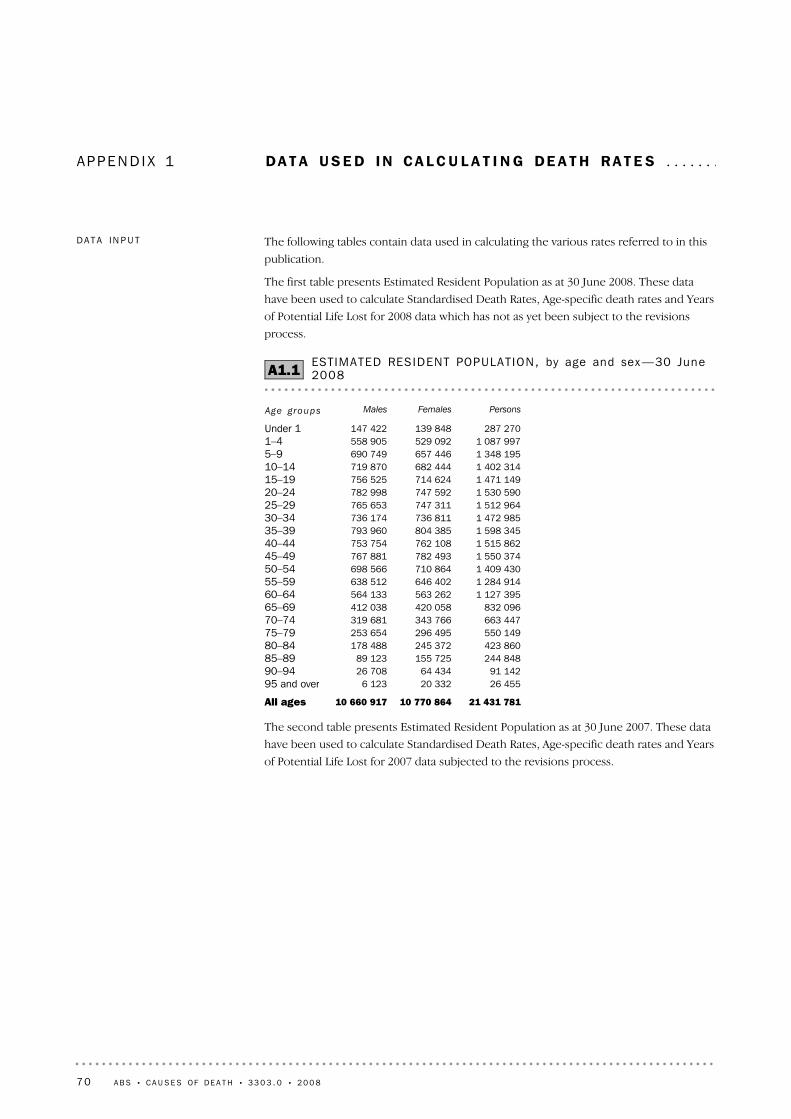
APP E N D I X 1 DA T A US E D IN CA L C U L A T I N G DE A T H RA T E S . . . . . . .
The second table presents Estimated Resident Population as at 30 June 2007. These data
have been used to calculate Standardised Death Rates, Age-specific death rates and Years
of Potential Life Lost for 2007 data subjected to the revisions process.
21 431 78110 770 86410 660 917All ages
26 45520 3326 12395 and over91 14264 43426 70890–94
244 848155 72589 12385–89423 860245 372178 48880–84550 149296 495253 65475–79663 447343 766319 68170–74832 096420 058412 03865–69
1 127 395563 262564 13360–641 284 914646 402638 51255–591 409 430710 864698 56650–541 550 374782 493767 88145–491 515 862762 108753 75440–441 598 345804 385793 96035–391 472 985736 811736 17430–341 512 964747 311765 65325–291 530 590747 592782 99820–241 471 149714 624756 52515–191 402 314682 444719 87010–141 348 195657 446690 7495–91 087 997529 092558 9051–4
287 270139 848147 422Under 1
PersonsFemalesMalesAge groups
ESTIMATED RESIDENT POPULAT ION, by age and sex —30 June2008A1.1
The following tables contain data used in calculating the various rates referred to in this
publication.
The first table presents Estimated Resident Population as at 30 June 2008. These data
have been used to calculate Standardised Death Rates, Age-specific death rates and Years
of Potential Life Lost for 2008 data which has not as yet been subject to the revisions
process.
DA T A IN P U T
70 A B S • CA U S E S OF D E A T H • 3 3 0 3 . 0 • 2 0 0 8

(a) Used to calculate infant death rates
296 621144 334152 2872008
285 213138 757146 4562007265 949129 257136 6922006259 791126 363133 4282005254 246123 646130 6002004248 870121 513127 3571999
PersonsFemalesMales
LIVE BIRTHS REGISTERED (a) , Aust ra l ia —1999– 2008A1.3
The thid table presents the number of live births for Australia for selected years, 1999 to
2008. These data have been used in calculating infant death rates - the number of deaths
of children under one year of age per 1,000 live births in the same period.
21 072 45210 596 92510 475 527All ages
23 67818 4095 26995 and over89 06263 47725 58590–94
229 092147 19481 89885–89415 090242 781172 30980–84552 953298 830254 12375–79646 647335 160311 48770–74807 740407 954399 78665–69
1 064 697531 517533 18060–641 269 554636 847632 70755–591 387 166698 700688 46650–541 523 955769 819754 13645–491 522 238766 341755 89740–441 569 866790 388779 47835–391 475 392739 976735 41630–341 455 791720 776735 01525–291 508 426737 705770 72120–241 447 517702 714744 80315–191 402 036682 335719 70110–141 343 530655 049688 4815–91 061 553516 621544 9321–4
276 469134 332142 137Under 1
PersonsFemalesMalesAge groups
ESTIMATED RESIDENT POPULAT ION, by age and sex —30 June2007A1.2
DA T A IN P U T continued
A B S • CA U S E S OF D E A T H • 3 3 0 3 . 0 • 2 0 0 8 71
A P P E N D I X 1 • D A T A U S E D I N CA L C U L A T I N G D E A T H R A T E S
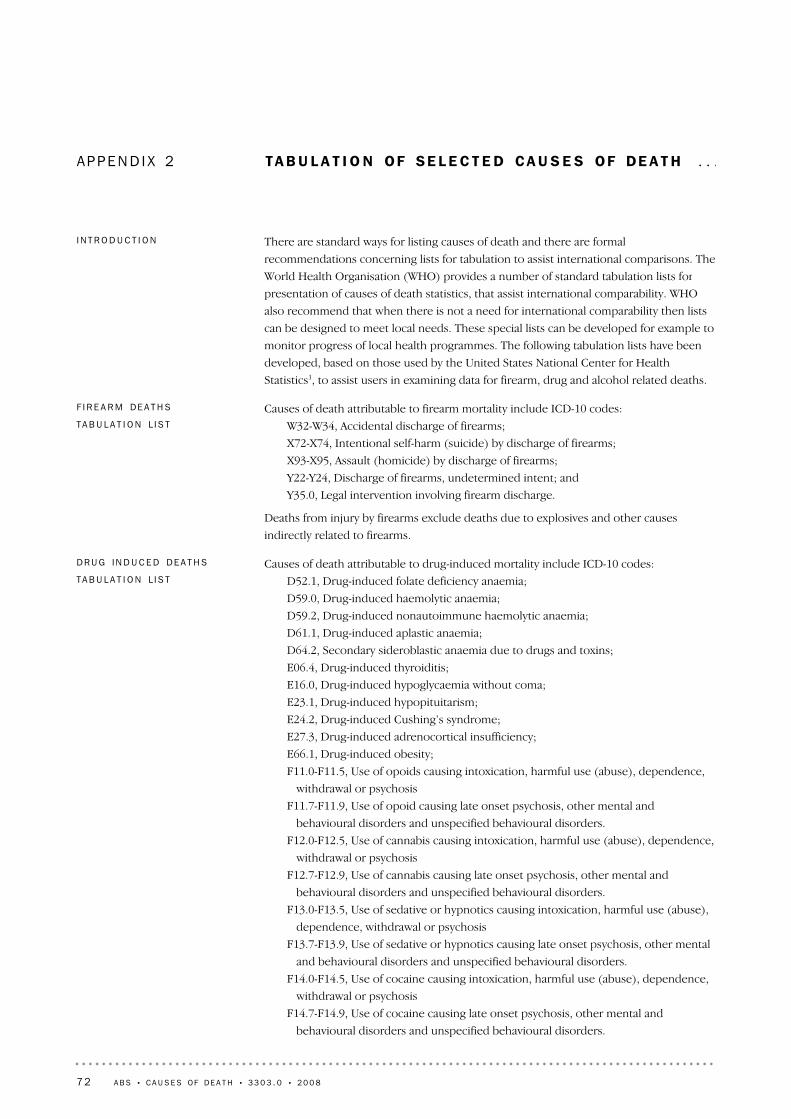
APP E N D I X 2 TA B U L A T I O N OF SE L E C T E D CA U S E S OF DE A T H . . .
Causes of death attributable to drug-induced mortality include ICD-10 codes:
D52.1, Drug-induced folate deficiency anaemia;
D59.0, Drug-induced haemolytic anaemia;
D59.2, Drug-induced nonautoimmune haemolytic anaemia;
D61.1, Drug-induced aplastic anaemia;
D64.2, Secondary sideroblastic anaemia due to drugs and toxins;
E06.4, Drug-induced thyroiditis;
E16.0, Drug-induced hypoglycaemia without coma;
E23.1, Drug-induced hypopituitarism;
E24.2, Drug-induced Cushing’s syndrome;
E27.3, Drug-induced adrenocortical insufficiency;
E66.1, Drug-induced obesity;
F11.0-F11.5, Use of opoids causing intoxication, harmful use (abuse), dependence,
withdrawal or psychosis
F11.7-F11.9, Use of opoid causing late onset psychosis, other mental and
behavioural disorders and unspecified behavioural disorders.
F12.0-F12.5, Use of cannabis causing intoxication, harmful use (abuse), dependence,
withdrawal or psychosis
F12.7-F12.9, Use of cannabis causing late onset psychosis, other mental and
behavioural disorders and unspecified behavioural disorders.
F13.0-F13.5, Use of sedative or hypnotics causing intoxication, harmful use (abuse),
dependence, withdrawal or psychosis
F13.7-F13.9, Use of sedative or hypnotics causing late onset psychosis, other mental
and behavioural disorders and unspecified behavioural disorders.
F14.0-F14.5, Use of cocaine causing intoxication, harmful use (abuse), dependence,
withdrawal or psychosis
F14.7-F14.9, Use of cocaine causing late onset psychosis, other mental and
behavioural disorders and unspecified behavioural disorders.
DR U G IN D U C E D DE A T H S
TA B U L A T I O N L I S T
Causes of death attributable to firearm mortality include ICD-10 codes:
W32-W34, Accidental discharge of firearms;
X72-X74, Intentional self-harm (suicide) by discharge of firearms;
X93-X95, Assault (homicide) by discharge of firearms;
Y22-Y24, Discharge of firearms, undetermined intent; and
Y35.0, Legal intervention involving firearm discharge.
Deaths from injury by firearms exclude deaths due to explosives and other causes
indirectly related to firearms.
F I R E A R M DE A T H S
TA B U L A T I O N L I S T
There are standard ways for listing causes of death and there are formal
recommendations concerning lists for tabulation to assist international comparisons. The
World Health Organisation (WHO) provides a number of standard tabulation lists for
presentation of causes of death statistics, that assist international comparability. WHO
also recommend that when there is not a need for international comparability then lists
can be designed to meet local needs. These special lists can be developed for example to
monitor progress of local health programmes. The following tabulation lists have been
developed, based on those used by the United States National Center for Health
Statistics1, to assist users in examining data for firearm, drug and alcohol related deaths.
I N T R O D U C T I O N
72 A B S • CA U S E S OF D E A T H • 3 3 0 3 . 0 • 2 0 0 8
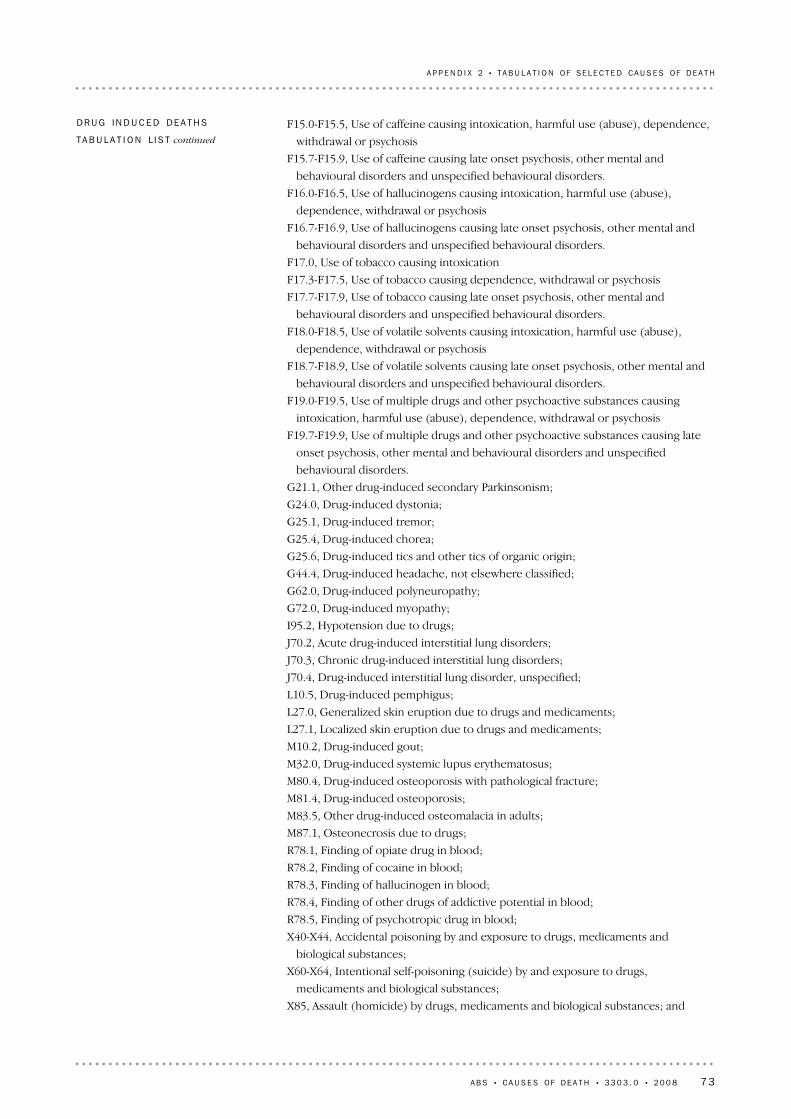
F15.0-F15.5, Use of caffeine causing intoxication, harmful use (abuse), dependence,
withdrawal or psychosis
F15.7-F15.9, Use of caffeine causing late onset psychosis, other mental and
behavioural disorders and unspecified behavioural disorders.
F16.0-F16.5, Use of hallucinogens causing intoxication, harmful use (abuse),
dependence, withdrawal or psychosis
F16.7-F16.9, Use of hallucinogens causing late onset psychosis, other mental and
behavioural disorders and unspecified behavioural disorders.
F17.0, Use of tobacco causing intoxication
F17.3-F17.5, Use of tobacco causing dependence, withdrawal or psychosis
F17.7-F17.9, Use of tobacco causing late onset psychosis, other mental and
behavioural disorders and unspecified behavioural disorders.
F18.0-F18.5, Use of volatile solvents causing intoxication, harmful use (abuse),
dependence, withdrawal or psychosis
F18.7-F18.9, Use of volatile solvents causing late onset psychosis, other mental and
behavioural disorders and unspecified behavioural disorders.
F19.0-F19.5, Use of multiple drugs and other psychoactive substances causing
intoxication, harmful use (abuse), dependence, withdrawal or psychosis
F19.7-F19.9, Use of multiple drugs and other psychoactive substances causing late
onset psychosis, other mental and behavioural disorders and unspecified
behavioural disorders.
G21.1, Other drug-induced secondary Parkinsonism;
G24.0, Drug-induced dystonia;
G25.1, Drug-induced tremor;
G25.4, Drug-induced chorea;
G25.6, Drug-induced tics and other tics of organic origin;
G44.4, Drug-induced headache, not elsewhere classified;
G62.0, Drug-induced polyneuropathy;
G72.0, Drug-induced myopathy;
I95.2, Hypotension due to drugs;
J70.2, Acute drug-induced interstitial lung disorders;
J70.3, Chronic drug-induced interstitial lung disorders;
J70.4, Drug-induced interstitial lung disorder, unspecified;
L10.5, Drug-induced pemphigus;
L27.0, Generalized skin eruption due to drugs and medicaments;
L27.1, Localized skin eruption due to drugs and medicaments;
M10.2, Drug-induced gout;
M32.0, Drug-induced systemic lupus erythematosus;
M80.4, Drug-induced osteoporosis with pathological fracture;
M81.4, Drug-induced osteoporosis;
M83.5, Other drug-induced osteomalacia in adults;
M87.1, Osteonecrosis due to drugs;
R78.1, Finding of opiate drug in blood;
R78.2, Finding of cocaine in blood;
R78.3, Finding of hallucinogen in blood;
R78.4, Finding of other drugs of addictive potential in blood;
R78.5, Finding of psychotropic drug in blood;
X40-X44, Accidental poisoning by and exposure to drugs, medicaments and
biological substances;
X60-X64, Intentional self-poisoning (suicide) by and exposure to drugs,
medicaments and biological substances;
X85, Assault (homicide) by drugs, medicaments and biological substances; and
DR U G IN D U C E D DE A T H S
TA B U L A T I O N L I S T continued
A B S • CA U S E S OF D E A T H • 3 3 0 3 . 0 • 2 0 0 8 73
A P P E N D I X 2 • T A B U L A T I O N OF SE L E C T E D CA U S E S OF D E A T H

Causes of death attributable to alcohol-induced mortality include ICD-10 codes:
E24.4, Alcohol-induced pseudo-Cushing’s syndrome;
F10, Mental and behavioural disorders due to alcohol use;
G31.2, Degeneration of nervous system due to alcohol;
G62.1, Alcoholic polyneuropathy;
G72.1, Alcoholic myopathy;
I42.6, Alcoholic cardiomyopathy;
K29.2, Alcoholic gastritis;
K70, Alcoholic liver disease;
K86.0, Alcohol-induced chronic pancreatitis;
R78.0, Finding of alcohol in blood;
X45, Accidental poisoning by and exposure to alcohol;
X65, Intentional self-poisoning by and exposure to alcohol; and
Y15, Poisoning by and exposure to alcohol, undetermined intent.
Alcohol-induced causes exclude accidents, homicides, and other causes indirectly related
to alcohol use. This category also excludes newborn deaths associated with maternal
alcohol use.
1. Miniño AM, Heron MP, Murphy SL, Kochankek, KD. Deaths: Final Data for 2004.
National vital statistics reports; vol 55 no 19. Hyattsville, MD: National Center for
Health Statistics. 2007.
AL C O H O L IN D U C E D DE A T H S
TA B U L A T I O N L I S T
Y10-Y14, Poisoning by and exposure to drugs, medicaments and biological
substances, undetermined intent.
Drug-induced causes exclude accidents, homicides, and other causes indirectly related to
drug use. Also excluded are newborn deaths associated with mother’s drug use.
DR U G IN D U C E D DE A T H S
TA B U L A T I O N L I S T continued
74 A B S • CA U S E S OF D E A T H • 3 3 0 3 . 0 • 2 0 0 8
A P P E N D I X 2 • T A B U L A T I O N OF SE L E C T E D CA U S E S OF D E A T H

TECH N I C A L NOTE 1 20 0 8 CO D CO L L E C T I O N - PR O C E S SIM P R O V E M E N T S . . . . . . . . . . . . . . . . . . . . . . . . . . . . . . . . . . . . . .
1 This Technical Note contains information on two processing improvements which
have been introduced to the causes of death collection for the release of 2008
preliminary data. These improvements relate to the way the ABS codes coroner certified
deaths and have had the effect of significantly improving the quality of cause of death
codes assigned to coroner certified cases.
2 In order to complete a death registration, the death must be certified by either a
doctor using the Medical Certificate of Cause of Death, or by a coroner. It is the role of
the coroner to investigate the circumstances surrounding all reportable deaths and to
establish wherever possible the circumstances surrounding the death, and the cause(s)
of death. Generally most deaths due to external causes will be referred to a coroner for
investigation; these include those deaths which are possible instances of Intentional
self-harm [Suicide].
3 When coronial investigations are complete, causes of death information is passed to
the Registrar of Births, Deaths and Marriages, as well as to the National Coroners
Information System (NCIS). The ABS uses the NCIS as the only source of data to code
coroner certified deaths. Where a case remains open on the NCIS at the time the ABS
ceases processing and insufficient information is available to code a cause of death, less
specific ICD codes are assigned as required by the ICD coding rules.
4 The specificity with which open cases are able to be allocated an ICD-10 code is
directly related to the amount and type of information available on the NCIS. The
amount of information available for open cases varies considerably from no information
to detailed police, autopsy and toxicology reports. There may also be interim findings of
'intent'.
5 The manner or intent of an injury which leads to death, is determined by whether
the injury was inflicted purposefully or not (in some cases, intent cannot be determined)
and, when it is inflicted purposefully (intentional), whether the injury was self-inflicted
(Suicide) or inflicted by another person (assault).
6 In order to classify a death as Suicide the ICD-10 interpretation used by the ABS
requires that specific documentation from a medical or legal authority be available
regarding both the self-inflicted nature and suicidal intent of the incident. If this
information is not available then the death must be classified as accidental. ABS uses
instructions for coders to ensure consistency in the coding of suicide deaths.
7 The first of the new processes to be introduced for 2008 data relates to the way that
the ABS utilises information on the Medical Certificate of Cause of Death. For both open
and closed coroners cases, more time was taken to investigate part 2 of the certificate
when a non-specific underlying cause was shown in part 1. Part 2 of the certificate details
conditions that may have contributed to the death but were not part of the sequence of
events that led to death.
8 The second new process relates to the use of additional information available on
NCIS. Increased resources and time were spent investigating coroners reports to identify
specific causes of death. This involved making increased use of police reports, toxicology
reports, autopsy reports and coroners findings for both open and closed cases to
minimise the use of non-specific causes and intents.
I N T R O D U C T I O N
A B S • CA U S E S OF D E A T H • 3 3 0 3 . 0 • 2 0 0 8 75

14 For deaths registered in 2008, 13% were certified by a coroner. There are variations
between jurisdictions in relation to deaths certified by a coroner, ranging from 10-11% of
deaths certified by a coroner in New South Wales, Queensland and Tasmania to 32% of
deaths certified by a coroner in the Northern Territory. The proportion of deaths
certified by a coroner in 2008 is comparable to previous years.
DE A T H S BY TY P E OF
CE R T I F I E R
13 The 2008 data provided in this publication has not yet been subjected to the
revisions process, which will further improve the quality of the data. Therefore, the
information on 2008 causes of death is considered preliminary - i.e. refers to the point in
time (31 January 2010) when initial 2008 processing was finalised. The 2008 data will go
through the revisions process twice, and will be released in the Causes of Death
publications in 2011 (2008 revised) and 2012 (2008 final). Information on the revisions
process and how it is applied to causes of death data can be found in Technical Note 2:
Causes of Death - Revisions Process.
9 The introduction of these processes have resulted in improved data quality in
relation to assigning unspecified cause codes to coroner certified deaths. There has been
a decrease of 381 (33%) in the number of coroner certified deaths attributed to Other
ill-defined and unspecified causes of mortality (R99) from 1,160 in 2007 (preliminary) to
779 in 2008 (preliminary).
10 As less specific codes are generally associated with open rather than closed coroner
certified cases, the new processes have had the effect of significantly improving the
quality of cause of death codes assigned to open cases. Additionally, a large number of
coroner cases are due to external causes, therefore the new processes have also had the
effect of improving these data, including Suicide data.
11 Prior to 2008, these processes were not routinely undertaken for coroner certified
cases. The impact of these new processes on the 2008 data are discussed further in this
Technical Note.
12 The timeline below presents the processing cycle for the 2008 data thus far. It
shows the different processing dates for doctor certified and coroner certified deaths.
I N T R O D U C T I O N continued
76 A B S • CA U S E S OF D E A T H • 3 3 0 3 . 0 • 2 0 0 8
T E C H N I C A L N O T E 1 • 2 0 0 8 CO D CO L L E C T I O N - P R O C E S S I M P R O V E M E N T S

15 All causes of death can be grouped to describe the type of death, whether it be
from a disease or condition, or from an injury or whether the cause is unknown. These
are generally described as:
! Natural Causes - deaths due to diseases (for example diabetes, cancer, heart disease
etc) (A00-Q99, R00-R98)
! External Causes- deaths due to causes external to the body (for example Suicide,
transport accidents, falls, poisoning etc) (V01-Y98)
! Unknown Causes - deaths where it is unable to be determined whether the cause
was natural or external (R99)
16 The following diagram describes registered deaths in 2008 with regard to the type
of certifier, the type of death and whether information was available on the NCIS at the
end of the ABS 2008 Causes of Death processing period.
(a) 2008 data have been subject to process improvements which have increased the quality of these data.See Technical Note 1: 2008 COD Collection - Process Improvements for further information.
(b) 2007 data are revised and subject to a further revisions process. See Technical Note 3: 2007 Revisionsfor further information.
(c) Causes of death data for 2008 are preliminary and subject to a revisions process. See Technical Note 2:Causes of Death - Revisions Process.
143 9461318 66887125 278137 8541216 85188121 003Australia
1 93118348821 5831 78119329821 452ACT1 04132338687039753231368662NT4 19010439903 7514 10111447893 654Tas.
12 749141 8138610 93612 304141 7348610 570WA12 642141 8328610 81012 388151 8678510 521SA27 554113 1398924 41526 015112 9758923 040Qld35 514155 4178530 09733 923124 1718829 752Vic.48 325115 3428942 98346 367115 0158941 352NSW
no.%no.%no.no.%no.%no.
Total
(2008)
Coroner
(2008)
Doctor
(2008)
Total
(2007)
Coroner
(2007)
Doctor
(2007)
TABLE 1: DEATHS BY TYPE OF CERT IF IER AND STATE/TERRITORY OFREGISTRAT ION— 2007 and 2008(a) (b ) (c )
DE A T H S BY TY P E OF
CE R T I F I E R continued
A B S • CA U S E S OF D E A T H • 3 3 0 3 . 0 • 2 0 0 8 77
T E C H N I C A L N O T E 1 • 2 0 0 8 CO D CO L L E C T I O N - P R O C E S S I M P R O V E M E N T S

17 There were 18,668 deaths (or 13% of all deaths) certified by a coroner in 2008. Of
those, 11,335 (61%) had a status of closed on NCIS and ABS had full information
available in order to undertake cause of death coding. There were 6,949 (37%) cases with
a status of open on NCIS in 2008 which may not have had information available at the
time of processing. However, all open cases were subject to the new processing
improvements and use was made of any additional information found in part 2 of the
Medical Certificate of Cause of Death, or in any available police reports, toxicology
reports, autopsy reports or coroners findings.
OP E N AN D CL O S E D CA S E S
ON NC I S
78 A B S • CA U S E S OF D E A T H • 3 3 0 3 . 0 • 2 0 0 8
T E C H N I C A L N O T E 1 • 2 0 0 8 CO D CO L L E C T I O N - P R O C E S S I M P R O V E M E N T S

19 The cases with a status of 'open' on the NCIS, were investigated with regard to
whether the cases were of an unknown cause, natural cause or external cause. Over half
of all deaths in 2008 due to unknown causes (53%), and 38% of all deaths due to external
causes, were coroner certified deaths which remained open on the NCIS at the close of
processing. A small proportion of all deaths due to natural causes (2.4%) were also
coroner certified deaths which remained open.
20 In 2008, 467 open cases (6.7% of all open cases) had insufficient information
recorded on NCIS to enable any cause of death to be determined. These records have
been coded to Other ill-defined and unspecified causes of mortality (R99). This
compared to 977 open cases (19% of all open cases) coded to Other ill-defined and
unspecified causes of mortality (R99) for preliminary 2007 cause of death data. The table
below indicates the impact of 2008 processing improvements on the number of open
coroner cases assigned to external or natural causes rather than 'unknown'.
— nil or rounded to zero (including null cells)(a) 2008 data have been subject to process improvements which have increased the
quality of these data. See Technical Note 1: 2008 COD Collection - ProcessImprovements for further information.
(b) Data cells with small values have been randomly assigned to protect theconfidentiality of individuals. As a result, some totals will not equal the sum of theircomponents. Cells with a zero value have not been affected by confidentialisation.
(c) Causes of death data for 2008 are preliminary and subject to a revisions process.See Technical Note 2: Causes of Death - Revisions Process.
(d) Includes coroner case status of 'blank', 'not stated' and 'not applicable'.
18 668384376 9496111 335Australia348—206980279ACT33873110467227NT4396187781356Tas.
1 8132028503711 290WA1 832616290841 536SA3 139173662 06729899Qld5 41773311 694673 650Vic.5 34299402 145583 098NSW
no.%no.%no.
TotalOther(d)OpenClosed
2008 CASES AS AT JANUARY 2010
TABLE 2: CORONER CERTIF IED DEATHS, BY CASE STATUS, State andter r i to r y of reg is t ra t ion —2008(a) (b ) (c )
18 On a jurisdictional level, the proportion of cases which have a status of open on the
NCIS varies significantly. This means that the impact of the new process improvements
has varied across states and territories. The largest impact was to Queensland coroner
certified cases, where 66% of cases were open at the cessation of ABS processing
compared with the Australia-wide average of 37%.
OP E N AN D CL O S E D CA S E S
ON NC I S continued
A B S • CA U S E S OF D E A T H • 3 3 0 3 . 0 • 2 0 0 8 79
T E C H N I C A L N O T E 1 • 2 0 0 8 CO D CO L L E C T I O N - P R O C E S S I M P R O V E M E N T S

21 Further analysis has also been completed of open cases on NCIS to consider the
intent of the injury for those cases that were coded to external causes, as shown in the
table below. This analysis highlights the improvements in data quality due to the changes
in processing coroner certified cases which were introduced in 2008.
22 For 2008, there were 3,313 open coroner cases assigned an external cause of death.
Of these cases, 38% (1,267) were coded to accidental intent, 26% (856) were coded to an
intent of Suicide, 4% (126) were coded to assault and 31% (1,064) were found to have
either an undetermined or other intent. This contrasted with the intent of external cause
deaths in 2007 preliminary data, where 37% (816) of open cases due to external causes
were coded to accidental intent, 18% (384) were coded to an intent of Suicide, 4% (90)
were coded to assault and 41% (904) were found to have either an undetermined or
other intent. The increase of open case external cause deaths coded to an intent of
Suicide, and the corresponding decrease in those deaths assigned an undetermined or
other intent, reflects the improved processes outlined above.
IM P A C T ON EX T E R N A L CA U S E
BY IN T E N T DA T A
(a) 2008 data have been subject to process improvements which have increased the quality of these data.See Technical Note 1: 2008 COD Collection - Process Improvements for further information.
(b) Causes of death data for 2008 are preliminary and subject to a revisions process. See Technical Note2: Causes of Death - Revisions Process.
(c) 2007 data presented here are preliminary and have not been subjected to the revisions process. SeeTechnical Note 3: 2007 Revisions for further information.
(d) For 2007 preliminary data, some data have moved between originally published cause categories dueto a more specific allocation to 'Natural' and 'Unknown' cause categories during the processing of 2008data.
(e) Data cells with small values have been randomly assigned to protect the confidentiality of individuals. Asa result, some totals will not equal the sum of their components. Cells with a zero value have not beenaffected by confidentialisation.
(f) External Causes- deaths due to causes external to the body (for example suicide, transport accidents,falls, poisoning etc). External causes are certified by coroners. (V01-V99)
(g) Natural Causes - deaths due to diseases (for example diabetes, cancer, heart disease etc). Naturalcauses are predominantly certified by doctors. (A00-Q99, R00-R98)
(h) Unknown Causes - deaths where it is unable to be determined whether the cause was natural orexternal. Predominantly these deaths are certified by coroners. (R99)
6 94969104775032902 0671 6942 145Total
6.71.44.81.33.23.413.91.75.4% of total467151161028729116Unknown Cause
45.653.627.939.022.741.742.448.753.0% of total3 1693729301141218768251 137Natural Cause
47.742.067.359.774.254.843.749.641.6% of total3 313297046373159904840892External Cause
PR E L I M I N A R Y 20 0 8
5 1283585633182742 1507831 420Total
19.111.45.91.612.613.531.21.814.5% of total977253403767014206Unknown Cause(h)
38.260.021.242.923.939.132.140.749.2% of total1 95721182776107690319699Natural Cause(g)
42.828.672.955.663.547.436.757.536.3% of total2 194106235202130790450515External Cause(f)
PR E L I M I N A R Y 20 0 7
AUSTACTNTTASWASAQLDVicNSW
TABLE 3 OPEN CORONER CASES BY TYPE OF CAUSE, 2007 Pre l im inaryand 2008 Pre l im inary (a ) (b ) (c ) (d ) —State and ter r i to r y ofreg is t ra t ion(e )
OP E N AN D CL O S E D CA S E S
ON NC I S continued
80 A B S • CA U S E S OF D E A T H • 3 3 0 3 . 0 • 2 0 0 8
T E C H N I C A L N O T E 1 • 2 0 0 8 CO D CO L L E C T I O N - P R O C E S S I M P R O V E M E N T S

— nil or rounded to zero (including null cells)(a) 2008 data have been subject to process improvements which have increased the quality of these
data. See Technical Note 1: 2008 COD Collection - Process Improvements for further information.(b) Causes of death data for 2008 are preliminary and subject to a revisions process. See Technical Note
2: Causes of Death - Revisions Process.(c) 2007 data presented here are preliminary and have not been subjected to the revisions process. See
Technical Note 3: 2007 Revisions for further information.(d) For 2007 preliminary data, some data have moved between originally published intent categories due
to a more specific code allocation in the processing of 2008 data.(e) Data cells with small values have been randomly assigned to protect the confidentiality of individuals.
As a result, some totals will not equal the sum of their components. Cells with a zero value have notbeen affected by confidentialisation.
(f) Care needs to be taken in interpreting figures relating to Suicide due to limitations of data, seeExplanatory Notes 72-75.
1000.931.23.825.838.2%3 313311 0331268561 267AUS
1006.9—10.317.265.5%292—3519ACT
100—2.98.620.070.0%70—261449NT
100—6.56.545.741.3%46—332119TAS
1000.812.98.623.354.4%3733483287203WA1003.817.011.321.446.5%159627183474SA1000.519.72.337.140.4%904517821335365QLD1001.435.42.922.238.1%8401229724187320VIC1000.553.62.119.424.4%892447819173218NSW
20 0 8
1000.940.04.117.537.4%2 1942087891384821AUS
100—40.030.0—70.0%10—43—7ACT
100—3.29.716.167.7%62—261042NT
1005.711.45.714.365.7%35242523TAS
1001.59.97.914.467.3%2023201629136WA1002.312.310.030.046.9%130316133961SA1000.847.72.420.428.7%790637719161227QLD1001.345.65.318.928.9%45062052485130VIC1000.948.91.610.737.9%5155252855195NSW
20 0 7
TotalOther
Undetermined
intent
(Y10-Y34,
Y87.2)
Assault
(X85-Y09,
Y87.1)
Intentional
self harm
(X60-X84,
Y87.0)(f)
Accidental
(V01-X59,
Y85, Y86)
TABLE 4: OPEN CORONER CASES, Exte rna l causes by in ten t —Stateand ter r i to r y of reg is t ra t ion —2007- 2008(a) (b ) (c ) (d ) (e )
IM P A C T ON EX T E R N A L CA U S E
BY IN T E N T DA T A continued
A B S • CA U S E S OF D E A T H • 3 3 0 3 . 0 • 2 0 0 8 81
T E C H N I C A L N O T E 1 • 2 0 0 8 CO D CO L L E C T I O N - P R O C E S S I M P R O V E M E N T S

TECH N I C A L NOTE 2 CA U S E S OF DE A T H - RE V I S I O N S PR O C E S S . . . . . . .
5 All coroner certified deaths registered after 1 January 2007 are now subject to a
revisions process after 12 and 24 months. The COD revisions process allows the ABS to
code any further information loaded to the NCIS after the preliminary coding took place.
In many cases, the coronial cases will be closed, with the coroner having determined the
underlying cause of death and allowing the ABS to code a more specific cause of death. If
the case remains open on the NCIS, ABS will investigate and use additional information
from police reports, toxicology reports, autopsy reports and coroners findings to assign a
more specific cause of death to these open cases. It is expected that all open cases will
be investigated in this manner from 2008 onwards.
RE V I S I O N S PR O C E S S
1 An ongoing issue for the Cause of Death collection has been that the quality of the
data can be affected by the length of time required for the coronial process to be
finalised and the coroner case closed. For some time, these concerns have been raised
by key users of Causes of Death (COD) data regarding the quality of external causes data
(e.g. deaths due to intentional self-harm (Suicide), homicide, Sudden Infant Death
Syndrome (SIDS) and motor vehicle accidents). The ABS have addressed these data
quality concerns in two ways.
! First, by increasing the length of time from the end of the reference period to
publication of data from 11 to 15 months to allow for a longer time period to receive
information on coroner certified deaths; and
! Second by introducing a process of revisions to COD data. This technical note will
discuss in detail the revisions process which will be applied to COD data.
2 Up to and including deaths registered in 2006, ABS Causes of death processing was
finalised at a point in time. At this point not all deaths registered in the reference year
which were referred to the coroner, had been investigated, the case closed and relevant
information loaded to the National Coroners Information System (NCIS). The coronial
process can take several years if an inquest is being held or complex investigations are
being undertaken. In these instances, the cases remain open on the NCIS. Impacts on
data quality for coroner certified deaths in terms of specificity of ICD code are:
! general increases in the length of coronial investigations
! increases in the workload of coroners
! the timeliness of input of coronial findings to the NCIS.
3 To address these data quality issues, all coroner certified deaths registered after 1
January 2007 are now subject to a revisions process. The revisions process enables the
use of additional information relating to coroner certified deaths either 12 or 24 months
after initial processing. This increases the specificity of the assigned ICD-10 codes over
time. As 12 or 24 months of time has passed since initial processing, further information
may have become available to the ABS about the causes of these deaths.
4 2007 (revised) data which has been subjected to the revisions process has been
published in this release. In 2011, after a second application of the revisions process,
2007 (final) data will be released in the 2009 (preliminary) Causes of Death publication.
See Technical Note 3: 2007 Revisions for further information on the impact of the first
application of the revisions process to 2007 data.
I N T R O D U C T I O N
82 A B S • CA U S E S OF D E A T H • 3 3 0 3 . 0 • 2 0 0 8

Code all open and closed coroners cases for the reference year based on ICD-10 coding rules,including the use of additional information: police, toxicology and autopsy reports.
All - open and closedPreliminary, Revised and Final
Process
Coroners
Cases AffectedData Type
TABLE 2, BUSINESS RULES FOR 2008 AND BEYOND FOR REVIS ION OF CORONER CERTIF IEDDEATHS
8 For all deaths registered from 1 January 2008, all coroner certified deaths with a case
status of open or closed will be reviewed during the processing of the current reference
year's data. Table 2 below is a summary of the business rules used by the ABS in the
application of the revisions process to coroner certified deaths. During subsequent
revisions (2007 onwards), all coroner certified deaths that are open at the end of
processing for the previous two reference years will be reviewed.
9 These business rules will be applied for all open and closed coroner cases for all
releases from now on.
March 20122008 Final
March 20112008 Revised
March 20102008 Preliminary
March 20112007 Final
March 20102007 Revised
March 20092007 Preliminary
Anticipated
Release
Schedule
Data Re fe r ence
Yea r
TABLE 1, CAUSES OF DEATH RELEASE SCHEDULE
6 ABS will undertake two rounds of revisions only for each year's data. It is anticipated
that the quality of the data will be higher after two revision processes. In each round of
revisions, those cases which were open at the time of publication the year before will be
reassessed by ABS coders to take into account any new information available on the
NCIS. This will affect both cases which have been subsequently closed, and those which
remain open.
7 As 2007 reference year data is the first series of data to undergo the revisions
process, a review of those 2007 cases which remain open on the NCIS at the end of the
second round of revisions (January 2011) will be undertaken. The results of this review
will be used to determine whether the ABS will undertake further revisions to the 2007
data. It is anticipated that the quality of the 2007 data will be very high after being
subjected to two rounds of revisions. If this is the case, the ABS will not undertake any
further revisions for that reference year. COD data for each year will therefore be
released three times, as preliminary, revised and final. The release schedule is
demonstrated in the table below.
RE V I S I O N S PR O C E S S continued
A B S • CA U S E S OF D E A T H • 3 3 0 3 . 0 • 2 0 0 8 83
T E C H N I C A L N O T E 2 • CA U S E S OF D E A T H - R E V I S I O N S P R O C E S S
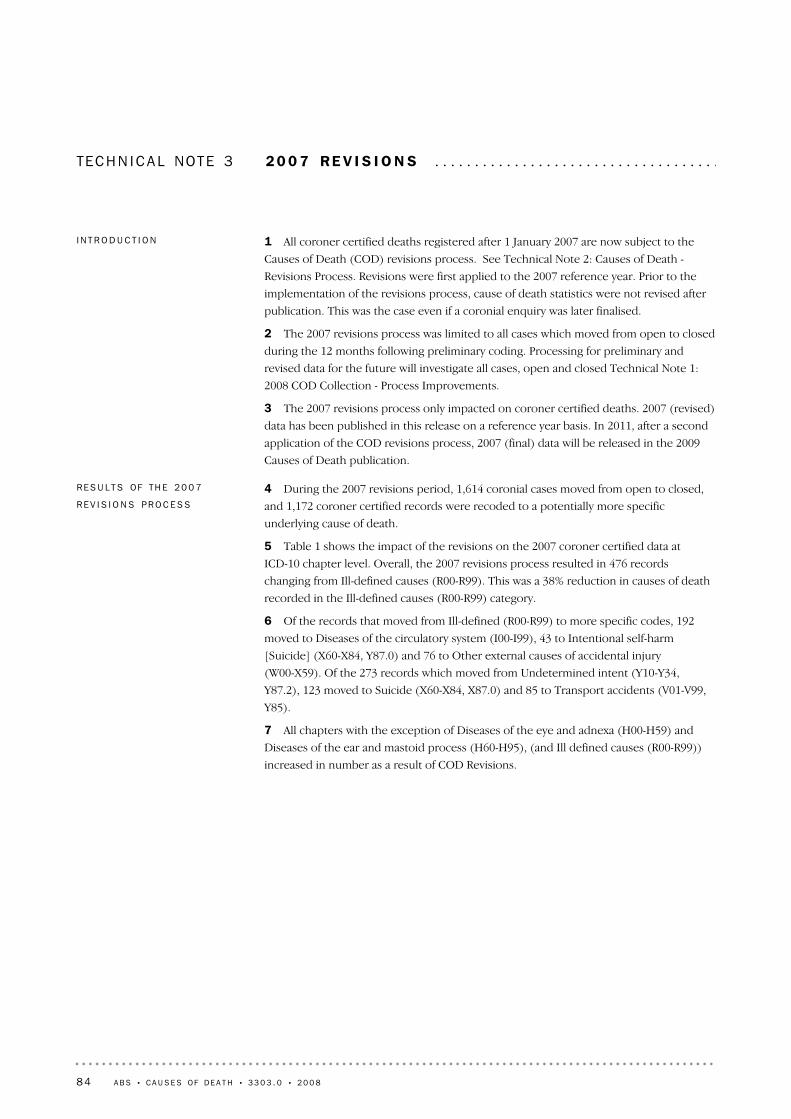
TECH N I C A L NOTE 3 20 0 7 RE V I S I O N S . . . . . . . . . . . . . . . . . . . . . . . . . . . . . . . . . . . .
4 During the 2007 revisions period, 1,614 coronial cases moved from open to closed,
and 1,172 coroner certified records were recoded to a potentially more specific
underlying cause of death.
5 Table 1 shows the impact of the revisions on the 2007 coroner certified data at
ICD-10 chapter level. Overall, the 2007 revisions process resulted in 476 records
changing from Ill-defined causes (R00-R99). This was a 38% reduction in causes of death
recorded in the Ill-defined causes (R00-R99) category.
6 Of the records that moved from Ill-defined (R00-R99) to more specific codes, 192
moved to Diseases of the circulatory system (I00-I99), 43 to Intentional self-harm
[Suicide] (X60-X84, Y87.0) and 76 to Other external causes of accidental injury
(W00-X59). Of the 273 records which moved from Undetermined intent (Y10-Y34,
Y87.2), 123 moved to Suicide (X60-X84, X87.0) and 85 to Transport accidents (V01-V99,
Y85).
7 All chapters with the exception of Diseases of the eye and adnexa (H00-H59) and
Diseases of the ear and mastoid process (H60-H95), (and Ill defined causes (R00-R99))
increased in number as a result of COD Revisions.
RE S U L T S OF TH E 20 0 7
RE V I S I O N S PR O C E S S
1 All coroner certified deaths registered after 1 January 2007 are now subject to the
Causes of Death (COD) revisions process. See Technical Note 2: Causes of Death -
Revisions Process. Revisions were first applied to the 2007 reference year. Prior to the
implementation of the revisions process, cause of death statistics were not revised after
publication. This was the case even if a coronial enquiry was later finalised.
2 The 2007 revisions process was limited to all cases which moved from open to closed
during the 12 months following preliminary coding. Processing for preliminary and
revised data for the future will investigate all cases, open and closed Technical Note 1:
2008 COD Collection - Process Improvements.
3 The 2007 revisions process only impacted on coroner certified deaths. 2007 (revised)
data has been published in this release on a reference year basis. In 2011, after a second
application of the COD revisions process, 2007 (final) data will be released in the 2009
Causes of Death publication.
I N T R O D U C T I O N
84 A B S • CA U S E S OF D E A T H • 3 3 0 3 . 0 • 2 0 0 8

8 Table 2 shows the impact of the COD revisions process on the 2007 data for selected
causes. The largest movements were:
! the number of records coded to Suicides (X60-X84, Y87.0) increased by 173
! the number of records coded to Transport accidents (V01-V99, Y85) increased by
116
! the number of records coded to Accidental poisonings (X40-X49) increased by 70
! the number of records coded to Falls (W00-W19) increased by 33
! the number of records coded to Assaults (X85-Y09, Y87.1) increased by 30.
9 The greatest movement among External cause codes due to the revisions process
was the increase in the number of deaths coded to Suicide from 1,881 (2007 preliminary)
to 2,054 (2007 revised), an increase of 173 deaths (9.2%).
RE S U L T S OF TH E 20 0 7
RE V I S I O N S PR O C E S S continued
(b) Data cells with small values have been randomly assigned toprotect the confidentiality of individuals. As a result, sometotals will not equal to the sum of their components.
— nil or rounded to zero (including null cells)(a) 2007 data are revised and subject to a further revisions
process. See Technical Note 3: 2007 Revisions for furtherinformation.
——16 85116 851All Causes
2.71736 6176 444External causes (V01-Y98) –37.7–4767881 264Ill defined causes (R00-R99) 11.088173Congenital and chromosomal abnormalities (Q00-Q99)
5.423937Conditions originating in the perinatal period (P00-P96) 20.0165Pregnancy, childbirth and the puerperium (O00-O99)
3.439289Diseases of the kidney, urinary system and genitals (N00-N99) 1.715958Diseases of the muscles, bones and tendons (M00-M99) 7.711413Diseases of the skin and subcutaneous tissue (L00-L99) 5.130619589Diseases of the digestive system (K00-K93) 3.019656637Diseases of the respiratory system (J00-J99) 3.21956 2486 053Diseases of the heart and blood vessels (I00-I99)
–50.0–224Diseases of the eye and adnexa and Diseases of the ear and mastoid
process (H00-H95)
2.57288281Diseases of the nervous system (G00-G99) 0.41237236Mental and behavioural disorders (F00-F99) 3.912319307Endocrine, nutritional and metabolic diseases (E00-E90) 7.123028Blood and Immunity Disorders (D50-D89) 2.818653635Cancer (C00-D48) 4.0410399Infectious Diseases (A00-B99)
%nonono
Change
(Preliminary
to Revised)
Change
(Preliminary
to Revised)
Revised
(After
revision)
Preliminary
(Before
revision)
Cause of dea th and ICD Code
TABLE 1 - CORONER CERTIF IED DEATHS, by ICD- 10 chapte r —2007 Pre l im inary and rev ised(a ) (b ) :Number and Percen tage change
A B S • CA U S E S OF D E A T H • 3 3 0 3 . 0 • 2 0 0 8 85
T E C H N I C A L N O T E 3 • 2 0 0 7 R E V I S I O N S

10 Table 3 shows the movement between selected causes from 2007 (preliminary)
underlying cause of death to 2007 (revised) underlying cause of death. The largest
movements were between Other ill-defined and unspecified causes of mortality (R99),
Diseases of the circulatory system (I00-I99); and Undetermined intent (Y10-Y34, Y87.2)
and Suicide (X60-X84, Y87.0). Table 3 also highlights the movements in codes within
chapters for these selected causes.
— nil or rounded to zero (including null cells)(a) 2007 data are revised and subject to a further revisions process. See Technical Note 3: 2007 Revisions for
further information.(b) Care needs to be taken in interpreting figures relating to suicide due to limitations of data, see Explanatory
Notes 72-75.
——16 85116 851All Causes
–1.8–573 0793 136Other external causes of mortality (X60-Y36)–24.0–2628301 092Event of Undetermined intent (Y10-Y34, Y87.2)18.330194164Assault (X85-Y09, Y87.1)
9.21732 0541 881Intentional self-harm (X60-X84, Y87.0)(b)13.170604534
Accidental poisoning by and exposure to noxioussubstances (X40-X49)
10.566357Exposure to smoke, fire and flames (X00-X09)1.63186183Accidental drowning and submersion (W65-W74)4.733728695Falls (W00-W19)8.61161 4581 342Transport accidents (V01-V99, Y85)
–41.8–4856751 160Other ill-defined and unspecified causes of
mortality (R99)
16.9128371Sudden infant death syndrome (R95)
%nonono
Change
(Preliminary
to Revised)
Change
(Preliminary
to Revised)
Revised
(After
revision)
Preliminary
(Before
revision)
Cause of dea th and ICD Code
TABLE 2: CORONDER CERTIF IED DEATHS, Selec ted causes —2007Pre l im inary and rev ised(a ) (b ) : Number and Percen tage change
RE S U L T S OF TH E 20 0 7
RE V I S I O N S PR O C E S S continued
86 A B S • CA U S E S OF D E A T H • 3 3 0 3 . 0 • 2 0 0 8
T E C H N I C A L N O T E 3 • 2 0 0 7 R E V I S I O N S

11 The revisions process applied to 2007 (preliminary) data has increased the number
of deaths coded to Suicide by 173. See tables 2, 3 and 5 in this Technical Note for further
information relating to the impact of the revisions process on Suicide deaths.
12 Table 4 presents data on 2007 open coroner cases (preliminary and revised) with an
external cause of death by mechanism of death. This is presented to provide information
on the impact of the revisions process on these data.
IM P A C T OF TH E RE V I S I O N S
PR O C E S S ON EX T E R N A L
CA U S E S OF DE A T H DA T A
— nil or rounded to zero (including null cells)(a) 2007 data are revised and subject to a further revisions process. See Technical Note 3: 2007 Revisions for further information(b) Data cells with small values have been randomly assigned to protect the confidentiality of individuals. As a result, some totals will not equal to the
sum of their components. Cells with a zero value have not been affected by confidentialisation. (c) Includes all causes of death.(d) Care needs to be taken in interpreting figures relating to suicide due to limitations of data, see Explanatory Notes 72-75.
1 17228010757487480Total(c)
187——437
Undeterminedintent(Y10-Y34,Y87.2)
391310—2114
Assault(X85-Y09,Y87.1)
248123—755143
Suicide(X60-X84,Y87.0)(d)
19249——42376
Other externalcauses ofaccidentalinjury(W00-X59)
20285——187019
Transportaccidents(V01-V99,Y85)
13—————12
Ill definedcauses(R00-R98,excludesR99)
272———42192
Diseases ofthecirculatorysytem(I00-I99)
Total
Undetermined
intent (Y10-Y34,
Y87.2)
Assault
(X85-Y09,Y87.1)
Suicide
(X60-X84,Y87.0)
Other
external
causes of
accidental
injury
(W00-X59)
Transport
accidents
(V01-V99,
Y85)
Other
ill-defined
and
unspecified
causes of
mortality
(R99)
PRELIMINARY 2007 ICD-10 CODE(c)
Rev i s ed
2007 ICD -10
code
TABLE 3: CORONER CASES, Pre l im inary and rev ised under l y ing cause of death —Selec tedcauses —2007 (a) (b)
A B S • CA U S E S OF D E A T H • 3 3 0 3 . 0 • 2 0 0 8 87
T E C H N I C A L N O T E 3 • 2 0 0 7 R E V I S I O N S

13 Table 5 presents open coroner cases (preliminary and revised) with an external
cause of death by intent ie. accidental, intentional self-harm (Suicide), assault (homicide)
or undetermined.
IM P A C T OF TH E RE V I S I O N S
PR O C E S S ON EX T E R N A L
CA U S E S OF DE A T H DA T A
continued
— nil or rounded to zero (including null cells)(a) 2007 data are revised and subject to a further revisions process. See Technical Note 3: 2007 Revisions for further information(b) For 2007 preliminary data, some data have moved between originally published mechanism categories due to a more specific
code allocation in the processing of 2008 data.(c) Data cells with small values have been randomly assigned to protect the confidentiality of individuals. As a result, some totals will
not equal to the sum of their components. Cells with a zero value have not been affected by confidentialisation.
1 45243634712886424487228Aust
1023——3141ACT37612184123NT254237—7—2Tas
128285346418321WA73191515216510SA
22444321659321040Qld3981471513647653552Vic557184525734010030100NSW
RE V I S E D 20 0 7
2 1946965710042796322112384Aust
1041—11111ACT621133291447NT359129—833Tas
202315394729825WA1302659294261021SA7902622147143318819179Qld45016815146811744060Vic5151856225441922788NSW
PR E L I M I N A R Y 20 0 7
Total Other and
Unspecified
Sharp
Objects
Firearms Transport
Accidents
Drowning Poisoning Falls Hanging
TABLE 4 - OPEN CORONER CASES, Externa l causes of death by mechan ism —2007 Pre l im inary andRev ised, (a) (b ) : State and ter r i t o r y of reg i s t ra t i on (c)
88 A B S • CA U S E S OF D E A T H • 3 3 0 3 . 0 • 2 0 0 8
T E C H N I C A L N O T E 3 • 2 0 0 7 R E V I S I O N S

14 Table 6 shows the number of 2007 open and closed coroner certified records on
the ABS processing system before and after the application of the 2007 revisions process.
The number of open coronial cases reduced from 5,128 to 3,017 over the 12 month
period. This means a total of 1,614 cases moved from open to closed between January
2009 and January 2010. This is larger than the overall number of cases which were
revised through the ABS revision process (1,172), due to the underlying cause of death
not being changed by coroners for some open cases which moved to a status of closed.
15 The number of closed cases for the New South Wales jurisdiction has decreased.
This is due to a difference in the methodology used for generating these figures. For
2007 preliminary data, the numbers were obtained from NCIS directly as the ABS did not
record case status on the Mortality system at that stage. The figures for 2007 revised data
were derived from ABS Mortality system. Although these numbers should match, the
difference can be explained by:
! the wrong coroner case originally being attributed to a record
! not being able to match to NCIS due to errors in spelling of names or date of birth
or death
! incorrect calculation of closed vs open cases in 2007 preliminary due to different
methodology.
OP E N AN D CL O S E D CA S E S
— nil or rounded to zero (including null cells)(a) 2007 data are revised and subject to a further revisions process. See Technical Note 3: 2007
Revisions for further information.(b) For 2007 preliminary data, some data have moved between originally published intent categories
due to a more specific code allocation in the processing of 2008 data.(c) Data cells with small values have been randomly assigned to protect the confidentiality of
individuals. As a result, some totals will not equal to the sum of their components. Cells with a zerovalue have not been affected by confidentialisation.
(d) Care needs to be taken in interpreting figures relating to Suicide due to limitations of data, seeExplanatory Notes 72-75.
1 4521449873276591Aust10443—7ACT371—2630NT25133416Tas
128116162075WA73110112031SA
22414497793Qld39841792376116Vic5576246973223NSW
RE V I S E D 20 0 7
2 1942087891384821Aust10—43—7ACT62—261042NT35242523Tas
2023201629136WA130316133961SA790637719161227Qld45062052485130Vic5155252855195NSW
PR E L I M I N A R Y 20 0 7
Total Other Undetermined Assault
Suicide(d)Accident
TABLE 5 - OPEN CORONER DEATHS, Externa l causes byintent (a ) (b ) —2007 Pre l im inary and Rev ised, State and ter r i to r y ofreg is t ra t ion (c )
IM P A C T OF TH E RE V I S I O N S
PR O C E S S ON EX T E R N A L
CA U S E S OF DE A T H DA T A
continued
A B S • CA U S E S OF D E A T H • 3 3 0 3 . 0 • 2 0 0 8 89
T E C H N I C A L N O T E 3 • 2 0 0 7 R E V I S I O N S
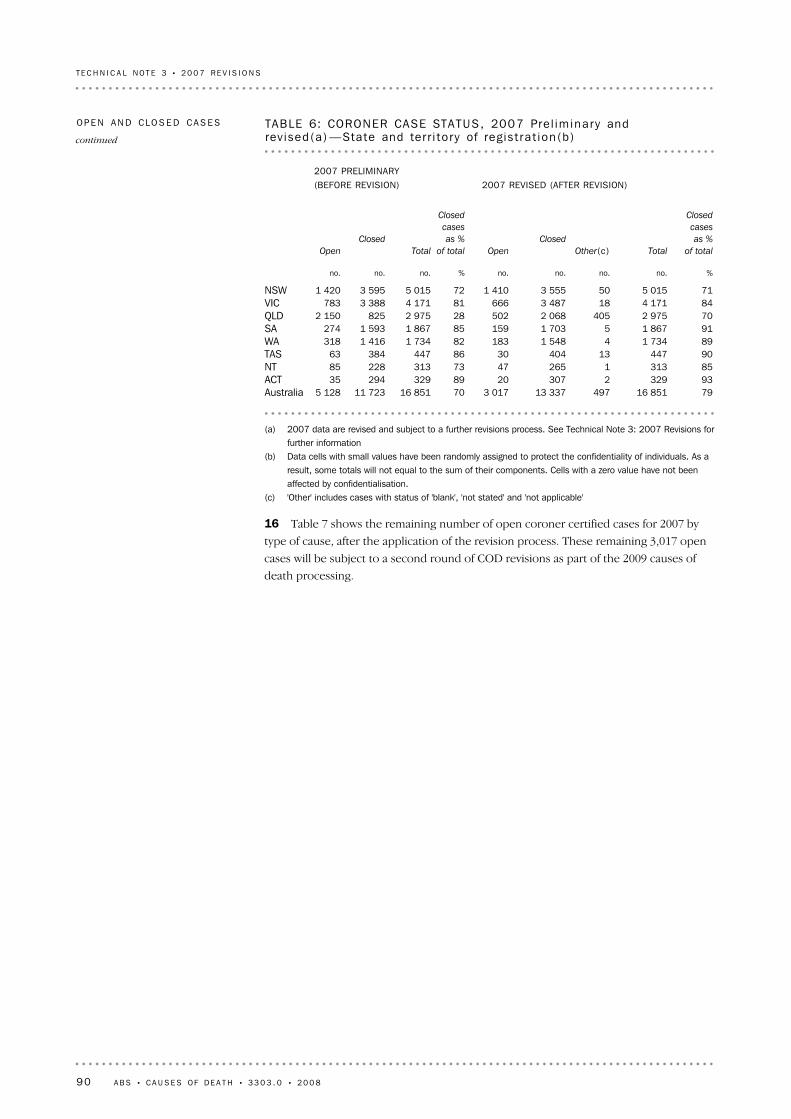
16 Table 7 shows the remaining number of open coroner certified cases for 2007 by
type of cause, after the application of the revision process. These remaining 3,017 open
cases will be subject to a second round of COD revisions as part of the 2009 causes of
death processing.
(a) 2007 data are revised and subject to a further revisions process. See Technical Note 3: 2007 Revisions forfurther information
(b) Data cells with small values have been randomly assigned to protect the confidentiality of individuals. As aresult, some totals will not equal to the sum of their components. Cells with a zero value have not beenaffected by confidentialisation.
(c) 'Other' includes cases with status of 'blank', 'not stated' and 'not applicable'
7916 85149713 3373 0177016 85111 7235 128Australia933292307208932929435ACT853131265477331322885NT9044713404308644738463TAS891 73441 548183821 7341 416318WA911 86751 703159851 8671 593274SA702 9754052 068502282 9758252 150QLD844 171183 487666814 1713 388783VIC715 015503 5551 410725 0153 5951 420NSW
%no.no.no.no.%no.no.no.
Closed
cases
as %
of totalTotalOther(c)Closed
Open
Closed
cases
as %
of totalTotal
Closed
Open
2007 REVISED (AFTER REVISION)2007 PRELIMINARY(BEFORE REVISION)
TABLE 6: CORONER CASE STATUS, 2007 Pre l im inary andrev ised(a) —State and ter r i to r y of reg is t ra t ion(b )
OP E N AN D CL O S E D CA S E S
continued
90 A B S • CA U S E S OF D E A T H • 3 3 0 3 . 0 • 2 0 0 8
T E C H N I C A L N O T E 3 • 2 0 0 7 R E V I S I O N S

— nil or rounded to zero (including null cells)(a) 2007 data are revised and subject to a further revisions process.
See Technical Note 3: 2007 Revisions for further information(b) Data cells with small values have been randomly assigned to protect
the confidentiality of individuals. As a result, some totals will notequal to the sum of their components. Cells with a zero value havenot been affected by confidentialisation.
(c) Natural Causes - deaths due to diseases (for example diabetes,cancer, heart disease etc). Natural causes are predominantlycertified by doctors. (A00-Q99, R00-98)
(d) External causes - deaths due to causes external to the body (forexample suicide, transport accidents, falls, poisoning etc). Externalcauses are certified by coroners. (V01-V99).
(e) Unknown Causes - deaths where it is unable to be determinedwhether the cause was natural or external. Predominantly thesedeaths are certified by coroners. (R99)
3 0173021 4521 263Australia
202108ACT473377NT30—255TAS
1831612839WA159297357SA50289224189QLD6664398264VIC
1 410159557694NSW
Total
Unknown
Causes(e)External
Causes(d)Natural
Causes(c)
TABLE 7: REMAINING OPEN CASES, Type of cause —State and ter r i to r yof reg is t ra t ion : 2007 Rev i sed (a) (b )
OP E N AN D CL O S E D CA S E S
continued
A B S • CA U S E S OF D E A T H • 3 3 0 3 . 0 • 2 0 0 8 91
T E C H N I C A L N O T E 3 • 2 0 0 7 R E V I S I O N S

GL O S S A R Y . . . . . . . . . . . . . . . . . . . . . . . . . . . . . . . . . . . . . . . . . . . .
Death is the permanent disappearance of all evidence of life after birth has taken place.The definition excludes all deaths prior to live birth. For the purposes of the Deaths andCauses of Death collections of the Australian Bureau of Statistics (ABS), a death refers toany death which occurs in, or en route to, Australia and is registered with a state orterritory Registry of Births, Deaths and Marriages.
Death
Are a series of spreadsheets which present Causes of Death data. Causes of Death datacubes can be found on the web page under the Downloads tab. See iNote for Data cubesfor more information on Causes of Death data cubes.
Data cubes
The crude death rate (CDR) is the number of deaths registered during the reference yearper 100,000 estimated resident population at 30 June.
Crude death rate
The classification of countries used is the Standard Australian Classification of Countries(SACC). For more detailed information refer to the Standard Australian Classification ofCountries (SACC) (cat. no. 1269.0).
Country of birth
Deaths which were certified by a coroner. Approximately 10-15% of deaths each year arecertified by a coroner. Coroner cases remain 'open' while cause of death investigationsare undertaken, and are closed when coronial investigations are complete. Followingcompletion, causes of death information is passed to the Registrar of Births, Deaths andMarriages, as well as to the National Coroners Information System (NCIS). All coronercertified deaths registered after 1 January 2007 are subject to a revisions process. Formore information see Technical Note 2: Causes of Death - Revisions Process and Technical Note 3: 2007 Revisions.
Coroner certified deaths
From 2007 data cells with small values have been randomly assigned to protectconfidentiality. As a result some totals will not equal the sum of their components. It isimportant to note that cells with 0 values have not been affected by confidentialisation.
Confidentialised
Deaths may be certified by either a medical practitioner, using the Medical Certificate ofCause of Death, or a coroner. Natural causes are predominantly certified by doctors,whereas External and Unknown causes are usually certified by a coroner. However, somedeaths for natural causes are referred to coroners for investigation, for exampleunaccompanied deaths.
Certifier type
The causes of death to be entered on the Medical Certificate of Cause of Death are allthose diseases, morbid conditions or injuries which either resulted in or contributed todeath and the circumstances of the accident or violence which produced any suchinjuries.
Cause of death
The ASGC provides a common framework of statistical geography and thereby enablesthe production of statistics which are comparable and can be spatially integrated. See Explanatory Notes 24-25 for more information.
Australian StandardGeographical Classification
(ASGC)
All causes listed on a death certificate other than the underlying cause.Associated causes
Age-specific death rates (ASDRs) are the number of deaths (occurred or registered)during the reference year at a specified age per 100,000 of the estimated residentpopulation of the same age at the mid-point of the year (30 June). Pro rata adjustment ismade in respect of deaths for which the age of the deceased is not given. ASDR fordeaths under 1 year of age are calculated based on 1,000 live births for that year.
Age-specific death rate
92 A B S • CA U S E S OF D E A T H • 3 3 0 3 . 0 • 2 0 0 8

This refers to the age at death at the 50th percentile for the relevant demographic group.Median age at death
Mechanism of external cause of death by which a person may die include: poisoning;hanging and other threats to breathing; drowning and submersion; firearms; contactwith sharp object; and falls.
Mechanism of death
Ranking causes of death is a useful method of describing patterns of mortality in apopulation and allows comparison over time and between populations. The ranking ofleading causes of death in this publication are based on research presented in theBulletin of the World Health Organisation, Volume 84, Number 4, April 2006, 257-336(see Explanatory Notes 40-42 for further information).
Leading causes of death
The manner or 'intent' of an injury which leads to death, is determined by whether theinjury was inflicted purposefully or not (in some cases, intent cannot be determined).The determination of 'intent' for each death is essential for determining the appropriateICD-10 code to use for a death and is particularly pertinent to the coding of externalcauses.
Intent
An infant death is the death of a live born child who dies before reaching his/her firstbirthday.
Infant death
See Standardised death rate (SDR).Indirect standardised deathrate (ISDR)
The death of a person who is identified as being of Aboriginal and/or Torres StraitIslander (Indigenous) origin on the Death Registration Form (DRF). From 2007,Indigenous origin for deaths registered in South Australia, Western Australia, Tasmania,the Northern Territory and the Australian Capital Territory is also derived from theMedical Certificate of Cause of Death (MCCD).
Indigenous death
Persons who identify themselves as being of Aboriginal and/or Torres Strait Islanderorigin.
Indigenous
International Statistical Classification of Diseases and Related Health Problems. Thepurpose of the ICD is to permit the systematic recording, analysis, interpretation andcomparison of mortality and morbidity data collected in different countries or areas andat different times. The ICD, which is endorsed by the World Health Organisation (WHO),is primarily designed for the classification of diseases and injuries with a formaldiagnosis. The ICD-10 is the current classification system, which is structured using analphanumeric coding scheme. Each disease or health problem is assigned a 3-digitidentification code, which is assigned to the deceased by a doctor or coroner. Cause ofdeath statistics can be produced for aggregates of these, for example, chapter level(letter), 2-digit code (first two numbers of the assigned code), and 3-digit code (threenumbers of the assigned code). See Explanatory Notes 29-33 for more information onICD. Further information also is available from the WHO website .
ICD
Australian external territories include Australian Antarctic Territory, Coral Sea IslandsTerritory, Norfolk Island, Territory of Ashmore and Cartier Islands, and Territory ofHeard and McDonald Islands.
External territories
Deaths due to causes external to the body (for example Suicide, transport accidents,falls, poisoning etc). ICD-10 codes V01-Y98.
External causes of death
The official measure of the population of Australia is based on the concept of residence.It refers to all people, regardless of nationality or citizenship, who usually live inAustralia, with the exception of foreign diplomatic personnel and their families. Itincludes usual residents who are overseas for less than 12 months. It excludes overseasvisitors who are in Australia for less than 12 months.
Estimated resident population(ERP)
Deaths which were certified by a doctor or medical practitioner, which were notrequired to be referred on to a coroner. Approximately 85-90% of deaths each year arecertified by a doctor. Doctor certified deaths are not subject to the revisions process.
Doctor certified deaths
A B S • CA U S E S OF D E A T H • 3 3 0 3 . 0 • 2 0 0 8 93
GL O S S A R Y

When additional information about an 'open' coroner certified death is received by theABS, either 12 or 24 months after initial processing, a more specific ICD-10 code may beapplied. This results in a 'revision' to the cause of death. See Technical Note 2: Causes ofDeath - Revisions Process and Technical Note 3: 2007 Revisions for further informationon the revisions process and the impact on 2007 revised data.
Revisions process
Deaths which are reported to a coroner. See Explanatory Note 2 for further informationon what constitutes a reportable death.
Reportable deaths
Each state and territory has a Registry of Births, Deaths and Marriages. It is a legalrequirement that all deaths are recorded by the relevant Registry for the state in whichthe death occurred.
Registry of Births, Deaths andMarriages
See 'Year of registration'.Registration year
The year that presented data refers to. For example, this publication presents data forthe 2008 reference year, as well as some historical data for the 1999 to 2007 referenceyears. From 2007, data for a particular reference year includes all deaths registered inAustralia for the reference year that are received by the ABS by the end of the Marchquarter of the subsequent year. For example, data for the 2008 reference year includes alldeaths registered in Australia for 2008 that were received by the ABS by the end of March2009. See Explanatory Notes 9-16 for more information about scope and coverage.
Reference year
Rate ratio is calculated by dividing the standardised death rate for one group (such as allpersons with a usual residence of Queensland) by the standardised death rate for thetotal relevant population (such as all persons with a usual residence of Australia).
Rate ratio
A perinatal death that is either a fetal death (i.e. a death prior to the complete expulsionor extraction from its mother as a product of conception of 20 completed weeks ofgestation or with a birth weight of at least 400 grams), or a neonatal death (i.e. death of alive born baby within 28 completed days of birth).
Perinatal death
Other Territories include Jervis Bay Territory, previously included with the AustralianCapital Territory, as well as Christmas Island and the Cocos (Keeling) Islands.
Other Territories
The neonatal period commences at birth and ends 28 completed days after birth.Neonatal period
Deaths due to diseases (for example diabetes, cancer, heart disease etc) which are notexternal or unknown.
Natural cause of death
Australia's National Health Priority Areas are diseases and conditions given focusedattention because of their significant contribution to the burden of illness and injury inthe Australian community. The eight priority areas are Arthritis and musculoskeletalconditions, Asthma, Cancer control, Cardiovascular health, Diabetes mellitus, Injuryprevention and control, Mental health and Obesity. For more information see Chapter 2 National Health Priority Area (NHPAs).
National Health Priority Area(NHPA)
The NCIS is a national data storage system which contains information about all deathsreferred to a coroner since July 2000 (January 2001 for Queensland).
National Coroners InformationSystem (NCIS)
All morbid conditions, diseases and injuries entered on the death certificate. Theseinclude those involved in the morbid train of events leading to death which wereclassified as either the underlying cause, the immediate cause, or any intervening causesand those conditions which contributed to death, but were not related to the disease orcondition causing death. For deaths where the underlying cause was identified as anexternal cause (for example, injury or poisoning, etc) multiple causes includecircumstances of injury, the nature of injury, as well as any other conditions reported onthe death certificate.
Multiple causes of death
The condition of being mortal or subject to death.Mortality
The events and diseases which lead to death.Morbid train of events
94 A B S • CA U S E S OF D E A T H • 3 3 0 3 . 0 • 2 0 0 8
GL O S S A R Y

YPLL measures the extent of 'premature' mortality, where 'premature' mortality isassumed to be any death at ages of 1-78 years inclusive. By estimating YPLL for deaths ofpeople aged 1-78 years it is possible to assess the significance of specific diseases ortrauma as a cause of premature death. See Explanatory Notes 43-45 for an explanation ofthe calculation of YPLL.
Years of potential life lost(YPLL)
Data presented on year of registration basis relate to the date the death was registeredwith the relevant state or territory Registrar of Births, Deaths and Marriages. In mostcases the year of registration and year of occurrence for a particular death will be thesame, but in some cases there may be a delay between occurrence and registration ofdeath.
Year of registration
Data presented on year of occurrence basis relate to the date the death occurred ratherthan when it was registered with the relevant state or territory Registrar of Births, Deathsand Marriages. See Explanatory Notes 15-16 for more information.
Year of occurrence
Usual residence within Australia refers to that address at which the person has lived orintended to live for a total of six months or more in a given reference year.
Usual residence
Deaths where it is unable to be determined whether the cause was natural or external.Unknown cause of death
The disease or injury which initiated the train of morbid events leading directly to death.Accidental and violent deaths are classified according to the external cause, that is, to thecircumstances of the accident or violence which produced the fatal injury rather than tothe nature of the injury.
Underlying cause of death
State or territory of usual residence refers to the state or territory in which the personhas lived or intended to live for a total of six months or more in a given reference year.
State or territory of usualresidence
State or territory of registration refers to the state or territory in which the death wasregistered. It is the state in which the death occurred, but is not necessarily thedeceased's state or territory of usual residence.
State or territory of registration
Standardised death rates (SDRs) enable the comparison of death rates betweenpopulations with different age structures by relating them to a standard population. TheABS standard populations relate to the years ending in 1 (e.g. 2001). The currentstandard population is all persons in the Australian population at 30 June 2001. SDRs areexpressed per 1,000 or 100,000 persons. There are two methods of calculatingstandardised death rates:
The direct method - this is used when the populations under study are large and theage-specific death rates are reliable. It is the overall death rate that would have prevailedin the standard population if it had experienced at each age the death rates of thepopulation under study.
The indirect method - this is used when the populations under study are small and theage-specific death rates are unreliable or not known. It is an adjustment to the crudedeath rate of the standard population to account for the variation between the actualnumber of deaths in the population under study and the number of deaths which wouldhave occurred if the population under study had experienced the age-specific deathrates of the standard population.
SDRs throughout this publication have been calculated using the direct method, exceptfor SDRs presented for leading causes of death in the Migrant datacube, which werecalculated using the indirect method.
Standardised death rate (SDR)
The number of males per 100 females. The sex ratio is defined for total population, atbirth, at death and among age groups by appropriately selecting the numerator anddenominator of the ratio.
Sex ratio
A B S • CA U S E S OF D E A T H • 3 3 0 3 . 0 • 2 0 0 8 95
GL O S S A R Y

www.abs.gov.auWEB ADDRESS
All statistics on the ABS website can be downloaded freeof charge.
F R E E A C C E S S T O S T A T I S T I C S
Client Services, ABS, GPO Box 796, Sydney NSW 2001POST
1300 135 211FAX
1300 135 070PHONE
Our consultants can help you access the full range ofinformation published by the ABS that is available free ofcharge from our website. Information tailored to yourneeds can also be requested as a 'user pays' service.Specialists are on hand to help you with analytical ormethodological advice.
I N F O R M A T I O N A N D R E F E R R A L S E R V I C E
www.abs.gov.au the ABS website is the best place fordata from our publications and information about the ABS.
INTERNET
F O R M O R E I N F O R M A T I O N . . .
© Commonwealth of Australia 2010Produced by the Australian Bureau of Statistics
33
03
.0
•
CA
US
ES
O
F D
EA
TH
, A
US
TR
AL
IA
•
20
08